Embed Size (px)
Citation preview
Analysis of Varied Feedstocks for Oxidative Coupling of Methane
Catalyst in a Redox Configuration
Undergraduate Research Thesis in Chemical Engineering
Presented in Partial Fulfillment of the Requirements for Graduation with Honors
Research and Distinction from the Department of Chemical and Biomolecular
Engineering at The Ohio State University
Written By:
Hussein Alkhatib
April 2016
Honors Thesis Committee:
Dr. Liang-Shih Fan
Dr. Aravind Asthag

i
Copyright by
Hussein Alkhatib
2016
ii
Abstract
With the recent shale gas boom, researchers have been devising methods of upgrading large
quantities of methane to higher valued products. One of these methods, the Oxidative Coupling of
Methane (OCM), creates hydrocarbons (mainly ethane and ethylene) via the catalytic coupling of
methane under oxidation. Ethane and Ethylene are starting points for many polymer materials.
OCM is typically run in a co-feed configuration where oxygen and methane are simultaneously
fed into the reactor. In an effort to commercialize the technology a chemical looping system has
been investigated to lower capital and operational costs. Chemical looping separates catalytic
oxidation and reduction into respective steps in order to remove the need for air separation. A
proprietary manganese based oxidative catalyst has been developed for chemical looping and has
shown promising results with respect to methane conversion. However the effects of the
manganese oxide based catalyst on various light hydrocarbons have not been studied. This thesis
will analyze the effect of certain pure light hydrocarbon feedstocks as well as certain hydrocarbon
mixtures on the manganese based catalyst within a chemical looping.

iii
To the refugees enduring sacrifice to further educate future generations

iv
Acknowledgements
I would like to give my deepest appreciation and thanks to Dr. Fan for sitting on my
committee as well as advising me throughout my undergraduate research career. Also I would like
to thank Dr. Asthagiri for also being part of my committee and for providing mentorship and
friendship during my undergraduate career.
I would like to give great thanks to Elena Chung for allowing me to work directly with her
these past three years. She was a great mentor and taught me a great deal about chemical
engineering, lab techniques, experimental intuition, and about life in general. I would also like to
thank Deven Baser who sacrificed significant amounts of his time to aid in my experimentation
and provided great recommendations for improvements for both my presentation as well as my
thesis. I would also like to thank Sourabh Nadgouda for his help throughout my time working in
the lab. I would also like to thank William Wang for providing our team with his expertise in
electrical work, process controls, and overall handy skills. I would also like to thank all of the
undergraduate students I had the pleasure of working with in Dr. Fans lab.
Lastly I would like to thank my parents, Omayma and Isam Alkhatib. It is their dedication
to providing me with the best environment for learning and development in combination for their
stress on morals and values that has led me to where I am today.
v
Table of Contents
Abstract .................................................................................................................................................... ii
Acknowledgements ..................................................................................................................................... iv
Table of Figures ............................................................................................................................................ vi
List of Tables ............................................................................................................................................... vii
1. Introduction .......................................................................................................................................... 1
1.1 Overview of Oxidative Coupling of Methane .................................................................................... 3
1.2 Chemical Looping Scheme ................................................................................................................ 5
1.3 Current Natural Gas Processing ........................................................................................................ 7
2. Experimental Methodology ..................................................................................................................... 8
2.1 Safety Considerations ............................................................................................................................. 8
2.2 Synthesis Method ................................................................................................................................... 8
2.3 Experimental Setup ................................................................................................................................. 8
2.3 Reaction Setup ...................................................................................................................................... 10
2.4 Data Analysis ......................................................................................................................................... 11
3. Results Discussion .................................................................................................................................. 11
3.1 Pure Methane Experiment .................................................................................................................... 11
3.2 Pure Ethane Experiment ....................................................................................................................... 13
3.3 Equimolar Methane and Ethane Experiment ....................................................................................... 14
3.4 Shale Gas Experiment ........................................................................................................................... 16
3.5 Post Ethane Steam Cracking Experiments ............................................................................................ 18
4. Conclusion and Future Work ................................................................................................................. 20
References .................................................................................................................................................. 21
Appendix: Additional Tables ...................................................................................................................... 23
vi
Table of Figures
Figure 1: Production volume projections for major chemical industries. .................................................... 1
Figure 2: Proven US natural gas reserves within the last fifteen years ........................................................ 2
Figure 3: Schematic of general OCM reactor. ............................................................................................... 3
Figure 4: Diagram of OCM mechanism for desired products. ...................................................................... 4
Figure 5: Diagram of the OCM reaction in the co-feed mode of operation. ................................................ 5
Figure 6: Diagram of OCM reaction in a chemical looping configuration. .................................................... 6
Figure 7: General overview of natural gas processing. ................................................................................. 7
Figure 8: Simplified schematic of reactor setup. ........................................................................................ 10
Figure 9: OCM performance parameter calculations ................................................................................. 11
Figure 10: Selectivity and Conversion for pure methane experiment. ....................................................... 11
Figure 11: Chart regarding yield for pure methane experiment. ............................................................... 12
Figure 12: Selectivity and Conversion data for pure ethane experiments. ................................................ 13
Figure 13: Graph of yield data for pure methane experiments. ................................................................. 14
Figure 14: Schematic comparing equimolar feed mixture and calculated pure ethane and methane
mixture. ....................................................................................................................................................... 15
vii
List of Tables
Table 1: Experimental parameters with corresponding values .................................................................... 9
Table 2: Comparison of experimental equimolar results versus calculated pure mixtures. ...................... 16
Table 3: Compositional results of shale gas experiments. .......................................................................... 17
Table 4: Composition of shale gas repeat experiment. .............................................................................. 18
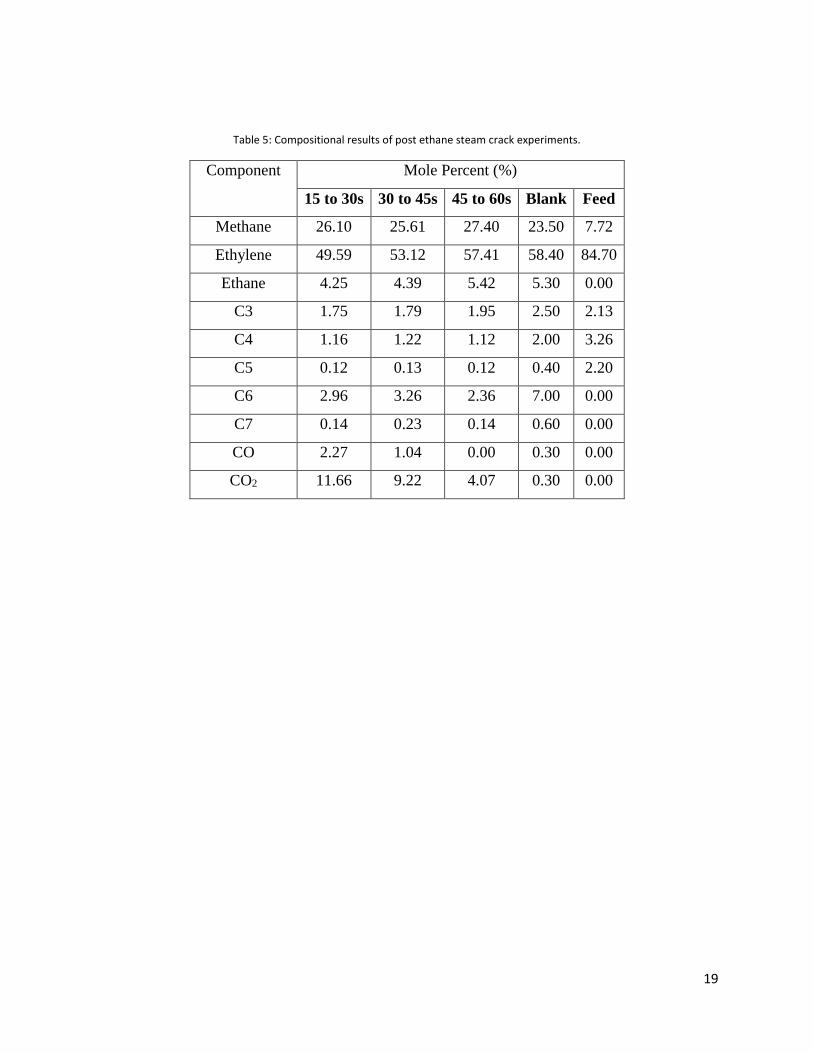
Table 5: Compositional results of post ethane steam crack experiments. ................................................. 19
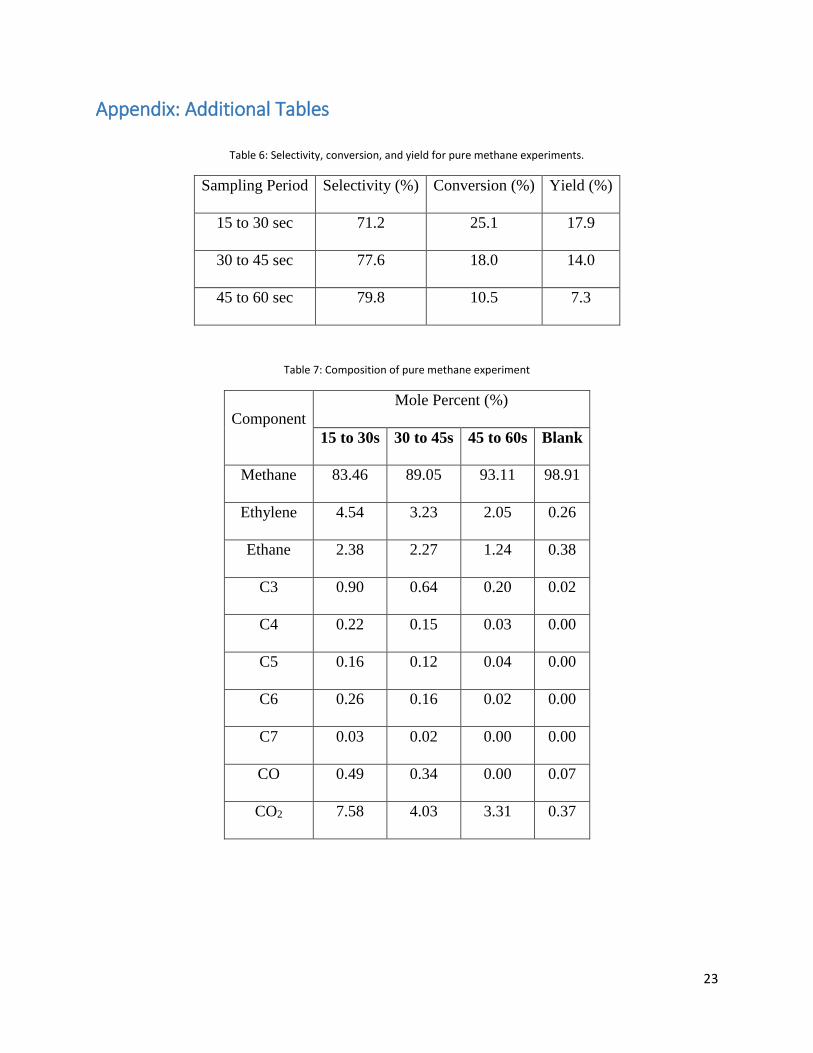
Table 6: Selectivity, conversion, and yield for pure methane experiments. .............................................. 23
Table 7: Composition of pure methane experiment .................................................................................. 23
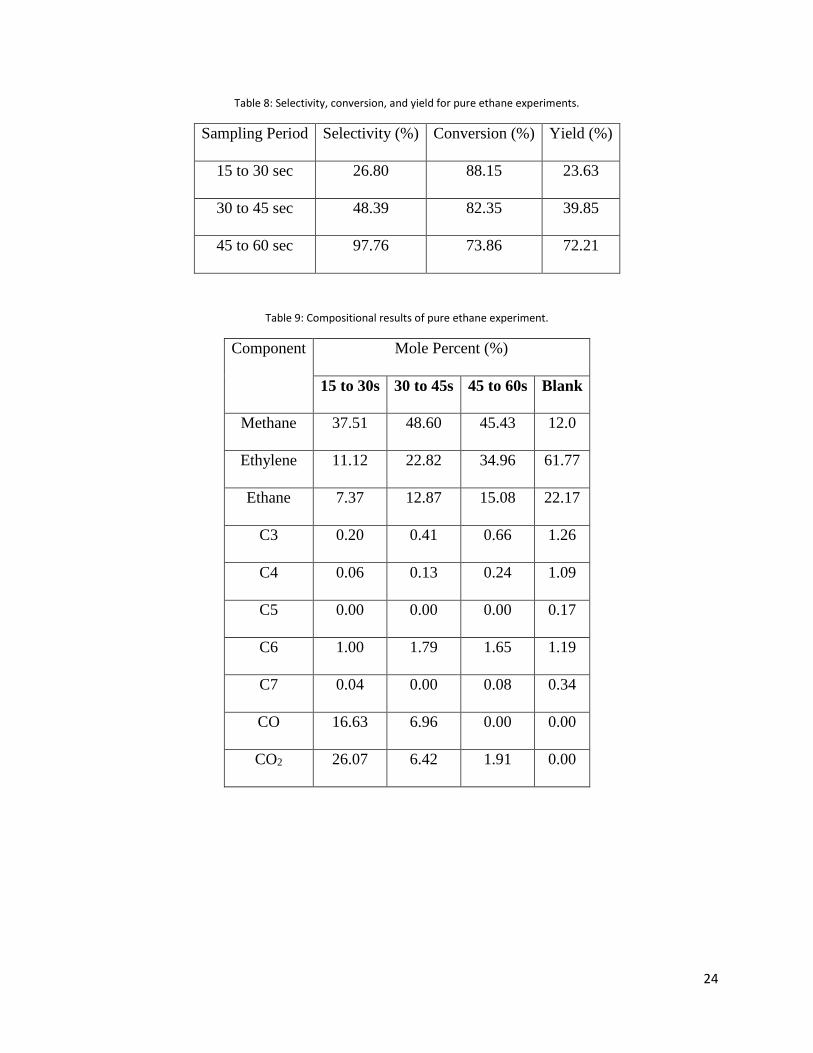
Table 8: Selectivity, conversion, and yield for pure ethane experiments. ................................................. 24
Table 9: Compositional results of pure ethane experiment. ...................................................................... 24
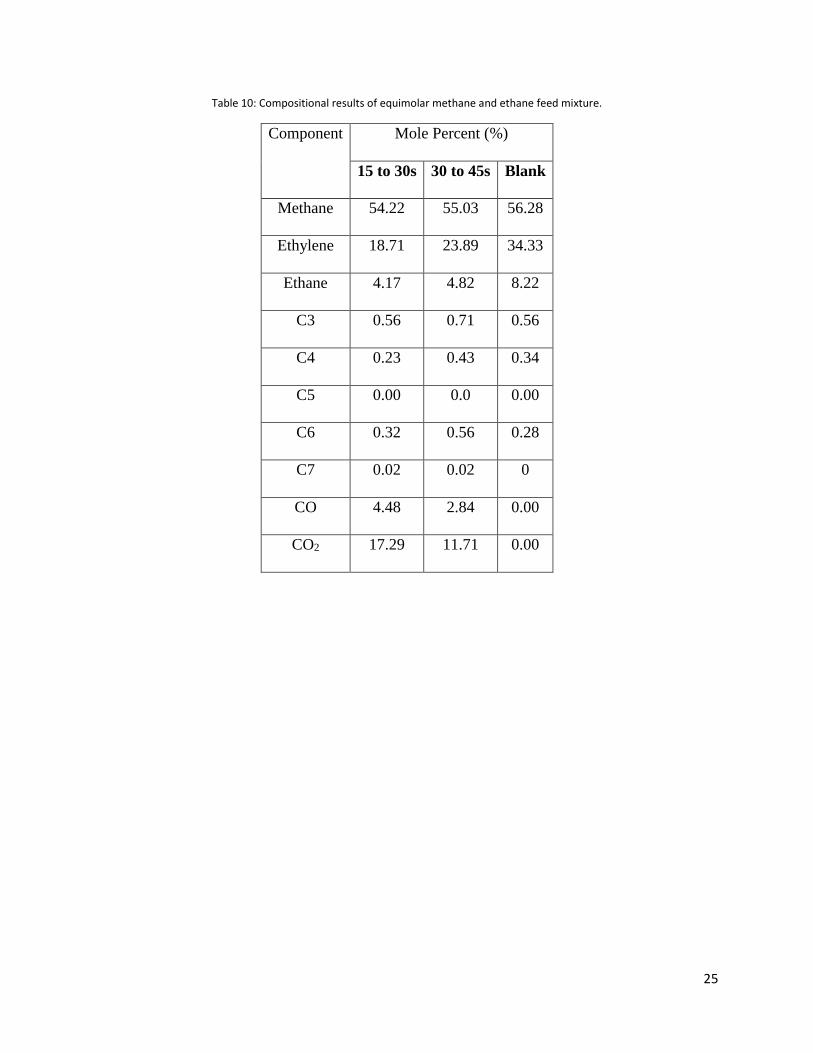
Table 10: Compositional results of equimolar methane and ethane feed mixture. .................................. 25
1
1. Introduction
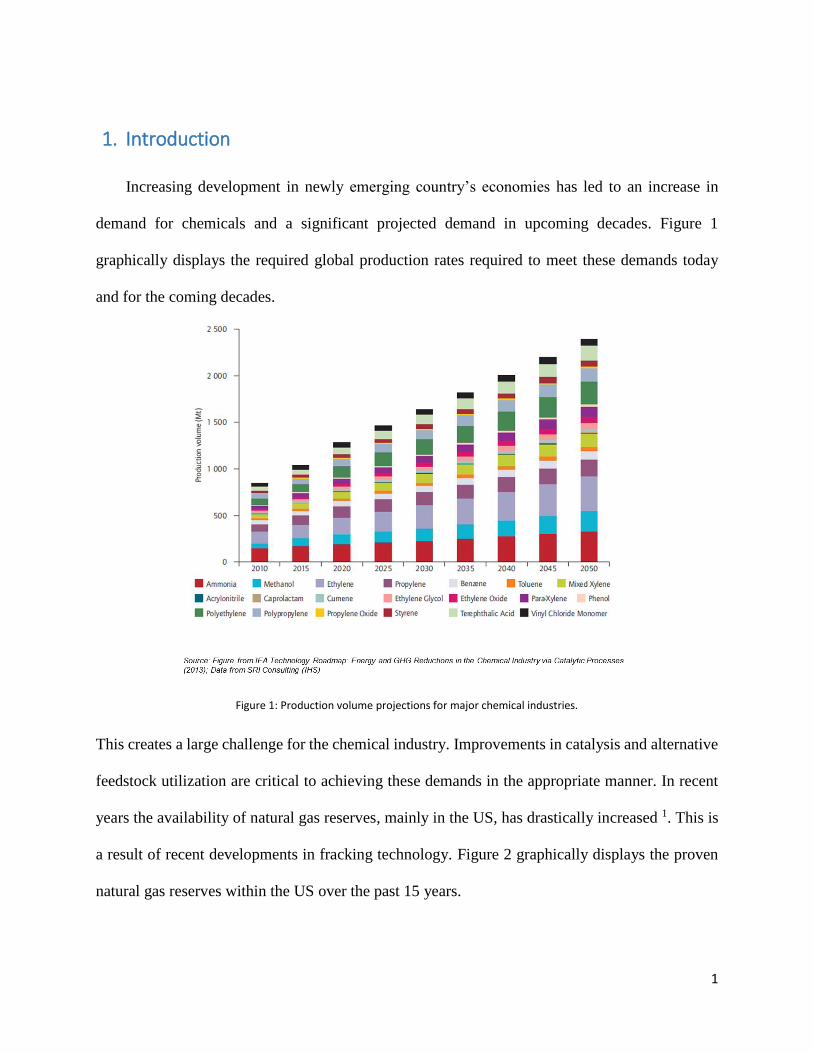
Increasing development in newly emerging country’s economies has led to an increase in
demand for chemicals and a significant projected demand in upcoming decades. Figure 1
graphically displays the required global production rates required to meet these demands today
and for the coming decades.
Figure 1: Production volume projections for major chemical industries.
This creates a large challenge for the chemical industry. Improvements in catalysis and alternative
feedstock utilization are critical to achieving these demands in the appropriate manner. In recent
years the availability of natural gas reserves, mainly in the US, has drastically increased 1. This is
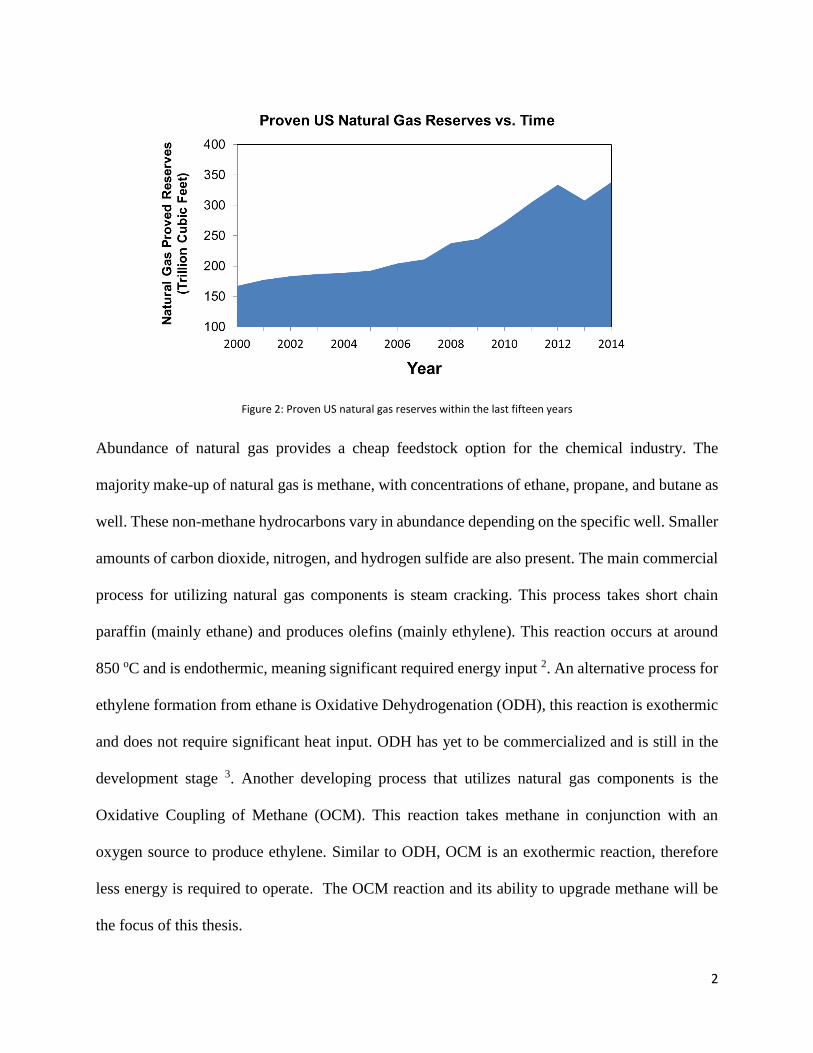
a result of recent developments in fracking technology. Figure 2 graphically displays the proven
natural gas reserves within the US over the past 15 years.
2
Figure 2: Proven US natural gas reserves within the last fifteen years
Abundance of natural gas provides a cheap feedstock option for the chemical industry. The
majority make-up of natural gas is methane, with concentrations of ethane, propane, and butane as
well. These non-methane hydrocarbons vary in abundance depending on the specific well. Smaller
amounts of carbon dioxide, nitrogen, and hydrogen sulfide are also present. The main commercial
process for utilizing natural gas components is steam cracking. This process takes short chain
paraffin (mainly ethane) and produces olefins (mainly ethylene). This reaction occurs at around
850 oC and is endothermic, meaning significant required energy input 2. An alternative process for
ethylene formation from ethane is Oxidative Dehydrogenation (ODH), this reaction is exothermic
and does not require significant heat input. ODH has yet to be commercialized and is still in the
development stage 3. Another developing process that utilizes natural gas components is the
Oxidative Coupling of Methane (OCM). This reaction takes methane in conjunction with an
oxygen source to produce ethylene. Similar to ODH, OCM is an exothermic reaction, therefore
less energy is required to operate. The OCM reaction and its ability to upgrade methane will be
the focus of this thesis.
3
1.1 Overview of Oxidative Coupling of Methane
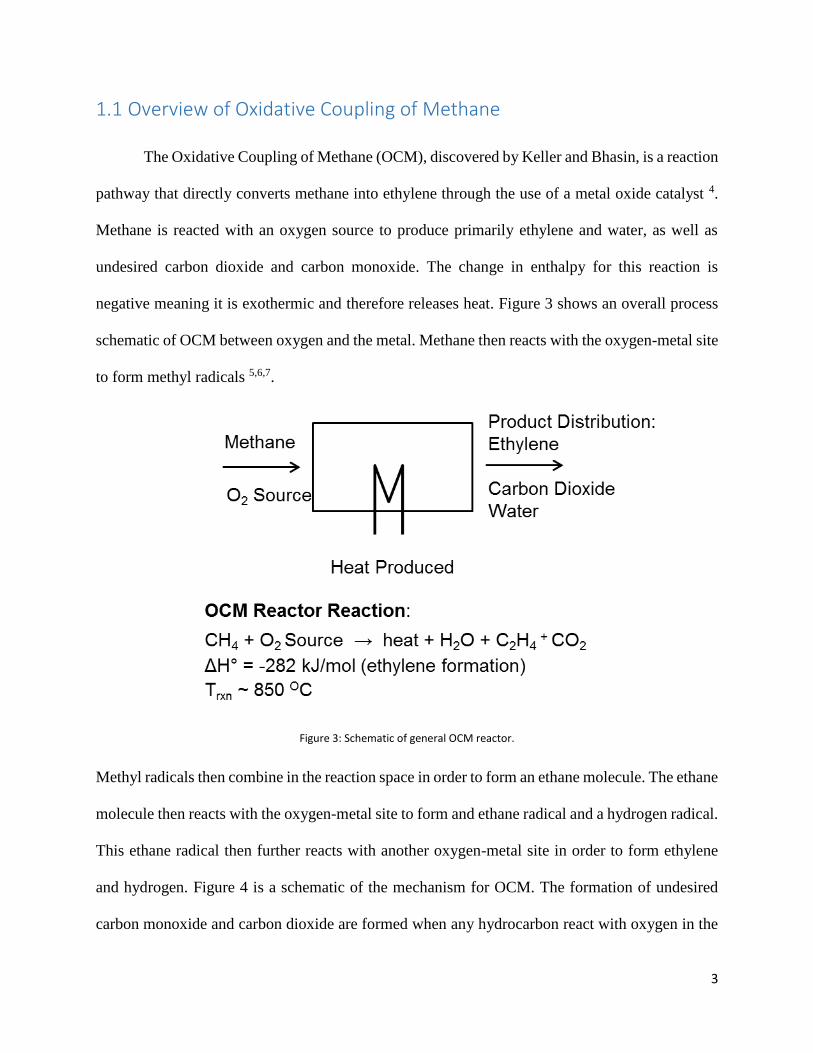
The Oxidative Coupling of Methane (OCM), discovered by Keller and Bhasin, is a reaction
pathway that directly converts methane into ethylene through the use of a metal oxide catalyst 4.
Methane is reacted with an oxygen source to produce primarily ethylene and water, as well as
undesired carbon dioxide and carbon monoxide. The change in enthalpy for this reaction is
negative meaning it is exothermic and therefore releases heat. Figure 3 shows an overall process
schematic of OCM between oxygen and the metal. Methane then reacts with the oxygen-metal site
to form methyl radicals 5,6,7.
Figure 3: Schematic of general OCM reactor.
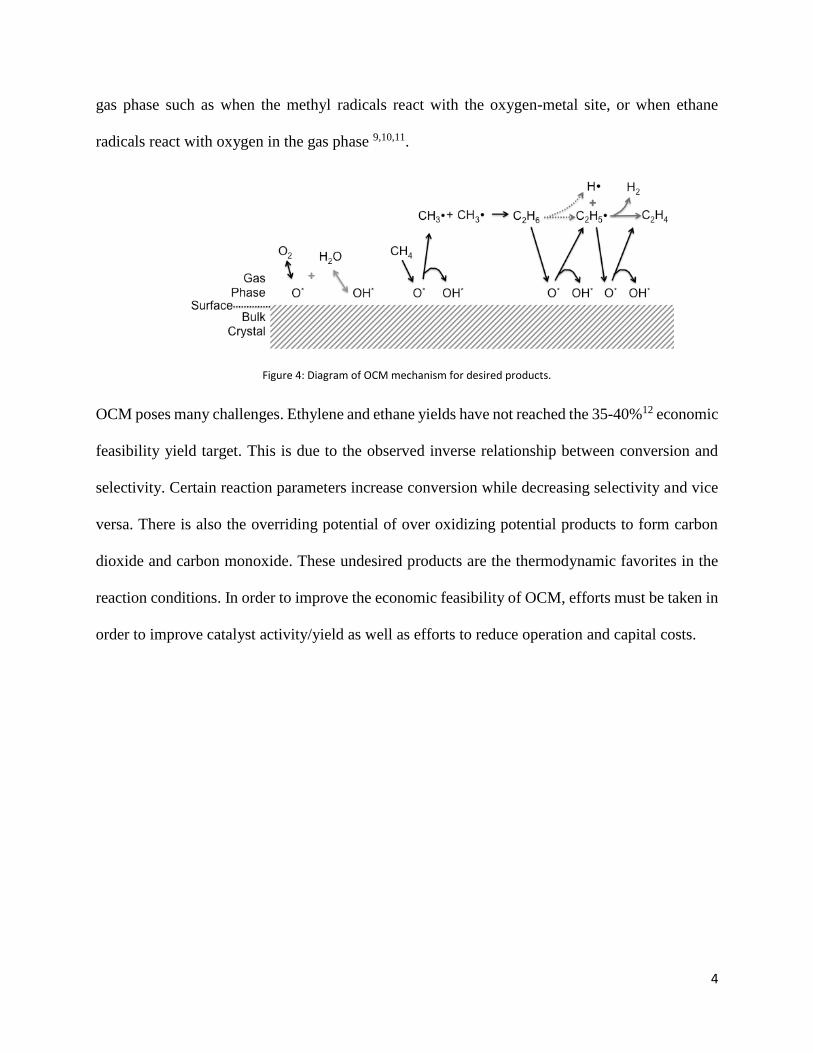
Methyl radicals then combine in the reaction space in order to form an ethane molecule. The ethane
molecule then reacts with the oxygen-metal site to form and ethane radical and a hydrogen radical.
This ethane radical then further reacts with another oxygen-metal site in order to form ethylene
and hydrogen. Figure 4 is a schematic of the mechanism for OCM. The formation of undesired
carbon monoxide and carbon dioxide are formed when any hydrocarbon react with oxygen in the
4
gas phase such as when the methyl radicals react with the oxygen-metal site, or when ethane
radicals react with oxygen in the gas phase 9,10,11.
Figure 4: Diagram of OCM mechanism for desired products.
OCM poses many challenges. Ethylene and ethane yields have not reached the 35-40%12 economic
feasibility yield target. This is due to the observed inverse relationship between conversion and
selectivity. Certain reaction parameters increase conversion while decreasing selectivity and vice
versa. There is also the overriding potential of over oxidizing potential products to form carbon
dioxide and carbon monoxide. These undesired products are the thermodynamic favorites in the
reaction conditions. In order to improve the economic feasibility of OCM, efforts must be taken in
order to improve catalyst activity/yield as well as efforts to reduce operation and capital costs.
5
1.2 Chemical Looping Scheme
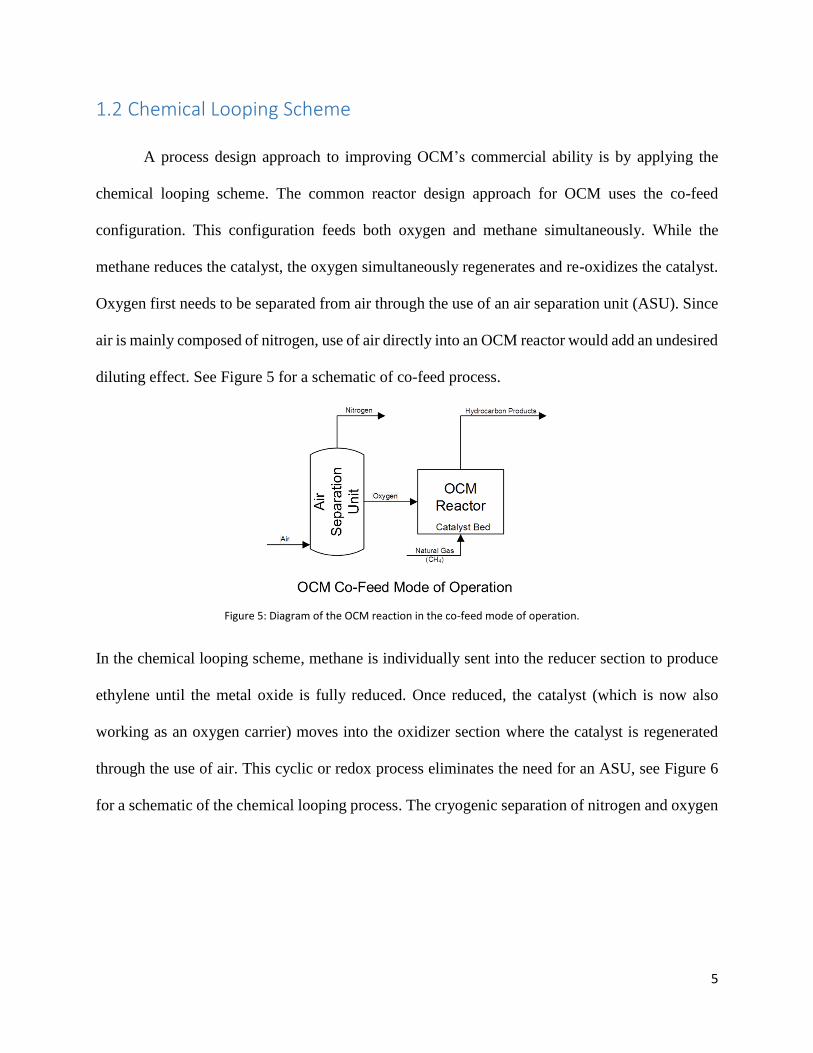
A process design approach to improving OCM’s commercial ability is by applying the
chemical looping scheme. The common reactor design approach for OCM uses the co-feed
configuration. This configuration feeds both oxygen and methane simultaneously. While the
methane reduces the catalyst, the oxygen simultaneously regenerates and re-oxidizes the catalyst.
Oxygen first needs to be separated from air through the use of an air separation unit (ASU). Since
air is mainly composed of nitrogen, use of air directly into an OCM reactor would add an undesired
diluting effect. See Figure 5 for a schematic of co-feed process.
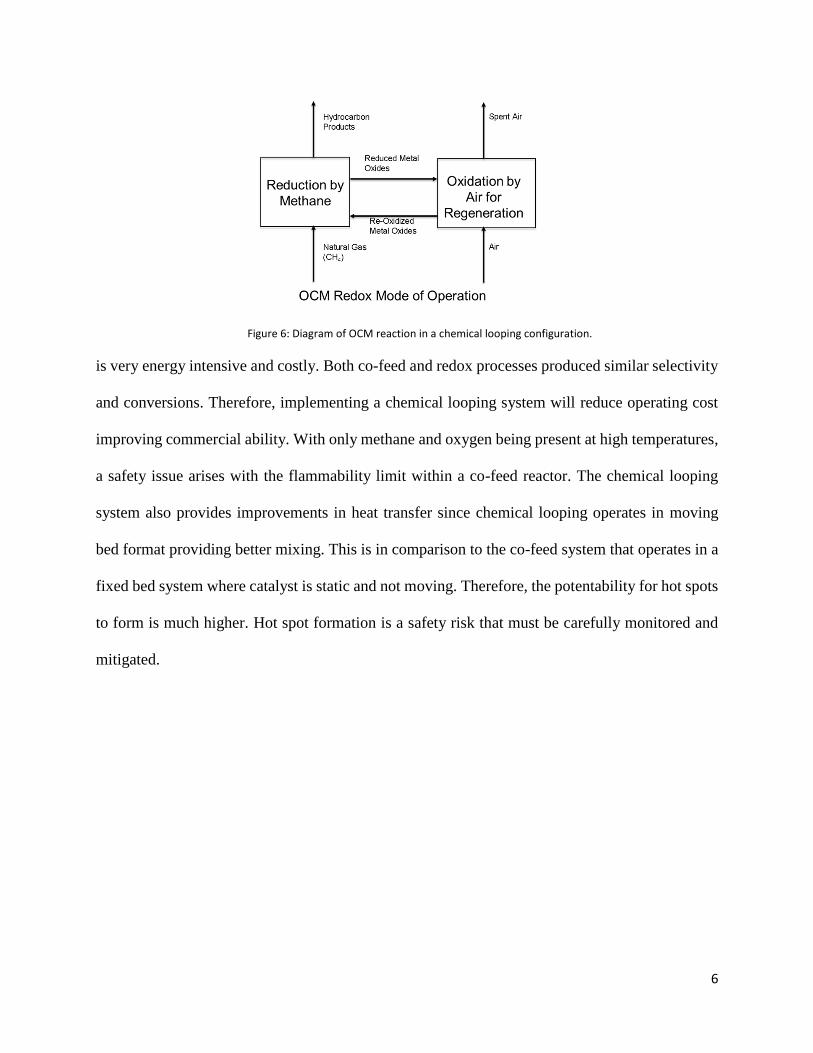
In the chemical looping scheme, methane is individually sent into the reducer section to produce
ethylene until the metal oxide is fully reduced. Once reduced, the catalyst (which is now also
working as an oxygen carrier) moves into the oxidizer section where the catalyst is regenerated
through the use of air. This cyclic or redox process eliminates the need for an ASU, see Figure 6
for a schematic of the chemical looping process. The cryogenic separation of nitrogen and oxygen
Figure 5: Diagram of the OCM reaction in the co-feed mode of operation.
6
is very energy intensive and costly. Both co-feed and redox processes produced similar selectivity
and conversions. Therefore, implementing a chemical looping system will reduce operating cost
improving commercial ability. With only methane and oxygen being present at high temperatures,
a safety issue arises with the flammability limit within a co-feed reactor. The chemical looping
system also provides improvements in heat transfer since chemical looping operates in moving
bed format providing better mixing. This is in comparison to the co-feed system that operates in a
fixed bed system where catalyst is static and not moving. Therefore, the potentability for hot spots
to form is much higher. Hot spot formation is a safety risk that must be carefully monitored and
mitigated.
Figure 6: Diagram of OCM reaction in a chemical looping configuration.
7
1.3 Current Natural Gas Processing
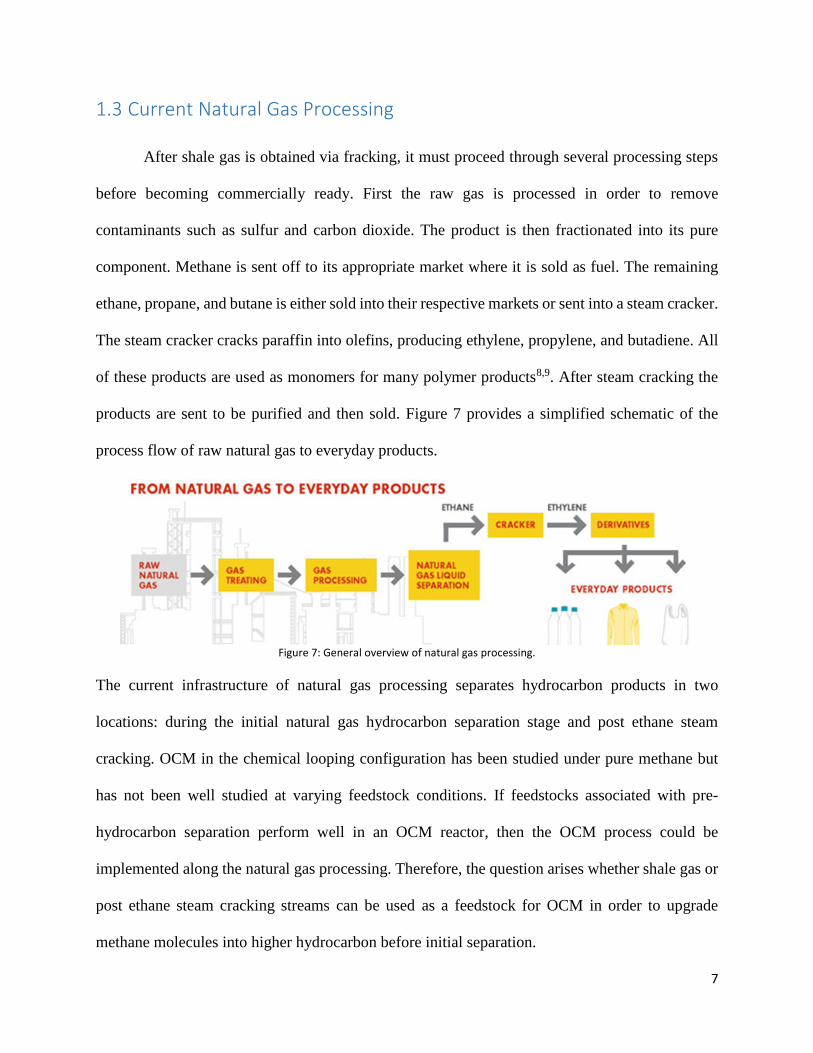
After shale gas is obtained via fracking, it must proceed through several processing steps
before becoming commercially ready. First the raw gas is processed in order to remove
contaminants such as sulfur and carbon dioxide. The product is then fractionated into its pure
component. Methane is sent off to its appropriate market where it is sold as fuel. The remaining
ethane, propane, and butane is either sold into their respective markets or sent into a steam cracker.
The steam cracker cracks paraffin into olefins, producing ethylene, propylene, and butadiene. All
of these products are used as monomers for many polymer products8,9. After steam cracking the
products are sent to be purified and then sold. Figure 7 provides a simplified schematic of the
process flow of raw natural gas to everyday products.
The current infrastructure of natural gas processing separates hydrocarbon products in two
locations: during the initial natural gas hydrocarbon separation stage and post ethane steam
cracking. OCM in the chemical looping configuration has been studied under pure methane but
has not been well studied at varying feedstock conditions. If feedstocks associated with pre-
hydrocarbon separation perform well in an OCM reactor, then the OCM process could be
implemented along the natural gas processing. Therefore, the question arises whether shale gas or
post ethane steam cracking streams can be used as a feedstock for OCM in order to upgrade
methane molecules into higher hydrocarbon before initial separation.
Figure 7: General overview of natural gas processing.
8
2. Experimental Methodology
2.1 Safety Considerations
Both oxygen and hydrocarbon gases were used in combination, therefore care was taken in
order to assure no explosive mixtures were being created. In order to assure further safety, all
experiments were completed in a walk-in hood, allowing for hazardous gases to be contained and
ventilated. All reducing gases were stored in ventilated containers in order to protect against
potential leaks. The experiments were conducted at extreme temperatures, therefore caution was
taken near the reactor. Before approaching the reactor, it was first allowed to cool down to room
temperature. During catalyst synthesis a respirator was used in order to remove the hazard of
breathing in fine metal oxide particles. Proper personal protective equipment was worn at all time.
2.2 Synthesis Method
The catalyst used was a proprietary catalyst developed by EcoCatalytic. Its synthesis
method cannot be disclosed, however the catalyst used is a Mg6MnO8 based catalyst that was
doped.
2.3 Experimental Setup
This study tested five feedstocks: a 100% methane feed, a 100% ethane feed, a mixture of
50% methane and 50% ethane, a representative shale gas feed, and a representative post ethane
steam cracking feed. Blank experiments were conducted to study the effects of feedstock gases at
reaction conditions without the presence of the desired catalyst. These gases were evaluated in a
fixed bed system. This system is diagramed in Figure 8. The conditions used for the fixed bed
9
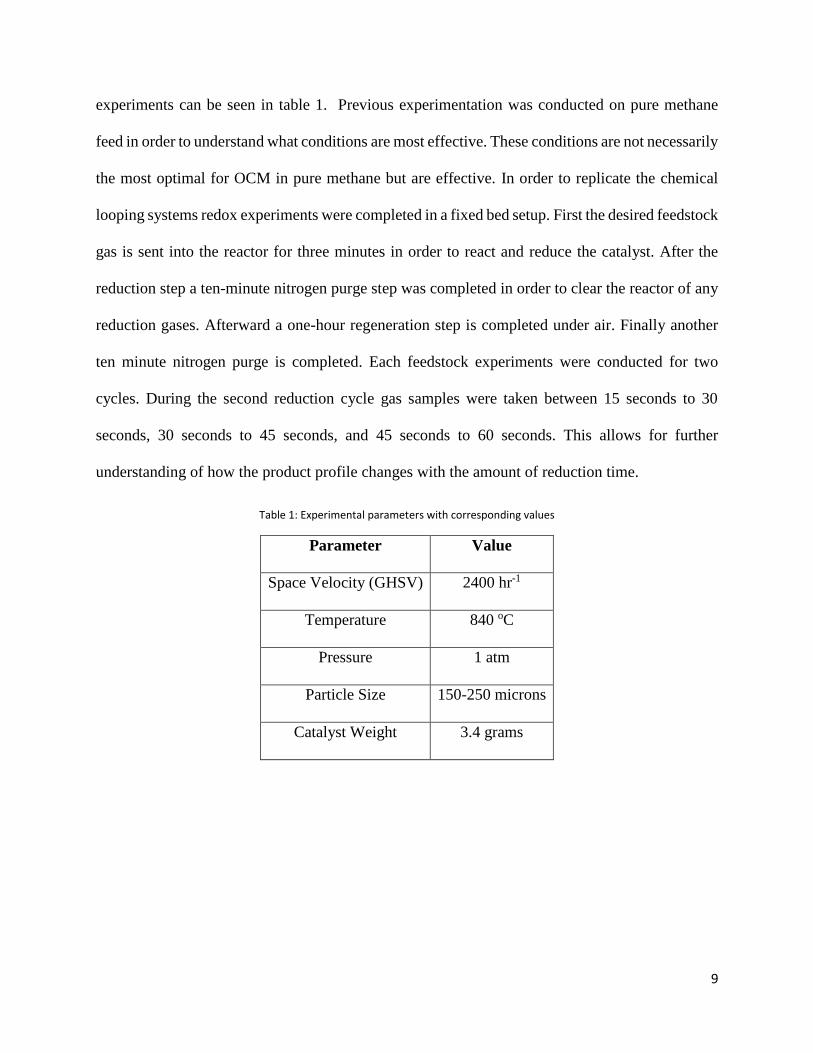
experiments can be seen in table 1. Previous experimentation was conducted on pure methane
feed in order to understand what conditions are most effective. These conditions are not necessarily
the most optimal for OCM in pure methane but are effective. In order to replicate the chemical
looping systems redox experiments were completed in a fixed bed setup. First the desired feedstock
gas is sent into the reactor for three minutes in order to react and reduce the catalyst. After the
reduction step a ten-minute nitrogen purge step was completed in order to clear the reactor of any
reduction gases. Afterward a one-hour regeneration step is completed under air. Finally another
ten minute nitrogen purge is completed. Each feedstock experiments were conducted for two
cycles. During the second reduction cycle gas samples were taken between 15 seconds to 30
seconds, 30 seconds to 45 seconds, and 45 seconds to 60 seconds. This allows for further
understanding of how the product profile changes with the amount of reduction time.
Table 1: Experimental parameters with corresponding values
Parameter Value
Space Velocity (GHSV) 2400 hr-1
Temperature 840 oC
Pressure 1 atm
Particle Size 150-250 microns
Catalyst Weight 3.4 grams
10
2.3 Reaction Setup
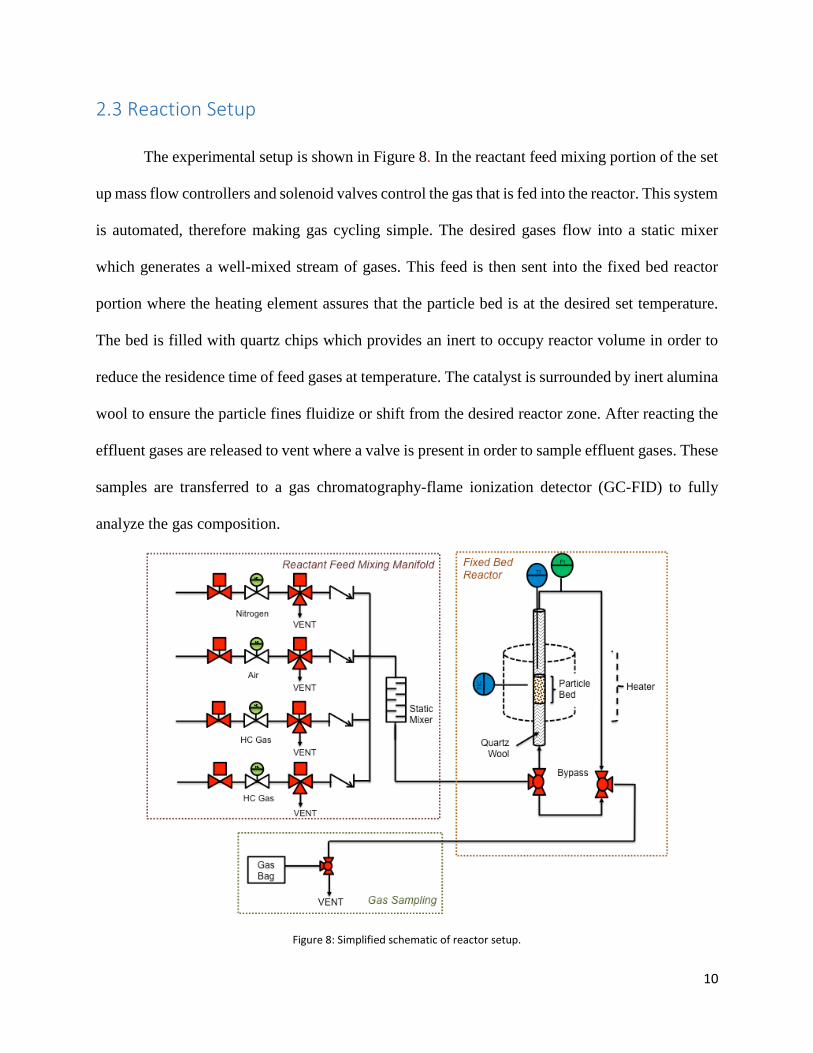
The experimental setup is shown in Figure 8. In the reactant feed mixing portion of the set
up mass flow controllers and solenoid valves control the gas that is fed into the reactor. This system
is automated, therefore making gas cycling simple. The desired gases flow into a static mixer
which generates a well-mixed stream of gases. This feed is then sent into the fixed bed reactor
portion where the heating element assures that the particle bed is at the desired set temperature.
The bed is filled with quartz chips which provides an inert to occupy reactor volume in order to
reduce the residence time of feed gases at temperature. The catalyst is surrounded by inert alumina
wool to ensure the particle fines fluidize or shift from the desired reactor zone. After reacting the
effluent gases are released to vent where a valve is present in order to sample effluent gases. These
samples are transferred to a gas chromatography-flame ionization detector (GC-FID) to fully
analyze the gas composition.
Figure 8: Simplified schematic of reactor setup.
11
2.4 Data Analysis
In order to analyze the data obtained from the 100% ethane and 100% methane experiments
selectivity, conversion, and yield are calculated. This calculation is completed on a per carbon
basis in regards to the exiting gas stream. The equations used to calculate these values are featured
below in Figure 9.
Figure 9: OCM performance parameter calculations
3. Results Discussion
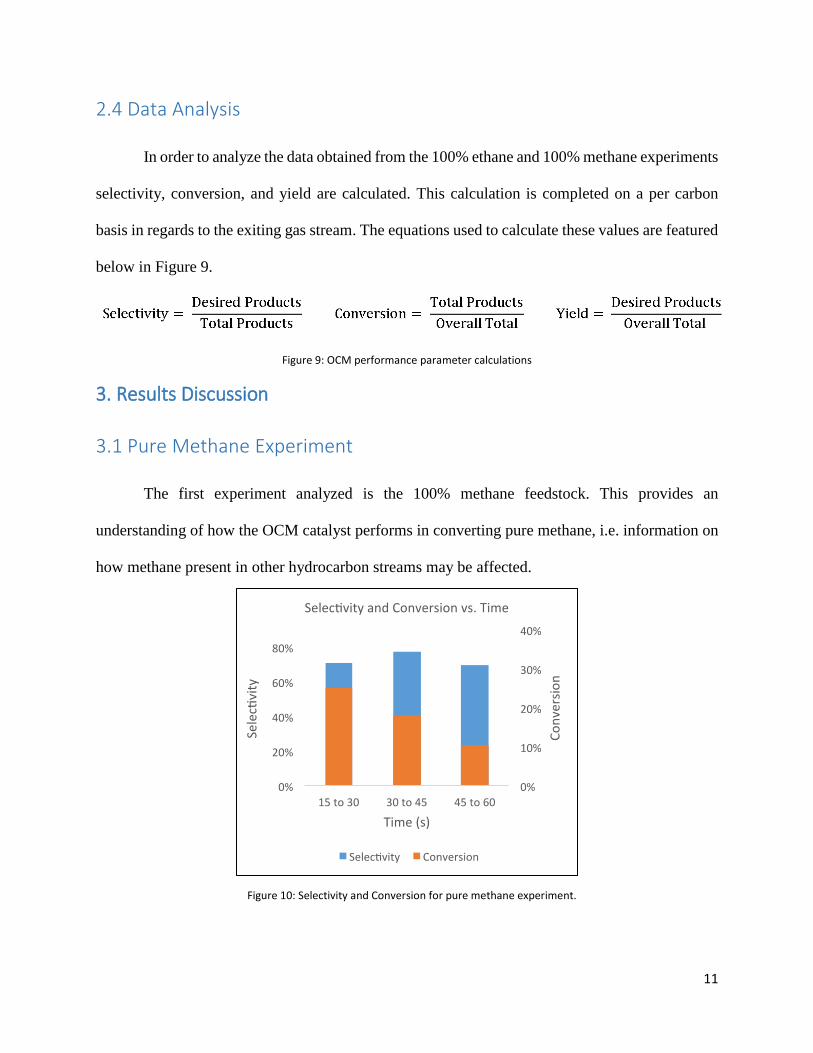
3.1 Pure Methane Experiment
The first experiment analyzed is the 100% methane feedstock. This provides an
understanding of how the OCM catalyst performs in converting pure methane, i.e. information on
how methane present in other hydrocarbon streams may be affected.
Figure 10: Selectivity and Conversion for pure methane experiment.
12
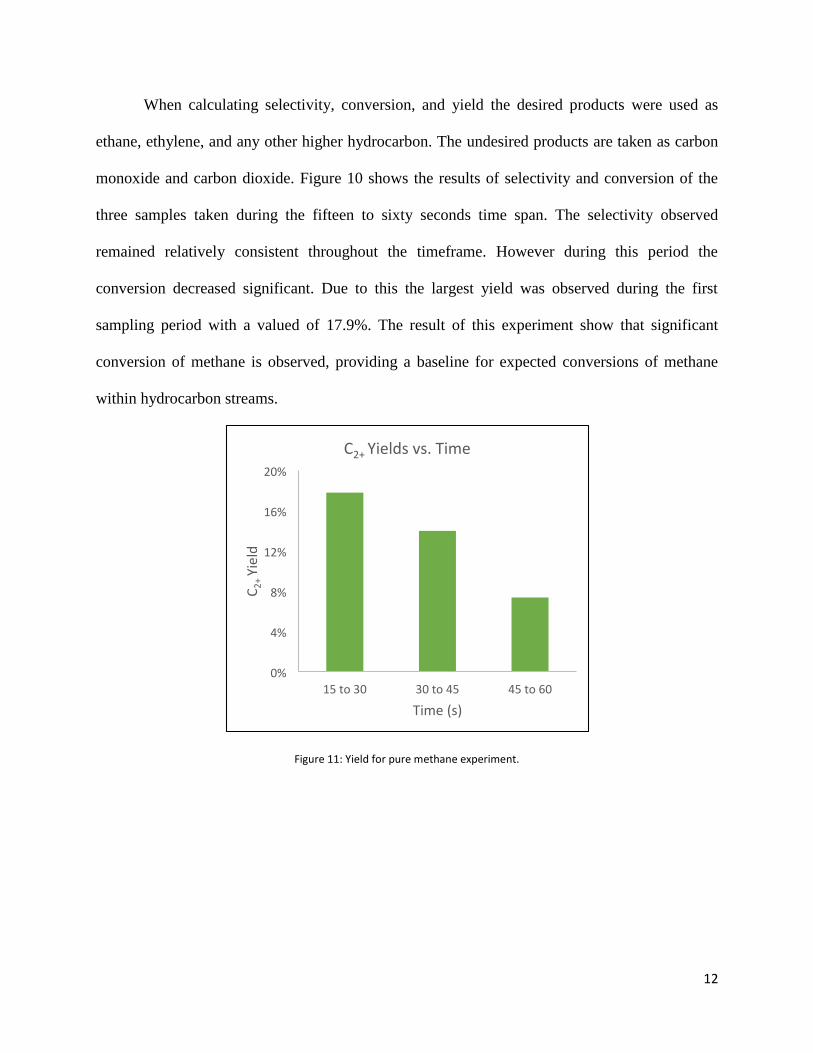
When calculating selectivity, conversion, and yield the desired products were used as
ethane, ethylene, and any other higher hydrocarbon. The undesired products are taken as carbon
monoxide and carbon dioxide. Figure 10 shows the results of selectivity and conversion of the
three samples taken during the fifteen to sixty seconds time span. The selectivity observed
remained relatively consistent throughout the timeframe. However during this period the
conversion decreased significant. Due to this the largest yield was observed during the first
sampling period with a valued of 17.9%. The result of this experiment show that significant
conversion of methane is observed, providing a baseline for expected conversions of methane
within hydrocarbon streams.
Figure 11: Yield for pure methane experiment.
0%
4%
8%
12%
16%
20%
15to30 30to45 45to60
C2+Yield
Time(s)
C2+Yieldsvs.Time
13
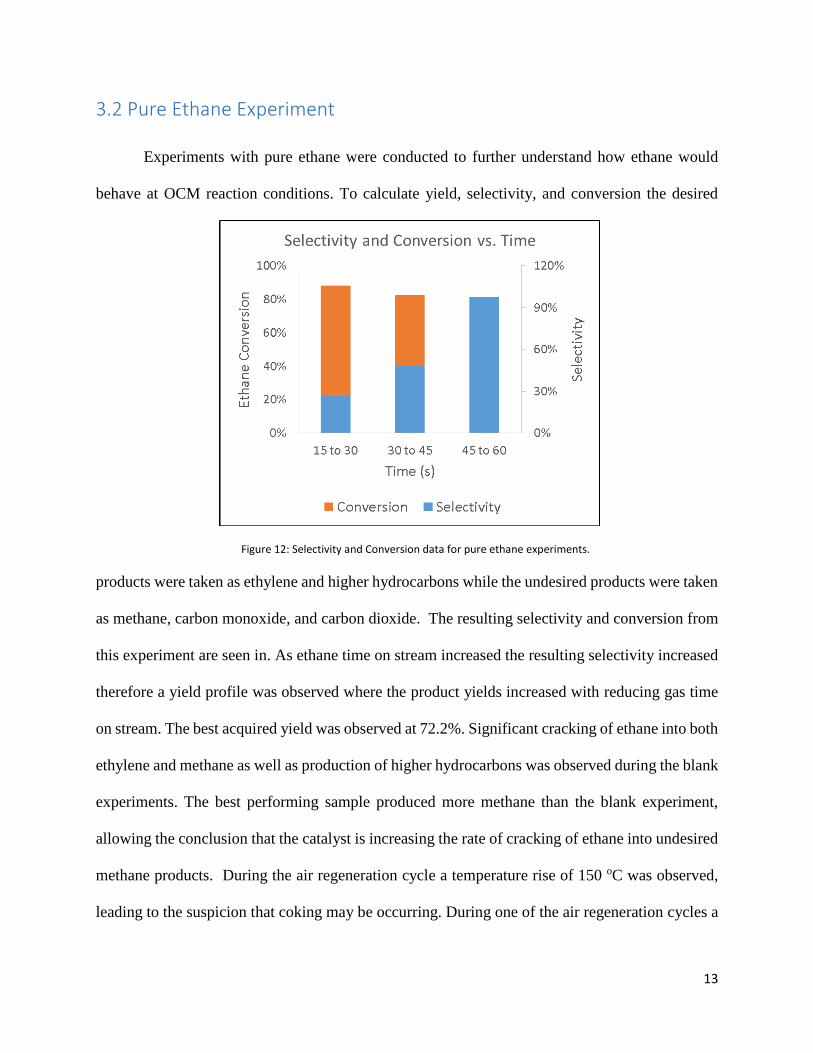
3.2 Pure Ethane Experiment
Experiments with pure ethane were conducted to further understand how ethane would
behave at OCM reaction conditions. To calculate yield, selectivity, and conversion the desired
products were taken as ethylene and higher hydrocarbons while the undesired products were taken
as methane, carbon monoxide, and carbon dioxide. The resulting selectivity and conversion from
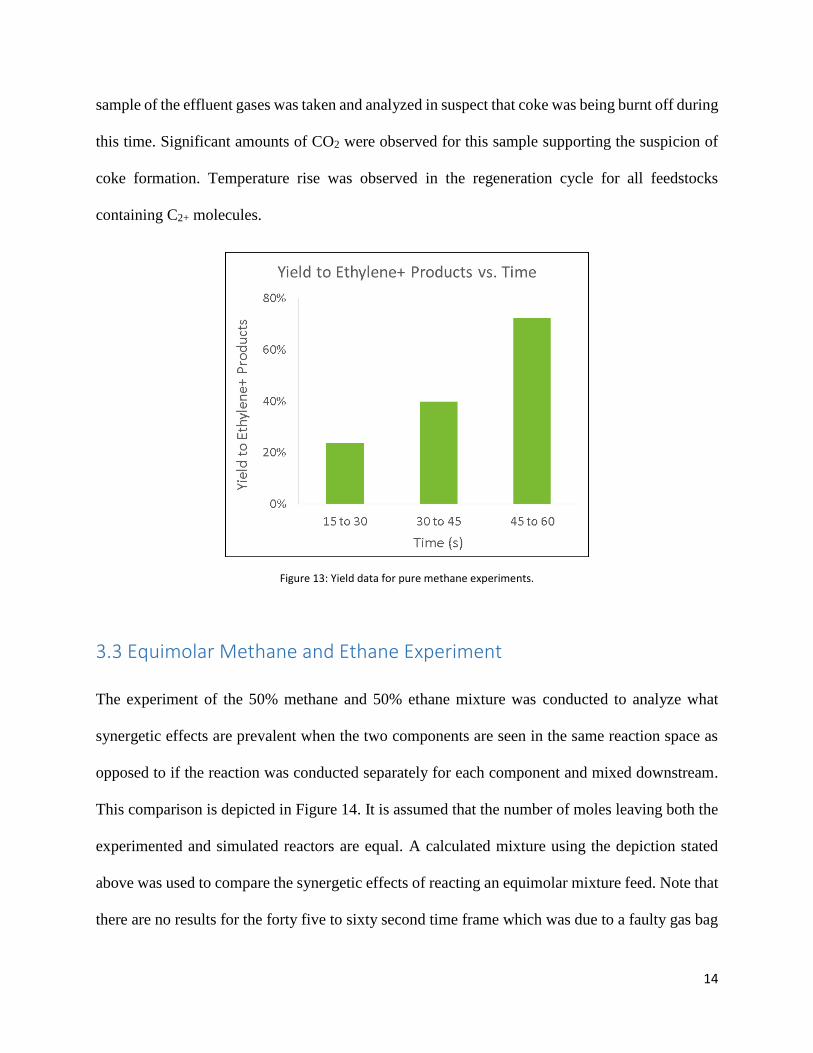
this experiment are seen in. As ethane time on stream increased the resulting selectivity increased
therefore a yield profile was observed where the product yields increased with reducing gas time
on stream. The best acquired yield was observed at 72.2%. Significant cracking of ethane into both
ethylene and methane as well as production of higher hydrocarbons was observed during the blank
experiments. The best performing sample produced more methane than the blank experiment,
allowing the conclusion that the catalyst is increasing the rate of cracking of ethane into undesired
methane products. During the air regeneration cycle a temperature rise of 150 oC was observed,
leading to the suspicion that coking may be occurring. During one of the air regeneration cycles a
Figure 12: Selectivity and Conversion data for pure ethane experiments.
14
sample of the effluent gases was taken and analyzed in suspect that coke was being burnt off during
this time. Significant amounts of CO2 were observed for this sample supporting the suspicion of
coke formation. Temperature rise was observed in the regeneration cycle for all feedstocks
containing C2+ molecules.
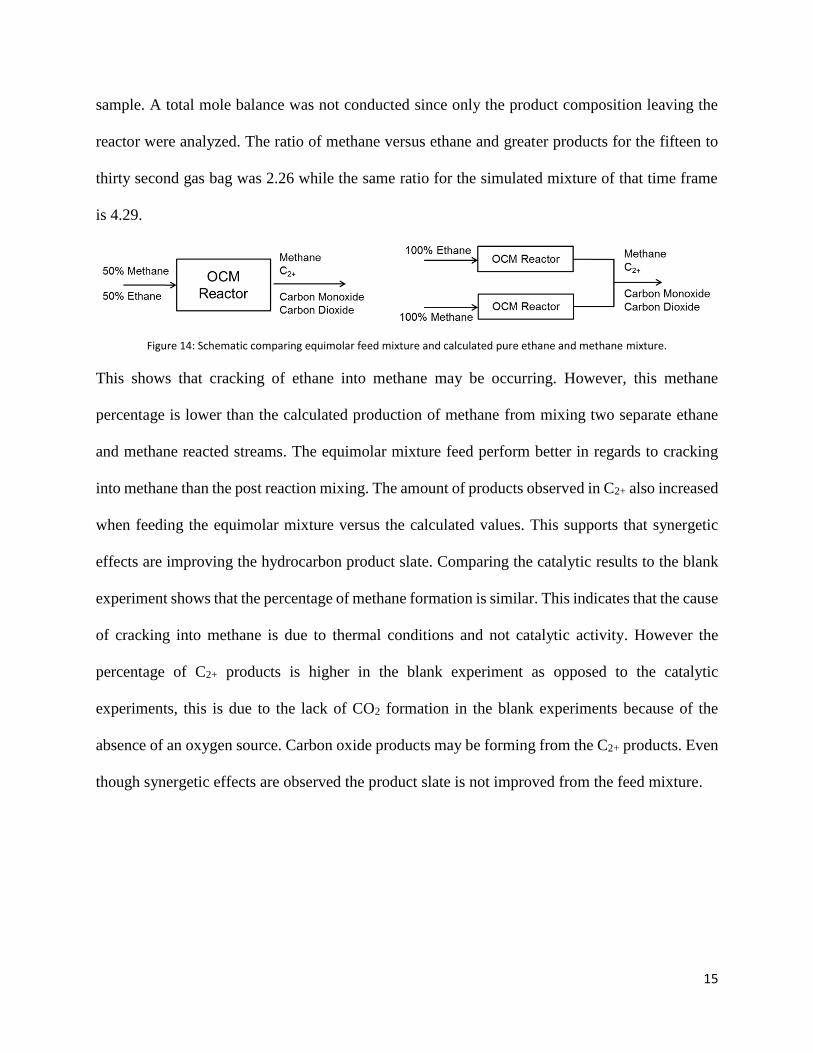
3.3 Equimolar Methane and Ethane Experiment
The experiment of the 50% methane and 50% ethane mixture was conducted to analyze what
synergetic effects are prevalent when the two components are seen in the same reaction space as
opposed to if the reaction was conducted separately for each component and mixed downstream.
This comparison is depicted in Figure 14. It is assumed that the number of moles leaving both the
experimented and simulated reactors are equal. A calculated mixture using the depiction stated
above was used to compare the synergetic effects of reacting an equimolar mixture feed. Note that
there are no results for the forty five to sixty second time frame which was due to a faulty gas bag
Figure 13: Yield data for pure methane experiments.
15
sample. A total mole balance was not conducted since only the product composition leaving the
reactor were analyzed. The ratio of methane versus ethane and greater products for the fifteen to
thirty second gas bag was 2.26 while the same ratio for the simulated mixture of that time frame
is 4.29.
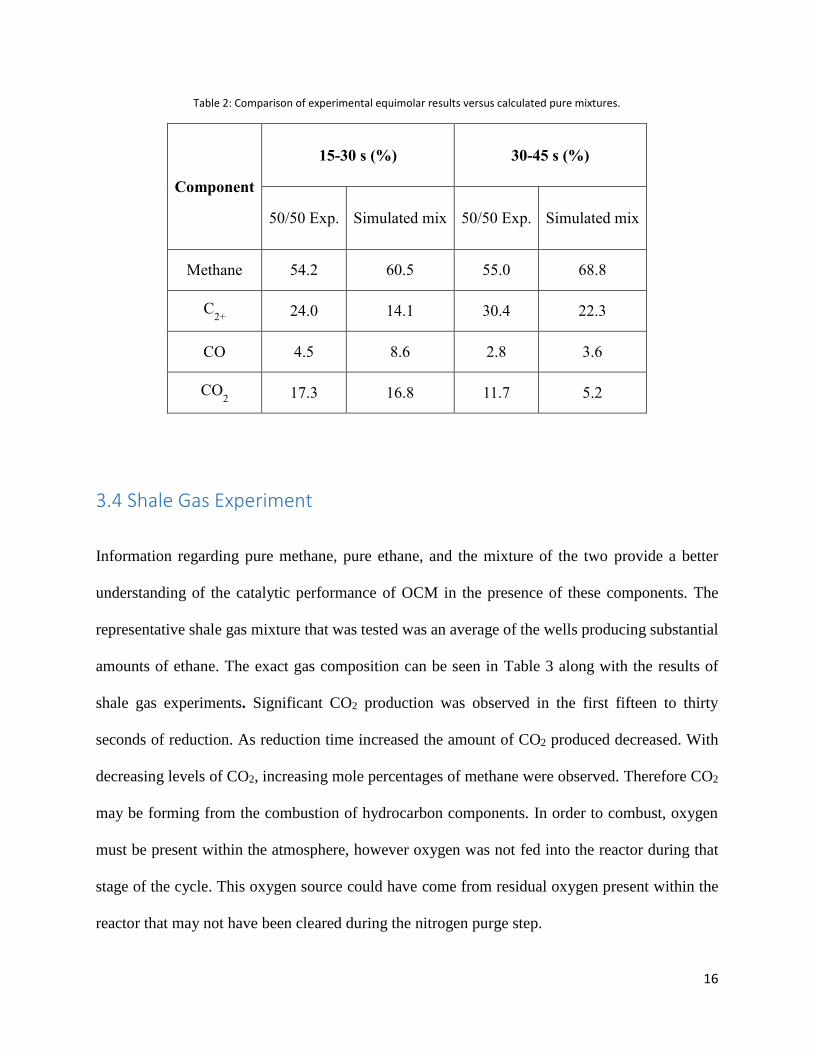
This shows that cracking of ethane into methane may be occurring. However, this methane
percentage is lower than the calculated production of methane from mixing two separate ethane
and methane reacted streams. The equimolar mixture feed perform better in regards to cracking
into methane than the post reaction mixing. The amount of products observed in C2+ also increased
when feeding the equimolar mixture versus the calculated values. This supports that synergetic
effects are improving the hydrocarbon product slate. Comparing the catalytic results to the blank
experiment shows that the percentage of methane formation is similar. This indicates that the cause
of cracking into methane is due to thermal conditions and not catalytic activity. However the
percentage of C2+ products is higher in the blank experiment as opposed to the catalytic
experiments, this is due to the lack of CO2 formation in the blank experiments because of the
absence of an oxygen source. Carbon oxide products may be forming from the C2+ products. Even
though synergetic effects are observed the product slate is not improved from the feed mixture.
Figure 14: Schematic comparing equimolar feed mixture and calculated pure ethane and methane mixture.
16
Table 2: Comparison of experimental equimolar results versus calculated pure mixtures.
Component
15-30 s (%) 30-45 s (%)
50/50 Exp. Simulated mix 50/50 Exp. Simulated mix
Methane 54.2 60.5 55.0 68.8
C2+
24.0 14.1 30.4 22.3
CO 4.5 8.6 2.8 3.6
CO2 17.3 16.8 11.7 5.2
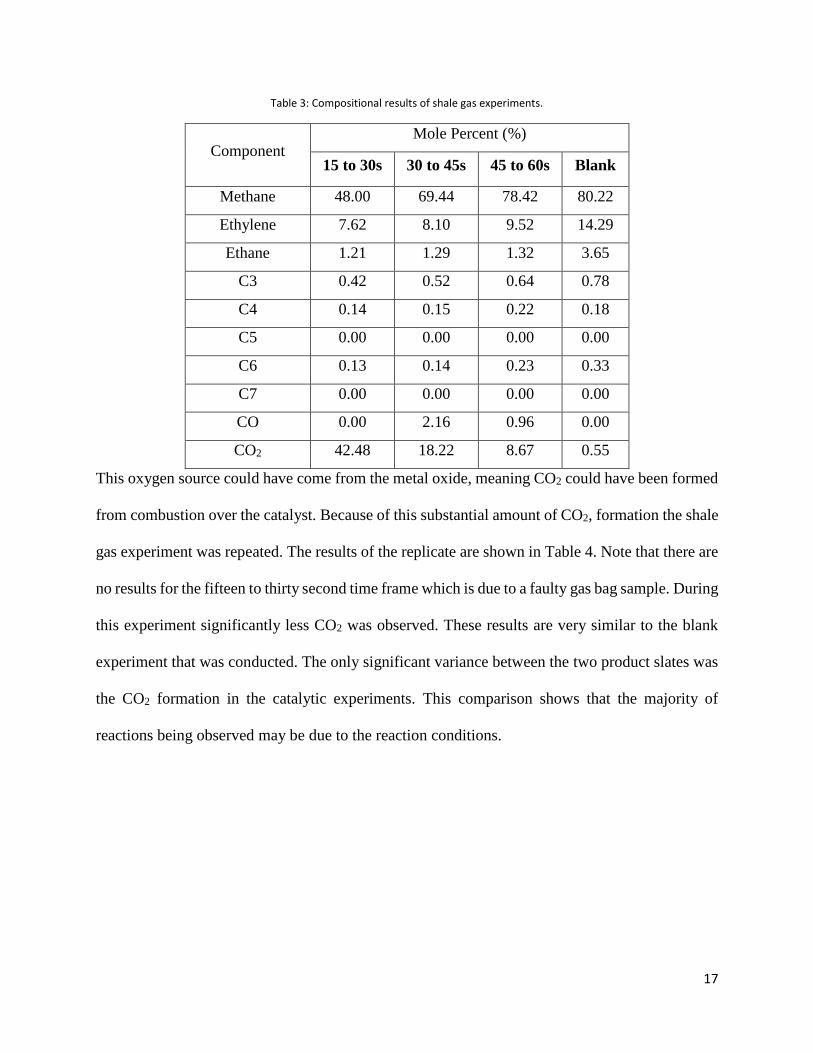
3.4 Shale Gas Experiment
Information regarding pure methane, pure ethane, and the mixture of the two provide a better
understanding of the catalytic performance of OCM in the presence of these components. The
representative shale gas mixture that was tested was an average of the wells producing substantial
amounts of ethane. The exact gas composition can be seen in Table 3 along with the results of
shale gas experiments. Significant CO2 production was observed in the first fifteen to thirty
seconds of reduction. As reduction time increased the amount of CO2 produced decreased. With
decreasing levels of CO2, increasing mole percentages of methane were observed. Therefore CO2
may be forming from the combustion of hydrocarbon components. In order to combust, oxygen
must be present within the atmosphere, however oxygen was not fed into the reactor during that
stage of the cycle. This oxygen source could have come from residual oxygen present within the
reactor that may not have been cleared during the nitrogen purge step.
17
Table 3: Compositional results of shale gas experiments.
Component Mole Percent (%)
15 to 30s 30 to 45s 45 to 60s Blank
Methane 48.00 69.44 78.42 80.22
Ethylene 7.62 8.10 9.52 14.29
Ethane 1.21 1.29 1.32 3.65
C3 0.42 0.52 0.64 0.78
C4 0.14 0.15 0.22 0.18
C5 0.00 0.00 0.00 0.00
C6 0.13 0.14 0.23 0.33
C7 0.00 0.00 0.00 0.00
CO 0.00 2.16 0.96 0.00
CO2 42.48 18.22 8.67 0.55
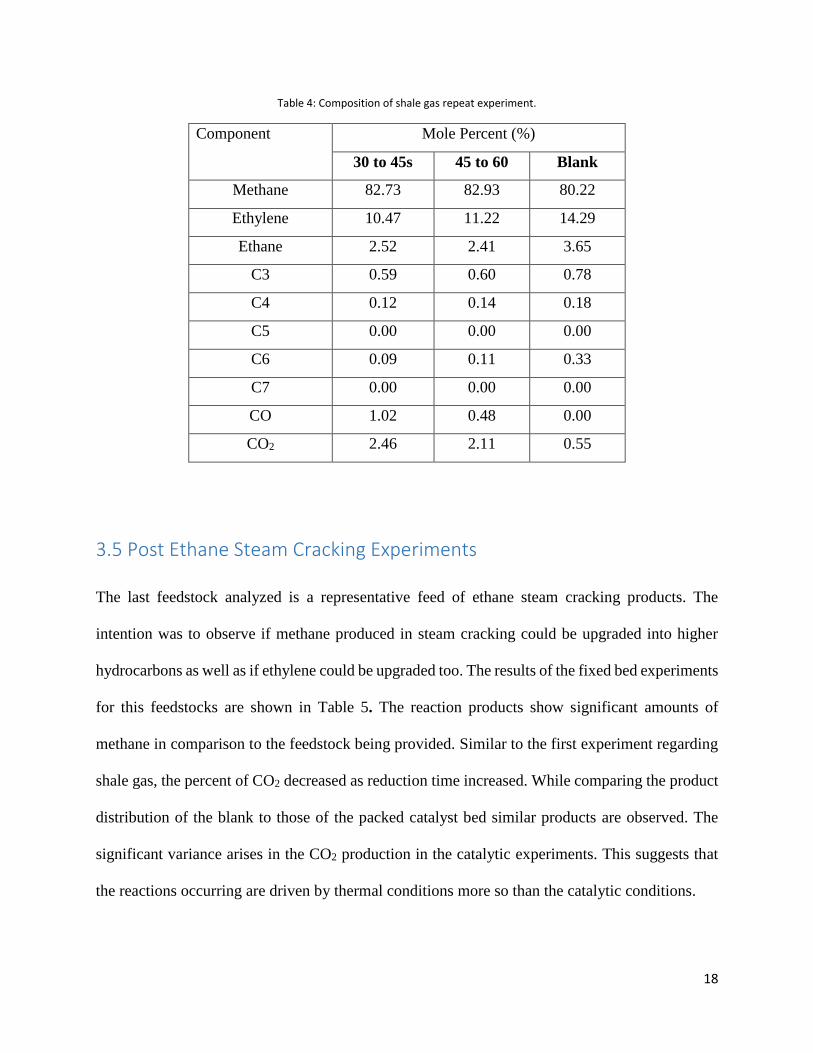
This oxygen source could have come from the metal oxide, meaning CO2 could have been formed
from combustion over the catalyst. Because of this substantial amount of CO2, formation the shale
gas experiment was repeated. The results of the replicate are shown in Table 4. Note that there are
no results for the fifteen to thirty second time frame which is due to a faulty gas bag sample. During
this experiment significantly less CO2 was observed. These results are very similar to the blank
experiment that was conducted. The only significant variance between the two product slates was
the CO2 formation in the catalytic experiments. This comparison shows that the majority of
reactions being observed may be due to the reaction conditions.
18
Table 4: Composition of shale gas repeat experiment.
Component Mole Percent (%)
30 to 45s 45 to 60 Blank
Methane 82.73 82.93 80.22
Ethylene 10.47 11.22 14.29
Ethane 2.52 2.41 3.65
C3 0.59 0.60 0.78
C4 0.12 0.14 0.18
C5 0.00 0.00 0.00
C6 0.09 0.11 0.33
C7 0.00 0.00 0.00
CO 1.02 0.48 0.00
CO2 2.46 2.11 0.55
3.5 Post Ethane Steam Cracking Experiments
The last feedstock analyzed is a representative feed of ethane steam cracking products. The
intention was to observe if methane produced in steam cracking could be upgraded into higher
hydrocarbons as well as if ethylene could be upgraded too. The results of the fixed bed experiments
for this feedstocks are shown in Table 5. The reaction products show significant amounts of
methane in comparison to the feedstock being provided. Similar to the first experiment regarding
shale gas, the percent of CO2 decreased as reduction time increased. While comparing the product
distribution of the blank to those of the packed catalyst bed similar products are observed. The
significant variance arises in the CO2 production in the catalytic experiments. This suggests that
the reactions occurring are driven by thermal conditions more so than the catalytic conditions.
19
Table 5: Compositional results of post ethane steam crack experiments.
Component Mole Percent (%)
15 to 30s 30 to 45s 45 to 60s Blank Feed
Methane 26.10 25.61 27.40 23.50 7.72
Ethylene 49.59 53.12 57.41 58.40 84.70
Ethane 4.25 4.39 5.42 5.30 0.00
C3 1.75 1.79 1.95 2.50 2.13
C4 1.16 1.22 1.12 2.00 3.26
C5 0.12 0.13 0.12 0.40 2.20
C6 2.96 3.26 2.36 7.00 0.00
C7 0.14 0.23 0.14 0.60 0.00
CO 2.27 1.04 0.00 0.30 0.00
CO2 11.66 9.22 4.07 0.30 0.00
20
4. Conclusion and Future Work
Five feedstocks were tested and analyzed in a fixed bed experimental set up. The pure
methane experiment showed a solid hydrocarbon yield of 17.9%. The pure ethane results showed
that some ethane could be upgraded at OCM conditions, however significant CO2 and methane
were observed as byproducts. Pure ethane is very reactive at the extreme OCM temperature
conditions. The equimolar mixture of methane and ethane showed synergetic effects that lowered
the methane products as well as increased the higher hydrocarbon yield. However, the ratio of
methane compared to desired hydrocarbons was greater than what was fed into the reactor. Also
the higher hydrocarbon count was observed to be lower in the products in comparison to the feed.
The results of shale gas feed initially showed substantial CO2 production, but during a replicate of
the experiment this significant amount of CO2 was not observed. The shale gas, like the equimolar
mixture, did not improve the feedstock product slate. Lastly the post ethane steam cracking
experiment showed significant formation of methane as well as CO2 formation, therefore the
product slates were not upgraded in comparison to their feedstocks. Observing the blank
experiments, in comparison to the corresponding catalytic reactions, it was seen that significant
cracking of higher hydrocarbons into methane occurred. Further experiments should be conducted
to understand the thermal cracking of ethane into methane in order to hinder this reaction. The
analysis of the effect of introducing steam should be considered in order to reduce coke formation
within the catalyst bed. Lastly the effects of reaction conditions such as temperature, pressure, and
space velocity should be studied in order to optimize these conditions for the production of higher
hydrocarbons with respect to the above studied feedstocks.
21
References
1. Brooks, R. (2013). Modeling the North American Market for Natural Gas Liquids. RBAC
Inc.
2. Fattouh, B., & Brown, C. (2014). US NGLs Production and Steam Cracker Substitution:
What will the Spillover Effects be in Global Petrochemical Markets. The Oxford Institute
For Energy Studies.
3. Cavani, F., & Trifirò, F. (n.d.). The oxidative dehydrogenation of ethane and propane as
an alternative way for the production of light olefins. Catalysis Today, 307-313.
4. Keller, G. E.; Bhasin, M. M. Synthesis of Ethylene via Oxidative Coupling of Methane.
J. Catal. 1982, 73, 9-19.
5. Jones, C. A.; Leonard, J. J.; Sofranko, J. A. The Oxidative Conversion of Methane to
Higher Hydrocarbons over Alkali-Promoted Mn/SiO2. J. Catal. 1987, 103, 311-319.
6. Ito, T.; Wang, J.-X.; Lin, C.-H.; Lunsford, J. H. Oxidative Dimerization of Methane over
a Lithium-Promoted Magnesium Oxide Catalyst. J. Am. Chem. Soc. 1985, 107, 5062-
5068.
7. Sofranko, J. A.; Leonard, J. J.; Jones, C. A.; Gaffney, A. M.; Withers, H. P. Catalytic
Oxidative Coupling of Methane Over Sodium-Promoted Mn/SiO2 and Mn/MgO. Catal.
Today 1988, 3, pp 127-135.
8. Liang, Y., Li, Z., Nourdine, M., Shahid, S. and Takanabe, K. Methane Coupling Reaction
in an Oxy-Steam Stream through an OH Radical Pathway by using Supported Alkali
Metal Catalysts. ChemCatChem, 6: 1245–1251.
22
9. Takanabe, K.; Iglesia, E. Mechanistic Aspects and Reaction Pathways for Oxidative
Coupling of Methane on Mn/Na2WO4/SiO2 Catalysts J. Phys. Chem. 2009, 113 (23),
10131-10145
10. Kondratenko, E. V., Baerns, M. “Oxidative Coupling of Methane,” In: Handbook of
Heterogeneous Catalysis; Ertl, G., Knozinger, H., Weitkamp, J., eds.
11. Tiemersma, T.P., Tuinier, M.J., Gallucci, F., Kuipers, J.A.M., van Sint Annaland, M., “A
Kinetics Study for the Oxidative Coupling of Methane on a Mn/Na2WO4/SiO2 Catalyst,”
Applied Catalysis A: General, Volume 433-434, 2012
23
Appendix: Additional Tables
Table 6: Selectivity, conversion, and yield for pure methane experiments.
Sampling Period Selectivity (%) Conversion (%) Yield (%)
15 to 30 sec 71.2 25.1 17.9
30 to 45 sec 77.6 18.0 14.0
45 to 60 sec 79.8 10.5 7.3
Table 7: Composition of pure methane experiment
Component
Mole Percent (%)
15 to 30s 30 to 45s 45 to 60s Blank
Methane 83.46 89.05 93.11 98.91
Ethylene 4.54 3.23 2.05 0.26
Ethane 2.38 2.27 1.24 0.38
C3 0.90 0.64 0.20 0.02
C4 0.22 0.15 0.03 0.00
C5 0.16 0.12 0.04 0.00
C6 0.26 0.16 0.02 0.00
C7 0.03 0.02 0.00 0.00
CO 0.49 0.34 0.00 0.07
CO2 7.58 4.03 3.31 0.37
24
Table 8: Selectivity, conversion, and yield for pure ethane experiments.
Sampling Period Selectivity (%) Conversion (%) Yield (%)
15 to 30 sec 26.80 88.15 23.63
30 to 45 sec 48.39 82.35 39.85
45 to 60 sec 97.76 73.86 72.21
Table 9: Compositional results of pure ethane experiment.
Component Mole Percent (%)
15 to 30s 30 to 45s 45 to 60s Blank
Methane 37.51 48.60 45.43 12.0
Ethylene 11.12 22.82 34.96 61.77
Ethane 7.37 12.87 15.08 22.17
C3 0.20 0.41 0.66 1.26
C4 0.06 0.13 0.24 1.09
C5 0.00 0.00 0.00 0.17
C6 1.00 1.79 1.65 1.19
C7 0.04 0.00 0.08 0.34
CO 16.63 6.96 0.00 0.00
CO2 26.07 6.42 1.91 0.00
25
Table 10: Compositional results of equimolar methane and ethane feed mixture.
Component Mole Percent (%)
15 to 30s 30 to 45s Blank
Methane 54.22 55.03 56.28
Ethylene 18.71 23.89 34.33
Ethane 4.17 4.82 8.22
C3 0.56 0.71 0.56
C4 0.23 0.43 0.34
C5 0.00 0.0 0.00
C6 0.32 0.56 0.28
C7 0.02 0.02 0
CO 4.48 2.84 0.00
CO2 17.29 11.71 0.00