Embed Size (px)
Citation preview
Joint Center for Housing Studies
Harvard University
Buying For Themselves: An Analysis of Unmarried Female Home Buyers
Rachel Bogardus Drew June 2006
N06-3

Joint Center for Housing Studies
Harvard University
Buying For Themselves: An Analysis of Unmarried Female Home Buyers
Rachel Bogardus Drew June 2006
N06-3
© by Rachel Bogardus Drew. All rights reserved. Short sections of text, not to exceed two paragraphs, may be quoted without explicit permission provided that full credit, including © notice, is given to the source. The author would like to thank Allegra Calder for her work on an earlier version of this paper and Eric Belsky and William Apgar for their reviews and critiques. Any opinions expressed are those of the author and not those of the Joint Center for Housing Studies of Harvard University or of any of the persons or organizations providing support to the Joint Center for Housing Studies. © 2006 President and Fellows of Harvard College. All rights reserved. Short sections of text, not to exceed two paragraphs, may be quoted without explicit permission provided that full credit, including © notice, is given to the source.

Introduction
For decades, real estate and housing professionals have thought of the typical home buyer
as a married couple, with or without children, either purchasing their first home or trading up as
their families and needs grow. While married couples continue to make up a majority of home
buyers today, a growing group of unmarried buyers has made the industry take notice. In
particular, the rise in the fraction of unmarried female home buyers to one-fifth of the market has
sparked interest in uncovering more about their characteristics, preferences and buying behavior,
and how the industry can be responsive to this segment of the market.
Yet, little is known about unmarried female homebuyers. Only a few surveys and studies
have focused on the marital status and gender of home buyers, and even fewer have sought to
identify theirs as a distinct market and consider the differences in their characteristics and
motivations for buying homes. This paper seeks to take what information is available and
describe unmarried female home buyers in more detail than has been previously done. This
analysis will look at their characteristics relative to other buyers, their home purchasing
behavior, their identified preferences, and finally, subsets of unmarried female buyers with
distinct buying behaviors of their own.
The findings are striking: Not only are unmarried women a large segment of the home
buying population, but they are fast-growing, too, increasing their share of home buyers by 50
percent in eight years. The value of their home purchases over a 3-plus year period totaled more
than $550 billion, though they were less likely to buy a newly built or a high priced home than
married couples. The characteristics of these buyers are also noteworthy, with a larger share of
minorities especially among younger buyers. Two out of three female buyers were previously
married, though that share drops significantly for younger buyers. They also have lower incomes
than unmarried men and married home buyers, but are less apt to finance their home purchase.
These traits generalize the make-up of unmarried female buyers; in reality they are a
diverse and highly segmented group comprised of single mothers, young singles, middle-aged
divorcees and seniors. Single mothers, for example, have the highest share of minorities while
young singles are the least likely to be previously married. Middle aged women and seniors are
more likely to have purchased a home in the past, which offsets their generally lower incomes
relative to other female buyers by providing equity with which to finance their new home.
© 2006 President and Fellows of Harvard College. All rights reserved. Short sections of text, not to exceed two paragraphs, may be quoted without explicit permission provided that full credit, including © notice, is given to the source. 1
For the purposes of this analysis, home buyers are defined as those households identified
in the 2003 American Housing Survey (AHS) as living in a home they purchased in 2000 or
later. Under this definition, the AHS identified 18 million home buyers. This figure is smaller
than the sum of buyers counted annually from 2000 to 2003 by the National Association of
Realtors® (22.3 million), in part because it excludes second home buyers, counts buyers who
moved multiple times between 2000 and 2003 as having moved only once (in their most recent
residence), and covers only part of 2003 (surveys were conducted between May and September,
and thus did not capture home purchases made in the later part of the year). Nonetheless this
group of recent home buyers is substantial enough to allow for in-depth analysis of their
characteristics.
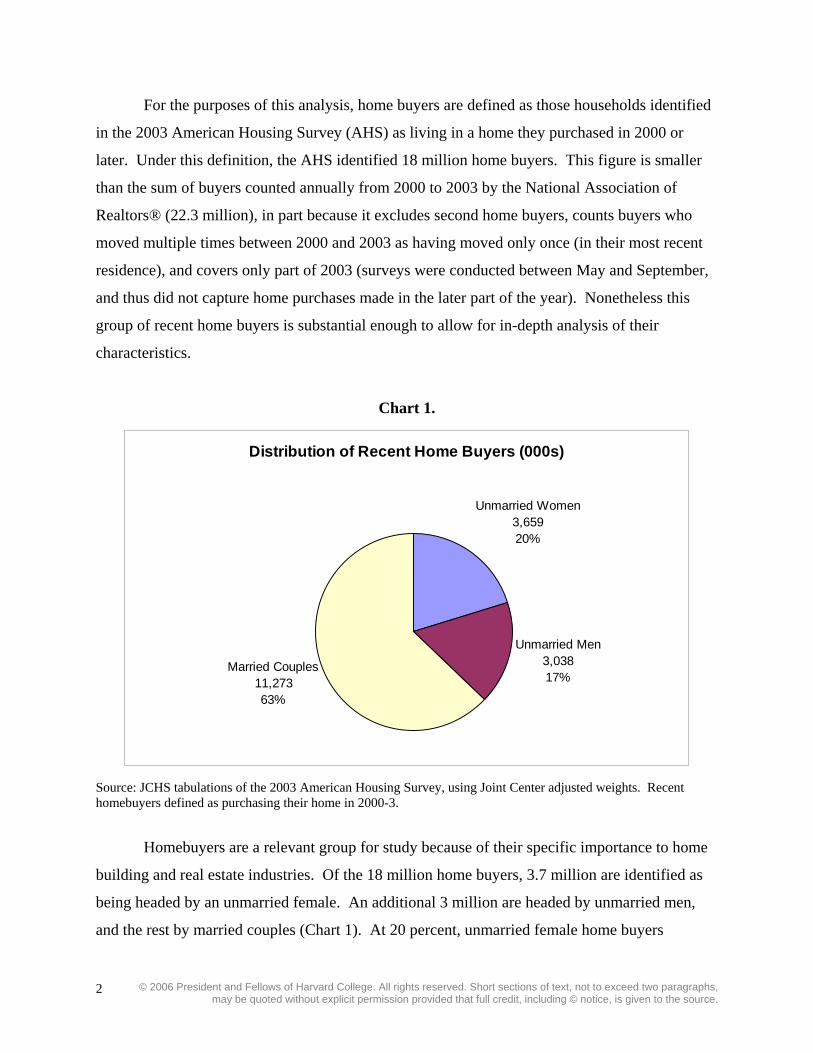
Chart 1.
Distribution of Recent Home Buyers (000s)
Unmarried Women3,65920%
Unmarried Men3,03817%
Married Couples11,27363%
Source: JCHS tabulations of the 2003 American Housing Survey, using Joint Center adjusted weights. Recent homebuyers defined as purchasing their home in 2000-3.
Homebuyers are a relevant group for study because of their specific importance to home
building and real estate industries. Of the 18 million home buyers, 3.7 million are identified as
being headed by an unmarried female. An additional 3 million are headed by unmarried men,
and the rest by married couples (Chart 1). At 20 percent, unmarried female home buyers
© 2006 President and Fellows of Harvard College. All rights reserved. Short sections of text, not to exceed two paragraphs, may be quoted without explicit permission provided that full credit, including © notice, is given to the source. 2
constitute a significant minority share of the home buying market. In general, unmarried female
buyers are older than married and unmarried male buyers, have higher shares of minority buyers,
have lower incomes and, consequently, much greater incidence of housing affordability
problems. Relative to unmarried male buyers, they are more likely to have been previously
married and to be living with children or other family members than alone or with non-relatives.
Unmarried female buyers also differ from other buyers in the types of homes they
choose, the locations of those homes, their financing and purchasing preferences, and their
reasons for moving and making a home purchase. Unmarried female buyers are slightly more
likely than unmarried male buyers and significantly more likely than married couple buyers to
purchase condos and less likely to live in single-family detached homes. More than half are
trade-up buyers, which is a smaller share than among married couples but higher than for
unmarried men. Both unmarried women and men are more likely to live in central cities relative
to married couples, though no other significant regional or geographical differences are evident.
Finally, unmarried women overwhelmingly prefer 2 bedroom homes more than other buyers, and
are less likely to choose newer construction than married couples.
The group of unmarried female buyers is far from homogeneous – it includes women of
all ages and races, single mothers, widows, divorcees, women living alone and those living with
other adults. Nearly half live alone and another 30 percent are single mothers. Two-thirds were
previously married – mostly divorced or separated – though younger buyers are more likely than
older and middle aged ones to have never been married. One quarter of buyers live with other
adults, which include women living with partners, unrelated roommates and other family
members.
© 2006 President and Fellows of Harvard College. All rights reserved. Short sections of text, not to exceed two paragraphs, may be quoted without explicit permission provided that full credit, including © notice, is given to the source. 3
The Rise in Female Home Buyers
The increasing interest in unmarried female home buyers comes as the housing industry
acknowledges the significant and growing role that women play in housing decisions. From
initiatives to inform and educate single women on the home buying process, to opportunities for
women to learn more about home maintenance and repair, and even advertising targeted at
women for everything from real estate services to mortgage companies to power tools, the
emphasis on appealing to women as homeowners is evident. Even within married couples,
women are increasingly identifying themselves as the householder, up from 11 percent in 1993
to 26 percent of all married couples in 2003. Married women who are not the identified
householder are also becoming more responsible for making most of the major housing-related
decisions. Additionally, women make greater financial contributions to the household than in
the past, as higher educational attainment and entry into the labor force have raised women’s
share of household earnings.
Though married couples still account for the majority of home buyers, their share has
been shrinking over the past 50 years. Meanwhile, the share of single female homebuyers
increased from 14 percent in 1995 to 21 percent in 2003, according to the National Association
of Realtors® 2004 Survey of Home Buyers and Sellers. The reasons for this change are
manifold. First, there are more unmarried women in the population than in the past (Chart 2).
Indeed, the number of unmarried women increased 20 percent in the last decade alone. The
average age of a woman’s first marriage increased from 20.8 in 1970 to 25.3 in 2003, as more
women sought an education and career before committing to marriage. And since fewer young-
adult women than men choose to live with their parents, more of these women are forming their
own households.
© 2006 President and Fellows of Harvard College. All rights reserved. Short sections of text, not to exceed two paragraphs, may be quoted without explicit permission provided that full credit, including © notice, is given to the source. 4
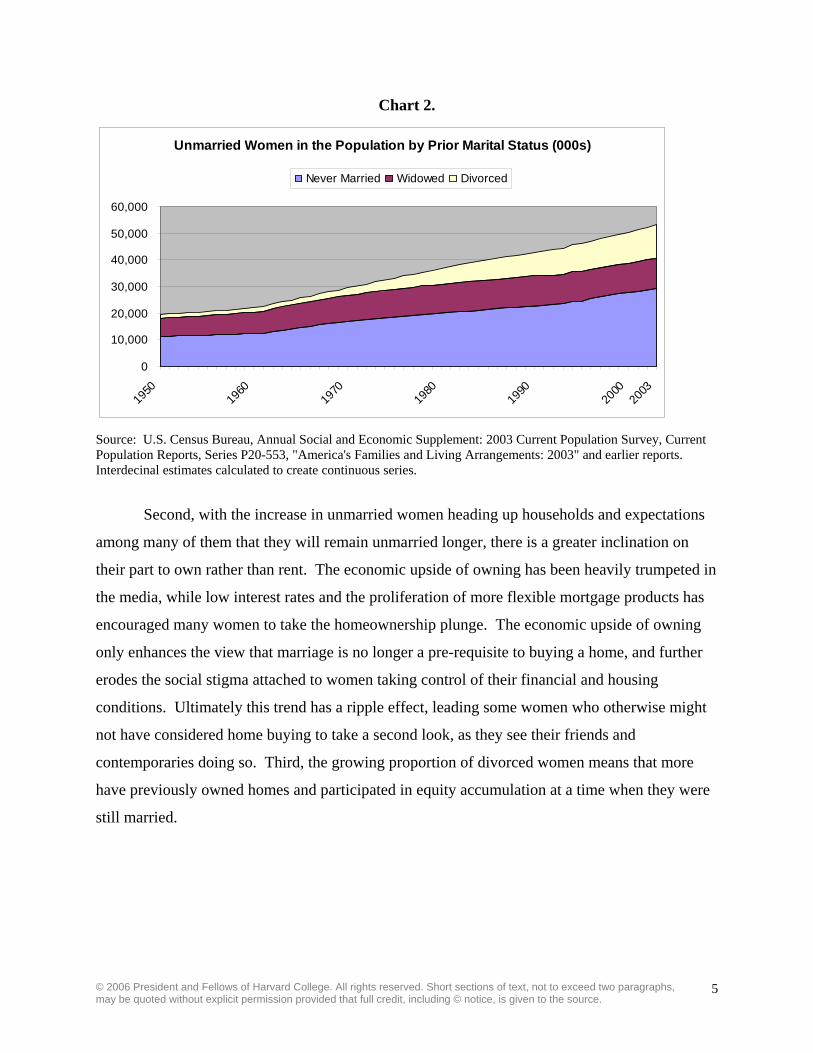
Chart 2.
Unmarried Women in the Population by Prior Marital Status (000s)
0
10,000
20,000
30,000
40,000
50,000
60,000
1950
1960
1970
1980
1990
2000
2003
Never Married Widowed Divorced
Source: U.S. Census Bureau, Annual Social and Economic Supplement: 2003 Current Population Survey, Current Population Reports, Series P20-553, "America's Families and Living Arrangements: 2003" and earlier reports. Interdecinal estimates calculated to create continuous series.
Second, with the increase in unmarried women heading up households and expectations
among many of them that they will remain unmarried longer, there is a greater inclination on
their part to own rather than rent. The economic upside of owning has been heavily trumpeted in
the media, while low interest rates and the proliferation of more flexible mortgage products has
encouraged many women to take the homeownership plunge. The economic upside of owning
only enhances the view that marriage is no longer a pre-requisite to buying a home, and further
erodes the social stigma attached to women taking control of their financial and housing
conditions. Ultimately this trend has a ripple effect, leading some women who otherwise might
not have considered home buying to take a second look, as they see their friends and
contemporaries doing so. Third, the growing proportion of divorced women means that more
have previously owned homes and participated in equity accumulation at a time when they were
still married.
© 2006 President and Fellows of Harvard College. All rights reserved. Short sections of text, not to exceed two paragraphs, may be quoted without explicit permission provided that full credit, including © notice, is given to the source. 5
Characteristics of Female Home Buyers
Unmarried female buyers are an important segment of homebuyers, purchasing over $550
billion of real estate between 2000 and 2003. Examination of their demographic, economic and
behavioral differences relative to other home buyers will help industry professionals better
understand this segment of the market and address their growing needs and demands.
Demographic Differences
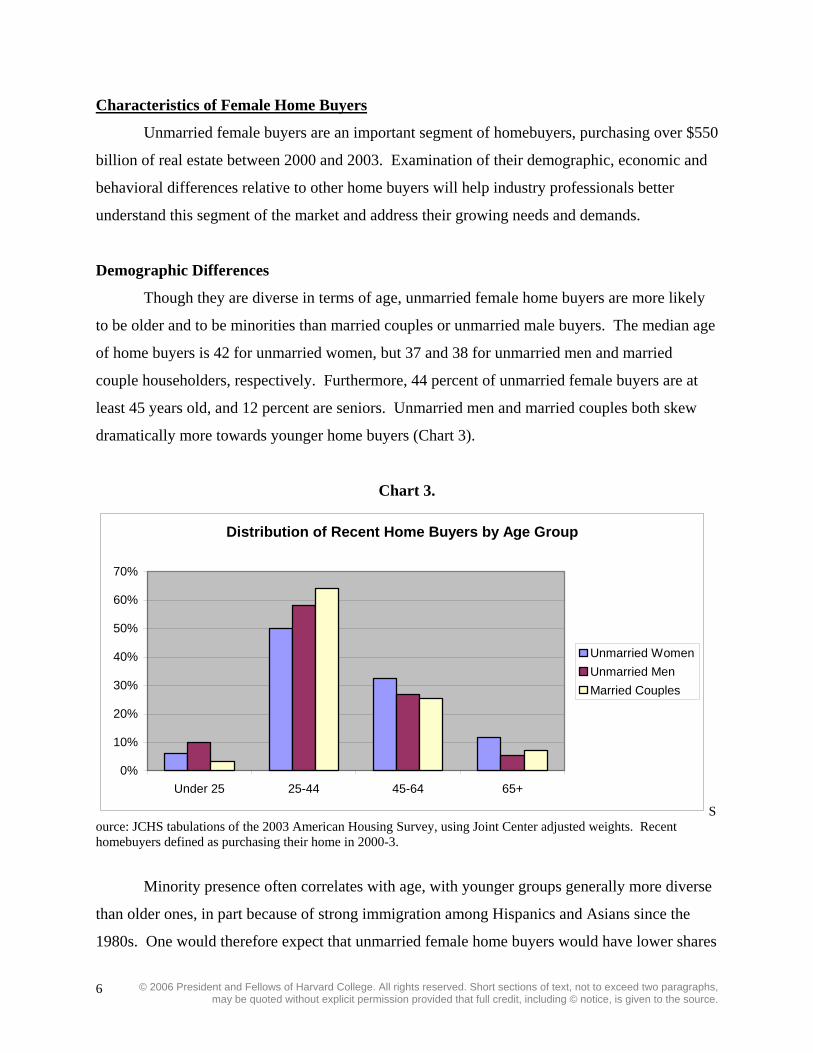
Though they are diverse in terms of age, unmarried female home buyers are more likely
to be older and to be minorities than married couples or unmarried male buyers. The median age
of home buyers is 42 for unmarried women, but 37 and 38 for unmarried men and married
couple householders, respectively. Furthermore, 44 percent of unmarried female buyers are at
least 45 years old, and 12 percent are seniors. Unmarried men and married couples both skew
dramatically more towards younger home buyers (Chart 3).
Chart 3.
Distribution of Recent Home Buyers by Age Group
0%
10%
20%
30%
40%
50%
60%
70%
Under 25 25-44 45-64 65+
Unmarried WomenUnmarried MenMarried Couples
Source: JCHS tabulations of the 2003 American Housing Survey, using Joint Center adjusted weights. Recent homebuyers defined as purchasing their home in 2000-3.
Minority presence often correlates with age, with younger groups generally more diverse
than older ones, in part because of strong immigration among Hispanics and Asians since the
1980s. One would therefore expect that unmarried female home buyers would have lower shares
© 2006 President and Fellows of Harvard College. All rights reserved. Short sections of text, not to exceed two paragraphs, may be quoted without explicit permission provided that full credit, including © notice, is given to the source. 6
of minorities relative to other buyers, due to their generally older age distribution. But on the
contrary, the minority share of unmarried female buyers is actually larger than for other groups
of recent home buyers. One quarter of unmarried female buyers are minorities, while 21 and 22
percent of unmarried male and married couple buyers are minorities. Indeed, the difference is
even more pronounced when segmented by age, with minorities accounting for nearly 30 percent
of female buyers under 45, relative to only 22 and 24 percent of unmarried men and married
couples, respectively. Large numbers of minority single mothers likely influence this trend.
Even within minority groups there are distinct trends – blacks are the only racial/ethnic
group for whom married couples are less than half of all home buyers, while unmarried women
account for over a third. By comparison, over 70 percent of Hispanic and Asian buyers are
married couples (see Table 1).
Prior Marital Status
The 3.7 million unmarried female home buyers between 2000 and 2003 include a
significant fraction of divorced, separated and widowed women in addition to those who have
never been married. Indeed, previously married women accounted for nearly 2 out of 3
unmarried female buyers, with divorced and separated women alone making up half. Unmarried
male buyers exhibit the opposite trend, however, with more than half of them having never been
married and only 6 percent widowed. This partially explains the younger average age of male
buyers relative to unmarried female buyers.
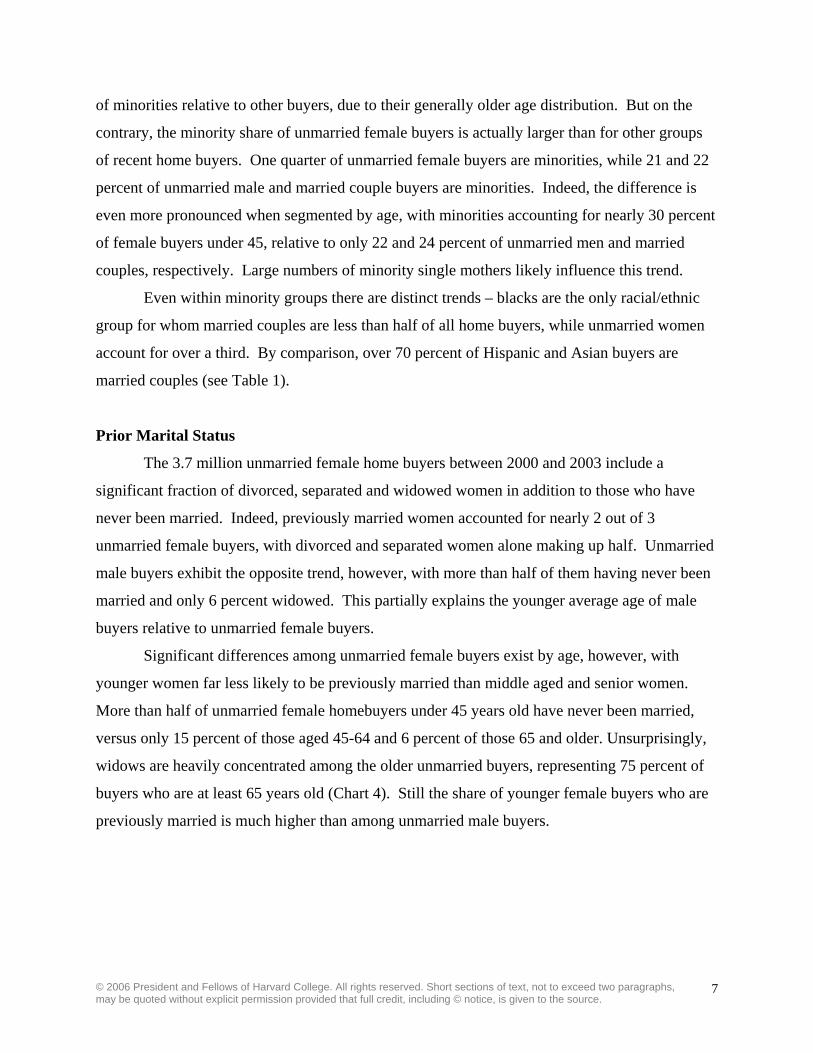
Significant differences among unmarried female buyers exist by age, however, with
younger women far less likely to be previously married than middle aged and senior women.
More than half of unmarried female homebuyers under 45 years old have never been married,
versus only 15 percent of those aged 45-64 and 6 percent of those 65 and older. Unsurprisingly,
widows are heavily concentrated among the older unmarried buyers, representing 75 percent of
buyers who are at least 65 years old (Chart 4). Still the share of younger female buyers who are
previously married is much higher than among unmarried male buyers.
© 2006 President and Fellows of Harvard College. All rights reserved. Short sections of text, not to exceed two paragraphs, may be quoted without explicit permission provided that full credit, including © notice, is given to the source. 7
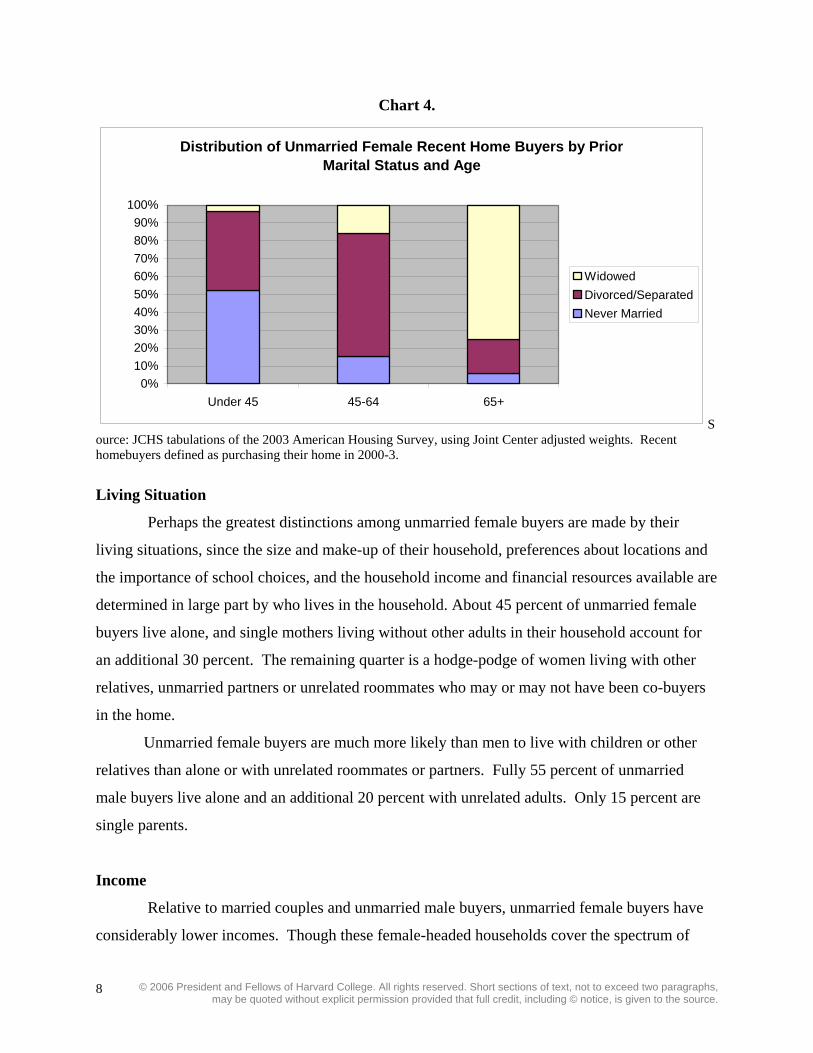
Chart 4.
Distribution of Unmarried Female Recent Home Buyers by Prior Marital Status and Age
0%10%20%30%40%50%60%70%80%90%
100%
Under 45 45-64 65+
WidowedDivorced/SeparatedNever Married
Source: JCHS tabulations of the 2003 American Housing Survey, using Joint Center adjusted weights. Recent homebuyers defined as purchasing their home in 2000-3.
Living Situation
Perhaps the greatest distinctions among unmarried female buyers are made by their
living situations, since the size and make-up of their household, preferences about locations and
the importance of school choices, and the household income and financial resources available are
determined in large part by who lives in the household. About 45 percent of unmarried female
buyers live alone, and single mothers living without other adults in their household account for
an additional 30 percent. The remaining quarter is a hodge-podge of women living with other
relatives, unmarried partners or unrelated roommates who may or may not have been co-buyers
in the home.
Unmarried female buyers are much more likely than men to live with children or other
relatives than alone or with unrelated roommates or partners. Fully 55 percent of unmarried
male buyers live alone and an additional 20 percent with unrelated adults. Only 15 percent are
single parents.
Income
Relative to married couples and unmarried male buyers, unmarried female buyers have
considerably lower incomes. Though these female-headed households cover the spectrum of
© 2006 President and Fellows of Harvard College. All rights reserved. Short sections of text, not to exceed two paragraphs, may be quoted without explicit permission provided that full credit, including © notice, is given to the source. 8
incomes, their $37,000 median income is fully $11,000 less than for unmarried men and almost
half as much as for married couples (who are more likely to have two or more earners in the
household). Indeed, over 62 percent of female buyers earn under 80 percent of their local area
median income (AMI), compared to 49 percent of men and only 26 percent of married couples.
Only 17 percent have incomes over 120 percent of AMI, relative to 28 percent of men and 51
percent of married couples. Hence, unless they benefited from equity appreciation in a previous
home, most face the housing market with less purchasing power than other types of buyers.
Nonetheless, a subset of unmarried women do have significant incomes and purchase
more expensive homes. Nearly 40 percent are middle aged and thus more established in their
careers and earnings than lower income buyers (fewer than 30 percent of whom are 45-64 years
old). More than half of all higher income female home buyers are divorced and thus may have
supplemental income from alimony or child support. Many live with other adults who add to
earnings, but also consequently require larger homes to house the additional people in their
households.
Still, lower incomes in general correlate with higher housing affordability burdens for
unmarried female buyers. More than 40 percent have moderate cost burdens (housing expenses
in excess of 30 percent of their income) and one in six has a severe cost burden (housing
expenses in excess of 50 percent of their income). Unmarried men and married couples each
have less than 31 percent of households with any cost burdens, and less than 11 percent with
severe burdens.
Characteristics of Home Purchases
As with their personal characteristics, the choice and process of home buying varies
between unmarried women and other buyers. Their different living situations, financial
resources, and preferences prescribe different housing needs.
Understanding the differences in the types of homes purchased and the process for doing
so among distinct groups of home buyers is important so that industry professionals can better
respond to the diverse segments of the market and maximize their sales potential. With an
average of about a million home buyers a year, unmarried women can represent a significant
market base for those developers and real estate agents that choose to target this segment. Yet
few publicly-available studies have been done on their specific needs and preferences, and
© 2006 President and Fellows of Harvard College. All rights reserved. Short sections of text, not to exceed two paragraphs, may be quoted without explicit permission provided that full credit, including © notice, is given to the source. 9
national survey data has not been extended to attempt to answer these questions. The following
descriptive statistics seek to provide a better understanding of the distinct submarket for
unmarried female home buyers using available survey data (see Table 2).
First-time Versus Repeat Buyers
Just over 1.5 million unmarried female home buyers between 2000 and 2003 were
purchasing their first home – accounting for 41 percent of all unmarried female buyers. This is
lower than the 48 percent of all unmarried male buyers that were first-time buyers, but more than
the 36 percent of married couples. The remaining buyers were mostly repeat home buyers (5
percent did not report their previous homeownership status), including those that owned as part
of a married couple before divorcing, are either “trading-up” from their previous home and using
their accumulated equity to purchase a larger or more desirable property, or “downsizing” to a
smaller and/or more manageable property, especially following a change in their marital or living
situation.
Types of Homes Purchased
The selection of homes purchased by recent buyers covers the spectrum of housing
options and varies not just in the type of buyer but also in their location, income, first-time buyer
status and living situation. Nonetheless, conclusions may be drawn as to what differences are a
function of the gender and marital status of the buyer. For instance, 15 percent of unmarried
female buyers purchased a condo, which is only slightly higher than the 12 percent of unmarried
men but three times more than the 5 percent of married couples purchasing condos. Unmarried
women likely prefer the convenience and security that comes with condominium living,
especially if they are the lone adult in the household. Disproportionately, younger buyers, those
without children and those with higher incomes overwhelmingly prefer condos; yet even within
these groups unmarried female buyers were more likely to be living in a condo than other recent
buyers.
As a consequence of the preference by unmarried women and men for condo living,
fewer of them purchase single family homes as compared to married couples. Only 83 percent
of unmarried female buyers chose a non-condo single family unit, compared with 94 percent of
married couples.
© 2006 President and Fellows of Harvard College. All rights reserved. Short sections of text, not to exceed two paragraphs, may be quoted without explicit permission provided that full credit, including © notice, is given to the source. 10
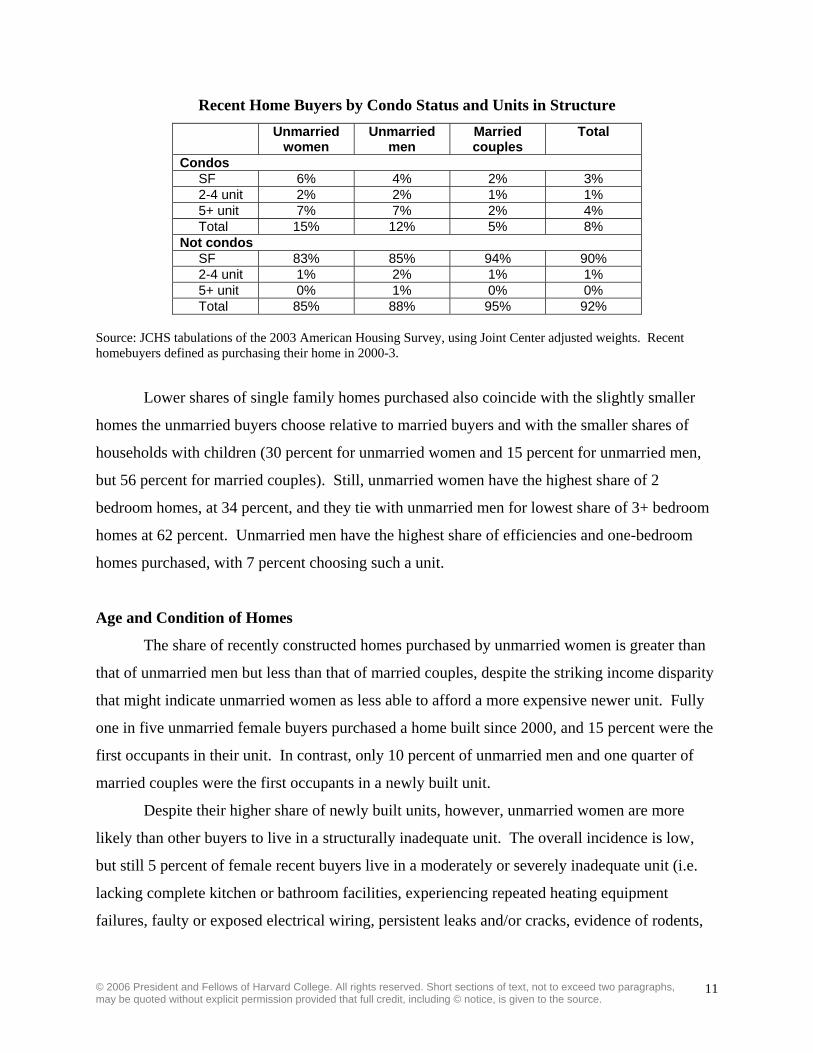
Recent Home Buyers by Condo Status and Units in Structure Unmarried
women Unmarried
men Married couples
Total
Condos SF 6% 4% 2% 3% 2-4 unit 2% 2% 1% 1% 5+ unit 7% 7% 2% 4% Total 15% 12% 5% 8%
Not condos SF 83% 85% 94% 90% 2-4 unit 1% 2% 1% 1% 5+ unit 0% 1% 0% 0% Total 85% 88% 95% 92%
Source: JCHS tabulations of the 2003 American Housing Survey, using Joint Center adjusted weights. Recent homebuyers defined as purchasing their home in 2000-3.
Lower shares of single family homes purchased also coincide with the slightly smaller
homes the unmarried buyers choose relative to married buyers and with the smaller shares of
households with children (30 percent for unmarried women and 15 percent for unmarried men,
but 56 percent for married couples). Still, unmarried women have the highest share of 2
bedroom homes, at 34 percent, and they tie with unmarried men for lowest share of 3+ bedroom
homes at 62 percent. Unmarried men have the highest share of efficiencies and one-bedroom
homes purchased, with 7 percent choosing such a unit.
Age and Condition of Homes
The share of recently constructed homes purchased by unmarried women is greater than
that of unmarried men but less than that of married couples, despite the striking income disparity
that might indicate unmarried women as less able to afford a more expensive newer unit. Fully
one in five unmarried female buyers purchased a home built since 2000, and 15 percent were the
first occupants in their unit. In contrast, only 10 percent of unmarried men and one quarter of
married couples were the first occupants in a newly built unit.
Despite their higher share of newly built units, however, unmarried women are more
likely than other buyers to live in a structurally inadequate unit. The overall incidence is low,
but still 5 percent of female recent buyers live in a moderately or severely inadequate unit (i.e.
lacking complete kitchen or bathroom facilities, experiencing repeated heating equipment
failures, faulty or exposed electrical wiring, persistent leaks and/or cracks, evidence of rodents,
© 2006 President and Fellows of Harvard College. All rights reserved. Short sections of text, not to exceed two paragraphs, may be quoted without explicit permission provided that full credit, including © notice, is given to the source. 11
broken fixtures/stairs/elevators, etc.), compared with 4 percent of unmarried male buyers and
under 3 percent of married couples.
Location
Relative to married couples, unmarried male and female home buyers are more likely to
purchase in central cities than in suburban areas – although over half of each segment still
purchases a suburban home. Unmarried women are the least likely segment to buy in non-
metropolitan areas. They also show a slightly higher propensity for living in the Northeast and
South relative to other buyers, and lower propensity for the West. However, unmarried women
buying in the Northeast and West are somewhat more likely to live in non-metro locations than
other buyers in those states. These trends in part reflect the geographic distribution of unmarried
woman-headed households generally, who have higher shares in cities than married couples
regardless of tenure or how recent their purchase. The distinctions between unmarried men and
women however are less precise across all households, with nearly identical shares of each by
metro type and region.
Price and Financing
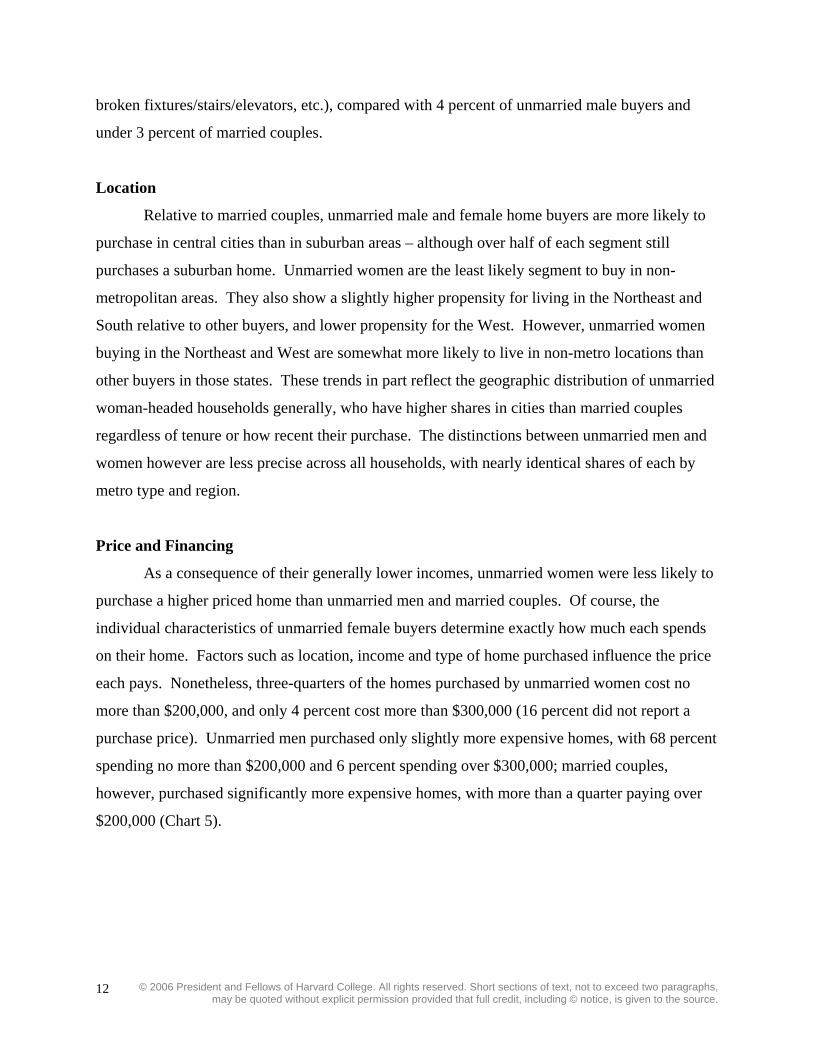
As a consequence of their generally lower incomes, unmarried women were less likely to
purchase a higher priced home than unmarried men and married couples. Of course, the
individual characteristics of unmarried female buyers determine exactly how much each spends
on their home. Factors such as location, income and type of home purchased influence the price
each pays. Nonetheless, three-quarters of the homes purchased by unmarried women cost no
more than $200,000, and only 4 percent cost more than $300,000 (16 percent did not report a
purchase price). Unmarried men purchased only slightly more expensive homes, with 68 percent
spending no more than $200,000 and 6 percent spending over $300,000; married couples,
however, purchased significantly more expensive homes, with more than a quarter paying over
$200,000 (Chart 5).
© 2006 President and Fellows of Harvard College. All rights reserved. Short sections of text, not to exceed two paragraphs, may be quoted without explicit permission provided that full credit, including © notice, is given to the source. 12
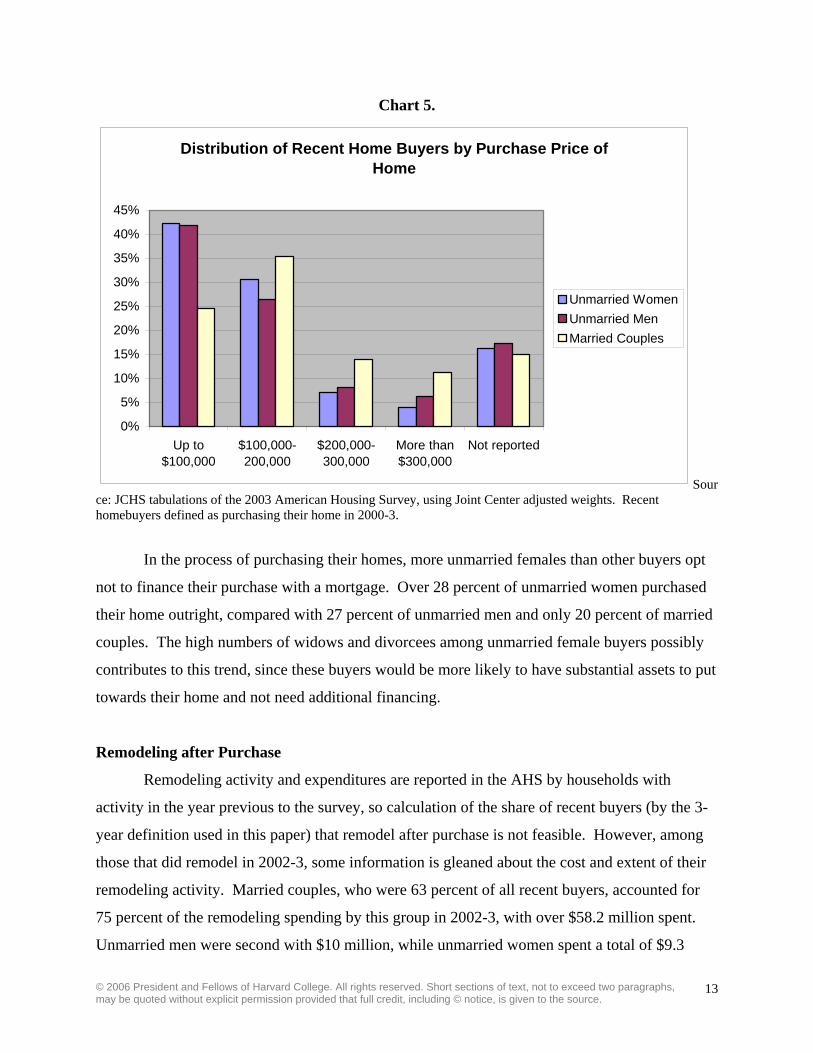
Chart 5.
Distribution of Recent Home Buyers by Purchase Price of Home
0%
5%
10%
15%
20%
25%
30%
35%
40%
45%
Up to$100,000
$100,000-200,000
$200,000-300,000
More than$300,000
Not reported
Unmarried WomenUnmarried MenMarried Couples
Source: JCHS tabulations of the 2003 American Housing Survey, using Joint Center adjusted weights. Recent homebuyers defined as purchasing their home in 2000-3.
In the process of purchasing their homes, more unmarried females than other buyers opt
not to finance their purchase with a mortgage. Over 28 percent of unmarried women purchased
their home outright, compared with 27 percent of unmarried men and only 20 percent of married
couples. The high numbers of widows and divorcees among unmarried female buyers possibly
contributes to this trend, since these buyers would be more likely to have substantial assets to put
towards their home and not need additional financing.
Remodeling after Purchase
Remodeling activity and expenditures are reported in the AHS by households with
activity in the year previous to the survey, so calculation of the share of recent buyers (by the 3-
year definition used in this paper) that remodel after purchase is not feasible. However, among
those that did remodel in 2002-3, some information is gleaned about the cost and extent of their
remodeling activity. Married couples, who were 63 percent of all recent buyers, accounted for
75 percent of the remodeling spending by this group in 2002-3, with over $58.2 million spent.
Unmarried men were second with $10 million, while unmarried women spent a total of $9.3
© 2006 President and Fellows of Harvard College. All rights reserved. Short sections of text, not to exceed two paragraphs, may be quoted without explicit permission provided that full credit, including © notice, is given to the source. 13
million, or an average of just under $5,000 per household with a remodeling project during this
period. Women who do remodel, consequently favor less expensive projects than other recent
home buyers making improvements, with 56 percent pf projects costing less than $25,000 and
only 11 percent costing more than $10,000, relative to 47 percent and 16 percent, respectively,
for married couples (Chart 6).
Chart 6.
Remodelling Expenditures 2002-3 by Recent Home Buyers
0%10%20%30%40%50%60%70%80%90%
100%
UnmarriedWomen
UnmarriedMen
MarriedCouples
$10,000+$5,000-9,999$2,500-4,9990-$2,499
Source: JCHS tabulations of the 2003 American Housing Survey, using Joint Center adjusted weights. Recent homebuyers defined as purchasing their home in 2000-3.
© 2006 President and Fellows of Harvard College. All rights reserved. Short sections of text, not to exceed two paragraphs, may be quoted without explicit permission provided that full credit, including © notice, is given to the source. 14
Search Process and Preferences
Some details about the process by which unmarried women go about finding and
purchasing their home are revealed using the National Association of Realtors® (NAR) 2004
Survey of Home Buyers and Sellers. The NAR survey asks whether a home buyer is part of a
married couple, an unmarried woman alone, an unmarried man alone, an unmarried couple, or
other. Due to incomplete variables and small sample sizes, the last two categories are not
delineated in the AHS data used primarily in this paper, even though they likely include some
female-headed households, either as part of a same- or opposite-sex couple or in a group of
unrelated individuals buying a home together. Thus, the results from the NAR survey are
tabulated somewhat differently than those from the AHS. Nonetheless, cross-tabs of these
categories with specific home buying activities do uncover additional details about the distinctive
market created by unmarried female home buyers.1
Among home buyers surveyed by NAR in 2004 that reported a reason for making their
purchase, half of unmarried women did so out of a desire to own a home of their own. An
additional 24 percent cited a need for more (15 percent) or less (9 percent) space, and 13 percent
bought to change their location (either to be closer to jobs/school/family or from a job
relocation). Unmarried men reported similar reasons, though married couples were much more
likely to want more space or another location.
Choice of location also reveals distinctions by type of buyer. Unmarried women are
more likely than other buyers to choose their location based on proximity to friends and family
(43 percent versus 33-37 percent for other groups), and less likely to do so because of proximity
to work or school (37 percent versus 40-45 percent). They are also more likely to compromise
on the size and cost of their home in order to get the attributes most important to them, and less
likely to compromise on location or neighborhood quality.
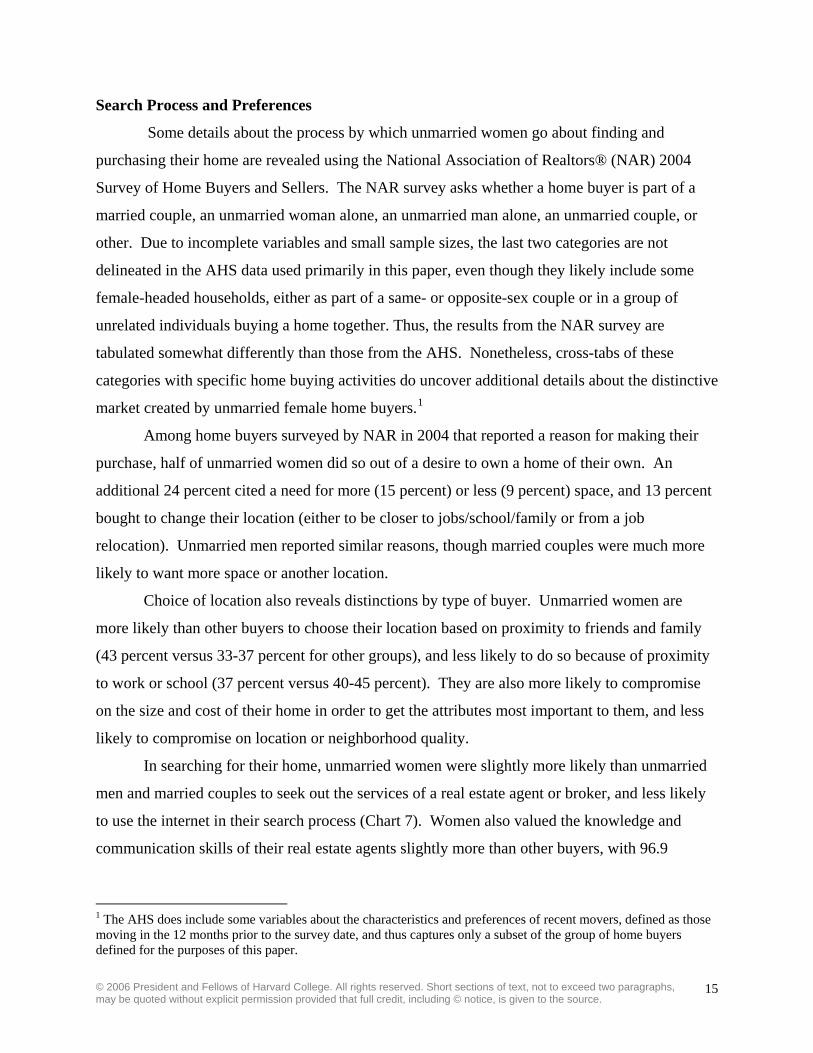
In searching for their home, unmarried women were slightly more likely than unmarried
men and married couples to seek out the services of a real estate agent or broker, and less likely
to use the internet in their search process (Chart 7). Women also valued the knowledge and
communication skills of their real estate agents slightly more than other buyers, with 96.9
1 The AHS does include some variables about the characteristics and preferences of recent movers, defined as those moving in the 12 months prior to the survey date, and thus captures only a subset of the group of home buyers defined for the purposes of this paper.
© 2006 President and Fellows of Harvard College. All rights reserved. Short sections of text, not to exceed two paragraphs, may be quoted without explicit permission provided that full credit, including © notice, is given to the source. 15
percent of single females rating it very important, versus only 91.7 percent of single males and
93.8 percent of married couples.
Chart 7.
Resources Used by Homebuyers in Purchase Process, 2004
68
70
72
74
76
78
80
Single Female Single Male Married Couple UnmarriedCouple
Other
NAR Categories of Home Buyers
Sha
re
Used Internet to Search for Homes Purchased Home Through Real Estate Agent/Broker
Source: Custom runs off data from the NAR Survey of Homebuyers and Sellers, 2004.
Subsets of Female Home Buyers
As remarkable as the characteristics of unmarried female home buyers and their
purchases are, they nonetheless mask significant distinctions within this group in both
demographics and buying behavior. The 3.7 million unmarried female householders who
purchased a home between 2000 and 2003 are far from a homogeneous group and represent
within them a wide range of factors that translate to substantially different approaches to home
buying.
Segmenting the population of unmarried female home buyers by specific characteristics –
including age, prior marital status, and living situation – helps to illuminate some of these
distinctions and illustrate how they correlate with different home buying behaviors (see Table 3).
Though they are far from complete in isolating all of the different types of female home buyers,
© 2006 President and Fellows of Harvard College. All rights reserved. Short sections of text, not to exceed two paragraphs, may be quoted without explicit permission provided that full credit, including © notice, is given to the source. 16
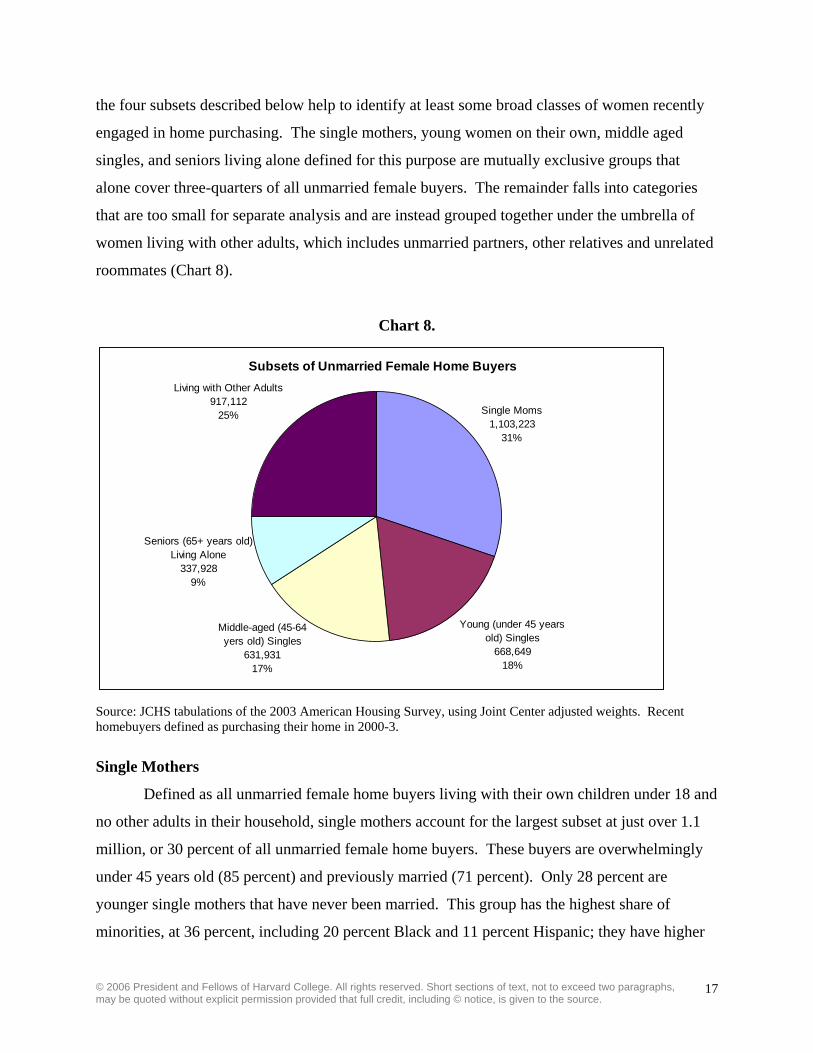
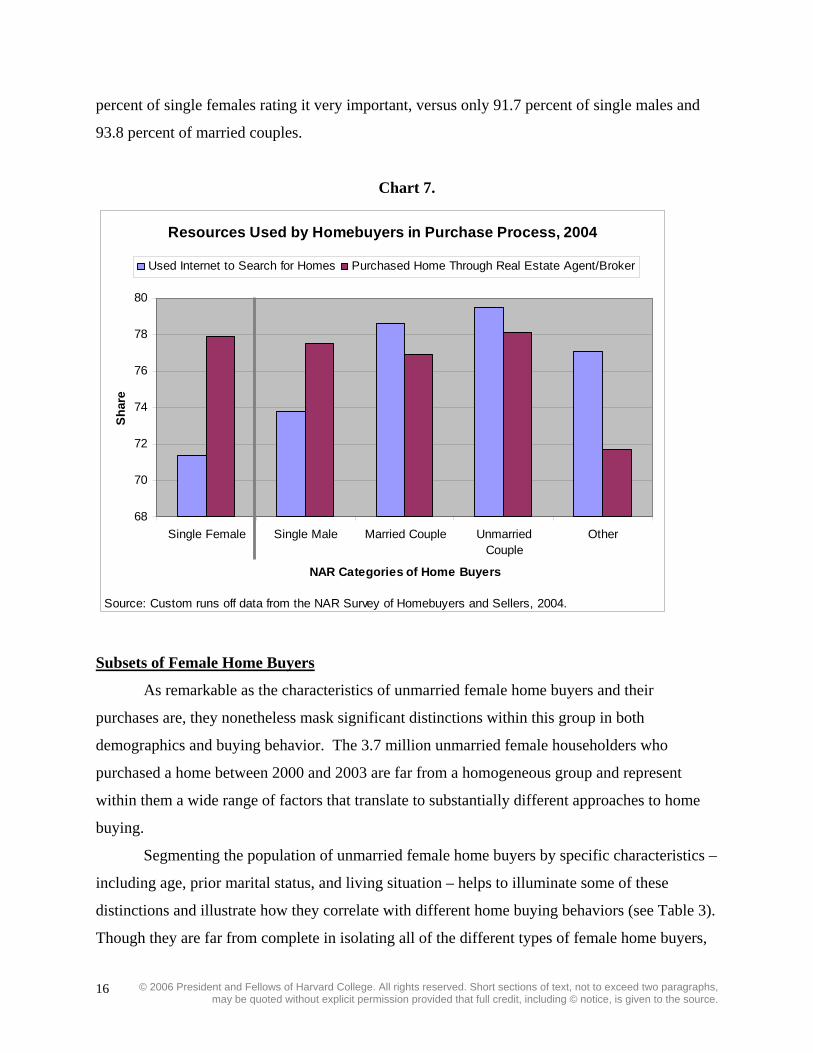
the four subsets described below help to identify at least some broad classes of women recently
engaged in home purchasing. The single mothers, young women on their own, middle aged
singles, and seniors living alone defined for this purpose are mutually exclusive groups that
alone cover three-quarters of all unmarried female buyers. The remainder falls into categories
that are too small for separate analysis and are instead grouped together under the umbrella of
women living with other adults, which includes unmarried partners, other relatives and unrelated
roommates (Chart 8).
Chart 8.
Subsets of Unmarried Female Home Buyers
Single Moms1,103,223
31%
Young (under 45 years old) Singles
668,64918%
Seniors (65+ years old) Living Alone
337,9289%
Living with Other Adults917,112
25%
Middle-aged (45-64 yers old) Singles
631,93117%
Source: JCHS tabulations of the 2003 American Housing Survey, using Joint Center adjusted weights. Recent homebuyers defined as purchasing their home in 2000-3.
Single Mothers
Defined as all unmarried female home buyers living with their own children under 18 and
no other adults in their household, single mothers account for the largest subset at just over 1.1
million, or 30 percent of all unmarried female home buyers. These buyers are overwhelmingly
under 45 years old (85 percent) and previously married (71 percent). Only 28 percent are
younger single mothers that have never been married. This group has the highest share of
minorities, at 36 percent, including 20 percent Black and 11 percent Hispanic; they have higher
© 2006 President and Fellows of Harvard College. All rights reserved. Short sections of text, not to exceed two paragraphs, may be quoted without explicit permission provided that full credit, including © notice, is given to the source. 17
incomes, however, than all but the women living with other adults, with a median of $36,800 and
15 percent earning at least 120 percent of their area median income. Never-married single
mothers have even higher incomes than divorced single mothers.
In making home buying decisions, these women have different priorities than buyers
without children, such as choosing a location near good schools or different financial
considerations. Due to the large number of divorced single mothers, some who are receiving
child support to supplement their purchasing power may also be constrained by the additional
costs of raising children. Indeed, over a quarter are younger never-married women have a lower
median income than other single mother home buyers.
These priorities are reflected in the types of homes purchased by single mothers. They
overwhelmingly prefer single family units with more bedrooms (relative to other female home
buyers), and have the lowest share living in condominiums (7 percent). A fifth live in units built
since 1990 and 13 percent in units built since 2000. Just over half are first-time home buyers.
The median purchase price for single mothers, at $84,500, was the lowest of all unmarried
female buyers, and only 9 percent of them spent over $200,000 on their home; single mothers,
nonetheless, were the most likely to finance their purchase and more than half of them put down
less than 5 percent of the purchase price.
Young Singles on Their Own
Defined as unmarried female home buyers under 45 living alone, there are 670,000 of
these buyers, or 18 percent of all unmarried female home buyers. Only 22 percent are
minorities, including 14 percent non-Hispanic black. Over 70 percent have never been married,
and the remainder are mostly divorced or separated (a statistically insignificant number are
widows). Many of these home buyers may choose to marry later on but in the meantime take the
opportunity to build wealth from their home’s equity.
This subset has the highest share of college-educated home buyers, with over half having
at least a college degree. Commensurately, this group also has somewhat higher incomes
(median $35,000) relative to other childless buyers, despite its younger average age. Indeed,
one-third earn over 80 percent of their area median income.
Young singles are more likely to buy condos in larger, central city developments than
other unmarried female buyers. Two-thirds are first-time home buyers, in part because their
© 2006 President and Fellows of Harvard College. All rights reserved. Short sections of text, not to exceed two paragraphs, may be quoted without explicit permission provided that full credit, including © notice, is given to the source. 18
younger age range provides less time for most to have been previous owners. This group also
prefers smaller, older units – more than 40 percent live in buildings built before 1970. But at the
same time, 15 percent live in units built after 2000, perhaps accounting for their higher median
purchase prices ($112,000) relative to other unmarried female buyers. Like single mothers, four
out of five take out a mortgage to finance their purchase, though more than half put at least 10
percent down when they do so.
Middle-aged Singles
Distinct from their younger counterparts, this group is defined as unmarried female home
buyers who are between 45 and 64 years old and living alone. At 630,000, they are nearly as
large a group as young singles, but are much more likely to have been previously married – 65
percent are divorced or separated, and an additional 18 percent are widows. Only 14 percent are
minorities, and only one-third has at least a college degree. Their median income is slightly
below that of single mothers and young singles, at $32,800, with just under a third earning at
least 80 percent of the area median income.
These women likely approach home buying with different resources and preferences than
young singles – many more are second-time buyers and are less likely to be transitional than
younger women. More than three-quarters of middle aged women living alone have purchased a
home before, either alone or in conjunction with a former spouse, which presumably provides
them with equity in which to invest in their current purchase. Indeed, these women had the
highest median house price ($116,000) of any group of unmarried female buyers, but a lower
share taking out a mortgage than among young singles and single mothers. Higher house prices
among this group also do not necessarily translate into a larger proportion of newly-built homes
bought, with only 12 percent of middle aged singles buying a house built after 2000, the lowest
share of any subset of unmarried female home buyers.
Unlike single mothers and young singles, middle-aged singles may be distinguished by
their prior marital status. These distinctions may not be great, but they are worth mentioning.
Firstly, the age distribution within middle-aged singles is different for previously and never
married women, with the widowed and divorced skewing much older than those that have not
previously been married. As a consequence, middle-aged singles that were previously married
are also more likely to have smaller incomes, less education and be less diverse than those that
© 2006 President and Fellows of Harvard College. All rights reserved. Short sections of text, not to exceed two paragraphs, may be quoted without explicit permission provided that full credit, including © notice, is given to the source. 19

have never been married. Though the never-married group has a higher share of buyers
purchasing more expensive homes – 34 percent spent over $200,000 versus only 21 percent for
divorced and widowed women – those previously married were more likely to buy a newly built
unit, perhaps another indication of their old age distribution as they begin the move towards
retirement and assisted housing.
Seniors Living Alone
Unmarried female home buyers age 65 and up are the smallest specified sub-group at less
than 10 percent of the total – unsurprising, given that seniors in general move less often than
other groups. More than three-quarters are widows, perhaps downsizing from homes they owned
with their late spouses or moving to retirement communities to be with other seniors. As with
other segments of the elderly population, this group has the lowest share of minorities and of
high school and college graduates relative to younger home buyers. Their median income, at
$17,000, is nearly half that of other female home buyers, since most are retired and living on
fixed incomes.
Both the demographic and economic circumstances of these senior women dictate their
distinct home buying behavior. This group is most likely to live in non-metro areas, in larger
multifamily structures, and in two-bedroom units when compared to other female buyers. More
than nine out of ten are previous home owners, allowing almost 70 percent to purchase their
recent home without mortgage financing. And of those that do finance, the majority put down at
least half their purchase price, so their mortgage costs remain relatively low. Given than 28
percent purchased units in structures built since 1990, and 20 percent purchased units built after
2000, it would appear that most are in fact buying in newer retirement communities.2
Women Living with Other Adults
At one-quarter of all unmarried female home buyers, this group is large but too
heterogeneous to characterize with common characteristics. A little more than half live with
other family members (grown children, aging parents, siblings, etc.) and the rest live with
unrelated adults (same or opposite gender partners, roommates or borders, etc.). Almost half are
2 Though the American Housing Survey asks whether households live in an age-restricted or naturally occurring retirement community, the response rate is too low among unmarried female buyers for adequate comparison across groups; however, of those senior women who did respond, about half reported living in such a community
© 2006 President and Fellows of Harvard College. All rights reserved. Short sections of text, not to exceed two paragraphs, may be quoted without explicit permission provided that full credit, including © notice, is given to the source. 20
under 45 years old, and about 10 percent are seniors. Half are divorced or separated, and 15
percent are widows. With multiple adults in the household, the median income for this group is
higher than for other unmarried female buyers, though personal earnings are more in line with
that of single earners.
Because their characteristics are so diverse, it is difficult to pinpoint specifics about their
home purchasing characteristics and preferences. A surprisingly high share (94 percent) lives in
single-family units, perhaps out of the need for larger units with more bedrooms to accommodate
their larger households. Less than half are first-time buyers, and only a quarter purchased their
homes without mortgage financing. Unfortunately, data limitations prevent knowing how many
of these buyers are co-owners of their homes, further complicating the analysis and comparison
with other unmarried female buyers.
Market Responses
With their strong and growing presence in the home buying market, unmarried women
are increasingly catching the attention of real estate professionals, developers and financers.
Still, only a few publicly-available sources of information on the gender and characteristics of
home buyers exist, and do not emphasize this relationship in any level of detail. The National
Association of Realtors® produces an annual survey of home buyers and sellers, which includes
gender and marital status, but only reports their share of the market not on the intersection of
gender and other home buying behaviors. Sears, Roebuck and Co. produced a fact sheet on
women and homeownership to coincide with the results of their own survey on female attitudes
towards home maintenance and upkeep, but emphasized existing home owners more than recent
buyers, despite the obvious interest of the latter to industry professionals. Chicago Title’s annual
survey of home buyers provided some metropolitan-specific detail on gender of home buyers,
but was unfortunately discontinued in 1999.
According to media reports, a handful of developers, lenders and real estate professionals
are targeting unmarried female home buyers, with success. One developer in Southern
California sees single women as a market that has been largely overlooked by developers of
family-oriented housing, and has sought to tap into that demand with developments that
incorporate more of the amenities single women prefer, including smaller units, gated access,
© 2006 President and Fellows of Harvard College. All rights reserved. Short sections of text, not to exceed two paragraphs, may be quoted without explicit permission provided that full credit, including © notice, is given to the source. 21
fitness facilities, social interactions with neighbors, and other organizational and convenience
features.3
Women home buyers, according to anecdotal evidence, are highly loyal to professionals
they feel helped them successfully navigate the home buying process, and more likely to
recommend those professionals to their friends.4 A group of female mortgage industry
executives is returning that favor, by promoting more homeownership opportunities for single
mothers.5 Through education and outreach to both lenders and potential buyers, the Women’s
Mortgage Industry Network (WMIN) is trying to close the gap on homeownership rates of single
mothers and fathers.
Even the federal government and GSE’s have entered into the mix. Freddie Mac
supported the WMIN as part of their efforts to increase the information about and ability of
single women to become home buyers. Fannie Mae created the Women-Headed Households
Initiative within their American Dream Commitment to increase homeownership for 18 million
Americans and encourage employer-assisted housing programs in industries that commonly
employ women. Additionally, the Federal Housing Administration pushed mortgage lenders to
begin allowing child care support payments to be included as income when qualifying for a
mortgage.
As the existing stock and traditional housing arrangements fail to meet the needs of the
changing composition of households, women are developing new approaches and even creating
new housing arrangements to meet their specific needs. One such option for female home buyers
is to purchase in a co-housing community. Co-housing communities, though relatively small in
number – about 50 in the US – are an attractive choice for women who want the privacy of their
own home with the benefit of a supportive, surrounding community. These communities
typically consist of 12 to 42 self-sufficient private dwelling units, but also include a common
kitchen/dining space where meals are shared as well as communal outdoor space. Other
arrangements help to pair single mothers looking for a shared living situation. By pooling
incomes single mothers can often afford to buy a more desirable home, and by living together
they can share household task and childcare which can free up valuable time. Living with
3 “When Buying a House, Who Needs a Man?”, Wall Street Journal, February 9, 1996, p. B10. 4 “A House of Her Own”, Mortgage Banking, June 2005, p. 61. 5 “Group to Target Single Moms for Homeownership Opportunities”, National Mortgage News, Vol. 28 Issue 7, p. 3. October 27, 2003.
© 2006 President and Fellows of Harvard College. All rights reserved. Short sections of text, not to exceed two paragraphs, may be quoted without explicit permission provided that full credit, including © notice, is given to the source. 22
someone can also provide critical emotional support and help make single parenting less
exhausting and lonely. Whether these alternative housing arrangements evolve and gain
prominence in the nation’s housing stock remains to be seen. Regardless, they are indicative of
the specific challenges some women face in finding housing suitable to their lifestyles, and
opportunities for developers and real estate professionals to target these groups.
Future Implications
The role of unmarried women in home buying is clearly strong and shows signs of
continued growth and expansion. The aging of the baby boom generation will lead to a dramatic
increase in the number of senior households, and with women living on average seven years
longer than men, an increase in widowed households will shift the age composition of female
households and create larger markets of widows seeking new housing. At the same time, the
younger women who have generated much of the recent growth in the single female homebuyers
demographic will continue to evolve in their housing careers, as changes in professional and
personal lives will lead to trade-up home buying, cohabitating and relocations.
There is still substantial work to be done, however, in furthering the capacity of
unmarried female householders to enter the home buying market. Unmarried female-headed
households represent 30 percent of all households, but only 23 percent of all home owners and
20 percent of recent home buyers – clearly there is room to grow within this market.
© 2006 President and Fellows of Harvard College. All rights reserved. Short sections of text, not to exceed two paragraphs, may be quoted without explicit permission provided that full credit, including © notice, is given to the source. 23
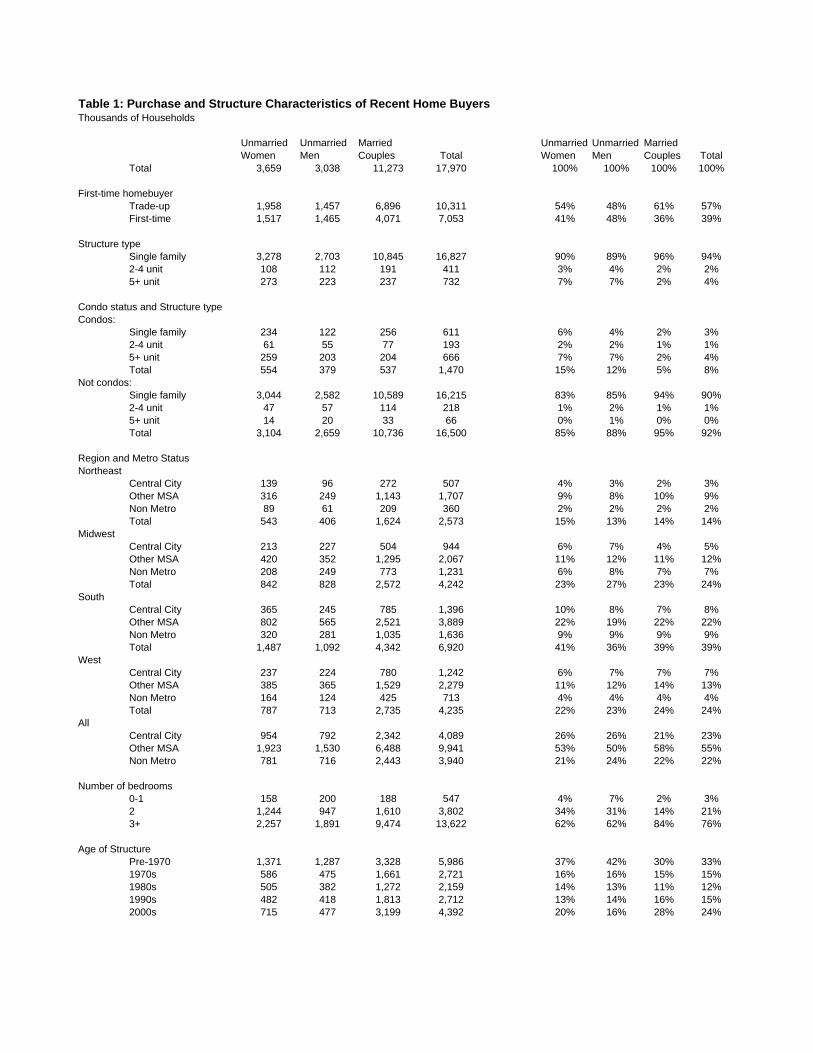
Table 1: Purchase and Structure Characteristics of Recent Home BuyersThousands of Households
Unmarried Women
Unmarried Men
Married Couples Total
Unmarried Women
Unmarried Men
Married Couples Total
Total 3,659 3,038 11,273 17,970 100% 100% 100% 100%
First-time homebuyerTrade-up 1,958 1,457 6,896 10,311 54% 48% 61% 57%First-time 1,517 1,465 4,071 7,053 41% 48% 36% 39%
Structure typeSingle family 3,278 2,703 10,845 16,827 90% 89% 96% 94%2-4 unit 108 112 191 411 3% 4% 2% 2%5+ unit 273 223 237 732 7% 7% 2% 4%
Condo status and Structure typeCondos:
Single family 234 122 256 611 6% 4% 2% 3%2-4 unit 61 55 77 193 2% 2% 1% 1%5+ unit 259 203 204 666 7% 7% 2% 4%Total 554 379 537 1,470 15% 12% 5% 8%
Not condos:Single family 3,044 2,582 10,589 16,215 83% 85% 94% 90%2-4 unit 47 57 114 218 1% 2% 1% 1%5+ unit 14 20 33 66 0% 1% 0% 0%Total 3,104 2,659 10,736 16,500 85% 88% 95% 92%
Region and Metro StatusNortheast
Central City 139 96 272 507 4% 3% 2% 3%Other MSA 316 249 1,143 1,707 9% 8% 10% 9%Non Metro 89 61 209 360 2% 2% 2% 2%Total 543 406 1,624 2,573 15% 13% 14% 14%
MidwestCentral City 213 227 504 944 6% 7% 4% 5%Other MSA 420 352 1,295 2,067 11% 12% 11% 12%Non Metro 208 249 773 1,231 6% 8% 7% 7%Total 842 828 2,572 4,242 23% 27% 23% 24%
SouthCentral City 365 245 785 1,396 10% 8% 7% 8%Other MSA 802 565 2,521 3,889 22% 19% 22% 22%Non Metro 320 281 1,035 1,636 9% 9% 9% 9%Total 1,487 1,092 4,342 6,920 41% 36% 39% 39%
WestCentral City 237 224 780 1,242 6% 7% 7% 7%Other MSA 385 365 1,529 2,279 11% 12% 14% 13%Non Metro 164 124 425 713 4% 4% 4% 4%Total 787 713 2,735 4,235 22% 23% 24% 24%
AllCentral City 954 792 2,342 4,089 26% 26% 21% 23%Other MSA 1,923 1,530 6,488 9,941 53% 50% 58% 55%Non Metro 781 716 2,443 3,940 21% 24% 22% 22%
Number of bedrooms0-1 158 200 188 547 4% 7% 2% 3%2 1,244 947 1,610 3,802 34% 31% 14% 21%3+ 2,257 1,891 9,474 13,622 62% 62% 84% 76%
Age of StructurePre-1970 1,371 1,287 3,328 5,986 37% 42% 30% 33%1970s 586 475 1,661 2,721 16% 16% 15% 15%1980s 505 382 1,272 2,159 14% 13% 11% 12%1990s 482 418 1,813 2,712 13% 14% 16% 15%2000s 715 477 3,199 4,392 20% 16% 28% 24%
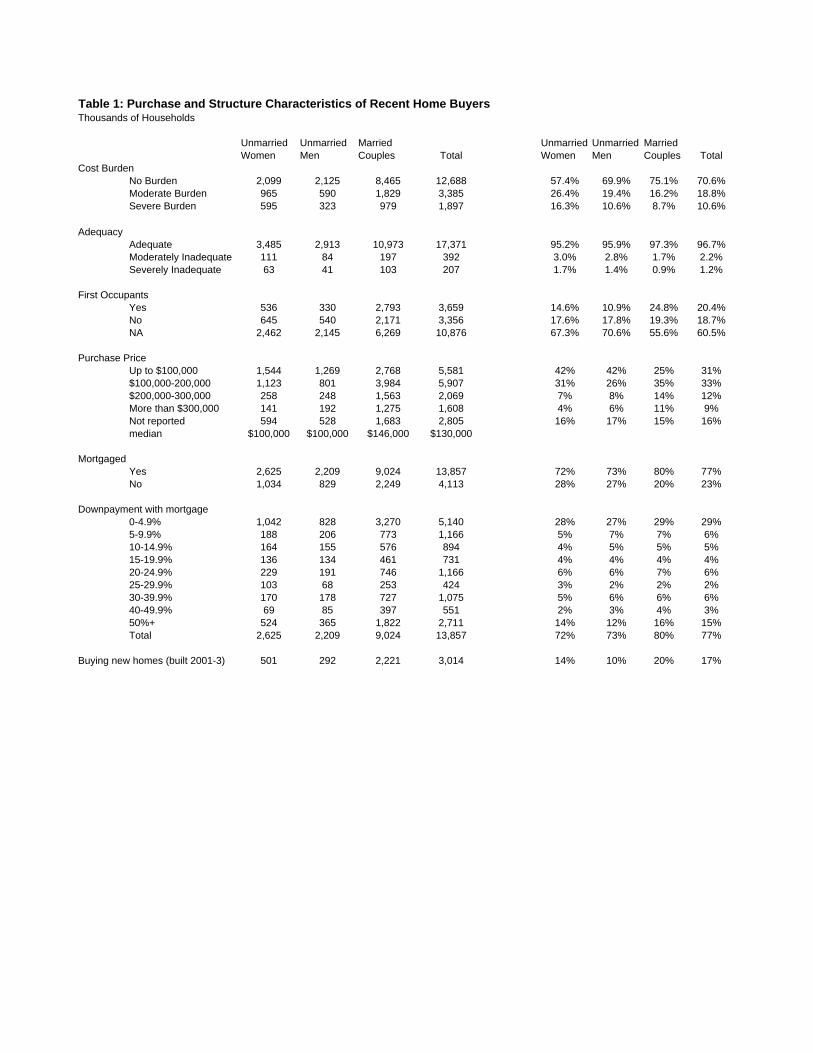
Table 1: Purchase and Structure Characteristics of Recent Home BuyersThousands of Households
Unmarried Women
Unmarried Men
Married Couples Total
Unmarried Women
Unmarried Men
Married Couples Total
Cost BurdenNo Burden 2,099 2,125 8,465 12,688 57.4% 69.9% 75.1% 70.6%Moderate Burden 965 590 1,829 3,385 26.4% 19.4% 16.2% 18.8%Severe Burden 595 323 979 1,897 16.3% 10.6% 8.7% 10.6%
AdequacyAdequate 3,485 2,913 10,973 17,371 95.2% 95.9% 97.3% 96.7%Moderately Inadequate 111 84 197 392 3.0% 2.8% 1.7% 2.2%Severely Inadequate 63 41 103 207 1.7% 1.4% 0.9% 1.2%
First OccupantsYes 536 330 2,793 3,659 14.6% 10.9% 24.8% 20.4%No 645 540 2,171 3,356 17.6% 17.8% 19.3% 18.7%NA 2,462 2,145 6,269 10,876 67.3% 70.6% 55.6% 60.5%
Purchase PriceUp to $100,000 1,544 1,269 2,768 5,581 42% 42% 25% 31%$100,000-200,000 1,123 801 3,984 5,907 31% 26% 35% 33%$200,000-300,000 258 248 1,563 2,069 7% 8% 14% 12%More than $300,000 141 192 1,275 1,608 4% 6% 11% 9%Not reported 594 528 1,683 2,805 16% 17% 15% 16%median $100,000 $100,000 $146,000 $130,000
MortgagedYes 2,625 2,209 9,024 13,857 72% 73% 80% 77%No 1,034 829 2,249 4,113 28% 27% 20% 23%
Downpayment with mortgage0-4.9% 1,042 828 3,270 5,140 28% 27% 29% 29%5-9.9% 188 206 773 1,166 5% 7% 7% 6%10-14.9% 164 155 576 894 4% 5% 5% 5%15-19.9% 136 134 461 731 4% 4% 4% 4%20-24.9% 229 191 746 1,166 6% 6% 7% 6%25-29.9% 103 68 253 424 3% 2% 2% 2%30-39.9% 170 178 727 1,075 5% 6% 6% 6%40-49.9% 69 85 397 551 2% 3% 4% 3%50%+ 524 365 1,822 2,711 14% 12% 16% 15%Total 2,625 2,209 9,024 13,857 72% 73% 80% 77%
Buying new homes (built 2001-3) 501 292 2,221 3,014 14% 10% 20% 17%
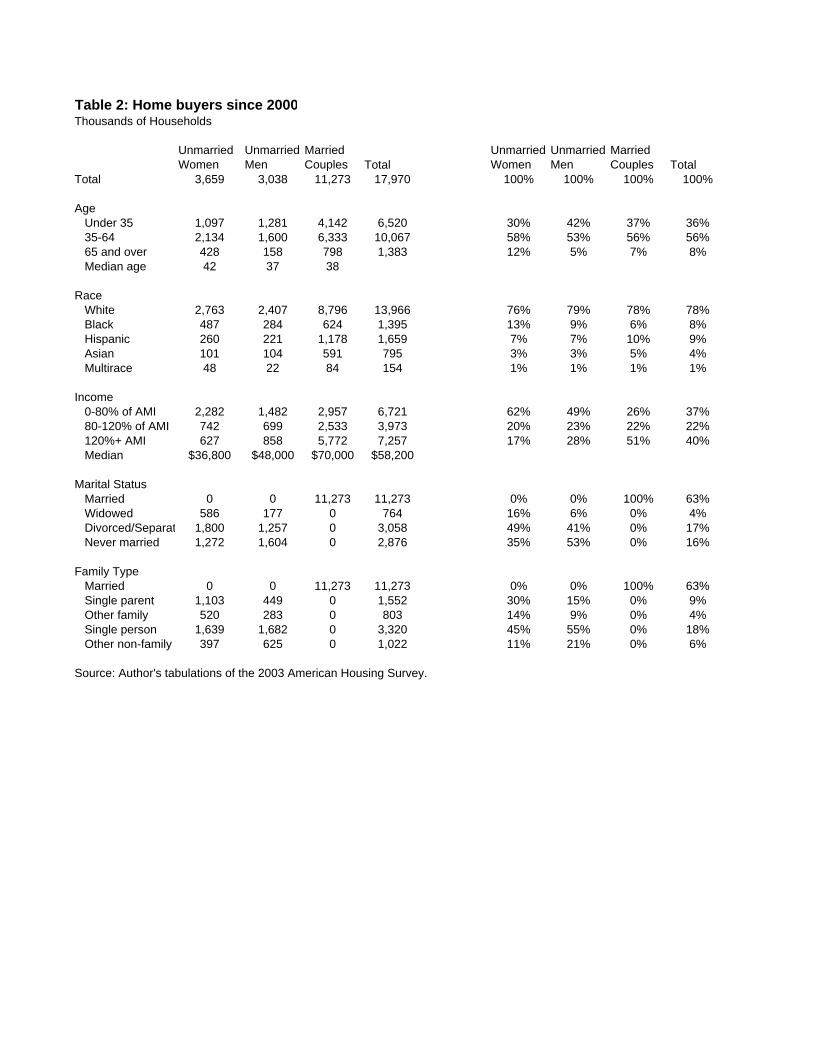
Table 2: Home buyers since 2000Thousands of Households
Unmarried Women
Unmarried Men
Married Couples Total
Unmarried Women
Unmarried Men
Married Couples Total
Total 3,659 3,038 11,273 17,970 100% 100% 100% 100%
AgeUnder 35 1,097 1,281 4,142 6,520 30% 42% 37% 36%35-64 2,134 1,600 6,333 10,067 58% 53% 56% 56%65 and over 428 158 798 1,383 12% 5% 7% 8%Median age 42 37 38
RaceWhite 2,763 2,407 8,796 13,966 76% 79% 78% 78%Black 487 284 624 1,395 13% 9% 6% 8%Hispanic 260 221 1,178 1,659 7% 7% 10% 9%Asian 101 104 591 795 3% 3% 5% 4%Multirace 48 22 84 154 1% 1% 1% 1%
Income0-80% of AMI 2,282 1,482 2,957 6,721 62% 49% 26% 37%80-120% of AMI 742 699 2,533 3,973 20% 23% 22% 22%120%+ AMI 627 858 5,772 7,257 17% 28% 51% 40%Median $36,800 $48,000 $70,000 $58,200
Marital StatusMarried 0 0 11,273 11,273 0% 0% 100% 63%Widowed 586 177 0 764 16% 6% 0% 4%Divorced/Separat 1,800 1,257 0 3,058 49% 41% 0% 17%Never married 1,272 1,604 0 2,876 35% 53% 0% 16%
Family TypeMarried 0 0 11,273 11,273 0% 0% 100% 63%Single parent 1,103 449 0 1,552 30% 15% 0% 9%Other family 520 283 0 803 14% 9% 0% 4%Single person 1,639 1,682 0 3,320 45% 55% 0% 18%Other non-family 397 625 0 1,022 11% 21% 0% 6%
Source: Author's tabulations of the 2003 American Housing Survey.
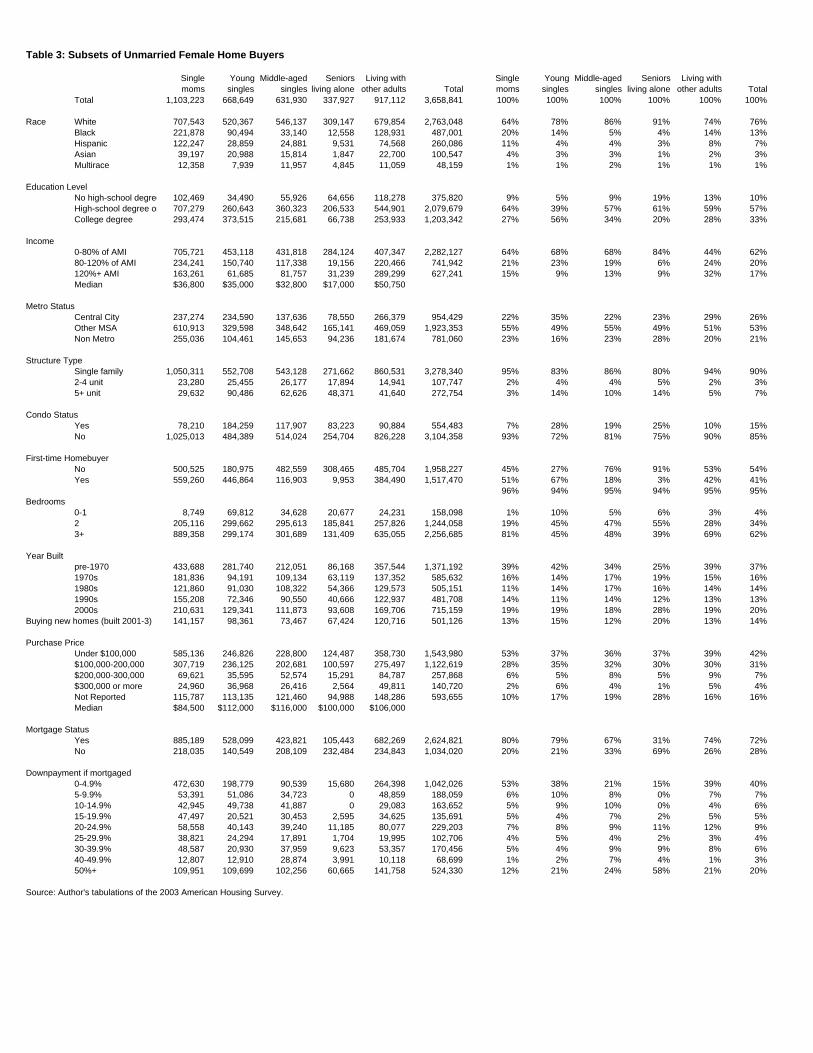
Table 3: Subsets of Unmarried Female Home Buyers
Single moms
Young singles
Middle-aged singles
Seniors living alone
Living with other adults Total
Single moms
Young singles
Middle-aged singles
Seniors living alone
Living with other adults Total
Total 1,103,223 668,649 631,930 337,927 917,112 3,658,841 100% 100% 100% 100% 100% 100%
Race White 707,543 520,367 546,137 309,147 679,854 2,763,048 64% 78% 86% 91% 74% 76%Black 221,878 90,494 33,140 12,558 128,931 487,001 20% 14% 5% 4% 14% 13%Hispanic 122,247 28,859 24,881 9,531 74,568 260,086 11% 4% 4% 3% 8% 7%Asian 39,197 20,988 15,814 1,847 22,700 100,547 4% 3% 3% 1% 2% 3%Multirace 12,358 7,939 11,957 4,845 11,059 48,159 1% 1% 2% 1% 1% 1%
Education LevelNo high-school degree 102,469 34,490 55,926 64,656 118,278 375,820 9% 5% 9% 19% 13% 10%High-school degree on 707,279 260,643 360,323 206,533 544,901 2,079,679 64% 39% 57% 61% 59% 57%College degree 293,474 373,515 215,681 66,738 253,933 1,203,342 27% 56% 34% 20% 28% 33%
Income0-80% of AMI 705,721 453,118 431,818 284,124 407,347 2,282,127 64% 68% 68% 84% 44% 62%80-120% of AMI 234,241 150,740 117,338 19,156 220,466 741,942 21% 23% 19% 6% 24% 20%120%+ AMI 163,261 61,685 81,757 31,239 289,299 627,241 15% 9% 13% 9% 32% 17%Median $36,800 $35,000 $32,800 $17,000 $50,750
Metro StatusCentral City 237,274 234,590 137,636 78,550 266,379 954,429 22% 35% 22% 23% 29% 26%Other MSA 610,913 329,598 348,642 165,141 469,059 1,923,353 55% 49% 55% 49% 51% 53%Non Metro 255,036 104,461 145,653 94,236 181,674 781,060 23% 16% 23% 28% 20% 21%
Structure TypeSingle family 1,050,311 552,708 543,128 271,662 860,531 3,278,340 95% 83% 86% 80% 94% 90%2-4 unit 23,280 25,455 26,177 17,894 14,941 107,747 2% 4% 4% 5% 2% 3%5+ unit 29,632 90,486 62,626 48,371 41,640 272,754 3% 14% 10% 14% 5% 7%
Condo StatusYes 78,210 184,259 117,907 83,223 90,884 554,483 7% 28% 19% 25% 10% 15%No 1,025,013 484,389 514,024 254,704 826,228 3,104,358 93% 72% 81% 75% 90% 85%
First-time HomebuyerNo 500,525 180,975 482,559 308,465 485,704 1,958,227 45% 27% 76% 91% 53% 54%Yes 559,260 446,864 116,903 9,953 384,490 1,517,470 51% 67% 18% 3% 42% 41%
96% 94% 95% 94% 95% 95%Bedrooms
0-1 8,749 69,812 34,628 20,677 24,231 158,098 1% 10% 5% 6% 3% 4%2 205,116 299,662 295,613 185,841 257,826 1,244,058 19% 45% 47% 55% 28% 34%3+ 889,358 299,174 301,689 131,409 635,055 2,256,685 81% 45% 48% 39% 69% 62%
Year Builtpre-1970 433,688 281,740 212,051 86,168 357,544 1,371,192 39% 42% 34% 25% 39% 37%1970s 181,836 94,191 109,134 63,119 137,352 585,632 16% 14% 17% 19% 15% 16%1980s 121,860 91,030 108,322 54,366 129,573 505,151 11% 14% 17% 16% 14% 14%1990s 155,208 72,346 90,550 40,666 122,937 481,708 14% 11% 14% 12% 13% 13%2000s 210,631 129,341 111,873 93,608 169,706 715,159 19% 19% 18% 28% 19% 20%
Buying new homes (built 2001-3) 141,157 98,361 73,467 67,424 120,716 501,126 13% 15% 12% 20% 13% 14%
Purchase PriceUnder $100,000 585,136 246,826 228,800 124,487 358,730 1,543,980 53% 37% 36% 37% 39% 42%$100,000-200,000 307,719 236,125 202,681 100,597 275,497 1,122,619 28% 35% 32% 30% 30% 31%$200,000-300,000 69,621 35,595 52,574 15,291 84,787 257,868 6% 5% 8% 5% 9% 7%$300,000 or more 24,960 36,968 26,416 2,564 49,811 140,720 2% 6% 4% 1% 5% 4%Not Reported 115,787 113,135 121,460 94,988 148,286 593,655 10% 17% 19% 28% 16% 16%Median $84,500 $112,000 $116,000 $100,000 $106,000
Mortgage StatusYes 885,189 528,099 423,821 105,443 682,269 2,624,821 80% 79% 67% 31% 74% 72%No 218,035 140,549 208,109 232,484 234,843 1,034,020 20% 21% 33% 69% 26% 28%
Downpayment if mortgaged0-4.9% 472,630 198,779 90,539 15,680 264,398 1,042,026 53% 38% 21% 15% 39% 40%5-9.9% 53,391 51,086 34,723 0 48,859 188,059 6% 10% 8% 0% 7% 7%10-14.9% 42,945 49,738 41,887 0 29,083 163,652 5% 9% 10% 0% 4% 6%15-19.9% 47,497 20,521 30,453 2,595 34,625 135,691 5% 4% 7% 2% 5% 5%20-24.9% 58,558 40,143 39,240 11,185 80,077 229,203 7% 8% 9% 11% 12% 9%25-29.9% 38,821 24,294 17,891 1,704 19,995 102,706 4% 5% 4% 2% 3% 4%30-39.9% 48,587 20,930 37,959 9,623 53,357 170,456 5% 4% 9% 9% 8% 6%40-49.9% 12,807 12,910 28,874 3,991 10,118 68,699 1% 2% 7% 4% 1% 3%50%+ 109,951 109,699 102,256 60,665 141,758 524,330 12% 21% 24% 58% 21% 20%
Source: Author's tabulations of the 2003 American Housing Survey.