Embed Size (px)
Citation preview

393393
�
�
6th International Conference on Industrial Engineering and Industrial Management. XVI Congreso de Ingeniería de Organización. Vigo, July 18-20, 2012
Analysis of the Operating Efficiency of Mobile Operators During the 2002 to 2008 Period
Roux Martínez Felix1, Ruiz Lopez Felipe, Eguren Santos �Abstract: This article aims to quantify the efficiency of mobile operators in Spain and other European countries such as France and Germany. The period considered is from 2002 to 2008.
Linear regression is used to analyze the relationship between growth in revenue and gross operating margin (EBITDA) generated by the relevant operators and the aggregate industry in each country.
At the industry level, it is shown that (i) there is a strong correlation between revenue and margin; and (ii) this correlation weakens when competitive intensity grows. At the operator level, those which achieved larger increases in revenues did not sacrifice their margins, but offset the additional investments and costs required to achieve said growth through economies of scale. Keywords: Mobile telecommunications, oligopoly, economies of scale, linear regression, operational efficiency.
1. Introduction
First, the Spanish mobile telephone market, including its structure, competitive dynamics and evolution, is presented. Then the efficiency of operators present in Spain and comparable European markets is analyzed. This comparison includes the analysis of the effect of the number of operators in the different countries, since it can alter competitive dynamics (Gagnepain and Pereira 2006).
We analyze how the changes in revenues are translated into operating gross margins and EBITDA. The latter is used because it eliminates the influence of factors not derived from operations, such as financial structure or tax environment. The statistical method used is linear regression, with revenues as the explanatory variable and EBITDA as the dependent variable. To analyze the quality of the results, percentage of the variance explained is used (Daniel Peña, 1987).
�������������������������������������������������������������1 Félix Roux Martínez (�) Escuela Técnica Superior de Ingenieros Industriales, Universidad Politécnica de Madrid C/ José Gutiérrez Abascal, n.º 2 28006, Madrid Spain e-mail: [email protected]
394
�
The 2002 to 2008 period corresponded to years of stability in the industry because (i) digital mobile technology had already reached maturity (GSM/UMTS), and GSM technology, had consolidated (de la Peña, 2001), (ii) in Europe, the increase in both mobile telephone users and use of services was relatively stable, resulting in a steady growth of revenue, (iii) the number of operators in European markets did not change significantly, and (iv) It was a period of relative economic stability, with moderate inflation rates, 2.1% - 3.3% in Europe (Eurostat, 2009).
It is worth to mention that the only operators considered in the case are those
which owned frequencies, and therefore were able to develop their own networks.
2. The Spanish Mobile Telephone Market
2.1. Structure and Market Size
The mobile telephone market behaves as a pure oligopoly, consisting of a few firms that produce the same type of product (Kotler y Keller, 2009), with an imperfect pattern of competition since only a few companies are able to offer the specific product (Samuelson, Nordhaus, 1986).
There is a reduced number of players due to structural and regulatory elements in the industry, including the fact that the radio electric spectrum is a scarce resource, whose allocation is regulated (by 32/2003 Law). There are only four operators managing frequencies: Telefónica, Vodafone, Orange and Yoigo2.
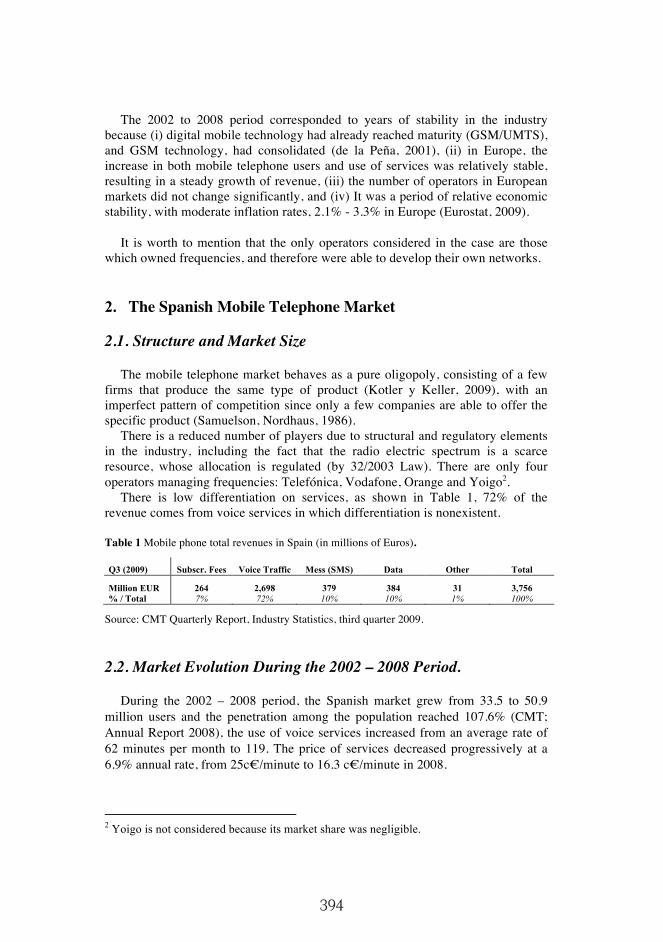
There is low differentiation on services, as shown in Table 1, 72% of the revenue comes from voice services in which differentiation is nonexistent.
Table 1 Mobile phone total revenues in Spain (in millions of Euros).
Q3 (2009) Subscr. Fees Voice Traffic Mess (SMS) Data Other Total
Million EUR 264 2,698 379 384 31 3,756 % / Total 7% 72% 10% 10% 1% 100%
Source: CMT Quarterly Report, Industry Statistics, third quarter 2009.
2.2. Market Evolution During the 2002 – 2008 Period.
During the 2002 – 2008 period, the Spanish market grew from 33.5 to 50.9 million users and the penetration among the population reached 107.6% (CMT; Annual Report 2008), the use of voice services increased from an average rate of 62 minutes per month to 119. The price of services decreased progressively at a 6.9% annual rate, from 25c�/minute to 16.3 c�/minute in 2008.
�������������������������������������������������������������2 Yoigo is not considered because its market share was negligible.

395
�
The market has matured and also migration from fixed to mobile networks happened, mobile networks as they mature substitute fixed networks (Ingo Vogelsang, 2010). In this sense, Gruber and Verboven (2001) show that there is a negative relationship between the number of fixed lines and mobile penetration.
3. Analysis of the Spanish Case
3.1. Evolution of Operating Gross Margin in the Spanish Market
From 2002 to 2008 the revenues of the three mobile operators have
progressively increased (Fig. 1).
�
Fig. 1: Evolution of revenues of Spanish mobile operators, 2001 – 2008 period (in million �) Source: Global Wireless Matrix 4Q09, Bank of America Merrill Lynch, December 13th 2009.
The evolution of the operators’ EBITDA margin (Fig. 2) shows that Vodafone’s was stable at 40%, and both Telefonica’s and Orange’s suffered margin erosion.
Fig. 2: Spanish operators’ EBITDA, as a percentage of revenues, 2002 – 2008. Source: Global Wireless Matrix 4Q09, Bank of America Merrill Lynch, December 13th 2009.
In Fig.2, three clearly differentiated ranges can be seen, Telefónica is in the 50% ~ 60% ranges; Vodafone, as the second operator, maintains a stable middle range around 40%; and Orange is in the lower 34%~24% range. These shows:
1. The existence of economies of scale, since the higher volume operators generate higher margins which are sustainable over time. In addition, different EBITDA ranges are observed as a function of operator size.
6,093 6,683 7,121 7,650 8,141 8,509 8,458
3,055 3,451 4,140 5,102 5,755
6,383 6,266
1,938 2,430 2,918 3,271 3,214 3,291 3,273 0,000
5,000
10,000
2002 2003 2004 2005 2006 2007 2008
Telefonica
Vodafone
Orange
57% 59% 58% 54% 51% 50% 50% 38% 40% 38% 40%
38% 41% 40%
7% 32% 34% 30% 29% 25% 24% 0%
50%
100%
2002 2003 2004 2005 2006 2007 2008
Telefonica
Vodafone
Orange
396
�
2. The existence of differences in operating efficiencies, since different operators undergo diverse margin evolutions as the market grows and matures.
3.2. Relationship between Revenue and EBITDA Margin: Quantifying Efficiency through Linear Regression
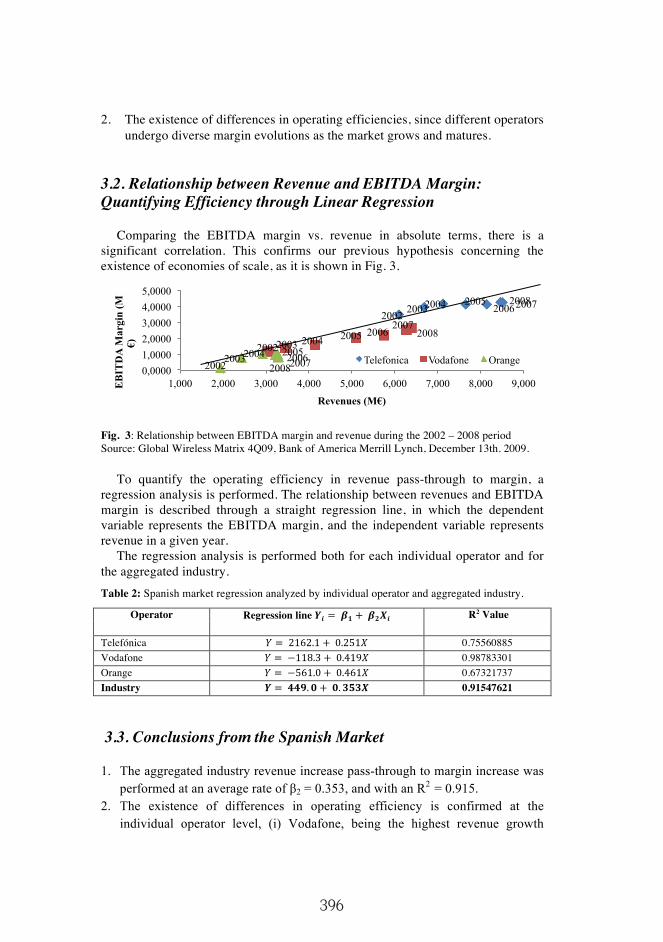
Comparing the EBITDA margin vs. revenue in absolute terms, there is a significant correlation. This confirms our previous hypothesis concerning the existence of economies of scale, as it is shown in Fig. 3.
�
Fig. 3: Relationship between EBITDA margin and revenue during the 2002 – 2008 period Source: Global Wireless Matrix 4Q09, Bank of America Merrill Lynch, December 13th. 2009.
To quantify the operating efficiency in revenue pass-through to margin, a regression analysis is performed. The relationship between revenues and EBITDA margin is described through a straight regression line, in which the dependent variable represents the EBITDA margin, and the independent variable represents revenue in a given year.
The regression analysis is performed both for each individual operator and for the aggregated industry. Table 2: Spanish market regression analyzed by individual operator and aggregated industry.
Operator Regression line �� � ��� � ����� R2 Value
Telefónica � � ������� � ������� 0.75560885 Vodafone � � ������� � ������� 0.98783301 Orange � � ������� � ������� 0.67321737 Industry � � ������ � ������� 0.91547621
3.3. Conclusions from the Spanish Market
1. The aggregated industry revenue increase pass-through to margin increase was performed at an average rate of �2 = 0.353, and with an R2 = 0.915.
2. The existence of differences in operating efficiency is confirmed at the individual operator level, (i) Vodafone, being the highest revenue growth
2002 2003 2004 2005 2006 2007 2008
2002 2003 2004 2005 2006 2007
2008
2002 2003 2004 2005 2006 2007 2008 0,0000 1,0000 2,0000 3,0000 4,0000 5,0000
1,000 2,000 3,000 4,000 5,000 6,000 7,000 8,000 9,000 EB
ITD
A M
argi
n (M
�)
Revenues (M�)
Telefonica Vodafone Orange

397
�
operator, presents the highest correlation level between revenue and EBITDA, with R2 = 0.9878. Its revenue pass-through to margin has a �2 = 0.419, and (ii) Telefónica, with a lower R2 = 0.7556, has a revenue pass-through to margin at �2 = 0.251, therefore, its EBITDA margin erodes from 57% to 50%.
This shows that the cost of gaining clients is compensated by higher volumes..
4. The European Environment
The structural elements of the European industry such as regulation, number of operators, and low differentiation, do not change. Therefore similar results should be expected. To confirm this, the two markets most resembling Spain are analyzed.
4.1. France
In France there are three operators: Orange (France Telecom), SFR (Vodafone) and Bouygues. The revenues of all three have grown progressively. Orange and SFR jointly lead the market, whereas Bouygues is smaller (Fig. 4).
Fig. 4: Revenues of French mobile phone operators 2002 – 2008 (in millions �). Source: Global Wireless Matrix 4Q09, Bank of America Merrill Lynch, December13th. 2009.
The two larger operators have higher EBITDA margins (Fig. 5), stabilizing during the last years. However, the margin of the third, smaller operator lies around ten percentage points below its larger competitors, at approximately 30%.
�
Fig. 5: Evolution of French operators’ EBITDA Margin, 2002 – 2008 (in %). Source: Global Wireless Matrix 4Q09, Bank of America Merrill Lynch, December13th. 2009.
6,989 8,107 8,785 9,130 9,238 9,320 9,714
6,076 7,430 7,676 8,242 8,254 8,382 8,576
2,703 2,995 3,326 4,144 4,198 4,464 4,696
2002 2003 2004 2005 2006 2007 2008
Orange SFR (Vodafone) Bouygues
41%
43% 45% 43% 41% 41% 40%
40%
36%
41% 39% 42% 41% 41% 32% 33% 35%
32% 29% 30% 31%
20%
30%
40%
50%
2002 2003 2004 2005 2006 2007 2008
Orange
SFR (Vodafone)
Bouygues

398
�
The above-indicated analysis confirms: (i) the existence of economies of scale, as operators with higher revenues generate higher stable margins over time (in addition, different EBITDA margins, in line with operator size, can be observed); and (ii) the existence of operating efficiency differences, since margin evolves differently as the market grows and matures. The relationship between revenue and EBITDA margin is presented in Fig. 6.
�
Fig. 6: Relationship between EBITDA margin and total revenues in France, 2002 – 2008. Source: Global Wireless Matrix 4Q09, Bank of America Merrill Lynch, December 13th 2009.
Table 3: Regression analysis for individual French operators and total French industry
Operator Regression line R2 Value Orange (FT) � � ������ � ������� 0.86575885 SFR (Vodafone) � � ������� � ������� 0.84963423 Bouyges � � ������ � ������� 0.92595216 Industry � � ����� � ������� 0.94772637
Conclusions in the French case are (i), the aggregate industry revenue pass-through to margin has a rate of �2 = 0.379, with a high R2 = 0.9477, and (ii) all three operators present high R2 values, over 0.849. Vodafone has the highest, �2 = 0.453, and thus higher efficiency.
4.2. Germany
There are four operators in Germany: T-Mobile (Deutsche Telecom), D2 (Vodafone), E Plus (KPN) and O2 (Telefónica), (Fig. 7).
�
0,000
5,000
1,000 2,000 3,000 4,000 5,000 6,000 7,000 8,000 9,000 10,000 11,000
EB
ITD
A
Mar
gin
(M�)
Revenues (M�)
Orange SFR (Vodafone) Bouygues
6,899 7,353 7,656 7,758 7,435 7,156 7,045
6,739 7,328 7,622 7,787 7,575 7,147 6,980
2,063 2,245 2,290 2,460 2,698 2,816 3,005
1,368 1,818 2,333 2,831 3,073 2,902 2,869
2002 2003 2004 2005 2006 2007 2008 T-Mobile D2 (Vodafone) E Plus O 2
399
�
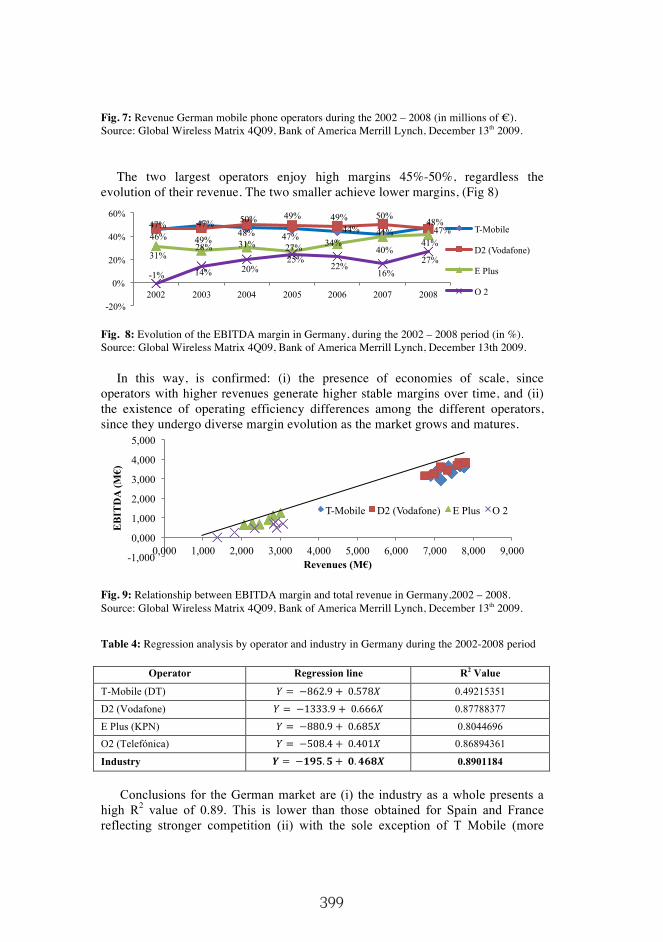
Fig. 7: Revenue German mobile phone operators during the 2002 – 2008 (in millions of �). Source: Global Wireless Matrix 4Q09, Bank of America Merrill Lynch, December 13th 2009.
The two largest operators enjoy high margins 45%-50%, regardless the evolution of their revenue. The two smaller achieve lower margins, (Fig 8)
�
Fig. 8: Evolution of the EBITDA margin in Germany, during the 2002 – 2008 period (in %). Source: Global Wireless Matrix 4Q09, Bank of America Merrill Lynch, December 13th 2009.
In this way, is confirmed: (i) the presence of economies of scale, since operators with higher revenues generate higher stable margins over time, and (ii) the existence of operating efficiency differences among the different operators, since they undergo diverse margin evolution as the market grows and matures.
�
Fig. 9: Relationship between EBITDA margin and total revenue in Germany,2002 – 2008. Source: Global Wireless Matrix 4Q09, Bank of America Merrill Lynch, December 13th 2009. Table 4: Regression analysis by operator and industry in Germany during the 2002-2008 period
Operator Regression line R2 Value
T-Mobile (DT) � � ������� � ������� 0.49215351
D2 (Vodafone) � � �������� � ������� 0.87788377
E Plus (KPN) � � ������� � ������� 0.8044696 O2 (Telefónica) � � ������� � ������� 0.86894361
Industry � � ������� � ������� 0.8901184
Conclusions for the German market are (i) the industry as a whole presents a
high R2 value of 0.89. This is lower than those obtained for Spain and France reflecting stronger competition (ii) with the sole exception of T Mobile (more
46% 49% 48% 47%
44% 41% 48% 47% 47% 50% 49% 49% 50%
47%
31% 28% 31% 27% 34%
40% 41%
-1% 14% 20% 25%
22% 16%
27%
-20%
0%
20%
40%
60%
2002 2003 2004 2005 2006 2007 2008
T-Mobile
D2 (Vodafone)
E Plus
O 2
-1,000
0,000
1,000
2,000
3,000
4,000
5,000
0,000 1,000 2,000 3,000 4,000 5,000 6,000 7,000 8,000 9,000
EB
ITD
A (M�)
Revenues (M�)
T-Mobile D2 (Vodafone) E Plus O 2

400
�
affected by competition) operators present high correlations, with R2 over 0.86, and (iii) there are differences in operating efficiency, and E Plus, with the fastest growth in revenue also achieved the highest growth in efficiency during the period.
5. Conclusions of the Study
1. There is a strong correlation between revenue and margin in the industry, this shows the existence of significant economies of scale, and this correlation diminishes when the number of competitors increases (Germany).
2. Those operators which have reached higher revenue increases, also have maintained or increased their EBITDA margin, not being penalized by investing in growth. On the contrary, the economies of scale outweighed the required investment and growth-derived costs .
3. Through the methodology used, the more efficient operators, those able to revenue pass-through to margin, can be easily identified.
6. References
“The World in 2010”, The Economist, January 2010, p.110. Kotler P, Keller KL (2006), Dirección de Marketing, 12ª Edición, Pearson Educación S.A.,
Madrid, cap. 11. Samuelson PA, Nordhaus WD (1986) Economía,12ª Edición, MacGraw Hill, Mexico, cap. 23. Peña Sanchez de Rivera D (1987) , Estadística Modelos y Métodos. 2 Modelos lineales y series
temporales, Alianza Universidad Textos, Madrid, cap.12. Gagnepain P, Pereira P (2007) Entry, costs reduction, and competition in the Portuguese mobile
telephony industry, International Journal of Industrial Organization. 25. pp. 461–481 Gruber H, Verboven F (2001). The diffusion of mobile telecommunications services in the
European Union. European Economic Review 45, p. 577–588. Vogelsang I, (2010) , The relationship between mobile and fixed-line communications: A
survey. Information Economics and Policy 22, p.4-17. De la Peña Aznar J, Moreno Rebollo A (2001). Presente y futuro de las telecomunicaciones
móviles. Economía Industrial 337, I. European Economic Statistics (2009), Edition, Eurostat Statistical Books, European Commission,
http://epp.eurostat.ec.europa.eu/cache/ITY_OFFPUB/KS-31-09-001/EN/KS-31-09-001-EN.PDF
Global Wireless Matrix 4Q, (2009). Bank of America & Merrill Lynch, 13 diciembre 2009. Informe Anual 2008, Comisión del Mercado de las Telecomunicaciones (CMT), 2009.
http://www.cmt.es/cmt_ptl_ext/SelectOption.do?nav=publi_anuales&detalles=09002719800868c6&pagina=1
Informe Trimestral 2008 Tercer trimestre, Comisión del Mercado de las Telecomunicaciones (CMT), 2009. http://www.cmt.es/es/publicaciones/anexos/Trimestral_III_09.pdf
Mostly Mobile (2009) Ofcom’s mobile sector assessment second consultation, 8 julio.http://www.ofcom.org.uk/consult/condocs/msa/msa.pdf
Ley 32/2003, de 3 de noviembre, General de Telecomunicaciones. Orden ITC/332/2010 de 12 de febrero por la que se aprueba el cuadro nacional de atribución de frecuencias (CNAF). http://www.mityc.es/telecomunicaciones/Espectro/CNAF/OrdenApruebaCNAF.pdf