Embed Size (px)
Citation preview
ALS Environmental Europe
John Quick – Principal Scientist February 2013
Analysis of Non-Polar Organic
Compounds in Water by
GC-MSMS
• STL was purchased by ALS from Severn Trent Water on 8th
February 2013.
• STL is now ALS Environmental Ltd.
• Wakefield laboratory – Potable & Wastewater samples
• Coventry laboratory – Wastewater & Contaminated Land
samples
• Bridgend laboratory – remained with Severn Trent Water
Background
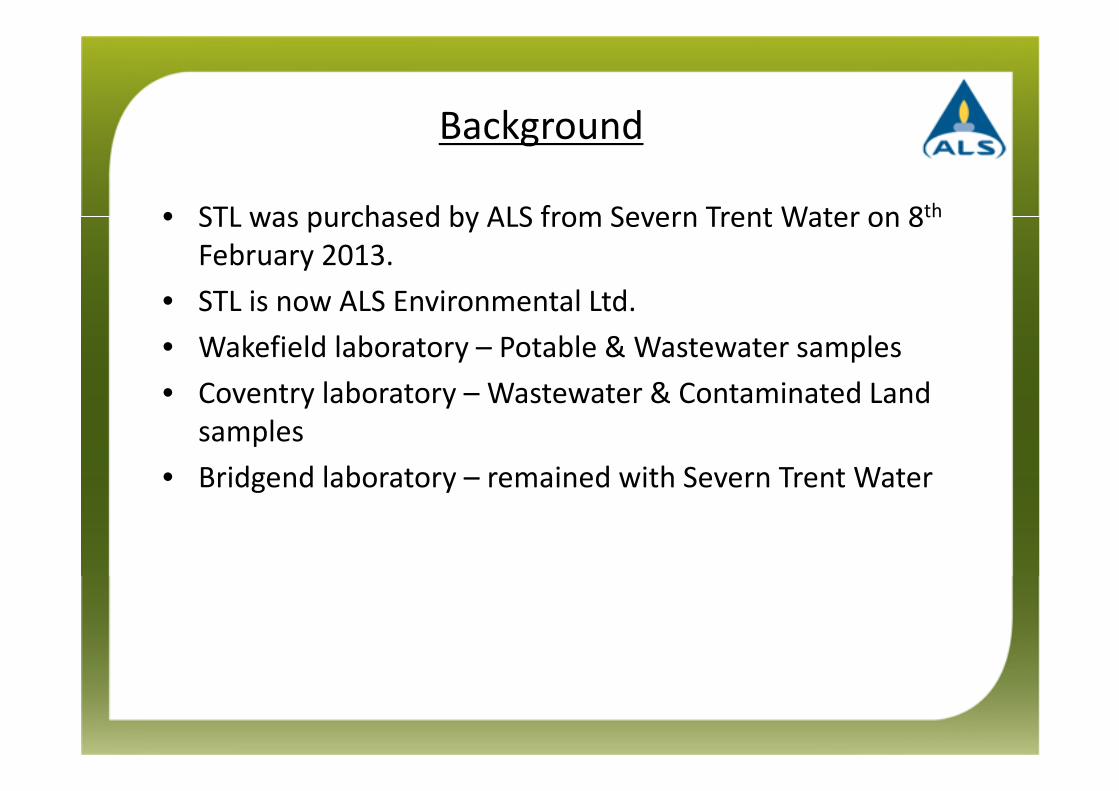
ALS Limited – Today
• Market Capitalization GBP2.3 billion
• Fourth largest public listed TIC company in the world
• ASX 100 participant (Sept 2011)
• Annual Revenues GBP +1 billion
• 14,000 Staff
• Operations in 56 countries on 6 continents
• Conservative Funding – 29% gearing
• Commitment to training - promotion
1863 1952 2012
ALS Company History
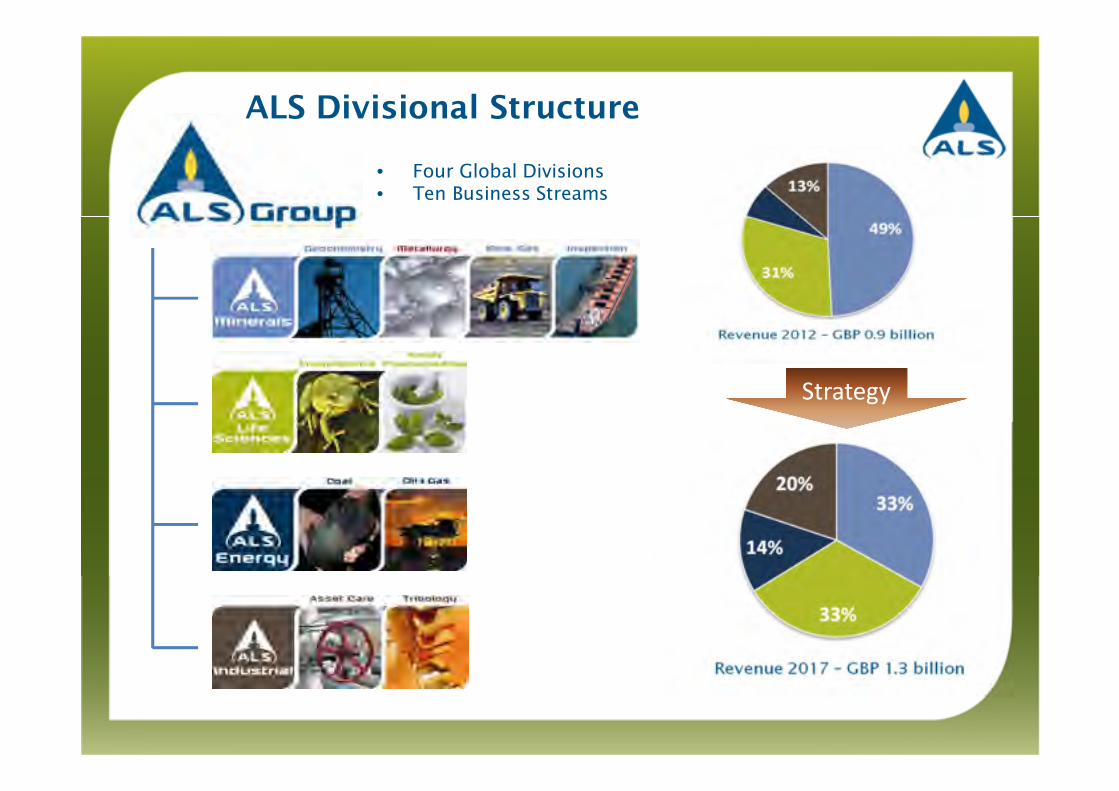
StrategyStrategy
• Four Global Divisions• Ten Business Streams
ALS Divisional Structure
• Recent work to transfer a number methods for, principally, non-polar
organic analytes from GC and GC-MS to GC-MSMS across sample matrix
types.
• Drivers
– Efficiency improvements
• Shorter chromatographic runs
• Simpler data processing
• Scope for simplifying sample preparation procedures
– Enhanced service to clients
• Ability to meet challenging LODs even in difficult matrices
• Unambiguous identification of target analytes.
• Examples
– Pesticides in Potable waters
– Pesticides/PBDEs and PAHs in dirty environmental waters
– NDMA – not non-polar!!
– Potential simple screening method using MEPS
Introduction
• Pesticides
– PCV of 0.1ug/l for individual pesticides.
– Required LODs <0.025ug/l (<0.01ug/l preferred).
– Precision target – 12.5%
– Need for efficient robust methodologies
– Analysis of the more polar pesticides usually
undertaken by LC-QQQ systems.
– Non-polar pesticide analysis is now being transferred
from single quadrupole instruments to GC-QQQ
Potable Water Analysis
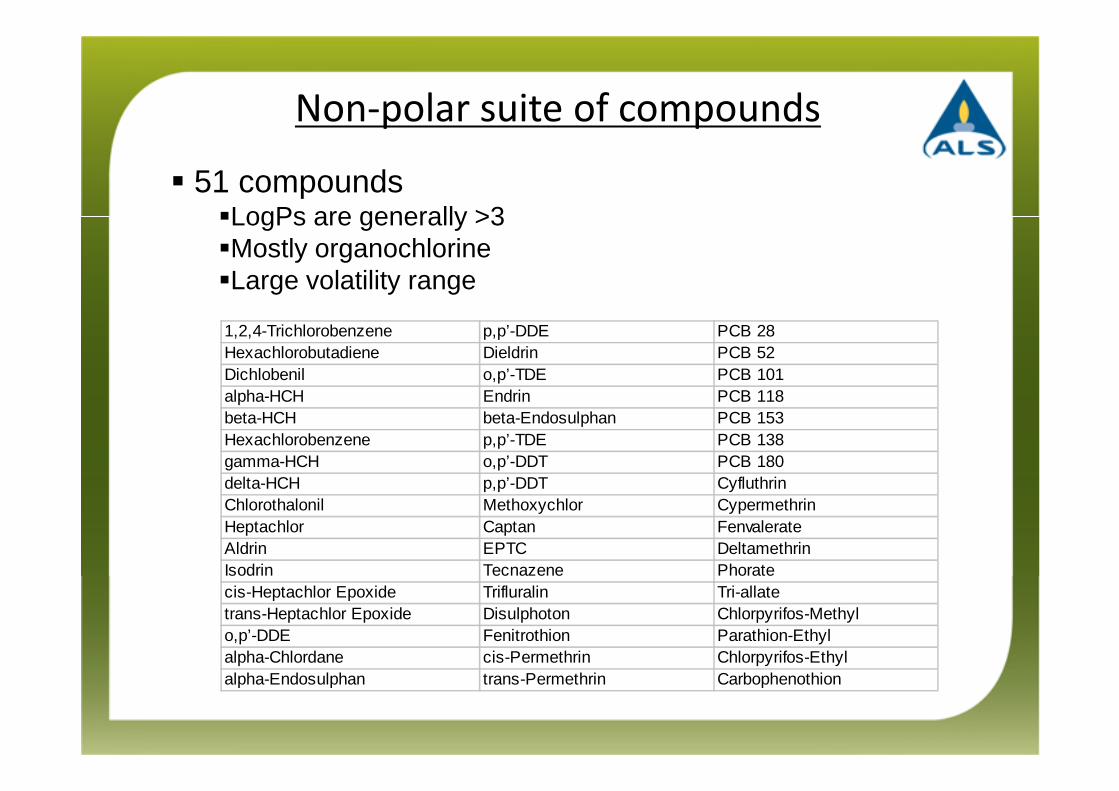
Non-polar suite of compounds
� 51 compounds�LogPs are generally >3�Mostly organochlorine�Large volatility range
1,2,4-Trichlorobenzene p,p’-DDE PCB 28Hexachlorobutadiene Dieldrin PCB 52Dichlobenil o,p’-TDE PCB 101alpha-HCH Endrin PCB 118beta-HCH beta-Endosulphan PCB 153Hexachlorobenzene p,p’-TDE PCB 138gamma-HCH o,p’-DDT PCB 180delta-HCH p,p’-DDT CyfluthrinChlorothalonil Methoxychlor CypermethrinHeptachlor Captan FenvalerateAldrin EPTC DeltamethrinIsodrin Tecnazene Phoratecis-Heptachlor Epoxide Trifluralin Tri-allatetrans-Heptachlor Epoxide Disulphoton Chlorpyrifos-Methylo,p’-DDE Fenitrothion Parathion-Ethylalpha-Chlordane cis-Permethrin Chlorpyrifos-Ethylalpha-Endosulphan trans-Permethrin Carbophenothion
Non-Polars - Previous Method
� Simple Extraction�500ml of sample shaken with 5ml hexane�Transfer portion of extract directly to autosampler vial – no blow down
�Instrumental Analysis�GC-MS/ECD – Microfluidic splitter device used�20ul on-column injection�30 minutes cycle time
�Quantitation�Most analytes from MS but some – mainly the Pyrethroids –from the ECD signal�Significant resource devoted to reprocessing
Non-Polars – GC-QQQ Method
� Extraction�Only modified slightly – 10ml of Hexane:Ethyl Acetate (1:1) used as the extraction solvent.
�Instrumental Analysis�25ul injected onto GC-QQQ system�Multi-mode inlet - Solvent vent mode utilised�2 MRM transitions per analyte�Calibration range – 10 to 120ng/L�DB1 or column for good separation of DDT isomers�Fast run time – 12 minutes�Cycle time - <15 minutes with cryo cooling, ~19mins without.
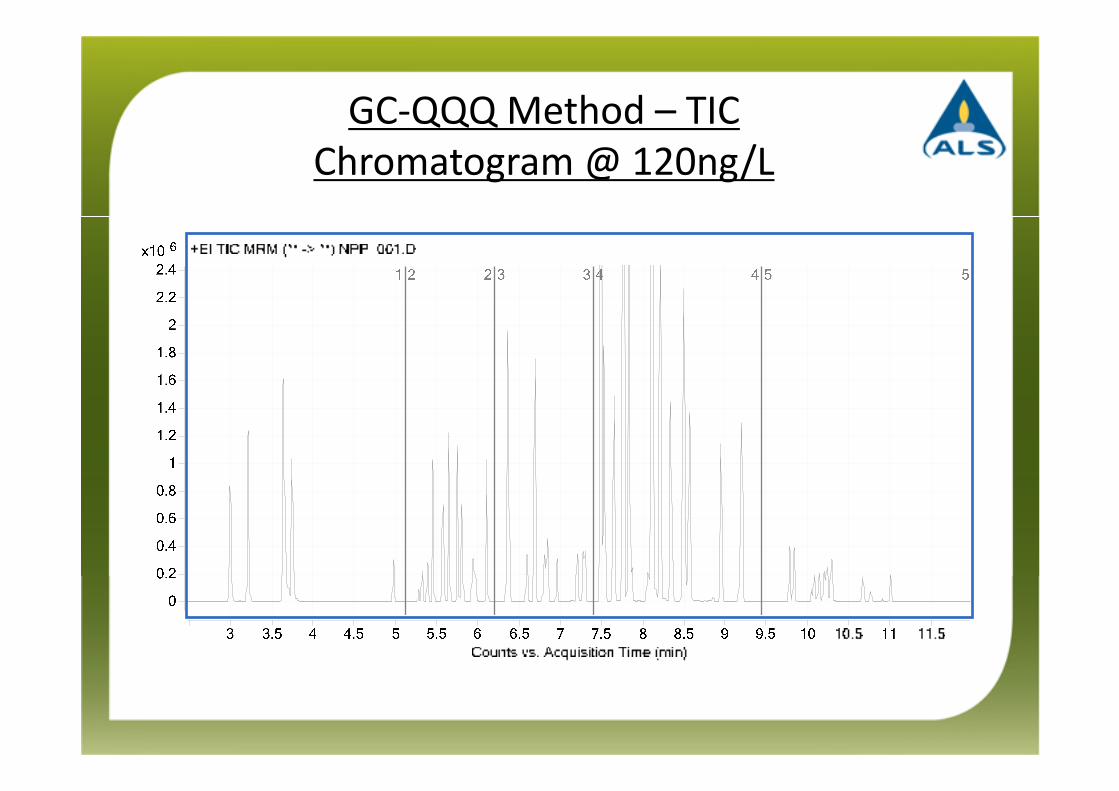
GC-QQQ Method – TIC
Chromatogram @ 120ng/L
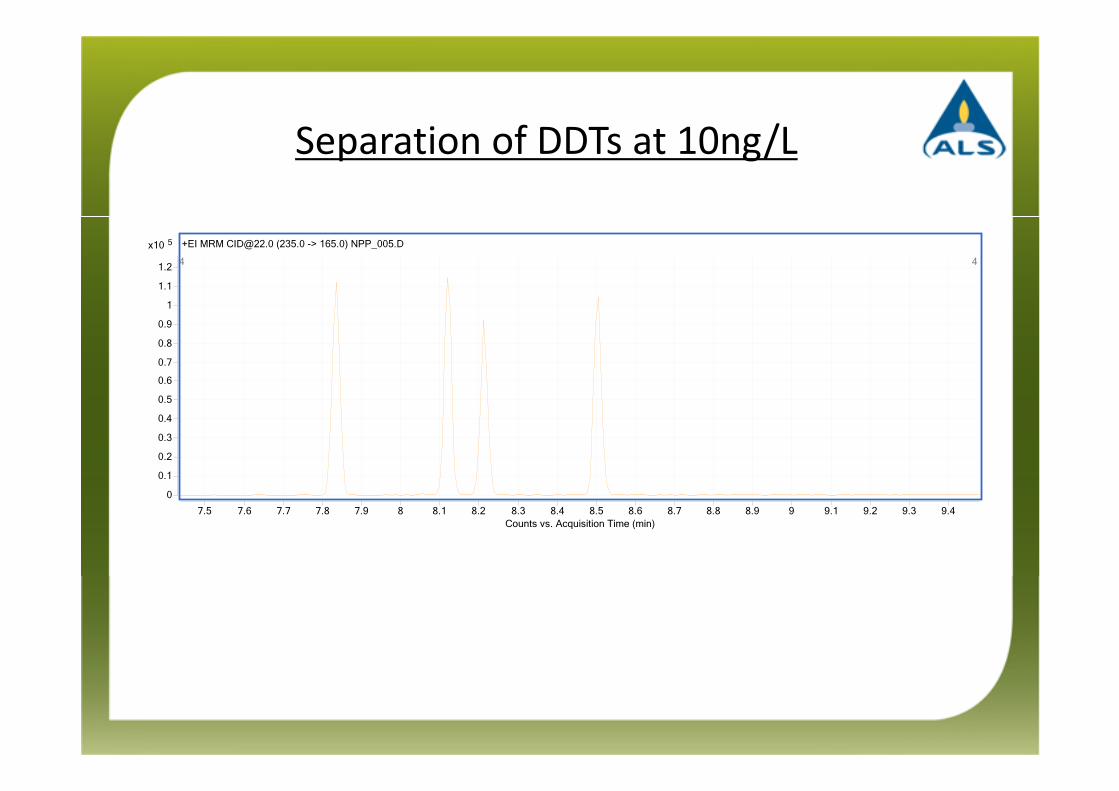
Separation of DDTs at 10ng/L
5x10
0
0.1
0.2
0.3
0.4
0.5
0.6
0.7
0.8
0.9
1
1.1
1.2
+EI MRM [email protected] (235.0 -> 165.0) NPP_005.D
4 4
Counts vs. Acquisition Time (min)
7.5 7.6 7.7 7.8 7.9 8 8.1 8.2 8.3 8.4 8.5 8.6 8.7 8.8 8.9 9 9.1 9.2 9.3 9.4
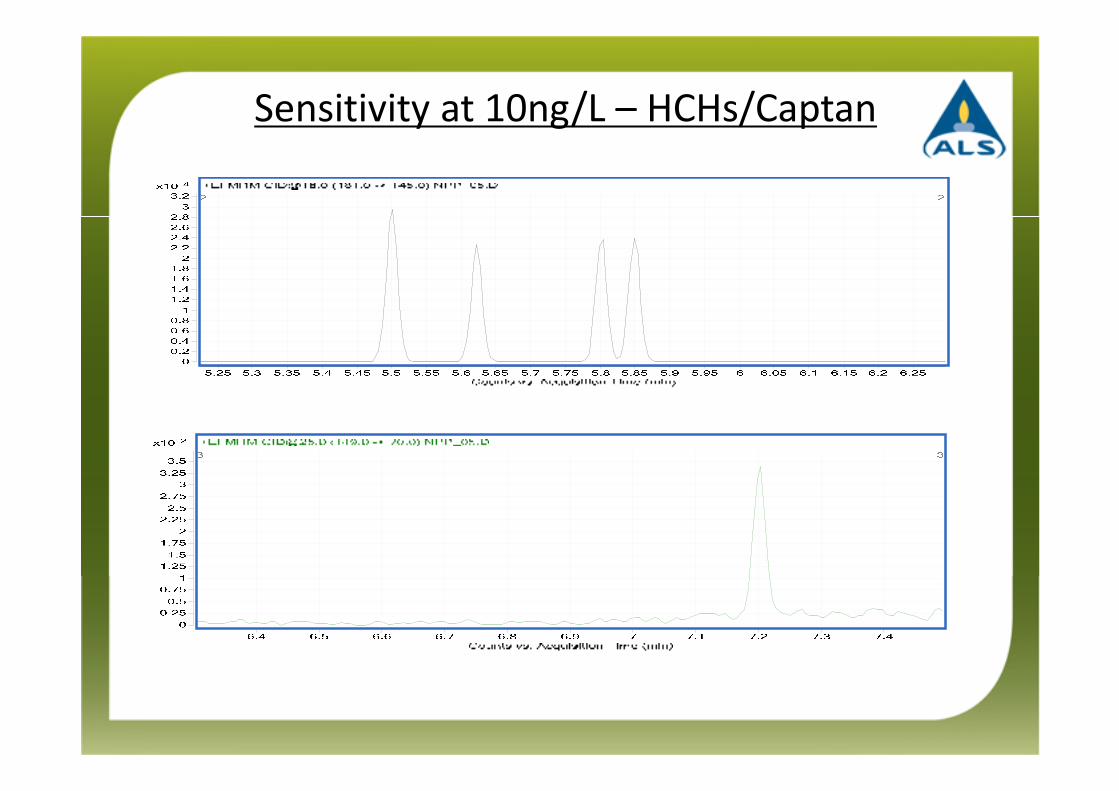
Sensitivity at 10ng/L – HCHs/Captan
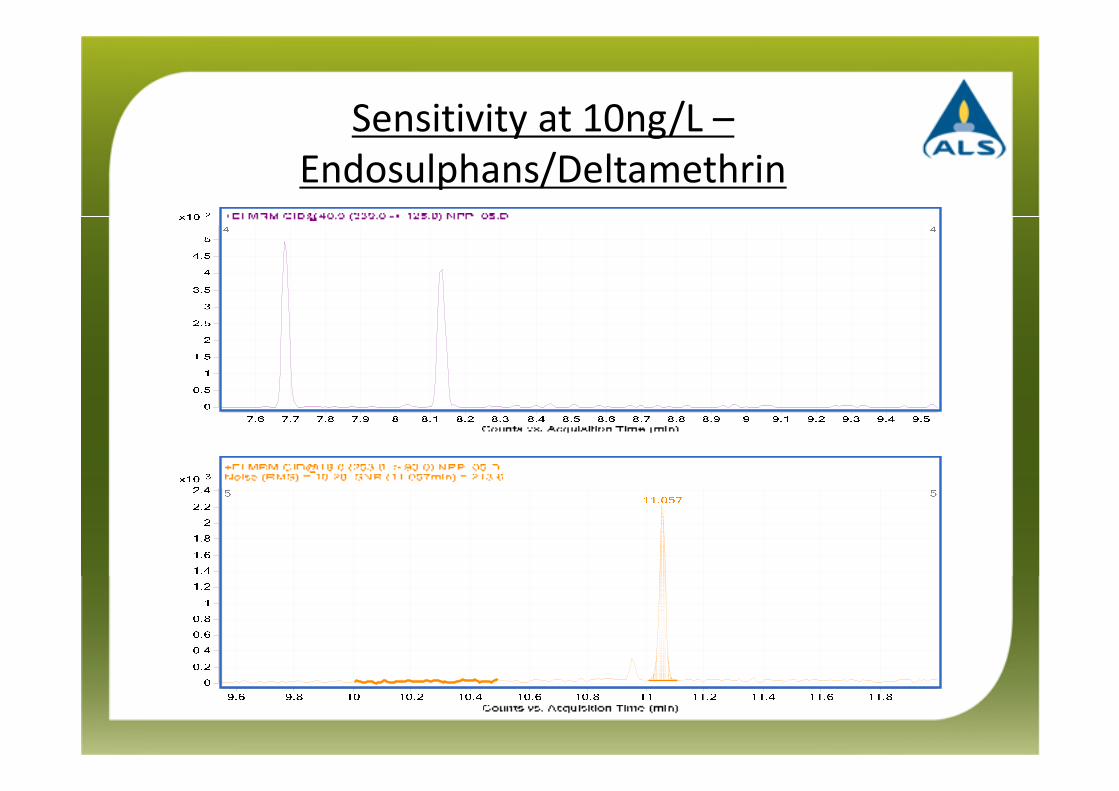
Sensitivity at 10ng/L –
Endosulphans/Deltamethrin
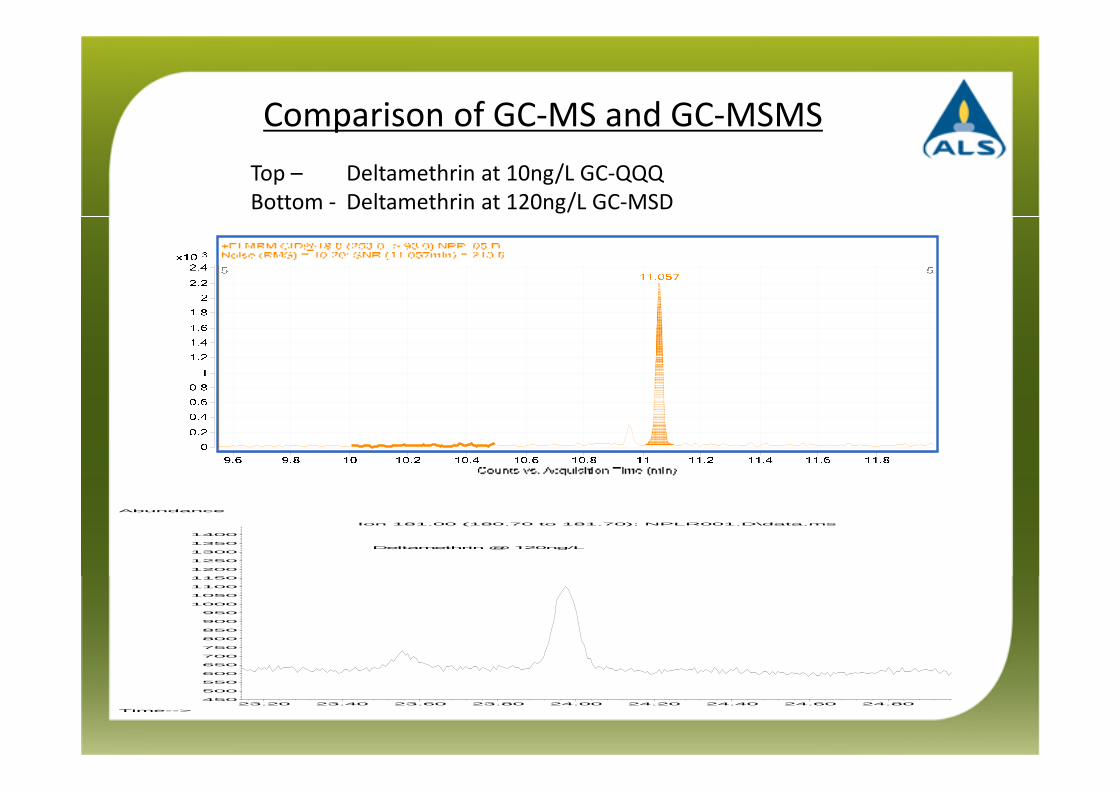
Comparison of GC-MS and GC-MSMS
23.20 23.40 23.60 23.80 24.00 24.20 24.40 24.60 24.80450
500
550
600
650
700
750
800
850
900
950
1000
1050
1100
1150
1200
1250
1300
1350
1400
Time-->
Abundance
Ion 181.00 (180.70 to 181.70): NPLR001.D\data.ms
Deltamethrin @ 120ng/L
Top – Deltamethrin at 10ng/L GC-QQQ
Bottom - Deltamethrin at 120ng/L GC-MSD
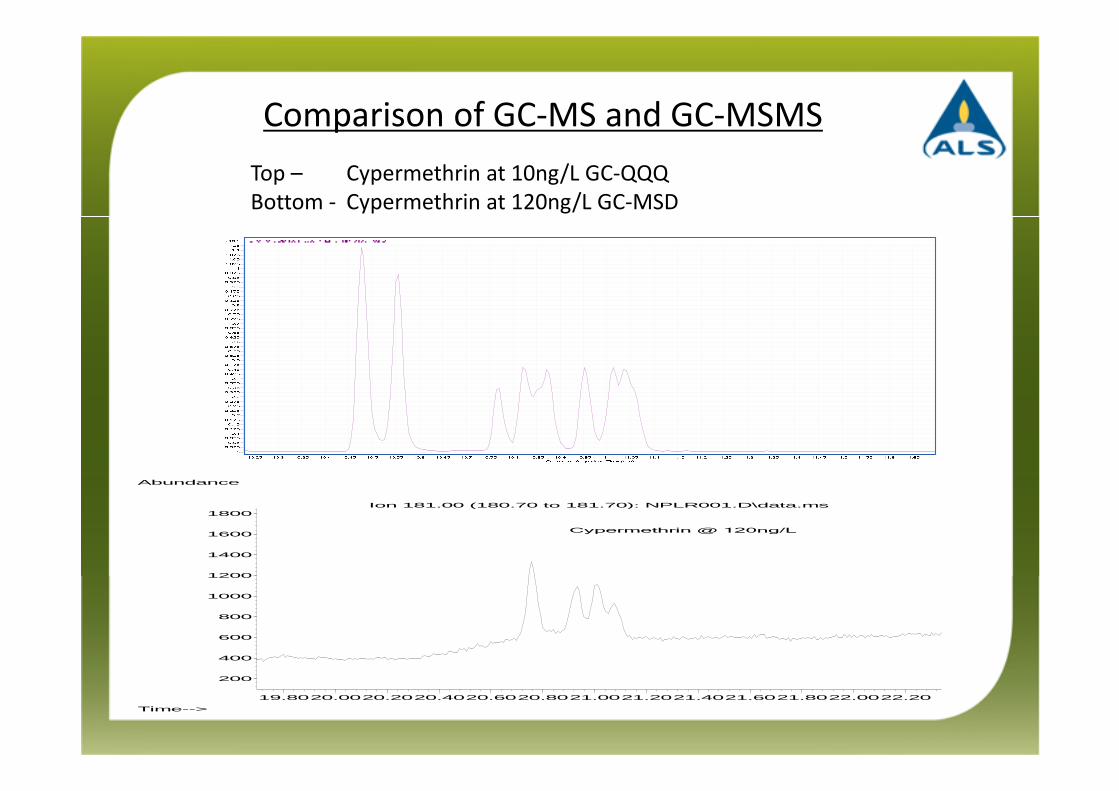
Comparison of GC-MS and GC-MSMS
Top – Cypermethrin at 10ng/L GC-QQQ
Bottom - Cypermethrin at 120ng/L GC-MSD
19.8020.0020.2020.4020.6020.8021.0021.2021.4021.6021.8022.0022.20
200
400
600
800
1000
1200
1400
1600
1800
Time-->
Abundance
Ion 181.00 (180.70 to 181.70): NPLR001.D\data.ms
Cypermethrin @ 120ng/L
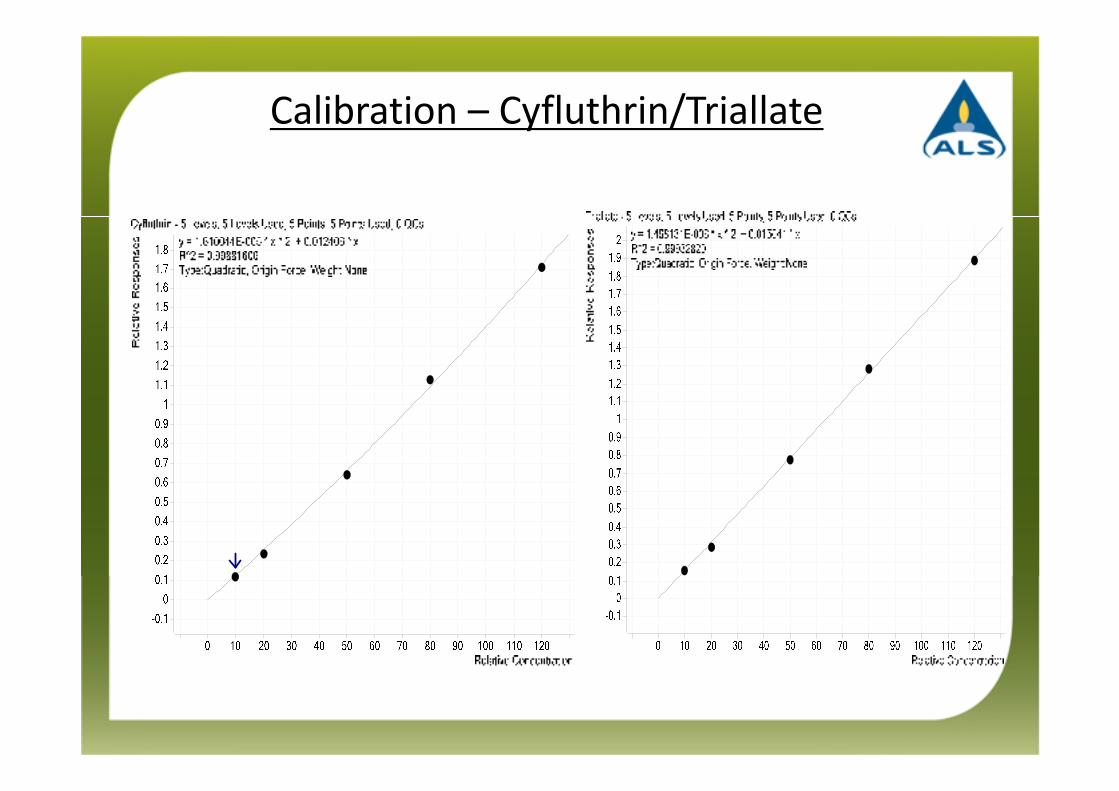
Calibration – Cyfluthrin/Triallate
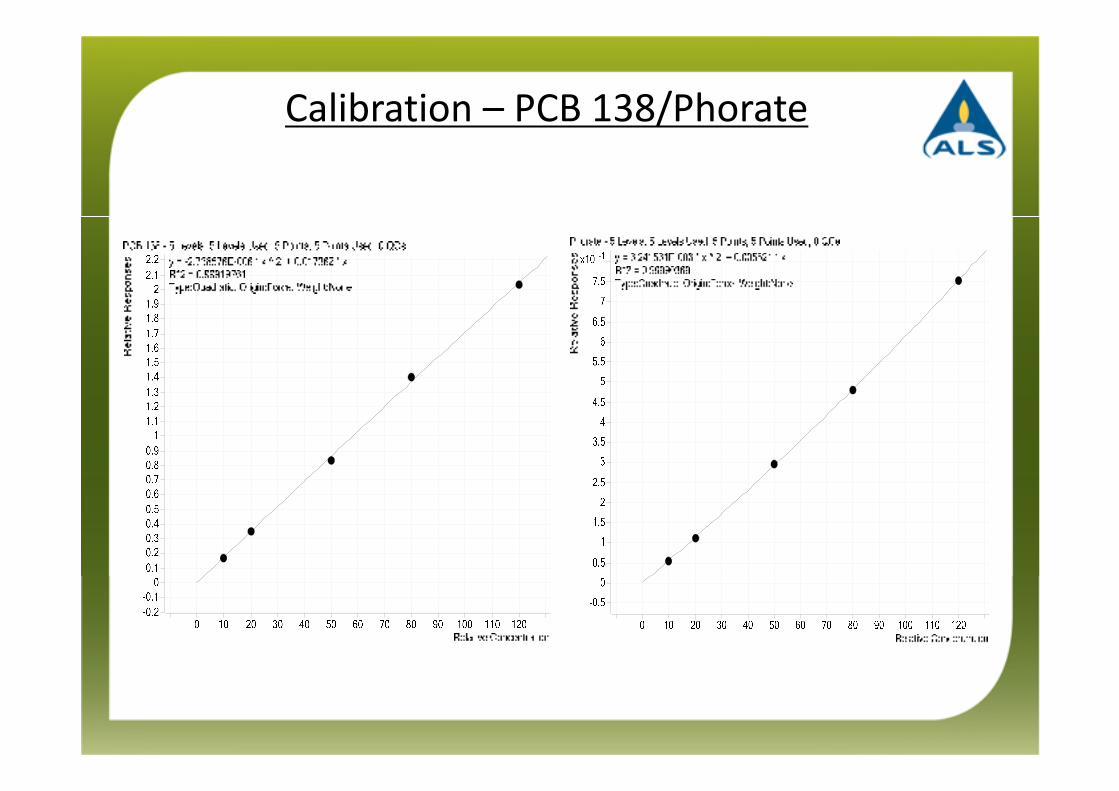
Calibration – PCB 138/Phorate
Non-Polars – Method Validation
� Method validated on 5 matrices�Potable – Soft, Medium, Hard�Raw – Borehole, Surface
�Summary of Results�Highest LOD was Captan at 3ng/L all others 2ng/L or less�Excellent recoveries and precision for all compounds –majority of RSDs <5% at the PCV Level.
�Method accredited by UKAS
�Method has been “live” at the Bridgend laboratory for 9 months and is performing well.
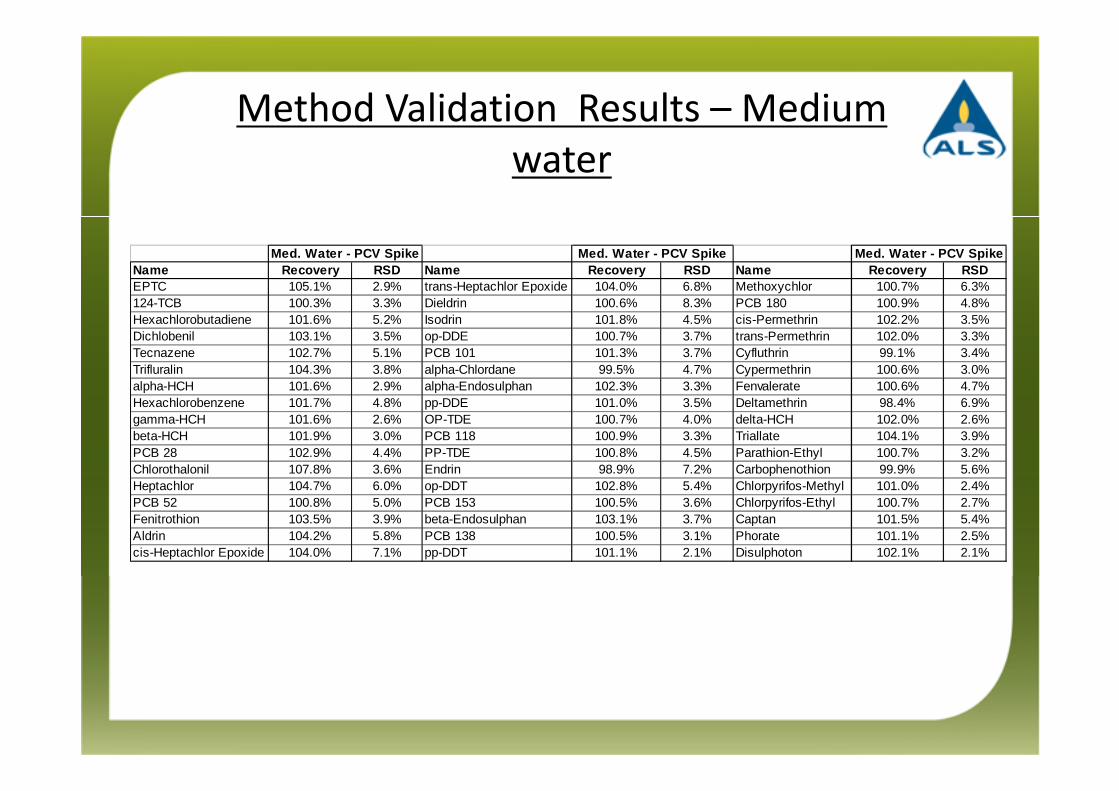
Method Validation Results – Medium
water
Name Recovery RSD Name Recovery RSD Name Recovery RSDEPTC 105.1% 2.9% trans-Heptachlor Epoxide 104.0% 6.8% Methoxychlor 100.7% 6.3%124-TCB 100.3% 3.3% Dieldrin 100.6% 8.3% PCB 180 100.9% 4.8%Hexachlorobutadiene 101.6% 5.2% Isodrin 101.8% 4.5% cis-Permethrin 102.2% 3.5%Dichlobenil 103.1% 3.5% op-DDE 100.7% 3.7% trans-Permethrin 102.0% 3.3%Tecnazene 102.7% 5.1% PCB 101 101.3% 3.7% Cyfluthrin 99.1% 3.4%Trifluralin 104.3% 3.8% alpha-Chlordane 99.5% 4.7% Cypermethrin 100.6% 3.0%alpha-HCH 101.6% 2.9% alpha-Endosulphan 102.3% 3.3% Fenvalerate 100.6% 4.7%Hexachlorobenzene 101.7% 4.8% pp-DDE 101.0% 3.5% Deltamethrin 98.4% 6.9%gamma-HCH 101.6% 2.6% OP-TDE 100.7% 4.0% delta-HCH 102.0% 2.6%beta-HCH 101.9% 3.0% PCB 118 100.9% 3.3% Triallate 104.1% 3.9%PCB 28 102.9% 4.4% PP-TDE 100.8% 4.5% Parathion-Ethyl 100.7% 3.2%Chlorothalonil 107.8% 3.6% Endrin 98.9% 7.2% Carbophenothion 99.9% 5.6%Heptachlor 104.7% 6.0% op-DDT 102.8% 5.4% Chlorpyrifos-Methyl 101.0% 2.4%PCB 52 100.8% 5.0% PCB 153 100.5% 3.6% Chlorpyrifos-Ethyl 100.7% 2.7%Fenitrothion 103.5% 3.9% beta-Endosulphan 103.1% 3.7% Captan 101.5% 5.4%Aldrin 104.2% 5.8% PCB 138 100.5% 3.1% Phorate 101.1% 2.5%cis-Heptachlor Epoxide 104.0% 7.1% pp-DDT 101.1% 2.1% Disulphoton 102.1% 2.1%
Med. Water - PCV Spike Med. Water - PCV SpikeMed. Water - PCV Spike
Non-Polars – Routine AQC
Performance
� Routine AQC�3 months data�RSDs range from 1.6 to 7.4%�43 Compounds <5%�15 Compounds <3%
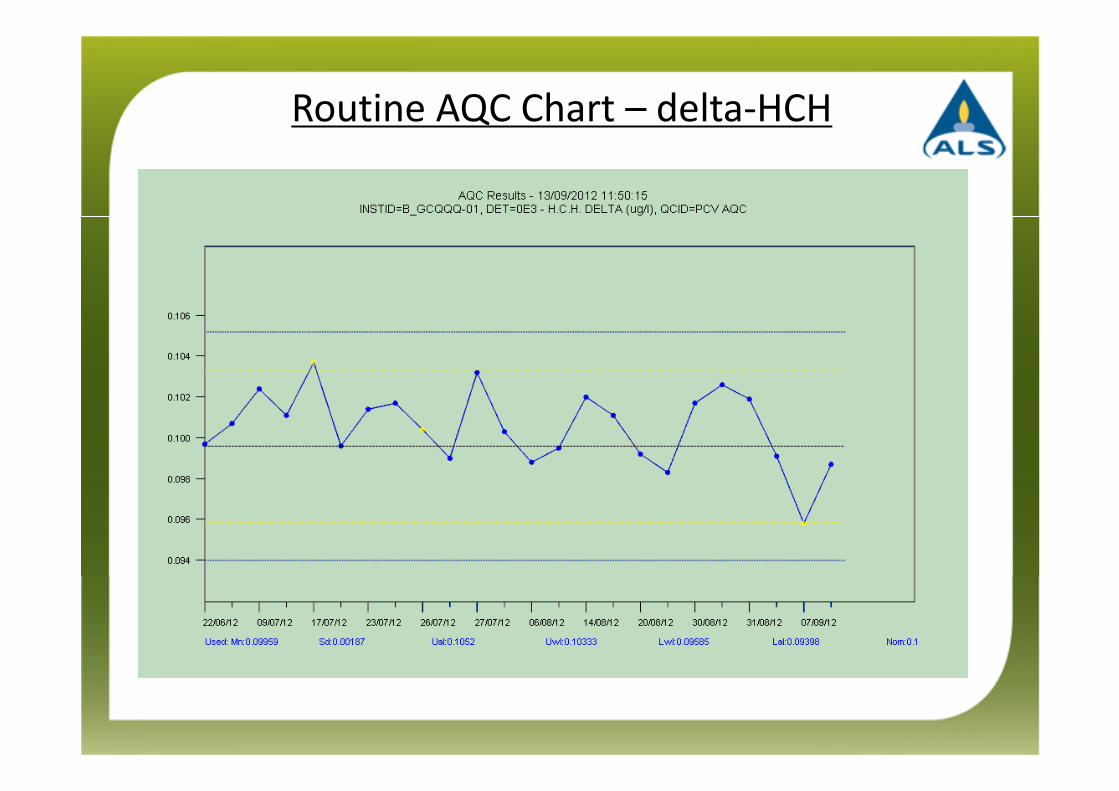
Routine AQC Chart – delta-HCH

Routine AQC Chart – Captan
Non-Polars in Potable Water -
Summary
� Analysis of a suite of non-polar pesticides has been successfully transferred from GC-MSD/ECD to GC-QQQ.
�Method has been accredited by UKAS and is working well in production.
�Advantages over the previous method include:�Faster analytical runs.�Enhanced sensitivity.�Greater robustness.�Easier data processing.�Better selectivity – 2MRM transitions per compound giving greater confidence in positive results.
Wastewater Analysis
• Compounds
– PBDEs, PAHs, Diazinon, Cypermethrin
– Low reporting limits - <0.2ng/L for some compounds
– Dirty matrices – Crude sewages & trade effluents
– Sensitivity and selectivity of GC-QQQ essential.
• Sample Preparation
– 160ml sample with 40ml acetonitrile
– Extract with 20ml hexane
– Evaporate 10ml of extract to 1ml
– Clean-up on NH2 SPE Cartridge
– Evaporate to 250ul
– Inject 12.5ul onto GC-QQQ via MMI operated in solvent vent
mode
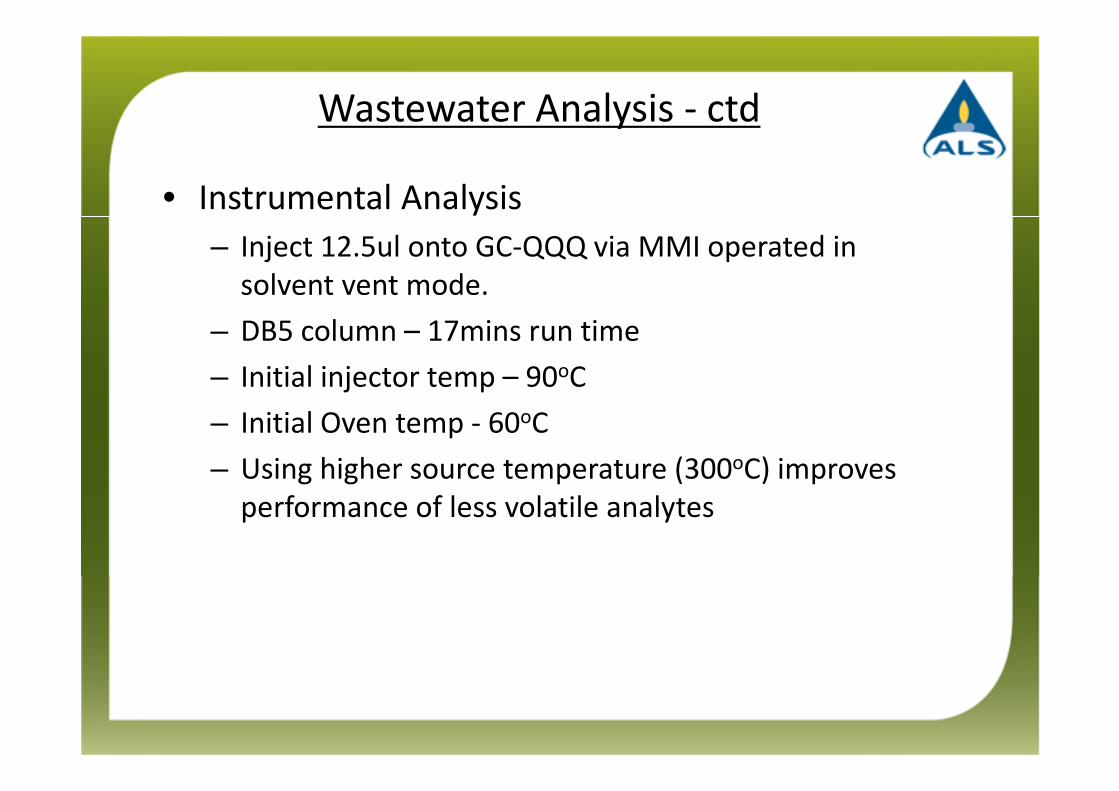
Wastewater Analysis - ctd
• Instrumental Analysis
– Inject 12.5ul onto GC-QQQ via MMI operated in
solvent vent mode.
– DB5 column – 17mins run time
– Initial injector temp – 90oC
– Initial Oven temp - 60oC
– Using higher source temperature (300oC) improves
performance of less volatile analytes
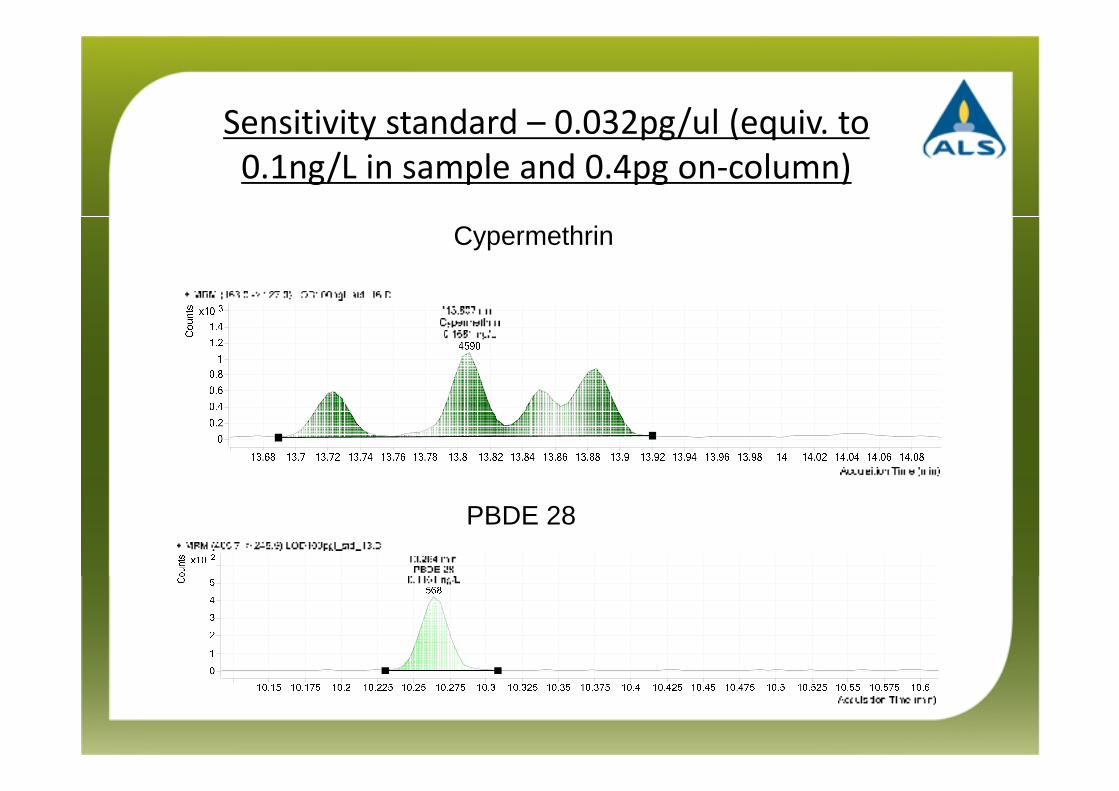
Sensitivity standard – 0.032pg/ul (equiv. to
0.1ng/L in sample and 0.4pg on-column)
Cypermethrin
PBDE 28
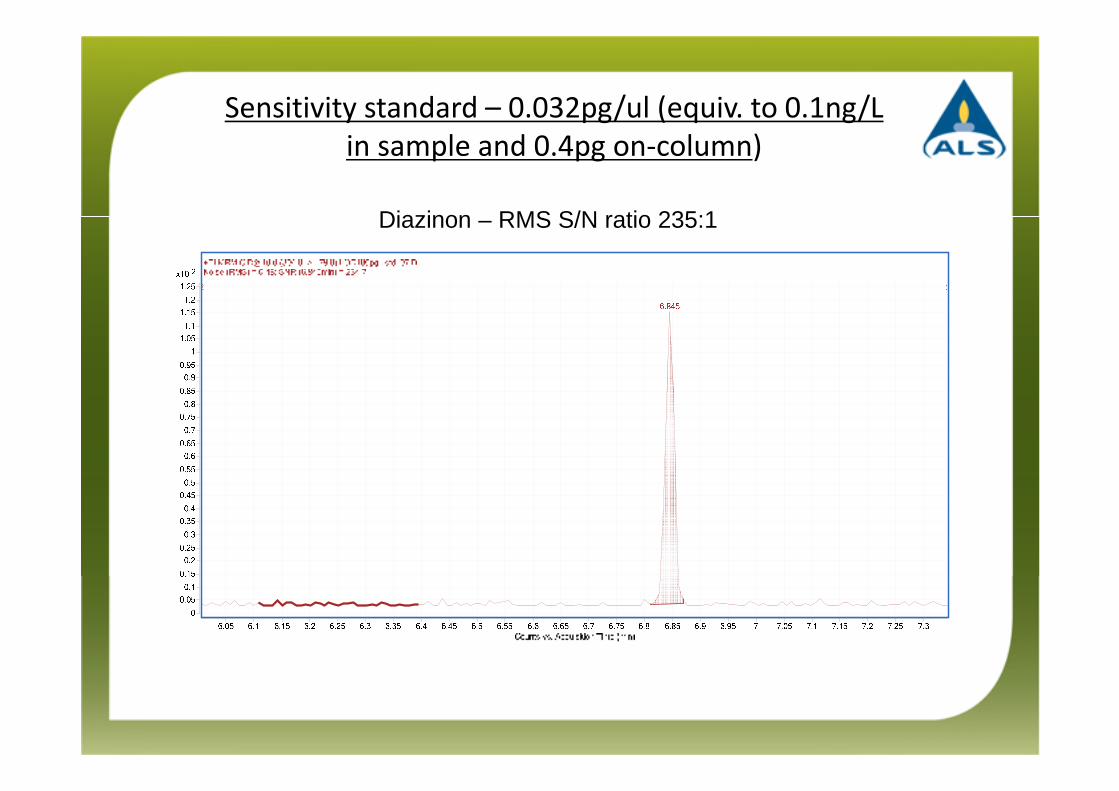
Sensitivity standard – 0.032pg/ul (equiv. to 0.1ng/L
in sample and 0.4pg on-column)
Diazinon – RMS S/N ratio 235:1
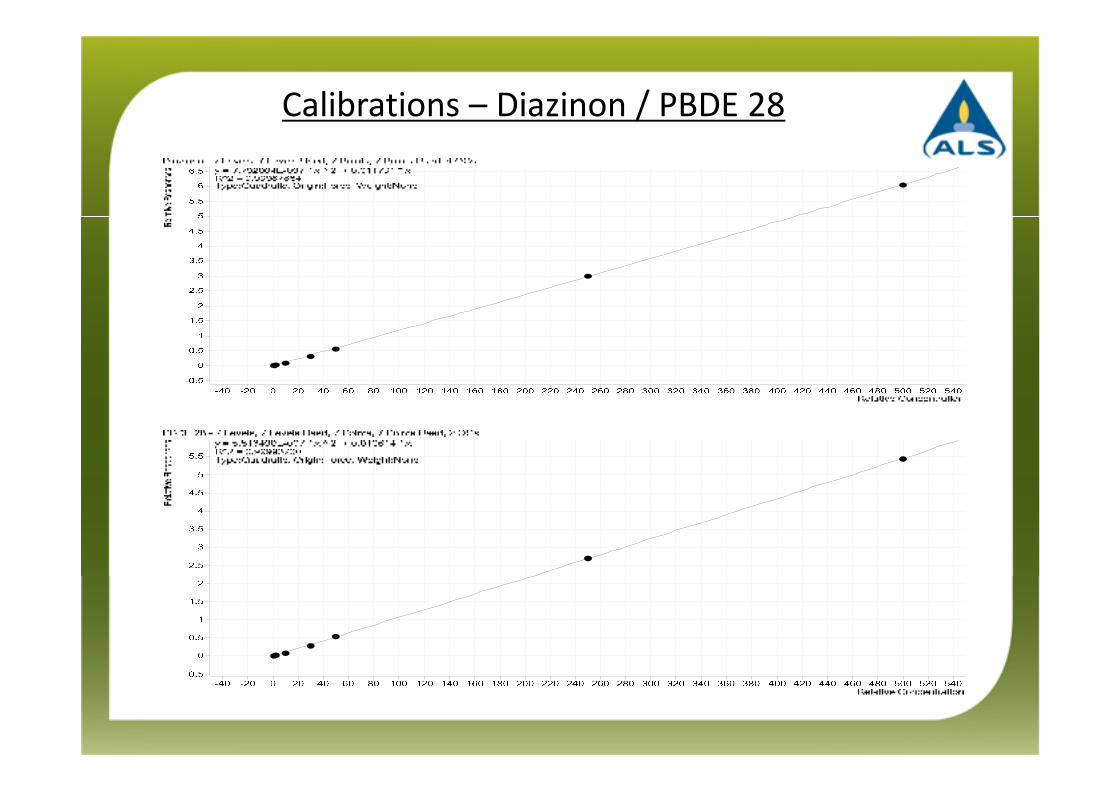
Calibrations – Diazinon / PBDE 28
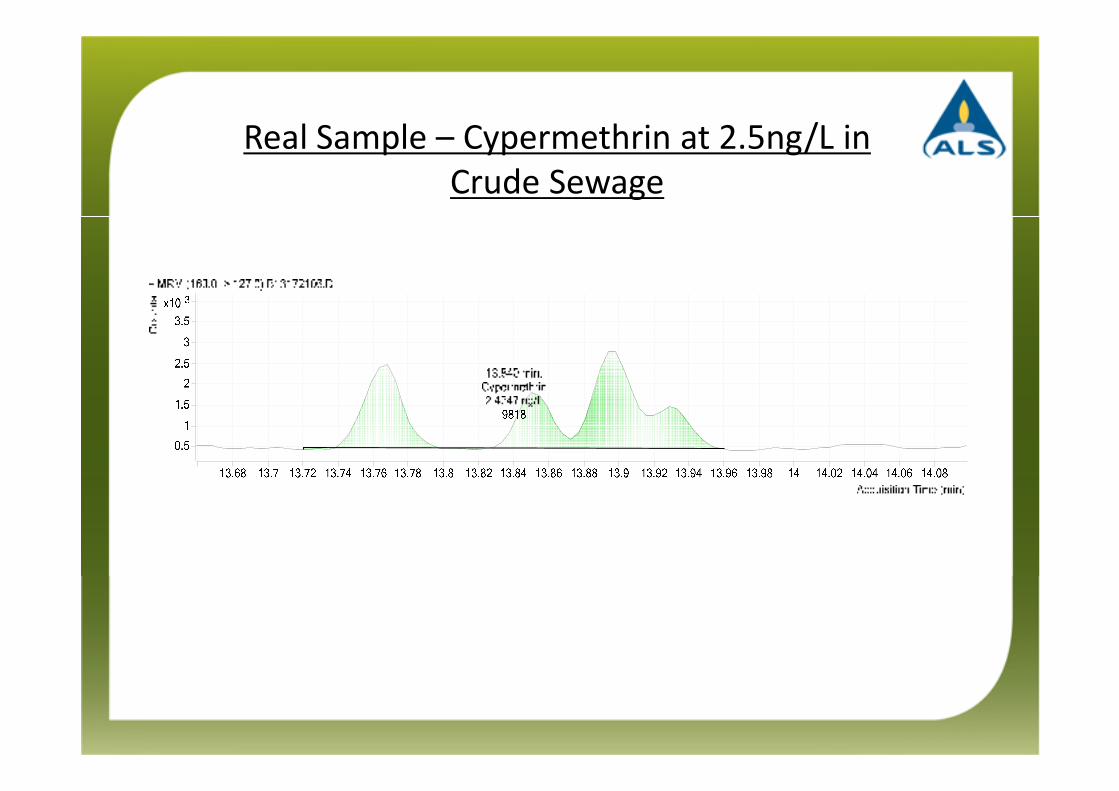
Real Sample – Cypermethrin at 2.5ng/L in
Crude Sewage
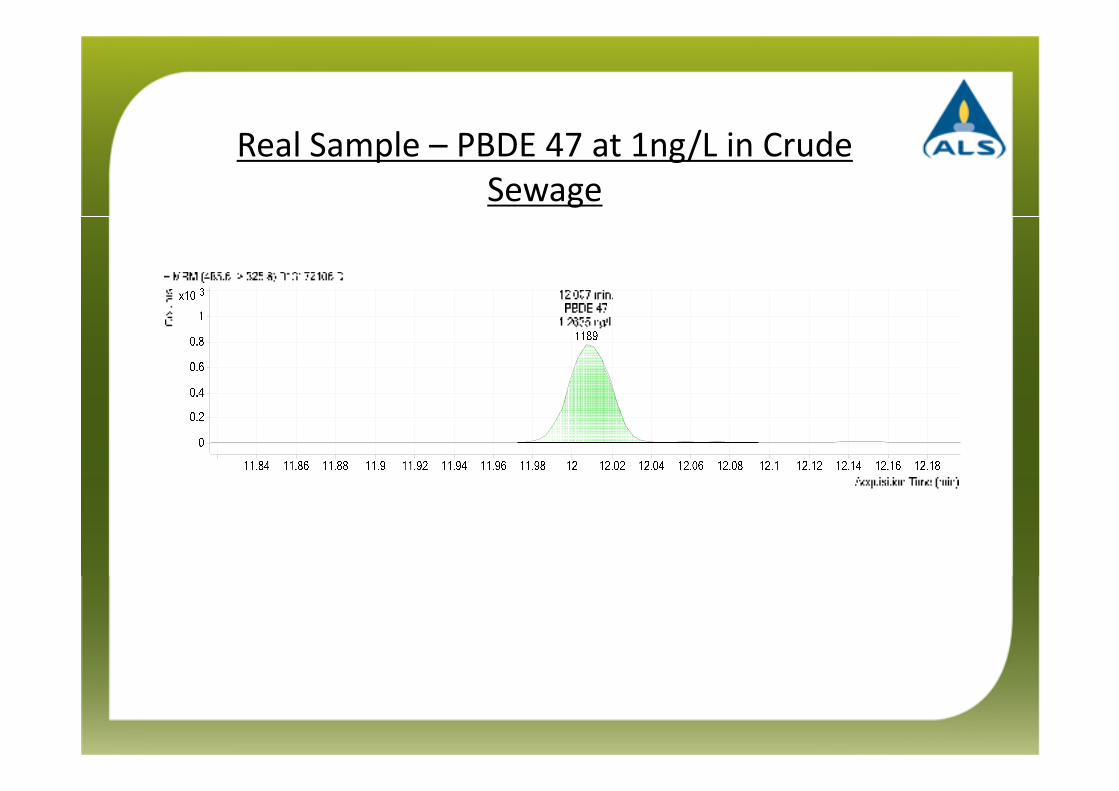
Real Sample – PBDE 47 at 1ng/L in Crude
Sewage
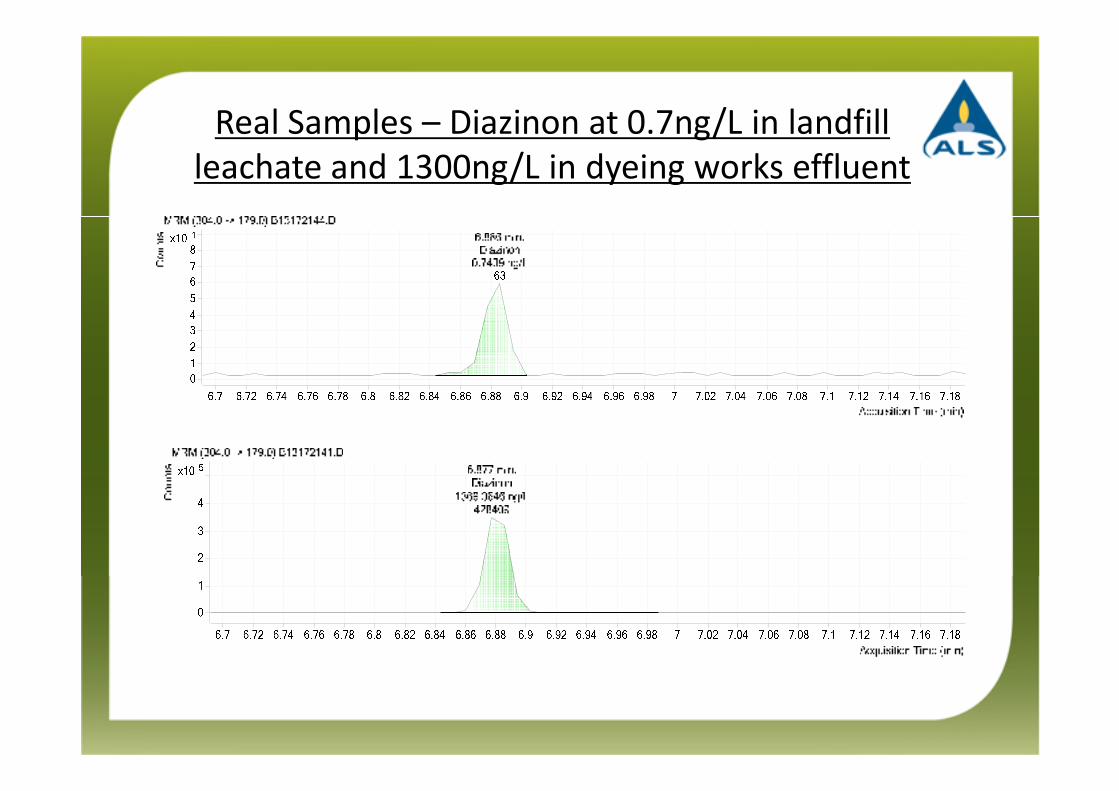
Real Samples – Diazinon at 0.7ng/L in landfill
leachate and 1300ng/L in dyeing works effluent
Non-Polars in Wastewater - Summary
� GC-QQQ successfully applied to the ultra-trace level analysis of PAHs, PBDEs and some pesticides in a variety of challenging sample matrices.
�7000 GC-QQQ ideally suited to the task�High sensitivity�Good selectivity�Large dynamic range�Robust�Easy data processing via Masshunter software
Analysis of NDMA by GC-MSMS
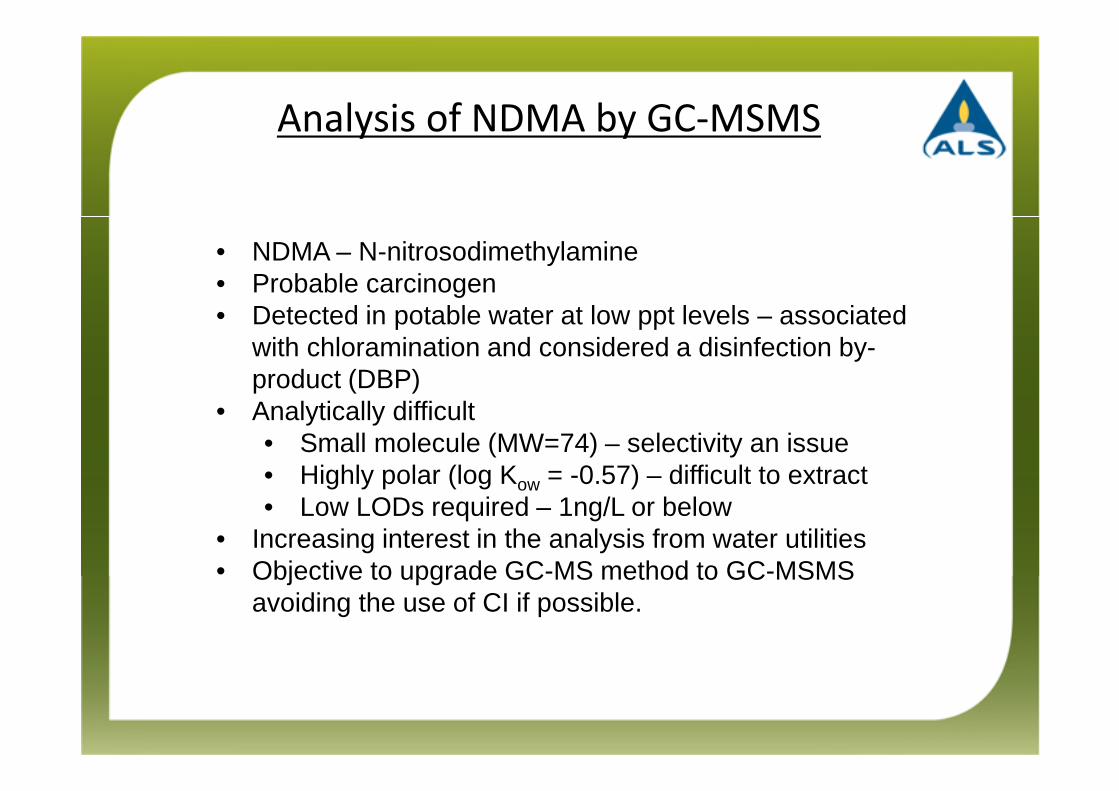
• NDMA – N-nitrosodimethylamine• Probable carcinogen• Detected in potable water at low ppt levels – associated
with chloramination and considered a disinfection by-product (DBP)
• Analytically difficult• Small molecule (MW=74) – selectivity an issue• Highly polar (log Kow = -0.57) – difficult to extract• Low LODs required – 1ng/L or below
• Increasing interest in the analysis from water utilities• Objective to upgrade GC-MS method to GC-MSMS
avoiding the use of CI if possible.
Analysis of NDMA by GC-MSMS
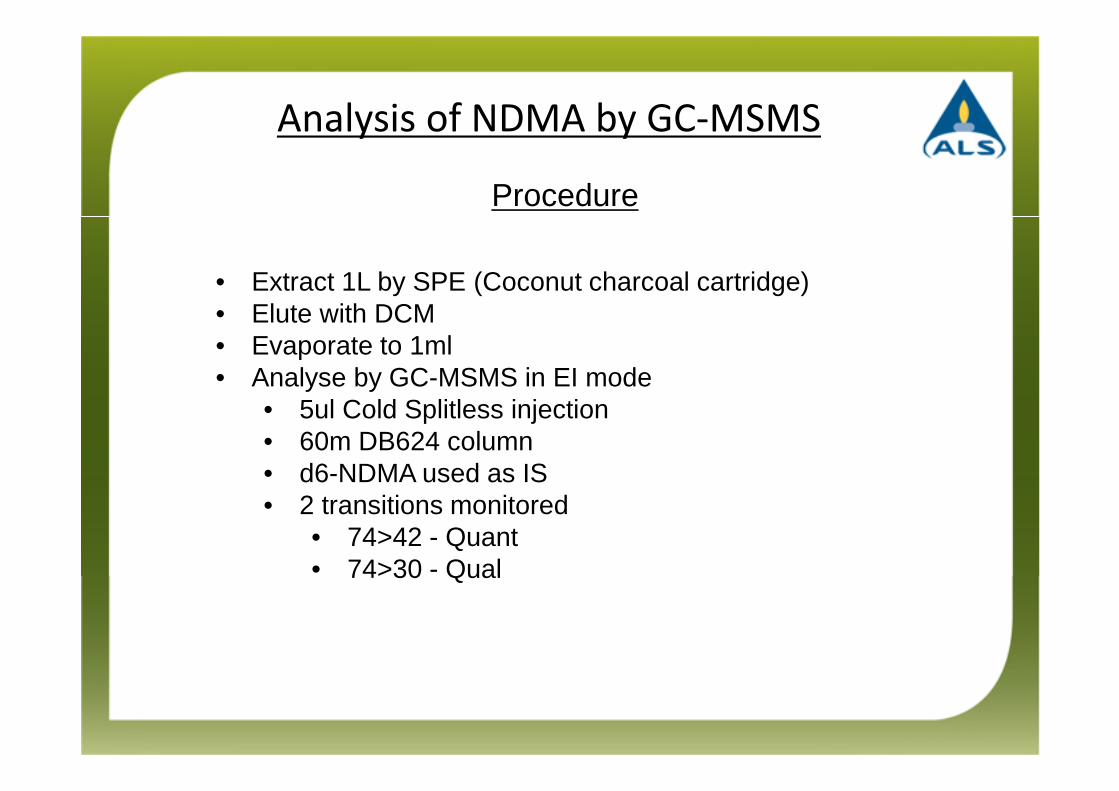
• Extract 1L by SPE (Coconut charcoal cartridge)• Elute with DCM• Evaporate to 1ml• Analyse by GC-MSMS in EI mode
• 5ul Cold Splitless injection• 60m DB624 column• d6-NDMA used as IS• 2 transitions monitored
• 74>42 - Quant• 74>30 - Qual
Procedure
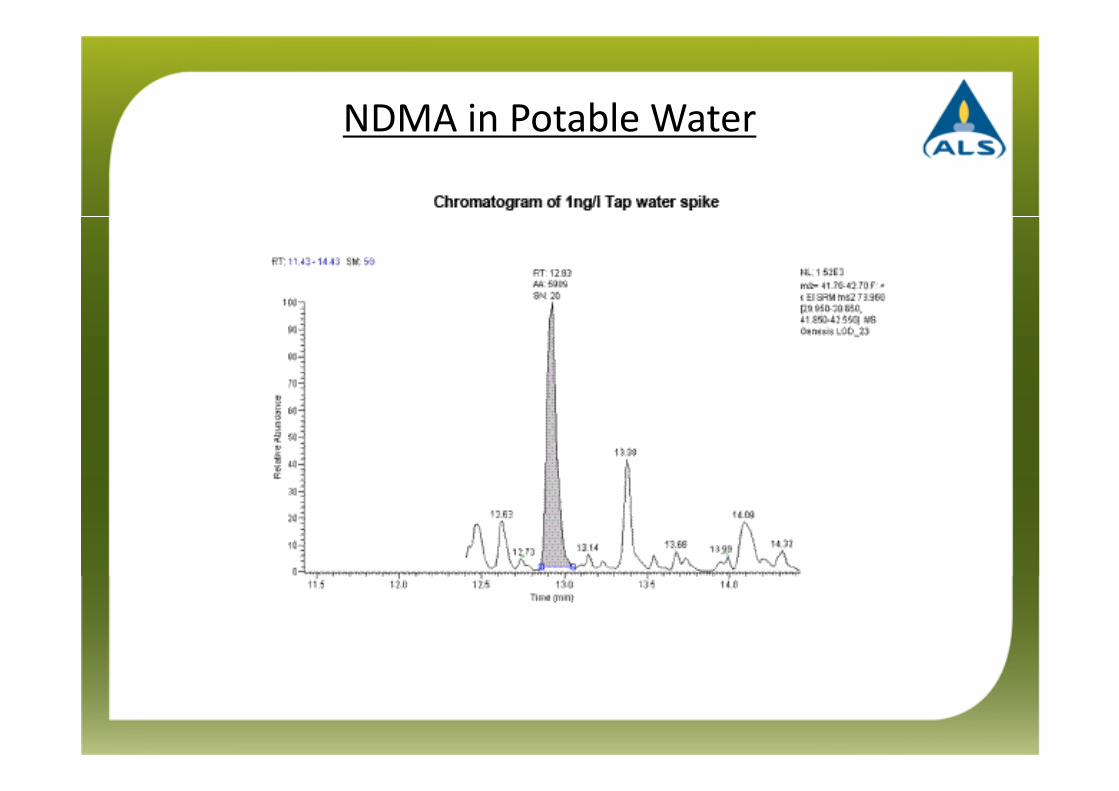
NDMA in Potable Water
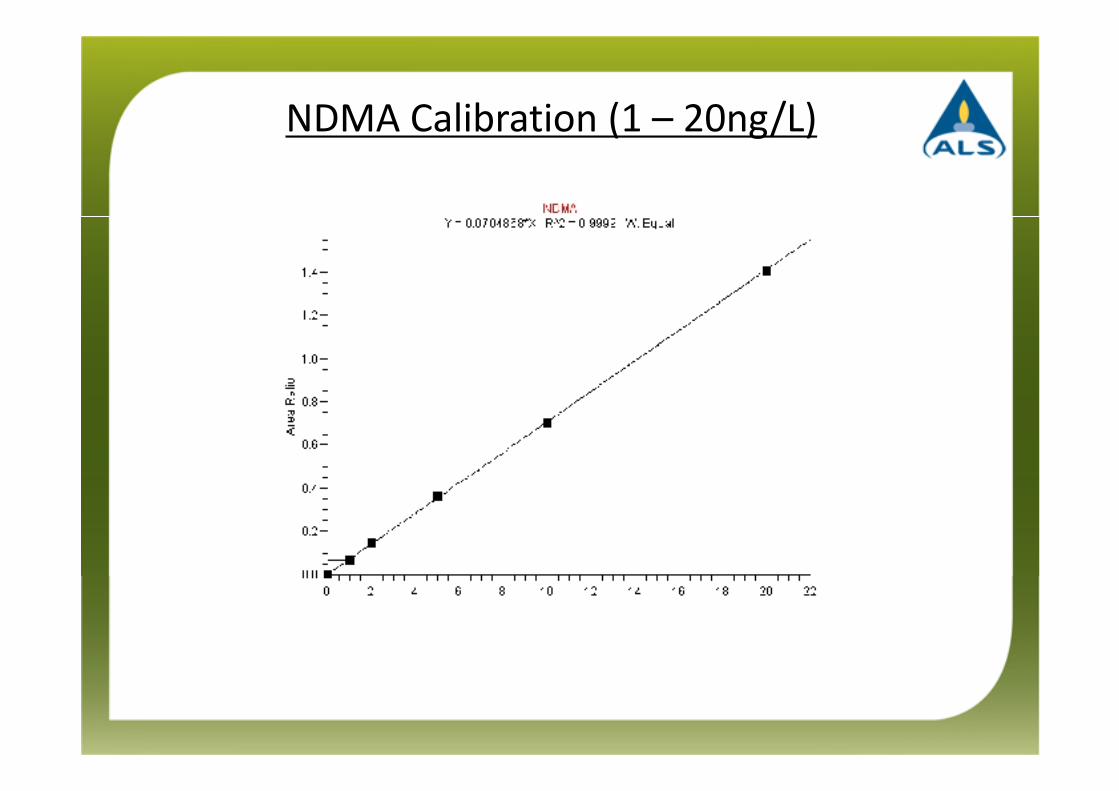
NDMA Calibration (1 – 20ng/L)
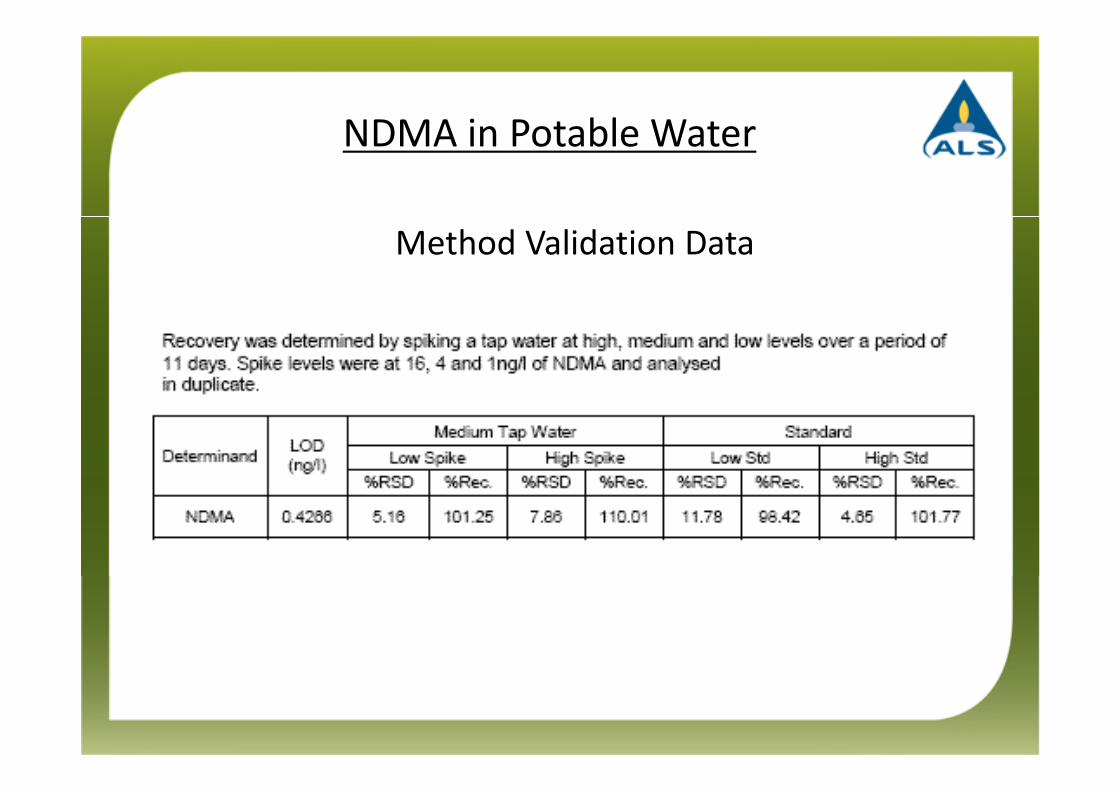
NDMA in Potable Water
Method Validation Data
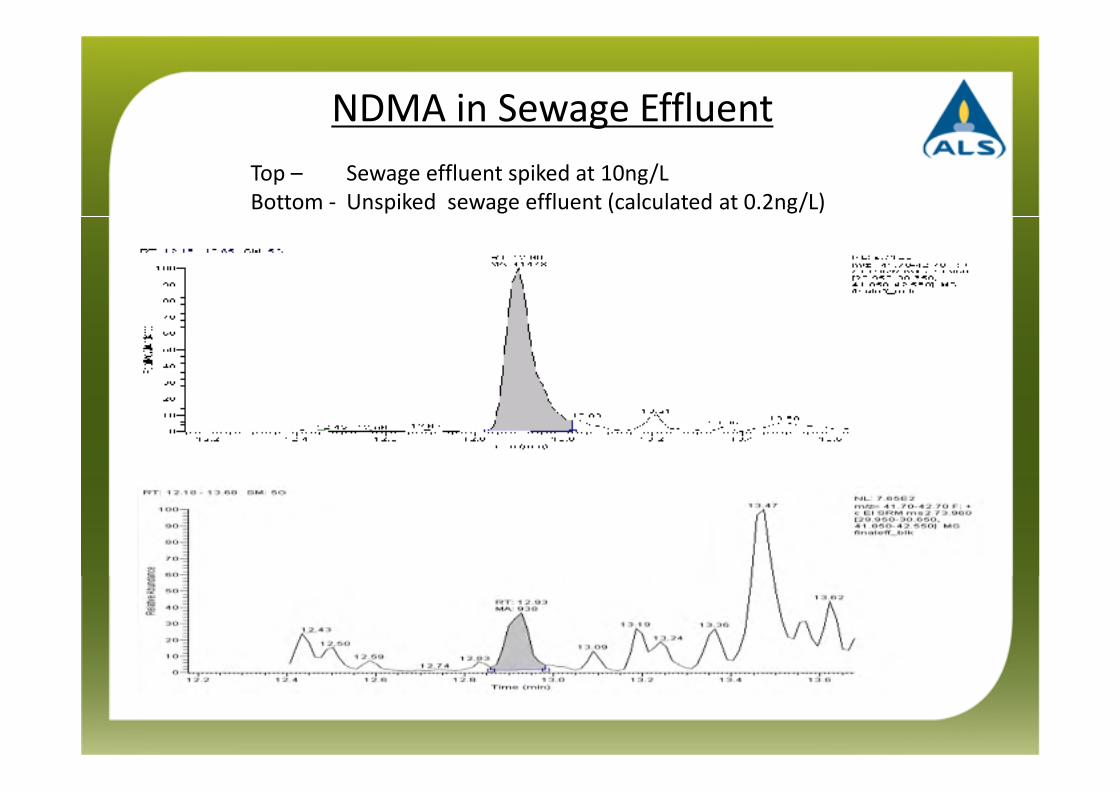
NDMA in Sewage Effluent
Top – Sewage effluent spiked at 10ng/L
Bottom - Unspiked sewage effluent (calculated at 0.2ng/L)
Analysis of NDMA by GC-MSMS
• Method for the low level analysis of NDMA in potable water by GC-MSMS validated.
• Good precision and bias statistics• MRL of <0.5ng/L• 60m GC column used to increase selectivity
chromatographically.• Use of CI reagent gases avoided.• Method has the potential to be applied to more complex
matrices
Summary
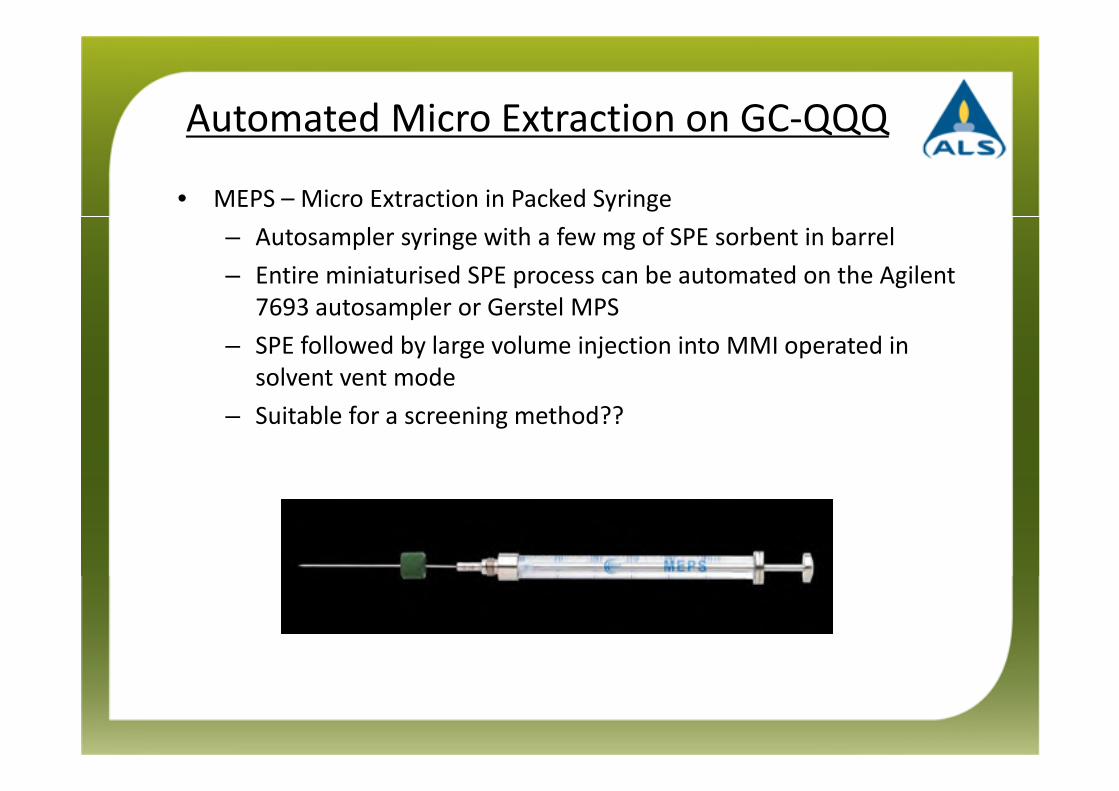
Automated Micro Extraction on GC-QQQ
• MEPS – Micro Extraction in Packed Syringe
– Autosampler syringe with a few mg of SPE sorbent in barrel
– Entire miniaturised SPE process can be automated on the Agilent
7693 autosampler or Gerstel MPS
– SPE followed by large volume injection into MMI operated in
solvent vent mode
– Suitable for a screening method??
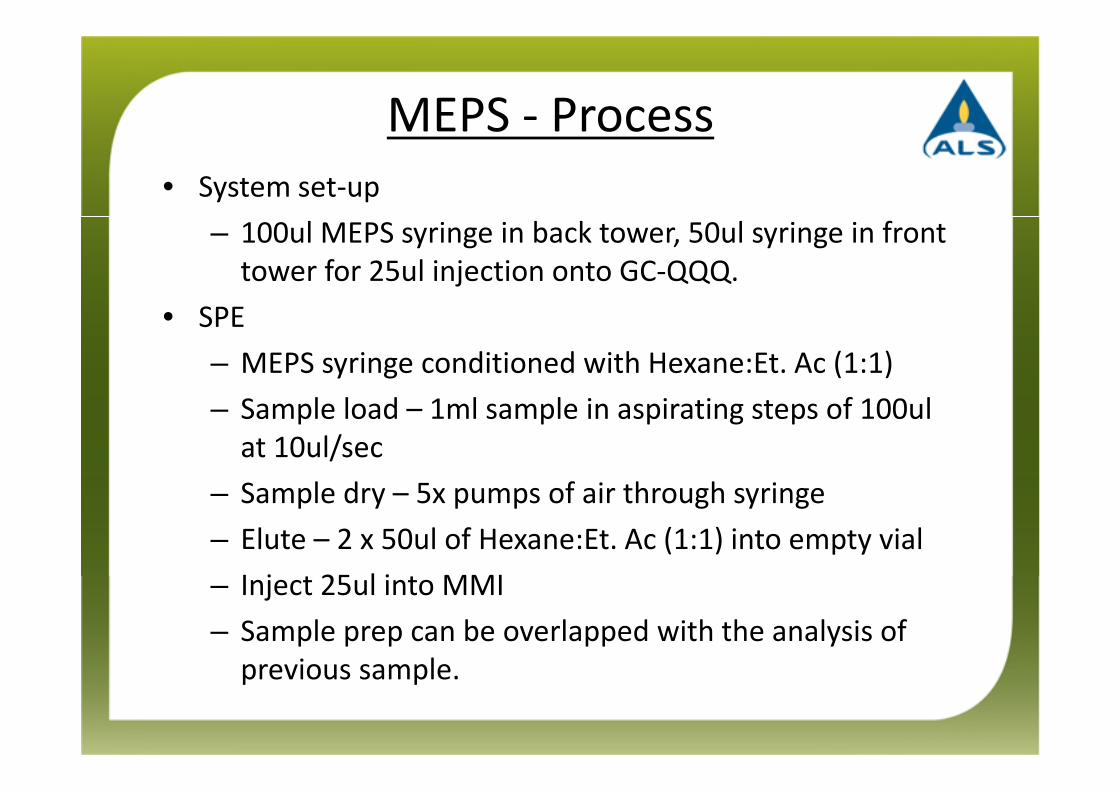
MEPS - Process
• System set-up
– 100ul MEPS syringe in back tower, 50ul syringe in front
tower for 25ul injection onto GC-QQQ.
• SPE
– MEPS syringe conditioned with Hexane:Et. Ac (1:1)
– Sample load – 1ml sample in aspirating steps of 100ul
at 10ul/sec
– Sample dry – 5x pumps of air through syringe
– Elute – 2 x 50ul of Hexane:Et. Ac (1:1) into empty vial
– Inject 25ul into MMI
– Sample prep can be overlapped with the analysis of
previous sample.
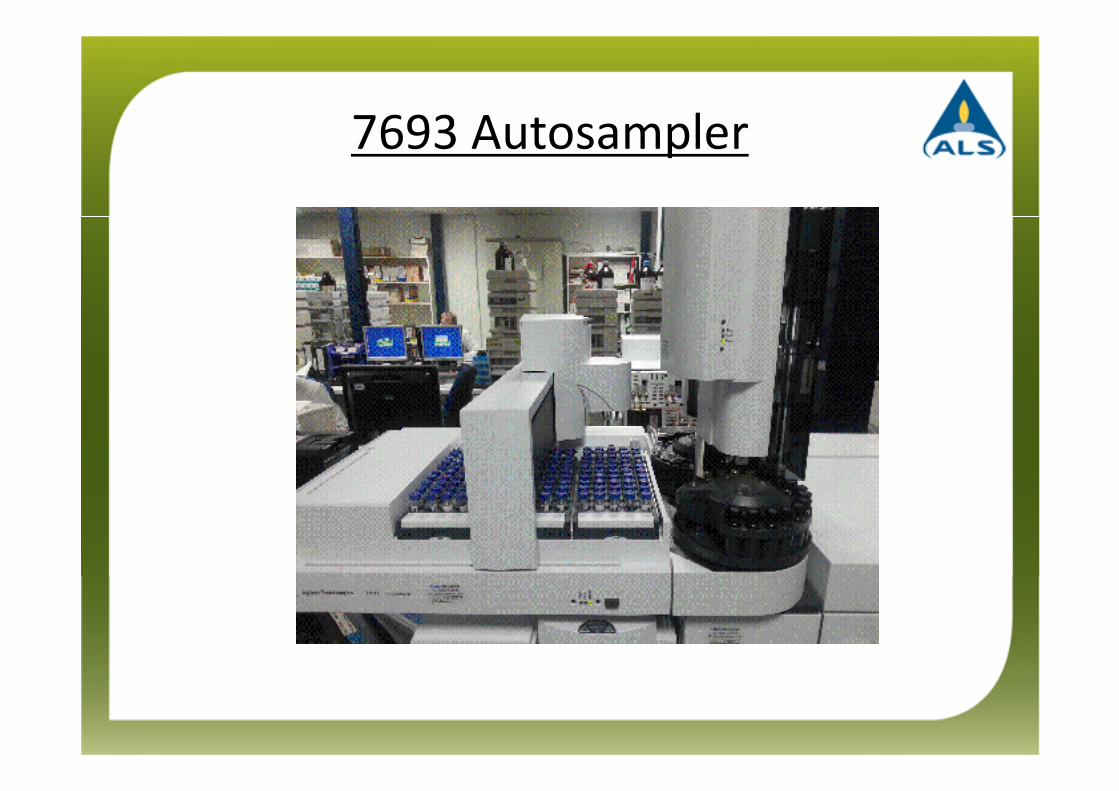
7693 Autosampler
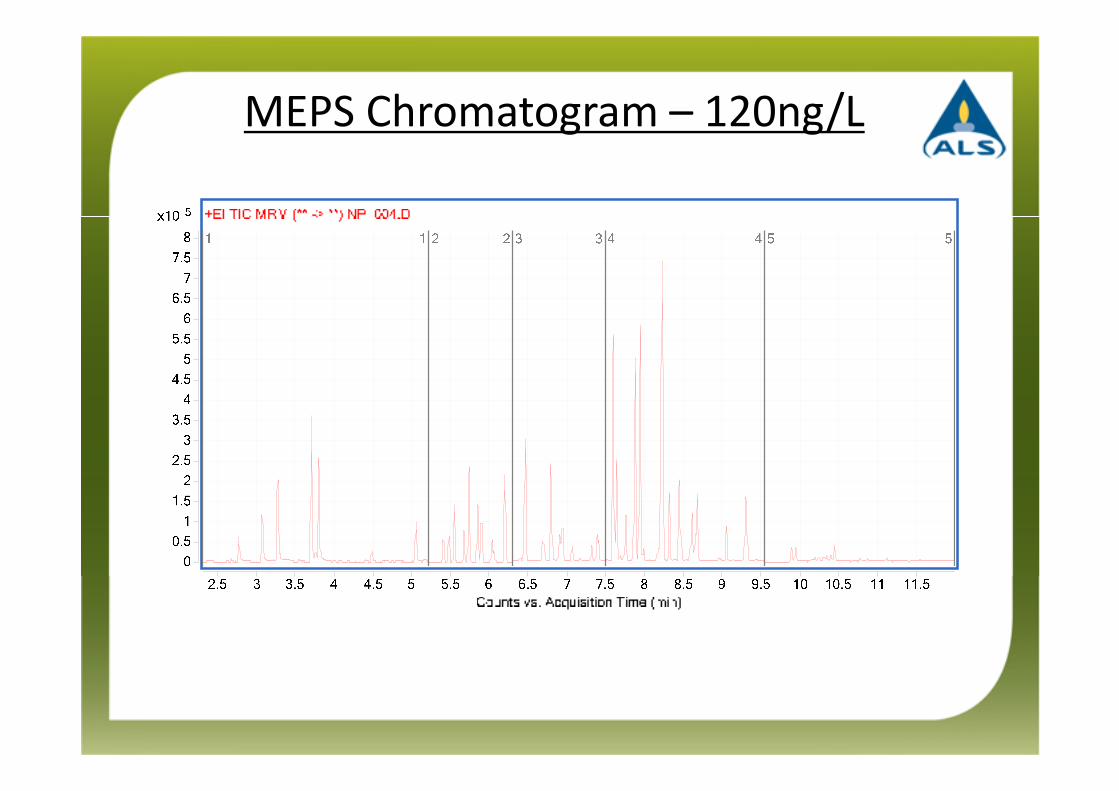
MEPS Chromatogram – 120ng/L
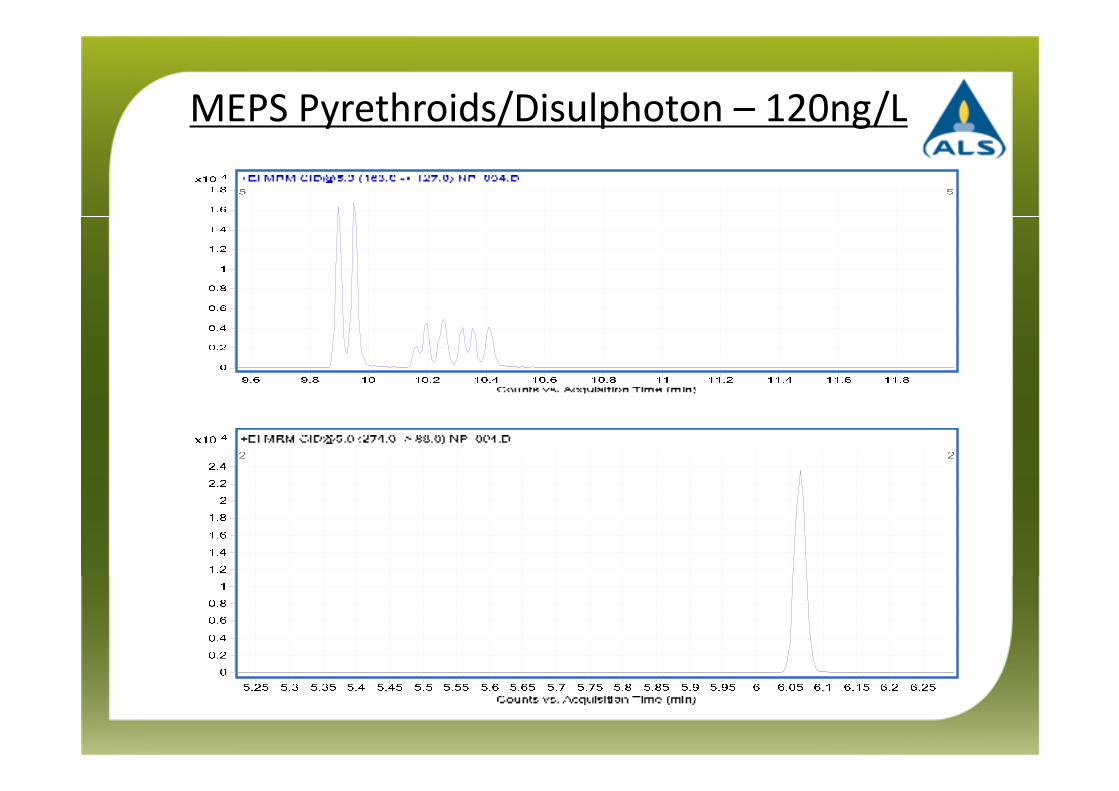
MEPS Pyrethroids/Disulphoton – 120ng/L
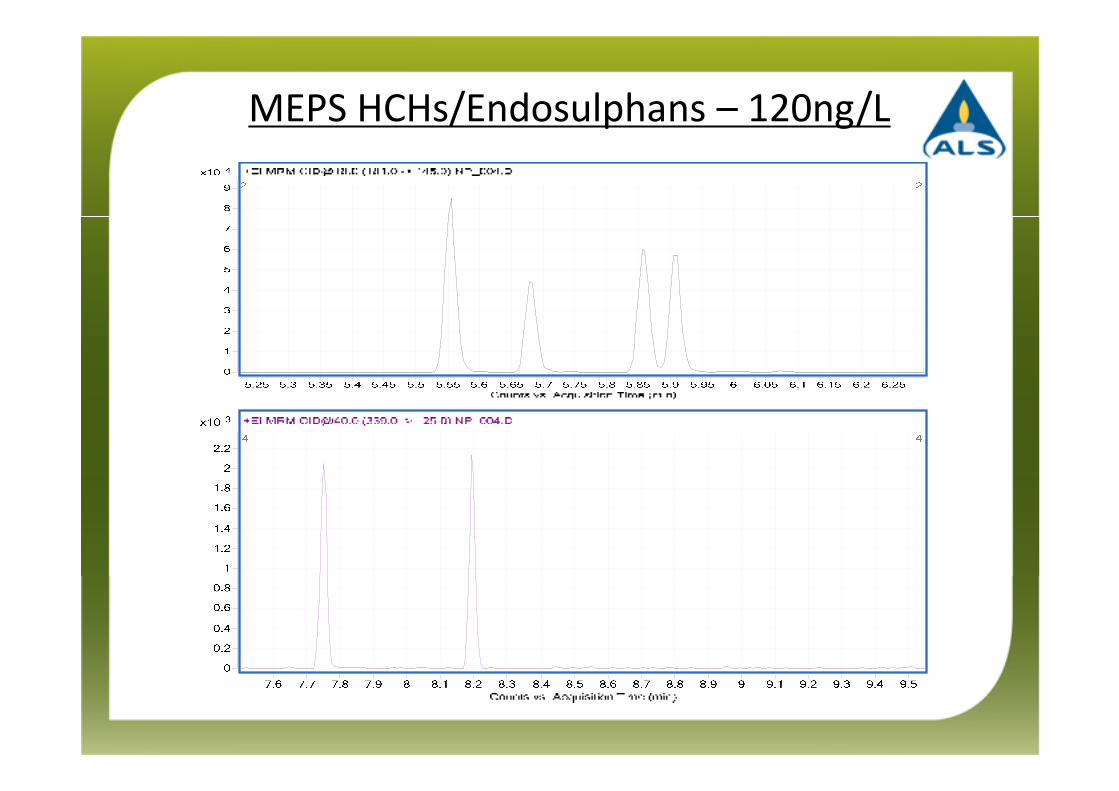
MEPS HCHs/Endosulphans – 120ng/L
Summary
� GC-MSMS successfully utilised for the trace level analysis of non-polar organic compounds in a wide variety of matrices across the business.
�Methods being transferred from MSDs to GC-QQQs
�Advantages�Reduced analytical run times�Greater sensitivity and selectivity�Ability to maintain low LODs even in dirty matrices�Easier reprocessing
�High sensitivity and selectivity combined with large volume injection and modern autosamplers gives rise to the potential for fully automated methods.
Acknowledgements
�Richard Glendinning – ALS Coventry
�Adrian Thomas – Severn Trent Water
� Gavin Mills – Severn Trent Water

Thank You!
Any Questions?


![Anodic Corrosion of Copper in Presence of Organic CompoundsOrganic compounds containing polar groups including nitrogen, sulfur, oxygen [14-22] and heterocyclic compounds with polar](https://img.pdfslide.us/doc/110x75/60b30c7fb90de02c262ccb89/anodic-corrosion-of-copper-in-presence-of-organic-organic-compounds-containing-polar.jpg)