1
Solvent Extraction of Organic Compounds from Shale Rock Alysha E. Sheets 1 , Amy M. McKenna 2 1 Tallahassee Community College, 444 Appleyard Drive, Tallahassee, Florida, 32304, United States 2 Ion Cyclotron Resonance Program, National High Magnetic Field Laboratory, Florida State University, 1800 East Paul Dirac Drive, Tallahassee, Florida 32310, United States BACKGROUND Hydraulic fracturing is a process by which natural gas and oils are harvested from shale deposits thousands of meters below the surface for commercial use. High pressure water must be pumped through the shale rock with hydraulic fracturing proppants which are able to hold cracks in the rock open after pumping is completed to assist in the release of natural gases. Currently it is estimated that the Bowland-Hodder shale formation in Northern England contains on average 1-3% organic content, with up to 8% organic content in certain areas 1. Because each shale formation has a unique composition, identifying the compounds present and thus predicting the behavior of the extracted organic material in this specific shale formation relies on specialized methods developed for the field of petroleomics. Chemical formulas for complex petroleum (or shale) samples can be best identified using methods that guarantee parts-per-billion mass accuracy, ultra-high mass resolving power, and a mass range between ~50-1500 Da – these criteria are uniquely met by Fourier-Transform Ion Cyclotron Resonance (APPI FT-ICR) mass spectrometry 2 . FT-ICR MS is conducted by first ionizing a diluted sample of organic matter using either Atmospheric Pressure Photo Ionization (APPI) or Electrospray Ionization (ESI) and then pulling the ionized molecules into a mass spectrometer for m/z identification 3 . Positive ion APPI FT-ICR MS provides the highest likelihood of ionizing and characterizing the greatest number of unique organic compounds in each sample 4 so was used in this experiment. To identify unique compounds in each sample, the mass spectrometer measures the m/z ratios of tens of thousands of compounds in each sample and that data is then calibrated according to the most abundant classes in order to identify as many individual compounds as possible. Four samples from the Bowland-Hodder formation were sent to the National High Magnetic Field Laboratory for analysis using APPI FT-ICR MS at 9.4 tesla. Pieces of each sample were cleaned using a Buehler Handimet 2 Roll Grinder with Silicon Carbide abrasive paper, then put into an ultrasonic bath in acetone for approximately five minutes each. All four cleaned samples were then wrapped in aluminum foil and broken up into crushed chunks using a sledgehammer, and two of the four samples were then crushed into fine powders by placing them into a Shatterbox for 5-10 minutes each. After the samples were cleaned and either ground into powder or broken into crushed chunks, organic compounds were Soxhlet extracted using toluene (see Image 1) from both powder samples and both crushed samples. Soxhlet extraction has been described in detail in earlier analyses 5 . 143.47 g of powdered shale and 94.59 g of crushed shale were each Soxhlet extracted for nonpolar compounds using ~350 mL of toluene, and an additional 44.37 g of powdered shale was Soxhlet extracted for polar compounds using ~350 mL of equal parts methanol and dichloromethane by volume. Each extraction lasted at least 18 hours to maximize the amount of organic material that could be extracted and added to the toluene or methanol/dichloromethane solutions. Once the extraction of nonpolar and polar organic compounds using solvent extraction was complete, each sample was placed under a nitrogen blower until complete evaporation of the solvent, leaving only the organic compounds extracted from each sample. The vials containing the samples were weighed when empty and again when they contained only the extracted organic matter to measure the total mass of the extracted organic material for each of our three samples. Table 1 shows the total mass extracted and percent yield for each of the three Bowland- Hodder samples. Finally, each of our three samples (extractions from powdered shale in toluene, crushed shale in toluene, and powdered shale in methanol/dichloromethane) and a control sample were re-diluted using toluene as a dopant in the solution to increase the ionization of the organic matter in the sample during APPI FT-ICR mass spectrometry. For our control sample, we used SRM-1580, a standard shale oil sample from the Colorado Green River characterized by the National Institute of Standards and Technology (NIST) 6 , again using toluene as a dopant in the sample solution. We also compared our APPI FT-ICR mass spectrometry data to data gathered using the same process on a sample of Bordovsky shale organic matter (collected from the Eagle Ford shale formation in Texas), also diluted in toluene. All samples but the SRM-1580 sample were diluted to a concentration of 500ug/mL prior to use in the mass spectrometer. The SRM-1580 sample was diluted to a concentration of 50ug/mL. SAMPLE PREPARATION Sample Orig. Mass (g) Extracted Mass Total (mg) % Yield Powdered Shale in Toluene 143.47 259.7 0.18% Crushed Shale in Toluene 94.59 93.7 0.10% Powdered Shale in MeOH/DCM 44.37 149.5 0.34% Image 1 (top left). Three Soxhlet extractions of organic material from Bowland-Hodder shale samples. Table 1. Original mass, extracted mass, and total yield for each Bowland-Hodder Soxhlet extraction. CONCLUSIONS Figure 1. Broadband positive ion FT-ICR mass spectra for Bowland- Hodder formation shale rock pulverized into a powder and extracted with 50:50 (v:v) methylene chloride:methanol (a), toluene (b), and manually pulverized chunk extracted with toluene (c) compared to shale oil from the Colorado Green River formation (d) and Eagle Ford Texas shale formation (e). Oil samples derived from the Bowland-Hodder formation span similar molecular weight distribution from 225 < m/z < 900, centered at m/z 350, whereas the Green River shale oil distribution is shifted to lower molecular weight from 200 < m/z < 700, centered at m/z 350. Eagle Ford shale oil distribution is shifted to higher m/z from 250 < m/z < 900 and centered at m/z 550. The shift to higher molecular weight occurs with an increase in mass spectral complexity, with a nearly two-fold increase in the number of mass spectral peaks resolved and identified above six time the baseline rms noise level in the Eagle Ford shale oil. Surprisingly, the complexity remains relatively constant across all three Bowland- Hodder extracts. Figure 2 (middle left). Heteroatom class distribution for all detected species of > 0.25% relative abundance in the APPI FT- ICR mass spectra for the three Bowland- Hodder extracts, as well as the Green River and Eagle Ford shale oils. Compounds containing only carbon and hydrogen (denoted as HC) were the most abundant class for the Bowland-Hodder extract and Eagle Ford shale oil. Surprisingly, the most abundant heteroatom class in the Green River shale corresponds to compounds containing on nitrogen, which could correspond to five-member ring pyrrolic nitrogen or six-member ring pyridinnic nitrogen through APPI ionization. The increased abundance of nitrogen- containing compounds also extends to the increased relative abundance of N 1 O1, N 1 O 2 , N 1 O 3 as well as N 2 and N 2 O 1 classes in the Green River shale oil. Eagle Ford shale oil contains the highest relative abundance of sulfur-containing compounds, with the S 1 class second in relative abundance, and an increased abundance of S x O y classes compared to the other shale oils. Bowland-Hodder toluene extracts from the powder and chunk samples exhibit a similar compositional trend, with HC, N 1 , O 1 and O 2 classes as the most abundant across both samples. Bowland-Hodder pwder extracted with 50:50 (vol:vol) DCM:MeOH, however, contained a higher relative abundance of multiheteroatomic compounds on average compared to the toluene extracts. In particular, an increase in the N 2 , N 2 O 1 and S 2 O 1 indicates a preferential extraction of more polar compounds with the addition of more polar solvents in the extraction process. Further studies to probe the polar compounds selectively with electrospray ionization will be needed to further probe this selectively. More than 25,000 mass spectral peaks were identified in each of the Bowland-Hodder shale samples with resolving power m/Δm 50% = 1,500,000 at m/z 500, with molecular weight distributions 225 < m/z < 900, centered at m/z 350. The Green River shale sample included relatively lower molecular weights than the Bowland-Hodder samples, whereas the Eagle Ford shale included relatively higher molecular weights than the Bowland-Hodder samples (see Figure 1). The three most abundant classes of compounds in each of the three Bowland-Hodder samples were the HC, N 1 , and O 1 classes, in descending order of abundance, indicating consistent compound classification for each of the three Bowland-Hodder shale samples. The Eagle Ford shale sample was similar to the Bowland-Hodder samples in that its most abundant class was the HC class, but the Eagle Ford shale’s S 1 class was more abundant than any of the other four samples, with ~8.0 relative abundance. The Green River sample contained more compounds in the N1 class than any other samples, with N 1 relative abundance ~27.7, followed by the HC class with ~9.2 relative abundance (Figure 2). For all three Bowland-Hodder samples, the most abundant compounds were found between C 18 -C 29 , with average H:C ratios ~1.0 – 1.3 and average DBE values ~14-17 for the HC, N 1 , and S 1 classes. The relatively high DBE and low Carbon numbers present in the Bowland-Hodder samples indicates the presence of polyaromatic hydrocarbons, which supports previous analysis of this shale formation 7 . Figures 3-5 show isoabundance- contoured plots of double bond equivalents (DBE, top) and H:C ratio (bottom) for the HC, N 1 , and S 1 classes for three Bowland-Hodder shale extracts, Colorado Green river shale oil, and Eagle Ford shale oil obtained by APPI FT-ICR MS at 9.4 tesla. Relative-abundance weighted average DBE, H:C ratio, and carbon numbers calculated from elemental compositions are shown in red for each sample. Compared to previous analyses of shale and petroleum samples, the Bowland-Hodder shale samples contain higher average DBE 7-8 and typical numbers of identified peaks 8-9, , indicating average sample complexity and greater than average aromaticity. Figure 3. The most abundant class for all shale samples except the Green River shale corresponds to nonpolar hydrocarbon species. Bowland-Hodder shale rock extracted with toluene corresponds to hydrocarbons with carbon number ranging from C 15 to C 70 and average carbon number ~C 34 -C 35 . Aromaticity is reflected by both DBE (top) and H:C ratio (bottom), with both toluene extracts with an average DBE 14-16 (H:C ratio 1.2-1.3). The most abundant hydrocarbons contain up to 20 DBE and less than ~30 carbons, indicative of homologous series of condensed, polyaromatic hydrocarbons that correspond to Figure 4.For all three Bowland- Hodder samples, the N 1 class was the second most abundant class of compounds following the HC class. The N 1 class represented relative abundances ~10.5-18.5 for all three Bowland-Hodder samples, with relative abundances of ~5.5 in the Eagle Ford Texas shale sample. The N 1 class was the most abundant class in the Colorado Green River shale sample, with relative abundance ~27.7. The three Bowland-Hodder extracts had on average 16-17 DBE, with slightly higher average DBE = 19 in the Eagle Ford Texas sample and a lower average DBE = 9 in the Colorado Green River shale sample. The H:C ratios were consistent across both Bowland-Hodder toluene extracted Figure 5. The S 1 class accounted ~1.2-1.6 relative abundance for all three Bowland-Hodder shale extract samples. The Colorado Green River shale sample had ~2.2 relative abundance in the S 1 class, and the Eagle Ford Texas shale had a lower ~0.7 relative abundance in the S 1 class. Within the S 1 class, the average DBE for all three Bowland- Hodder samples ranges from 14-16, with the Colorado Green River Shale represented by a lower average DBE = 9 and the Eagle Ford Texas shale represented by a higher DBE = 20. The average carbon number for all three Bowland-Hodder samples in the S 1 class is between C 29 -C 32 , with the Eagle Ford Texas shale having on average a higher carbon number C 47 and the Colorado Green naphthalene cores and cycloalkane-substituted derivatives. A similar carbon number distribution (C 12 -C 65 , centered at C 34 ) and DBE distribution DBE 5-30 with average DBE = 15 occurs in the DCM:MeOH extract, although a higher abundance of more alkylated compounds extends to higher carbon number. Eagle Ford shale oil hydrocarbons contain carbon number ranging from C 20 to C 75 , with an average of C 47 , which corresponds to molecules with an average of 10 carbons more than Bowland- Hodder analogues, and DBE 5-30 with an average of 20 per molecule. The increased compositional complexity associated with higher molecular weight compounds reported in Figure 1 translates to high carbon number distribution in the Eagle Ford shale oil. Surprisingly, Colorado Green river shale oil hydrocarbons contain (on average) 20 carbon atoms less per molecule than Eagle Ford hydrocarbons, with carbon number ranging from C 12 to C 45 (relative-abundance weighted average C 27 ). Across all samples, the H:C ratio for hydrocarbon compounds ranges from more aromatic with an average H:C ratio ~ 1.2 in the Bowland-Hodder toluene extract, to more aliphatic in the Green River shale oil with an H:C ratio ~ 1.4. samples with average H:C ratios=1.0, and the average H:C ratio for the Bowland-Hodder DCM:MeOH extraction sample was very close to the other two Bowland-Hodder samples at 1.1. River shale having on average a lower carbon number C 27 . The H:C ratio for both toluene extracts from the Bowland-Hodder formation is 1.1, while the H:C ratio for the Bowland-Hodder sample extracted by DCM:MeOH is slightly higher at 1.2, and the Eagle Ford and Colorado Green River shale samples have slightly higher still H:C ratios of 1.3 and 1.4, respectively. Acknowledgements This research was sponsored by NSF Division of Materials Research (DMR-1157490) and supported by Munir Humayan, Cody Davis, and Huan Chen. References (1) Andrews, I.J. (2013). The Carboniferous Bowland Shale gas study: geology and resource estimation. British Geological Survey for Department of Energy and Climate Change, London, UK. (2) Rodgers, R.P., Schaub, T.M., & Marshall, A.G.. (2005). Petroleomics: MS Returns to Its Roots. Analytical Chemistry, January 1, 2005, 20-27. (3) McKenna, A. M. (2014, October 14). MagLab - Atmospheric Pressure Photoionization (APPI). Retrieved July 2, 2015. (4) Purcell, J.M., Hendrickson, C.L., Rodgers, R.P., & Marshall, A.G.. (2006). Atmospheric Pressure Photoionization Fourier Transform Ion Cyclotron Resonance Mass Spectrometry for Complex Mixture Analysis. Analytical Chemistry, vol. 78(16). 5906-5912. (5) Ruddy, B.M., Huettel, M., Kostka, J.E., Lobodin, V.V., Bythell, B.J., . . . Rodgers, R.P.. (2014). Targeted Petroleomics: Analytical Investigation of Macondo Well Oil Oxidation Products from Pensacola Beach. Energy & Fuels, 2014(28). 4043-4050. (6) Wise, S.A. and Watters Jr., R.L.. (2012, June 26). Standard Reference Material 1580: Organics in Shale Oil. Retrieved July 14, 2015. (7) Sommariva, R., Blake, R.S., Cuss, R.J., Cordell, R.L., Harrington, J.F., White, I.R., & Monks, P.S.. (2014). Observations of the Release of Non- methane Hydrocarbons from Fractured Shale. Environmental Science & Technology, 2014(48). 8891-8896. (8) Bae, E., Na, J., Chung, S.H., Kim, H.S., & Kim, S.. (2010). Identification of about 30,000 Chemical Components in Shale Oils by Electrospray Ionization (ESI) and Atmospheric Pressure Photoionization (APPI) Coupled with 15 T Fourier Transform Ion Cyclotron Resonance Mass Spectrometry (FT-ICR MS) and a Comparison to Conventional Oil. Energy & Fuels, 2010(24). 2563-2569. (9) McKenna, A.M., Nelson, R.K., Reddy, C.M., Savory, J.J., Kaiser, N.K., Fitzsimmons, J.E., Marshall, A.G., & Rodgers, R.P. (2013). Expansion of the Analytical Window for Oil Spill Characterization by Ultrahigh Resolution Mass Spectrometry: Beyond Gas Chromatogrpaphy. Environmental Science & Technology, 2013(47), 7530-7539.

Solvent Extraction of Organic Compounds from … Extraction of Organic Compounds from Shale Rock . ... the extraction of nonpolar and polar organic compounds using ... a standard shale

  • Upload
    lynga

  • View
    219

  • Download
    1

Embed Size (px)

Citation preview

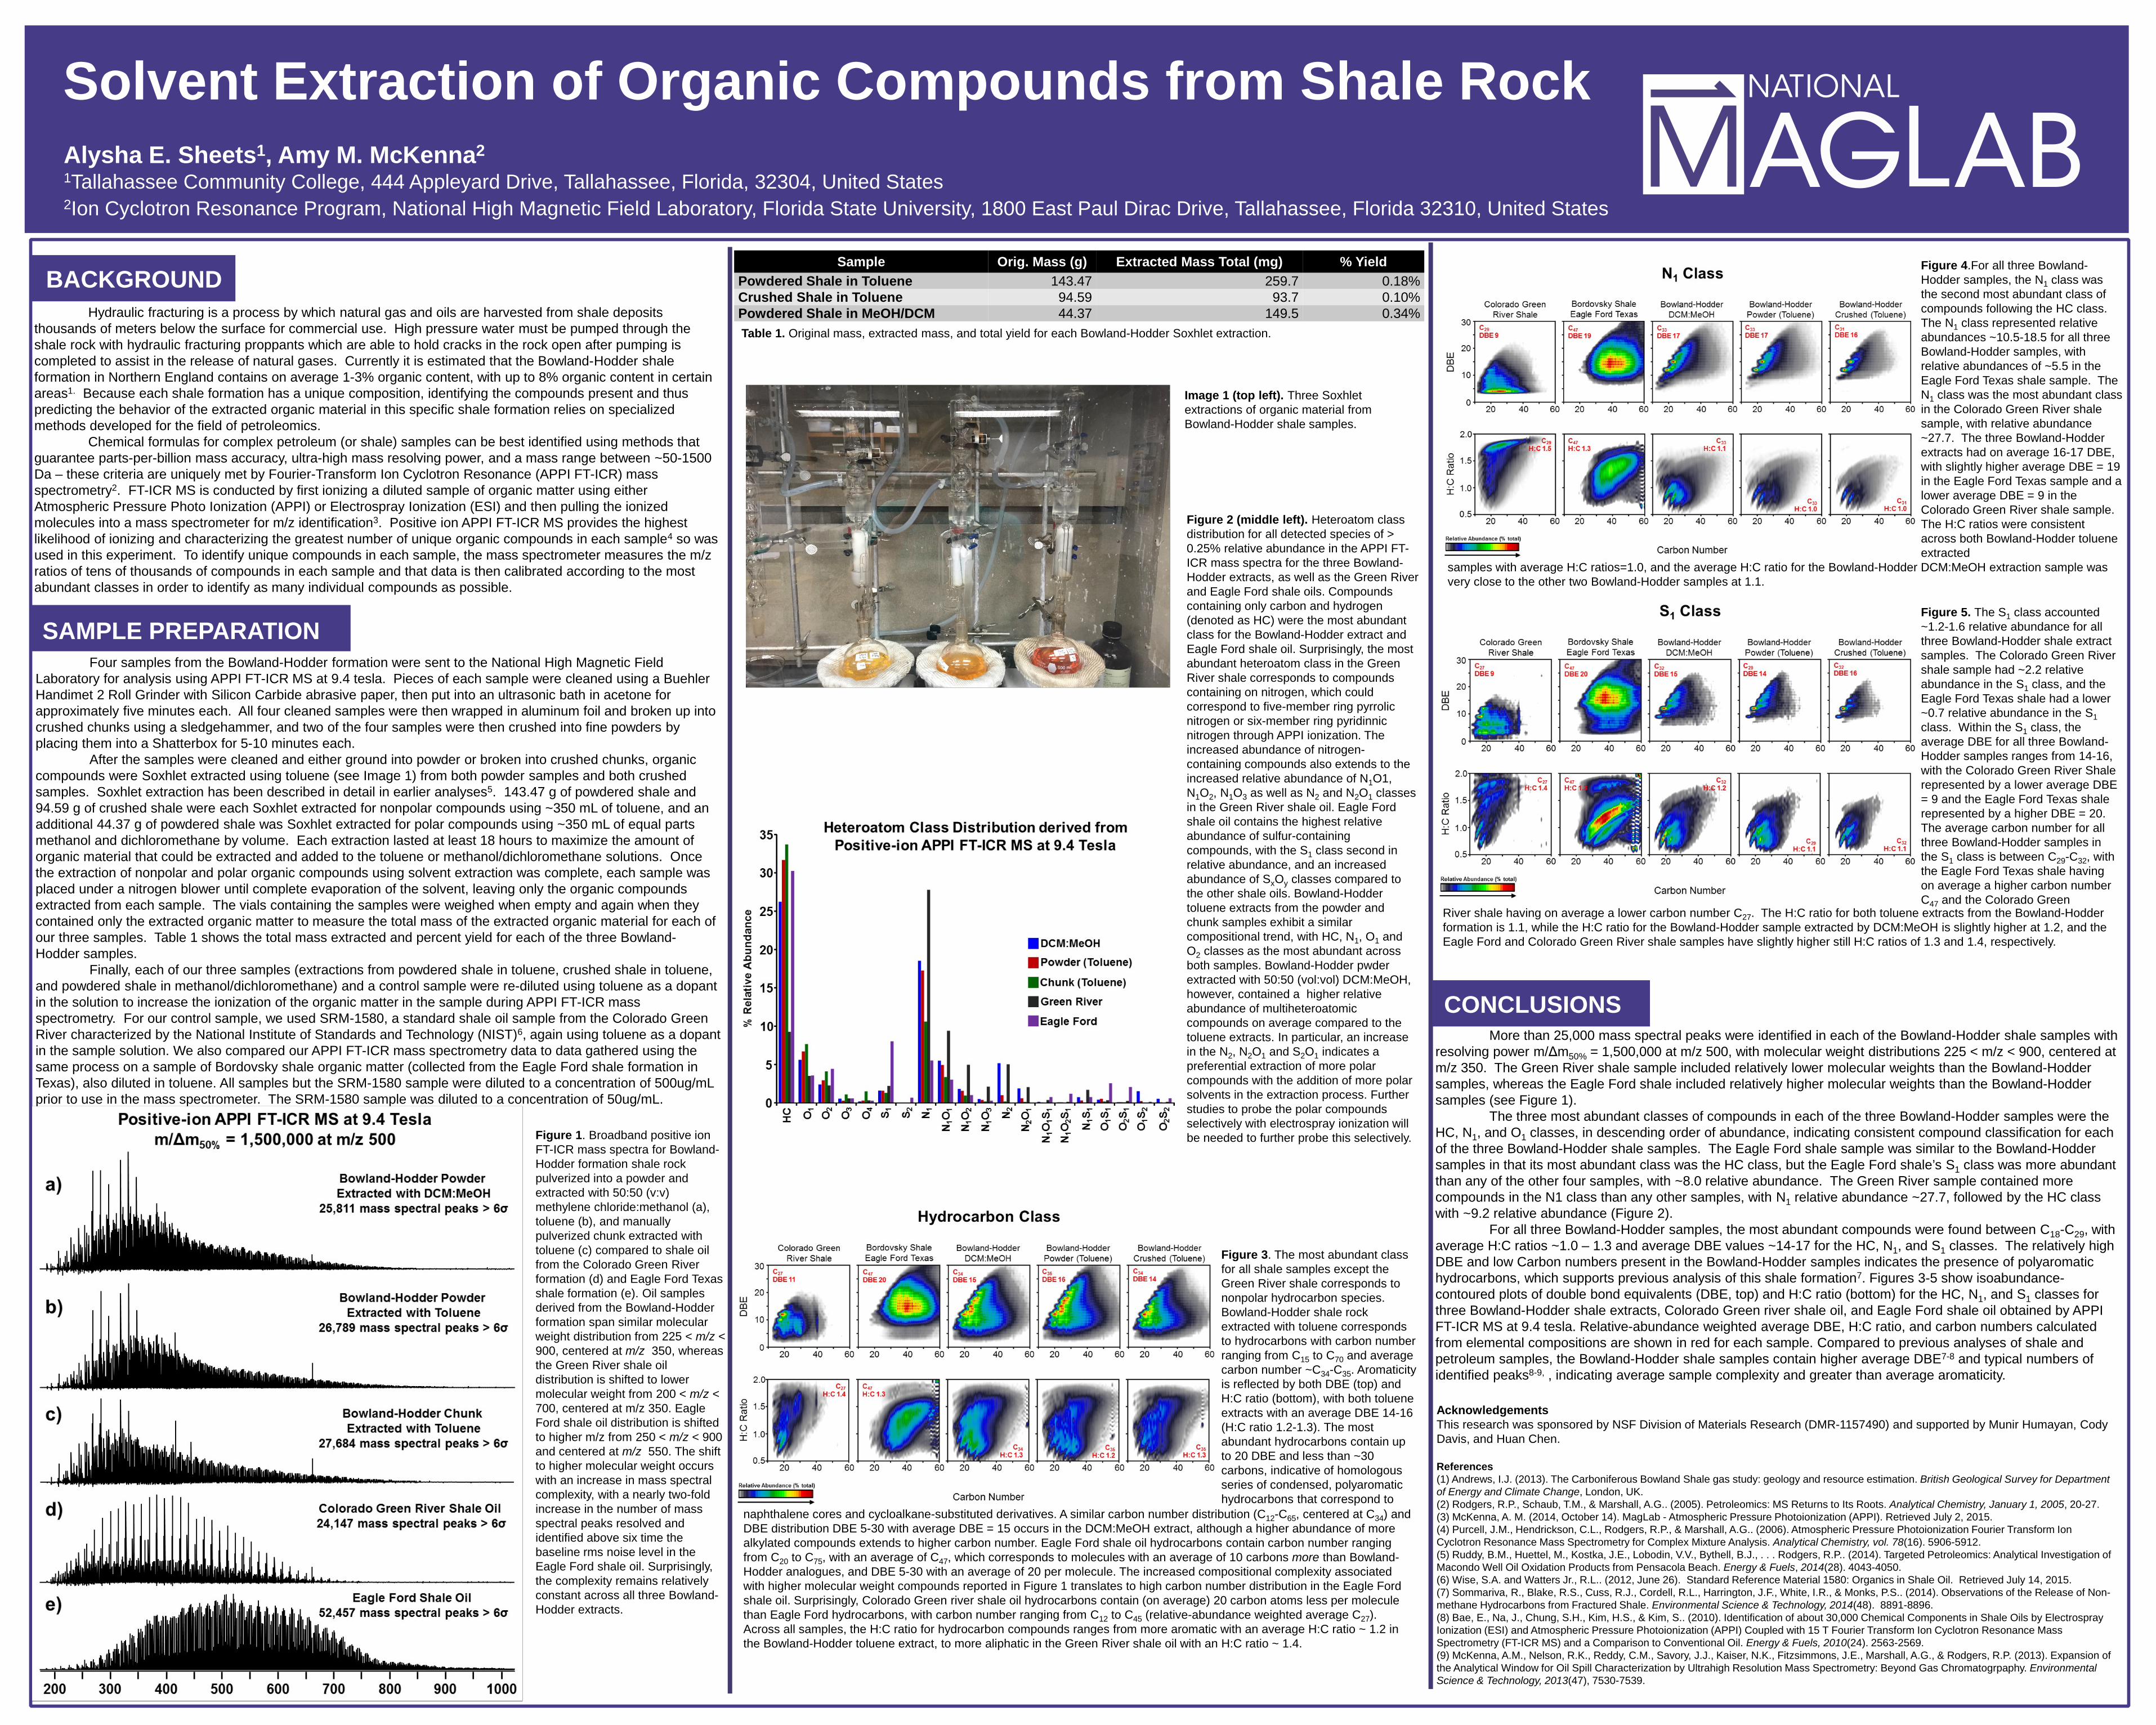
Solvent Extraction of Organic Compounds from Shale Rock Alysha E. Sheets1, Amy M. McKenna2 1Tallahassee Community College, 444 Appleyard Drive, Tallahassee, Florida, 32304, United States 2Ion Cyclotron Resonance Program, National High Magnetic Field Laboratory, Florida State University, 1800 East Paul Dirac Drive, Tallahassee, Florida 32310, United States

BACKGROUND Hydraulic fracturing is a process by which natural gas and oils are harvested from shale deposits thousands of meters below the surface for commercial use. High pressure water must be pumped through the shale rock with hydraulic fracturing proppants which are able to hold cracks in the rock open after pumping is completed to assist in the release of natural gases. Currently it is estimated that the Bowland-Hodder shale formation in Northern England contains on average 1-3% organic content, with up to 8% organic content in certain areas1. Because each shale formation has a unique composition, identifying the compounds present and thus predicting the behavior of the extracted organic material in this specific shale formation relies on specialized methods developed for the field of petroleomics. Chemical formulas for complex petroleum (or shale) samples can be best identified using methods that guarantee parts-per-billion mass accuracy, ultra-high mass resolving power, and a mass range between ~50-1500 Da – these criteria are uniquely met by Fourier-Transform Ion Cyclotron Resonance (APPI FT-ICR) mass spectrometry2. FT-ICR MS is conducted by first ionizing a diluted sample of organic matter using either Atmospheric Pressure Photo Ionization (APPI) or Electrospray Ionization (ESI) and then pulling the ionized molecules into a mass spectrometer for m/z identification3. Positive ion APPI FT-ICR MS provides the highest likelihood of ionizing and characterizing the greatest number of unique organic compounds in each sample4 so was used in this experiment. To identify unique compounds in each sample, the mass spectrometer measures the m/z ratios of tens of thousands of compounds in each sample and that data is then calibrated according to the most abundant classes in order to identify as many individual compounds as possible.

Four samples from the Bowland-Hodder formation were sent to the National High Magnetic Field Laboratory for analysis using APPI FT-ICR MS at 9.4 tesla. Pieces of each sample were cleaned using a Buehler Handimet 2 Roll Grinder with Silicon Carbide abrasive paper, then put into an ultrasonic bath in acetone for approximately five minutes each. All four cleaned samples were then wrapped in aluminum foil and broken up into crushed chunks using a sledgehammer, and two of the four samples were then crushed into fine powders by placing them into a Shatterbox for 5-10 minutes each. After the samples were cleaned and either ground into powder or broken into crushed chunks, organic compounds were Soxhlet extracted using toluene (see Image 1) from both powder samples and both crushed samples. Soxhlet extraction has been described in detail in earlier analyses5. 143.47 g of powdered shale and 94.59 g of crushed shale were each Soxhlet extracted for nonpolar compounds using ~350 mL of toluene, and an additional 44.37 g of powdered shale was Soxhlet extracted for polar compounds using ~350 mL of equal parts methanol and dichloromethane by volume. Each extraction lasted at least 18 hours to maximize the amount of organic material that could be extracted and added to the toluene or methanol/dichloromethane solutions. Once the extraction of nonpolar and polar organic compounds using solvent extraction was complete, each sample was placed under a nitrogen blower until complete evaporation of the solvent, leaving only the organic compounds extracted from each sample. The vials containing the samples were weighed when empty and again when they contained only the extracted organic matter to measure the total mass of the extracted organic material for each of our three samples. Table 1 shows the total mass extracted and percent yield for each of the three Bowland-Hodder samples. Finally, each of our three samples (extractions from powdered shale in toluene, crushed shale in toluene, and powdered shale in methanol/dichloromethane) and a control sample were re-diluted using toluene as a dopant in the solution to increase the ionization of the organic matter in the sample during APPI FT-ICR mass spectrometry. For our control sample, we used SRM-1580, a standard shale oil sample from the Colorado Green River characterized by the National Institute of Standards and Technology (NIST)6, again using toluene as a dopant in the sample solution. We also compared our APPI FT-ICR mass spectrometry data to data gathered using the same process on a sample of Bordovsky shale organic matter (collected from the Eagle Ford shale formation in Texas), also diluted in toluene. All samples but the SRM-1580 sample were diluted to a concentration of 500ug/mL prior to use in the mass spectrometer. The SRM-1580 sample was diluted to a concentration of 50ug/mL.

SAMPLE PREPARATION

Sample Orig. Mass (g) Extracted Mass Total (mg) % Yield Powdered Shale in Toluene 143.47 259.7 0.18% Crushed Shale in Toluene 94.59 93.7 0.10% Powdered Shale in MeOH/DCM 44.37 149.5 0.34%

Image 1 (top left). Three Soxhlet extractions of organic material from Bowland-Hodder shale samples.

Table 1. Original mass, extracted mass, and total yield for each Bowland-Hodder Soxhlet extraction.

CONCLUSIONS

Figure 1. Broadband positive ion FT-ICR mass spectra for Bowland-Hodder formation shale rock pulverized into a powder and extracted with 50:50 (v:v) methylene chloride:methanol (a), toluene (b), and manually pulverized chunk extracted with toluene (c) compared to shale oil from the Colorado Green River formation (d) and Eagle Ford Texas shale formation (e). Oil samples derived from the Bowland-Hodder formation span similar molecular weight distribution from 225 < m/z < 900, centered at m/z 350, whereas the Green River shale oil distribution is shifted to lower molecular weight from 200 < m/z < 700, centered at m/z 350. Eagle Ford shale oil distribution is shifted to higher m/z from 250 < m/z < 900 and centered at m/z 550. The shift to higher molecular weight occurs with an increase in mass spectral complexity, with a nearly two-fold increase in the number of mass spectral peaks resolved and identified above six time the baseline rms noise level in the Eagle Ford shale oil. Surprisingly, the complexity remains relatively constant across all three Bowland-Hodder extracts.

Figure 2 (middle left). Heteroatom class distribution for all detected species of > 0.25% relative abundance in the APPI FT-ICR mass spectra for the three Bowland-Hodder extracts, as well as the Green River and Eagle Ford shale oils. Compounds containing only carbon and hydrogen (denoted as HC) were the most abundant class for the Bowland-Hodder extract and Eagle Ford shale oil. Surprisingly, the most abundant heteroatom class in the Green River shale corresponds to compounds containing on nitrogen, which could correspond to five-member ring pyrrolic nitrogen or six-member ring pyridinnic nitrogen through APPI ionization. The increased abundance of nitrogen-containing compounds also extends to the increased relative abundance of N1O1, N1O2, N1O3 as well as N2 and N2O1 classes in the Green River shale oil. Eagle Ford shale oil contains the highest relative abundance of sulfur-containing compounds, with the S1 class second in relative abundance, and an increased abundance of SxOy classes compared to the other shale oils. Bowland-Hodder toluene extracts from the powder and chunk samples exhibit a similar compositional trend, with HC, N1, O1 and O2 classes as the most abundant across both samples. Bowland-Hodder pwder extracted with 50:50 (vol:vol) DCM:MeOH, however, contained a higher relative abundance of multiheteroatomic compounds on average compared to the toluene extracts. In particular, an increase in the N2, N2O1 and S2O1 indicates a preferential extraction of more polar compounds with the addition of more polar solvents in the extraction process. Further studies to probe the polar compounds selectively with electrospray ionization will be needed to further probe this selectively.

More than 25,000 mass spectral peaks were identified in each of the Bowland-Hodder shale samples with resolving power m/Δm50% = 1,500,000 at m/z 500, with molecular weight distributions 225 < m/z < 900, centered at m/z 350. The Green River shale sample included relatively lower molecular weights than the Bowland-Hodder samples, whereas the Eagle Ford shale included relatively higher molecular weights than the Bowland-Hodder samples (see Figure 1). The three most abundant classes of compounds in each of the three Bowland-Hodder samples were the HC, N1, and O1 classes, in descending order of abundance, indicating consistent compound classification for each of the three Bowland-Hodder shale samples. The Eagle Ford shale sample was similar to the Bowland-Hodder samples in that its most abundant class was the HC class, but the Eagle Ford shale’s S1 class was more abundant than any of the other four samples, with ~8.0 relative abundance. The Green River sample contained more compounds in the N1 class than any other samples, with N1 relative abundance ~27.7, followed by the HC class with ~9.2 relative abundance (Figure 2). For all three Bowland-Hodder samples, the most abundant compounds were found between C18-C29, with average H:C ratios ~1.0 – 1.3 and average DBE values ~14-17 for the HC, N1, and S1 classes. The relatively high DBE and low Carbon numbers present in the Bowland-Hodder samples indicates the presence of polyaromatic hydrocarbons, which supports previous analysis of this shale formation7. Figures 3-5 show isoabundance-contoured plots of double bond equivalents (DBE, top) and H:C ratio (bottom) for the HC, N1, and S1 classes for three Bowland-Hodder shale extracts, Colorado Green river shale oil, and Eagle Ford shale oil obtained by APPI FT-ICR MS at 9.4 tesla. Relative-abundance weighted average DBE, H:C ratio, and carbon numbers calculated from elemental compositions are shown in red for each sample. Compared to previous analyses of shale and petroleum samples, the Bowland-Hodder shale samples contain higher average DBE7-8 and typical numbers of identified peaks8-9, , indicating average sample complexity and greater than average aromaticity.

Figure 3. The most abundant class for all shale samples except the Green River shale corresponds to nonpolar hydrocarbon species. Bowland-Hodder shale rock extracted with toluene corresponds to hydrocarbons with carbon number ranging from C15 to C70 and average carbon number ~C34-C35. Aromaticity is reflected by both DBE (top) and H:C ratio (bottom), with both toluene extracts with an average DBE 14-16 (H:C ratio 1.2-1.3). The most abundant hydrocarbons contain up to 20 DBE and less than ~30 carbons, indicative of homologous series of condensed, polyaromatic hydrocarbons that correspond to

Figure 4.For all three Bowland-Hodder samples, the N1 class was the second most abundant class of compounds following the HC class. The N1 class represented relative abundances ~10.5-18.5 for all three Bowland-Hodder samples, with relative abundances of ~5.5 in the Eagle Ford Texas shale sample. The N1 class was the most abundant class in the Colorado Green River shale sample, with relative abundance ~27.7. The three Bowland-Hodder extracts had on average 16-17 DBE, with slightly higher average DBE = 19 in the Eagle Ford Texas sample and a lower average DBE = 9 in the Colorado Green River shale sample. The H:C ratios were consistent across both Bowland-Hodder toluene extracted

Figure 5. The S1 class accounted ~1.2-1.6 relative abundance for all three Bowland-Hodder shale extract samples. The Colorado Green River shale sample had ~2.2 relative abundance in the S1 class, and the Eagle Ford Texas shale had a lower ~0.7 relative abundance in the S1 class. Within the S1 class, the average DBE for all three Bowland-Hodder samples ranges from 14-16, with the Colorado Green River Shale represented by a lower average DBE = 9 and the Eagle Ford Texas shale represented by a higher DBE = 20. The average carbon number for all three Bowland-Hodder samples in the S1 class is between C29-C32, with the Eagle Ford Texas shale having on average a higher carbon number C47 and the Colorado Green

naphthalene cores and cycloalkane-substituted derivatives. A similar carbon number distribution (C12-C65, centered at C34) and DBE distribution DBE 5-30 with average DBE = 15 occurs in the DCM:MeOH extract, although a higher abundance of more alkylated compounds extends to higher carbon number. Eagle Ford shale oil hydrocarbons contain carbon number ranging from C20 to C75, with an average of C47, which corresponds to molecules with an average of 10 carbons more than Bowland-Hodder analogues, and DBE 5-30 with an average of 20 per molecule. The increased compositional complexity associated with higher molecular weight compounds reported in Figure 1 translates to high carbon number distribution in the Eagle Ford shale oil. Surprisingly, Colorado Green river shale oil hydrocarbons contain (on average) 20 carbon atoms less per molecule than Eagle Ford hydrocarbons, with carbon number ranging from C12 to C45 (relative-abundance weighted average C27). Across all samples, the H:C ratio for hydrocarbon compounds ranges from more aromatic with an average H:C ratio ~ 1.2 in the Bowland-Hodder toluene extract, to more aliphatic in the Green River shale oil with an H:C ratio ~ 1.4.

samples with average H:C ratios=1.0, and the average H:C ratio for the Bowland-Hodder DCM:MeOH extraction sample was very close to the other two Bowland-Hodder samples at 1.1.

River shale having on average a lower carbon number C27. The H:C ratio for both toluene extracts from the Bowland-Hodder formation is 1.1, while the H:C ratio for the Bowland-Hodder sample extracted by DCM:MeOH is slightly higher at 1.2, and the Eagle Ford and Colorado Green River shale samples have slightly higher still H:C ratios of 1.3 and 1.4, respectively.

Acknowledgements This research was sponsored by NSF Division of Materials Research (DMR-1157490) and supported by Munir Humayan, Cody Davis, and Huan Chen. References (1) Andrews, I.J. (2013). The Carboniferous Bowland Shale gas study: geology and resource estimation. British Geological Survey for Department of Energy and Climate Change, London, UK. (2) Rodgers, R.P., Schaub, T.M., & Marshall, A.G.. (2005). Petroleomics: MS Returns to Its Roots. Analytical Chemistry, January 1, 2005, 20-27. (3) McKenna, A. M. (2014, October 14). MagLab - Atmospheric Pressure Photoionization (APPI). Retrieved July 2, 2015. (4) Purcell, J.M., Hendrickson, C.L., Rodgers, R.P., & Marshall, A.G.. (2006). Atmospheric Pressure Photoionization Fourier Transform Ion Cyclotron Resonance Mass Spectrometry for Complex Mixture Analysis. Analytical Chemistry, vol. 78(16). 5906-5912. (5) Ruddy, B.M., Huettel, M., Kostka, J.E., Lobodin, V.V., Bythell, B.J., . . . Rodgers, R.P.. (2014). Targeted Petroleomics: Analytical Investigation of Macondo Well Oil Oxidation Products from Pensacola Beach. Energy & Fuels, 2014(28). 4043-4050. (6) Wise, S.A. and Watters Jr., R.L.. (2012, June 26). Standard Reference Material 1580: Organics in Shale Oil. Retrieved July 14, 2015. (7) Sommariva, R., Blake, R.S., Cuss, R.J., Cordell, R.L., Harrington, J.F., White, I.R., & Monks, P.S.. (2014). Observations of the Release of Non-methane Hydrocarbons from Fractured Shale. Environmental Science & Technology, 2014(48). 8891-8896. (8) Bae, E., Na, J., Chung, S.H., Kim, H.S., & Kim, S.. (2010). Identification of about 30,000 Chemical Components in Shale Oils by Electrospray Ionization (ESI) and Atmospheric Pressure Photoionization (APPI) Coupled with 15 T Fourier Transform Ion Cyclotron Resonance Mass Spectrometry (FT-ICR MS) and a Comparison to Conventional Oil. Energy & Fuels, 2010(24). 2563-2569. (9) McKenna, A.M., Nelson, R.K., Reddy, C.M., Savory, J.J., Kaiser, N.K., Fitzsimmons, J.E., Marshall, A.G., & Rodgers, R.P. (2013). Expansion of the Analytical Window for Oil Spill Characterization by Ultrahigh Resolution Mass Spectrometry: Beyond Gas Chromatogrpaphy. Environmental Science & Technology, 2013(47), 7530-7539.