Embed Size (px)
DESCRIPTION
Analysis of Heterojunction Bipolar Transistors. Outline. 3-D Structure of Single Finger and Three Fingers C-up HBT A 3-D modal of single finger and three fingers C-up HBT Adjust the Thickness of PHS Layer and GaAs Substrate Compare with the results of 2- D modal - PowerPoint PPT Presentation
Citation preview

1
Analysis Analysis ofof Heterojunction Bipolar Heterojunction Bipolar TransistorsTransistors
2
OutlineOutline
3-D Structure of Single Finger and Three Fingers3-D Structure of Single Finger and Three Fingers C-up HBTC-up HBT
A 3-D modal of single finger and three fingers C-up HBT
Adjust the Thickness of PHS Layer and GaAs Substrate
Compare with the results of 2- D modal
The results under the different boundary condition
ConclusionConclusion
3-D Structure of Single Finger C-up HBT3-D Structure of Single Finger C-up HBT
4
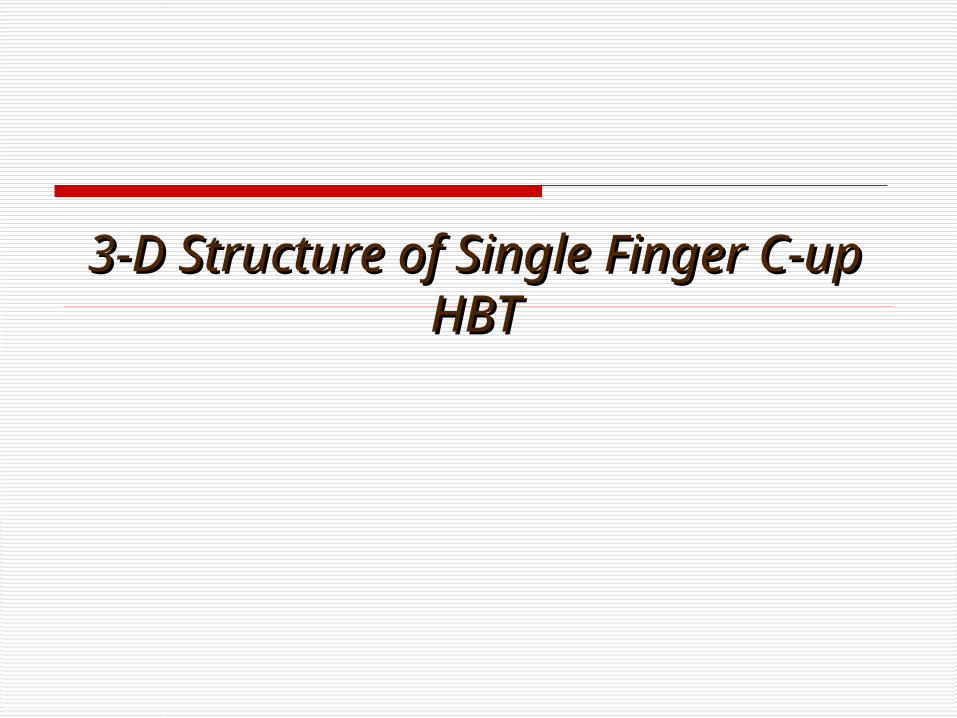
A 3-D Modal of Single Finger C-up HBTA 3-D Modal of Single Finger C-up HBT
5
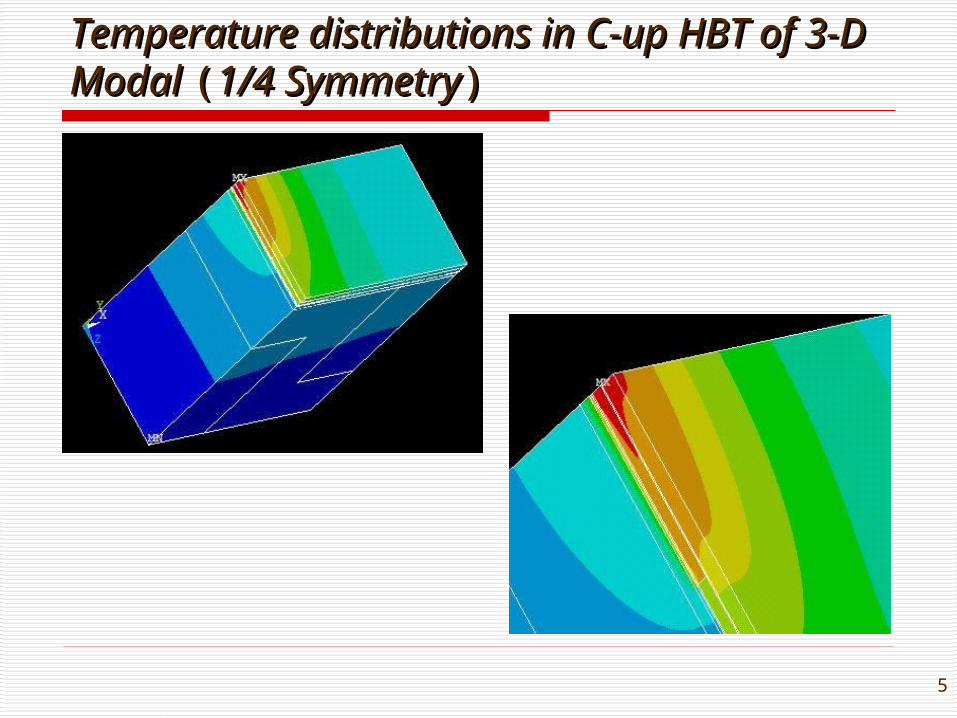
Temperature distributions in C-up HBT of 3-D Temperature distributions in C-up HBT of 3-D Modal Modal ((1/4 Symmetry1/4 Symmetry))
6
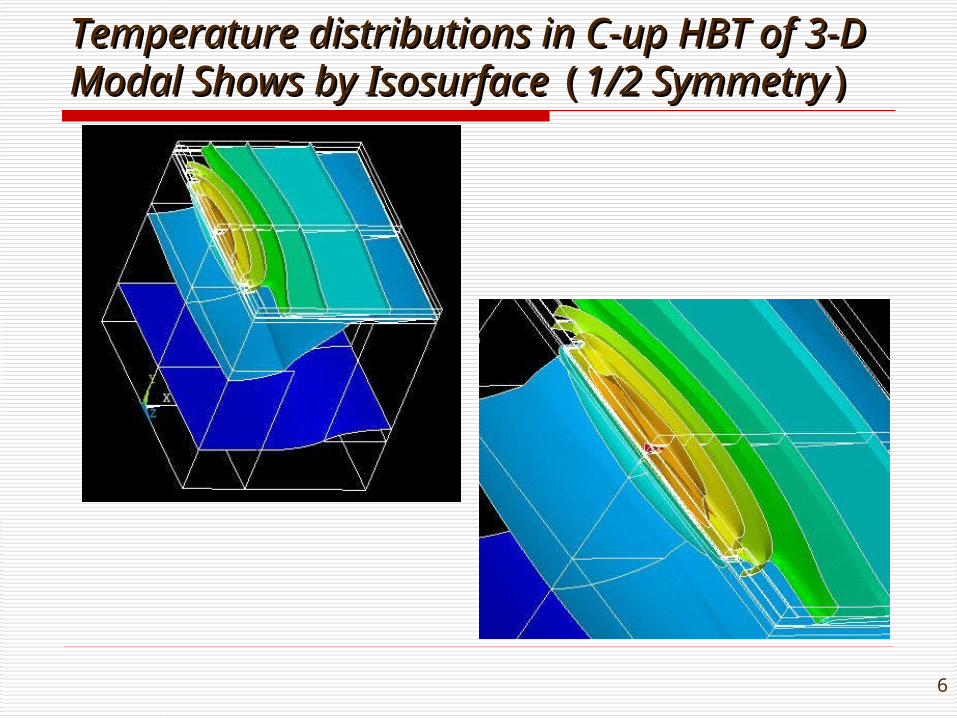
Temperature distributions in C-up HBT of 3-D Temperature distributions in C-up HBT of 3-D Modal Shows by Isosurface Modal Shows by Isosurface ((1/2 Symmetry1/2 Symmetry))
7
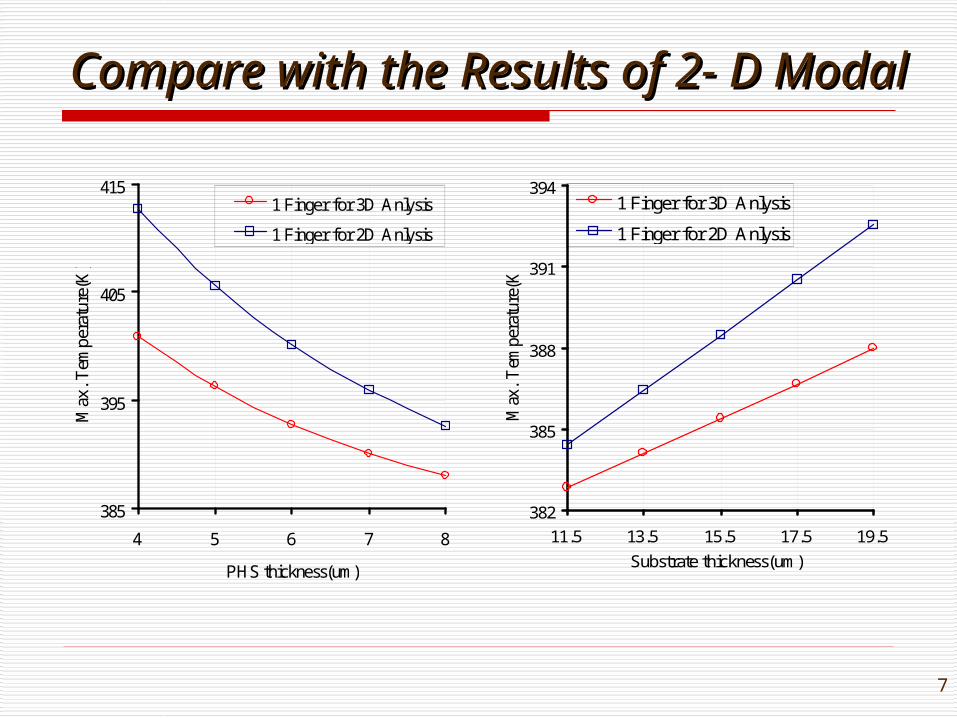
Compare with the Results of 2- D ModalCompare with the Results of 2- D Modal
385
395
405
415
4 5 6 7 8
PHS thickness(um)
Max
. Tem
pera
ture
(K)
1 Finger for 3D Anlysis
1 Finger for 2D Anlysis
382
385
388
391
394
11.5 13.5 15.5 17.5 19.5
Substrate thickness(um)
Max
. T
empe
ratu
re(K
)
1 Finger for 3D Anlysis
1 Finger for 2D Anlysis
8
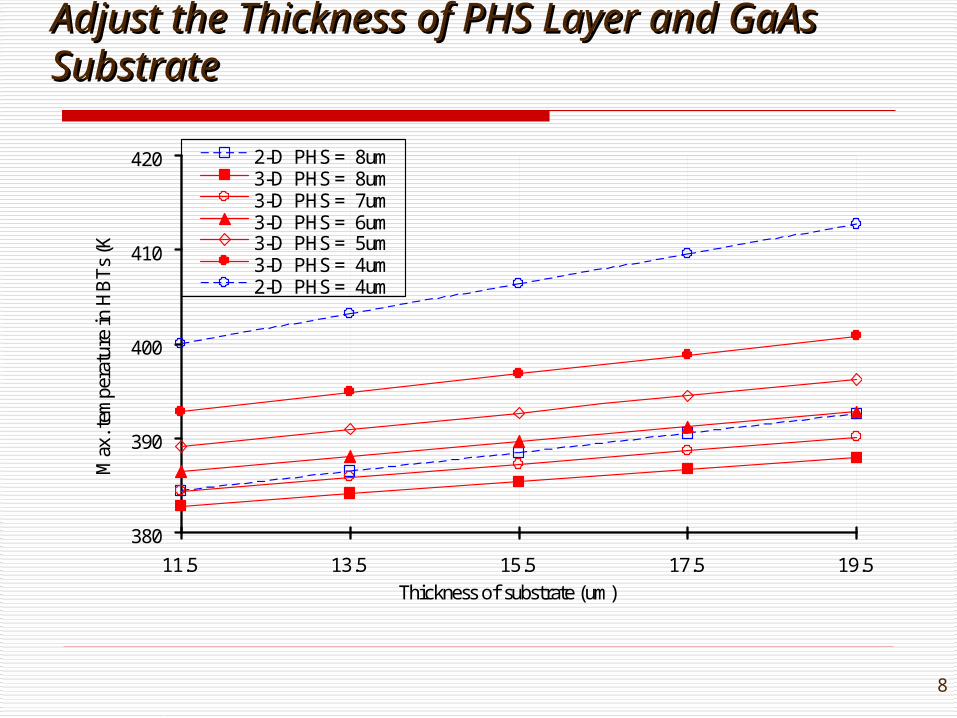
Adjust the Thickness of PHS Layer and GaAs SubstrateAdjust the Thickness of PHS Layer and GaAs Substrate
380
390
400
410
420
11.5 13.5 15.5 17.5 19.5
Thickness of substrate (um)
Max
. tem
pera
ture
in H
BT
s (K
)
2-D PHS = 8um3-D PHS = 8um3-D PHS = 7um3-D PHS = 6um3-D PHS = 5um3-D PHS = 4um2-D PHS = 4um
9
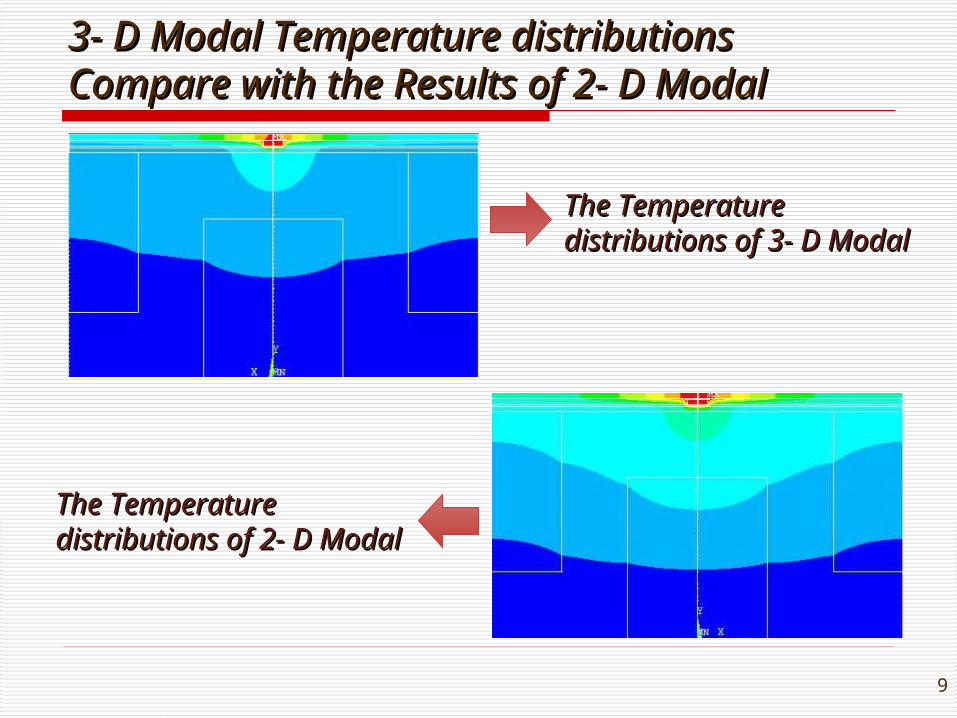
3- D Modal Temperature distributions Compare 3- D Modal Temperature distributions Compare with the Results of 2- D Modalwith the Results of 2- D Modal
The Temperature distributions The Temperature distributions of 3- D Modalof 3- D Modal
The Temperature distributions The Temperature distributions of 2- D Modalof 2- D Modal
10
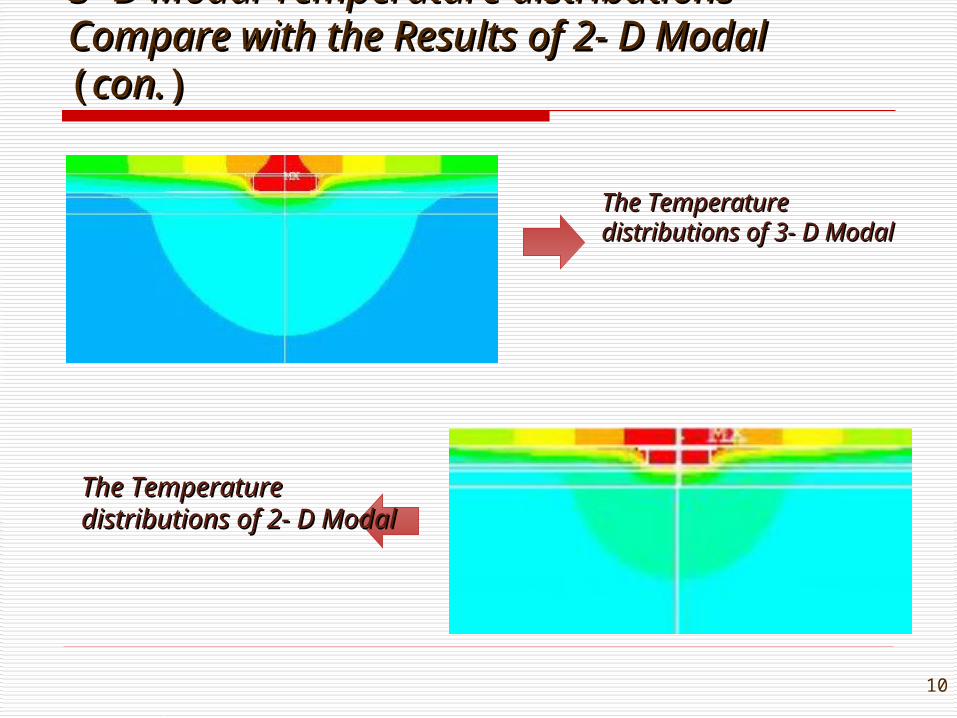
3- D Modal Temperature distributions Compare 3- D Modal Temperature distributions Compare with the Results of 2- D Modalwith the Results of 2- D Modal ( (con.con.))
The Temperature The Temperature distributions of 3- D Modaldistributions of 3- D Modal
The Temperature The Temperature distributions of 2- D Modaldistributions of 2- D Modal

11
Comparison of temperature distribution in C-up HBT Comparison of temperature distribution in C-up HBT
with a thicker and a thinner thermal viawith a thicker and a thinner thermal via
Original thicker thermal via :Substrate = 19.5um ; PHS =8um
A thinner thermal via :Substrate = 13.5um ; PHS =6um
298.5 398
3-D Structure of Three3-D Structure of Three Finger C-up HBTFinger C-up HBT
13
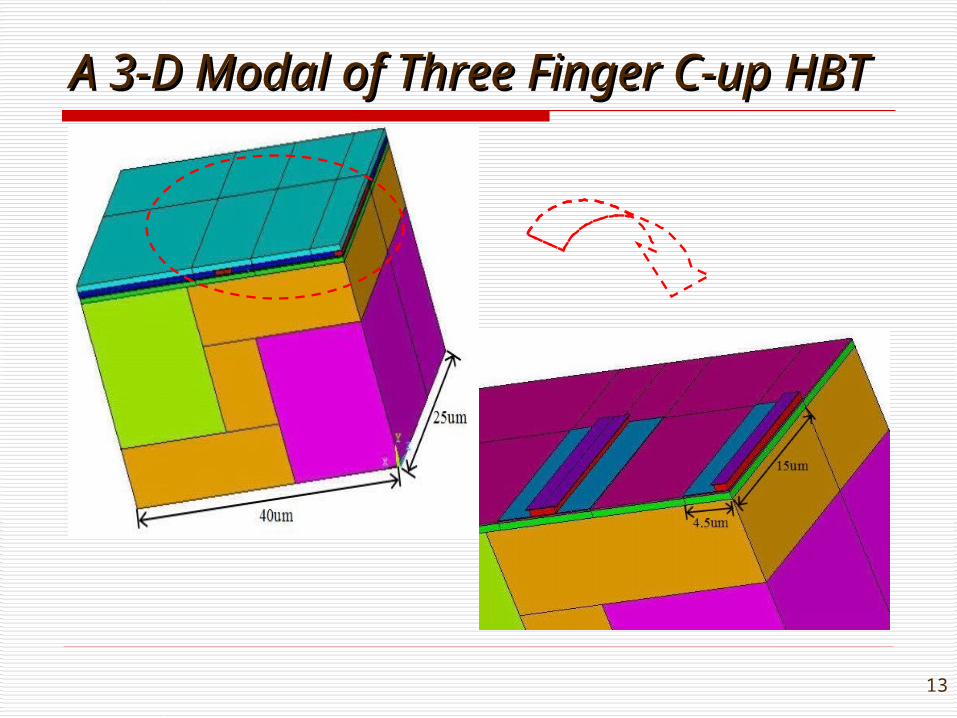
A 3-D Modal of Three Finger C-up HBTA 3-D Modal of Three Finger C-up HBT
14
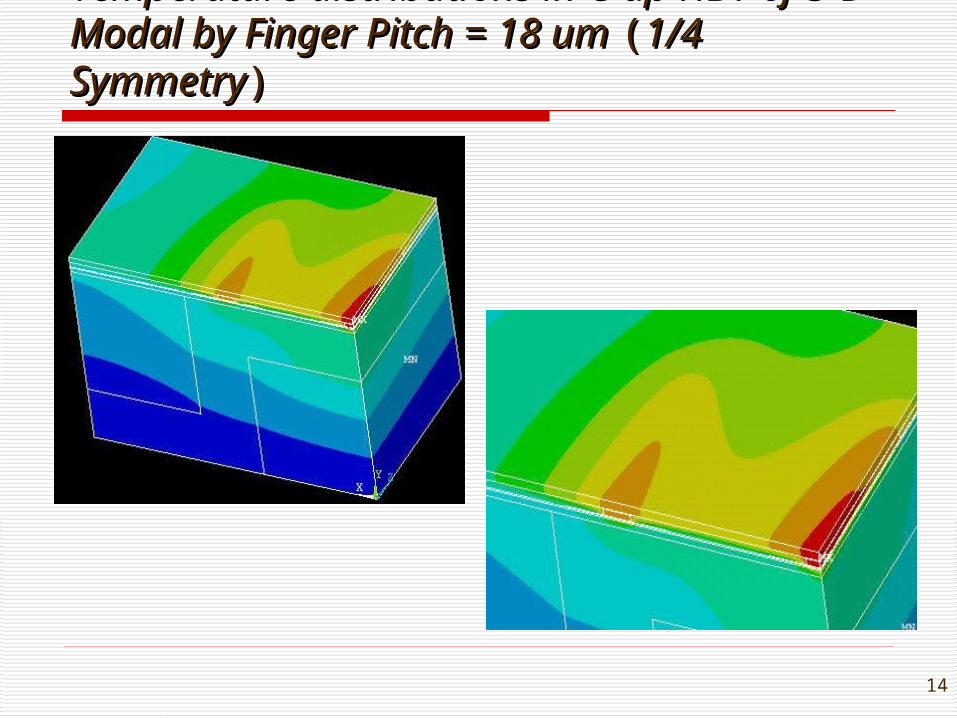
Temperature distributions in C-up HBT of 3-D Temperature distributions in C-up HBT of 3-D Modal by Finger Pitch = 18 um Modal by Finger Pitch = 18 um ((1/4 Symmetry1/4 Symmetry))
15
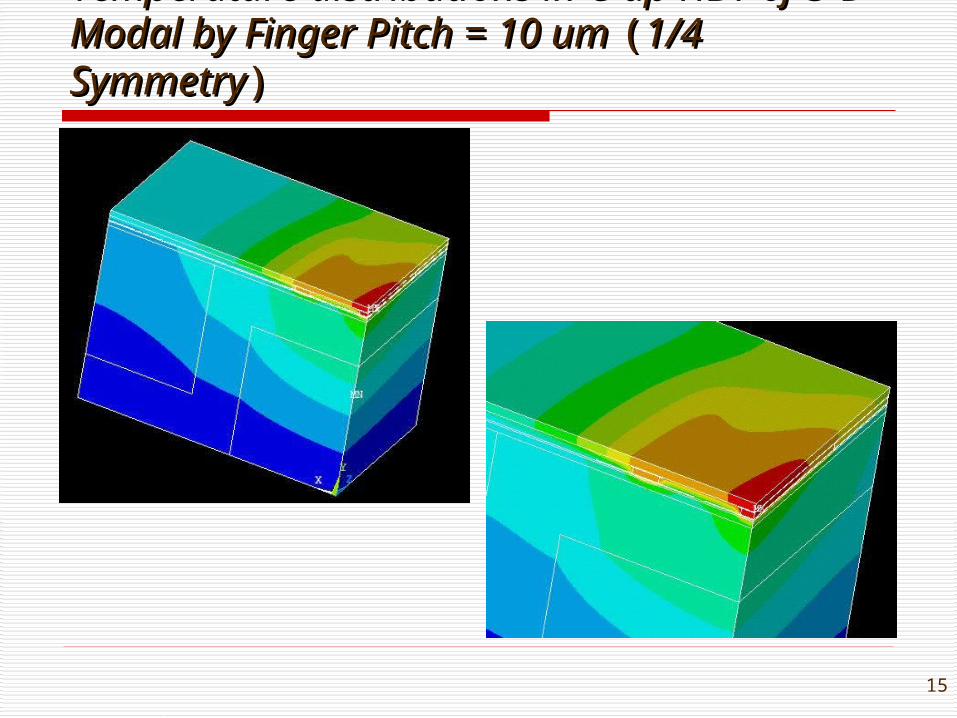
Temperature distributions in C-up HBT of 3-D Temperature distributions in C-up HBT of 3-D Modal by Finger Pitch = 10 um Modal by Finger Pitch = 10 um ((1/4 Symmetry1/4 Symmetry))
16
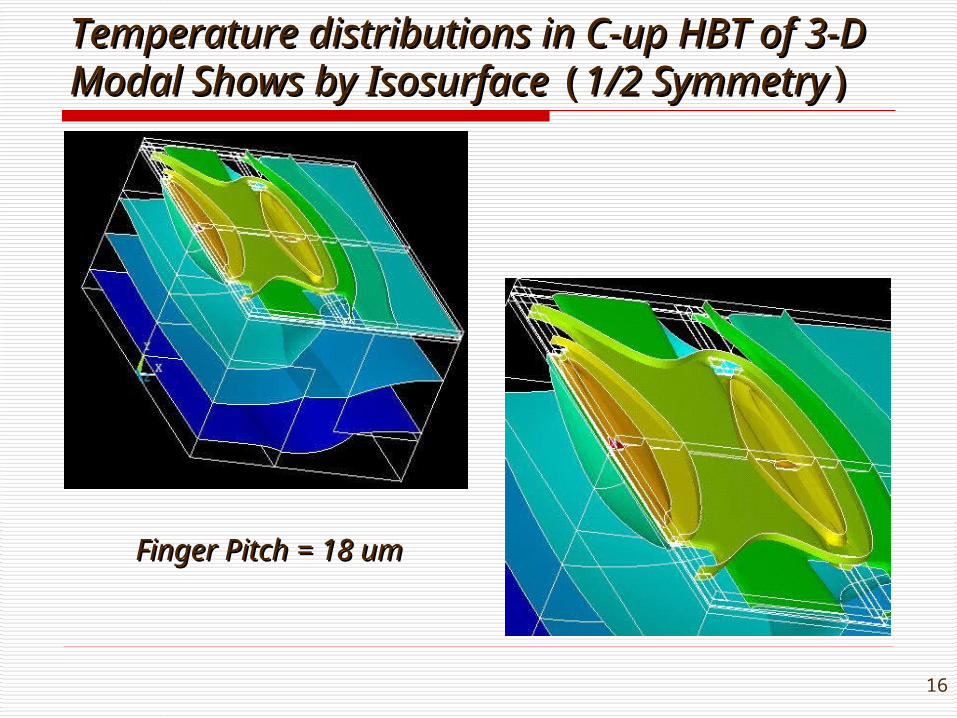
Temperature distributions in C-up HBT of 3-D Temperature distributions in C-up HBT of 3-D Modal Shows by Isosurface Modal Shows by Isosurface ((1/2 Symmetry1/2 Symmetry))
Finger Pitch = 18 umFinger Pitch = 18 um
17
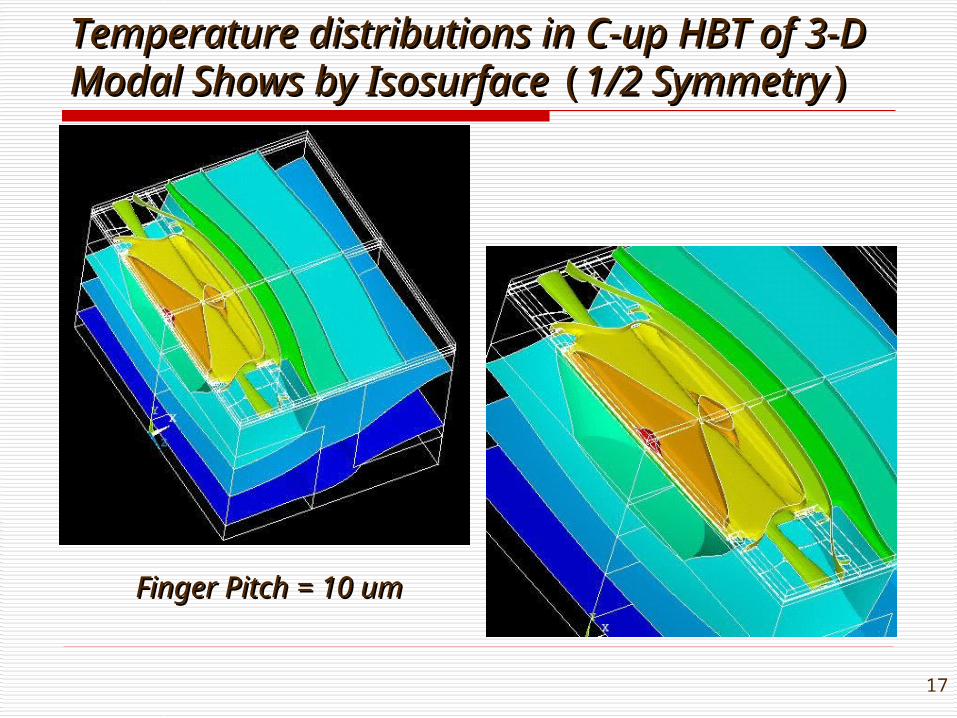
Temperature distributions in C-up HBT of 3-D Temperature distributions in C-up HBT of 3-D Modal Shows by Isosurface Modal Shows by Isosurface ((1/2 Symmetry1/2 Symmetry))
Finger Pitch = 10 umFinger Pitch = 10 um
18
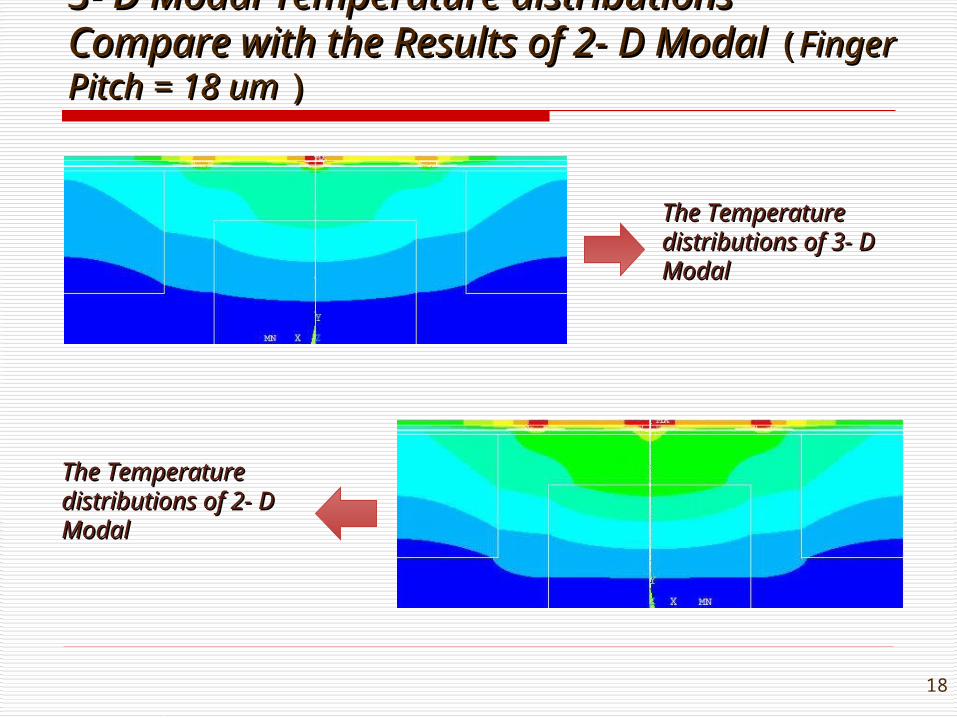
3- D Modal Temperature distributions Compare 3- D Modal Temperature distributions Compare with the Results of 2- D Modal with the Results of 2- D Modal ((Finger Pitch = 18 um Finger Pitch = 18 um ))
The Temperature The Temperature distributions of 3- D distributions of 3- D ModalModal
The Temperature The Temperature distributions of 2- D distributions of 2- D ModalModal
19
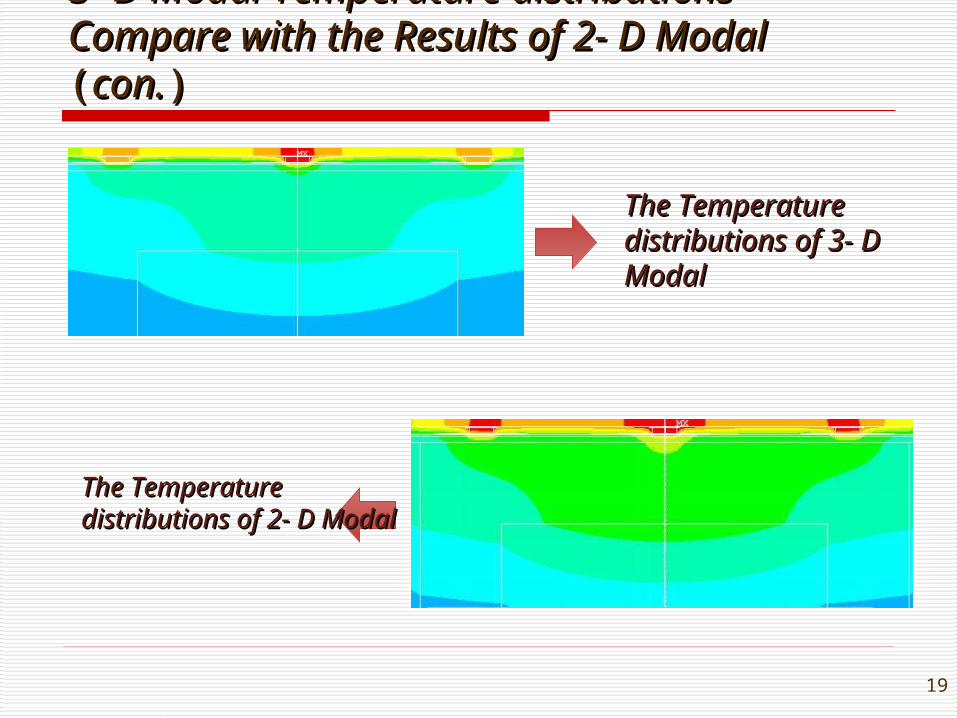
3- D Modal Temperature distributions Compare 3- D Modal Temperature distributions Compare with the Results of 2- D Modalwith the Results of 2- D Modal ( (con.con.))
The Temperature The Temperature distributions of 3- D distributions of 3- D ModalModal
The Temperature The Temperature distributions of 2- D Modaldistributions of 2- D Modal
20
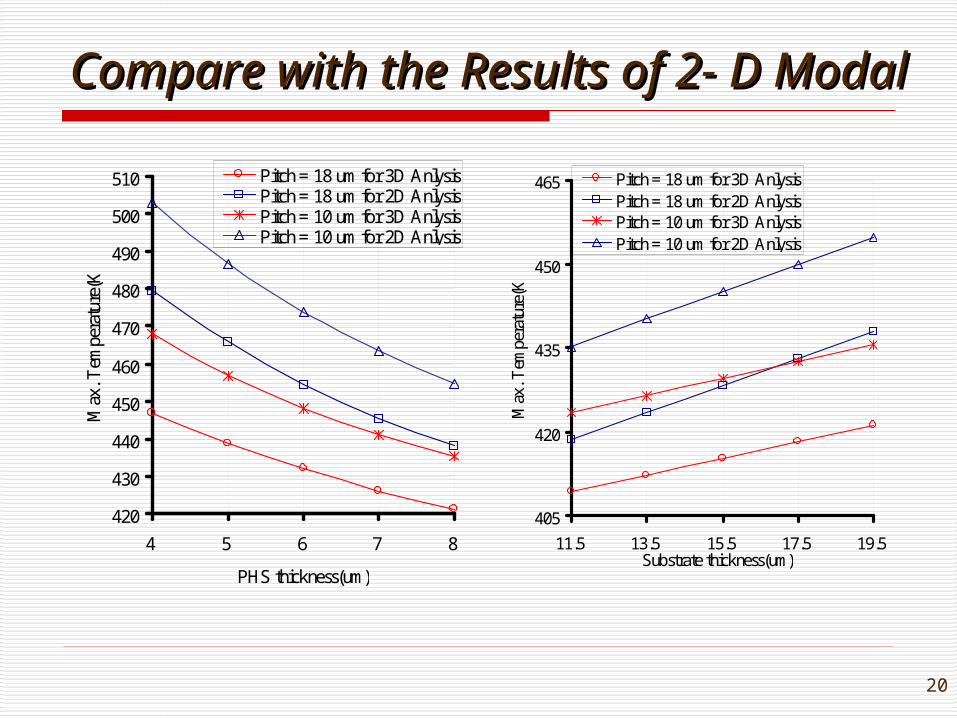
Compare with the Results of 2- D ModalCompare with the Results of 2- D Modal
420
430
440
450
460
470
480
490
500
510
4 5 6 7 8
PHS thickness(um)
Max
. Tem
pera
ture
(K)
Pitch = 18 um for 3D AnlysisPitch = 18 um for 2D AnlysisPitch = 10 um for 3D AnlysisPitch = 10 um for 2D Anlysis
405
420
435
450
465
11.5 13.5 15.5 17.5 19.5Substrate thickness(um)
Max
. Tem
pera
ture
(K)
Pitch = 18 um for 3D AnlysisPitch = 18 um for 2D AnlysisPitch = 10 um for 3D AnlysisPitch = 10 um for 2D Anlysis

21
ConclusionConclusion
The relation of maximum temperature to substrate thickness
is linear, and the relation of maximum temperature to PHS
thickness is a cubic equation in 2D and 3D analysis.
The temperature distribution of 3D modal is similar to 2D
modal, but the result of 2D modal is higher than that of 3D
modal.
The 3D analysis of 1-finger C-up HBT shows that the
thickness of thermal via can be reduced 32% to provide the
same thermal performance.