Embed Size (px)
Citation preview
1
1. Introduction
Textile industry is one of the highest water consuming industries with approximately 0.2 to 0.5 m3/kg of final product [1]. The water is required in most of its production processes, i.e. scouring, dyeing, printing, washing, and final finishing [2]. Wastewater produced from the textile industry came from two main sources, i.e. material preparation and dyeing steps. The effluents are mostly discharged from the material preparation process, having variable composition depending on the type of products and dyestuff. It contains oxidiz-ing agent, surfactant, sodium hydroxide, and some discarded fiber. Meanwhile, the main pollutants in wastewater originated from the dyeing process are dyes, salts, and surfactants [3]. An effective treatment of textile wastewater mostly requires advanced processes e.g. electrocoagulation [4] membrane filtration [5, 6] or combination of biological treatment with membrane filtration [7, 8].
Presently, reverse osmosis (RO) membrane is widely used in industrial wastewater treatment and reclamation processes. Permeate from the membrane has high quality and ready for re-use in many purposes such as cooling towers, boilers, cleaning, and dyeing etc. Nevertheless, RO application is still facing major ob-stacle in term of fouling prevention or minimization. This problem has adversely affected the treatment plant performance both in terms of water quantity and quality. It increases the operating
cost due to increases in overall filtration resistance, corrosive by-products, and salt passage [9, 10]. Fouling phenomena of the membrane is initially associated with the sieving of particles, col-loids and molecules according to the pore size of the membrane. Subsequently, a cake layer is built up on the membrane surface [9, 11]. Chemical cleaning of membrane cannot completely prevent the formation of foulant layer on the membrane surface but the additions of chemicals in feed water help retarding the development of the foulant layer. In order to achieve higher efficiency, chemical cleaning procedures of membranes need to be optimized [12].
The primarily constituents of textile wastewater that lead to fouling on membranes normally consists of surfactants and dyes [13]. Surfactants in textile wastewater regularly lead to fouling by hydrophobic interaction [14]. In case of lower concentration than critical micelle concentration (CMC), the hydrophobic force always shows higher strength than ionic repulsion force. Hence, the hydrophobic tails of surfactant associate with hydrophobic surface of membrane and turn the hydrophilic head to the water stream. This situation leads to a decrease in hydrophobic property and effective area of membrane. On the other hand, the higher concentration leads to colloidal form in water and affects the fouling mechanism by concentration polarization [15].
The fouling of dyes was affected by type of charged properties, salt concentration, and cross flow velocity across membrane surface
Environ. Eng. Res. 2016; 21(1): ??-?? pISSN 1226-1025http://dx.doi.org/10.4491/eer.2015.090 eISSN 2005-968X
Fouling and cleaning of reverse osmosis membrane applied to membrane bioreactor effluent treating textile wastewaterThirdpong Srisukphun1, Chart Chiemchaisri2†, Wilai Chiemchaisri2, Monthon Thanuttamavong2
1Department of Environmental Health, Faculty of Public and Environmental Health, Huachiew Chalearmprakiet University, Samutprakarn 10540, Thailand 2Department of Environmental Engineering, Faculty of Engineering, Kasetsart University, Bangkok 10900, Thailand
ABSTRACTMembrane bioreactor (MBR) and reverse osmosis (RO) membrane system was applied to the treatment and reclamation of textile wastewater in Thailand. An experiment was carried out to determine the fouling behavior and effect of anti-scalant and biocide addition to flux decline and its recovery through chemical cleaning. The RO unit was operated for one month after which the fouled membranes were cleaned by sequential chemical cleaning method. RO flux was found rapidly declined during initial period and only slightly decreased further in long-term operation. The main foulants were organic compounds and thus sequential cleaning using alkaline solution followed by acid solution was found to be the most effective method. The provision of anti-scalant and biocide in feed-water could not prevent deposition of foulant on the membrane surface but helped improving the membrane cleaning efficiencies.
Keywords: Fouling, Membrane cleaning, Reverse osmosis, Textile wastewater, Wastewater reclamation
This is an Open Access article distributed under the terms of the Creative Commons Attribution Non-Commercial License (http://creativecommons. org/ licenses/by-nc/3.0/) which per-
mits unrestricted non-commercial use, distribution, and reproduction in any medium, provided the original work is properly cited.
Copyright © 2016 Korean Society of Environmental Engineers
Received August 3, 2015 Accepted December 14, 2015
† Corresponding authorEmail: [email protected]: +662-797-0999 Fax: +662-579-0730
T. Srisukphun et al.
2
[16, 17]. In case of low salt concentration, dyes removal efficiency and permeate flux vary with cross flow velocity. In contrast, high salt concentration lead to colloidal forming of dyestuff and cross flow velocity does not have a significant effect on its removal [17]. Moreover, negatively charged membranes give higher salt and dye removal than neutrally charged membrane but they result in rapid fouling due to concentration polarization and cation species associate with negatively charged surface [16]. This situation leads to reduction of repulsive force between opposite species. Some small anion species can pass through the membrane surface but larger anion species are filtered by sieving mechanism, and hence, salt and color rejection decreases [18].
Fouled membranes need to be cleaned if permeate flux and/or salt rejection decrease by 10 to 15%. On the other hand, feed pressure and/or pressure drop can be allowed to increase by 10 to 15% [19]. Physical cleaning can recover membrane flux by eliminating particulate fouling but are not effective for other types of fouling [20]. Therefore, chemical cleaning is needed to recover the membrane permeate flux in long-term operation. Chemical agents used in membrane cleaning can be classified into four categories consisting of acids, alkalis, chelating agents, and for-mulated products [12]. There have been some studies focusing on the effectiveness of water and chemical cleaning of fouled membranes from textile wastewater application [6, 8], nonetheless, the effectiveness of using chemicals in feed water for preventing or retarding membrane fouling has not been systematically investigated. Therefore, the main purpose of this research is an investigation of the fouling characteristics of RO membrane system applied to textile wastewater and the effectiveness of RO membrane cleaning when biocide and anti-scalant chemicals were added to the feed water.
2. Materials and Methods
2.1. Membrane Processes for the Treatment of Textile Wastewater
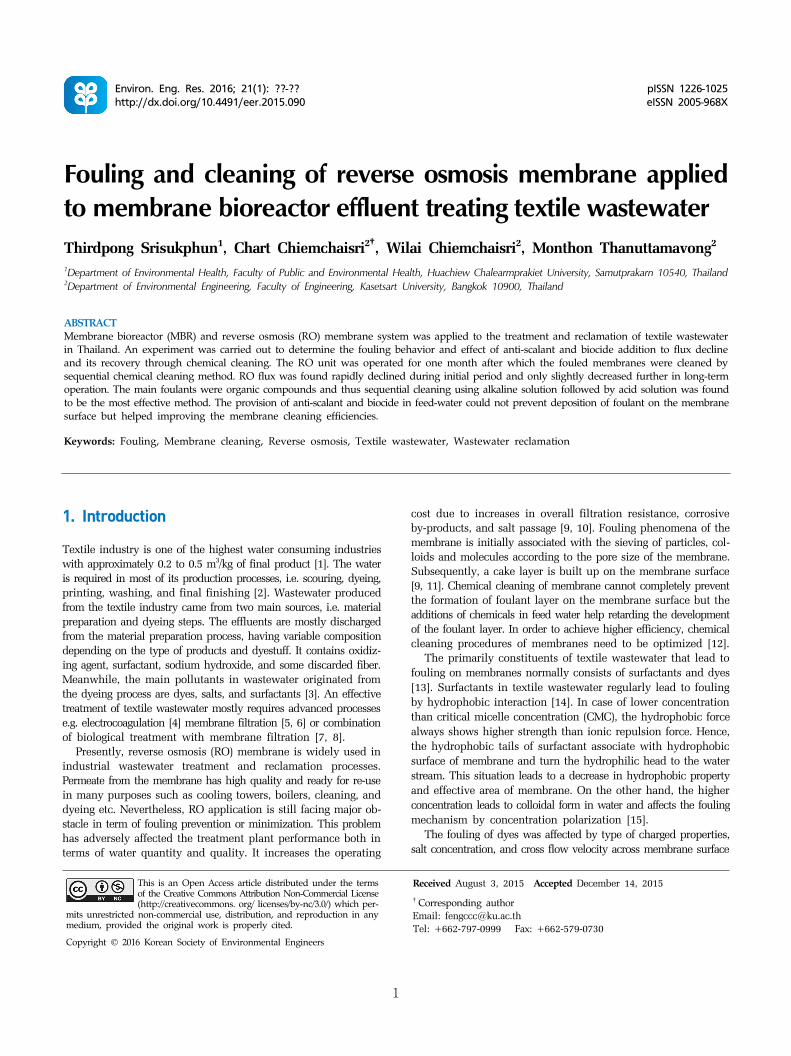
The raw wastewater obtained from the production process i.e., bleaching, mercerizing, dyeing, and washing, was treated by the hybrid process comprising of membrane bioreactor (MBR) and RO membrane system. The schematic diagram of the reclamation process is shown in Fig. 1. Flat-sheet micro-filtration membranes (MF; Kubota Corp., Japen), which have average pore size of 0.4 μm and total membrane area of 20 m2, were installed in the MBR. The treatment capacity was 18 m3/d. The temperature of raw waste-water was controlled by a cooling tower and adjusted to a pH of around 7.0 using hydrochloric acid (HCl) prior to MBR tank. Fine bubble air-diffuser tubes aerated the bioreactor continuously. Post treatment, RO membrane unit, improved the quality of treated wastewater from MBR with the capacity of 200 L/h. The membrane model XLE-4040 (Film Tech Corp. USA) with active membrane area of 8.1 m2 was applied. The biocide solution (Kuriverter EC 503; Kurita Water Industry LTD. Japen) and anti-scalant solution (Kulifloat; Kurita Water Industry LTD. Japen) were continuously added for preventing biofouling and scaling. Moreover, the feed-wa-
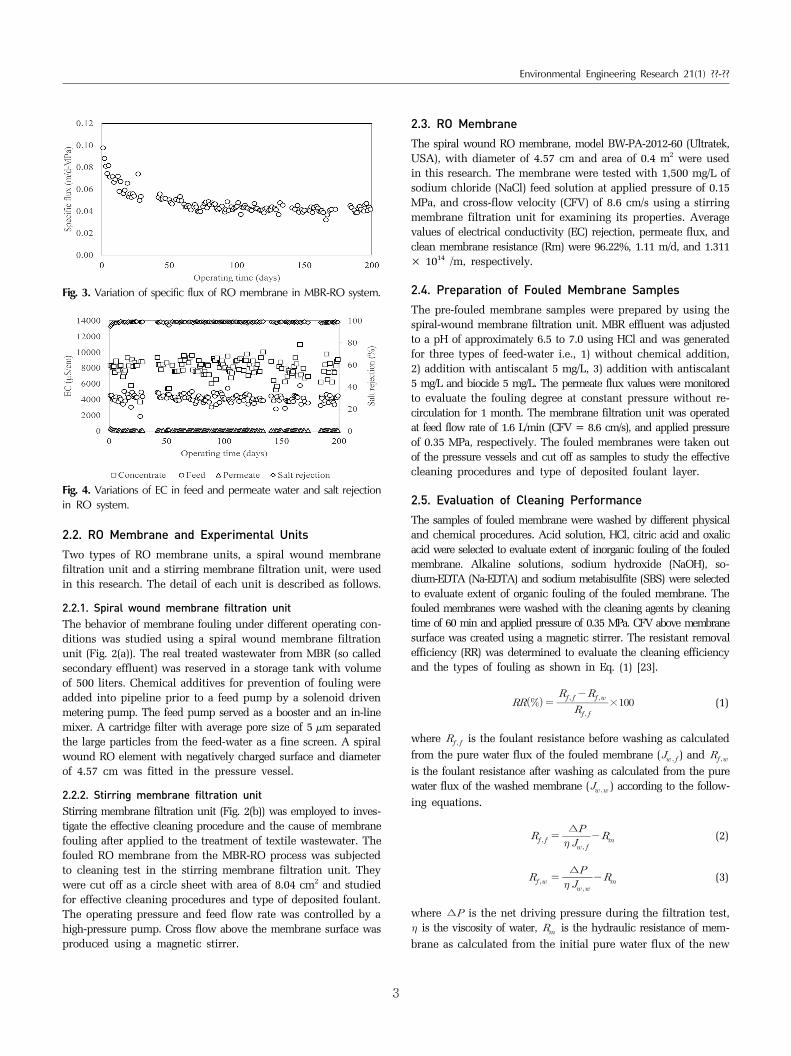
ter to the RO unit was adjusted to a pH of 6.5 using HCl. RO unit was operated with a recovery ratio of 50%. This plant was monitored the permeate flux and salt rejection for 6 months and the monitoring results are shown in Fig. 3 and 4.
The influent and effluent samples of MBR system were collected and kept at 4˚C upon their analyses in the laboratory. The 5-days biochemical oxygen demand (BOD), chemical oxygen demand (COD), total kjeldahl nitrogen (TKN), total phosphorus (TP), sus-pended solids (SS), total dissolved solids (TDS) and color were determined following Standard Methods for the Examination of Water and Wastewater [21]. The pH and electrical conductivity (EC) were monitored using pH and EC meter respectively. Silt density index (SDI) were determined using ASTM procedure D4189 [22].
Fig. 1. Schematic diagram of the MBR-RO system.
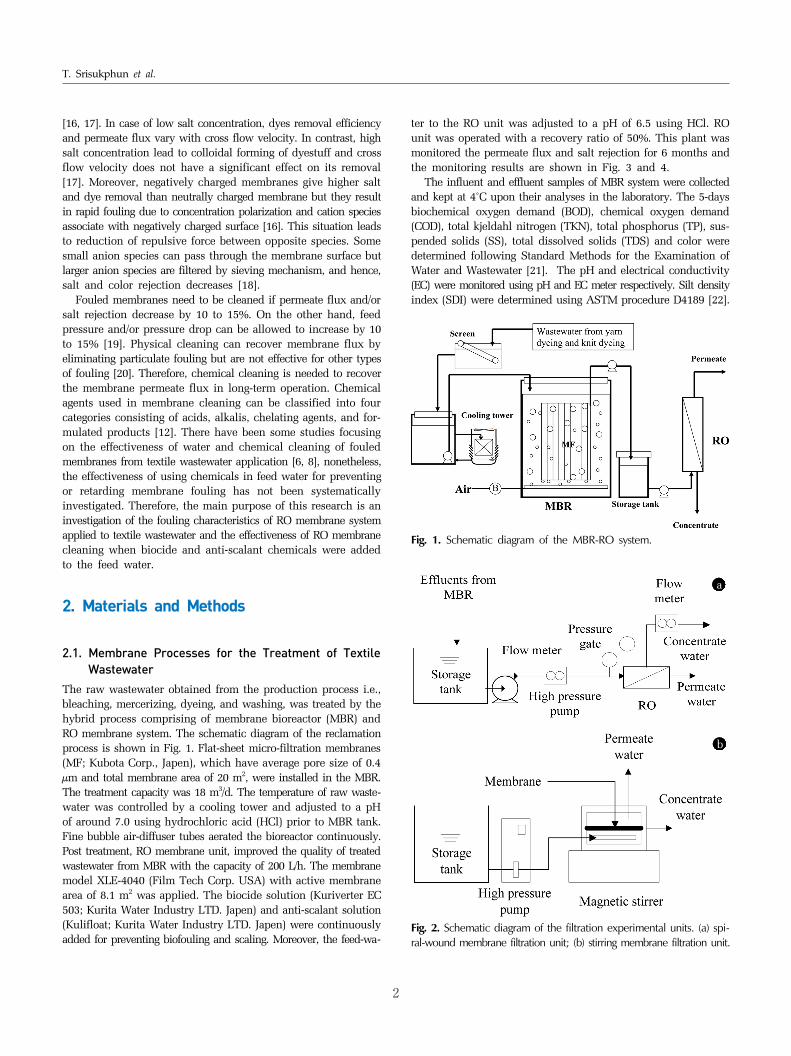
a
b
Fig. 2. Schematic diagram of the filtration experimental units. (a) spi-ral-wound membrane filtration unit; (b) stirring membrane filtration unit.
Environmental Engineering Research 21(1) ??-??
3
Fig. 3. Variation of specific flux of RO membrane in MBR-RO system.
Fig. 4. Variations of EC in feed and permeate water and salt rejection in RO system.
2.2. RO Membrane and Experimental Units
Two types of RO membrane units, a spiral wound membrane filtration unit and a stirring membrane filtration unit, were used in this research. The detail of each unit is described as follows.
2.2.1. Spiral wound membrane filtration unitThe behavior of membrane fouling under different operating con-ditions was studied using a spiral wound membrane filtration unit (Fig. 2(a)). The real treated wastewater from MBR (so called secondary effluent) was reserved in a storage tank with volume of 500 liters. Chemical additives for prevention of fouling were added into pipeline prior to a feed pump by a solenoid driven metering pump. The feed pump served as a booster and an in-line mixer. A cartridge filter with average pore size of 5 μm separated the large particles from the feed-water as a fine screen. A spiral wound RO element with negatively charged surface and diameter of 4.57 cm was fitted in the pressure vessel.
2.2.2. Stirring membrane filtration unit Stirring membrane filtration unit (Fig. 2(b)) was employed to inves-tigate the effective cleaning procedure and the cause of membrane fouling after applied to the treatment of textile wastewater. The fouled RO membrane from the MBR-RO process was subjected to cleaning test in the stirring membrane filtration unit. They were cut off as a circle sheet with area of 8.04 cm2 and studied for effective cleaning procedures and type of deposited foulant. The operating pressure and feed flow rate was controlled by a high-pressure pump. Cross flow above the membrane surface was produced using a magnetic stirrer.
2.3. RO Membrane
The spiral wound RO membrane, model BW-PA-2012-60 (Ultratek, USA), with diameter of 4.57 cm and area of 0.4 m2 were used in this research. The membrane were tested with 1,500 mg/L of sodium chloride (NaCl) feed solution at applied pressure of 0.15 MPa, and cross-flow velocity (CFV) of 8.6 cm/s using a stirring membrane filtration unit for examining its properties. Average values of electrical conductivity (EC) rejection, permeate flux, and clean membrane resistance (Rm) were 96.22%, 1.11 m/d, and 1.311 × 10¹⁴ /m, respectively.
2.4. Preparation of Fouled Membrane Samples
The pre-fouled membrane samples were prepared by using the spiral-wound membrane filtration unit. MBR effluent was adjusted to a pH of approximately 6.5 to 7.0 using HCl and was generated for three types of feed-water i.e., 1) without chemical addition, 2) addition with antiscalant 5 mg/L, 3) addition with antiscalant 5 mg/L and biocide 5 mg/L. The permeate flux values were monitored to evaluate the fouling degree at constant pressure without re-circulation for 1 month. The membrane filtration unit was operated at feed flow rate of 1.6 L/min (CFV = 8.6 cm/s), and applied pressure of 0.35 MPa, respectively. The fouled membranes were taken out of the pressure vessels and cut off as samples to study the effective cleaning procedures and type of deposited foulant layer.
2.5. Evaluation of Cleaning Performance
The samples of fouled membrane were washed by different physical and chemical procedures. Acid solution, HCl, citric acid and oxalic acid were selected to evaluate extent of inorganic fouling of the fouled membrane. Alkaline solutions, sodium hydroxide (NaOH), so-dium-EDTA (Na-EDTA) and sodium metabisulfite (SBS) were selected to evaluate extent of organic fouling of the fouled membrane. The fouled membranes were washed with the cleaning agents by cleaning time of 60 min and applied pressure of 0.35 MPa. CFV above membrane surface was created using a magnetic stirrer. The resistant removal efficiency (RR) was determined to evaluate the cleaning efficiency and the types of fouling as shown in Eq. (1) [23].
× (1)
where is the foulant resistance before washing as calculated from the pure water flux of the fouled membrane () and is the foulant resistance after washing as calculated from the pure water flux of the washed membrane ( ) according to the follow-ing equations.
∆ (2)
∆ (3)
where ∆ is the net driving pressure during the filtration test, is the viscosity of water, is the hydraulic resistance of mem-brane as calculated from the initial pure water flux of the new
T. Srisukphun et al.
4
membrane ( ) as determined by the following equation.
∆(4)
2.6. Investigation of Deposited Foulant Layer Using SEM
The deposited foulants on the fouled membranes were observed using SEM micrographs taking from scanning electron microscope (SEM), JEOL model JSM-5600 LV. Both of the fouled membrane samples and the washed membrane samples were cut into small pieces and liberated of moisture in a desiccator overnight. The dried samples were coated with gold mineral prior to be taken their images.
3. Results and Discussion
3.1. Characteristics of Raw Wastewater and MBR Treated Wastewater
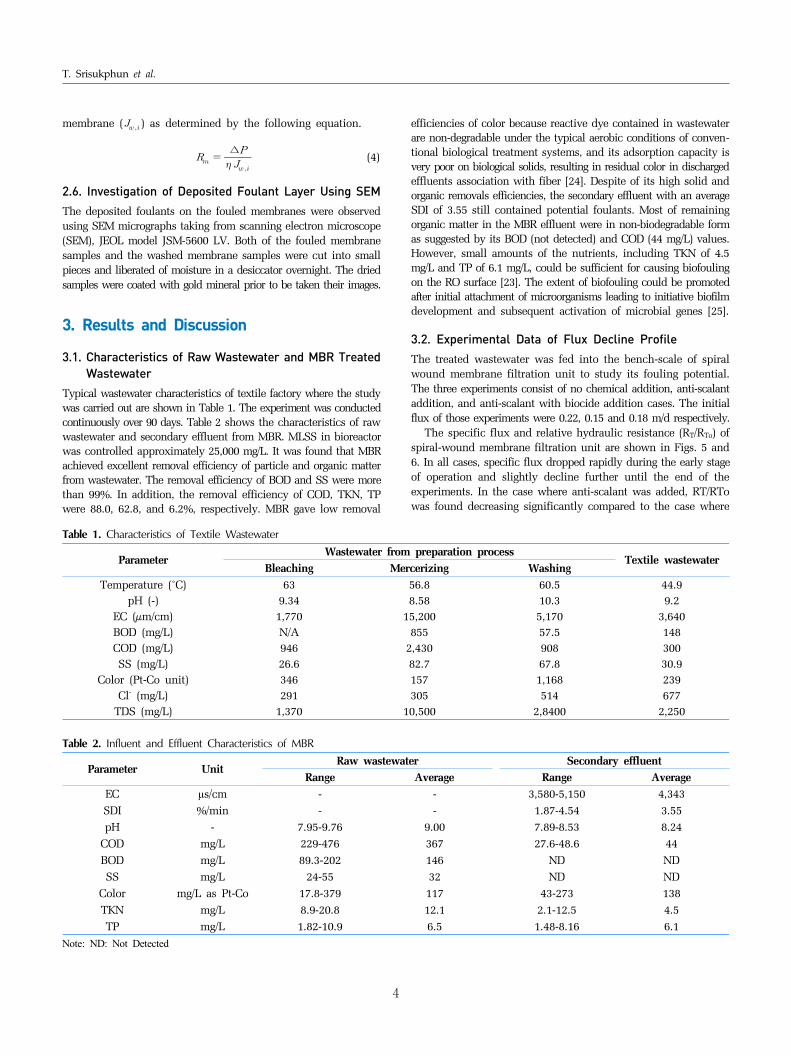
Typical wastewater characteristics of textile factory where the study was carried out are shown in Table 1. The experiment was conducted continuously over 90 days. Table 2 shows the characteristics of raw wastewater and secondary effluent from MBR. MLSS in bioreactor was controlled approximately 25,000 mg/L. It was found that MBR achieved excellent removal efficiency of particle and organic matter from wastewater. The removal efficiency of BOD and SS were more than 99%. In addition, the removal efficiency of COD, TKN, TP were 88.0, 62.8, and 6.2%, respectively. MBR gave low removal
efficiencies of color because reactive dye contained in wastewater are non-degradable under the typical aerobic conditions of conven-tional biological treatment systems, and its adsorption capacity is very poor on biological solids, resulting in residual color in discharged effluents association with fiber [24]. Despite of its high solid and organic removals efficiencies, the secondary effluent with an average SDI of 3.55 still contained potential foulants. Most of remaining organic matter in the MBR effluent were in non-biodegradable form as suggested by its BOD (not detected) and COD (44 mg/L) values. However, small amounts of the nutrients, including TKN of 4.5 mg/L and TP of 6.1 mg/L, could be sufficient for causing biofouling on the RO surface [23]. The extent of biofouling could be promoted after initial attachment of microorganisms leading to initiative biofilm development and subsequent activation of microbial genes [25].
3.2. Experimental Data of Flux Decline Profile
The treated wastewater was fed into the bench-scale of spiral wound membrane filtration unit to study its fouling potential. The three experiments consist of no chemical addition, anti-scalant addition, and anti-scalant with biocide addition cases. The initial flux of those experiments were 0.22, 0.15 and 0.18 m/d respectively.
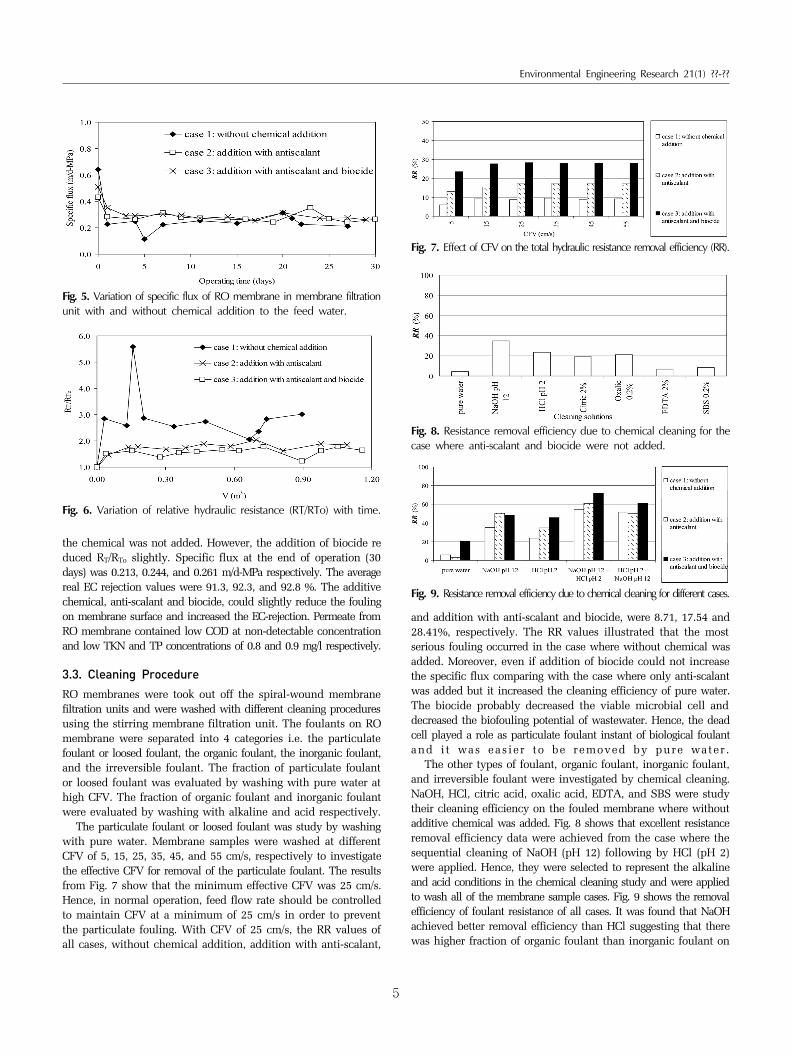
The specific flux and relative hydraulic resistance (RT/RTo) of spiral-wound membrane filtration unit are shown in Figs. 5 and 6. In all cases, specific flux dropped rapidly during the early stage of operation and slightly decline further until the end of the experiments. In the case where anti-scalant was added, RT/RTo was found decreasing significantly compared to the case where
Table 1. Characteristics of Textile Wastewater
ParameterWastewater from preparation process
Textile wastewaterBleaching Mercerizing Washing
Temperature (˚C)pH (-)
EC (μm/cm)BOD (mg/L)COD (mg/L)SS (mg/L)
Color (Pt-Co unit)Cl- (mg/L)
TDS (mg/L)
639.341,770N/A94626.6346291
1,370
56.88.58
15,200855
2,43082.7157305
10,500
60.510.35,17057.590867.81,168514
2,8400
44.99.2
3,64014830030.9239677
2,250
Table 2. Influent and Effluent Characteristics of MBR
Parameter UnitRaw wastewater Secondary effluent
Range Average Range AverageEC μs/cm - - 3,580-5,150 4,343
SDI %/min - - 1.87-4.54 3.55pH - 7.95-9.76 9.00 7.89-8.53 8.24
COD mg/L 229-476 367 27.6-48.6 44
BOD mg/L 89.3-202 146 ND NDSS mg/L 24-55 32 ND ND
Color mg/L as Pt-Co 17.8-379 117 43-273 138
TKN mg/L 8.9-20.8 12.1 2.1-12.5 4.5TP mg/L 1.82-10.9 6.5 1.48-8.16 6.1
Note: ND: Not Detected
Environmental Engineering Research 21(1) ??-??
5
Fig. 5. Variation of specific flux of RO membrane in membrane filtration unit with and without chemical addition to the feed water.
Fig. 6. Variation of relative hydraulic resistance (RT/RTo) with time.
the chemical was not added. However, the addition of biocide re duced RT/RTo slightly. Specific flux at the end of operation (30 days) was 0.213, 0.244, and 0.261 m/d-MPa respectively. The average real EC rejection values were 91.3, 92.3, and 92.8 %. The additive chemical, anti-scalant and biocide, could slightly reduce the fouling on membrane surface and increased the EC-rejection. Permeate from RO membrane contained low COD at non-detectable concentration and low TKN and TP concentrations of 0.8 and 0.9 mg/l respectively.
3.3. Cleaning Procedure
RO membranes were took out off the spiral-wound membrane filtration units and were washed with different cleaning procedures using the stirring membrane filtration unit. The foulants on RO membrane were separated into 4 categories i.e. the particulate foulant or loosed foulant, the organic foulant, the inorganic foulant, and the irreversible foulant. The fraction of particulate foulant or loosed foulant was evaluated by washing with pure water at high CFV. The fraction of organic foulant and inorganic foulant were evaluated by washing with alkaline and acid respectively.
The particulate foulant or loosed foulant was study by washing with pure water. Membrane samples were washed at different CFV of 5, 15, 25, 35, 45, and 55 cm/s, respectively to investigate the effective CFV for removal of the particulate foulant. The results from Fig. 7 show that the minimum effective CFV was 25 cm/s. Hence, in normal operation, feed flow rate should be controlled to maintain CFV at a minimum of 25 cm/s in order to prevent the particulate fouling. With CFV of 25 cm/s, the RR values of all cases, without chemical addition, addition with anti-scalant,
Fig. 7. Effect of CFV on the total hydraulic resistance removal efficiency (RR).
Fig. 8. Resistance removal efficiency due to chemical cleaning for the case where anti-scalant and biocide were not added.
Fig. 9. Resistance removal efficiency due to chemical cleaning for different cases.
and addition with anti-scalant and biocide, were 8.71, 17.54 and 28.41%, respectively. The RR values illustrated that the most serious fouling occurred in the case where without chemical was added. Moreover, even if addition of biocide could not increase the specific flux comparing with the case where only anti-scalant was added but it increased the cleaning efficiency of pure water. The biocide probably decreased the viable microbial cell and decreased the biofouling potential of wastewater. Hence, the dead cell played a role as particulate foulant instant of biological foulant and i t was easier to be removed by pure water .
The other types of foulant, organic foulant, inorganic foulant, and irreversible foulant were investigated by chemical cleaning. NaOH, HCl, citric acid, oxalic acid, EDTA, and SBS were study their cleaning efficiency on the fouled membrane where without additive chemical was added. Fig. 8 shows that excellent resistance removal efficiency data were achieved from the case where the sequential cleaning of NaOH (pH 12) following by HCl (pH 2) were applied. Hence, they were selected to represent the alkaline and acid conditions in the chemical cleaning study and were applied to wash all of the membrane sample cases. Fig. 9 shows the removal efficiency of foulant resistance of all cases. It was found that NaOH achieved better removal efficiency than HCl suggesting that there was higher fraction of organic foulant than inorganic foulant on
T. Srisukphun et al.
6
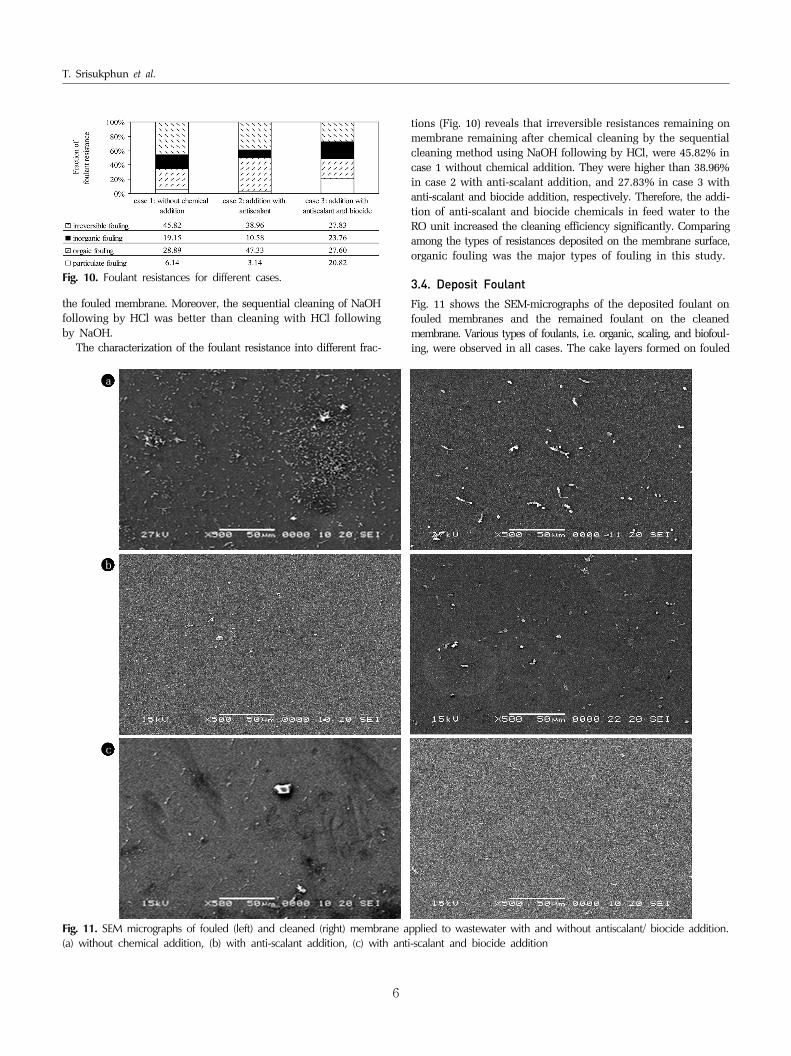
Fig. 10. Foulant resistances for different cases.
the fouled membrane. Moreover, the sequential cleaning of NaOH following by HCl was better than cleaning with HCl following by NaOH.
The characterization of the foulant resistance into different frac-
tions (Fig. 10) reveals that irreversible resistances remaining on membrane remaining after chemical cleaning by the sequential cleaning method using NaOH following by HCl, were 45.82% in case 1 without chemical addition. They were higher than 38.96% in case 2 with anti-scalant addition, and 27.83% in case 3 with anti-scalant and biocide addition, respectively. Therefore, the addi-tion of anti-scalant and biocide chemicals in feed water to the RO unit increased the cleaning efficiency significantly. Comparing among the types of resistances deposited on the membrane surface, organic fouling was the major types of fouling in this study.
3.4. Deposit Foulant
Fig. 11 shows the SEM-micrographs of the deposited foulant on fouled membranes and the remained foulant on the cleaned membrane. Various types of foulants, i.e. organic, scaling, and biofoul-ing, were observed in all cases. The cake layers formed on fouled
a
b
c
Fig. 11. SEM micrographs of fouled (left) and cleaned (right) membrane applied to wastewater with and without antiscalant/ biocide addition.(a) without chemical addition, (b) with anti-scalant addition, (c) with anti-scalant and biocide addition
Environmental Engineering Research 21(1) ??-??
7
membrane surface of different cases were varied in types and thickness. Observed foulants in SEM micrographs from cases where anti-scalant was added, and where anti-scalant and biocide were added, suggested that anti-scalant and biocide solution could not completely prevent scaling and biofouling on the membrane surface.
From the membrane cleaning tests, the most effective cleaning agents, sequential cleaning of NaOH (pH 12) following by HCl (pH 2), were applied on membrane samples from all cases. SEM micrographs of these samples illustrated the performance of an-ti-scalant and biocide solutions in supporting cleaning efficiency.
4. Conclusions
From our investigation on the fouling and cleaning of RO membrane treating textile wastewater, the following conclusions can be drawn.
1) Flux of RO membrane treating the secondary effluent rapidly declined at the beginning of operation (24 hours) and slightly decreased further in long-term (~30 days). The addition of anti-sca-lant and biocide slightly reduced the fouling and increased mem-brane rejection efficiency. The scaling and biofilm were observed by SEM micrographs suggesting that addition of anti-scalant and biocide did not completely prevent the scaling and biofouling.
2) Sequential cleaning using alkaline solution (NaOH, pH 12) followed by acid solution (HCl, pH 2) was the most effective proce-dure for removing the foulant resistance caused by the secondary effluent (of MBR). The main cause of RO fouling was the organic foulants as determined by high hydraulic resistance recovery by alkaline solution.
References
1. Marcucci M, Nosenzo G, Capanelli G, Ciabatti I, Corrieri D, Ciardelli G. Treatment and reuse of textile effluents based on new ultrafiltration and other membrane technologies. Desalination 2001;138:75-82.
2. Dasgupta J, Sikder J, Chakraborty S, Curcio S, Drioli E. Remediation of textile effluents by membrane based treatment techniques: A state of the art review. J. Environ. Manage. 2015;147:55-72.
3. Kurt E, Konseoglu-Imer DY, Dizge N, Chellam S, Koyuncu I. Pilot-scale evaluation of nanofiltration and reverse osmosis for process reuse of segregated textile dyewash wastewater. Desalination 2012;302:24-32.
4. Hossain MM, Mahmud MI, Parvez MS, Cho HM. Impact of current density, operating time and pH of textile wastewater treatment by electrocoagulation process. Environ. Eng. Res. 2013;18:157-161.
5. Ellouze E, Souissi S, Jrad A, Amar RB, Salah AB. Performances of nanofiltration and reverse osmosis in textile industry waste water treatment. Desalination Water Treat. 2010;22:182-186.
6. Lau WJ, Ismail AF. Polymeric nanofiltration membranes for textile dye wastewater treatment: Preparation, performance evaluation, transport modelling, and fouling control-A review. Desalination 2009;245:321-348.
7. Sahinkaya E, Uzal N, Yetis U, Dilek FB. Biological treatment
and nanofiltration of denim textile wastewater for reuse. J. Hazard. Mater. 2008;153:1142-1148.
8. Zheng Y, Yu S, Shuai S, et al. Color removal and COD reduction of biologically treated textile effluent through submerged filtra-tion using hollow fiber nanofiltration membrane. Desalination 2013;314:89-95.
9. Brauns E, Van Hoof E, Molenberghs B, Dotremont C, Doyen W, Leysen R. A new method of measuring and presenting the membrane fouling potential. Desalination 2002;150:31-162.
10. Abid MF, Zablouk MA, Abid-Alameer AM. Experimental study of dye removal from industrial wastewater by membrane tech-nologies of reverse osmosis and nanofiltration. Iranian J. Environ. Health Sci. & Eng. 2012;9-17.
11. Visvanathan C, Boonthanon N, Sathasivan A, Jegatheesan V. Pretreatment of seawater for biodegradable organic content removal using membrane bioreactor. Desalination 2002;153:133-140.
12. Ang WS, Yip NY, Tiraferri A, Elimelech M. Chemical cleaning of RO membranes fouled by wastewater effluent: Achieving higher efficiency with dual-step cleaning. J. Membr. Sci. 2011;382:100-106.
13. Fersi C, Gzara L, Dhahbi M. Flux decline study for textile wastewater treatment by membrane processes. Desalination 2009;244:321-332.
14. Kim CK, Kim SS, Kim DW, Lim JC, Kim JJ. Removal of aromatic compounds in the aqueous solution via micellar enhanced ultrafiltration: part 1 behaviors of nonionic surfactants. J. Membrane Sci. 1998;147:13-22.
15. Mietton-Peuchot M, Ranisio O, Peuchot C. Study of behaviour of membranes in the presence of anionic or nonionic surfactants. Filtration & Separation 1997;34:883-886.
16. Jiraratananon R, Sungpet A, Luangsowan P. Performance evalu-ation of nanofiltration membranes for treatment of effluents containing reactive dye and salt. Desalination 2000;130:177-183.
17. Koyuncu I. Reactive dye removal in dye/salt mixtures by nano-filtration membranes containing vinylsulphon dyes: effect of feed concentration and cross flow velocity. Desalination 2002; 143:243-253.
18. Tang C, Chen V. Nanofiltration of textile wastewater for water reuse. Desalination 2002;143:11-20.
19. Al-Ahmad M, Aleem FAA, Mutiri A, Ubaisy A. Biofouling in RO membrane systems part1: fundamentals and control. Desalination. 2000;132:173-179.
20. Zhao Y, Wu K, Wang Z, Zhao L, Li S. Fouling and cleaning of membrane – a literature review. J. Environ. Sci. 2000;12:241-251.
21. APHA. Standard Methods for the Examination of Water and Wastewater, 21st ed. American Public Health Association. Washington DC; 2005.
22. ASTM Standards. Standard Test Method for Silt Density Index (SDI) of Water. PA: ASTM International, West Conshohocken; 2014.
23. Vrouwenvelder JS, van der Kooij D. Diagnosis prediction of biofouling of NF and RO membranes. Desalination 2001;139:65-71.
24. Epolitoa WJ, Lee YH, Bottomleyb LA, Pavlostathis SG. Characterization of the textile anthraquinone dye reactive blue 4. Dyes and Pigments 2005;67:35-46.
25. Lee J, Ren X, Yu HW, Kim SJ, Kim IS. Membrane biofouling of seawater reverse osmosis initiated by Sporogenic Bacillus strain. Environ. Eng. Res. 2010;15:141-147.