Embed Size (px)
Citation preview

Written by Ecorys
November – 2018
Analysis of administrative
burden arising from the CAP Final Report

EUROPEAN COMMISSION
Directorate-General for DG for Agriculture and Rural Development
Directorate C — Strategy, simplification and policy analysis
Unit C.4 — Monitoring and evaluation
E-mail: [email protected]
European Commission
B-1049 Brussels

EUROPEAN COMMISSION
2019 Directorate-General for Agriculture and Rural Development
Analysis of administrative burden arising from the CAP
Final Report

LEGAL NOTICE
The information and views set out in this study are those of the authors and do not
necessarily reflect the official opinion of the Commission. The Commission does not
guarantee the accuracy of the data included in this study. Neither the Commission
nor any person acting on the Commission’s behalf may be held responsible for the
use which may be made of the information contained therein.
More information on the European Union is available on the Internet
(http://www.europa.eu).
Luxembourg: Publications Office of the European Union, 2019
ISBN:
978-92-79-98021-3
Doi:
10.2762/521652
Catalogue number:
KF-05-18-107-EN-N
© European Union, 2018
Reproduction is authorised provided the source is acknowledged.
EUROPE DIRECT is a service to help you find answers
to your questions about the European Union
Freephone number (*):
00 800 6 7 8 9 10 11
(*) The information given is free, as are most calls (though some operators, phone
boxes or hotels may charge you)

Table of Contents
Glossary 7
Abstract 8
1 Introduction 9
1.1 Context and objectives of the study 9
1.2 Content and structure of the report 11
2 Methodological approach and limitations 13
2.1 Definitions and methodological implications emerging from literature 13
2.1.1 Assessments of costs and burdens in CAP related scientific literature 13
2.1.2 Definitions applied in this study 17
2.2 Approach and methodologies chosen 18
2.2.1 Key methodologies for cost identification and assessment 19
2.2.2 General approach for case studies 20
2.2.3 Extrapolation of findings 20
2.2.4 Approach for setting up the framework for assessing LPIS Cost-
Effectiveness 21
2.3 Limitations and robustness of the study 22
3 Functioning and development of IACS related activities 25
3.1 Evolution of the CAP 25
3.2 Description of IACS and its major components 34
3.2.1 IACS’ main components 37
3.2.2 Land Parcel Identification System (LPIS) 39
3.2.3 Costs of controls 44
3.2.4 Payment entitlements 46
3.2.5 Greening 48
3.2.6 Cross-compliance 53
3.2.7 Rural development measures (IACS based) 55
4 Costs and cost drivers of IACS related activities 59
4.1 Overall costs of IACS 59
4.2 Set-up costs 66
4.3 Running costs 71
4.3.1 Horizontal IACS staff 72
4.3.2 The Land Parcel Identification System (LPIS) 82
4.4 Management and control costs 94
4.4.1 Horizontal assessment of cost drivers and aspects concerning controls 96
4.4.2 Payment entitlements 106
4.4.3 Greening 109
4.4.4 Cross-compliance 116
4.4.5 IACS-based rural development measures 120
4.5 Administrative burden: farmers’ perspective 128
6
4.5.1 Farmers’ understanding of the definition of administrative burden 129
4.5.2 Sources of administrative burden 130
4.5.3 Estimates of time spent on CAP related administrative tasks 130
4.5.4 Estimates of financial costs of administrative burden for farmers 133
4.5.5 Farmers’ perspectives on specific tools and instruments 136
4.5.6 Future CAP and opportunities to reduce administrative burdens 142
5 Conclusions and recommendations 149
5.1 Key findings and implications for future policy 149
5.2 Overall conclusions 155

7
Glossary
Acronym Description
AECM Agri-environment-climate Measures
AEM Agri-environmental measures
AP Agricultural Parcels
ATS Abstract Tests Suit
BPS Basic Payment Scheme
CAP Common Agricultural Policy
DG AGRI European Commission, Directorate-General for Agriculture and Rural Development
EAFRD European Agricultural Fund for Rural Development
EAGF European Agricultural Guarantee Fund
EC European Commission
EFA Ecological Focus Area
ETS Executable Test Suite
FTE Full Time Equivalents
GAEC Good Agricultural and Environmental Conditions
GIS Geographic Information System
GSAA Geo-Spatial Aid Application
IACS Integrated Administration and Control System
IT Information Technology
LCCS Land Cover Classification System
LFA Less-Favoured Area
LIDAR Light Detection and Ranging
LPIS Land Parcel Identification System
LPIS QA Land Parcel Identification System Quality Assurance
MTS Model Test Suit
MS Member State
OTSC On The Spot Checks
PA paying agency
RDP Rural Development Programmes
RP Reference Parcels
RS Remote Sensing
SAPS Single Area Payment Scheme
SCM Standard Cost Model
SMR Statutory Management Requirement
SPS Single Payment Scheme
TC Transaction cost
UAA Utilised Agricultural Area
VCS Voluntary Coupled Support
VHR Very High Resolution
YF Young Farmers

Analysis of administrative burden arising from the CAP
8
Abstract
This study collects evidence and measures the costs related to the implementation
of the Integrated Administration and Control System (IACS) after the CAP 2013
reform. It analyses in-depth the different forms of IACS, Land Parcel Identification
System and related control mechanisms, as well as the costs associated to cross-
compliance. Overall, the 2013 reform led to an increase of the administrative
burden on administrations, which has helped to avoid a significant increase of the
burden on the beneficiaries. For the administrations, IACS administrative costs are
estimated to represent around 3% of the annual CAP budget. For farmers, the
share of the administrative burden, excluding compliance costs, accounts for about
2% of the total aid received. The study recommends to consider the administrative
cost implications of Member States interventions in the future CAP strategic plans
and to stimulate the use of digital technology. The report proposes examples of
actions that could be taken by the Member States. The study also reveals that there
is little data available on the administrative costs related to the CAP implementation
which makes comparisons between Member States difficult and which does not
allow for a monitoring of the costs over time.
Cette étude rassemble des preuves et mesure les coûts liés à la mise en œuvre du
système intégré de gestion et de contrôle (SIGC) après la réforme de la PAC 2013.
Elle analyse en profondeur les différentes formes de SIGC, le système
d'identification des parcelles de terrain (SIPA) et les mécanismes de contrôle
associés, ainsi que les coûts associés à la conditionnalité. Globalement, la réforme
de la PAC 2013 a entraîné une augmentation de la charge administrative pour les
administrations, ce qui a permis d'éviter une augmentation significative de la
charge pour les bénéficiaires. Pour les administrations, les coûts administratifs du
SIGC représentent environ 3% du budget annuel de la PAC. Pour les agriculteurs, la
part de la charge administrative (coûts de conditionnalité exclues), représente
environ 2% du total des aides reçues. L'étude recommande de prendre en compte
les coûts administratifs des interventions des États membres dans les futurs plans
stratégiques de la PAC et de stimuler l'utilisation des technologies numériques. Le
rapport propose des exemples d'actions que pourraient entreprendre les États
membres. L'étude révèle également qu'il existe peu de données disponibles sur les
coûts administratifs liés à la mise en œuvre de la PAC, ce qui rend les comparaisons
entre les États membres difficiles et ne permet pas un suivi des coûts dans le
temps.

Analysis of administrative burden arising from the CAP
9
1 Introduction
This chapter provides a brief introduction to the context of the study, its objectives
and structure.
1.1 Context and objectives of the study
Context and study setting
Since its establishment in 1962, the Common Agricultural Policy (CAP) has
undergone major reforms aimed at tailoring and/or simplifying its implementation.
Among the most influential were the so-called ‘MacSharry’ reforms in the 1990s
and the Agenda 2000 reforms. Reforms included the introduction of a new
Integrated Administrative Control System (IACS), which incorporates checks on the
accuracy of farmers’ declared area and livestock headage claims, together with
associated payment reductions and penalties where applicable. The IACS system
has been subsequently developed and tailored across the EU, introducing specific
regulatory requirements (RDPs, Greening etc.) and technological tools (LPIS, Geo
Spatial Aid Application etc.).
The 2013 CAP Reforms, which provide the basis of IACS assessed by this study,
built upon the previously introduced two Pillar structure but increased overall
flexibility for Member States and strengthened the links between the Pillars. The
current IACS incorporates different databases (farmers’ register, animal register,
LPIS, entitlement register, claims databases) with cross-checking of the integrity of
data. Under IACS, Member States are required to use computerised databases to
administer the annual claim and control cycle, covering aid application,
administrative and (where applicable) on-the-spot checks (OTSC), and payments,
incorporating (where applicable) penalties and deductions.
The study takes also into account stakeholders’ views expressed in the public
consultations held at the time of the REFIT exercises on agriculture1, particularly
those related to Greening in 2016, and the “Simplification and modernisation of the
CAP”2, in 2017, together with the outcomes of the Omnibus Regulation 20173.
These give rise to observations on various topics that warrant consideration by this
study:
The impact of good quality advisory services such as the Farm Advisory system
(FAS)4 and well-functioning IT systems in reducing the administrative burden
placed on different stakeholders;
The impact of unclear or highly detailed and prescriptive requirements on CAP
beneficiaries;
1 https://ec.europa.eu/info/publications/refit-platform-recommendations-agriculture_en 2 European Commission, DG AGRI (2017): Modernising and simplifying the CAP, Background Document Socio-Economic
challenges facing EU agriculture and rural areas 3 https://www.consilium.europa.eu/en/policies/cap-simplification/omnibus-regulation-agriculture/ 4 https://ec.europa.eu/agriculture/direct-support/cross-compliance/farm-advisory-system_en

Analysis of administrative burden arising from the CAP
10
The impact of policy changes – including their frequency and speed of
implementation – on administrative processes at the national, regional and farm
level;
The impact of overlapping or stacked rules (e.g. relation Greening payment,
cross-compliance and the AEC measure) on administrative complexity;
The potential opportunities from use of results-based payments, rather than
penalties, to achieve a better balance between cost and effectiveness of CAP
administration;
The ways in which the prescriptive nature of the CAP (as mentioned in the
Communication on the Future of Farming) impacts on Member States
implementation of controls and IT systems, and on efforts to find and introduce
innovative alternatives.
Objectives of this study
The general objective of this study is to examine the costs and administrative
burden, including the effectiveness and efficiency, of current systems for managing
and controlling a large share of common agricultural policy (CAP) expenditure.
Specifically, the study analyses and assesses different elements of the Integrated
Administration and Control System (IACS), including the Land Parcel Identification
System (LPIS) and related control mechanisms in place across the EU. The analysis
and findings provided by the study should contribute to reflections on ways to
simplify and improve management systems and procedures for CAP
implementation.
The general objective of the study, is further defined by the following more
operational specific objectives:
Objective 1 – Improve the understanding of Member States’
implementation of IACS: provide an overview and description of IACS,
including LPIS, cross-compliance and related aspects of direct payments,
including insights on their implementation by Member States;
Objective 2 - Identify the sources of costs for IACS: identify and categorise
costs of IACS according their source;
Objective 3 - Quantify and compare IACS costs across Member States:
provide a comparative quantification of the costs of different components of
IACS across Member States;
Objective 4 - Compare IACS implementation procedures and their
associated costs: provide a comparison of Member States’ IACS
implementation procedures and assess the impact of observed differences on
IACS costs;
Objective 5 – Undertake a ‘fitness check’ of IACS implementation:
provide and assessment of the adequacy, efficiency and effectiveness of IACS
implementation and its regulatory basis, together with identification of
opportunities for improvement and simplification;
Objective 6 – Develop a methodological framework for measuring LPIS
cost-effectiveness: develop and test a methodological framework for assessing
the cost effectiveness of LPIS. This methodological framework, after fine-tuning,
should be suitable for future use by Member States5.
5 NOTE: The LPIS Cost Effectiveness Framework is a separate study outcome not presented in this report.

Analysis of administrative burden arising from the CAP
11
1.2 Content and structure of the report
The structure of the report is as follows:
Chapter 2 – Methodological approach and limitations: presents the general
approach and methodology applied in the study;
Chapter 3 – Functioning and development of IACS: introduces the policy
background and context, simplification efforts and describes IACS and its major
components;
Chapter 4 – Costs and cost drivers of IACS: analysis of the administrative
costs related to the main components of IACS and the burdens observed by
farmers;
Chapter 5 – Conclusions and recommendations: conclusions /
recommendations based on the analysis of all study components.


Analysis of administrative burden arising from the CAP
13
2 Methodological approach and limitations
This chapter presents the definitions and methodological implications emerging
from literature (Section 2.1), the approach for the study including the key
methodologies chosen (Section 2.2) and the limitations and robustness of the study
findings (Section 2.3).
2.1 Definitions and methodological implications emerging from literature
Administrative costs and burdens of EU policy and funds in general and the CAP in
particular have been part of various reform discussions in recent years. Definitions
applied however often differ and the political debate around the topics of ‘burden
reductions’ and ‘gold-plating’ are not always supporting methodologically accurate
definitions and distinctions. In the following sections, we thus first provide a brief
introduction on assessments of costs and burdens in CAP related scientific
literature, followed by an elaboration of the definitions applied in the remainder of
this study.
2.1.1 Assessments of costs and burdens in CAP related scientific literature
The administrative burden is often mentioned in assessments of measures and
policy. Broadly speaking, the scientific literature on the administrative cost of
agricultural policy is mostly related to transaction costs, i.e. all costs (except for the
price of the product itself) needed to carry out a transaction. Transaction costs are
used by a growing body literature (implicitly or explicitly) to introduce the notion of
trade-off between the costs and benefits of a more precise or more tailored policy.
A more precise policy implies a more accurate implementation in line with
objectives, which involves more demanding checks, more sophisticated selection
criteria, better targeting and better controls at the stage of implementation.
However, increased targeting and tailoring is expected to bring higher benefits (e.g.
higher effectiveness) yet also implies higher transaction costs6. This trade off can
be depicted as done in the figure below.
6 Fahrmann and Grajewski (2013) https://academic.oup.com/erae/article-abstract/40/4/541/428701
Analysis of administrative burden arising from the CAP
14
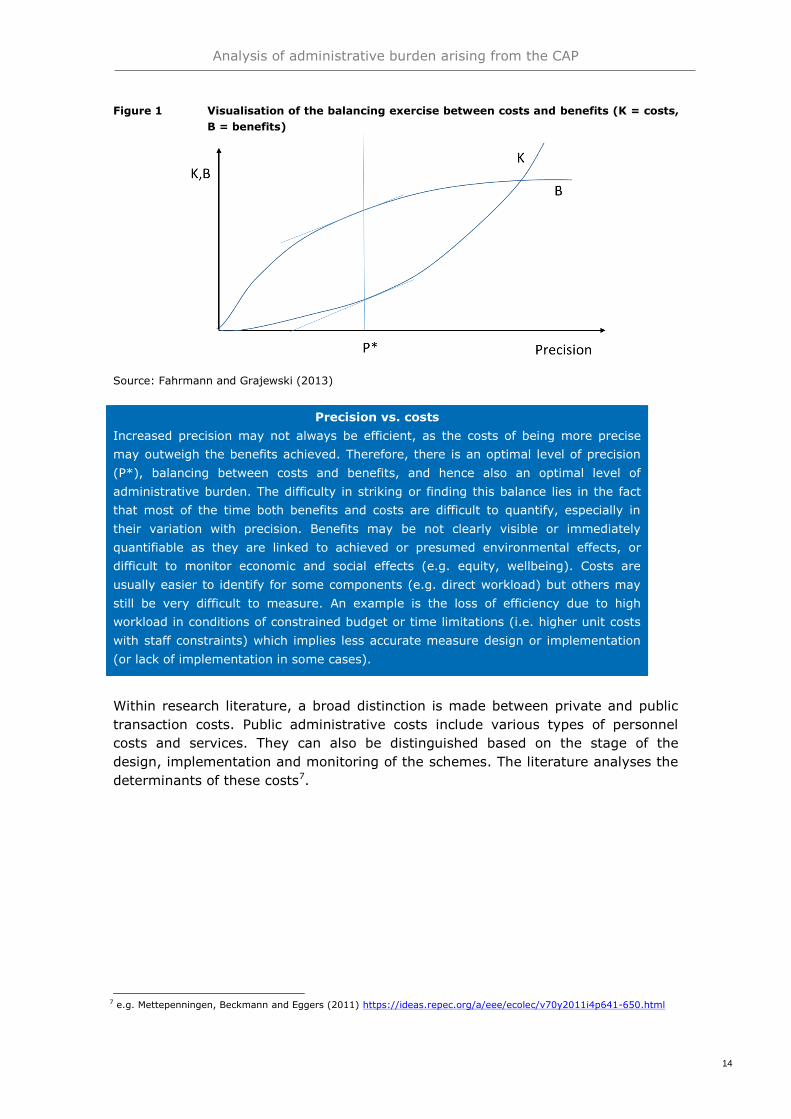
Figure 1 Visualisation of the balancing exercise between costs and benefits (K = costs,
B = benefits)
Source: Fahrmann and Grajewski (2013)
Precision vs. costs
Increased precision may not always be efficient, as the costs of being more precise
may outweigh the benefits achieved. Therefore, there is an optimal level of precision
(P*), balancing between costs and benefits, and hence also an optimal level of
administrative burden. The difficulty in striking or finding this balance lies in the fact
that most of the time both benefits and costs are difficult to quantify, especially in
their variation with precision. Benefits may be not clearly visible or immediately
quantifiable as they are linked to achieved or presumed environmental effects, or
difficult to monitor economic and social effects (e.g. equity, wellbeing). Costs are
usually easier to identify for some components (e.g. direct workload) but others may
still be very difficult to measure. An example is the loss of efficiency due to high
workload in conditions of constrained budget or time limitations (i.e. higher unit costs
with staff constraints) which implies less accurate measure design or implementation
(or lack of implementation in some cases).
Within research literature, a broad distinction is made between private and public
transaction costs. Public administrative costs include various types of personnel
costs and services. They can also be distinguished based on the stage of the
design, implementation and monitoring of the schemes. The literature analyses the
determinants of these costs7.
7 e.g. Mettepenningen, Beckmann and Eggers (2011) https://ideas.repec.org/a/eee/ecolec/v70y2011i4p641-650.html

Analysis of administrative burden arising from the CAP
15
Figure 2 Main categories of determinants of public transaction costs
Source: Consortium based on Mettepenningen, Beckmann and Eggers (2011)
Public transaction costs
Actors involved affect public transaction costs both due to their number (the higher
the number e.g. of farmers involved, the higher the transaction costs) and
characteristics (the more heterogeneous, the higher the transaction costs).
Transaction costs are also influenced by actors’ features, such as trust, familiarity
with measures, attitudes towards public administration and specific measures.
Some of these elements mostly affect monitoring and control needs. With their
influence based on characteristics and features, but also individual or collective
policy choices, public administrations can cause (unintentionally or deliberately)
additional potentially unnecessary requirements, better known under the term
“gold-plating”8.
Scheme (and in general policy) characteristics also affect public transaction costs.
Measures targeting environmental prescriptions have normally higher transaction
costs than measures related to joint public and private goods (such as
environmental taxes), which are normally more costly than simple subsidies. In
addition, more locally targeted and territorial differentiated measures have higher
transaction costs. Higher transaction costs apply in more heterogeneous local
conditions, due to asset specificity and to the perceived risk of lock-in by farmers9.
8 The European Commission defines 'gold-plating' in the context of Smart Regulation, by referring to the '[…]
transposition of EU legislation, which goes beyond what is required by that legislation, while staying within legality.
Member States have large discretion when implementing EC directives. They may increase reporting obligations, add
procedural requirements, or apply more rigorous penalty regimes. If not illegal, 'gold-plating' is usually presented as
a bad practice because it imposes costs that could have been avoided' 9 Meaning they have limited ‘free choice’ or flexibility in decision

Analysis of administrative burden arising from the CAP
16
Features of measures causing costs
Other aspects depend more directly on the feature of the measures: a) scope of the
scheme may increase complexity and design costs; b) the possibility of taking up
multiple measures together can instead reduce costs for application management; c)
the possibility for farmers to cooperate may reduce the costs for public administration
(though may increase private costs at least of some types); d) the degree of
monitoring and controls needed (the higher the controls, the higher the transaction
costs); e) the timing in the program and the life cycle of a policy; transaction costs can
decrease over time due to learning and improvement of procedures (with stable rules).
An important set of determinants is concerned with the institutional environment.
This includes broad political issues, such as instability and degree of conflicting
attitudes in an area. More practically, the number of parties involved, the
contextual rules, the status quo linked to path dependency10 can all contribute to
rather different levels of costs.
Natural environment can affect transaction costs due to different levels of
complexity or heterogeneity. Notably, different types of transaction costs may be
related, positively or negatively with each other. For example, higher costs for
stakeholders participation in an early stage of the scheme development can
produce better compliance and hence reducing monitoring and control costs.
Empirical studies show that complexity of schemes is the most influencing factor
affecting paying agencies’ transaction costs in AES11.
From the discussion above, it emerges that the actual costs may depend both on
objective characteristics of prescription (and their complexity) and on preferences
and behaviour by the actors involved12. The latter may be the most difficult
component to detect and is also the most difficult to act upon, as it implies long
terms actions building knowledge, trust and confidence with measures.
Private transaction costs
Private transaction costs are costs borne by farmers or other private actors. They
are affected by largely the same variables as for the public transaction costs, but,
in addition, they are strongly affected by the design of the applied policy
instruments and by the public administrative procedures. Depending on the
scheme, these costs can be more or less compensated by payments (as is the case
for transaction costs in the calculation of some second pillar payments) or be left as
a net burden to farmers. Rather important for farmers, more than for the public
administration, transaction costs not readily detectable from the time spent or
accounting calculations may be important. This includes, e.g. uncertainty and risk
perceptions and personal attitudes against complex administrative procedures.
In terms of wider interpretations, the topic can be further cast in the issue of the
political economy of decentralisation and subsidiarity and hence in the wider
10 Path dependence explains how the set of decisions one faces for any given circumstance is limited by the decisions
one has made in the past 11 e.g. Mettepenningen, Beckmann and Eggers (2011) https://ideas.repec.org/a/eee/ecolec/v70y2011i4p641-650.html 12 Nilsson (2009): Personal and social factors that influence pro-environmental behavior

Analysis of administrative burden arising from the CAP
17
context of decentralised strategic programming13. Indeed, while there is a growing
attention to transaction costs from policies, implications for planning and measure
design are still poorly considered in real-life decision-making processes and policy
evaluations14.
2.1.2 Definitions applied in this study
The focus of this study is on administrative costs of IACS for paying agencies
including the perspective on administrative burden from a farmers position. We
therefore define as “administrative costs” what is in the scientific literature referred
to as transaction costs, distinguishing between administrative costs for authorities
(public transaction costs) and farmers (private transaction costs).
Figure 3 Transaction cost, administrative cost and burdens
Source: Author’s own elaboration
Administrative costs can be further divided into the subcategories of compliance
costs and administrative burdens.
Table 1 Cost definitions used in this study
Cost categories Definition
Administrative costs All costs related to the set-up, running and management
and control of IACS related measures
Compliance costs Costs for complying with relevant legislation e.g. the
implementation of certain requirements
Administrative burdens Information obligations and related activities due to the
legislation related to IACS
Source: Author’s own elaboration
13 Beckmann, Eggers and Mettepenningen (2009), “Deciding how to decide on agri-environmental schemes: the political
economy of subsidiarity, decentralisation and participation in the European Union”. 14 Shahab, Clinch and O’Neill (2018), “Estimates of Transaction Costs in Transfer of Development Rights Programs”.
Analysis of administrative burden arising from the CAP
18
The main difference between most compliance costs and administrative burdens is
that the former usually include a certain amount of what is called “Business-as-
Usual” costs, hence costs that would also occur in the absence of legislation.15
Administrative burdens on the other hand only occur due to the legislative
requirements of providing and collecting information.16 Given that one could argue
that the absence of CAP legislation would lead to no remaining activities of paying
agencies (directly or indirectly linked to information obligations17), it is harder to
distinguish between compliance cost and administrative burden for them. Based on
this reasoning the European Commission in its Impact Assessment for the new
CAP18 follows the previous assessment19 establishing that only less than 5% of
administrative cost can be expected to occur also in absence of legislation and
hence the remainder can be defined as administrative burden. However, the term
“burden” is often affiliated in the public debate with unnecessary obligations and
gold-plating that should be abolished and not in its methodological “neutral” sense.
In this report, we thus for public authorities do not distinguish between
administrative costs and burdens, assessing and describing the higher level
category of administrative costs. In contrast, for farmers, we focus on
administrative burdens.
2.2 Approach and methodologies chosen
Building on the context and objectives of this study and the considerations
emerging from scientific literature of previous assessments, an approach was
chosen that acknowledges the specificities of the CAP 2014-2020 and its efforts
towards a greater simplification and flexibility for MS, as well as the complexity
inherent in the controls and checks that are required. The chosen methodologies
build on the EU Better Regulation Guidelines (revised in 2017) for assessing
administrative burden for businesses and administrations due to EU regulations
using the definitions established above. For information collection overall literature
review, extensive case study work including farmers’ interviews and a validation
survey were used. The general logic behind the applied approach matching
methodologies and data sources with the sub-objectives (as defined in Chapter 1)
is depicted in the following figure and summarised thereafter.
15 CEPS (2013): Assessing the costs and benefits of regulation 16 European Commission Better Regulation Toolbox, see: http://ec.europa.eu/smart-
regulation/guidelines/docs/br_toolbox_en.pdf 17 NOTE: we interpret monitoring, and control activities as information obligations 18 SEC(2011) 1153 final/2: Common Agricultural Policy towards 2020 Annex 9 19 EU Project on Baseline Measurement and Reduction of Administrative Costs, 2010,
http://ec.europa.eu/smartregulation/refit/admin_burden/docs/enterprise/documents/files/abs_development_reduction_r
ecommendations_en.pdf

Analysis of administrative burden arising from the CAP
19
Figure 4 Project approach
Source: Author’s own elaboration
2.2.1 Key methodologies for cost identification and assessment
To analyse administrative costs and burdens of the CAP and identify their sources
we rely on a mix of two specific methods tailored to the specific context of this
study:
Standard Cost Modelling (SCM): allows to address the costs and burdens of
CAP requirements for paying agencies. It allows the quantification of actual costs
(i.e. financial/time costs) resulting from CAP regulatory requirements (for paying
agencies at MS level), to enable an assessment of the extent to which the CAP is
deemed efficient;
Gold-plating Analysis (GPA): provides a specific methodology to structurally
and qualitatively identify Member State decisions on policy implementation
potentially increasing costs. While the SCM is part of the EU Better Regulation
Toolbox, GPA is a method developed by Ecorys as part of previous Administrative
Burdens studies related to the CAP.20
Through this combination, the approach allows for a better identification of possible
corrective actions (i.e. fitness checks) in addressing persisting or new burdens in
the CAP implementation.
20 European Commission (2017): Better Regulation “Toolbox”, available at: http://ec.europa.eu/smart-
regulation/guidelines/docs/br_toolbox_en.pdf , European Parliament, Directorate-General for Internal Policies, Policy
Department D. Budgetary Affairs (2014): “Gold-plating' in the EAFRD: To what extent do national rules unnecessarily
add to complexity and, as a result, increase the risk of errors?”, available at:
http://www.europarl.europa.eu/RegData/etudes/etudes/join/2014/490684/IPOL-JOIN_ET(2014)490684_EN.pdf

Analysis of administrative burden arising from the CAP
20
A third methodology, which inspired the approach chosen for this study is the
Cumulative Cost Assessment (CCA), which aims to identify, assess and, where
possible, quantify the cumulative costs generated by selected areas of EU
legislation on a given industrial sector. The assessment of regulatory costs is based
on a holding’s cost structure. The CCA in its original format was designed for the
assessment of costs for industry and has features which extend beyond the scope
of this study. However, the following two features were used to reinforce and
complete the approach chosen:
expansion of the SCM to a broader set of requirements: by referring to a number
of regulatory requirements (and in this sense to slot in additional costs due to
MS and regional relevant regulations that go beyond EU CAP requirements;
allowing the assessment of cumulative costs of different legislative acts:
providing a framework for avoiding double-counting in areas where regulation
overlaps.
As in the case of other better regulation instruments, the CCA was not originally
designed to judge the content of policies:21 it is rather a method of insight
generation that potentially feeds into further policy decisions. Yet, the CCA is in
some ways more appropriate to policy analysis than a method such as cost-benefit
analysis; or a process-oriented instrument built on specific steps, such as
regulatory impact assessment.
2.2.2 General approach for case studies
Twelve Member State case studies22 provide the core evidence base for this study.
They were used to collect both quantitative and qualitative information for all study
themes to shed more light on the functioning of the different IACS systems and the
administrative costs stemming from these systems. The selection of case studies
focused on identifying cases, which represent a typical coverage of different types
of CAP implementation and national/regional context. This allowed for the
extrapolation of results to the EU level and the formulation of conclusions for all
Member States.
In each case study, evidence was collected via a combination of desk research,
interviews with paying agencies, and inquiry with other related stakeholders and
farmers (farmers’ interviews).
2.2.3 Extrapolation of findings
The case studies were selected on the basis that they would cover a range of
different approaches to CAP implementation, focus areas and contextual settings
(e.g. geographical and economic context, CAP priorities etc.). For the qualitative
study questions this provided a strong evidence base for a Thematic Cross Analysis,
providing the basis to draw overarching conclusions for all EU Member States.
21 Claudio M. Radaelli, “Evidence-based policy and political control: what does regulatory impact assessment tell us?”,
presentation held at the ECPR Joint Sessions of Workshops, University of Rennes, France, April 2008. 22 Note: In the case of regional implementation of the CAP, typical regions were selected and analysed instead or
complementary to activities performed at the MS level.
Analysis of administrative burden arising from the CAP
21
In the case of quantitative information (personnel cost, investment cost etc.), the
extrapolation is more challenging. Firstly, data collection was not always possible at
the desired level of granularity due to a combination of factors such as non-
availability of data, non-existence of relevant monitoring structures, different
reporting practices, changes in staff, time constraints, confidentiality of data etc.
Consequently, data gaps had to be filled using methods such as cross-country
shadowing, contextual indicator comparison, typical cost breakdowns etc. An
additional input used was the European Commission, Directorate-General for
Agriculture and Rural Development (DG AGRI) cost of controls survey 2017. To
compare, aggregate and extrapolate, contextual indicators of agricultural structure,
country indicators, and CAP indicators (budget, beneficiaries etc.) were used.
Given the challenges in data collection and the sometimes heterogeneous
responses from Member States, we integrated an additional validation and
assessment of transferability check into our approach by installing a validation of
draft findings and hypotheses based on a preliminary report. In addition, key
findings of the farmers’ interviews were discussed with COPA-COGECA23.
2.2.4 Approach for setting up the framework for assessing LPIS Cost-Effectiveness
In addition to the assessment of the costs and burdens of CAP implementation, a
specific additional output of this study is to suggest a methodological framework for
measuring and monitoring the cost-effectiveness of implementing the Land Parcel
Identification System (LPIS) across EU Member States. As reported by the EU Court
of Auditors – and reinforced by the analysis of this study – Member States have
“difficulties in quantifying the overall investment cost of their LPISs, their annual
running costs and the cost of specific features, such as the LPIS update process or
the different LPIS layers or QA” (CoA 2016, p.25)24. As a result, “Member States
are not in a position to assess the cost‐effectiveness of system improvements”.
A Cost-effectiveness Framework (CEF) is therefore suggested to identify the specific
costs to be collected and compare these with the main effects of LPIS
implementation across EU Member States.
For the purpose of this analysis, LPIS can be considered cost-effective when it
efficiently allows Member States to unambiguously locate, identify and measure the
Maximum Eligible Areas (MEA) of the reference parcels declared by beneficiaries,
along with reliably checking the related administrative requirements and
information25. The assumption behind this analysis is that, although the
management of LPIS implies certain costs to be incurred by the Paying Agencies, in
the mid-term, it allows to increase efficiency of checks and controls and to reduce
errors incurred by beneficiaries. Importantly, in this respect, LPIS fosters the
overall digitalisation of the agricultural sector in Europe, towards fully automatized
national and EU policy management systems.
23 the union of the two big European agricultural umbrella organisations COPA and COGECA 24 https://www.eca.europa.eu/Lists/News/NEWS1610_25/SR_LPIS_EN.pdf 25 https://marswiki.jrc.ec.europa.eu/wikicap/index.php/LPISQA_Legacy/Rationale

Analysis of administrative burden arising from the CAP
22
The framework suggested focuses on the following areas of costs:
LPIS update, including the update of LPIS content (e.g. acquisition of new
imagery, photo-interpretation, updates as a result of evidence coming from OTS
checks or farmer’s request etc.);
LPIS upgrade, referring to system’s adjustments required to align with the
scope of new regulatory requirements;
furnishing application process, including the integration of information from
LPIS on reference parcels and incorporation of GSAA information on agricultural
parcels into LPIS/IACS; and
Enabling activities for administrative and OTS checks.
To set up the framework for assessing LPIS cost-effectiveness, the approach
includes:
Identification of LPIS objectives/activities;
Definition of some contextual variables to be considered in the analysis;
Definition of costs/results Indicators;
Set-up the overall Cost-Effectiveness Framework (to be used by MS);
Interpretation of the emerging data;
Comparison with additional existing indicators.
2.3 Limitations and robustness of the study
The analysis presented hereafter should be interpreted with awareness of the
following limitations:
The key source of information are 12 case studies: the study is based on
extensive research in 12 different Member States (or regions therein). While the
selection of case studies aimed at covering all major different types of CAP
implementation and contextual and agricultural settings, overall conclusions for
the EU still needed to be extrapolated. Despite the consecutive validation
exercise with responses from 21 Member States, a potential bias of results due
to the sample size cannot be fully excluded;
Dependency on cooperation and input information from Member States:
information collected (and in particular quantitative information) required the
extensive cooperation of paying agencies and farmers and their ability to
respond to the study questions. Unavailability for interviews, non-availability of
data/information, difficulties in estimating efforts and diverging reporting
structures reduced the evidence base, particularly at a very detailed level of
activities. At a more aggregate level of key activities in managing and running
IACS, sufficient data was available to estimate gaps. These estimates were
further validated by the paying agencies through the Committee for direct
payments;
Focus on costs and not benefits: the focus of quantification in the study lies
on costs and not on benefits. This should not be taken as implying that the CAP
creates costs in disproportion to its benefits. The purpose of focusing on the
costs is to identify opportunities for efficiency gain;
Extrapolation requires assumptions: extrapolating from a sample to the EU
requires assumptions (standard wage rates etc.). The assumptions used are

Analysis of administrative burden arising from the CAP
23
chosen in a way to reduce the risk of biases as much as possible. Nevertheless,
assumptions can lead to over- or underestimation of findings;
Speed and extent of implementation of new technologies and other
adjustments: differences in technology uptake or the capability of transforming
management and control structures affect the functioning of systems.
Consequently, the comparison of implementation between Member States is not
always based on the use of same systems or structures;
Implementation choices affecting cost estimates: differences in costs may
be due to different implementation choices. Where possible, the study aims to
identify the reasons for cost differences. In the case of a combination of
structural, technological and political (choices) differences, it is however not
always possible to identify the exact drivers of costs given that different issues
interact or their diverging impacts cross-compensate each other;
Combination of inputs and risk of overlaps: to enlarge the evidence base,
the DG AGRI cost of controls survey data was integrated in the estimates. Given
its partially diverging definitions and delineations in comparison to the study
themes and thus data collection tools, there is a risk of overestimating costs;
Overlap of study timing and MFF discussions: although the timing of this
study overlaps with discussion on the 2021-2027 Multiannual Financial
Framework (MFF), it is not focussed on the MFF but rather on improving the
systems which remain in place or new ones that may be setup. However, it
meant that the study’s data collection activities corresponded to a period when
paying agencies where heavily occupied and when sensitivities over sharing
detailed information on costs of operation were in a heightened state;
Timing of the study in relation to the publication of the proposals for the
CAP after 2020: this study was conducted to assess the implementation of the
CAP 2013 reform. It was designed before the publication of the proposals for the
CAP after 2020. As a consequence it does not provide an in depth analysis in the
implications of the proposals on the administrative costs.
To mitigate the risks, which emerged due to the limitations stated above, extensive
quality checks and a validation exercise have been conducted. The quality checks of
individual data points consisted of:
Internal and external data consistency checks: assessment of the logical
consistency of data provided, the magnitude of inputs and hence the statistical
identification of reporting errors;
Outlier identification: cross country checking to identify specific outliers for
further assessment;
Validation and verification: additional verification with the original
interviewees if outliers of data or inconsistencies can be clarified. Overall,
validation of country estimates and overall cost estimates and drivers in the form
of a survey addressed to the paying agencies and distributed through the
Committee for direct payments survey.


Analysis of administrative burden arising from the CAP
25
3 Functioning and development of IACS related activities
This chapter presents the context of the analysis. It provides a historical
background, outlines the key CAP reforms (Section 3.1) and describes the general
functioning of IACS and related mechanisms (Section 3.2). As such, this chapter
helps to better place the analysis of IACS and its components in a wider context of
the CAP and its simplification efforts.
3.1 Evolution of the CAP
Historical Background
The CAP aims to provide a decent standard of living for farmers and viable food
production for European citizens, while contributing to sustainable management of
natural resources and combating climate change.26 Since its inception in 1962,
reforms of the CAP have seen it evolve from a system primarily based on
guaranteed prices, export subsidies and tariffs and quotas to a system operating
through direct payments to farmers and with a greater orientation towards
environmental sustainability.
In 1992 the so-called 'MacSharry reforms’ initiated the shift from product support
to producer support. This support would mainly be controlled by a new Integrated
Administrative Control System (IACS) focusing on checking the accuracy of
farmer’s declared area and livestock headage claims, with associated reduction and
penalties where relevant.
In 2000 the Pillar II of the CAP27 was introduced, giving Member States discretion
under their agreed rural development programmes to introduce agri-environmental
and other measures that best suited their environmental aims and taking the form
of multi-annual schemes not aimed at meeting a specific outcome or obligation in a
single year. These fell under the IACS umbrella, with checks needed to ensure
against double benefits or incompatible uses on the same area of land.
The CAP 2003 reforms removed the link between subsidies and production. Farmers
were now able to receive income support based on a “payment entitlement”,
providing that they met cross-compliance obligations in terms of looking after their
land and meeting food safety, environmental, and animal health and welfare
standards. Member States were given greater flexibility over direct payments,
including the ability to retain a proportion of their budgetary ceilings to meet local
policy aims and which could be spent through existing or new coupled schemes
linked to specific areas of production. The reforms also ended a number of market
measure schemes, the value of which was incorporated in entitlement budgetary
ceilings. Further, SAPS - a simplified income support scheme not requiring the
26 https://ec.europa.eu/info/food-farming-fisheries/key-policies/common-agricultural-policy/cap-glance_en 27 Pillar I: Direct Payments; Pillar II: Rural Development

Analysis of administrative burden arising from the CAP
26
establishment of entitlements - was made available to countries joining the EU in
2004 and 2007, with ten out of twelve using this option.
Simplification of the CAP has been an ongoing process since the early nineties.
However, it gained additional impetus in 2005 with the “simplification initiative”
that formed part of the Lisbon Strategy and the Commission’s overall strategy for
simplification28. In addition a study on the administrative burden arising from the
Pillar I of the CAP in 2003 implemented in 200729 and focussing on the single
payment scheme, found a large impact of public sector use of IT solutions, as well
the provisions of prefill forms, on administrative costs and burden both
administrations and beneficiaries. Variations in administrative burden between
Member States were also attributed to the size of national agricultural sectors and
administrative structure and processes (e.g. being subject to rules of different
regions, assistance in filling in forms, the magnitude of certain one-off costs). In
2009, this culminated in the publication of the Communication “A simplified CAP for
Europe - A success for all” which brought simplifications to the Single Payment
Scheme and other support schemes. What followed were major efforts across EU
priority areas, including agriculture and agricultural subsidies, under the “Action
Programme for the Reduction of the Administrative Burden”. Moreover, studies
were commissioned30 and the results presented by the “High Level Group
Independent Stakeholders on Administrative Burdens”31.
The CAP 2013 reform
Simplification has also been at the core of the CAP 2013 being named one of the
core objectives and key requirements in Regulation (EU) No 1307/2013.32 It thus
neatly fits into the ongoing debate of previous CAP reforms33 particularly as certain
measures imply direct costs and could interfere with beneficiaries’ business
decisions.
Building on the existing two-pillar structure, the CAP 2013 reform34 aimed to
strengthen the economic and ecological competitiveness of the agricultural sector,
to promote innovation, to combat climate change and to support employment and
growth in rural area. New features of the reform package included:
A new architecture of direct payments (basic payment scheme/single area
payment scheme integrating pre-conditions for active farmers to access other
decoupled direct payments);
A compulsory payment element for agricultural practices beneficial for the
climate and the environment (the so-called ‘greening’ measures); and
A compulsory payment scheme for targeting young farmers: the young farmers
scheme.
Member States also got the possibility to further target direct payments through
other optional schemes. To provide more targeted support to small and medium
28 http://europa.eu/rapid/press-release_MEMO-05-382_en.htm?locale=en 29 DG AGRI, Study on administrative burden reduction associated with the implementation of certain Rural Development
measures (2011). The study analysed four groups of cost drivers: (i) transposition of CAP regulations, (ii) public administration, (iii) business culture, and (iv) national or cultural differences between the studied Member States
(Denmark, France, Germany, Ireland and Italy). 30 e.g. Capgemini (2010): EU Project on Baseline Measurement and Reduction of Administrative Costs 31 http://europa.eu/rapid/press-release_MEMO-14-574_en.htm 32 REGULATION (EU) No 1307/2013 OF THE EUROPEAN PARLIAMENT AND OF THE COUNCIL 33 http://ec.europa.eu/agriculture/simplification/index_en.htm 34 http://eur-lex.europa.eu/LexUriServ/LexUriServ.do?uri=COM:2010:0672:FIN:en:PDF

Analysis of administrative burden arising from the CAP
27
sized farms, Member States can apply a redistributive payment to the first eligible
hectares of the farms. Moreover, to reduce their administrative burden, Member
States can apply a specific and simplified support scheme for small farmers and are
permitted to continue to grant limited coupled support to potentially vulnerable
sectors. Further, Member States may also grant payment for areas with natural
constraints.
The CAP 2013 reform also provided Member States with additional flexibility in
implementation choices. Particularly important is the flexibility to transfer 15%35 of
their direct payment envelope between the two pillars.36
Basic payments are made either through the basic payment scheme (BPS) or the
single area payment scheme (SAPS). Member States operating the BPS are
expected to shift away from direct payments calculated on an historic basis,
towards a uniform (national or regional) rate per hectare. Member States that
implement SAPS, which is a flat payment per hectare, can continue to do so until
2020. Moreover, payments under both schemes are to be reduced for those in
receipt of over €150,000 of basic payment. Member States also have the option
to introduce a redistributive payment (subject to a maximum limit) as a proportion
of ‘first eligible hectares’ of farms. Member States that allocate over 5% of the
national ceiling to these types of payments may, if they so choose, decide not to
implement the reduction of payments rules. The new greening measures also
provide significant flexibility to better reflect the diversity of environmental and
production conditions across the EU.
For Pillar II, one of the most important changes is the removal of the previously
existing four axes37. They have been replaced by six common EU priorities and
multiple focus areas.
Priorities and focus areas of the rural development programmes
1. Fostering knowledge transfer/innovation in agriculture, forestry, and rural
areas:
Innovation and the knowledge base in rural areas;
Links between agriculture and forestry and research and innovation;
Lifelong learning and vocational training in the agricultural and forestry sectors;
2. Enhancing competitiveness of all types of agriculture and enhancing farm
viability:
Restructuring of farms facing major structural problems, notably farms with a low
degree of market participation, market-oriented farms in particular sectors and
farms in need of agricultural diversification;
Generational renewal in the agricultural sector;
3. Promoting food chain organisation and risk management in agriculture:
Primary producers into the food chain through quality schemes, promotion in local
35
Some Member States were allowed to transfer up to 25% of their Pillar II funds to Pillar I, see Article 14(2) of Regulation (EU) No
1307/2013 or point 2.3 of the information fiche available here: https://ec.europa.eu/agriculture/sites/agriculture/files/direct-
support/direct-payments/docs/direct-paymenst-financial-mechanisms_en.pdf. 36 DG AGRI (2015). Presentation on “The CAP towards 2020: the links between Pillar I and Pillar II”. See also
Commission Delegated Regulation (EU) No. 1378/2014. 37 Axis 1: Improving the competitiveness of the agricultural and forestry sector; Axis 2: Improving the environment and
the countryside; Axis 3: Improving the quality of life in rural areas and encouraging diversification of the rural
economy; Axis 4: LEADER.
Analysis of administrative burden arising from the CAP
28
markets and short supply circuits, producer groups and inter-branch organisations;
Farm risk management;
4. Restoring, preserving and enhancing ecosystems dependent on agriculture
and forestry:
Biodiversity, including in Natura 2000 areas and high nature value farming, and
the state of European landscapes;
Water management;
Soil management;
5. Promoting resource efficiency and supporting the shift towards a low carbon
and climate resilient economy in agriculture, food and forestry sectors:
Efficiency in water use by agriculture;
Efficiency in energy use in agriculture and food processing;
Supply and use of renewable sources of energy, of by products, wastes, residues
and other non-food raw material for purposes of the bio-economy;
Reduce nitrous oxide and methane emissions from agriculture;
Carbon sequestration in agriculture and forestry;
6. Promoting social inclusion poverty reduction and economic development in
rural areas:
Diversification, creation of new small enterprises and job creation;
Local development in rural areas;
Accessibility to, use and quality of information and communication, technologies
(ICT).
Source: DG AGRI (2015)
Aside from implementation modalities and technicalities, Member States can choose
the focus of the measures under these six priorities. There are also possibilities to
link the two pillars by:
complying with greening through equivalent measures under Pillar II;
supporting young and small farmers through both Pillar I and Pillar II
interventions;
supporting areas facing natural constraints either under Pillar I or Pillar II;
providing an option to link the risk management toolkit under Pillar II to direct
payments and market measures under the common market organisation (CMO);
providing cooperation support under Pillar I, Pillar II and market measures
(CMO).
Overall, because of the additional flexibility introduced by the CAP 2013 reform,
attainment of the CAP objectives (as specified in Art. 110 (2) of Reg. (EU) No
1306/2013 of the European Parliament and of the Council) and administrative
complexity can be substantially influenced by the range and combination of
implementation choices made by Member States under both the Pillar I and Pillar
II.
Administrative burden and simplification in the CAP 2013 reform
Given the complex and multi-faceted nature of the CAP 2013 reform, it is not an
easy task to assess the administrative costs associated to CAP regulation and its
implementation. Generally, throughout the CAP implementation process, the
range of administrative requirements for beneficiaries, managing

Analysis of administrative burden arising from the CAP
29
authorities and paying agencies has grown.38 National and Regional
regulations, further definition and description of measures within Rural
Development Programmes, administrative requirements for the management of
specific projects co-funded under RDP measures, and potential yearly changes of
priorities, mean that even within one Member State it is extremely difficult to
describe and assess the highly complex situation of policy implementation.
Comparing across Member States, the CAP 2013 reform contributed additional
complexity by making implementation processes even more
heterogeneous, as it gave Member State greater autonomy in the implementation
of measures and regulations for both Pillar I and II. At the level of national
authorities, the diversity of CAP implementation choices means that it is almost
impossible to make an overall assessment of CAP administrative requirements, and
their consequential costs. It is nevertheless possible to select a relevant range of
different implementation options across EU Member States and different
institutional settings that characterise such implementation.
The flexibility provided under the CAP 2013 reform aims to allow Member States to
find the best solution tailored to their specific context and thus reduce
administrative burden. For instance, Member States have favoured different
mechanisms for allocating payment entitlements (e.g. exclusions of some areas,
transition to flat rate value, different flat rate values depending on the region).
However, the impact assessment conducted by the European Commission before
the CAP 2013 reform (based on the initial Commission proposal) pointed to
concerns among stakeholders that these different mechanisms might not result in
the most efficient choices for them. In addition, it provided some early indications
of the related administrative burden, particularly for compliance with information
obligations arising from Pillar I regulations (Annex 8 - Simplification39). The
assessment came at a very early stage of discussions for new CAP regulations, but
provides a basis for the assessment under this study. Notably, the impact
assessment provided estimates of the change (addition) in administrative costs
arising from changes in legal obligations for direct payments post-2013:
about €354 million estimated for businesses (of which about 80% due to pure
administrative burden);
about €32 million estimated for public authorities (of which about 5% due to
pure administrative burden).40
From these estimates, compared to the previous CAP regulation, the CAP 2013
reform was expected to cause an approximately 15% increase of administrative
cost of the direct payment system.41
The impact assessment also highlighted how changes in administrative burden are
strongly affected by policy choices. For example, the small farmers scheme, where
great efforts have been made to simplify requirements for this beneficiary group,
resulted in an estimated total reduction of €126 million. Conversely, greening
38European Parliament, Directorate-General for Internal Policies, Policy Department D. Budgetary Affairs (2014): “Gold-
plating' in the EAFRD: To what extent do national rules unnecessarily add to complexity and, as a result, increase the
risk of errors?”, available at: http://www.europarl.europa.eu/RegData/etudes/etudes/join/2014/490684/IPOL-JOIN_ET(2014)490684_EN.pdf
39 European Commission (2011) : CAP Impact Assessment - Annex 8, see : http://ec.europa.eu/agriculture/policy-
perspectives/impact-assessment/cap-towards-2020/report/annex8_en.pdf 40 The average wage-per-hour was adjusted to take account of the differing wage levels in EU Member States (based on
PPS coefficients) 41 European Commission (2011) : CAP Impact Assessment - Annex 8, p. 24., see :
http://ec.europa.eu/agriculture/policy-perspectives/impact-assessment/cap-towards-2020/report/annex8_en.pdf

Analysis of administrative burden arising from the CAP
30
schemes aimed at ensuring that payments go to environmentally sustainable
solutions, processes and products, were estimated to create additional costs for
businesses (i.e. farmers) of in total €299 million.
In 2014, a screening exercise launched by Commissioner Hogan42, which assessed
agricultural policy in its entirety, identified elements that could be simplified and
that could be better left to the Member States.43 In this respect, the following were
identified among the priorities:
Every policy proposal will be screened and evaluated in terms of
simplification, so that simplification potential will be reinforced in the legislative
process where possible;
The new direct payments regime will be reviewed in terms of
administrative burden, in particular - but not limited to - the rules on EFAs.
In 2016, a study on implementation of the 2014 – 2020 CAP, conducted by Ecorys44
provides a preliminary assessment of the administrative burdens for both public
administrations and beneficiaries.
Previously identified sources of administrative burden arising from CAP
implementation
Adaptation of the IACS. Adapting IACS to support the management of new CAP
requirements has proved a complex task for public authorities. Specifically, control
requirements and requirements on the on-the-spot checks that are often perceived
by public authorities to be too rigid, leading to undue administrative costs. To
minimise negative impacts, administrations’ efforts have focussed on making
implementation choices on those areas where administrative costs of meeting
implementation requirements were not expected to overwhelm benefits;
Insufficient past investments in LPIS. Public authorities that were unable to
make sufficient earlier investments to assure efficient information systems for
mapping landscape features (e.g. remote control, satellite systems), appear to
encounter particular difficulties in the proper implementation of new CAP regulations;
Inefficient MS systems for on-the spot controls: systems set up for such
controls are not organised in an efficient manner to avoid unnecessary burdens;
Recalculation of eligibility and payment criteria. New requirements (e.g.
Greening, BPS) necessitating accurate analysis of local trends and needs (in extreme
cases resulting in 1 000 pages of analysis) resulted in significant additional burden on
administrations with limited capacity/experience (e.g. new Member States) or with
more complex country systems involving decentralised implementation systems that
require decisions to be coordinated across various governance levels (e.g. Southern
Member States);
Interplay of CAP regulations across the two pillars. Particularly in relation to
land measures and also cross-compliance, implementation of RDP is challenging for
some countries. This seems to be more the case for some Southern and New Member
States with more limited capacity and capabilities and complex implementation
systems that create challenges for the promotion of synergies between central and
regional authorities.
Source: Ecorys (2016)
42 https://ec.europa.eu/agriculture/cap-overview/simplification_en 43 http://europa.eu/rapid/press-release_SPEECH-14-2343_en.htm 44 European Commission (2016): Mapping and analysis of the implementation of the CAP, see:
https://ec.europa.eu/agriculture/sites/agriculture/files/external-studies/2016/mapping-analysis-implementation-
cap/fullrep_en.pdf

Analysis of administrative burden arising from the CAP
31
The 2017 open public consultation on simplifying and modernising the CAP,
corroborates the findings of the Ecorys study.45 Respondents highlighted that the
amount and accuracy of the required paperwork and the complexity of
continuously changing applications for premia, subsidies or grants are the
most important factors that add to their administrative burden. The stacking
of different rules related to CAP instruments and measures, and the lack of
transparency related to controls were indicated as factors increasing complexity and
the perceived risk of being sanctioned or penalised. Furthermore, many
respondents indicated that the burden relating to greening seems disproportionate
to its environmental impacts, with specific references made to the definition of
permanent grassland and the ecological focus areas. Respondents suggested that
simplification opportunities could arise from granting more flexibility to farmers in
implementing environmental measures and through adopting a more results-based
approach, which could potentially be more effective. Furthermore, they suggested
the CAP could be simplified through the use of ICT applications and
databases to reduce controls, especially when combined with e-
government services.
At the end of 2017, the European Commission published a communication on the
Future of food and farming46, which recognised the need to “significantly
decrease bureaucracy and administrative burden”. The communication recognised
that EU level requirements are detailed and feature tight controls, penalties and
audit arrangements. Considering the highly diversified farming landscape in Europe,
the role of the union should be to set basic policy parameters, while placing greater
responsibilities on Member States to decide how they will reach policy targets,
including a larger role in designing the compliance and control framework. In
conclusion, the spirit of the communication is to reduce the prescriptive nature of
the CAP at EU level, thereby favouring more integrated and innovative approaches.
Furthermore, the future delivery system should aim to be more result-driven,
making use of opportunities to reduce the cost and burden of control though
simplified cost options and use of modern technologies.
45 European Commission, Directorate-General for Agriculture and Rural Development (2017): “Modernising and
Simplifying the Common Agricultural Policy: Summary of the results of the Public Consultation”, available at:
https://ec.europa.eu/agriculture/sites/agriculture/files/consultations/cap-modernising/summary-public-consul.pdf 46 European Commission (2017). COM (2017) 713 final. The future of food and farming.
https://ec.europa.eu/agriculture/sites/agriculture/files/future-of-
cap/future_of_food_and_farming_communication_en.pdf

Analysis of administrative burden arising from the CAP
32
The Omnibus Regulation, which sets out the financial rules applicable to the
general budget of the Union, includes a proposal for a further simplification exercise
of the four CAP regulations to the benefit of both farmers and national
authorities47,48. The agricultural provisions of the Omnibus Regulation49 were
approved on 12 December 2017 and entered into force on 1 January 2018. In
terms of simplification, key amendments include:
Direct Payments Regulation (Reg. (EU) No. 1307/2013). The active farmer
definition has been made optional to Member States, greater flexibility is given
to Member States in the rules related to Permanent Grassland, and other aspects
of the Greening payment are simplified;
Rural Development Regulation (Reg. (EU) No. 1305/2013). The use of
financial instruments is simplified, and coherence with other EU Structural and
Investment Funds is improved;
Horizontal regulation (Reg. (EU) No. 1306/2013). The procedure for
controlling financial discipline is simplified, and is placed under single
management of the Commission.
Proposed CAP post 2020
In June 2018, the European Commission published its proposal for the CAP post-
2020. The legislative changes proposed by the European Commission revolve
around modernisation and simplification. Furthermore, the CAP 2013 reform will
shift away from rules and compliance towards a more results and performance-
oriented approach, while allowing greater flexibility to Member States.
The main features of the Commission’s proposal for a modernised and simplified
CAP include:
a focus on strategy and objectives;
a fairer subsidy system;
a focus on environmental and climate actions.
Member States will have more flexibility to design measures targeting
national and regional needs, and more flexibility when agreeing strategic
plans with the EU for the application of controls, which should provide a
better fit to the package of measures they put in place. Member States will produce
performance reports that show how these measures have been applied.
The figure below presents the nine objectives of the future CAP set out in the
Commission’s proposal. Member States’ national strategic plans will be subject to
approval by the Commission and Member States will have to report on progress on
an annual basis, with under-performance subject to possible suspension of
payments.
47 Council of the EU (2017). Omnibus Regulation: Agricultural rules. http://www.consilium.europa.eu/en/policies/cap-
simplification/omnibus-regulation-agriculture/ 48 Council of the EU (2017). Omnibus regulation: Council adopts new, simplified, agricultural rules.
http://www.consilium.europa.eu/en/press/press-releases/2017/12/12/omnibus-regulation-council-adopts-new-
simplified-agricultural-rules/ 49 PRE-CONS 56/17. http://www.consilium.europa.eu/media/32072/pe00056en17.pdf

Analysis of administrative burden arising from the CAP
33
Figure 5 CAP objectives for 2020 - 2026
Source: https://www.agronaplo.hu/nagyvilag/common-agricultural-policy-post-2020-simplification-and-
modernisation
As with the CAP 2013 reform, Member States will have the possibility to transfer
15% of their CAP allocations between the two pillars. In addition, Member States
may choose to transfer an additional 15% from Pillar I to Pillar II to support
environmental and climate actions. The proposal sees IACS as a key element of
control of CAP expenditure.
Direct payments, which will continue to represent 74% of the overall CAP budget,
will remain at the core of income support to farmers. Payments will occur in the
form of an annual decoupled payment per eligible hectare. The CAP after 2020
aims to change the distribution of financial means across farm holdings
(20% of farmers receiving 80% of payments), by proposing an updated system of
interventions. This system will encourage small and medium-sized farms, via a
reduction of payments exceeding €60,000 and an aid capping of payments
exceeding €100,000. Member States will have to set aside an amount
corresponding to at least 2% of the annual direct payments allocation to support
young farmers.
The CAP after 2020 will require farmers to achieve a higher level of ambition
through both mandatory, and incentive-based measures. A mandatory proportion
(30%) of payments to farmers under Pillar II will be conditional upon environmental
and climate requirements. Greening will be discontinued, but several of its
principles will be carried forward under the conditionality compliance
structure. In addition, it will be mandatory for Member States to introduce eco-
schemes to incentivise farmers to go beyond mandatory requirements with regard
to environmental and climate action. Participation in these eco-schemes will be
Analysis of administrative burden arising from the CAP
34
voluntary for farmers. Overall, it is expected that 40% of the CAP budget will
contribute to climate action.
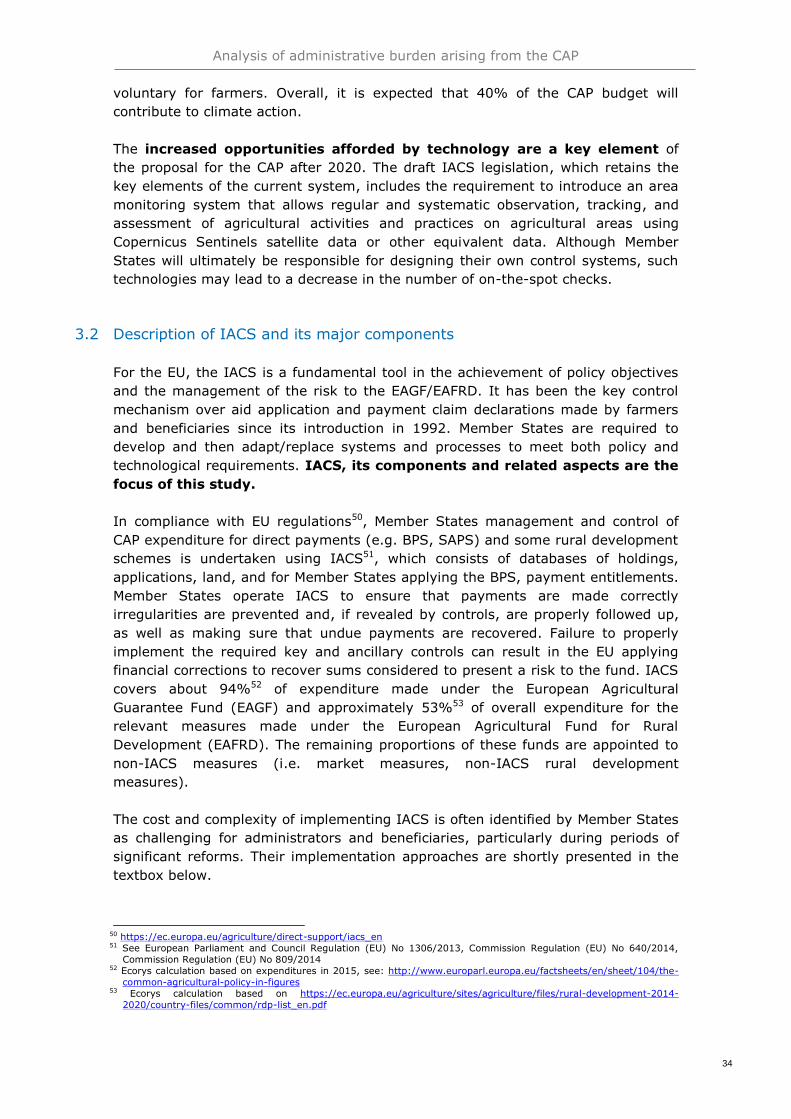
The increased opportunities afforded by technology are a key element of
the proposal for the CAP after 2020. The draft IACS legislation, which retains the
key elements of the current system, includes the requirement to introduce an area
monitoring system that allows regular and systematic observation, tracking, and
assessment of agricultural activities and practices on agricultural areas using
Copernicus Sentinels satellite data or other equivalent data. Although Member
States will ultimately be responsible for designing their own control systems, such
technologies may lead to a decrease in the number of on-the-spot checks.
3.2 Description of IACS and its major components
For the EU, the IACS is a fundamental tool in the achievement of policy objectives
and the management of the risk to the EAGF/EAFRD. It has been the key control
mechanism over aid application and payment claim declarations made by farmers
and beneficiaries since its introduction in 1992. Member States are required to
develop and then adapt/replace systems and processes to meet both policy and
technological requirements. IACS, its components and related aspects are the
focus of this study.
In compliance with EU regulations50, Member States management and control of
CAP expenditure for direct payments (e.g. BPS, SAPS) and some rural development
schemes is undertaken using IACS51, which consists of databases of holdings,
applications, land, and for Member States applying the BPS, payment entitlements.
Member States operate IACS to ensure that payments are made correctly
irregularities are prevented and, if revealed by controls, are properly followed up,
as well as making sure that undue payments are recovered. Failure to properly
implement the required key and ancillary controls can result in the EU applying
financial corrections to recover sums considered to present a risk to the fund. IACS
covers about 94%52 of expenditure made under the European Agricultural
Guarantee Fund (EAGF) and approximately 53%53 of overall expenditure for the
relevant measures made under the European Agricultural Fund for Rural
Development (EAFRD). The remaining proportions of these funds are appointed to
non-IACS measures (i.e. market measures, non-IACS rural development
measures).
The cost and complexity of implementing IACS is often identified by Member States
as challenging for administrators and beneficiaries, particularly during periods of
significant reforms. Their implementation approaches are shortly presented in the
textbox below.
50 https://ec.europa.eu/agriculture/direct-support/iacs_en 51 See European Parliament and Council Regulation (EU) No 1306/2013, Commission Regulation (EU) No 640/2014,
Commission Regulation (EU) No 809/2014 52 Ecorys calculation based on expenditures in 2015, see: http://www.europarl.europa.eu/factsheets/en/sheet/104/the-
common-agricultural-policy-in-figures 53 Ecorys calculation based on https://ec.europa.eu/agriculture/sites/agriculture/files/rural-development-2014-
2020/country-files/common/rdp-list_en.pdf

Analysis of administrative burden arising from the CAP
35
Implementation of IACS
Member States have adopted a range of technological approaches to meet IACS
requirements. Some have developed systems linking the various elements together to
perform the necessary checks. In other instances, they have installed commercially
available IACS/CAP specific software packages with pre-loaded common rules that can be
further configured to meet national and regional implementation policies and choices.
Some use web-enabled applications that allow beneficiaries to apply online, whilst others
allow use trusted third parties or regional offices.
In some Member States IACS is developed centrally. In others, some elements such as the
entitlement register are developed and held at national level and LPIS/claims databases
are developed and maintained at regional level. In other instances, paying agencies take
feeds of data from registered administrations elsewhere; for example where farmer’s
registration is managed by a different government department or agency. Given the
dynamic nature of the regulatory environment some Member States have invested in
business rules engines that allow rules to be reconfigured relatively swiftly, whilst others
may use a hard-coded solution. Some or all elements can be managed and developed in-
house, or alternatively outsourced to IT or service companies. All these variables may
have an impact on the speed, cost and complexity of the implementation of regulatory
changes.
Key IACS changes and technological requirements
In parallel with the major policy changes affecting the IACS legislation, which are
summarised in the previous section, changes in requirements coupled with
technological advances have created both needs and opportunities to strengthen
and enhance IACS. Key among the requirements and other factors influencing the
shape of IACS are the following:
requirements to cross-check claims under animal premia, voluntary coupled
support and cross-compliance obligations against animal registration databases;
opportunities to replace physical on-the-spot checks with the use of
remote sensing satellite imagery;
information requirements for LPIS, covering the incorporation of up-to-date
imagery or other mapping data spatially recording each agricultural parcel and
allowing the electronic cross-check against aid applications and payment claims
under direct payment and relevant rural development schemes;
requirements to pre-populate aid applications and payment claims with
recorded control data on previously declared land parcels and entitlements
including providing each claimant with up-to-date maps;
the opportunity to submit a single annual application for all IACS-related
aid schemes;
the opportunity to allow electronic submission of aid applications and
payment claims whilst still providing an equivalent service for those unable to do
so;
the introduction of additional information requirements for greening
including additional spatial layers in the LPIS to control ESG and chosen EFA
features;
the requirement to incrementally introduce GSAA allowing electronic and
spatial identification, as well as amendments to beneficiaries’ claims and land so
that by 2018, 100% of land on aid applications and payment claims are covered;

Analysis of administrative burden arising from the CAP
36
provisions to allow Sentinel satellite and other Earth observation data to
be used as evidence in control checks and cross-compliance requirements, along
with the ability to use evidence such as geo-tagged photos or other relevant
evidence submitted by the beneficiary and information from drones or other
aerial imagery.
Implementation approaches
EU regulations allow Member States to choose IACS policies and
implementation approaches that best suit their needs. As a result, variations
exist in Member States’ implementation of the different systems composing the
IACS, with the following models being identified:
Centralised model: all IACS databases and processes are managed and
administered by one central agency;
Regionalised model: responsibilities are shared between federal/central and
regional authorities/paying agencies. For instance, farmer and animal registers,
as well as the entitlement register, may be managed centrally, while claims and
land controls are managed at the regional level;
Multi-agency involvement: Member States may opt to have different agencies
administering EAGF and EAFRD claims, or may use more complex arrangements
for control and administration through local authorities and delegated inspection
and control bodies.
Figure 6 Administrative structure by Member State
Source: Author’s own elaboration

Analysis of administrative burden arising from the CAP
37
Other implementation dimensions that are also at the discretion of Member States
include:
entitlements type, i.e. regionalised on a geographic or topographic basis;
range of landscape features included in EFA;
inclusion of non-mandatory schemes (e.g. schemes for small farmers and VCS);
and
options for quantification of grassland areas.
Member States have pursued different IT implementation approaches.
Some use in-house development teams and others outsource part or all the
development to third party companies. Further, some Member States have a
network of third-party groups or structures on hand to assist or receive digital
applications and transfers, while others provide web-enabled services that allow
beneficiaries to enter their applications directly. And, in addition, levels of digital
sophistication of beneficiaries and administrations also differs across and within
Member States.
Differences in Member States choices over the various elements outlined above
have the potential to influence the complexity and costs of implementing and
managing IACS, particularly when changes take place. Chapter 4 of this report sets
out to identify and understand these differences and analyse their impact on costs.
A specific topic of interest is whether advances in the availability, frequency and
accuracy of satellite systems (e.g. Sentinel systems) can enhance or replace
existing methods of land data collection, such as aerial photography and national
land surveys. More broadly, it is important to identify if there are assistive
technologies currently in use or being considered by administrators, beneficiaries
and tin he wider market that have the potential to reduce administrative burden.
For example, are there robust geo-tagging solutions that can assist in areas such as
confirmation of crop type or achievement of retention periods, and that can provide
alternatives to more traditional control methods? Similarly, it is important to
consider the potential impact of future policy changes that under consideration on
the IACS framework and technology options and solutions.
3.2.1 IACS’ main components
The main components of the IACS are shown in the following figure and described
thereafter.
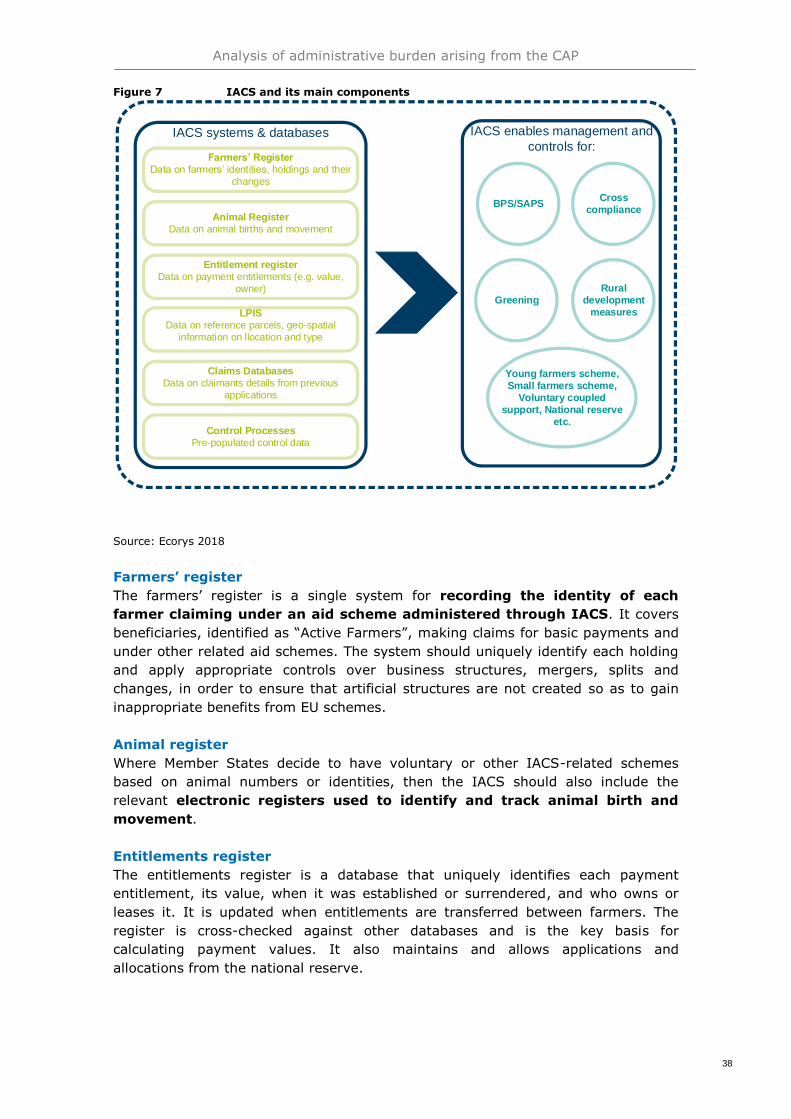
Analysis of administrative burden arising from the CAP
38
Figure 7 IACS and its main components
IACS systems & databases
Farmers’ Register
Data on farmers’ identities, holdings and their
changes
Animal Register
Data on animal births and movement
Entitlement register
Data on payment entitlements (e.g. value,
owner)
LPIS
Data on reference parcels, geo-spatial
information on llocation and type
Claims Databases
Data on claimants details from previous
applications
Control Processes
Pre-populated control data
IACS enables management and
controls for:
BPS/SAPSCross
compliance
Greening
Rural
development
measures
Young farmers scheme,
Small farmers scheme,
Voluntary coupled
support, National reserve
etc.
Source: Ecorys 2018
Farmers’ register
The farmers’ register is a single system for recording the identity of each
farmer claiming under an aid scheme administered through IACS. It covers
beneficiaries, identified as “Active Farmers”, making claims for basic payments and
under other related aid schemes. The system should uniquely identify each holding
and apply appropriate controls over business structures, mergers, splits and
changes, in order to ensure that artificial structures are not created so as to gain
inappropriate benefits from EU schemes.
Animal register
Where Member States decide to have voluntary or other IACS-related schemes
based on animal numbers or identities, then the IACS should also include the
relevant electronic registers used to identify and track animal birth and
movement.
Entitlements register
The entitlements register is a database that uniquely identifies each payment
entitlement, its value, when it was established or surrendered, and who owns or
leases it. It is updated when entitlements are transferred between farmers. The
register is cross-checked against other databases and is the key basis for
calculating payment values. It also maintains and allows applications and
allocations from the national reserve.
Analysis of administrative burden arising from the CAP
39
Claims Databases and control processes
The claims database is an integrated database for recording details for each
claimant taken from their aid applications and covering at least the previous
10 years. Provided compatibility between systems is maintained, claims databases
may be decentralised. The database is managed following an annual cycle, where
farmers submit applications for direct payment and IACS-relevant payment
schemes within a defined time period, and containing details of their land, number
of payment entitlements to be activated, and scheme specific information. Member
States must prepopulate the application with the relevant control data they hold,
which should be available electronically to farmers in a geo-spatial format that
allows them to make any necessary amendments. The application covers all
relevant direct payment schemes, such as greening and small farmers’ scheme, as
well as relevant rural development measures.
3.2.2 Land Parcel Identification System (LPIS)
LPIS is a geographic information system that allows the IACS to geolocate, display
and spatially integrate its constituent data. LPIS contains reference parcels, for
which Member States need to ensure correct quantification of maximum eligible
area and must check that all declared agricultural parcels for IACS schemes are
properly identified inside of reference parcels. Information about location of
reference parcels and maximum eligible area must be provided to farmers as part
of their aid applications. From 2018, all aid applications must include pre-populated
and amendable geo-spatial information including the location and size of ecological
focus areas (EFAs).
LPIS should also include data or layers that support a range of eligibility checks; for
example, EFA, permanent grassland layer, Environmentally Sensitive Grassland,
Natura 2000 and Rural Development measures. LPIS may also be used to assist in
cross-compliance controls.
LPIS is maintained using aerial or satellite ortho-photos (imagery), national
mapping systems, validated farmer notifications, and results of on-the-spot
controls. Member States must ensure that the spatial data is sufficiently accurate
and up-to-date that they allow effective checks of declared areas to be performed.
There is a regulatory obligation for MS to perform an annual quality self-
assessment of LPIS, with the results provided to the EU for consideration. If LPIS
consistently meets the quality criteria, it can enable Member States to reduce the
number of on-the-spot controls.
Reference parcels
Reference parcels are at the core of application process. A reference parcel is “a
uniquely identified and geographically delimited agricultural area”.54
Farmer’s applications to the paying agency contain all claims for the current year
and the area of all reference parcels, such as agricultural parcels. Regulations
define an agricultural parcel as “a continuous area of land, declared by one
farmer, which does not cover more than one single crop group”. Agricultural
parcels can change depending on the farming priorities, such as crop rotation, set-
aside, aggregation or subdivision of fields, different extent of use, market
54 Articles 2(25) and 5(1) of Regulation (EU) No 640/2014 as well as Article 4(1)(e) of Regulation (EU) No 1307/2013

Analysis of administrative burden arising from the CAP
40
considerations etc. Therefore, for the purpose of unique identification of agricultural
parcels, reference parcels were introduced by the CAP regulations.
Reference parcels serve as a spatial container for allocation and identification of
agricultural parcel(s). EU regulations offer Member States a choice between
different types of reference parcels. The four types of reference parcels applied by
the Member States are summarised in the table below.
Table 2 Different types of reference parcels
Agricultural
parcel (Single
Crop)
Farmer’s Block Physical Block Cadastral parcel
Exam
ple
Main
featu
res
One single crop
group;
single farmer;
annual life cycle.
One or several
crop groups;
single farmer;
multi-annual life
cycle.
One or several
crop groups;
one or several
farmers;
semi-permanent.
Do not always
match
agricultural
pattern;
one or several
farmers;
object life cycle in
database
depending on
property rights.
So
urce
Farmer’s application Farmer’s application Administrative
classification
Cadastre, land
register and farmers
application
Source: Zielinski, R., Sagris, V., 2009. Summary Results of the LPIS Survey 2008. EUR 23828 EN. Luxembourg (Luxembourg): OPOCE; 2009. JRC51413.
Regulation (EU)N°1307/2013 defines ‘agricultural area’ (Art. 2) as any area taken
up by arable land, permanent grassland/pasture or permanent crops. In practice,
the four main types of agricultural area can have very different appearance on the
image or in the field, depending on geographical location and agricultural practice
of each Member State. To provide for common interpretation of possible sub-types,
the Land Cover Classification System (LCCS) originally developed by the FAO is
used. There is, however, an ongoing process of re-definition of LCCS in accordance
with the INSPIRE Directive for land cover. The maximum eligible area (MEA) is the
officially known and recorded maximum quantity of agriculture land, read eligible
hectare, per reference parcel. This indicator is used in cross-checks with other IACS
registries for possible over declarations for the reference parcel. The figure below
presents the distribution of different types of reference parcels used in each EU
Member State in 2015.

Analysis of administrative burden arising from the CAP
41
Figure 8 Distribution of different reference parcel types across the EU in 2015.
Source: Author’s own elaboration based on the European Court of Auditors and the 2014 and 2015 LPIS
Quality Assessment Reports
Another term with key importance for the LPIS is eligible hectare, as defined by the
Regulation (EU) N°1307/2013. Eligible hectare refers to any agricultural area of a
holding that is: (i) used for an agricultural activity or, where the area is also used
for non-agricultural activities, is predominantly used for agricultural activities, or (ii)
certain areas that gave a right to payments under the single payment scheme
(SPS) or the single area payment scheme (SAPS) in 2008.
Member States need to ensure correct quantification of maximum eligible area of
reference parcels and check that all declared agricultural parcels for IACS schemes
are properly identified inside the reference parcels. Information about the location
of reference parcels and maximum eligible area must be provided to farmers as
part of their aid applications. From 2018, all aid applications must be submitted
through geo-spatial aid application (GSAA), which should contain pre-populated and
amendable geo-spatial information including the location and size of ecological
focus area (EFA). As described earlier, for the purposes of administrative checks,
LPIS should include data or layers allowing a range of eligibility checks to be made.

Analysis of administrative burden arising from the CAP
42
Article 5 of Regulation (EU) N°640/2014 specifies that the identification system for
agricultural parcels shall operate at reference parcels level. Member States shall
ensure that (i) declared agricultural parcels are reliably identified through reference
parcels and (ii) aid applications and payment claims are furnished with information
that enables each agricultural parcel to be located and measured. For each
reference parcel, the database shall contain information that allows to:
Determine a maximum eligible area for the purpose of the support for direct
payments schemes of Regulation (EU) No 1307/2013;
Determine a maximum eligible area for the purpose of the area-related for rural
development measures of Regulation (EU) No 1305/2013;
Locate and determine the size of EFA;
Determine whether provisions of Regulations mentioned in Article 5(d) of
R640/2014 apply.
LPIS in practice
LPIS uses aerial or satellite ortho-photos (imagery) to provide necessary
information that can be aligned with the reference parcels to quantify the eligible
area. Thus, imagery with very high spatial resolution is a key element for LPIS
quality. A three-year cycle of imagery update appears to be the most efficient and
reference parcels’ layer is subject to regular update as soon as new imagery is
available. In addition, LPIS contains other spatial data sets from multiple sources
that, together with reference parcels classifications, permit quantification of eligible
area and enable checking of commitments and obligation. Therefore, the LPIS
already takes advantage of the synergy with other EU policies including data sets
created for those policies; e.g. environmental regulations on protected areas Natura
2000. LPIS may also include spatial information from other national governmental
registries such as a cadastre.
There are currently 44 national or regional LPISs in operation in the EU,
containing over 135 million reference parcels.55 LPIS is connected through
reference parcels with other IACS components. A quantity of eligible hectares is
accompanied by beneficiary entitlements and should be stated in the aid
application. Key elements of the administrative burden arising from LPIS relate to
its main functions in the IACS (as illustrated in the figure below). It includes the
submission of farmers’ applications, including graphical information, and
information for administrative and on-the-spot (OTSC) checks. Producing graphical
maps of the reference parcels for each application is simplified through the use of
Internet map portals, which allow farmers to identify relevant reference parcels,
obtain necessary information for declaration and print out required maps. E-
application solutions permit the integration of graphical information with declaration
forms and avoid paper forms. The GSAA, obligatory from 2018, is a further step
towards the process of simplification.
Member States are obliged to ensure that the system works properly and,
therefore, that necessary information updates and IT system upgrades are
implemented. The main trigger for systematic updates is the acquisition of new
ortho-photo imagery that may potentially reveal that changes have occurred.
55 This number reflects the total number of “polygons” stored in the LPIS, including also non-declared parcels, cadastral
parcels on non-agricultural area, non-eligible exclusions, landscape features, etc.

Analysis of administrative burden arising from the CAP
43
Updates may also be triggered by information gathered from farmers' declaration,
or during the OTSC checks of farmer’s applications.
Figure 9 Model of basic concepts of subsidies’ administration
Source: Sagris, V., Kikas, T., Angileri, V. (2015). Registration of land for the common agricultural policy management: potentials for evaluation of environmental policy integration. Int. J. Agricultural Resources, Governance and Ecology, Vol. 11, No. 1, 2015
LPIS QA
Member States are obliged to perform an annual assessment of the LPIS quality
and its effectiveness in determining maximum eligible areas.56 After this self-
assessment exercise, actions to remedy deficiencies need to be taken where
necessary. LPIS quality can roughly be defined as an ability of the system to fulfil
two explicit LPIS functions, namely the (i) localisation of all declared agricultural
parcels by farmer and inspectors, and (ii) correct quantification of all eligible area
for crosschecks. The LPIS Quality Assessment (LPIS QA) framework is composed of
two major components:
Database design testing, also known as abstract or models test suite (ATS or
MTS); and
Testing of data records stored in the system, so-called executable tests suite
(ETS).
The ETS exercise must be performed annually, while ATS/MTS should be
undertaken only if there are changes in the database model or in underlying
concepts; e.g. change of reference parcel type. Member States’ information
obligations arise from the quality assessment exercise include the reporting of tests
results and remedial actions (if needed) to the European Commission (DG AGRI and
JRC). After receiving Member States’ reports and the data subject to the testing,
the JRC undertakes a screening to assess correctness of applied tests and
disseminates the results to Member States and DG AGRI.
The key elements of the administrative burden in the LPIS QA are related to
three main activities:
Understanding of the methodology and coping with methodological
changes;
56 Article 6 of Regulation 640/2014

Analysis of administrative burden arising from the CAP
44
Time and efforts spent for performing tests and conducting rapid field
visits, if necessary. This may include also the acquisition of additional imagery
or pre-processing of imagery acquired by DG JRC;
Communication of results to the European Commission.
The Executable Test Suite (ETS) consists of the following steps:
Preparation of layer of reference parcels for Member States and the
random selection of test samples. In case of absence of the most recent
imagery selection of samples constrained to the spatial windows of the imagery
especially purchased by the Commission for the purpose of controls; imagery
should be tested and, if necessary, corrected for geometric errors by the LPIS
custodian. The required sample size is determined from the total number of
active parcels in LPIS, such that more parcels should be checked for bigger
systems, therefore impacting the amount of effort required for subsequent
steps;
Undertaking ETS observations, including two conformance levels: (i)
Level 1, which includes the re-digitizing of reference parcels in order to correctly
quantify the maximum eligible area and classification of major types of errors, so
called critical defects, that were found during observation; (ii) Level 2, which
includes calculation of different types of quality indicators from observations and
critical errors;
Conducting rapid field visits, if necessary;
Reporting to the Commission (reports to DG AGRI and to the JRC), covering
formal communication and submission of actual geospatial data and testing
results for screening by the JRC.
3.2.3 Costs of controls
Before the approval of payments, CAP regulations require controls of applications
registered in the claims database.
Figure 10 IACS annual claim cycle and controls
Source: Ecorys
Controls for IACS based measures consist of administrative checks and on-
the-spot-checks (OTSCs). While all claims are subject to administrative cross
checks for accuracy, scheme eligibility and conformity with IACS rules, at least 5%
must undergo OTSCs. The majority of OTSCs are conducted on the basis of a
predetermined risk assessment, while others (~1.5%) are selected randomly. In a
Aid application
(incl. geospatial)
Administrative checks
On the spot checks
(physical, remote)
Payments, penalties and deductions
Pre-population of application
Analysis of administrative burden arising from the CAP
45
typical year, around 190,000 on-the-spot checks (with 57,000 randomly selected)
are made from a base of about 3.8 million beneficiaries.57
Member States must ensure that inspections are carried out at the most
appropriate time (for instance, for crop diversification under greening when the
crop is in the ground or within a prescribed retention period when animals are on
the holding). To help reduce the burden on beneficiaries, they can simultaneously
be included in the sample of inspections for several measures. For instance,
farmers inspected under BPS can also be included in the sample for greening
controls. If high levels of error are identified, Member States must increase
inspection levels and implement corrective measures to reduce error levels.
Inspections may be aided by new technological developments. Many field inspectors
use hand-held devices and tablets with downloaded claim and geo-spatial
information, allowing them to validate parcel and feature size and upload their
reports electronically. In addition, information of one year is used to pre-populate
the database for the following year.
Administrative checks
All claims are subject to administrative crosschecks against the relevant
IACS databases to confirm accuracy and eligibility with scheme and IACS rules.
This typically includes:
checks beneficiary’s registration as meeting relevant criteria and eligibility of
claim;
checks against the LPIS that the declared area is not overstated;
checks against animal registers to ensure that livestock are registered and
associated with the correct holding;
checks against entitlements registers to validate the number of declared
entitlements (and if applicable within the correct region);
check that total claims do not exceed 100% of the parcel, in the case of multiple
farmers or beneficiaries declaring the same agricultural parcel is at their
disposal;
checks that the declared land use (e.g. wheat production) is compatible with the
land cover determined in the LPIS (e.g. arable);
checks that different uses are not incompatible, in the case that a land parcel is
declared under different schemes (e.g. BPS and rural development);
checks between regions within a Member State to ensure there are no double
claims for a single holding and unintentional errors that could lead to reductions
or penalties are avoided.
In addition to IACS crosschecks, a number of scheme specific checks can be made
to ensure that the relevant regulatory obligations are met before payments are
made. These include, for instance:
checks that relevant payments are only made to active farmers rather than
companies whose primary activity is on a prescribed negative list from which
they have no exemption;
57 Borchmann, Christina (DG AGRI): CAP audit system 2014-2020, see:
https://ec.europa.eu/futurium/en/system/files/ged/c._borchmann_dg_agri_eafrd_audits_-_facts_and_figures.pdf
Analysis of administrative burden arising from the CAP
46
checks that farmers meet crop diversification, EFA and permanent grassland
rules and thresholds under greening, and that claims for exemptions as organic
farmers are legitimate;
checks that young farmers meet national definitions and have sufficient
controlling interest in the holding to demonstrate eligibility to subsidy;
checks that applications to the National Reserve from young farmers, new
entrants and other categories meet eligibility criteria and entitlements are not
falsely awarded;
checks that specific options and programmes under IACS-related rural
development measures meet the laid down control and verifiability criteria.
On-the-Spot Controls
Within each scheme, a defined proportion of beneficiaries must be selected
for on-the-spot checks. Typically, they are selected using a predetermined risk
assessment, with a smaller proportion chosen randomly. On-the-spot checks may
be conducted by physical inspection on the ground or remotely using remote
sensing via satellite.
Cross-compliance has its own on-the spot control requirements. Samples of
beneficiaries under both Pillar I and Pillar II IACS schemes are selected from
populations covering SMR, GAEC or both. In some instances, the levels of
inspection are prescribed in other sectoral legislation, such as that governing the
traceability of livestock. Errors found during these inspections or other checks and
notifications must be evaluated for their severity, extent, permanence and
reoccurrence of the non-compliance before the appropriate penalty is applied across
all IACS-related Pillar I and Pillar II payments in that year.
Penalties
Both IACS and the different schemes have their own prescribed reduction and
penalty regimes for payment reductions, which depend on the gravity of the error
or over-declaration. The EU legislation has introduced the concept of a “yellow
card” in 2016, where some initial errors or over-declarations in aid applications
through IACS are treated with a reduction of the penalty of 50%. If a reporting
error is observed in the next claim year for the same support plan or measure, the
affected beneficiary will have to pay the portion of the administrative penalty from
which it was exempted the previous year. The “yellow card” has not yet been fully
implemented in all Member States.
3.2.4 Payment entitlements
The Basic Payment Scheme from 2015
Payment entitlements are a key component of the basic payment scheme.
They link payments back to farmers and facilitate the correct allocation of the
annual direct payments under the Pillar I of the CAP. The BPS is a compulsory
scheme for all Member States, but those having applied the single area payment
scheme under Regulation (EC) 73/2009 have been allowed to continuing applying
the SAPS for a transitional period until 202058. In countries where SAPS is
applied59, there are no payment entitlements, and the support is paid solely based
58 10 Member States in total: BG, RO, CZ, SK, PL, EE, LT, LV, CY, HU. 59 European Commission: CAP explained. Direct payments for farmers 2015 – 2020 (2017).

Analysis of administrative burden arising from the CAP
47
on the eligible hectares. However, the logic behind the allocation of resources is
similar to BPS.
Payment entitlements are linked to eligible land (de-coupled payment system). In
general, “the number of payment entitlements a farmer can obtain [is] equal to the
number of eligible hectares he declares in his aid application in 2015 and which are
at his disposal at a date fixed by the Member State.”60 Payment entitlements are
activated on an annual basis by declaring eligible hectares with an accompanying
number of payment entitlements.
The envelope available for the BPS is not a fixed percentage of the national ceiling
fixed in Annex II Regulation (EU) N°1307/2013. The BPS ceiling is obtained by
subtracting from the national ceiling in Annex II, the amounts foreseen for the
redistributive payment, the payment for agricultural practices beneficial for the
climate and the environment (greening), the payment for areas under natural
constraints, the young farmer payment and the voluntary coupled support.
Member States need to operate a (national or regional) reserve. In 2015, the
reserve is established by allocating a certain share of the BPS ceiling to it, in the
later years amounts available in the reserve correspond to those remaining from a
previous year and any replenishments thereafter. Priority for the allocation of these
funds is to be given to young farmers and new entrants (This is regulated in Art.
30-6. Regulation (EU) N°1307/2013). Member States can set additional eligibility
criteria relating to appropriate skills, education or experience applicable to these
groups of farmers.
Payment entitlements have been allocated under BPS for the first time in
2015 (this is regulated in Art. 24 Regulation EU 1307/2013). Some Member States,
under specific conditions, decided to use the option to allocate BPS entitlements by
keeping those allocated to farmers under the SPS61 (this is regulated in Art. 21-3
Regulation EU 1307/2013).
The BPS can be applied at national or regional level. Six Member
States/regions (DE, EL, ES, FR, FI, UK - applied in Scotland and England) opted for
the possibility offered under Art. 23 Regulation EU 1307/2013. Member States
applying the BPS at regional level are allowed to establish regional reserves. Among
them, only France has opted for this system.
The three main models of internal convergence
Within a given country/region, all entitlements allocated to a farmer have the same
value, but difference in the values of entitlements may occur among farmers. In
order to ensure a more equitable distribution of direct support between farmers,
Member States implement internal convergence. The main options 62 available to
achieve the convergence are explained in the info box below.
60 European Commission: Direct Payments. Basic Payment Scheme (2016). 61 DK, UK-England, SE, FI, European Commission: Direct Payments. Basic Payment Scheme (2016). 62 For a more detailed description of the three options, please refer to European Commission: Direct Payments: the Basic
Payment Scheme from 2015 – Convergence of the value of payment entitlements (‘Internal Convergence’) (2015).
Analysis of administrative burden arising from the CAP
48
Main models of internal convergence
Flat rate from 2015: in this model the value of PEs is calculated by dividing a fixed
percentage of the national ceiling available for granting direct payments (Annex II to
Regulation EU 1307/2013) for each year by the total number of PEs allocated in 2015,
except the ones allocated from the reserve – Art. 25-1 Regulation EU 1307/2013). This
fixed percentage corresponds to the share of the BPS ceiling excluding the reserve in the
national ceiling in 2015. It means that all PEs will have the same value (yearly average)
in a Member State or in a region from 2015 onwards63;
Flat rate by 2019: in this model the objective is to reach a uniform amount per hectare in
maximum 5 steps. Member States differentiate initially the values of PEs which converge
progressively until reaching a uniform value by 2019 (Art. 25-3 Regulation EU
1307/2013). The starting point is the Initial Unit Value (IUV) calculated on the basis of
the direct support the farmer was entitled to in 2014, adjusted to the proportion of BPS in
2015 and to the national ceiling as amended by the Multiannual Financial Framework
2014-202064;
Partial convergence (the tunnel model): the adjustment is similar to the flat rate by
2019 model, but no complete convergence is achieved by that date. The target value for
2019 is between 90% and 100% of the 2019 average65. The 2019 average is also
calculated on the basis of the "theoretical BPS ceiling excluding the reserve" (This is
regulated in Art. 25 Regulation EU 1307/2013).
3.2.5 Greening
‘Greening’ is one of the key features introduced in the CAP 2013 reform. It is a
component of direct payments adopted to achieve the CAP objective to enhance the
environmental performance of European agriculture and accounts for 30% of the
direct payments budget. The principle behind the greening payment is to
remunerate farmers for their efforts towards the environment and
biodiversity. The greening payment is linked to a number of sustainable
agricultural practices beneficial for climate and environment. It targets three main
areas:
the maintenance and protection of permanent grassland: Member States
are required to monitor the proportion of permanent grassland in the total
agricultural area covered by direct payments and to designate areas of sensitive
permanent grassland;
ecological focus areas: farmers with more than 15 ha’s of arable land must
devote an equivalent of 5% of that land to EFAs (EU legislation provides for
19 distinct EFA types);
crop diversification: farmers with more than 10 ha’s of arable land will have to
cultivate a minimum of two or three different crops.66
The greening component complements the cross-compliance rules and the
environmental measures under rural development (Pillar II).
63 Implemented in DE, MT, FR-Corsica and UK-England. 64 Implemented in NL, AT, FI, UK-Scotland and UK-Wales. 65 Implemented in BE-Flanders, BE-Wallonia, DK, IE, EL, ES, Continental FR, HR, IT, LU, PT, SI, SE and UK-Northern
Ireland. 66 https://ec.europa.eu/agriculture/direct-support/greening_en

Analysis of administrative burden arising from the CAP
49
Figure 11 Cross-compliance, greening and environmental measures under rural
development
Source: ECA(2017): Special Report No 21/2017 — ‘Greening: a more complex income support scheme,
not yet environmentally effective’
Both, greening and cross-compliance are compulsory, whereas farmers get financial
support only for greening. Environmental measures under rural development (with
the exception of the Agri-environmental-climate measure – AECM) are voluntary,
but receive financial support.
The design, management and control of the greening scheme have led to
additional administrative tasks for Member States and farmers, especially in
the first year of implementation (e.g. the creation of the EFA layer in the IT-
systems). In 201185, the European Commission performed an impact assessment of
the new legislative proposals for the CAP 2013 reform. This impact assessment
already pointed to the potentially high administrative burden and costs for
businesses as regards the greening scheme. It was estimated that total costs would
amount to €299 million for the 2013-2020 period. The same study estimated that
the greening scheme would furthermore represent the largest share of
administrative burden to the Member State administrations (71% of the total
administrative burden to the public authorities).67 In the course of reducing the
environmental reach of the Commission’s original proposals, the co-legislators
(Council and European Parliament) added to the complexity of the direct payments
system (Hart et al., 2016)68. Following the introduction of the greening obligations
to farmers, and the Commission’s ambition to simplify the CAP, an analysis of
greening implementation was undertaken. The Review of greening after one year69
included a consultation to collect feedback from relevant stakeholders on the
functioning of the greening scheme after the first year of implementation. The
stakeholder consultation strategy is presented in the box below.
67 see also the Impact Assessment, Annex 8, Table 4 68 Hart, K., Buckwell, A. and Baldock (2016). Learning the lessons of the Greening of the CAP.
http://publications.naturalengland.org.uk/publication/5851680709541888 69 SWD(2016) 218 final: Review of greening after one year

Analysis of administrative burden arising from the CAP
50
The focus of this greening review after one year was on one feature of the green
direct payment scheme, the ecological focus area. The review addressed three
aspects, 1) any administrative burden arising from this new instrument; 2) the
impact on the level playing field for farmers of implementation by Member States of
green direct payments; and 3) the impact on production potential. Concerning the
first aspect – most relevant for this study – the review concluded that “After only
one year of implementation, sufficient hard data on the costs and burdens
associated with the new greening measures is still not available”.
Stakeholder Consultation on greening
Dedicated consultation activities included discussions in Expert Groups on Direct Payments
(three meetings during the second half of 2015), a meeting of the Expert Group on
Simplification (February 2016) and two meetings of the Civil Dialogue Group for Direct
Payments and Greening (November 2015 and April 2016). In addition, from 15 December
2015 to 8 March 2016, an online survey sought to collect stakeholders’ views on the main
themes of the Commission declaration of 2 April 2014 covering experiences from the first
year of application of greening, especially the ecological focus areas (EFA), the impact on
the level playing field and production potential, administrative burden and simplification
ideas. This Open Public Consultation (OPC) also sought respondents’ preliminary views on
the effects of greening.
The results from the Open Public Consultation “Experience with the first year of
application of the greening obligations under the direct payment scheme (CAP)”70
show that the majority of farmers, professional farmer organisations and
public authorities consider the implementation requirements for greening
difficult to very difficult. Also understanding the rules and complying with them
for crop diversification and the Ecological Focus Areas were aspects highlighted by
respondents as being very demanding.71
Because of the consultation, the Commission published a Staff Working Document
in 2017 addressing efforts to simplify and reduce regulatory burdens. Many of its
conclusions related to greening were based upon the findings from the OPC (e.g.
aid application for greening requiring extra time, farmers need to hire professional
support to complete the declaration, and the perception of additional risks as
regards making costly mistakes and additional controls72).73
In light of the results of the greening review after one year, including the
consultation activities, the parallel Refit exercise aimed at improve the effectiveness
of the policy and the need to address the actions identified in the Mid-term review
of the EU biodiversity Strategy to 2020, the Commission identified four priority
areas to amend the secondary legislation.
Such changes aimed from one side to simplify the greening scheme and on the
other to increase its environmental effectiveness (especially the ban of use of plant
70 https://ec.europa.eu/agriculture/sites/agriculture/files/consultations/greening/greening-001-results-online-survey_en.pdf
71 Based on participants to the Expert and Civil Dialogue Groups and the OPC 72 Some noted that these administrative aspects are the only consequence of greening for those farmers whose
production methods were and would be in line with greening even in the absence of the legislation. 73 SWD(2017) 675 final: Overview of the Union’s Efforts to Simplify and to Reduce Regulatory Burdens
Analysis of administrative burden arising from the CAP
51
protection products on productive EFA), as the results of the review after one year
showed potential to improve it.
The priority areas were further elaborated into 14 concrete amendments to the
delegated and implementing acts:
Better specification and/or clarification of what is required from farmers and
national administrations, especially as regards landscape features;
Eliminating some burdensome technical requirements without lowering
environmental benefits;
Providing more flexibility or alternatives where these increases the
environmental and climate benefit of the greening;
Additional harmonisation of some requirements and conditions.74
Table 3 Overview of priority areas for review of the Greening Payment after one year
of implementation
Priority Issues
identified
Planned way forward Implemented changes
by the Commission
Delegated Regulation
(EU) 2017/1155 of 15
February 201775 76
Better specification and/or
clarification of what is
required from farmers and
national administrations,
especially as regards
landscape features
Merging certain EFA types such as strips
(e.g. buffer strips and field margins) and
streamlining certain conditions
associated to these EFA types could be a
way forward. For farmers, these
simplifications would reduce the risk of
errors in the declaration. For national
administrations, the need for definitions,
clarifications and specific checks would
be reduced. It should therefore facilitate
the uptake of some landscape features
as ecological focus areas and therefore
increase their environmental benefits.
Landscape features and
strips:
Certain strips (buffer
strips and field margins)
have been merged and
associated conditions
streamlined (min and
max width: 1 to 20 m
and no production
requirements)
Certain landscape
features have been
merged (trees in line,
wooded strips and
hedges)
Associated conditions for
landscape features are
streamlined
Common definition and
conditions
No production
requirement applicable
to Land Lying Fallow
and all strips without
production) means no
agricultural activity as
defined under Art 4 (1)
of basic act (reg
n°1307/2013) without
prejudice other
requirements under
74 DS/EGDP/2016/04 rev 2 (greening) 75 http://epkk.ee/wp-content/uploads/2017/05/Unit-D2-CDG-DP-greening-2017-05-19.pdf 76 https://ec.europa.eu/transparency/regdoc/rep/3/2017/EN/C-2017-735-F1-EN-MAIN-PART-1.PDF

Analysis of administrative burden arising from the CAP
52
Priority Issues
identified
Planned way forward Implemented changes
by the Commission
Delegated Regulation
(EU) 2017/1155 of 15
February 201775 76
GAEC ;
Eliminating some
burdensome technical
requirements without
lowering environmental
benefits
Revisions of certain aspects (e.g. species
to be used, allowing more mixtures)
could be considered in order to make
some EFA types more attractive and
increase the environmental
improvement. Introducing some
flexibility as regards certain geographical
criteria and deadlines could also be
considered with a view to preventing
undue constraints upon farmers arising
from their inadequacies with respect to
the plant cycle and the climatic
conditions, especially for green cover or
catch crops
Crop diversification:
Possible differentiation for
the period of crop
diversification at
regional and/or sub
regional level.
Catch crops / green
cover
Deletion of deadline for
sowing catch crops or
green cover (before 1st
October)
Common minimum
duration of 8 weeks for
catch crops and green
cover
Adjustment of the list of
species for under
sowing (allowing
leguminous)
NFCs
Allowing mixture of seeds
for Nitrogen Fixing Crops
(NFC)
Providing more flexibility
or alternative where this
increases the
environmental and climate
benefit of the greening
Certain eligibility rules for landscape
features are fully relevant for the
definition of agricultural land, but have
been shown to be too restrictive for
ecological focus areas, in particular as
regards their size and their location in
the parcel of land. In such situations,
farmers can be reluctant to declare these
landscape features because of the risk of
possible non-compliance with the
fulfilment of the mandatory 5 %. This
reduces the potential biodiversity
delivery of ecological focus areas.
Certain modifications could be useful to
promote other potential landscape
features.
More flexibility for the
land lying fallow EFA
(see previous row)
More flexibility for the
qualification of
landscape features:
Corresponding area
calculated up the
maximum width or size
Adjacency notion extend
to the 2nd element
adjacent to the 1St
element directly
adjacent to the arable
land.
Additional harmonisation
of some requirements and
conditions
This first year experience has shown that
certain definitions are missing or would
benefit from a better specification to
better achieve their environmental
objective, in particular for EFA types
such as land lying fallow, catch crops or
green cover. In addition, the potential
biodiversity value added of EFA types
has to be properly considered in view of
favouring the use of the most valuable
Ban of use of pesticides
on productive EFA areas
(nitrogen fixing crops,
catch crops and green
cover land lying fallow
and strips along forest)
Weighting and conversion
factors of EFAs have
been amended (Annex
X of Reg. (EU) No.
Analysis of administrative burden arising from the CAP
53
Priority Issues
identified
Planned way forward Implemented changes
by the Commission
Delegated Regulation
(EU) 2017/1155 of 15
February 201775 76
EFA types by farmers. As regards the
method of calculation of EFA areas, the
definition of weighting factors could
better reflect the potential to enhance
biodiversity of the various features of
ecological focus areas. The modification
of these weighting factors could
therefore be considered in this respect.
The harmonisation of some management
requirements may also be needed. In
this perspective, a limitation of the use
of inputs on productive EFA areas could
be considered.
1307/2013)
EFAs:
Land lying fallow
The article now includes the
duration of the ‘no
production’ restriction while
taking into account the
need to allow farmers
resuming main crops before
the end of year.
Source: Commission Delegated Regulation (EU) 2017/1155 of 15 February 2017
3.2.6 Cross-compliance
Cross-compliance was first introduced on a voluntary basis during the Agenda 2000
CAP reform, and further developed in the 2003 CAP reform. Cross-compliance is
based on a conditionality principle, whereas farmers direct payments are made
conditional upon compliance with basic standards and requirements laid out
in Regulation 1306/2013. The objective of cross-compliance is to raise the
awareness of CAP beneficiaries, to contribute to the development of sustainable
agriculture and making the CAP more compatible with the expectations of society.
The cross-compliance system consists of two main elements:
Statutory management requirements (SMRs): 13 legislative standards in
the field of the environment, food safety, animal and plant health and animal
welfare;
Standards for good agricultural and environmental conditions (GAEC): a
range of standards related to soil protection, maintenance of soil organic matter
and structure, avoiding the deterioration of natural habitats, and water
management.77
Prior to the introduction of cross-compliance, the basic obligations under the SMRs
already existed under the sectorial EU legislation. They apply to all farmers
disregarding if they are CAP beneficiaries or not.
The SMRs that stem from sectorial legislation are, for Directives, applied as
implemented by Member States. They contain selected requirements addressed to
farmers (and not to Member States) which are measurable and controllable and are
linked to farming activity under the following policies:
Public, animal and plant health: General Food Law, Hormones ban Directive,
Regulations on identification and registration of pigs, bovine, ovine and caprine
animals, Regulation on prevention, control and eradication of TSEs78, Regulation
on plant protection products;
77 https://ec.europa.eu/agriculture/direct-support/cross-compliance_en 78 Transmissible Spongiform Encephalopathies (TSEs) are a family of diseases occurring in man and animals and are
characterised by a degeneration of brain tissue giving a sponge-like appearance leading to death

Analysis of administrative burden arising from the CAP
54
Animal welfare: Directives on the protection of calves, pigs and animals kept
for farming purposes;
Environmental protection: Nitrates Directive, NATURA 2000 Directives (wild
birds and habitats).
The GAEC standards, specifically applicable for farmers receiving CAP payments
refer to a set of standards aimed at:
preventing soil erosion: minimum soil cover, minimum land management;
maintaining soil organic matter and soil structure: maintenance of soil
organic matter level;
biodiversity and ensure a minimum level of maintenance: retention of
landscape features including a ban on cutting hedges and trees during the bird
breeding and rearing season;
protection and management of water: establishment of buffer strips along
water courses, authorisation on water for irrigation and protection of ground
water against pollution.
The policy framework for standards of good agriculture and environmental condition
(GAEC) was restructured with the current CAP programme (2014-2020) to take into
account the introduction of the greening measures (Hart et al., 2016). The main
changes as compared to the previous CAP programming period are that all
standards are now compulsory and the standards have been consolidated into a
shorter list. For example, the maintenance of permanent grassland became a
greening requirement, and optional standards for crop rotation were superseded by
the compulsory crop diversification (greening) requirement. The number of SMRs
was also shortened.
The philosophy behind cross-compliance follows a “whole farm-approach”. This
implies that when non-compliance is detected, the payments farmers receive may
be reduced proportionally to the extent, permanence, severity and reoccurrence of
the infringement specified. Furthermore, it is considered if the infringement was
committed intentionally or due to negligence having an impact on the reduction´s
calculation.
The payments subject to a reduction may include:
the direct payments (decoupled or coupled) (Pillar I, CAP);
most rural development payments (Pillar II CAP) such as Area Based Payments,
which include agri-environmental measures, Areas with natural constrains,
Natura 2000 measures, Afforestation measures, Forest environmental payments,
Agroforestry, Organic farming, and two payments specifically linked to the wine
sector ("Restructuring and conversion of vineyards" and "Green harvesting").
Cross-compliance is a good example of the search for striking a balance
between transaction costs and benefits, as it covers all farmers eligible for
direct payments. As such, a large agricultural area is subject to the cross-
compliance conditions, ensuring a basic environmental standard could be reached79.
Yet, the following elements should be taken into account:
to what extent this actually ensures a given level of environmental quality;
79 OECD (2010), Environmental cross compliance in agriculture. See: http://www.oecd.org/tad/sustainable-
agriculture/44737935.pdf

Analysis of administrative burden arising from the CAP
55
the amount of monitoring costs involved.
Farmers not respecting the standards/requirements risk a penalty reducing their
direct payments from 1% to 15% (the higher threshold applies for repetitions of
infringements), as a general rule by 3% which is in practise often lowered to 1%.
In case a minor infringements, instead of applying a reduction, the paying agency
may give in writing an early warning to the beneficiary informing on the non-
compliance identified, the corrective-action required and the time limit for such
action. However, such early warning does not call for a mandatory follow-up visit to
control if the beneficiary implemented in due time the required corrective action.
3.2.7 Rural development measures (IACS based)
The EU's rural development policy, or so-called Pillar II of the CAP, is funded
through the EAFRD.80 The EAFRD finances the EU’s contribution81 to 118 different
RDPs, either at national or regional level (20 single national programmes and
8 Member States opting to have two or more programmes).82
In the CAP 2013 reform, the EU switched from the previously existing four axes to
a framework setting the following priorities:
fostering knowledge transfer and innovation in agriculture, forestry and rural
areas;
enhancing the viability and competitiveness of all types of agriculture, and
promoting innovative farm technologies and sustainable forest management;
promoting food chain organisation, animal welfare and risk management in
agriculture;
restoring, preserving and enhancing ecosystems related to agriculture and
forestry;
promoting resource efficiency and supporting the shift toward a low-carbon and
climate-resilient economy in the agriculture, food and forestry sectors;
promoting social inclusion, poverty reduction and economic development in rural
areas.83
The rural development priorities are then broken down into the so-called “focus
areas”.
While IACS applies to all direct payment schemes, it only covers those rural
development support measures that are granted based on the number of
hectares or animals held by the farmer.84 The specific measures are defined in
Council Regulation 1305/201385 and 1303/201386, as summarised in the table
below:
80 https://ec.europa.eu/agriculture/rural-development-2014-2020_en 81 https://ec.europa.eu/agriculture/cap-funding_en 82 https://ec.europa.eu/agriculture/rural-development-2014-2020_en 83 https://ec.europa.eu/agriculture/rural-development-2014-2020_en AND REGULATION (EU) No 1305/2013 OF THE
EUROPEAN PARLIAMENT AND OF THE COUNCIL of 17 December 2013 on support for rural development by the
European Agricultural Fund for Rural Development (EAFRD) and repealing Council Regulation (EC) No 1698/2005 84 https://ec.europa.eu/agriculture/direct-support/iacs_en 85 REGULATION (EU) No 1305/2013 OF THE EUROPEAN PARLIAMENT AND OF THE COUNCIL of 17 December 2013 on
support for rural development by the European Agricultural Fund for Rural Development (EAFRD) and repealing
Council REGULATION (EC) No 1698/2005 86 Regulation (EU) No 1303/2013 OF THE EUROPEAN PARLIAMENT AND OF THE COUNCIL of 17 December 2013 laying
down common provisions on the European Regional Development Fund, the European Social Fund, the Cohesion
Fund, the European Agricultural Fund for Rural Development and the European Maritime and Fisheries Fund and
laying down general provisions on the European Regional Development Fund, the European Social Fund, the Cohesion
Fund and the European Maritime and Fisheries Fund and repealing Council Regulation (EC) No 1083/2006

Analysis of administrative burden arising from the CAP
56
Table 4 IACS-based rural development measures
Article Measure Heading Sub Heading
21
reg.1305/2013
08 Investments in forest area
development and improvement of
the viability of forests*
(a) afforestation and creation of
woodland;
(b) establishment of agroforestry
systems.
28
reg.1305/2013
10 Agri-Environment and Climate
29
reg.1305/2013
11 Organic Farming
30
reg.1305/2013
12 Natura 2000 and Water
Framework Directive Payments
31
reg.1305/22013
13 Payments to areas facing natural
or other specific constraints
33
reg.1305/2013
14 Animal Welfare
34
reg.1305/2013
15 Forest-environmental and climate
services and forest conservation
40 - Financing of complementary
national direct payments for
Croatia
35.1 of
1303/2013
- Support from the ESI Funds for
community-led local development
(LEADER)
Where applicable:
(b)implementation of operations
under the community-led local
development strategy;
(c) preparation and implementation
of the local action group's
cooperation activities.
*this measure has an investment and a maintenance component. The IACS part relates to the
maintenance only.
Source: Council Regulation 1305/13
As with all the measures in RDPs, also RDP measures that are IACS-based are
based on voluntary participation (exception AECM, which is compulsory for MS,
see “shall” in Article 28(1) of Reg. 1305/2013). Though the basic measures are set
up by EU regulations, they usually undergo a rather significant adaptation to local
needs connected to local environmental and climate objectives, the latter being the
core of most of them. Consequently, the detailed design of measures and of the
related prescriptions can change remarkably from an area (region) to the other. For
instance, technical prescriptions can also differ within the same programming area.
In addition, their implementation typically involves zoning (i.e. identification of
areas with different needs) and targeting of enrolled land, to provide a
concentration of measures in some specific areas (e.g. Nitrate-vulnerable zones).
This can be achieved through locally defined selection criteria (although EU-wide
eligibility criteria remain valid for most measures). These criteria usually focus on
environmental concerns and possibly interact with general farm or farmers’ features
(e.g. specialisation, age). These criteria can represent a useful selection tool, in
case the budget available is not sufficient for funding all eligible applicants. As a
matter of fact, selection criteria, as well as eligibility criteria, may be locally-
specific.

Analysis of administrative burden arising from the CAP
57
Eligible farms have to comply with the eligibility conditions (eligibility
criteria, commitments and other obligations) established in the programme, which
are checked by the competent authority through administrative and on-
the-spot checks. The compliance with some eligibility conditions may be difficult
to check, mainly due to time restrictions (e.g. activities carried out only in a
restricted time period) or because they imply the reduction of fertilisers and/or
pesticides, which is difficult to assess. In any case, Member States are obliged to
comply with Article 62 of Regulation (EU) 1305/2013, which stipulates that all
measures implemented in the programme have to be verifiable and controllable.
This obligation brings the risk that some measures are not implemented by
programming authorities because their commitments are difficult to verify and
control.

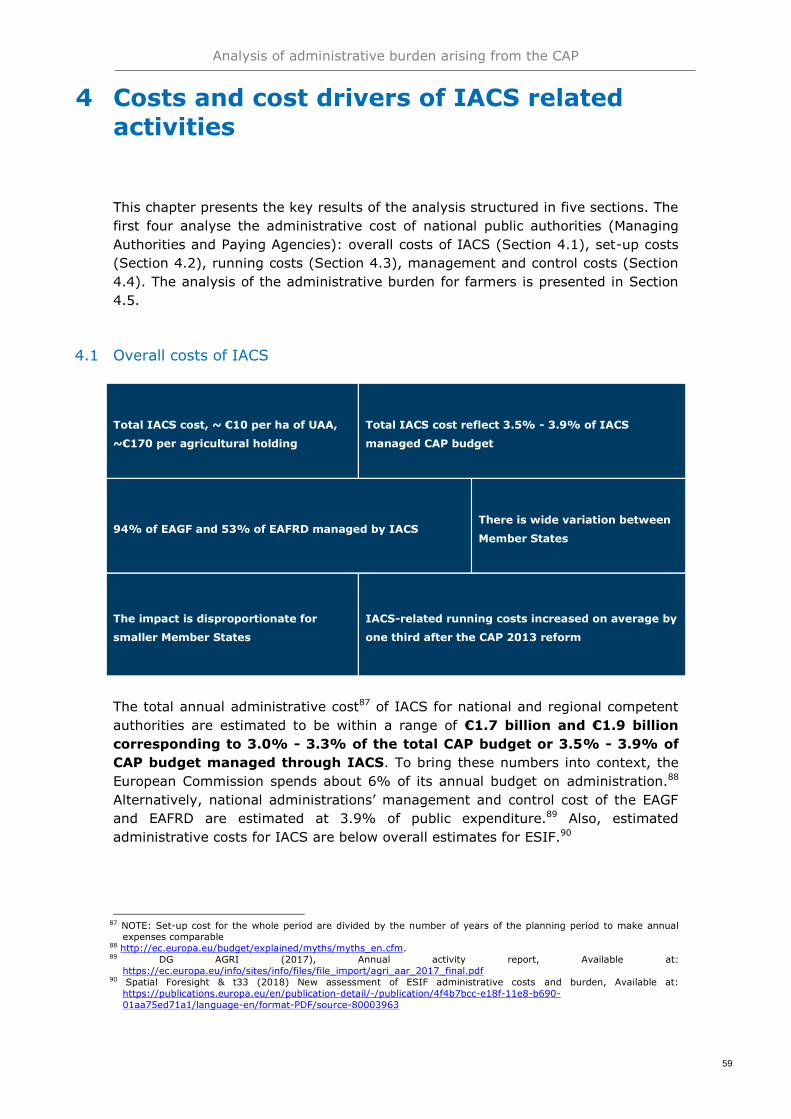
Analysis of administrative burden arising from the CAP
59
4 Costs and cost drivers of IACS related activities
This chapter presents the key results of the analysis structured in five sections. The
first four analyse the administrative cost of national public authorities (Managing
Authorities and Paying Agencies): overall costs of IACS (Section 4.1), set-up costs
(Section 4.2), running costs (Section 4.3), management and control costs (Section
4.4). The analysis of the administrative burden for farmers is presented in Section
4.5.
4.1 Overall costs of IACS
Total IACS cost, ~ €10 per ha of UAA,
~€170 per agricultural holding
Total IACS cost reflect 3.5% - 3.9% of IACS
managed CAP budget
94% of EAGF and 53% of EAFRD managed by IACS There is wide variation between
Member States
The impact is disproportionate for
smaller Member States
IACS-related running costs increased on average by
one third after the CAP 2013 reform
The total annual administrative cost87 of IACS for national and regional competent
authorities are estimated to be within a range of €1.7 billion and €1.9 billion
corresponding to 3.0% - 3.3% of the total CAP budget or 3.5% - 3.9% of
CAP budget managed through IACS. To bring these numbers into context, the
European Commission spends about 6% of its annual budget on administration.88
Alternatively, national administrations’ management and control cost of the EAGF
and EAFRD are estimated at 3.9% of public expenditure.89 Also, estimated
administrative costs for IACS are below overall estimates for ESIF.90
87 NOTE: Set-up cost for the whole period are divided by the number of years of the planning period to make annual
expenses comparable 88 http://ec.europa.eu/budget/explained/myths/myths_en.cfm. 89 DG AGRI (2017), Annual activity report, Available at:
https://ec.europa.eu/info/sites/info/files/file_import/agri_aar_2017_final.pdf 90 Spatial Foresight & t33 (2018) New assessment of ESIF administrative costs and burden, Available at:
https://publications.europa.eu/en/publication-detail/-/publication/4f4b7bcc-e18f-11e8-b690-
01aa75ed71a1/language-en/format-PDF/source-80003963

Analysis of administrative burden arising from the CAP
60
Table 5 Comparative assessment of administrative costs for public authorities
Fund Share of administrative
cost
European Agricultural Fund for Rural Development * 8.3%
European Territorial Cooperation* 6.7%
European Maritime Fisheries Fund* 4.4%
European Structural and Investment Funds - overall* 4.0%
European Agricultural Guarantee Fund and European Agricultural Fund
for Rural Development **
3.9%
European Structural and Investment Funds * overall for national
administrations (excluding national coordination and programme
preparation)
3.8%
IACS-based CAP as estimated in this study 3.5% - 3.9%
European Social Fund* 2.8%
European Regional Development Fund* 2.3%
Cohesion Fund* 1.8%
*The comparative estimates are extracted from the Spatial Foresight & t33 (2018) study91. These
estimates also incorporate (unless otherwise stated) the programming aspect of funds, which are not
captured by this study.
** Emerging from the DG AGRI annual activity report as share of public expenditure
In 2017, the average annual costs of IACS administration per country was
around €65 million. There is, however, significant variation across Member States
and years, ranging from estimated annual costs of €2 million to more than
€300 million.
Per hectare of utilised agricultural area (UAA), the annual IACS cost of
administration is estimated at €10.47. Across the EU, the annual IACS cost
ranges from €2 to €208 per hectare of UAA, indicating considerable variation across
Member States. Similarly, average annual IACS costs per agricultural holding are
estimated at €168.61. There is, however, considerable variation across Member
States, with average annual IACS cost per agricultural holding ranging from €18 -
€4,000.
In particular, the data shows large differences between smaller and larger Member
States, with a disproportionately high cost for smaller Member States.
Administrative tasks linked to the IACS are more burdensome for smaller Member
States that do not benefit from economies of scale. For example, all Member States
need to implement an IACS IT infrastructure but, although the absolute cost of
IACS IT infrastructure is higher for large Member States, the cost per beneficiary is
lower.
Several factors have the potential to impact on administrative costs at a
Member State level. These include country specific characteristics such as the
geography of the country, the size and structure of its agricultural sector and the
organisational structure of the national authorities. On top of those, factors related
to the CAP implementation choices and budget allocation such as the amount of
CAP budget received, the number and types of available schemes, implementation
91 Spatial Foresight & t33 (2018): New assessment of ESIF administrative costs and burden, see:
http://ec.europa.eu/regional_policy/sources/docgener/studies/pdf/assess_admin_costs.pdf
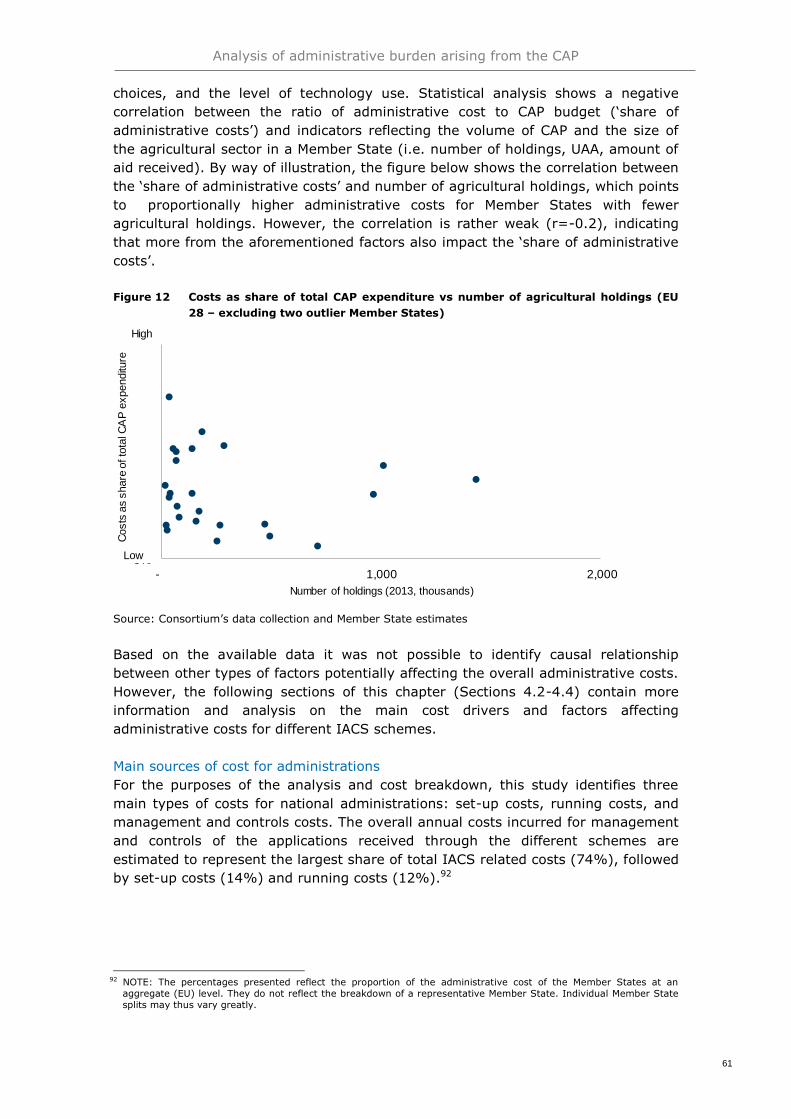
Analysis of administrative burden arising from the CAP
61
choices, and the level of technology use. Statistical analysis shows a negative
correlation between the ratio of administrative cost to CAP budget (‘share of
administrative costs’) and indicators reflecting the volume of CAP and the size of
the agricultural sector in a Member State (i.e. number of holdings, UAA, amount of
aid received). By way of illustration, the figure below shows the correlation between
the ‘share of administrative costs’ and number of agricultural holdings, which points
to proportionally higher administrative costs for Member States with fewer
agricultural holdings. However, the correlation is rather weak (r=-0.2), indicating
that more from the aforementioned factors also impact the ‘share of administrative
costs’.
Figure 12 Costs as share of total CAP expenditure vs number of agricultural holdings (EU
28 – excluding two outlier Member States)
Source: Consortium’s data collection and Member State estimates
Based on the available data it was not possible to identify causal relationship
between other types of factors potentially affecting the overall administrative costs.
However, the following sections of this chapter (Sections 4.2-4.4) contain more
information and analysis on the main cost drivers and factors affecting
administrative costs for different IACS schemes.
Main sources of cost for administrations
For the purposes of the analysis and cost breakdown, this study identifies three
main types of costs for national administrations: set-up costs, running costs, and
management and controls costs. The overall annual costs incurred for management
and controls of the applications received through the different schemes are
estimated to represent the largest share of total IACS related costs (74%), followed
by set-up costs (14%) and running costs (12%).92
92 NOTE: The percentages presented reflect the proportion of the administrative cost of the Member States at an
aggregate (EU) level. They do not reflect the breakdown of a representative Member State. Individual Member State
splits may thus vary greatly.
0%
- 1,000 2,000
Costs
as s
hare
of to
tal C
AP e
xpenditu
re
Number of holdings (2013, thousands)
High
Low

Analysis of administrative burden arising from the CAP
62
Figure 13 Main types of IACS related costs borne by national administrations
Source: Consortium’s data collection and DG AGRI Cost of Controls Survey 2018
Set-up costs presented in this study represent the annualised value of the total
amount of spending on IT systems for IACS after the CAP 2013 reform; unlike
other cost categories, the quantification of set-up costs reflects the total amount of
costs in the programming period divided by the number of years since the start of
the programming period. Key cost components include: the worked hours spent by
IT staff, purchases of products and services associated with establishing all
necessary infrastructure (hardware), applications (software), and other IT-related
costs to operate IACS. Set-up costs are typically one-off investment in IT, which is
often outsourced. The need for the development of new IT systems, or updates of
existing systems, is often created by the adoption of new schemes (e.g. adoption of
greening), integration of new tools and e-solutions (e.g. GSAA), or modifications in
schemes or processes. However, changes in the set-up of IACS may also be
initiated by the Member States with the aim of improving efficiency, usability etc.
Set-up costs could be further broken down into sub-categories. For instance, costs
for initial establishment of IACS, costs for integrating LPIS, costs for setting-up
greening etc. However, cost information at such a detailed level could not be
retrieved.
Set-up costs, 14%
Running costs, 12%
Management and controls costs, 74%

Analysis of administrative burden arising from the CAP
63
Running costs presented in this study represent the total annual amount of
spending for the running of IACS. These include the worked hours of staff,
purchases of products and services associated with system maintenance,
monitoring and reporting, and evaluations, as well as costs associated with LPIS.
Running costs are split into the following three categories, which are elaborated in
the indicated sections:
Horizontal IACS staff (Section 4.3.1) covers overall IACS management
operations, such as database management, applications management, control
management etc.;
LPIS (Section 4.3.2), which includes provision of correct reference parcel
information (including imagery acquisition), furnishing the application process,
and enabling checks;
LPIS QA (Section 4.3.3), which covers preparing and carrying out tests (i.e. the
LPIS QA data test suite) and communicating results, including reporting to the
Commission.
Management and controls costs represent the total spending for managing all
the specific IACS based schemes and measures (excluding the overall IACS
management) directly or indirectly linked to conducting controls. These include the
worked hours and purchases of products and services associated with the day-to-
day management activities of all specific schemes, such as calculating and
conducting of payments, processing and selection of applications as well as
organising and conducting controls. For the purposes of this study management
and controls costs are divided in the following, which are elaborated in the indicated
sections:
Horizontal controls costs (Section 4.4.1), which are horizontal costs - for all
IACS measures - for the execution of administrative checks and on-the-spot
checks;
Payment entitlements (Section 4.4.2), which covers the operations required to
initiate the basic payment scheme (e.g. initial allocation of entitlements,
establishing values), run all recurring operations related with payment
entitlements (e.g. keeping track of updates, processing applications) and
conduct the controls on the basic payment scheme applications;
Greening (Section 4.4.3), which covers the operations related to dealing with
greening claims, such as calculating and transferring payments due to
beneficiaries, and conducting administrative and on-the-spot checks for greening
applications;
Cross-compliance (Section 4.4.4), which covers the execution of all compliance
checks required under GAEC and SMR, as well as the relevant reporting and
follow-up;
Rural development measures (Section 4.4.5), which covers operations related
to the IACS based rural development measures, such as managing the open
calls, selecting the applications, processing the payments, conducting controls
etc.
Cost structures for these three cost elements vary among Member States. As
shown in the figure below, the case studies indicate a moderate correlation
between the size of the agricultural sector (represented by agricultural holdings)
and the shares of set-up costs (r=-0.31), and management and controls costs
(r=0.33).

Analysis of administrative burden arising from the CAP
64
Figure 14 Cost structure of individual Member States
Source: Consortium’s data collection through case studies
Set-up costs are often higher for Member States with fewer agricultural holdings.
There also appears to be a trade-off between the shares of set-up costs and
management and control costs. Moreover, other aspects defining the
implementation choices of Member States have an impact on the overall costs.
Such factors often are geographic considerations (e.g. mountainous areas),
historical factors (e.g. continuity of funding), structural conditions (e.g.
regionalisation), technological advancements (e.g. adoption of GSAA) or political
ambitions (e.g. environmental conditions). Particularly the latter combined with
flexibility in the interpretation of legal prescriptions, fears of auditors and lack of
alignment between stakeholders lead to what is often interpreted as gold-plating.
Gold-plating could however not be quantified as it is often the outcome of
intentional choices with expected benefits (and can as such not be declared
“unnecessary”) or overcompensated by other implementation decisions (including
technological uptake).
Looking at the cost estimates from a more granular point of view, the figure below
illustrates that rural development measures represent the highest cost
driver with a median value of 32% of the total costs. IACS IT Investment and
payment entitlements (Basic payment scheme) are also significant cost
sources with a median value of 14%. As for the Member State cost structures from
the case studies presented above, ranges for each category vary.

Analysis of administrative burden arising from the CAP
65
Figure 15 Breakdown of main of IACS related costs borne by national administrations
Source: Consortium’s data collection and DG AGRI Cost of Controls Survey 2018
Note: the category “other DP related activities” should not be mixed-up with the horizontal assessment
of control costs as described in chapter 4.4.1. This category quantifies the remaining costs for
management and controls deducting PE, greening, cross-compliance and RDP, hence capturing aspects
such as young farmers scheme and voluntary coupled support.
Cost impact of the CAP 2013 reform
Evidence from the case studies indicates increases in IACS-related running costs
increased following the CAP 2013 reform of between 17% and 58%, with an
average of about one third. Some case study respondents attributed the cost
increases to the introduction of the greening obligations (see Section 4.4.3). The
cost of establishing new reference layers, outsourced data acquisition, and
subsequent verification by the paying agency were also indicated as factors,
particularly due to the need to recruit additional staff. IT systems also needed to be
modernised to cater for these changes. In other instances, a combination of the
control requirements arising from the legislation alongside existing national legal
framework increased complexity and raised cost.
While paying agencies observe increased costs due to the CAP reform, interviewed
farmers indicated that there was no significant increase in their administrative
burden.93.
93 NOTE: the farmers survey focuses on administrative burden and not compliance cost, which are of much higher
relevance for farmers than for administrations.

Analysis of administrative burden arising from the CAP
66
4.2 Set-up costs
Estimated set-up costs of €250 m -
€275 m or 14% of overall IACS cost
(yearly costs)
Costs ranging from 6% in larger Member States, to
40% in smaller ones
IT choices and architecture have a major impact on
the variability of costs and the ability of Member
States to adapt to changing regulations
System enhancement can deliver a
20-30% reduction in costs
The greater the level of customisation
the greater the cost
Disproportionate impact of set-up costs on smaller
Member States
Set-up costs cover all costs arising from establishing or upgrading IACS to meet the
legislative framework following the 2013 CAP reform. Set-up costs are typically
one-off investment in IT, which is often outsourced.
Set-up costs are estimated at €250 million to €275 million, or 14% of the annual
IACS cost borne by Member States. In practice, these costs are higher at the
beginning of the planning period and decrease over time. Cost estimates show that
set-up costs also have a disproportionate impact on smaller Member States ranging
from around 6% in larger Member States to up to 40% in smaller Member States.94
94 NOTE: Set-up costs could conceptually be further broken down into sub-categories of costs such as costs for initial
establishment of IACS, costs for integrating LPIS, costs for setting-up greening etc. However, cost information at
such a level of detail is not collected by Member States under assessment.
Set-up costs, 14%

Analysis of administrative burden arising from the CAP
67
The need for the development of new IT systems, or updates of the existing ones is
often created by the adoption of new schemes (e.g. Greening), integration of new
tools and e-solutions (e.g. GSAA) or modifications in schemes or processes. The
case studies indicate extensive preparation, adaptation and maintenance of IT-
systems due to the new greening requirements, e.g. the development of new layers
to incorporate the greening elements in the system. The case studies confirm that
considerable time and effort were spent to set-up and prepare IT-systems, both to
incorporate the greening requirements, and to inform farmers about the changes in
the legislation. These costs are considered the largest driver of overall cost and can
account to up to 20% of establishment costs.95
Table 6 Main sources of costs related to greening requirements
Main sources of costs mentioned by (regions of) Member States Mentioned by X
Member States
IT
Preparations and technical refurbishment of the IT systems and
requirements for administration and control system
4
Layer digitisation 6
Layer maintenance 1
Modification aid application form 3
Information to farmers
Information to farmers 1
Controls
Differentiated and time-divided on-the-spot-inspections for EFA
requirements
9
Source: Consortium based on case studies
Changes in the set-up of IACS may not only be due to new requirements, but also
be initiated by Member States aiming to increase efficiency, usability etc. Key cost
components include: hours spent by IT staff and purchases of products and
services associated with establishing all necessary infrastructure (hardware) and
applications (software) to operate IACS.
95 Alliance Environnement and Thünen Institute (2017): Evaluation study of the payment for agricultural practices
beneficial for the climate and the environment, see:
https://ec.europa.eu/agriculture/sites/agriculture/files/fullrep_en.pdf

Analysis of administrative burden arising from the CAP
68
Figure 16 Share of Set-up cost out of total IACS administrative cost in relation to
number of agricultural holdings
Source: Consortium’s data collection and Member State estimates
Solutions for and costs of setting-up IACS
Most Member States covered by the case studies developed purpose-built systems
by either adapting general licenced software to meet IACS requirements or creating
bespoke systems using either in-house or external developers. This often involved
the integration of several different components, sometimes developed by different
suppliers to deal with the challenge of changes resulting from major reforms. In
other cases, Member States either (i) procured software where a component or
components were developed/provided by commercial suppliers to meet the specific
requirements of the CAP/IACS or (ii) used suppliers that were established primarily
to develop CAP/IACS solutions, such as LPIS systems or remote sensing modules.
The former has the benefit of introducing systems that do not need to be designed
from scratch, though they will still need to be adapted to national needs and
integrated with other IACS systems. In the latter, Member States are able to
leverage the IT skills of companies that are familiar with the complexities of CAP
which can reduce analysis and design time and costs.
In addition, Member States operating regional models either provided common
software to the regions or national technical specifications96 to ensure that systems
were developed to harmonised standards. In these instances, Member States were
able to benefit from a degree of commonality, though systems still needed to be
adapted to meet national or regional needs and required integration with other
components.
Other Member States purchased “out of the box” software packages
specifically designed to deliver a fully integrated IACS solution. These
provide all the relevant core registers and databases to manage and control IACS
schemes, together with modules available for specific elements such as LPIS QA,
EU payments, accounting, and remote sensing. Updates to common elements are
96 National technical specifications are developed by some Member States to ensure compatibility of regional systems.

Analysis of administrative burden arising from the CAP
69
provided, but other elements need configured to local implementation choices and
potentially some customised solutions are required where certain practices are
unique to a Member State, region, or a processes for handling transactions and
claims that is different to the standard design. Local implementation choices
increasing overall costs, can be defined in a wider sense as gold-plating. Such gold-
plating is however usually happening based on good intention and to provide
additional benefits, which could cause higher costs for administrations. In general,
the greater the level of customisation the greater the cost, but this approach
has the advantage of sharing the costs of development, reducing and simplifying
integration, and reducing testing costs.
There were instances of enhancements of existing IT systems to achieve identified
benefits either in the speed of payment using existing resources or maintaining
levels of service with fewer people.
Insights from the case studies
One Member State experienced a 40% increase in costs following the introduction of the
CAP 2013 reform package. Just under 90% of this was due to increased set-up costs. A
significant amount of the increase can be attributed to increased costs in the use of
external IT suppliers.
In one example, a system enhancement that allowed the electronic input and capture of
inspection reports and findings delivered a 20-30% reduction in costs and improved the
speed of input and resolution compared with the previous position, enhanced the quality of
the information as results no longer needed to be manually transposed, and eliminated
previous paper and printing costs.
Both the level of integration and the modernity of the systems impact on
the speed and cost of development required by major reforms. With the
exception of one Member States, which reported a development cycle of less than a
year, all case study Member States reported a development lifecycle to
implement changes associated with a major reform package of at least two
years. In most cases, a three-year cycle from the production of draft council
regulations to the introduction of a new scheme was considered to be the norm.
Based on preliminary analysis of their current IT systems and the emerging
proposals, most Member States envisage a similar or lengthier development cycle
for the next reform period, once clear requirements are known.
These case studies indicate that the existing IT architecture has a significant
impact on the ability of Member States to adapt to changing regulations. In
general, those Member States using integrated solutions or components specifically
designed to meet IACS requirements have shorter development lifecycles than
those using general purpose IT software (adapted to meet regulatory requirements)
and/or requiring the integration of multiple different components. In these latter
cases, development and test cycles are longer. This is particularly the case when
responsibility for IT systems is shared between national and regional authorities, or
different implementation bodies. Sharing the implementation is also always a factor
that increases the risk of gold-plating, given the increased need for communication
and alignment between the implementation bodies. A previous study focussing on

Analysis of administrative burden arising from the CAP
70
the EAFRD showed that in case of no clear agreement, bodies tend to prefer being
“on the safe side”, by introducing stricter rules than what is absolutely necessary.97
Some Member States are experiencing difficulties in adapting their IT systems to
conform to the last set of reforms. At that time, some Member States took the
opportunity to upgrade or change some or all elements of their IT platforms to
better deliver their services and obligations. In other cases, the reforms were
managed by through incrementally developments of existing IT platforms. Some of
the EU13 Member States, which developed some of the most modern IT platforms
after accession (approximately 10 years ago) that are now reaching the end of their
life-cycle, are considering upgrading or changing their systems to cater for the
forthcoming reforms. This could lead to more flexible and cost-effective solutions
but there could be risks from changing IT at the same time as implementing major
regulatory reforms. In addition, because of the risks involved or the limitations of
their existing IT solutions, Member States may be cautious or discouraged from
considering control systems that differ significantly from those currently in place,
even though this could potentially deliver attractive benefits.
Future CAP and opportunities to reduce administrative burdens
Member States indicate that they frequently find it necessary to initiate
developments of their IT systems based on assumptions made in advance of
regulations being agreed, which can necessitate subsequent adaptation causing
implementation delays. Such unclarity also provides additional room for overarching
rules or activities which later might be interpreted as gold-plating.
There is a consensus view that impact assessments and high-level estimates of
development cost and effort can begin while regulations are in negotiation but
system analysis starts after their adoption, and development starts when there is
agreement on delegated and implementing acts, which need to be in place at least
one year before systems need to be operational.
Some Member States, stress that the timing of the regulation is not the major
factor, but internal timings of IT development are critical. IT development often
takes place in phases; for example, software to receive and confirm an application
may be developed in advance of software to calculate values and make payments.
Taking into account the IACS scheme cycle, Member States indicate that
confirmation of rules relevant to different aspects of the cycle (e.g. application
design and receipt, administrative validation and controls and later payment
calculations and penalties) should be prioritised according to the timing of the cycle
in which they are to be implemented. This is considered more important than
developing a comprehensive regulation covering all aspects, if doing so introduces
delays and uncertainty. Hence, the IACS scheme cycle should be taken into
consideration when specifying the CAP after 2020.
97
European Parliament, Directorate-General for Internal Policies, Policy Department D. Budgetary Affairs (2014): ‘Gold-plating’ in the
EAFRD. To what extent do national rules unnecessarily add to complexity and, as a result increase the risk of errors?

Analysis of administrative burden arising from the CAP
71
4.3 Running costs
Estimated running costs of €200 m - €225
m or 12% of overall IACS cost
Horizontal IACS staff cost is estimated at €65
m - €75 m or 4% of overall IACS cost
Regionalisation may constitute practical constraint to
deliver economies of scale
A number of existing new
technologies have not yet been
tested by the Member States
Initial results from the use of GSAA and
Sentinel imagery indicate potential cost
reductions and other benefits
44 LPISs in operation, with some 135 million
reference parcels
LPIS is estimated at €133 m - €147 m and LPIS QA at
€3.5 m - €4.2 m or 8% and 0.2% of overall IACS
respectively
Acquisition of imagery is a main
source of costs under LPIS
Agricultural parcel and Farmer’s block most
effective LPIS QA has led to improvement of LPIS
Running costs, 12%
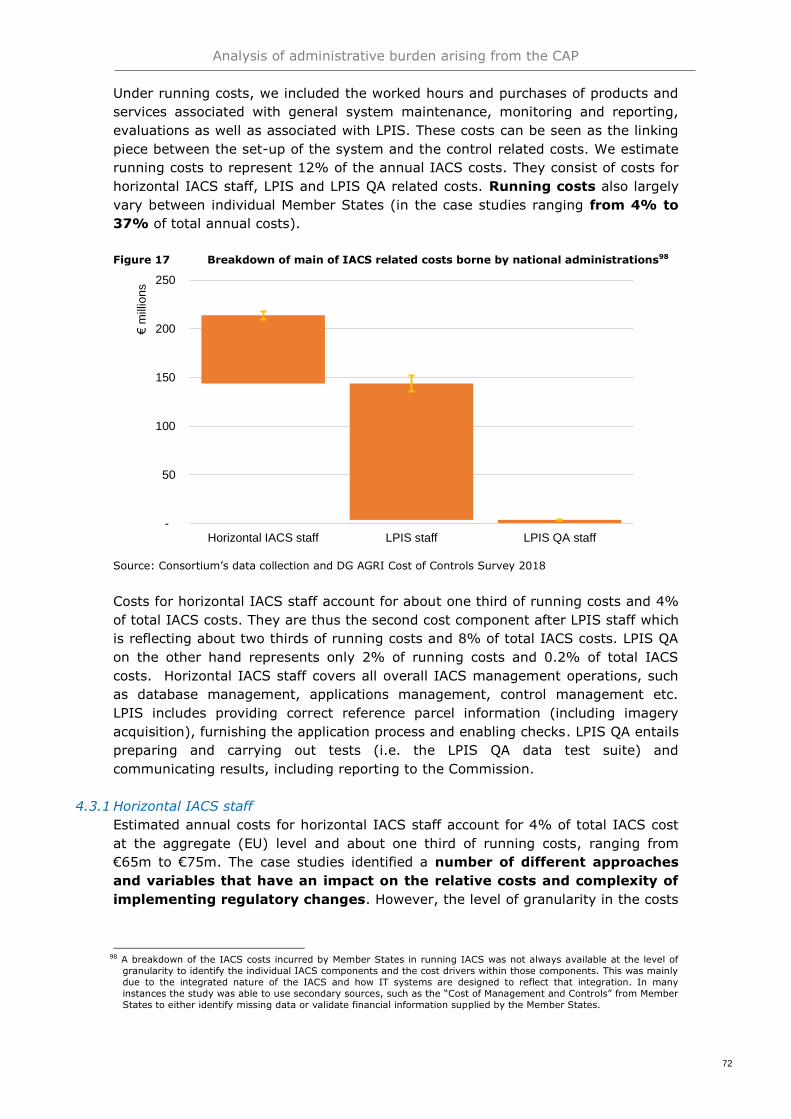
Analysis of administrative burden arising from the CAP
72
Under running costs, we included the worked hours and purchases of products and
services associated with general system maintenance, monitoring and reporting,
evaluations as well as associated with LPIS. These costs can be seen as the linking
piece between the set-up of the system and the control related costs. We estimate
running costs to represent 12% of the annual IACS costs. They consist of costs for
horizontal IACS staff, LPIS and LPIS QA related costs. Running costs also largely
vary between individual Member States (in the case studies ranging from 4% to
37% of total annual costs).
Figure 17 Breakdown of main of IACS related costs borne by national administrations98
Source: Consortium’s data collection and DG AGRI Cost of Controls Survey 2018
Costs for horizontal IACS staff account for about one third of running costs and 4%
of total IACS costs. They are thus the second cost component after LPIS staff which
is reflecting about two thirds of running costs and 8% of total IACS costs. LPIS QA
on the other hand represents only 2% of running costs and 0.2% of total IACS
costs. Horizontal IACS staff covers all overall IACS management operations, such
as database management, applications management, control management etc.
LPIS includes providing correct reference parcel information (including imagery
acquisition), furnishing the application process and enabling checks. LPIS QA entails
preparing and carrying out tests (i.e. the LPIS QA data test suite) and
communicating results, including reporting to the Commission.
4.3.1 Horizontal IACS staff
Estimated annual costs for horizontal IACS staff account for 4% of total IACS cost
at the aggregate (EU) level and about one third of running costs, ranging from
€65m to €75m. The case studies identified a number of different approaches
and variables that have an impact on the relative costs and complexity of
implementing regulatory changes. However, the level of granularity in the costs
98 A breakdown of the IACS costs incurred by Member States in running IACS was not always available at the level of
granularity to identify the individual IACS components and the cost drivers within those components. This was mainly
due to the integrated nature of the IACS and how IT systems are designed to reflect that integration. In many
instances the study was able to use secondary sources, such as the “Cost of Management and Controls” from Member
States to either identify missing data or validate financial information supplied by the Member States.
-
50
100
150
200
250
Horizontal IACS staff LPIS staff LPIS QA staff
€ m
illio
ns

Analysis of administrative burden arising from the CAP
73
provided makes it difficult to reach clear financial conclusions on the factors that
influence the administrative burden on Member States.
Main cost elements of horizontal IACS activities
Organisational level and structure
One aspect defining the cost structure of horizontal IACS management, is the
organisational structure applied. The main distinction can be made between those
Member States that adopted a regional model and those that operate with one
central paying agency. The choice of these models often reflects the level of
delegated autonomy at a political level. De-centralised (regional) managing
models may constitute a practical constraint to delivering economies of
scale, and cost-effective and less burdensome structures and processes.
This introduces additional overhead costs.
Insights from the case studies
One Member State needed to establish an operational team to cover the regions and the
ministry to oversee and monitor the management and development of IACS systems.
Regions can use nationally developed systems, but maintain the autonomy to choose
whether these are deployed and in some instances choose to manage their own.
In addition to the general central vs regional structure, Member States have
different approaches concerning the involvement of different bodies or the
delegation to other state bodies such as local municipalities. Such choices can also
affect the application processes. Most Member States in the case studies had a
single application covering both Pillar I and Pillar II IACS schemes. This
was however not always the case where responsibilities were managed by different
bodies or agencies. However, not only the integration of applications into one
system in one year allows for simplification, but also the integration of historic data
and applications into updates and new applications. Several Member States
invested heavily in processes and structures that allowed both farmers and
administrations to update key data on an ongoing basis rather than having this
information checked at the point of aid application or payment claim submission.
This reduces the amount of anomalies found and the amount of effort required to
manage these.
Insights from the case studies
One paying agency has over three times as many people working in its “front office”
managing updates and receiving claims as it has in its “back office” dealing with anomalies
found during administrative cross checks.
Structural decisions are also taken with respect to outsourcing of specific services.
While in some instances, there has been little or no outsourcing, others have
chosen to outsource where they do not have the practical in-house specialist skills
or capacity. As some tasks, such as confirmation of crops for greening, have a very
tight timescale, more resources and greater flexibility are needed. In these cases, it
makes more sense to outsource specific tasks, to manage them in a more cost
effective way.

Analysis of administrative burden arising from the CAP
74
Overall, the analysis does not allow for general conclusions on the ideal
organisational structure, given that it always has to be built in the national/regional
context. The case studies show however that there are examples on how cost
savings were achieved due to structural changes in the way that services
were delivered.
Insights from the case studies
One Member State reorganised its paying agency to become more activity based,
recognising that there needed to be greater overall management responsibility and
accountability for IACS. This new structure envisages delivery at reduced cost and greater
oversight and control over how IACS is implemented. Another country was able to
significantly reduce the costs associated with a rural development nature management
scheme (from €27 million to €15 million) due to the changes to managing applications
through regional collectives starting in 2015.
Levels of e-take up
There is a significant variation in the levels of electronic take up between
Member States. In some instances all key transactions are managed electronically,
whilst in others take up is extremely low (less than 1% of all transactions). This is a
reflection of the levels of sophistication of the overall electronic enablement and
expectations of how the Member State interacts with its citizens. This is closely
linked to the wider challenges in increasing e-take up due to the aspects of the age
of the farming population, its relative sophistication and the ability to access
sufficient broadband services in remote rural areas. Consequently, Member States
often provide extensive local physical support to farmers. Such “Front Office”
facilities to farmers who are physically able to present their proposed changes and
updates and have any issues identified in real time, provide reassurance and a
cost-effective option for both administrators and farmers appropriate to the nature
of the Member States. This option is cost-effective if not provided only to a handful
of farmers. It however might also act as a disincentive for them to use online tools.
Investments in new and extended IT systems are often costly (see Section 4.2). We
however also see that they often substantially decrease the amount of paper work
and the manual works to be done, which leads to a positive benefit cost ratio in the
longer run.
Insights from the case studies
One Member State was able to reduce the cost of maintaining a paper channel of
applications tenfold over 10 years as the take-up in e-claims increased. There would also
be additional associated paying agency labour costs savings by avoidance of manual or
other data capture or the opportunity to transfer staff to more productive validation work
to speed up payments.
Impact of new technologies on costs
The majority of the administrations made investments or identified opportunities to
use technology to cater for the changes arising from the CAP 2013 reform. Often
the main driver of these investments was the need to address perceived or
identified control risks and therefore eliminate or reduce the risks and cost of

Analysis of administrative burden arising from the CAP
75
financial corrections for incorrect application of EU rules. In other instances,
additional investment was required to comply with regulatory requirements that
were prescribed incrementally or needed to be met in later years such as the
introduction of GSAA or the establishment of an EFA control layer. In the following
a further assessment of GSAA, Remote Sensing, Sentinel Satellite Data, Spatial
Software tools, Geo-tagging, Drones, robots is presented.
a. Geo-Spatial Aid Application
GSAA is not completely new. Some Member States adopted electronic claims with a
geo-spatial component before GSAA became a requirement. This provides several
attractive features for farmers, such as on-line crosschecks with paying agency
databases and instant anomaly warnings that can help minimise the number of
mistakes in declarations. It also reduces the number of errors and checks the
paying agency needs to undertake between the receipt of the application and
making payment. Comparing Member States with GSAA in place for several
years against those that have only recently implemented the requirement
shows that the costs of controls are about 50% higher for the latter. This
suggests that the marginal benefits of introducing GSAA are high. However, the
available data is relatively thin and does not allow a robust calculation of the cost-
benefit ratio. The cost reductions would need to be further validation with a more
comprehensive data set before reliable conclusions could be drawn.
Insights from Case Studies - Specific Member State reflections on the use of
GSAA
The most enthusiastic comments on GSAA indicated that it provides higher accuracy and
speed of the procedure for aid applications, and that that having everything online (web
based) and automated, allow a continually improvement of the communication between
farmers and the assistance bodies.
Another Member State highlighted that the GSAA reduces time spent by farmers and for
different controls, thanks to one shared information base. The online application (including
the GSAA) was first tested in the Member State in question in 2005 and has been
progressively deployed during the 2007-2013 period. Automatic controls were launched in
2015 and the system has been operational since 2017. The main difficulty arises from
farmers’ double declaration on a same parcel (superposition in the GSAA) and shared
utilities. Transfers are also more difficult to deal with, as they requires specific verification,
including notarial deed, which is not automatable.
A Member State has introduced the GSAA according to the timing established by EU
regulation. Currently, it applies the GSAA at 100% for direct aid and at 25% for rural
development measures, with wide differences between paying agencies. The adoption of
the GSAA is deemed to contribute to a high extent to improve cost-effectiveness.
Furthermore, on the basis of a specific action plan shared with the competent EU
Commission services, the overcoming of the cadastral parcel with a new model of
reference agricultural parcel being planned. The Member State expects that the surfaces
will not have to be measured in the new control model for monitoring, thanks to the
measurements determined in the GSAA system and the cross checks with LPIS.
The paying agency from another Member State with 100% GSAA coverage, stated that the
use of the GSAA has already improved the cost-effectiveness of IACS (EAGF & EAFRD).

Analysis of administrative burden arising from the CAP
76
The most important improvement has been the reduction of the administrative burden due
to the use of the digitization of the land parcels and the improved reliability of land
register that leads to fewer OTSCs.
In Member States where the GSAA has been available more recently (since 2015) a
Member State indicates as the main effects included improving cost-effectiveness to an
average extent, while two others argue it has not. In terms of control of double claims
(two applications for the same parcel or for the same farmer) at the margins, decrease in
the number of them and control of large farms. One Member State points to low update of
online applications due to low digital literacy of farmers’ population in the Member State.
b. Remote Sensing
A few Member States, particularly the smaller ones, already use remote sensing to
the maximum extent as part of their control regime. This has allowed a reduction
in the number of on-the-spot controls and more targeted use of resources
when inspectors need to be deployed on-farm. The use of the imagery together
with other data sources or technologies could be optimised to add value to the
overall control regime.
Insights from the case studies
One Member State uses Light Detection and Ranging (LIDAR) which an active remote
sensing system that can be used to measure vegetation height across wide areas. It uses
light in the form of a pulsed laser to measure ranges (variable distances) to the earth. Its
use, in conjunction with remote sensing has enabled a better evaluation of the eligible
areas of grassland under the pro-rata method for areas of permanent grassland. Its use in
conjunction with crop identification software has provided the potential to support a more
cost effective means of undertaking the greening crop diversification inspection
requirements in a short period. It can also be used to scan terrain multiple times a year,
and crosscheck this against other layer of information to identify anomalies and changes
for further consideration. It provides the opportunity for more targeted control checks such
as in large areas of land which are difficult to physically access or where land is under
shared or common ownership. However, reliance on this as a method is often tempered by
the existence of cloud cover over these inaccessible areas.
c. Sentinel Satellite Data
A number of Member States are either piloting or considering the use of Sentinel
imagery. Recent regulatory changes and the new CAP reform proposals
introduce the possibility for the greater use of monitoring techniques
across IACS schemes where Sentinel is likely to play a significant role.
Insights from the case studies
One Member State has tested and used Copernicus Sentinel-1 and Sentinel-2 imagery with
other software to check its grassland-mowing obligation and uses the results to fine-tune
the application for 2018. To minimise the number of non-compliances the system notifies
farmers by e-mail or text when they have two weeks until mowing deadline reminding
them of the need to mow together with spatial information locating the area concerned.
The aim is to expand this to crop group identification and look at other potential uses such
as the detection of nitrogen fixing crops and cultivated fallow land. Another Member States
has used Sentinel data for a couple of years.
In 2016, Sentinel-2 data was used in support of its remote sensing campaign (about

Analysis of administrative burden arising from the CAP
77
50 000 sampled and verified farmers) through the European Space Agency (ESA) portal
and other open services. In 2017, it expanded this by using multi-temporal analysis with
multiple Sentinel-2 images. In this Member State 74 sample areas of 30 000 sq km,
230 Sentinel-2 images were acquired to provide information throughout the agricultural
year: winter, spring, until late summer.
Existing feedback from case studies and other pilots are largely positive towards
the further increase of using Sentinel. However, these pilots are mostly in the early
stages to determine if sentinel uses are cost-effective. Moreover, there were also a
number of more challenging aspects to the introduction of this technology
that will need to be addressed.
Insights from the case studies
In one Member State, initial analysis is that whilst 100% monitoring via satellites is an
aim, it would require a significant amount of additional labour. With 100% monitoring, the
level of potential inconclusive cases that may need field checks would be more onerous
than traditional 5% sample on-the-spot-checks. Similarly, early indications from another
also indicate high utilisation costs.
The following table provides an overview on the key benefits and issues identified:
Table 7 Benefits and issues of using Sentinel
Benefits Issues
The introduction of checks by monitoring would
provide the opportunity to replace 5% on-
the-spot checks with a system for 100%
monitoring, based on the automatic detection
of agricultural activities by each farmer;
It is possible that farmers could have the
possibility to alter claims and rural
development agreements on an ongoing
basis to reflect changes in their holdings and
management obligations;
Potentially simplifying the annual claims
process by basing payments on monitoring
checks and technologies and portals for farmer
notification. In addition, the size of a control
unit can be reduced. This could reduce costs
particularly in Member States where large
numbers of inspections are required;
Increased accuracy and simplification of
the aid application from farmers, through
the confirmation of the results of the
monitoring and the combined use of geo-
tagged photographs;
Elimination of bottlenecks improving the
speed of payments for beneficiaries;
Reductions in penalties and error rates;
More timely identification of irregularities;
Cost reductions in the cost of procurement
of control imagery by using this “open
source” data;
Using sentinel imagery in tandem with land use
The administrative, technical and
cultural challenge of moving from a
system of change being identified on
an annual or less frequent basis to
one where change is constantly
identified;
Sentinel alone is unlikely to fully
replace existing methods (and their
cost) to determine boundaries and
ineligible features and higher resolution
images are needed to provide a full
picture;
The geometric resolution of Sentinel-2
(10m pixels) is insufficient for some
elements and features such as hedges,
ponds, ditches, trees in line or in groups,
margins of field, traditional walls. Also
updating parcel boundaries and for many
permanent crops (olive groves, scattered
orchards);
Monitoring parcels of <0.5 ha (present
in very high numbers in some Member
States);
Potential increased total cost of
ownership including:
- costs of developing the associated
software;
- algorithms for accessing processing
and interpreting the images;

Analysis of administrative burden arising from the CAP
78
Benefits Issues
identification software to determine crops. This
is particularly pertinent as potential
alternatives for greening controls where a
large number of inspections need to be
undertaken in a narrow control window
and catch and cover crops must be determined
in different periods. The greater frequency and
availability of sentinel imagery can be more
reliable than remote sensing capability,
particularly in areas of greater cloud cover;
Determination of cultivated areas,
grassland and other features for direct
payments and some rural development
commitments such as vineyards, wild bird
cover establishment and traditional
meadowland;
Support for compensation or derogations
associated with unnatural events such as
flood or severe drought conditions where the
areas impacted can be monitored more
precisely over time;
Using the imagery to indicate potential
anomalies in eligible areas (though not
accurate dimensions) in tandem with
automated software that produces alerts to
digitisers or controllers for future follow
up.
- data storage capacity or cloud
computing costs together with
digitising costs of managing the
availability of changes.
The preliminary assessment confirms that Sentinel data has the potential to be
a key component of a future monitoring system. Their use presents the
possibility to reduce the burden of on-the spot controls on administrations and
beneficiaries in some areas. It is however more likely to be a cost-effective solution
for those Member States with high numbers of farmers, which require large
numbers of checks. In other Member States or regions, particularly with a smaller
land area where the LPIS can be updated by imagery sources annually, there is a
risk that sentinel will introduce additional development and maintenance costs
without a commensurate improvement in control or potential for cost reduction.
d. Spatial Software tools
One of the more positive areas of development and consideration is around
the use of tools to assist the ingestion and analysis of change. These range
from:
software that determines specific land use; to
hyperspectral analysis that allows for identifying the type of land cover by
interpretation of the colours on ground; and
the identification of potential anomalies for further research through tools that
automatically update the LPIS where the area is considered to be sufficiently
accurate against a specified set of rules thereby eliminating the need for manual
digitisation.
Imagery, whether regularly obtained via sentinel or more traditional means is
combined with other layers of developed, procured or open source data that allow a
suite of checks against different regulatory direct payment and rural development

Analysis of administrative burden arising from the CAP
79
requirements to take place. The majority of these tools use probability assessments
where parcels, land uses, areas or features are flagged as potential anomalies often
using “traffic light” coding. The higher the level of probability required then the
greater the number of potential anomalies that may require follow up or
investigation. The key to ensuring that these and other technologies are able to
make a cost-effective investment proposition compared with those currently in use
is agreeing a sensible level of acceptable residual risk to both Member States and
EU funds. If this is not achieved then it is likely that Member States, fearful of
financial corrections, will set very high probability levels, identifying large numbers
of anomalies that need investigation or ratification. This introduces the capacity for
significantly increased costs or having to invest in several different technologies to
reach the required level of assurance.
e. Geo-tagging
There are a number of Member States considering or using geo-tagging capability.
Inspectors or farmers provide evidence via time, date and location stamped images
taken via smartphones or tablets. Geo-tagging refers to adding the metadata for
these geo-spatial information on images or other media. Identified uses include:
Providing an effective means for any area that is not effectively
monitored by imagery or where there is doubt that needs verification as the
result of controlled use of that imagery;
Validation of crop type or feature within a land parcel particularly in
determining crop diversification obligations under greening but also for specified
crops or areas under voluntary coupled schemes and features in rural
development measures;
A potential cost-effective alternative means of confirmation of small
land parcels against a combination of sentinel and high resolution imagery;
Where the model provides the opportunity for the farmer or representative to
submit the geo-tagged evidence, the ability to save travel and resource
costs by eliminating or reducing the need for rapid field visits or even full on-
the-spot controls;
A supplementary route to provide secondary information for certain
crops or schemes such as details of seed labels;
Another tool for updating and maintaining the accuracy and currency of
the LPIS.
Overall there are positive views about the potential uses of geo-tagging
within an overall framework of spatial and technical monitoring tools. The
full costs of using this technology are however only currently being explored.
Moreover, its use is not without challenges. Technical skills are needed to provide
an authoritative set of images that can be used to assure the accuracy of control or
declared areas. It should be reasonably easy to train control officers in its use but it
may be more problematic where farmers would supply the evidence. In several
Member States, particularly those showing low current levels of direct e-take up on
claims and other transactions by farmers where there is also an aged farming
population; there may be insufficient current technical capability to make this a
widespread option that can reduce control costs. The technology needs to be
tamper-proof to provide assurance that the image represents the actual parcel or
area on the date and time in question. There is also a need to ensure that any
photographs taken or used for control purposes do not include any unauthorised
Analysis of administrative burden arising from the CAP
80
personal data of either people associated with the holding being controlled or any
third parties with no such ties.
One on the use of geo-tagging from the Member States and the costs it entails are
rather limited. One single Member State indicated the costs for the development of
a working model of around €50 000, indicating it has the potential to provide a
cost-effective component.
f. Drones
The most realistic use of drones is for targeted campaigns on specific areas where
physical access is difficult for traditional on-the-spot controls. Currently their
coverage and range limits their usefulness. Several Member States have
considered and discounted their use on cost effectiveness grounds and the
need to avoid too many different technologies seeking to achieve the same
aim. The time and cost to acquire the details of the area under control, preparation
and processing combined with the level of initial and ongoing capital investment
have dissuaded its widespread use and placed the focus on targeted “high value”
inspections. There are also legal limitations in some Member States where it is
currently national law that drones cannot be flown out of the sight of the operator.
As well as the practical challenges, there are wider issues that need to be
overcome. In areas of relatively high population density or where the drones are
being used to monitor agricultural land within sight of non-agricultural areas or
businesses there may be suspicion from those not subject to the control regarding
their use. Public bodies are sensitive to the negative publicity and challenge that
may arise in these circumstances.
However as the sophistication and ability of drones to operate successfully beyond
the eye of the controller improves, so too does the opportunity to complement
other control techniques. Drones of this type may be fuelled by hydrogen and can
therefore undertake a control check over a greater area. In addition to eliminating
controls in areas difficult to access, they could also resolve issues where remote
sensing images are impacted by cloud and therefore on-the-spot controls are
needed.
g. Robots
Robots are an option to reduce the time intensive tasks of staff in checking
applications. They are particularly interesting when interacting with software
applications. So far experience with robots is however limited, which does not allow
to draw overall conclusions on their cost-effectiveness. A few Member States have
investigated the possible use of robots with one of them having piloted the use of a
robot since 2017.
Insights from the case studies
In March 2017, one of the analysed Member States introduced robotics to perform certain
functions. The robot is software capable of working with a number of other software
applications. It has already evaluated thousands of applicants and their annual
applications. In a similar manner to paying agency staff, the robot does its work following
clear procedures and rules. When evaluating a document received, it checks employment-
related income and / or state social insurance pensions received and transfers the data to
paying agency forms in order to correctly calculate the support amount. It interrogates

Analysis of administrative burden arising from the CAP
81
other data sources to check the number of animals kept, and saves the generated report
in the paying agency’s internal system. The robot also completes the evaluation
questionnaire, checks the calculations and evaluates the application. In 24 hours, it
handles a daily workload of 6 employees alone, evaluating more than 400 applications.
This has the clear potential to reduce administrative costs, operate longer working hours,
support more timely payments to farmers and avoid human errors.
Future CAP and opportunities to reduce administrative burdens
Member States are generally supportive of simplification initiatives and the changes
in current regulations. They highlighted however instances where changes aimed
at simplifying IT processes for farmers resulted in additional
administration costs to adapt the IT.
Insights from the case studies
One example was the “Yellow Card” approach for applying a more proportionate penalty
regime where more discretionary application of penalties for unintentional first time
breaches. From the administrative perspective, the need to apply a retrospective element
was seen as particularly difficult. In most instances, Member States suggestions would
require a less rigorous application of controls to get the simplification benefit such as a
more liberal application of tolerances than currently permitted where the costs of
application of the control can be seen to be greater than the identified risk. Similarly, there
were proposals that specific circumstances of a Member States or region because of its
scale or geography should allow derogation or flexibility in the application of some controls
going forward.
Looking at the future of the CAP, case study interviews show largely consistent
views with those expressed in the Commission proposal for the post 2020 period
such as greater use of monitoring techniques and other technologies to allow the
reduction of traditional inspections. In addition, the less centralised approach to
IACS control via strategic plans presents the opportunity to address some of the
concerns highlighted. A number of Member States were supportive of the
ability to design their control systems reflective of local needs and to set
priorities within the overall IACS framework. There are clear opportunities to
simplify control systems with properly targeted risk-based solutions that can both
reduce administrative costs and the burden on beneficiaries. Nevertheless, there
were concerns identified through the case studies that the move of emphasis
towards national legislation and the need to achieve agreement of the proposed
approach with the EU would introduce greater risk of delay, cost and
implementation challenges including the risk of being accused for gold-plating for
the next reform package than previously. In particular if the timing of the
introduction of new schemes following the production of delegated and
implementing act is not adjusted to reflect these new procedures. In many cases,
these changes may have to be enacted into national legislation where previously
the EU regulations did not require any actions for their transposition. This could
also lead to some Member States coming forward with conservative proposals,
fearful that more radical plans will fall foul of subsequent audit criticism and risk
financial corrections. In this scenario, costs and complexity could increase, as
Member States apply new technologies and local systems in addition to all the
existing procedures rather than rationalising or replacing them.
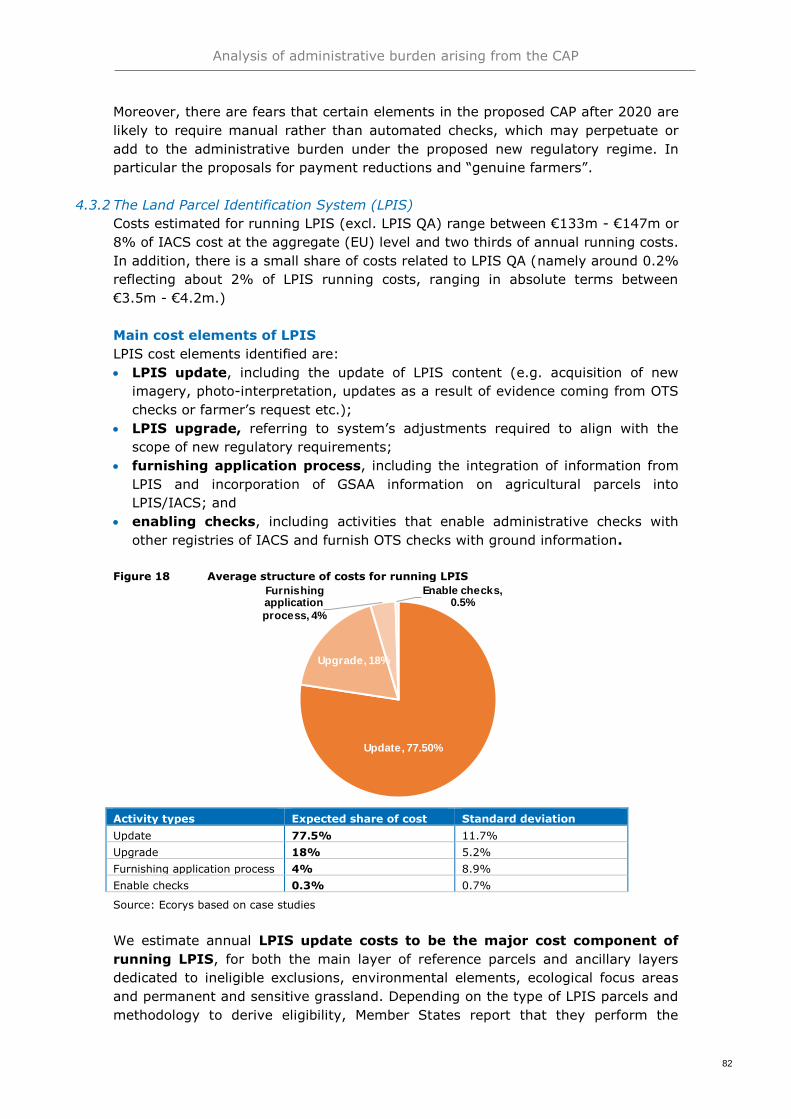
Analysis of administrative burden arising from the CAP
82
Moreover, there are fears that certain elements in the proposed CAP after 2020 are
likely to require manual rather than automated checks, which may perpetuate or
add to the administrative burden under the proposed new regulatory regime. In
particular the proposals for payment reductions and “genuine farmers”.
4.3.2 The Land Parcel Identification System (LPIS)
Costs estimated for running LPIS (excl. LPIS QA) range between €133m - €147m or
8% of IACS cost at the aggregate (EU) level and two thirds of annual running costs.
In addition, there is a small share of costs related to LPIS QA (namely around 0.2%
reflecting about 2% of LPIS running costs, ranging in absolute terms between
€3.5m - €4.2m.)
Main cost elements of LPIS
LPIS cost elements identified are:
LPIS update, including the update of LPIS content (e.g. acquisition of new
imagery, photo-interpretation, updates as a result of evidence coming from OTS
checks or farmer’s request etc.);
LPIS upgrade, referring to system’s adjustments required to align with the
scope of new regulatory requirements;
furnishing application process, including the integration of information from
LPIS and incorporation of GSAA information on agricultural parcels into
LPIS/IACS; and
enabling checks, including activities that enable administrative checks with
other registries of IACS and furnish OTS checks with ground information.
Figure 18 Average structure of costs for running LPIS
Activity types Expected share of cost Standard deviation
Update 77.5% 11.7%
Upgrade 18% 5.2%
Furnishing application process 4% 8.9%
Enable checks 0.3% 0.7%
Source: Ecorys based on case studies
We estimate annual LPIS update costs to be the major cost component of
running LPIS, for both the main layer of reference parcels and ancillary layers
dedicated to ineligible exclusions, environmental elements, ecological focus areas
and permanent and sensitive grassland. Depending on the type of LPIS parcels and
methodology to derive eligibility, Member States report that they perform the
Update, 77.50%
Upgrade, 18%
Furnishing application
process, 4%
Enable checks, 0.5%
Analysis of administrative burden arising from the CAP
83
update parcel-by-parcel (including changes for different layers), while in some
cases, the work is conducted layer-by-layer, e.g. ineligible features, are treated
separately, sometimes by different administrations.
Overall, upgrading is considered the second largest cost item, being placed
at about one fifth of the cost. In some Member States it is only responsible for
13-16% of LPIS costs, while in others it can go up to almost 26%. The amount of
data to be digitalised depends on Member States’ approach. Some Member
States decided to include into ecological focus areas only those elements that were
relevant to GAECs and environmental schemes in the previous period. Since these
data had been used before, costs on ecological focus areas layer decreased
considerably. In those Member States, the highest costs are reported for the
separation of land use – arable land, permanent grassland and permanent crop.
These countries declared that the costs linked with LPIS are significantly high.
In those Member States where the percentage of GSAA is relatively high or
close to 100%, authorities report zero costs for furnishing application and
enabling checks, because no effort from paying agency staff is needed to
incorporate parcel data into the system. Overall, most Member States assess these
as marginal costs. Dispersion in our case study sample is driven mainly by the
response of a single Member State, which indicated these cost items to represent
respectively 20% and 2% of total LPIS cost.
In the following section, we present further insights concerning the two main cost
items “update” and “upgrade”.
LPIS update costs
LPIS update, responsible for 77.5% of costs in running LPIS, consists of the
following main cost items:
Acquisition of imagery;
Regular LPIS update (with new imagery) by means of photo-interpretation;
Ad-hoc updates (based on evidence coming from administrative and OTS checks,
farmer’s request);
Costs of annual update of ancillary layers (not RP);
Costs of implementation of remedial action plan (after LPIS QA).
The following table provides an overview on the costs and the structure of the LPIS
update per reference parcel based on case studies findings. These estimates are
extrapolated from rough estimates provided by the Member States in question, in
order to give an indication on the LPIS update costs.

Analysis of administrative burden arising from the CAP
84
Table 8 Costs of update per reference parcel and structure of the costs in LPIS update
Parcel ty
pe
Esti
mate
d N
r.
of
parcels
in t
he L
PIS
(th
ou
san
ds)
Esti
mate
d N
r.
of
parcels
up
date
d i
n 2
01
7*
(in
th
ou
san
ds)
To
tal LP
IS
costs
wit
hou
t im
ag
ery
acq
uis
itio
n,
k€
Up
date
co
sts
per
RP
Sh
are o
f u
pd
ate
RP
in
th
e c
osts
Sh
are o
f O
TS
in
the c
osts
Sh
are o
f u
pd
ate
of
an
cilla
ry l
ayers
Country 1 PhB 1 389 347 630 1.30 - - -
Country 2** PhB 301 100 376 3.75 43% 3% 40%
Country 3 FB 1 910 955 700 0.73 50% - -
Country 4*** FB 161 92 428 4.65 59% 16% 25%
Country 5 FB 1 101 367 565 1.54 65% 35% -
Country 6 SC 104 26 82 3.14 - - -
Country 7 CadP - - 5 839 63% - 36%
Country 8 CadP 34 696 11 565 5 128 0.44 - - -
Source: Ecorys based on case studies * Calculated on the basis of annual update cycle when exact number is not reported; ** Country 2 reported that Remedial Action Plan after LPIS QA took up to 5% of LPIS related costs; *** Country 4 applies 2-year cycle; PhB= physical block; FB= farmer’s block; SC= single crop; CadP= Cadastral parcel
The acquisition of the imagery is one of the main sources of costs in running
LPIS.
Insights from the case studies show that Member States can be grouped in two
categories:
Member States where aerial ortho-photo imagery is acquired and pre-processed
by national (or regional) mapping authorities. This imagery is normally multi-
purposed and used by different state agencies within Member States. It is
therefore difficult to derive the specific, CAP related cost from the common use;
Member States in which the paying agencies are in charge of the imagery
acquisition, and usually outsource it to a commercial provider. Within these,
three Member States reported imagery acquisition costs and in one case they
considerably exceed other LPIS update costs. For these Member States, costs
per sq.km varied from €10-€40.
Up-to-date ortho-photo imagery is a key element for the quality of LPIS
data. Evidence from the case study Member States, points to an average of 2-
3 years cycles of imagery acquisition and LPIS update. The majority of Member
States in the case study sample (8 from 10 responses) manages to produce
imagery within the 3-year or even shorter cycle – which, according to the CAP
regulation, allows them to reduce the number of some LPIS related checks. Two of
them reported a 2-year cycle. In the northern parts of Sweden, where weather
does not permit often cloud free acquisition, it is done every 6-10 years.

Analysis of administrative burden arising from the CAP
85
Insights from the case studies
One Member State reported regular use of Very High Resolution (VHR) satellite imagery
for LPIS update, whereas partially it is imagery purchased by the Commission for the need
of OTS checks with remote sensing. In addition, other two reported that their PAs
purchased VHR imagery to map reference parcels along an EU external border where it is
difficult to arrange aerial survey flights. Another Member State uses satellite imagery to
map oversea territories.
Regular LPIS update by means of visual photo-interpretation on the screen
based on aerial ortho-photos is reported as the main methodology for the
reference parcel regular update. Additional data requirements in the current
programming period such as separation by agricultural land type and mapping of
EFA led to a considerable increase of time needed for parcel updates.
Insights from the case studies
The majority of countries declared that the amount of reference parcel updates per year is
strongly connected to the imagery acquisition cycle. The goal is to ensure correctness of
parcel information and prevent a situation where LPIS contains parcels, which were
updated more than 4 years ago. However, shortening imagery acquisition time may lead
to an increase in costs – for imagery and for the more frequent update exercise .
The wide range of costs does not allow making reliable conclusions on the
dependency from the reference parcel type. For the physical block type, the only
information needed for interpretation are physical borders from imagery and land
cover. For other parcel types, some additional information are needed
(ownership/cadastral borders). Therefore, interpretation of physical blocks is
theoretically considered as less costly. An overview on cost estimates based on
the case studies is presented below. The exemplary information collected does not
fully support this consideration.
Table 9 Costs for photo-interpretation per RP per type
Parcel type Cost of photo-interpretation
per parcel, €
Country 1 PhB 0.08
Country 2 PhB 0.54
Country 3* FB 1.54
Country 4 SC 0.48
Country 5 FB 0.36
Country 6 FB 1.00
Country 7 CadP 0.44
Source: Ecorys based on case studies
* Country 3 reported that during photo-interpretation of RP all ancillary layers are also updated if
necessary. PhB= physical block; FB= farmer’s block; SC= single crop; CadP= Cadastral parcel
Costs of ad-hoc updates (triggered by evidence coming from administrative and
on-the-spot checks, farmer’s request) are considerably low and reported as a
part of the regular update. Regarding the ad-hoc updates of farmer’s blocks, in
some countries, the feedback from the applicant is required. For instance, in
France, when the ecological focus areas layer is updated, farmers should be notified
and confirm its correctness. A considerable amount of time is spent for

Analysis of administrative burden arising from the CAP
86
updates stemmed from field measurements during on-the-spot checks. The
ratio of field visits to the regular updates may differ from 10% to 35%.
Costs related to the implementation of remedial action plan are incurred only if
needed as an outcome of the LPIS QA99. In the study conducted, only two Member
States reported these costs, which represented approximately 13.5% and 17% of
LPIS update costs.
LPIS upgrade costs
Upgrade costs, being responsible for estimated 18% of LPIS running costs,
are deemed as considerably high – sometimes close to annual LPIS update
cost (see table below). The main workload accumulated in the two first years of the
programming period indicates considerable increase in administrative burden at the
beginning. Some Member States report that it costs additional staff to employ to
keep-up with the reform timetable. Regarding different layers, evidence indicates
that the EFA layer was the most expensive.
The cost of the additional layers should be weighted against the purposes it serves.
For instance, layers added to LPIS to serve requirements of the CAP 2013 reform
may also have an important role in the monitoring and evaluation process and
serve the enforcement and controls of other environmental legislations.
Insights from the case studies
Member States that made the choice to use only elements of agro-environmental
measures and landscape features of previous programming period as EFA, saved on the
new layer digitalization costs. The decision was also supported by the assumption that
those environmental elements are already familiar to the farmers. There were also more
ambitious, environmentally dedicated approaches by some countries trying to include as
many different features as possible. Those countries run in considerable costs, as reported
by one of them: “this problem comes from the initial Member States LPIS choice:
delimiting every non-agricultural surface at the level of isolated trees, as long as they
present a scenic and ecological interest, it needs to be delimited”.
Based on the information collected from the case studies, the following table
provides individual cost estimates for LPIS upgrade for the period 2013-2017, as
compared to the annual LPIS update cost.
Table 10 Cost of annual LPIS update and upgrade from the start of the CAP 2013
reform
Update for year
2017, thousands
€
Upgrade for program
period 2013-2017,
thousands €
Ratio of upgrade in
terms of annual
update
Country 1 700.0 300.0 43%
Country 2 428.1 319.1 75%
Country 3 5839.8 3607.5 62%
Country 4 376.3 508.5 135%
Country 5* 82.3 11.3 14%
Country 6 565.6 290.0 51%
Source: Ecorys based on case studies * Country 5 does not apply EFA.
99 https://marswiki.jrc.ec.europa.eu/wikicap/index.php/LPIS_TG_ETS
Analysis of administrative burden arising from the CAP
87
Costs incurred are related to the development of application and integration with
different IT systems of IACS. They are lower for countries which introduced e-
application with its graphical part long time before the reform. In fact, they needed
to conduct only maintenance updates to conform with new rules and to achieve
integration with other IT systems that were applicable for these countries.
Concerning IT costs for GSAA, Member States did not separately specify the cost
related to integration with LPIS.
Insights from the case studies
One Member State under observation with relatively low number of beneficiaries, spent
€709k for GSAA-related IT-development in the programming period (but first introduction
of the e-application was long ago). Since 2013, the Member State saved €18.5 thousands
on pre-printing maps and €95 thousands on mailing costs due to graduate increase in
number of on-line applications. The total cost of printers with soot and paper costs has
decreased from €26 thousands to €8 thousands per year.
Effectiveness and efficiency of approaches
Effectiveness of update methodologies
All case study Member States indicate that the visual photo-interpretation on the
computer screen using aerial ortho-photo imagery unanimously is the best
methodology for updating reference parcels. This process is supported to different
extents with on-the-spot checks and, in particular, GPS field measurements of
eligible area. The complexity of eligibility criteria and number of small
features/landscape elements, which are eligible at certain circumstances (e.g. size,
width or length), do not permit automatic classification with the existing capabilities
and, human decision is needed. Therefore, VHR satellite imagery cannot support
the level of detail needed to establish eligibility areas precisely.
Additional actions to address the aforementioned issues include the following:
In the systems with farmer’s block and cadastral parcel (Estonia, France,
Sweden, Spain), it is frequent that declarations of the farmer and cadastral
ownership boundaries are also taken into account to associate an applicant to a
particular parcel;
Previous year declaration are consulted, farmers should confirm land use of the
previous year or submit changes;
Information on ineligible inclusion (presence and extent) detected from the
photo by the paying agency (or associated institution) should be
confirmed/objected by the farmer;
Additional information is consulted, different state registries according to nature
and heritage protection legislation.
Overall, aerial ortho-photo imagery seems to be the best and most precise data
source for LPIS update. VHR satellite pictures are used by very small countries , for
border areas and outermost territories.

Analysis of administrative burden arising from the CAP
88
Effectiveness and efficiency in determining reference parcel eligibility
Member States follow three main different approaches for determining reference
parcel eligibility:
Agricultural parcel (Single crop) and farmer’s block use an approach where
100% of the parcel graphical shape is eligible (in other words only eligible land is
digitised). Some ineligible features, which are smaller than digitalisation
threshold, as stored alfa-numerically (pro-rata). Reference parcels are digitised
based on eligibility criteria (this process only includes eligible land, separated by
land use). For farmer’s block it is also important that parcels belong to one farm,
and during the update data from previous application years are consulted;
In case of physical block (sometimes also called topographical-block) borders
of topographical elements such as roads and water courses from imagery form
reference parcel boundaries. This makes digitalisation/updating much faster and
changes are minimal over time. This type of reference parcels is always
supported by layers of land uses and one of small ineligible features, which is
updated more frequently to take account of ineligible land. Eligible areas on
reference parcels are calculated by spatial or alpha-numerical subtraction of
these layers;
Cadastral boundaries are the primary container of eligible land in cadastral
parcels. Such parcels are subdivided by sub-parcels of different land use (for
example recinto in Spain). In addition, small ineligible elements and the eligible
element of EFA are added to eligibility by land use spatially or alpha-numerically.
When number and frequency of the ineligible features are high and manual
digitisation is burdensome, a pro-rata approach is used / operator assess the ratio
of inclusions for wider territory (some specific landscapes such as alvars, wooded
meadows, independent of type of the parcel). Since the pool of ecological focus
areas’ features accommodates a former pro-rata element, it seems that the number
of MSs using pro-rata method has decreased.
Evidence from the case studies shows that agricultural parcel (Single crop) and
farmer’s block are the most effective solutions in terms of administrative
checks, due to tighter delineation of eligible land and their direct link to the
particular beneficiary (lower risk of double declaration). This is the reason why
some Member States underwent evolutional transition from physical to farmer’s
block. However, those two types lose considerably to physical block in terms of
maintenance costs and therefore advantages in efficiency diminish – the physical
block system is more stable, with faster and cheaper update requirements.
In addition, the number of parcels in the system increases when the parcel type is
changed from physical to farmer’s block. The cadastral parcel is less effective in
cross-checks than the farmer’s block as by definition does not match any
boundaries of agricultural land. However, there is no evidence that it is more or less
expensive to maintain compared to e.g. physical block (Member States with
cadastral parcel provided only sum of cost, but failed to give statistics on number of
parcels and rate of update).

Analysis of administrative burden arising from the CAP
89
Therefore, we conclude that the farmer’s block is the most efficient in
administrative checks and therefore most secure to the funds in the current IACS
set-up. Nevertheless, the case studies show that its superiority is not absolute
and since conditions in and choices of Member States differ greatly, all of the
parcel types can perform effectively100.
LPIS QA: quality assurance framework and annual assessment
Total estimated costs for LPIS QA represents a small share of the total IACS cost at
the aggregate (EU) level, namely around 0.2% reflecting about 2% of LPIS running
costs, ranging in absolute terms between €3.5m - €4.2m.
LPIS QA procedures and associated costs
Regarding the LPIS QA procedures, the following cost elements were identified:
Understanding the methodology and coping with methodological changes;
Preparing the work (including imagery);
Carrying out the LPIS QA data test suite (ETS) observations (central part of the
QA);
Conducting rapid field visits, if necessary;
Reporting to the Commission (reports to DG AGRI and to the DG JRC).
We observe the carrying out of the ETS to be the main cost item of LPIS QA.
The range of costs attributed to each step based on the case study Member States
is presented in the table below.
Table 11 Ranges in cost for LPIS QA between the Member States
Range Steps in the LPIS procedure
5-10% Understanding the methodology and coping with methodological changes
5-15% Preparing the work (including imagery)
60-70% Carrying out the LPIS QA data test suite (ETS) observations (central part of the QA)
0-2% Conducting rapid field visits, if necessary
15-25% Reporting to the Commission (reports to DG AGRI and to the DG JRC)
5-15% Preparing Remedial Action Plan*
Source: Ecorys based on case studies
*Not always the case, only when MS fail to pass ETS
The size of sampling lot for LPIS QA is calculated from the total number of
reference parcels falling under its scope101 by employing industry standard and may
vary from 500 up to 1,250102. The time needed for quality assurance may depend
on a number of factors, such as the lot size, the type of reference parcel and the
complexity of the eligible area determination rules. Overall, case study evidence
shows that larger sample sizes (1,250 parcels) are associated in absolute
terms to higher time spent for LPIS QA (table below). Nevertheless, there is
the exception of a Member State reporting relative low time spent, despite the
relatively large sample size. An overall assessment in terms of FTE per parcel does
not lead to clear conclusions. This finding may suggest however, a correlation
100
NOTE: LPIS can be considered effective when it allows Member States to unambiguously locate, identify and measure the maximum
eligible areas (MEA) of the reference parcels declared by beneficiaries, along with reliably checking the related administrative
requirements and information. 101 https://marswiki.jrc.ec.europa.eu/wikicap/index.php/ETS_Scope
102 JRC ( 2011): LPIS quality inspection: EU requirements and methodology

Analysis of administrative burden arising from the CAP
90
between the time needed for LPIS QA and the reference parcel type.
Looking at the reference parcel type in fact, countries adopting agricultural
parcel (Single crop) and farmer’s block reported less time spent for quality
assurance compared to the others, irrespective of the lot size. For these
countries, time spent on LPIS QA ranges between 0.13 to 0.56 FTEs.
In absolute terms, reported costs of LPIS QA ranged from €8 thousands to
€16 thousands. There is one exception amongst the cases reporting very high
cost. A possible explanation for that refers to the fact that the same country
reported that LPIS QA methodology is deemed not to be sufficiently tailored to the
specificity of the national system.
The following table provides an overview of the case study responses.
Table 12 Total time taken by LPIS QA
RP type Sample size –
Nr. of parcels
under the test
Time spent to
LPIS QA in
2017, FTE
Costs of LPIS QA,
thousands €
Country 1 PhB 1,250 1.27 16.2
Country 2 FB 800 0.33 7.8
Country 3 FB 1,250 0.13 8.5
Country 4 SC 500 0.56 12.5
Country 5 CadP 1,250 6.9 278.9
Country 6 CadP 1,250 1.33 16
Source: Ecorys based on case studies
PhB= physical block; FB= farmer’s block; SC= single crop; CadP= Cadastral parcel
Regarding the time spent per reference parcel an indicative value of approximately
half an hour was derived from the case study Member States. However, this
value varies depending on the quality of imagery. Some countries reported that
they consult better resolution imagery, such as aerial photos, when performing data
test observations. In contrast, others indicated that additional information is rarely
consulted.
Main difficulties reported by Member States include the following:
Difficulties in understanding of LPIS methodology, as presented in terms of
complex ISO geo-spatial standards and INSPIRE. On the other hand, others
indicate that applying the standard methodology ensured correctness;
Interpretation of the technical specifications, which are only available in
English, is sometimes very difficult;
Inconvenient format of geospatial data exchange (GML), conversion tools
for which are not provided by many standard desktop software;
Member States that use specialised software for LPIS QA need to amend
functionality to align with changes in methodology, but the majority of
respondents mentioned that the methodology finally is in place and software
used for the LPIS test reporting to the Commission (ETS Reporter) works well;
One of the major concerns expressed in case studies refers to low resolution of
imagery provided by the EC (satellite VHR). Thus, there are variations in the
precision of digitalisation already programmed into the methodology. In order to
reduce discrepancies, Member States use additional information (10-15% of
cases as reported by Estonia);

Analysis of administrative burden arising from the CAP
91
Member States with small parcels/uneven terrain have higher level of
discrepancy when parcels are measured with VHR. A paying agency
response explains: “Thresholds are now in percentage, but tolerance for small
parcels should be also expressed in minimum area of square meter, currently no
waiver for classification correctness QE2c”;
Methodology expects the drawing of reference parcels from scratch.
Random operator(s) errors and on the imagery of lower quality become system
errors – the one commonly mentioned drawback of LPIS QA methodology.
Alternative uses of imagery and optimisation of roles
In some cases, imagery is also used to a limited extent for other purposes.
Seven out of twelve case study Member States indicated that the imagery are not
used for other purposes due to very low image resolution. While five Member States
report that they use it at limited extent for visual interpretation in LPIS update,
especially if territory not covered by the most recent aerial imagery.
In general, the majority of interviewed authorities considers the current roles and
responsibilities of the European Commission and Member States for the QA
framework as rather appropriate. Nevertheless, the suggestions for
improvement coming from the case studies include the following:
More freedom and flexibility in the selection of sites and test examples. Member
States are best placed to assess the representative case constellations;
Some adaptation needed in terms of different models suited to national needs
for LPIS with small parcels and cadastral parcel type.
Future CAP and opportunities to reduce administrative burdens
The LPIS’s main functions are to locate, identify and quantify agricultural land.
Member States put significant financial resources into establishing, running and
updating their land parcel identification systems. Changes in regulations aimed at
simplifying things for farmers sometimes resulted in additional
administration costs to adapt technology, introduce new control procedure and
create/update data sets supporting them. However, there are no obligations in
place to collect information on the amount and structure of costs, which makes it
difficult to monitor their development. As already discussed in Section 2.2.4
regarding the set-up of a framework for assessing LPIS Cost-Effectiveness, a
common framework to identify the specific costs to be collected may prove
beneficial for this purpose.
Moreover, a major difficulty reported by case study Member States relates
to the high level of accuracy required for surfaces and landscape features
included in the LPIS. The level of accuracy is considered excessive. The main
difficulties concern area size, area overlaps, occupancy, and determination of non-
agricultural area. This is particularly problematical in small parcels with a high
share of landscape elements. This aspect is an important cost driver for
administrative checks and requires a lot of time in most Member States when
updating the LPIS.
The implementation choices in CAP made by Member States have a
significant influence on the administrative costs of LPIS. Some Member
States made the choice to use only elements of agro-environmental measures and
landscape features of the previous programming period as ecological focus areas

Analysis of administrative burden arising from the CAP
92
and, therefore, these administrations saved on the new layer digitalization. This
decision was also supported by the assumption that those environmental elements
are already familiar to the farmers. There were also more ambitious,
environmentally dedicated approaches by some countries trying to include as many
different features as possible - those countries run into considerable costs.
A pan-European LPIS could be established throughout Member States aiming to
harmonise the procedures and reduce administrative costs. Most Member States’
authorities did not identify clear overall benefit in such a solution. Nevertheless,
case studies underlined that it is difficult to estimate any impacts without
insights on the share of roles and responsibilities between Member States and
the Commission. The overall stance towards a pan-European LPIS was negative,
some potential benefits, challenges and other considerations are listed in the table
below.
Table 13 Case study authorities’ reflections on a pan-European LPIS
Advantages Challenges Other considerations
More homogeneity across
the EU in the type of LPIS
implementation;
Considerable reduction of
costs for Member States, as:
the EU may take over the
financing of the imagery
acquisition. It may also lead
to staff reduction for paying
agencies;
Reduced audit reviews and
subsequent sanctions;
Potential increased
efficiency in case result-
based/ monitoring approach
in order to harmonise
payment practices, avoid
difference in treatment,
audit/appeals blockages.
Difficulty to address all
different choices of Member
States;
Standardisation in the type
of LPIS reference parcels is
technically difficult or even
impossible exercise, in
particular, due to different
agricultural systems and
landscape patterns;
Various environmental
conditions, historical
aspects, and agricultural
practices would be difficult
to address;
Standardisation in
geospatial terms will have
different impact on Member
States;
Difficult to implement as all
Member States have
basically built up their own
systems;
There would also be
difficulties to reach
consensus between Member
States;
OTSC versus EC LPIS – the
process of checks will be
less effective;
Regarding ortho-photo
image, nowadays Member
States are in charge of
acquisition, each Member
State has a different cycle;
Communication with farmers
will be slow and inflexible;
Possibly slower decision-
making processes.
Only one Member State
confirmed that they were
consulted on the topic;
others said that they have
not been consulted so far;
Member States expressed
concerns that
responsibilities between
Member States and the
Commission are unclear in
this solution: which costs
will be borne by whom and
who will be responsible for
the update of the EC LPIS.
Source: Ecorys based on Case Studies
Analysis of administrative burden arising from the CAP
93
The LPIS QA has led to improvements for LPIS and its updates according to
case study Member States, although with some differences in the intensity of such
improvement. On the one hand, four Member States’ authorities indicate
improvements to a limited extent, as the system in place was deemed already
effective and did not require substantial improvements. On the other hand, six
Member States reported that improvements were observed to high or very high
extent, justifying their opinion by the fact that LPIS QA allowed them to detect and
analyse the type of errors and to focus on them during regular update through the
implementation of remedial action plans.
The number of parcels updated during LPIS QA is rather low and Member States
indicated increasing the aerial imagery resolution as the major factor for quality
improvement. Overall, LPIS quality has improved greatly since 2010, when
LPIS QA became mandatory according to interviewed authorities; this is mainly
due to technological advances in aerial photography such as higher resolution and
more frequent acquisition. LPIS QA only gives insight on type and sources of
possible errors.
A common remark from several Member States was that LPIS QA does not
require any immediate changes, and stable requirements should be
ensured in the future. Arguments supporting the current version of LPIS QA
include the following:
ETS is a useful instrument and an appropriate way to check if the systems
works. It has led to improvements of the system, as the deviations are lower
year by year;
It shows probable weaknesses or distortions, which should be addressed in order
to improve LPIS quality;
It provides feedback on the quality and main types of errors in LPIS, thanks to
quality indicators;
The LPIS QA is an effective and low-cost tool to check and assure data quality.
Nevertheless, along with some specific difficulties reported in the previous section,
Member States also raised points of attention with respect to guaranteeing accurate
impression of LPIS quality, the number of requested indicators and the limited
benefit in case of Member States with already low error rates.
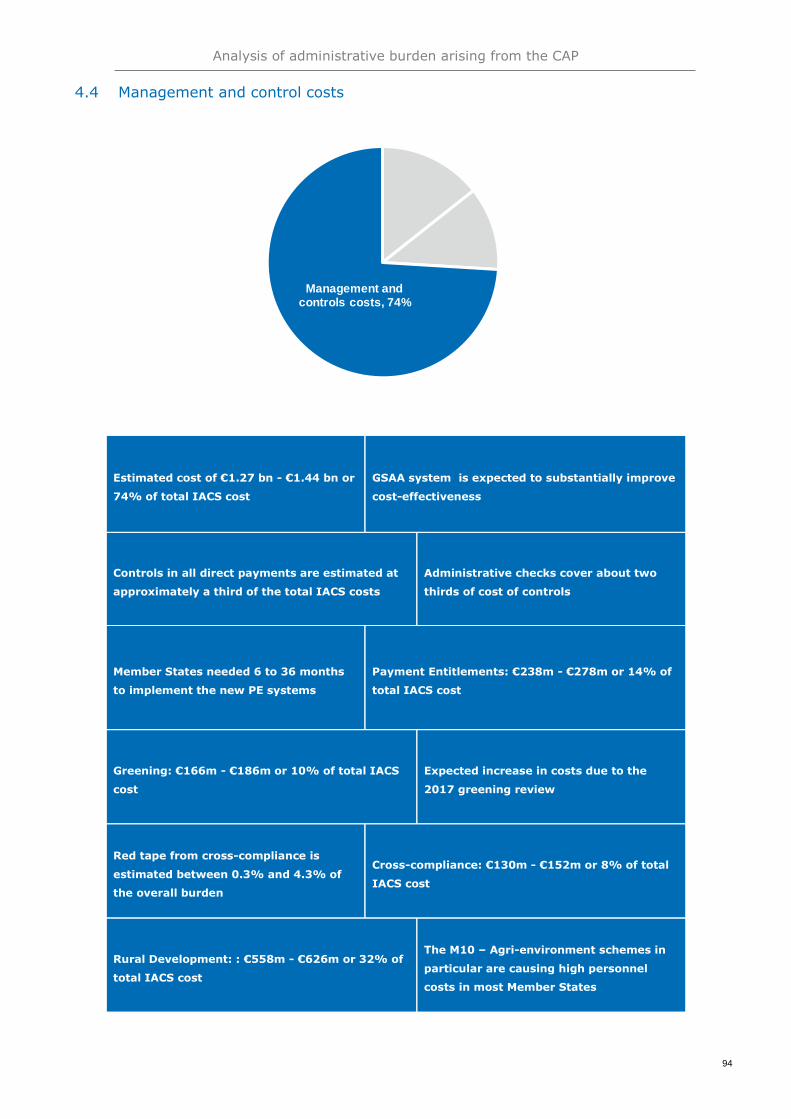
Analysis of administrative burden arising from the CAP
94
4.4 Management and control costs
Estimated cost of €1.27 bn - €1.44 bn or
74% of total IACS cost
GSAA system is expected to substantially improve
cost-effectiveness
Controls in all direct payments are estimated at
approximately a third of the total IACS costs
Administrative checks cover about two
thirds of cost of controls
Member States needed 6 to 36 months
to implement the new PE systems
Payment Entitlements: €238m - €278m or 14% of
total IACS cost
Greening: €166m - €186m or 10% of total IACS
cost
Expected increase in costs due to the
2017 greening review
Red tape from cross-compliance is
estimated between 0.3% and 4.3% of
the overall burden
Cross-compliance: €130m - €152m or 8% of total
IACS cost
Rural Development: : €558m - €626m or 32% of
total IACS cost
The M10 – Agri-environment schemes in
particular are causing high personnel
costs in most Member States
Management and controls costs, 74%

Analysis of administrative burden arising from the CAP
95
Overall, management and control costs represent the greatest component in the
total IACS costs. In fact, estimated costs account for 74% of total IACS cost,
ranging between €1.27bn - €1.44bn. Management and control costs can be
approached from a horizontal angle distinguishing between activities related to
administrative checks vs. on-the-spot checks (OTSC) and a vertical thematic angle
distinguishing between costs for payment entitlements, greening, cross-compliance,
IACS-based RDP measures and other controls of direct payments.
Figure 19 Breakdown of management and control cost from vertical and horizontal
perspective
Managem
ent
and c
ontr
ol costs
Share
of
adm
inis
trative
and O
TS c
hecks
Source: Ecorys
From a horizontal perspective, administrative checks are responsible for about two
thirds of the cost, while OTSC account for one third of them. Vertically, RDP IACS
controls cover about one third of the cost followed by payment entitlements, other
controls (such as young farmers scheme and basic payment scheme), greening and
cross-compliance.
-
200
400
600
800
1.000
1.200
1.400
Paymententitlements
Greening Crosscompliance
other DP relatedactivities
Ruraldevelopment
€ m
illio
n
0% 25% 50% 75% 100%
Administrative controls On-the-spot checks

Analysis of administrative burden arising from the CAP
96
Breakdown categories and potential overlaps
The aforementioned types of costs and IACS components are used to present a breakdown
of IACS costs. In practice, the administrative control framework that Member States put in
place to apply the regulations is often applied holistically and may not break down neatly
into these components and types of costs. This means that these categories are not
necessarily mutually exclusive and some overlaps may occur. For instance:
The specific IACS components under “management and controls” (i.e. payment
entitlements, greening, cross-compliance and rural development measures), also entail
some : “set-up costs” to adjust the system to their reforms and changes as well as
some “running costs” for their management.
This division attempts to estimate the costs of controls under greening and payment
entitlements aside the total cost of controls. Since most of the time controls under
different schemes are combined, this is only an approximate estimate.
In the following sections we first provide a horizontal assessment of cost drivers
and aspects concerning controls, followed by a specific vertical focus on payment
entitlements, greening, cross-compliance and IACS-based rural development
measures.
4.4.1 Horizontal assessment of cost drivers and aspects concerning controls
The horizontal assessment of IACS management and control costs focuses on the
distinction between administrative checks and on-the-spot checks as well as
organisational and operational choices affecting the costs, a possible relation
between them and error rates and the future of the CAP.
Cost of management and controls
Costs of management and control related activities are estimated to represent
74% of the total IACS cost. However, this share varies significantly among
Member States, ranging from almost 50% to more than 90%.103 The costs for
management and control equal about 1.9% of the total aid received. Again, this
share varies a lot between Member States, but also among controls and
management linked to the two different pillars. Costs for the management and
controls range between 0.3% and 9.7%of total aid received for direct payments,
and 0.3% and 12% for the management and controls of pillar I and pillar II (see
Table 14). If reported to the total UAA of the Member States (regional UAA for
Andalusia, Bavaria and Emilia Romagna were considered), the cost of controls
varies in the case study sample between €0.9 per ha up to around €58 per ha of
UAA for all IACS measures.
There is also a variation of cost shares among the pillars, which is mainly explained
by the number of FTEs employed on the performance of controls (higher under
Pillar II), which is obviously linked to the number of applicants and more generally
to the importance of the agricultural sector in each Member State. To a lesser
103 Data on control costs have been collected in the 12 sample Member States. Depending on the case study, data were
either provided by the administrations interviewed or come from the DG AGRI survey. In all cases, the information
corresponds to annual costs (latest data available 2016 or 2017). For Italy, Germany and Spain, which have a
decentralised administrative organisation, data considered are at regional level (Emilia Romagna, Bavaria and
Andalusia). When only data on the number of FTEs employed on control were available, the cost in euros was
estimated using Eurostat data on the yearly average labour costs for different employee’s categories (assuming a
share of the different employee’s categories in the administrations concerned).
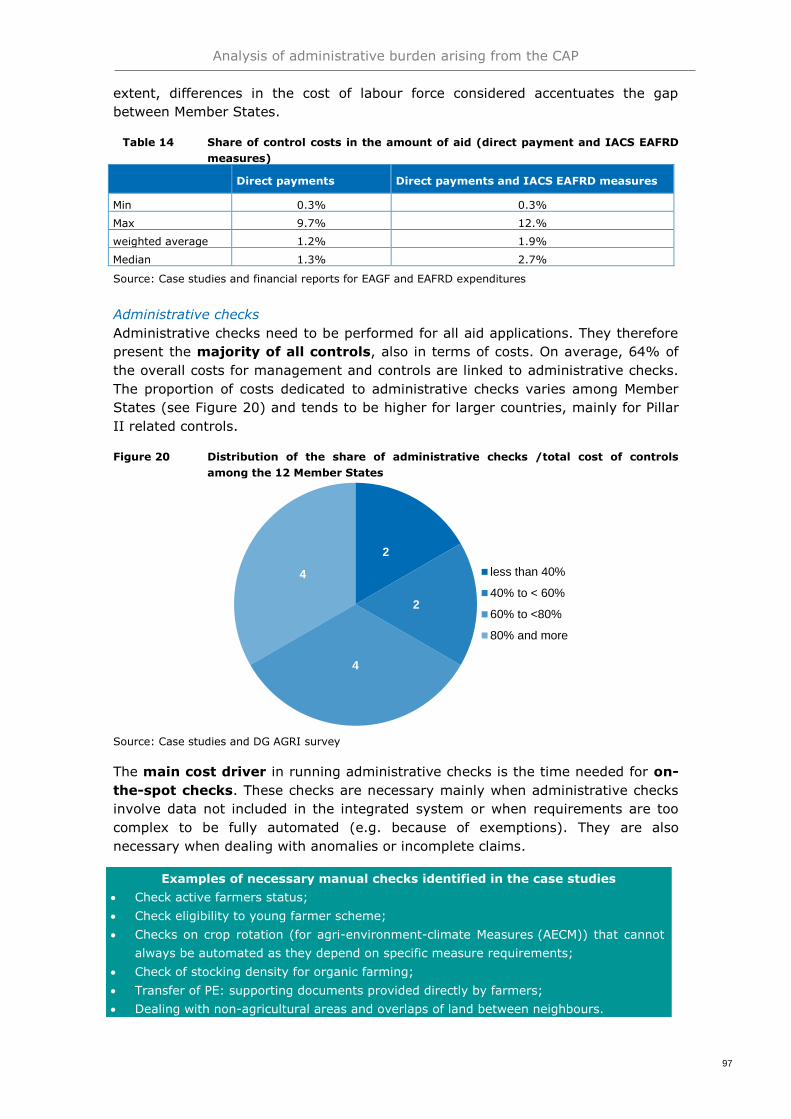
Analysis of administrative burden arising from the CAP
97
extent, differences in the cost of labour force considered accentuates the gap
between Member States.
Table 14 Share of control costs in the amount of aid (direct payment and IACS EAFRD
measures)
Direct payments Direct payments and IACS EAFRD measures
Min 0.3% 0.3%
Max 9.7% 12.%
weighted average 1.2% 1.9%
Median 1.3% 2.7%
Source: Case studies and financial reports for EAGF and EAFRD expenditures
Administrative checks
Administrative checks need to be performed for all aid applications. They therefore
present the majority of all controls, also in terms of costs. On average, 64% of
the overall costs for management and controls are linked to administrative checks.
The proportion of costs dedicated to administrative checks varies among Member
States (see Figure 20) and tends to be higher for larger countries, mainly for Pillar
II related controls.
Figure 20 Distribution of the share of administrative checks /total cost of controls
among the 12 Member States
Source: Case studies and DG AGRI survey
The main cost driver in running administrative checks is the time needed for on-
the-spot checks. These checks are necessary mainly when administrative checks
involve data not included in the integrated system or when requirements are too
complex to be fully automated (e.g. because of exemptions). They are also
necessary when dealing with anomalies or incomplete claims.
2
2
4
4 less than 40%
40% to < 60%
60% to <80%
80% and more
Examples of necessary manual checks identified in the case studies
Check active farmers status;
Check eligibility to young farmer scheme;
Checks on crop rotation (for agri-environment-climate Measures (AECM)) that cannot
always be automated as they depend on specific measure requirements;
Check of stocking density for organic farming;
Transfer of PE: supporting documents provided directly by farmers;
Dealing with non-agricultural areas and overlaps of land between neighbours.

Analysis of administrative burden arising from the CAP
98
The second current key cost driver is investments in IT tools.104 These are
mainly related to the evolution of IACS. In particular the increased integration of
databases, the integration of IACS-rural development measures105, and the initial
configuration of the necessary administrative checks require significant investments
in the IT infrastructure. More performant IT systems should however increase cost-
effectiveness of administrative checks in the long run by reducing the number of
necessary manual checks.
The third key cost driver is the complexity of the intervention logic (and
changes in regulations and requirements can lead to an increase of both IT costs
and manual checks).
Figure 21 Case study Member States average ratings on cost drivers for administrative
checks
Source: Case studies and DG AGRI survey
On-the-spot checks (OTSCs)
On-the-spot checks account for a smaller share of the overall costs for controls
(approx. 36%). The paying agencies of the Member States included in the case
studies identified some of the key cost drivers for OTSC. Costs for IT tools stand
out as a major cost driver. Indeed, the development and upgrade of specific IT
systems to assist and monitor OTSC, as well as the development of remote sensing
are cost intensive. Out of the twelve case study Member States, most have specific
IT systems for OTSC. Inspectors generally make use of tablets, which are also
taken into account in the IT costs. However, as IT costs are usually one-off costs, it
is not clear if Member States discounted the costs for IT tools when asked to
identify the key cost drivers. Rather, the major cost driver can be expected to be
the labour costs, i.e. the time spent on visiting farms to perform the controls. In
addition, Member States identified the determination of the sampling method and
difficulties in accessing the farms as cost drivers. Member States indicating
challenges to determine the sampling method generally experience difficulties in
combining the criteria for different schemes to combine the OTSC for different
104 IT tools are included here in order to reflect the existence of the need of new IT or IT updates arising from controls;
however, IT costs are quantified and assessed under Section 4.2 Set-up. 105 which used to be under different systems in some Member States, e.g. in France

Analysis of administrative burden arising from the CAP
99
measures. The difficulty in accessing farms is primarily related to the specific
geographical context and structure of the farms (number and distance of the
different parcels) in each MS.
Figure 22 Case study Member States’ average ratings on cost drivers for OTSC
Source: Case studies and DG AGRI survey
The extent to which remote sensing is used, as well as the technologies used for
remote sensing also have a major impact on the cost of OTSC. In general, physical
controls are more expensive than remote sensing controls. However, remote
sensing cannot be used for all types of controls. The control of certain greening
requirements for instance implies visual controls. The cost of remote sensing
controls includes imagery acquisition, the cost of which varies depending on the
technology used (mainly satellite or aerial) and the time spent for image
interpretation. The cost of physical controls includes the cost of vehicles, mobile
phone/ tablets, and time spent for travelling and during controls.
Organisational and operational choices affecting costs of controls
Feedback provided by Member States illustrates that organisational choices are
primarily based on the historical organisation of public administrations in each
Member State. This includes the distribution of competencies of the different
geographical levels, the organisation of the services at central level, the
representation of the national or regional authorities in the territories, the pre-
existing skills in the different administrations, financial capacities etc. Even in
Member States that re-organised to some extent their services for the overall
management of IACS to some extent, the organisation of controls remained fairly
stable. This is in particular the case for OTSC, which require specific skills and
training of inspectors. Main changes are related to the increased use of technology:
new IT tools and increased automation of administrative checks, new IT tools to
assist and monitor OTSC, use of remote sensing for OTSC, the use of satellite
imagery and, mainly at experimental stage, use of drones and geotagging. The
available data do not allow to assess the impact of specific organisational choices
on the cost of controls, but transferability from one Member State to the other
seems limited anyway given the above.

Analysis of administrative burden arising from the CAP
100
Outsourcing of controls
There is no evidence that outsourcing reduces cost of controls. Information
also do not imply that it increases the costs. About half of Members States
investigated to outsource only OTSC. Two kinds of practices are identified:
Countries decide to outsource only a small part of their controls. In one
Member State, for example, only 5% of remote sensing controls (1300 to
1400 files) are outsourced. The Member State decided to source these files out
when remote sensing controls were performed for the first time, as the agency
was lacking the competency to perform the checks;
Countries decide to outsource the largest part of their controls. For
instance, one Member State in the case studies outsources the majority of its
OTSC controls. The outsourcing is related to direct payments system in less
favoured areas (LFAs), due to their number and less complicated character.
The general tendency is to outsource remote controls, which require sophisticated
IT tools. Some paying agencies do not have the technology or skills to implement
remote sensing. Contrary to this, on site visits are usually performed by national
authorities and not outsourced. In general, small Member States do not outsource
controls because the cost-effectiveness is not clearly given.
Cost drivers of specific requirements
Environmental measures, voluntary coupled schemes or veterinary controls for
animals are often listed as very specific and thus could potentially cause additional
costs of controls. The analysis shows that:
there is no evidence that controls of environmental measures are more cost-
effective for annual or multiannual commitments;
veterinary controls for animals tend to be conducted separately from other
animal-related controls.
The available case studies do however not provide clear evidence that the
combination of controls would lead to a reduction of burden. Similarly, the cost data
available do not allow a comparison between the two options to combine controls or
to perform them separately.
Insights from the Case Studies
Members States that do not outsource tasks indicated the following main reasons:
Cost: outsourcing represents additional cost for the paying agency. According to
them, it is more expensive to outsource than to develop tools and set them up by
themselves. It allows greater flexibility and less cost;
Additional burden: outsourcing implies additional controls of the external body as
the paying agency has to maintain the link to the provider at all times, define a
specific contract, control their technology, etc.
Legitimacy: in some Member States, farmers would be more reluctant to be
controlled by private organisations than by public authorities.
Analysis of administrative burden arising from the CAP
101
Relationship between control costs and error rates
Based on the evidence collected, there is no clear correlation between the
costs of controls and the error rate. A correlation test was made to compare the
cost of controls and the administrative, OTSC and residual error rates. The
correlation between the cost of control and the administrative error rates on one
hand and the cost of control and the OTSC error rate on the other hand are both
negative. They thus point into the “right” direction. However, none of the
Insights from the case studies
Environmental measures
Several Member States reported that there were no significant difference, because
commitments are annual or multiannual. In this case, the control management system is
the same for annual and multiannual measures and the control effort as regards OTSC is
also equivalent (5% of claimed amount). Nevertheless, some highlighted that the
processing and assessment of control results can involve more administrative work for a
multiannual requirement due to the adjustment on several years (retroactivity), whereas
on the other side, a stronger stability for farms benefitting of multiannual requirements is
expected.
Voluntary coupled schemes
The majority of Member States underlines the suitability of IACS rules with VCS measures.
The rules are similar to the original ones adopted when the IACS-system was developed
and coherence between national register and the OTSC livestock is easily checked
(Identification control is similar to eligibility). IACS applications can be used all along the
control process.
Veterinary controls for animals
In practice, eligibility and identification controls are combined (as much as possible) in
several countries where the paying agency operates for identification control by means of
delegation. Veterinary controls are, however, more often separated (1% sampling, less
than the other controls) and performed by specific sanitary agencies. Only Spain resorts to
private veterinarians in some cases.
Two paying agencies ensure complete combined controls, including veterinary controls.
The integration of veterinary skills into the paying agencies is the most suitable option for
combining animal related controls. Delegating eligibility and VCS controls to specific
Veterinary authorities seems to rise some issues about prerogatives. These actors are not
always keen to endorse such kind of control activities. Inspectorates provide veterinary
assistance that the farmer may need.
Other identified limits are:
Farm sample overlapping and differences in thresholds. Another specific case refers
to mixed herds where the control rates are not reached at the same time for a single
farm;
Timing and availability of both farmers and controllers;
Required trainings for paying agency inspectors to carry out veterinary checks (in
addition to competences on Phytosanitary, remote sensing).

Analysis of administrative burden arising from the CAP
102
correlation values are significant.106 In other words, a higher spending on controls
does not necessarily ensure that the error rate is reduced. Still, this does not imply
that the costs of controls have no impact on error rates, but rather that it is not a
determinant factor. Implementation choices and the total amount of aid
received (in terms of economies of scale) may have a greater impact.
No statistical test applied could identify a significant relationship between
control rates and lower error rates through years107. The only relationship
that could be observed (but not statistically tested as data are aggregated), is the
relationship between the two rates at national level. However, results differ
depending on the Member State, which underlines that other factors
(implementation choices, geographical or physical constraints, learning curve etc.)
are more determinant than the control rate.
Future CAP and opportunities to reduce administrative burdens
Although Member States generally agree that mandatory controls are necessary to
enforce the CAP regulation and create a culture of compliance (see figure below),
they also report difficulties in the understanding of the EU legal framework
on controls. Some Member States consider the regulation too complex and difficult
to implement.
Figure 23 Extent to which the different mandatory controls are considered necessary to
enforce the CAP regulation and create a culture of compliance
Source: Case studies
The high number of regulatory changes for a new programming period reinforces
difficulties to interpret the EU legal framework. Once paying agencies adjusted to
the new rules and develop routine, they have to implement changes again. As a
consequence, maintaining consistency in the interpretation of the regulation is
challenging. The difficulty in understanding the EU regulation on controls increases
with the complexity of the schemes. In addition, Member States indicated that they
consider the complexity of the schemes and thus controls to have increased
106 The correlation value is between -1 and 1. When the correlation is negative, it indicates that error rates decrease
when control costs increase. The closer it is to 0, the less significant is the correlation. 107 Different statistical tests were also carried out to determine if there was a link or not between control rates and lower
error rates through years. Several statistical methods were used (correlation and regression tests), with various time
lags, to identify a relationship between the control rate and the error rate.

Analysis of administrative burden arising from the CAP
103
compared to the previous programming period. Some of the most problematic
issues identified by Member States are:
Greening (with the definition of EFAs and the introduction of specific controls);
AECs (which imply numerous tender specifications and requirements to be
controlled);
The status as “active farmer”; and
The management of payment entitlement transfers (very complex,
administrative procedure as BPS are linked to the farm and not the agricultural
surface).
Nevertheless, options to adapt the regulation at national level can increase
the complexity even further. This also makes it more challenging to perform
controls (greening in particular as regards the definition of EFAs). Difficulties to
interpret and apply the EU regulation also impacts IT systems, as they have to be
adapted on a continuous basis. In one case, it was pointed out that the small
number of skilled people able to understand and translate the regulations and the
turnover in the administration are also important limitations.
Depending on the specific requirements, some schemes are easier to control than
others. Some require OTSC, such as greening and AECM. Other schemes require
controls to take place at specific dates or within short periods of time (e.g. date of
mowing, implantation of catch crops, diversification). In addition, animal-related
controls under the two pillars cannot be combined because of different
requirements in terms of the reference year. This makes the scheduling of controls
more challenging. In addition, control samples have to be established considering
these constraints. Moreover, in large Member States and differences in climatic
conditions, it is difficult to apply controls homogenously throughout the country.
Finally, some Member States highlighted that the zero-tolerance obligation, i.e. that
also very small errors are not negligible, can be very costly, while the benefits of
solving small issues are often negligible.
Adjustments of the control system
The study should also identify – if possible – alternative approaches to the controls.
However, among the Member States considered, there is no clear evidence for an
alternative yet performing way to manage the control of direct payments and area-
based support measures. While some indicate that there are alternatives worth
considering, others do not see alternatives. However, there is room for
improvements in terms of enhancing methods, simplifying procedures, the training
of staff, etc.
Most of Member States which fully implemented IACS tools and processes, consider
only changes at the level of the general framework helpful to further improve the
performance and efficiency of the system. Indeed, the main cost drivers identified
in the above analysis (the complexity of the schemes and the costs of developing IT
tools) are not specific to the issue of controls but influence the overall system of the
CAP. Some possible improvements have been identified that could contribute to
reduce the cost of controls, without undermining the various objectives of the CAP.
These range from the enhanced use of GIS and remote sensing to greater flexibility
and the avoidance of control duplication.

Analysis of administrative burden arising from the CAP
104
In addition, suggestions were made on possible legal changes to improve combined
controls between VCS measure controls, cross-compliance and veterinary controls.
Most recommendations are linked to the necessity to adopt a more risk-based
approach and limit OTSC by using animal register, and are potentially already
possible to implement.
The previous discussion illustrates that there is room to improve the system in
future. In particular, a greater and more integrated use of IT tools could enhance
the efficiency of controls and reduce costs for Member States. Some of the
improvements and changes could already be implemented with the current tools.
The analysis further highlights that policymakers need to be reflective of the
operational consequences when developing the requirements of schemes and the
overall CAP structure. Changes in the legal context need time to be implemented,
and it takes even longer to adjust the control system to the extent that it works
efficiently again.
Proposed changes to controls expressed in case studies
The following suggested changes were proposed by interviewees in the case studies:
A stronger focus on more structural commitments in order to reduce conditions and
criteria, especially concerning environmental measures (Area of ecological interest,
etc.) and possibly merging of conditions, greening, AEC objectives and criteria;
Clean-up of conditions (one in/ one out): new technologies that simplify controls could
increase the cost effectiveness of controls, as long as old, more bureaucratic measures
and conditions are lifted;
Better use of Geographic Information System (GIS) and remote sensing: Some
measures such as direct payment could be controlled using RS only. Such an approach
could be widened to M13, M15 and progressively to other measures due to technical
progress and the possibility to carry out monitoring (i.e. through the acquisition of
imagery over a time series). Generally, conditions should always be defined taking into
account what technology can provide;
More flexible calendar: strict deadlines (e.g. 15th of May) can significantly increase the
burden to implement and perform controls without contributing to the reliability of the
system;
Sampling methods and risk-based strategy: the 100% control conditions could be
relaxed to reduce costs (which would of course also reduce the completeness of
controls). Also the OTSC sampling size could be reduced focusing more on risk-based
and cost-benefit principles.
Proposed legal improvements to controls expressed in case studies
The following improvements to the existing system were proposed by interviewees in the
case studies:
Complete interfacing and mutual update between livestock system and IACS;
Regional databases could be more detailed: improved traceability of sheep and goat
herds;
Comprehensive guidance for "animal" controls (as is available for crop areas);
Decrease OTSC: checking data bases will be more efficient on time and money;
Better coordination between authorities and veterinary;
Veterinary checks should be considered in identical sample;
Avoiding double checks such as ear-marking made by farmers and administrations.
Analysis of administrative burden arising from the CAP
105
Previous results-based methods
Very few of the Member States in the case studies had considered the use
of results-based measures. A region of a Member States is implementing a
scheme for species-rich grassland and a pilot study to monitor specific zones for
greenhouse gas emissions and land coverage thresholds. Early indications are that
within the existing IACS the determination of the precise area of land and features
is less relevant. However, the LPIS is still seen as a key tool to access new and
different layers of spatial data to determine the success of measures over time.
Similarly, administrative checks need to be supplemented by cross checks to
external data sources stored non-spatially. Costs are not easily quantified as the
measure covers only 4 500 ha within a total agricultural area of over one million ha
but early indications are that the measure requires a noticeably higher training
requirement and a significantly higher control effort.
Another has introduced monitoring indicators and is developing a system, which
processes these indicators. Currently data is being extracted and analysed manually
from a number of distributed databases. The new system will allow the data to be
consolidated and processed automatically. It is anticipated that this will be more
costly overall but will reduce the burden of data gathering for administrators and
farmers and improve its accuracy. In 2010, a Member State introduced result-
based measures in its nature development schemes. However, this was abandoned
as it was considered that there were too many factors influencing the result over
which the farmer had no influence. The authorities went back to measures based on
inputs. In addition, they are currently running a pilot on species rich grassland
where the use of aerial photography as a validation tool is being trialled but there is
currently little information to confirm whether this will be a success. Feedback from
those who are trialling measures or were considering them was that ambitious
result-based measures are difficult to implement as they require solid indicators
(accuracy, reliability, precision, timeliness etc.), which can be difficult to source in
areas such as water pollution, carbon storage, etc. Most need data from external
sources that would need to be modelled. There would be less ability to place
reliance on the LPIS for validation and there may be a need to consider alternative
models based on the multi-annual nature of the measure rather than validating on
an annual basis, as is the current norm.
IACS would need to be expanded to allow the access and cross checking of
secondary databases, which may lead to increased complexity and costs.
This data may be managed and controlled by other state bodies or trusted third
parties. Dependent upon the level and frequency that this data may need to be
crosschecked this is likely to require a more complex and costly IT. There may be
some cost reductions within regional development schemes but overall Member
States will need broadly the same IACS systems for direct payments and those
elements of a results-based scheme that are best managed via IACS plus any new
elements required to adequately control results-based schemes. New solutions
would need to be developed to adapt to new measures from the old and new
interfaces would need to be developed to relevant external sources of independent
validation, which may or may not exist in a format required to perform automated
checks. If this is the case, manual administrative checks and/or physical validation
in the field would be required to confirm results. The prospect of using new

Analysis of administrative burden arising from the CAP
106
technologies could reduce these costs. A Member State is piloting the daily
monitoring of land parcels combined with the use of geotagging. The project aims
to evaluate and test the possibility to adopt more ambitious monitoring approaches.
Some practices appear to be relevant for satellite monitoring, such as crop
rotation/diversification, catch crops, permanent grassland or late mowing. Other
practices (use of fertilisers or phytosanitary) appear more difficult to monitor. Some
tests are being carried out in order to estimate greenhouse gas emissions scores
instead of measuring each type of practice.
4.4.2 Payment entitlements
Payment entitlements cover the operations required to initiate the basic payment
scheme (e.g. initial allocation of entitlements, establishing values), run all recurring
operations related with payment entitlements (e.g. keeping track of updates,
processing applications) and conduct the controls on the basic payment scheme
applications.
Costs of management and controls linked to payment entitlements
Overall, the estimated administrative costs for payment entitlements range
between €238m - €278m, accounting for 14% of total IACS at the aggregate (EU)
level, not including the establishment costs.
The analysis of administrative costs related to payment entitlements faces the
following general constraints:
As specified in the above Chapter 3, in four Member States (BG, EE, LT, PL) from
our case studies, there is no payment entitlements identification and registration
system (no BPS), thus they are not included in the analysis under this section;
The real cost is more related to the design procedure implicit in the regulatory
effort, rather than in specific items of expenditure.
These elements hampered authorities from the case study Member States to
provide the detailed administrative cost structure that would allow detailed
estimates on the administrative burden. Furthermore, no significant relationship
between the timeframe, modalities and administrative burdens of implementing the
CAP, declared by Member States, and the grouping of Member States into five
clusters, according to the choices of CAP implementation, was found. Therefore, it
is not possible to make any comparisons between Member States
belonging to different clusters and thus limits the possibility to identify
concrete examples of gold-plating.108
Administrative issues differ among Member States, but on the basis of the
information provided by them, no difference can be referred to the different
implementation of BPS.
From the available data, an extrapolation based on the number of beneficiaries
provides an estimate that the initial set-up costs range from €250,000 to €500,000
per Member State. The average unit cost for payment entitlements (per
beneficiary) is estimated at approx. €7.8 (including all types of costs). The number
of entities or authorities involved in the payment entitlements identification and
108 European Commission (2016), Mapping and Analysis of the implementation of the CAP.

Analysis of administrative burden arising from the CAP
107
registration system varies depending on the choices in terms of internal
convergence and regionalisation models.
Insights from Case Studies
The specific reasons that motivated the design of the payment entitlements identification
and registration system come for all Member States from historical causes and, for some
of them, also from the division of competences across different regional levels. For
example in one Member State, four different types of entities are involved in the payment
entitlements identification and registration system.
The timeframe needed to implement the new payment entitlements system ranged
from 6 to 36 months, with an average of 18 months (standard deviation of 11). In
some cases, these delays are mostly due to the parcel register evolution and the
2015 action plan. Furthermore, because of the convergence approach, where
applied, the historical path of each farmer rights has to be integrated in the system
and this individual treatment was complex to operationalise in the PE database.
The nature of the process for a new establishment of entitlements in 2015 led in
some cases to delays in payments to farmers compared to payment profiles in
previous years. The main changes in the management of systems have been the
nature of the first implementation of new entitlements, the need to ensure that the
entitlements were based on eligible hectares declared in 2015, the management of
a new national reserve and the need to accurately calculate entitlement values.
Moreover, the subsequent completion of several investigations by the paying
agencies has led to substantial recalculation processes.
Member States encountered several key difficulties in setting up the new payment
entitlements system. These are mainly related to the interpretation of the rules or
the complexity of choices made by the Member States. In more detail, these
difficulties are:
Obstacles in the assessment and technical definition of eligibility (“active
farmer”);
Challenging political negotiation with regions;
Problems in tracing the history of each farmer (pre-2015); and
Consolidating these data for the new calculation tool.
In most of the Member States covered by the case studies, there were no particular
difficulties in establishing the IT module for payment entitlements registration.
Instead, existing IT tools were simply adapted. Three countries report some specific
issues, respectively in (1) integrating needs and functionalities in IT tools after the
adoption of the regionalisation model that requires negotiation, in (2) managing
special cases and situations that do not allow a linear process of analysis and
development of computer algorithms and in (3) dealing with the heterogeneity and
difficult communication between different databases.
For Member States applying the basic payments scheme, payment entitlement
management costs include the allocation of payment entitlements to new entrants
in the system (new farmers). During this allocation, specific rules and conditions
apply. For instance, newly installed young farmers are given priority in the payment
entitlements allocation.
Analysis of administrative burden arising from the CAP
108
The main costs to establish eligibility of young farmers and new entrants are
incurred for the administrative control of the information provided by farmers. In IT
terms, this differentiation plays a minor role in the preparation of the calculation
software. Costs are also referred to the complex verification of the requirements for
eligibility.
The main entities typically involved in assessing the eligibility of farmers for the
first allocation of payment entitlements are:
Farmers: they must testify their status as active farmers. They have to prove
that their principal business does not consist of activities excluded by the
European regulation;
The Ministry of Agriculture: it outlines the necessary national legislation and
administers the PE. The administering includes the establishment of the farmers
eligibility, the definition of the national reserve and the attribution of payment
entitlements through a BPS transfer or through the reserve (in some Member
States it delegates the administration of payment entitlements to the paying
agency);
The administrative control units: they check the applications and run on site
controls;
The paying agencies: they establish eligibility of land for the first allocation of
payment entitlements, the value of payment entitlements (including its
progression for internal convergence) and the national reserve (if delegated by
the Ministry).
Some Member States utilise digital information from other institutions, such as
digital cadastre, area data from regional administrations, economics and tax data of
farmers from Ministry of Finance and Independent Public Revenue Authority.
Regarding the establishment of the value of entitlements for first allocation, the
main difficulties have been the ex-ante determination of the eligible area and the
transition from the previous system to the new one. The latter has been particularly
complex for some countries adopting regionalisation. In particular, some countries
refer to the fact that in the new system calculations and analyses are longer and
harder to convert in IT. One Member State which kept the existing entitlements
reported less problems with the initial allocation.
Among the main difficulties in establishing the national or regional reserve, some
processes, e.g. the control processes, have been difficult to digitalise. These include
the transfer of payment entitlements, clause signatures, and the notarial deed
verification. The rules for replenishing the national or regional reserve are complex.
Other difficulties are related to capturing and validating additional land during the
request period, to estimating the needed amount of national or regional reserve
and to performing manual work. Only two Member States identify some cost drivers
for establishing the national or regional reserve in the payment entitlements
system. These are the complexity of regulations for the allocation of PEs from the
national or regional reserve and the complexity of regulations and controls for new
entrants.
Analysis of administrative burden arising from the CAP
109
Future CAP and opportunities to reduce administrative burdens
It is a widely shared view amongst case study interviewees that the administrative
procedures linked to PEs need to be simplified. The recommendations range from a
complete abolishment of the PE system to more specific simplifications. Others
suggestions, relating to the establishment and management of the national or
regional reserve in the PE identification and the registration system are listed below
(national or regional level solutions could also be applied to address some of these
issues):
The withdrawal of mandatory rules for the allocation of payment entitlements
from the reserve and the related amendment of Regulation (EU) No 1307/2013
Leaving more autonomy at national level in the management of the national or
regional reserve;
The clarification of the legal status of young and new farmers and the
improvement in the communication about the reserve to decrease farmers’
requests and complaints, where these issues occur;
The use of the same process and criteria in the first and second pillars as regard
young farmers.
There is a call to simplify the management of the transfer of PEs after the first
allocation. Member States proposed several changes. Those which were mentioned
the most are (1) avoiding controls on the criterion of active farmer, (2)
consolidating all applications in one single application per beneficiary or holding,
and (3) harmonising entitlement transfer windows at the EU level.
4.4.3 Greening
Greening covers the operations related to dealing with greening claims, such as
calculating and transferring the payments due to beneficiaries and conducting
administrative and on-the-spot checks for greening applications.
Costs of management and controls linked to greening
Our study estimates that costs for greening range between €166m - €186m,
accounting for 10% of total IACS cost at the aggregate (EU) level (excluding
set-up costs) and being one of the major cost items of managing and control
of direct payments.
Bringing such estimates into context depends also on the definition of what exact
activities are included in the administration of a task and how data is being
collected109. A previous study by Alliance Environment and the Thünen Institute
(2017) for example estimated substantially lower administrative costs for Member
States linked to greening ranging from €27 to €76 million for the EU28.110 This
estimate includes different items also linked to set-up costs (assessed to be 10-
20% of the total)111112. The same study concludes that management and control
109 First of all, the capacity to gain insight on the costs of greening may progress over time, along with experience with
the actual implementation. The second factor is the ‘human factor’. For instance, there is little to no quantitative
data available on the costs of greening for the administration. Therefore, the estimates are largely based on the
subjective assumptions of the respondents. 110 Alliance Environment and the Thünen Institute (2017). Evaluation of the payment for agricultural practices beneficial
for the climate and environment. November 2017. 111 NOTES: the terminology used in this study slightly differs from the one used in the Thünen study; In the Thünen
study, implementation costs entail preparatory costs, set-up costs, information costs and other costs; in our study,
items related to implementation are referred to as set-up costs. 112 NOTE: the estimates need to be treated however with care, given that they were based on limited data available.

Analysis of administrative burden arising from the CAP
110
costs of the greening measures for public administrations correlate
strongly with the regulated area. 113 This is not a surprising result, as these
costs (e.g. costs for handling applications and performing controls) are strongly
linked to the number of farmers situated in the controlled area. However, the share
of fixed costs involved in running the system shows that running costs per ha are
significantly lower in larger Member States. In a small Member State within the
case studies, for instance, running costs amount to €16 per ha, whereas
management and control costs account for only €0.12 to €0.60 per ha in most of
the larger EU Member States.114 Moreover, according to the same study, there
may be differences in costs due to varying labour costs across Member
States. In particular, handling applications and conducting on-the-spot-checks
require substantial labour costs.
The 2017 study from Alliance Environment and the Thünen Institute identifies a
number of additional factors complicating the estimation of cost:
a possible under-estimation of the additional costs of the greening measure, as
Member States may experience difficulties to identify cost increases attributed to
greening;
the difficulty to compare results between Member States due to different
“business as usual” baselines;
difficulties related to the possible reallocation of staff due to the establishment of
greening measures.
Insights from Member States
A study in the Netherlands (2017) 115 estimated the administrative burden of the greening
measures for Dutch farmers for 2015. The administrative costs for the PA could not be
estimated, at least not at the detailed level of greening measures.
For Poland, the Polish Supreme Chamber of Control estimated the cost of IT system
modification linked to the LPIS requirement for greening at €2.26 million. Those costs
include the need to construct the EFA layers as well as an additional layer for the
permanent grassland requirement. The costs for the on-the-spot-controls of greening were
estimated at €1.92 million. If taken as a share of the total amount of direct payments
received by Poland (for 2016 PLN21.3 billion, which is roughly €5.08 billion), the total
costs for system modification amount to 0.05% of the direct payments, the costs for on-
the-spot-controls of greening to 0.04%.
Sources of administrative costs
The main administrative costs related to greening emerging from the case studies
are:
Adaptation of the administrative system and tools, for instance the
inclusion of the EFA-layer and the preparation of the greening sample for
control;116
113 Alliance Environment and the Thünen Institute (2017). Evaluation of the payment for agricultural practices beneficial
for the climate and environment. November 2017. 114 Alliance Environment and the Thünen Institute (2017). Evaluation of the payment for agricultural practices beneficial
for the climate and environment. November 2017. 115 Meulen, H.A.B. van der, A.B. Smit en J.H. Jager, 2017. Effecten nieuw GLB op inkomens, kosten en administratieve
lasten; Gevolgen van aanpassing directe betalingen en invoering vergroeningseisen. (Effects of the new CAP on
incomes, costs and administrative burden; Consequences of changes in the direct paments and introduction of the
Greening Regulation; in Dutch, with English summary). Wageningen, Wageningen Economic Research, Report 2017-
080

Analysis of administrative burden arising from the CAP
111
Activities to inform farmers on the changes in the payment system, the
meaning of greening measures, the conditions for receiving both basic and
greening payments and the changes in the administrative tasks to perform;
Communication with and assistance to farmers with questions about the
greening measures, before, during and after fulfilling their administrative tasks;
Checks whether farmers comply with the greening conditions, both from an
administrative point of view and, for a sample of farms, through control on-the-
spot including communication with farmers and, in some cases, rejecting
requests for greening payments, in a limited number leading to appeal or legal
challenge.
In 2015, the Member States implemented greening requirements for the first time.
That being so, costs for setting up (see also section 4.2) and implementing
greening were perceived as particularly high in that year by the paying agencies.
This perception may result from the fact that both competent authorities and
farmers had to become acquainted with the new Regulation and the
additional administrative tasks to be performed including rebuilding of IACS as
well as measuring and controlling additional indicators like number of crops and
EFA-areas per farm.
Even though hard to be isolated from other control costs for direct payments, 5 out
of 12 case studies indicated that greening results in additional on-the-spot-
control costs. This is mainly due to the necessity to carry out inspections at
different times of the year (for seasonality reasons) and requirements that impose
visual control in case one cannot rely on remote sensing. Especially, on-the-spot
controls for EFA are considered a major burden by a majority of the Member
States. For instance, area verification and adjustments are difficult to check even
when using GSAA.
Given its complexity and thematic link to ambitious policy objectives in the area of
environmental protection, greening is also a core area potentially affected by
“positive” gold-plating, meaning that additional burden is put on administrations
(and farmers) to achieve specific policy objectives. In one case study for example,
political actors insisted on more greening activities.
Costs linked to specific greening areas
In their contributions to the broader Public Consultation from 2015117, the various
stakeholders consistently point to the significant administrative burden linked
particularly to one of the greening areas, namely the Ecological Focus
Areas:
For Member State administrations this seems to be mainly linked to the
increased cost of complying with control requirements and mapping EFA
elements in a dedicated LPIS layer (see also section 4.3.2);
For farmers this appears to be linked to the correct declaration of EFA (length of
declaration, location and dimension accuracy) and increased farm inspections
(further elaborated in section 4.5).
116
NOTE: these costs are estimated as part of setup and running costs. 117 SWD(2016) 218 final: Review of greening after one year

Analysis of administrative burden arising from the CAP
112
From an administrative perspective, especially the different options for
landscape features (i.e. hedges, wooded strips, etc.) were indicated to be
demanding118.
The number of elements included in the EFA layer varies across Member
States (table below). Based on the results from the case studies, few countries
have included three EFA elements or less, while most Member States included at
least five elements. Land lying fallow, landscape features and nitrogen fixing crops
are quite commonly included in the EFA layer, followed by buffer strips, catch
crops/green cover and short rotation coppice.
Table 15 EFA elements per Member State
Country/regi
on
EFA elements
Lan
d lyin
g
fall
ow
Terraces
Lan
dscap
e
featu
res
Bu
ffer s
trip
s
Ag
ro
-fo
restr
y
Fo
rest
ed
ges
Sh
ort
rota
tion
co
pp
ice
Aff
oreste
d
areas
Catc
h c
rop
s
Nit
rog
en
fix
ing
cro
ps
To
tal
Germany
(Bavaria) x x x x x x x 7
Spain
(Andalusia) x x x 3
France
(Centre) x x x x x x x x x 9
Netherlands x x x x x 5
Poland x x x x x x x x x 9
Greece x x x x 4
Italy (Emilia
Romagna) x x x x x x x x x 9
Sweden x x x x x 5
Malta* 0
Bulgaria x x 2
Lithuania x x x x x 5
Estonia x 1
Total per EFA
element 8 1 9 7 5 4 6 4 6 9
* There is no EFA control layer in Malta as only 14 farmers are subject to greening provisions. The two
EFA-elements are recorded in a graphical crop layer.
In addition, the level of digitisation differs across Member States whereas case
studies show a tendency towards digitisation. Out of the assessed sample:
Four Member States have digitised EFA elements to a very high extent;
Five Member States have digitised EFA elements to a high extent;
In two Member States parcel-types of EFA (land lying fallow, catch crops,
nitrogen fixing crops, buffer strips, field margins, strips along forest edge) are
not at all digitised in the layer; and
In one Member State, the parcel-types of EFA are digitised to a limited extent.
118 Furthermore, the results of the OPC indicated certain aspects of the Crop Diversification (e.g. changing it to crop
rotation rather than diversification) and Permanent Grassland (e.g. the 5 year rule, the definition) to be very
complex.

Analysis of administrative burden arising from the CAP
113
Elements digitised in the EFA layer are usually (11 out of 12 cases) automatically
shown in the system to the beneficiaries, and beneficiaries can add EFAs
themselves, or with the help of an advisor (in a specific example this needs to be a
technician).
Besides, Member States may use alternative means to fulfil the EFA obligations via
equivalent practices as set out in Annex IX of the direct payments regulation. Three
Member States indicated to have introduced equivalent practices to EFA. However,
no further details were provided on the administrative burden arising from
equivalent practices.
As for the other greening areas, namely crop diversification and permanent
grassland, case studies did not provide sufficient data on costs.
Costs specifically linked to farmer support
In all Member States present in the sample, farmers can receive guidance to
make the best choices as regards the implementation of EFAs. This guidance is
provided by:
the farm advisory services (FAS);
civil servants who work for the Ministry of Agriculture (or at one of the local
offices); or
(paid) independent private advisory services (a number of which in the
Netherlands is recognised as part of the FAS).119
Results from the case studies furthermore show that the vast majority of the paying
agencies in the sample also assists farmers to fill out the application forms and
to pre-check the forms of farmers before they are submitted to the authorities.
Future CAP and opportunities to reduce administrative burdens
A decrease as regards the level of administrative burden was expected by Member
States represented in the case studies from 2016 onwards. The expected decrease
by the authorities was based on a normal learning effect throughout the
programming period. This effect might however be reduced due to some
adaptations to the regulations and the administrative procedures and tools based
on the experiences from 2015. In fact, case studies point to an expected increase
in costs due to the 2017 greening review, due to expected increased control
efforts (with benefits hardly being affected according to most respondents). In
addition, greening requirements might overlap with other components of the CAP
as well as other policies.
Impact of the greening review
Evidence collected in the case studies provides a mixed picture as regards the
perception on the extent to which the Greening review is expected to
impact administrative costs and benefits (see figure below), with a tendency
towards an increase of costs.
119 Smit, A.B., H. Prins & M.N.A. Ruijs, (2014). Inrichting operationeel Bedrijfsadviessysteem (BAS); Aangepaste opzet
naar aanleiding van herziening Gemeenschappelijk Landbouwbeleid. Den Haag, LEI Wageningen UR (University &
Research centre), LEI Rapport 2014-029 (http://edepot.wur.nl/327077
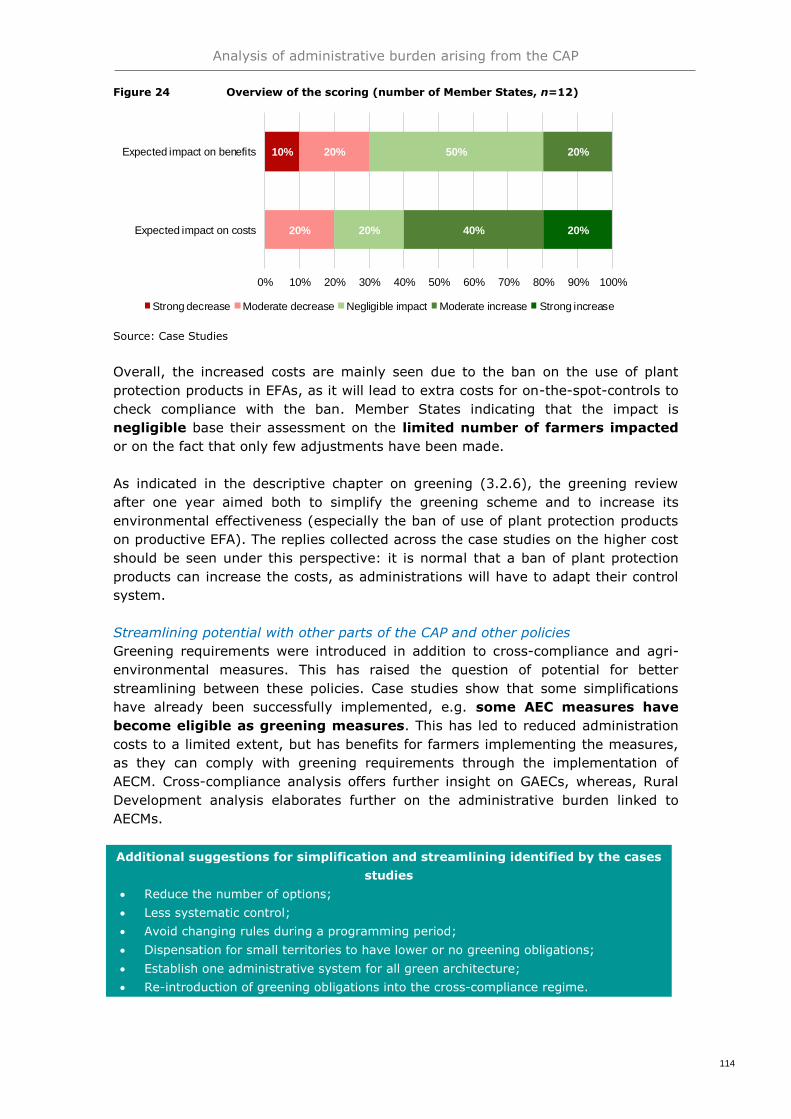
Analysis of administrative burden arising from the CAP
114
Figure 24 Overview of the scoring (number of Member States, n=12)
Source: Case Studies
Overall, the increased costs are mainly seen due to the ban on the use of plant
protection products in EFAs, as it will lead to extra costs for on-the-spot-controls to
check compliance with the ban. Member States indicating that the impact is
negligible base their assessment on the limited number of farmers impacted
or on the fact that only few adjustments have been made.
As indicated in the descriptive chapter on greening (3.2.6), the greening review
after one year aimed both to simplify the greening scheme and to increase its
environmental effectiveness (especially the ban of use of plant protection products
on productive EFA). The replies collected across the case studies on the higher cost
should be seen under this perspective: it is normal that a ban of plant protection
products can increase the costs, as administrations will have to adapt their control
system.
Streamlining potential with other parts of the CAP and other policies
Greening requirements were introduced in addition to cross-compliance and agri-
environmental measures. This has raised the question of potential for better
streamlining between these policies. Case studies show that some simplifications
have already been successfully implemented, e.g. some AEC measures have
become eligible as greening measures. This has led to reduced administration
costs to a limited extent, but has benefits for farmers implementing the measures,
as they can comply with greening requirements through the implementation of
AECM. Cross-compliance analysis offers further insight on GAECs, whereas, Rural
Development analysis elaborates further on the administrative burden linked to
AECMs.
Additional suggestions for simplification and streamlining identified by the cases
studies
Reduce the number of options;
Less systematic control;
Avoid changing rules during a programming period;
Dispensation for small territories to have lower or no greening obligations;
Establish one administrative system for all green architecture;
Re-introduction of greening obligations into the cross-compliance regime.
10%
20%
20%
20%
50%
40%
20%
20%
0% 10% 20% 30% 40% 50% 60% 70% 80% 90% 100%
Expected impact on costs
Expected impact on benefits
Strong decrease Moderate decrease Negligible impact Moderate increase Strong increase
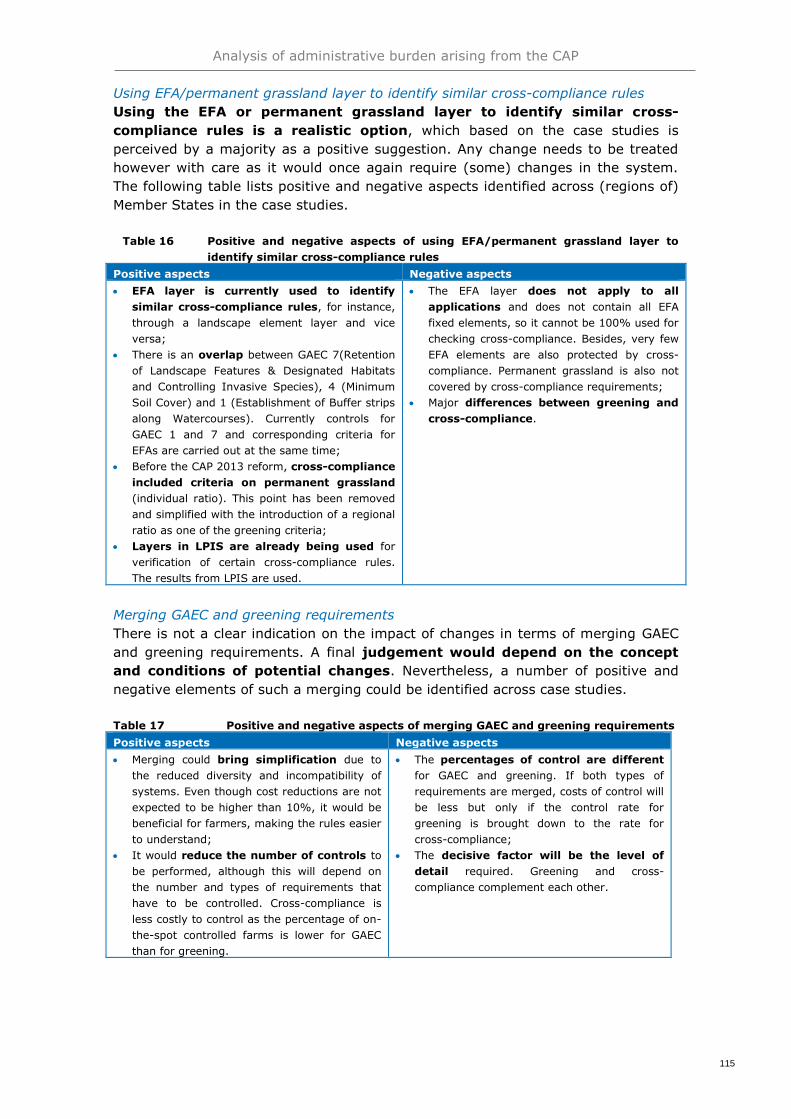
Analysis of administrative burden arising from the CAP
115
Using EFA/permanent grassland layer to identify similar cross-compliance rules
Using the EFA or permanent grassland layer to identify similar cross-
compliance rules is a realistic option, which based on the case studies is
perceived by a majority as a positive suggestion. Any change needs to be treated
however with care as it would once again require (some) changes in the system.
The following table lists positive and negative aspects identified across (regions of)
Member States in the case studies.
Table 16 Positive and negative aspects of using EFA/permanent grassland layer to
identify similar cross-compliance rules
Positive aspects Negative aspects
EFA layer is currently used to identify
similar cross-compliance rules, for instance,
through a landscape element layer and vice
versa;
There is an overlap between GAEC 7(Retention
of Landscape Features & Designated Habitats
and Controlling Invasive Species), 4 (Minimum
Soil Cover) and 1 (Establishment of Buffer strips
along Watercourses). Currently controls for
GAEC 1 and 7 and corresponding criteria for
EFAs are carried out at the same time;
Before the CAP 2013 reform, cross-compliance
included criteria on permanent grassland
(individual ratio). This point has been removed
and simplified with the introduction of a regional
ratio as one of the greening criteria;
Layers in LPIS are already being used for
verification of certain cross-compliance rules.
The results from LPIS are used.
The EFA layer does not apply to all
applications and does not contain all EFA
fixed elements, so it cannot be 100% used for
checking cross-compliance. Besides, very few
EFA elements are also protected by cross-
compliance. Permanent grassland is also not
covered by cross-compliance requirements;
Major differences between greening and
cross-compliance.
Merging GAEC and greening requirements
There is not a clear indication on the impact of changes in terms of merging GAEC
and greening requirements. A final judgement would depend on the concept
and conditions of potential changes. Nevertheless, a number of positive and
negative elements of such a merging could be identified across case studies.
Table 17 Positive and negative aspects of merging GAEC and greening requirements
Positive aspects Negative aspects
Merging could bring simplification due to
the reduced diversity and incompatibility of
systems. Even though cost reductions are not
expected to be higher than 10%, it would be
beneficial for farmers, making the rules easier
to understand;
It would reduce the number of controls to
be performed, although this will depend on
the number and types of requirements that
have to be controlled. Cross-compliance is
less costly to control as the percentage of on-
the-spot controlled farms is lower for GAEC
than for greening.
The percentages of control are different
for GAEC and greening. If both types of
requirements are merged, costs of control will
be less but only if the control rate for
greening is brought down to the rate for
cross-compliance;
The decisive factor will be the level of
detail required. Greening and cross-
compliance complement each other.

Analysis of administrative burden arising from the CAP
116
Moreover, most case studies highlighted differences between a low-entry
scheme and the AECM, which would hamper additional efficiency. However,
some suggested elements that could help to improve efficiency:
potential for simplification of the baseline design;
a more ambitious minimum setting, which would increase the level of AECM
requirements and the ease for the control of AECMs.
Overlaps with other policies
Overlaps of greening with other policies appear to depend substantially on the
national setting. While about half of the Member States under investigation do
not observe overlaps, the other half did indicate overlaps of greening administrative
arrangements with other policies. While not specifying details of such overlaps, the
following areas were mentioned:
Natura 2000 (without any further comment);
Overlap of greening administrative arrangements with those of the Rural
Development Plan, mainly afforested areas which can also be categorized as EFA
elements if established after 2008;
Overlap of greening requirements and cross-compliance: the Birds Directive
requirements can also be a part of EFA, especially in the buffer zones;
Part of the areas under Natura 2000 are categorised as sensitive permanent
grassland;
Regional soil and water protection measures, which is also a permanent
grassland maintenance basic requirement.
4.4.4 Cross-compliance
Cross-compliance covers the execution of all compliance checks required under
GAEC and SMR, as well as the relevant reporting and follow-up.
Costs of management and controls linked to cross-compliance
Estimated costs for cross-compliance range between €130 m - €152 m,
accounting for 8% of total IACS cost at the aggregate (EU) level. A previous
study assessing the administrative burden on farms arising from the CAP120 in 2007
concluded that the burden of red tape from cross-compliance was rather
limited, i.e. between 0.3% and 4.3% of the overall burden. Verket (2011)121 also
confirms that the additional costs of farmers for complying with the SMRs are on
average low based upon an in-depth assessment of Sweden, yet finds them to be
heterogeneous between different types of farms. Based on our estimates building
on data from the DG AGRI Survey and comparing them with the previous
assessments, we conclude that cross-compliance costs as a percentage of
direct payments received have decreased.
120 Directorate-General for Agriculture and Rural Development (DG AGRI) (2007). Study to assess the administrative
burden on farms arising from the CAP. https://ec.europa.eu/agriculture/external-studies/burden_en 121 Jordbruks Verket (2011). Environmental Effects of cross compliance.
http://www2.jordbruksverket.se/webdav/files/SJV/trycksaker/Pdf_rapporter/ra11_5eng.pdf

Analysis of administrative burden arising from the CAP
117
Table 18 Cross-compliance cost development
2015 2017
Costs as a percentage of
direct payments
below 0.1% for two Member
States;
range from 0.1% to 0.3% in
six Member States;
are estimated to be 1.15% in
one Member State.
below 0.1% for three Member
States;
range from 0.1% to 0.3% in
five Member States;
are estimated to be 0.4% in
one Member State.
Costs in the form of FTEs
(FTE/1,000 euro of direct
payments)
0.02 to 0.07 FTE for six
Member States;
to 0.15 FTE for two Member
States;
0.44 FTE for one Member
State.122
0.02 to 0.06 FTE for seven
Member States;
0.1 to 0.15 FTE for two
Member States.
Source: Ecorys based on the information obtained from the DG AGRI Survey
Sources of administrative costs
As regards public authorities, costs for cross-compliance are mainly due to the
specific OTSCs, not already required by underlying sectorial legislation. We
distinguish between costs incurred from controls of SMR and GAEC.
Costs incurred from controls of SMRs
The following key cost items of controls of SMRs as perceived by the Member States
have been identified based on the case studies:
co-ordination with sectorial control bodies provided their control results are
used for achieving the cross-compliance´ minimum control rate;
costs for involving (SMR) experts in the control team, if Member States opt
for not using results from sectorial controls123;
investments;
animal identification (seen as a high cost), in particular in areas where herd
size is important;
on-the-spot controls; and
amortisation of IT applications.
In addition, the following cost factors are mentioned:
veterinary controls, which also require additional equipment to meet bio-security
requirements;
risk analysis, in particular the different risk analyses needed due to a variety of
regulations.124
122 NOTE: This calculation is based on the number of FTE involved in the controls, times the cost per FTE (as indicated
by the Member State). However, it should be noted that the cost per FTE vary per Member State, due to differences
in labour costs. Also, differences in costs may arise due to differences in the calculation basis; that is in some Member
States the costs appear to include costs for equipment used, in other Member States the costs per FTE only relate to labour costs. To adjust the calculations for this, we have also calculated the number of FTE needed per 1,000 euro of
direct payments. These costs are rough estimates, and merely indicate a range. It does however show that overall
the administrative costs for cross-compliance may be considered relatively low. 123 NOTE: These are not costs related to cross-compliance, as these control bodies have to be established due to
sectorial legislation anyhow 124 NOTE: costs mentioned related to maintaining the relevant regulations and these costs would have occurred also in
the case that cross-compliance had not been introduced.
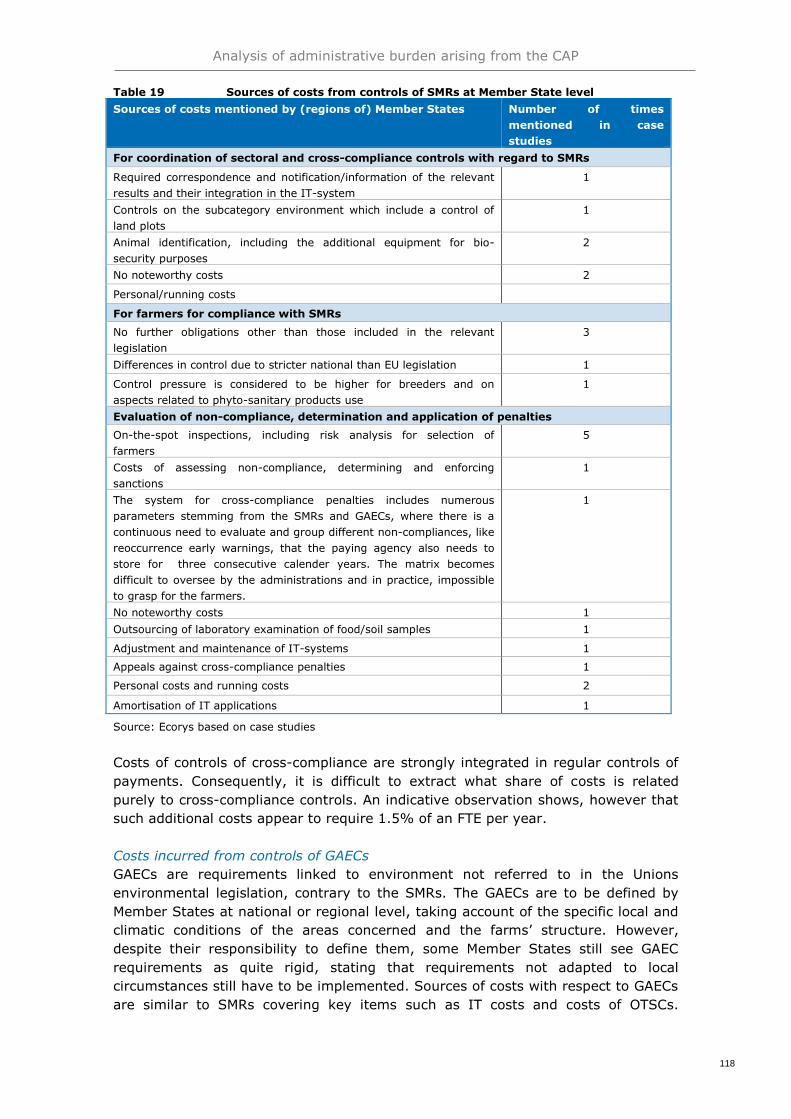
Analysis of administrative burden arising from the CAP
118
Table 19 Sources of costs from controls of SMRs at Member State level
Sources of costs mentioned by (regions of) Member States Number of times
mentioned in case
studies
For coordination of sectoral and cross-compliance controls with regard to SMRs
Required correspondence and notification/information of the relevant
results and their integration in the IT-system
1
Controls on the subcategory environment which include a control of
land plots
1
Animal identification, including the additional equipment for bio-
security purposes
2
No noteworthy costs 2
Personal/running costs
For farmers for compliance with SMRs
No further obligations other than those included in the relevant
legislation
3
Differences in control due to stricter national than EU legislation 1
Control pressure is considered to be higher for breeders and on
aspects related to phyto-sanitary products use
1
Evaluation of non-compliance, determination and application of penalties
On-the-spot inspections, including risk analysis for selection of
farmers
5
Costs of assessing non-compliance, determining and enforcing
sanctions
1
The system for cross-compliance penalties includes numerous
parameters stemming from the SMRs and GAECs, where there is a
continuous need to evaluate and group different non-compliances, like
reoccurrence early warnings, that the paying agency also needs to
store for three consecutive calender years. The matrix becomes
difficult to oversee by the administrations and in practice, impossible
to grasp for the farmers.
1
No noteworthy costs 1
Outsourcing of laboratory examination of food/soil samples 1
Adjustment and maintenance of IT-systems 1
Appeals against cross-compliance penalties 1
Personal costs and running costs 2
Amortisation of IT applications 1
Source: Ecorys based on case studies
Costs of controls of cross-compliance are strongly integrated in regular controls of
payments. Consequently, it is difficult to extract what share of costs is related
purely to cross-compliance controls. An indicative observation shows, however that
such additional costs appear to require 1.5% of an FTE per year.
Costs incurred from controls of GAECs
GAECs are requirements linked to environment not referred to in the Unions
environmental legislation, contrary to the SMRs. The GAECs are to be defined by
Member States at national or regional level, taking account of the specific local and
climatic conditions of the areas concerned and the farms’ structure. However,
despite their responsibility to define them, some Member States still see GAEC
requirements as quite rigid, stating that requirements not adapted to local
circumstances still have to be implemented. Sources of costs with respect to GAECs
are similar to SMRs covering key items such as IT costs and costs of OTSCs.
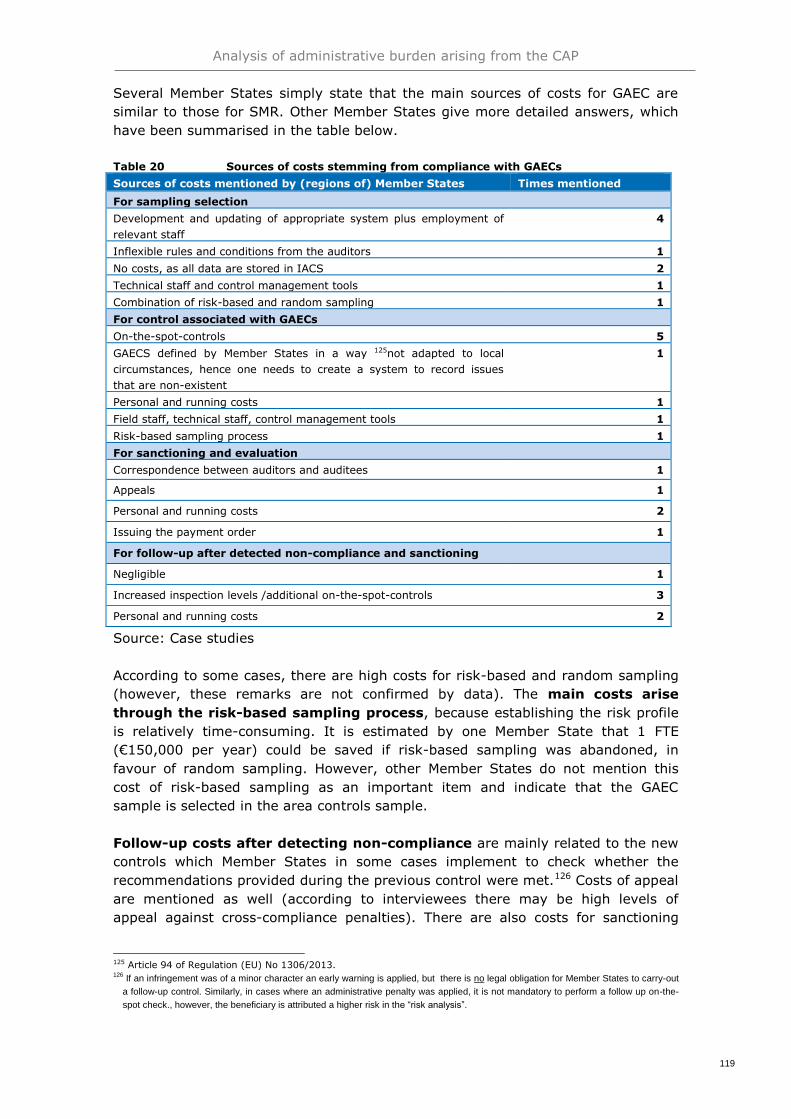
Analysis of administrative burden arising from the CAP
119
Several Member States simply state that the main sources of costs for GAEC are
similar to those for SMR. Other Member States give more detailed answers, which
have been summarised in the table below.
Table 20 Sources of costs stemming from compliance with GAECs
Sources of costs mentioned by (regions of) Member States Times mentioned
For sampling selection
Development and updating of appropriate system plus employment of
relevant staff
4
Inflexible rules and conditions from the auditors 1
No costs, as all data are stored in IACS 2
Technical staff and control management tools 1
Combination of risk-based and random sampling 1
For control associated with GAECs
On-the-spot-controls 5
GAECS defined by Member States in a way 125not adapted to local
circumstances, hence one needs to create a system to record issues
that are non-existent
1
Personal and running costs 1
Field staff, technical staff, control management tools 1
Risk-based sampling process 1
For sanctioning and evaluation
Correspondence between auditors and auditees 1
Appeals 1
Personal and running costs 2
Issuing the payment order 1
For follow-up after detected non-compliance and sanctioning
Negligible 1
Increased inspection levels /additional on-the-spot-controls 3
Personal and running costs 2
Source: Case studies
According to some cases, there are high costs for risk-based and random sampling
(however, these remarks are not confirmed by data). The main costs arise
through the risk-based sampling process, because establishing the risk profile
is relatively time-consuming. It is estimated by one Member State that 1 FTE
(€150,000 per year) could be saved if risk-based sampling was abandoned, in
favour of random sampling. However, other Member States do not mention this
cost of risk-based sampling as an important item and indicate that the GAEC
sample is selected in the area controls sample.
Follow-up costs after detecting non-compliance are mainly related to the new
controls which Member States in some cases implement to check whether the
recommendations provided during the previous control were met.126 Costs of appeal
are mentioned as well (according to interviewees there may be high levels of
appeal against cross-compliance penalties). There are also costs for sanctioning
125 Article 94 of Regulation (EU) No 1306/2013. 126
If an infringement was of a minor character an early warning is applied, but there is no legal obligation for Member States to carry-out
a follow-up control. Similarly, in cases where an administrative penalty was applied, it is not mandatory to perform a follow up on-the-
spot check., however, the beneficiary is attributed a higher risk in the “risk analysis”.

Analysis of administrative burden arising from the CAP
120
that arise from issuing the payment order, which are estimated at about €250 by
one Member State.
Coordination of controls
Sectoral bodies sometimes cooperate to avoid duplication of efforts. Such
cooperation differs however between Member States. For SMRs, the case studies
suggest an equal split between those countries having a high or very high extent
of sectoral control bodies involved for cross-compliance controls, and those which
do not involve sectoral control bodies. In four cases, the administration (paying
agency) is the sole responsible for the cross-compliance controls of SMRs, hence no
specific costs for coordination are involved. Cooperation is also not always easy,
given its controls being very complex and specific. In the Member States where
sectoral control bodies carry out controls, no major costs of coordination could be
identified. For GAECs, the picture appears to be mixed with a slightly more
negative trend than for SMRs, indicating less involvement of sectoral control
bodies.
Future CAP and opportunities to reduce administrative burdens
Following its introduction, cross-compliance was a highly debated subject. The 2007
assessment showed that farmers perceive the many checks related to cross-
compliance as a burden. The length taken for the checks and the perceived
unpredictability of unannounced controls annoyed farmers in the Member States
studied.127 After the health check, the Commission allowed advance notice for
OTSCs (“early warning system” – renamed as mandatory follow-up visit) and the
abolition of a reduction of payment for minor infringements a de minimis limit of
€100128. Existing sanctioning costs of €250 were estimated in the case studies. This
estimate would imply that increasing the ‘bagatelle limit’ could lead to less costs.
Previous and ongoing improvements allow farmers to better plan their activities,
demanding less paperwork to solve small infringements and remove the threat to
be penalised for trivial infractions. The measure also simplifies the task of national
administrations. Yet, the European Court of Auditors pointed out in their 2016
report129 that despite their similarities, the compulsory GAEC and greening rules are
checked under two control systems. This may lead to inefficiencies in the control
systems and an additional administrative burden.
In general, given the interlinkage with other policies, the cost-effectiveness and
thus ‘regulatory fitness’ of cross-compliance require detailed assessment as regards
to what extent they complement one another and to what extent synergies exist.
4.4.5 IACS-based rural development measures
This section covers the management and controls of IACS-based rural development
measures, such as managing the open calls, selecting the applications, processing
the payments etc.
127 Directorate-General for Agriculture and Rural Development (DG AGRI) (2007). Study to assess the administrative
burden on farms arising from the CAP. https://ec.europa.eu/agriculture/external-studies/burden_en 128 European Commission (2011), Impact assessment Common Agricultural Policy towards 2020 Commission staff
working paper. Annex 8 Simplification of the CAP. https://ec.europa.eu/agriculture/sites/agriculture/files/policy-
perspectives/impact-assessment/cap-towards-2020/report/annex8_en.pdf 129 European Court of Auditors (2016). Making cross compliance more effective and achieving simplification
remains -challenging. https://www.eca.europa.eu/Lists/News/NEWS1610_27/SR_CROSS_COMPLIANCE_EN.pdf

Analysis of administrative burden arising from the CAP
121
Costs of management and controls linked to IACS-based RDP measures
Estimated costs for IACS-based rural development measures range between €558m
- €626m, accounting for 32% of total IACS cost at the aggregate (EU) level.
From a very rough estimate, based on budget allocated to rural development
measures reported in 2016, management and control costs are most frequently in a
range between 5 and 15% of the amount of payments, but variability per Member
State is much higher than this range. The number of FTEs are more frequently in
the range of 300-500 per year and per billion Euro of total budget over the 7 years
of programming.
According to past reports of the European Court of Auditors130 the EAFRD is one
of the funds most prone to error rates, often due to its complex rules and
eligibility conditions. The EAFRD is a fund with a relatively high administrative
burden, if compared to other EU co-funded programmes, which is in part inherent
to the specific type, size, variety and conditionality of its interventions and some
related gold-plating131 practices (see also previous section). Errors add a further
layer of burdens and costs for both beneficiaries (i.e. farmers and business) and
public administrations. Once such errors occur, additional clarifications and further
exchanges of data are required. Administrative burdens in Pillar II can
therefore be further reduced throughout its implementation, by improving
clarity and appropriateness of information obligations across EAFRD measures and
operational requirements.
In our study, cost of controls are found to be higher for the Pillar II
measures than for direct payments. This is also confirmed by the qualitative
feedback provided in the case studies. Depending on the requirements to be
inspected, OTSC can require 1 to 3 physical visits on the same farm while Pillar I
controls can (at least) partially be performed through remote sensing. This is not
surprising given the combination of very specific and often one-off measures. Costs
are particularly high for the agri-environmental-climate measure. These stem from
the complexity of some types of operation and changing eligibility requirements,
items to be checked can be numerous and different according to the type of
commitment and require specific field investigation (late mowed, verification of
fertiliser / phytosanitary inventory books and storage premises, etc.).
Insights from the case studies
According to a study carried out by apaying agency in 2015, on-site visits also tend to take longer for
Pillar II controls than for Pillar I, when they are not combined. For instance, about 70% of Pillar II
IACS-based controls are combined with Pillar I controls.
For animal-related measures, in both cases (Pillar I and II), controls include
database related checks and the verification of the adequacy between recorded
data and animals present on the farm. The main issue raised is the fact that
additional controls are necessary for LFA because of the requirement to control the
stocking density in a given year, while controls for the Pillar I depend on data of the
year before.
130 Court of Auditors Annual Report (2011), Par. 4.5. 131 transposition of EU legislation, which goes beyond what is required by that legislation

Analysis of administrative burden arising from the CAP
122
Sources of administrative costs
Analysing costs in terms of absolute numbers shows that particularly M10 – agri-
environment schemes are causing high personnel costs in most Member States.
Figure 25 Distribution of personnel costs by RDP measures (% share)
Source: DG AGRI: Data Collection on Administrative Costs for Programme Management – EAFRD funds –
January 2018
NOTE: Costs are those reported by programming authorities to the Commission without adjustment by
income level and mostly refer to year 2016.
The overall cost and the distribution of these costs among measures largely reflects
the importance of each measure in the Member States. The distribution of the effort
in FTE is roughly in line with these costs.
Breaking down personnel costs in terms of activities shows that a major source of
personnel cost is represented by administrative checks (carried out on 100% of
applications for support and payment claims), regardless of the measure. On-the-
spot controls are the second most relevant cost driver (carried out on 5% of the
beneficiaries).
0%
10%
20%
30%
40%
50%
60%
70%
80%
90%
100%
MS 1 MS 2 MS 3 MS 4 MS 5 MS 6 MS 7 MS 8 MS 9
Share
of
costs
Leader
M15 - Forest environmental and climate services
M14 - Animal welfare
M13 - Payments to areas facing natural or other specific constraints
M12 - Natura 2000
M11 - Support for organic farmining

Analysis of administrative burden arising from the CAP
123
Figure 26 Share of control cost by type of cost and measure – average of the observed
countries (%)
Source: DG AGRI: Data Collection on Administrative Costs for Programme Management – EAFRD funds –
January 2018
Differences between Member States
Differences between cost items across Member States can be observed.
Administrative checks remain the most important item, though in some cases
OTSCs account for roughly the same (or even higher) share of costs.
Figure 27 Share of control cost by type of cost and country – average of the observed
measures excluding leader (%)
Source: DG AGRI: Data Collection on Administrative Costs for Programme Management – EAFRD funds –
January 2018
Remote sensing has an important share of costs in only two of the assessed
countries. In terms of personnel, the effort (FTE dedicated) on remote sensing is
second only to administrative checks (about one tenth of personnel effort dedicated
to remote sensing), while OTSC are much lower in one of these Member States and
roughly of the same amount in the other. These figures, though not conclusive, hint
that remote sensing can indeed contribute to overall cost reduction.
0%
25%
50%
75%
100%
M08 M10 M11 M12 M13 M14 Leader
admin controls remote sensing on the spot controls others
0%
10%
20%
30%
40%
50%
60%
70%
80%
90%
100%
MS 1 MS 2 MS 3 MS 4 MS 5 MS 6 MS 7 MS 8 MS 9
admin controls remote sensing on the spot controls others

Analysis of administrative burden arising from the CAP
124
Explanatory factors for cost and cost-effectiveness differences
Differences of costs among regions can be due to a number of reasons:
Each region has a different number of measures;
Measures within the region can be more or less differentiated (e.g. with respect
to eligibility conditions, sub-measures and types of operation);
The set of measures in different regions may differ by design, with more or less
complex sets of eligibility conditions.
The complexity of measures is the primary reason for higher costs of
controls. Especially the number of eligibility conditions add to this complexity, as
each requires additional information and controls. The costs for controls of
measures supporting areas facing natural or other specific constraints are relatively
low. Here, only the area’s location needs to be checked. The costs of controls for
measures supporting ecological agriculture, such as the AECM, are much higher.
Numerous specific checks that lead to higher costs for performing the control
activities are required.
It is reported that the most costly activities for the administration are
performed under measures related to cross-compliance and environmental
payments. In multi-annual measures, the requirements can be numerous and very
specific, and in this case, the cost increases. Some measures need several visits to
be controlled, and some territories, like mountain regions, are more difficult to
control. This has an impact on the cost of controls. Among individual measures,
e.g. measure 10, the high level of flexibility given to the local level and the large
number of types of operation proposed generate an higher administrative burden
compared to other measures, as there are a lot of specifications to take into
account and thus a lot of control items.
In addition to measure design and to the number of measures, the following factors
are relevant to determine administrative costs:
Different regional contexts and the special territorial features of each specific
area, with higher heterogeneity or location in remote areas leading to higher
costs of implementation;
Degree of integration of additional regional parameters and local legislation
with the IACS;
Requirement for different control rates (depending on measures and
regions) and equipment needed by inspectors for certain measures;
Small extra costs related to laboratory samples examination when needed;
Need to conduct a supplementary public procurement procedure for some
of the measures;
Link and consistency with the baseline, which also stems from national
legislative procedures;
Commitments including dates or a seasonality constraints, that impose to
perform controls in a certain period, which generates complexity (AECM,
greening);
Priority systems in the selection (measure 10) or after the aid processing
(measure 11), which generates costs as many applicants do not fit with the
eligibility criteria.

Analysis of administrative burden arising from the CAP
125
Cost development and linkages to error rates
Comparison with previous period
Changes of costs between programming periods depend on a large number of
factors, from regulatory aspects to implementation decisions on the national and
regional level. It is thus hard to give an overall assessment whether costs have
increased or decreased. Anecdotal evidence suggests that cost did not decrease.
Insights from the case studies
One (regional) paying agency estimated a cost increase of some 20%. The distribution of costs (for
measures 10, 11 and 13) provides an indication of the order of magnitude also to be expected in
other regions/Member States:
Specifications (transposition of EC requirements, setting up of selection criteria when they apply,
etc.) (4-8%);
Management of the open calls (publication, reception of application, provision of information,
responses to farmer requests, etc.) (4-8%);
Selection of applications (applications ranking when applied, communication and appeals, etc.)
(40-45%);
Payments (management of payments, refunds, controversies, etc.) (40-45%).
Linkages between administrative burden and error rates
The relationship between error rates and administrative burden is not clear
due to limited information available. In general, control rates have not increased
(are constant everywhere), while error rates, reported only in a couple of country
cases, are mostly stable or in some cases decreasing. In one region, the error rate
is increasing, but remains at a comparatively very low level.
Insights from the case studies
An example of an action plan to reduce error rates had been reported for Spain. The error
rates decreased from 4.93 to 2.7% in 5 years (and much more from 2011 onwards), not only due to
an increased number of controls, but also because of the implementation of an action plan, which
included measures to improve the quality of the system of controls (such as training of public servant
and beneficiaries, improved reports and documents, guidance, IT tool improvements, revision of the
sanction system, etc.). Precise costs are not available, but the measures listed are likely to bring
some relevant administrative costs.
Suitability of IACS for rural development measures
In general, the IACS framework is reported to be suitable for area-based rural
development measures and no major specific problem has been detected
on this regard. Moreover, there are no major differences in the way Member States
manage IACS in relation to rural development measures compared to the way they
manage the system for direct payments (Pillar I). In some cases, the responsible
bodies are the same in both situations. In other cases, the distribution of
responsibilities is more complex. This has implications for the total administrative
burden for design and implementation, or at least for the cost distribution (but the
effects are not necessarily linked to the IACS per se - some examples follow).

Analysis of administrative burden arising from the CAP
126
Insights from the case studies
In one Member State, the responsibility of IACS measure controls is shared between the national and
regional level boards. No significant increase in control activity (and hence burden) is observed, since
the measures are IACS based.
Another Member State adopted a new model for AECM payments in 2015, the so-called collective
approach. Before 2015, payments were granted to individual farmers, endorsing certain
commitments, to compensate them for all or part of the additional costs and income foregone
resulting from the commitments made. That model led to a low share of participation on high
productive soils, as the AECM payment was insufficient to compensate the higher compliance costs
(manly due to higher income forgone, so lower profitability of participation) of these soils. In the new
model, AECM-payments are now awarded to regional cooperatives of farmers (the collectives) instead
of individual farmers. The agri-environmental-climate commitments are specifically focused on the
conservation of species of the Birds and Habitat Directive and only farmers in habitats that are
favourable for certain species can apply for AECM payments. In this model, the collective is the
beneficiary and acts as an intermediary between the paying agency and the farmers. The payments
are maximised according to the highest compensation rate allowed (based on cost incurred and
income foregone) and fixed based on the agreement between the cooperatives and the regional
government.
In a third example, of a regionally organised country the administrations involved are the same for
procedures and management of IACS in Pillar I: the regional governmental body and paying agency
for CAP measures. Public officers of the territorial delegations carry out controls: the same control
team carries out controls for both the Pillar I and rural development programmes, hence control
procedures are not outsourced for RD measures. Cross-compliance controls are carried out by another
department.
The organisations involved in the implementation of IACS based RDP measures for a Member State
implementing measures 10, 11 and 13 are:
Regional Councils. They have been designated as EAFRD managing authorities for the 2014-2020
period (on the previous programs, the managing authority was the State and there was only one
national rural development program). They are in charge of the writing of the RDPs, the steering
and coordination of all actors involved in the implementation, and the monitoring and evaluation of
measures. As regards the implementation of IACS based RDP measures, Regional Councils are
responsible for launching the call for projects, the selection of agri-environmental schemes and the
establishment of requirements specifications (updated yearly as for measures 10 and 11). They
are also involved in the configuration of regional parameters for measures 10 and 11 in the IACS .
Decentralised State services. These are in charge of processing applications (once farmers have
applied online), administrative checks and on-the-spot controls returns. DRAAF The Decentralised
State services are involved in the design and implementation of national framework schemes .
They also participate in regional committees for the selection of agri-environmental and climate
projects and contribute with regional councils to the setting of regional parameters in the IACS.
The payment agency is responsible for on-the-spot controls on second pillar area-based measures
(IACS based RDP measures).
These different models reflect different ways of adapting to the implementation of
RDP measures based on existing institutional design and responsibility. Based on

Analysis of administrative burden arising from the CAP
127
the information available so far, it is not yet possible to give a judgement about the
different performances and the role of IACS.
Usability of IACS and LPIS to check commitments and room for cost
reductions
The extent to which IACS and LPIS are useful to check commitments under RDPs
also in the coming programming period depends on how Member States will
choose their future programmes and to what extent the measures would
be area-based.
In general, the ability to better check commitments at lower costs depends on the
future quality and availability of information supplementing the LPIS, e.g. new data
layers and better monitoring through Copernicus Sentinels’ data to provide more
frequent images, thus allowing more frequent analysis across time periods. In this
respect, evidence from the experience carried out until now strongly depends on
the starting point. Concerning digitalisation of processes, responses in the case
studies are divided between two main positions:
Those countries in which digitalisation was already advanced, where the
new system has brought little effect;
Those countries where the system is new, in which costs are higher but also
value added from the new system are more often recognised .
There are diverging opinions about the extent to which satellite based
information can improve the quality of checks and reduce, to a relatively
high extent, costs of monitoring Rural Development commitments.
Insights from the case studies
A Member State using satellite based information to a high extend, indicated that they can decrease
costs. However, the views of paying agencies in other Member States show that, on the one hand
side, geo-tagged pictures could be improved to make it possible to identify crops (with current IT
tools, it is not always possible to identify crops according to the period and the type of crops).
Therefore, the requirements should be adapted to the quality of the geo-spatial pictures.
Two Member States identified no cost savings due to the fragmented agrarian structure and high
levels of cloud coverage. As a result, a dual system of controls that still includes traditional on-the-
spot controls would still be required in addition to any controls managed via Sentinels satellites. Other
Member States identified technical issues,such as new technologies/satellites not being able to
measure things that move, such as cattle.
In addition, new technologies require appropriate legislation changes ensuring their consistent use.
One paying agency is expecting to use drones in the future to carry out more controls, but do not
expect to have any efficiency improvement/saving from this solution.
Methods to overcome lack of controllability of certain environmentally
valuable commitments
Overall, the controllability and verifiability of measures is duly discussed and taken
into account when designing the schemes. Therefore, there is often no clear
evidence of explicit problems of rejection of measures due to non-
verifiability or non-controllability (but such information is hidden in the details
of the process).
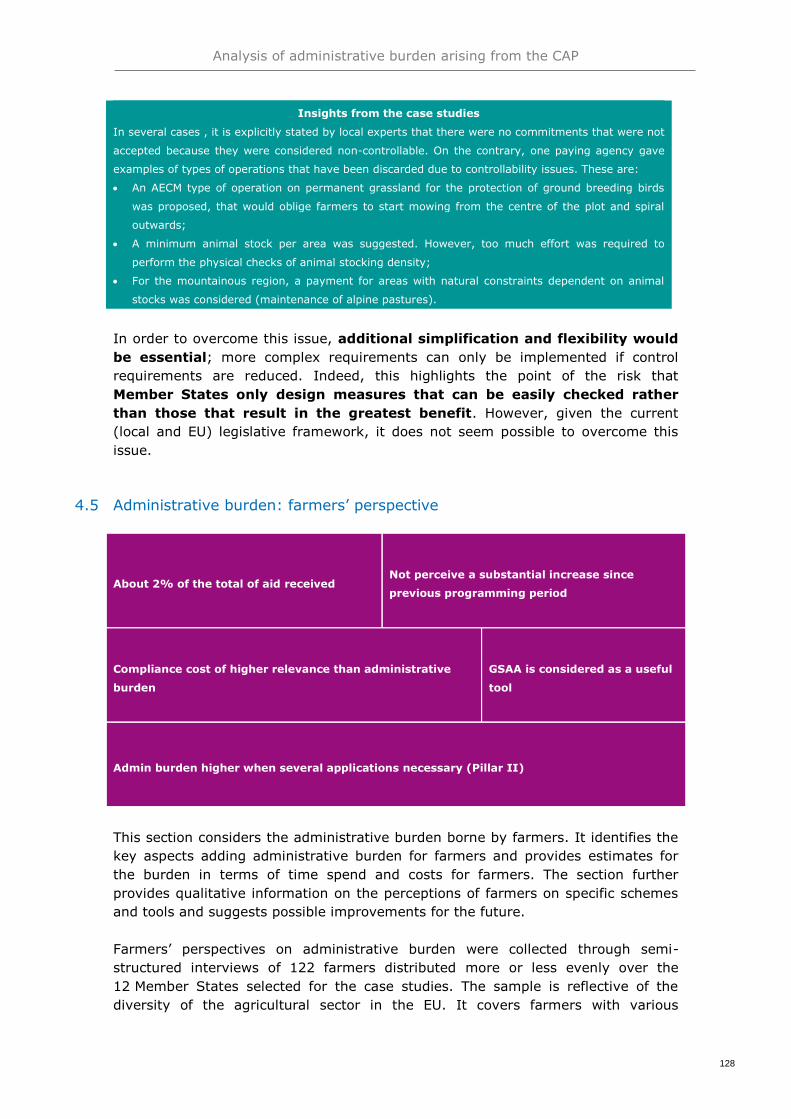
Analysis of administrative burden arising from the CAP
128
Insights from the case studies
In several cases , it is explicitly stated by local experts that there were no commitments that were not
accepted because they were considered non-controllable. On the contrary, one paying agency gave
examples of types of operations that have been discarded due to controllability issues. These are:
An AECM type of operation on permanent grassland for the protection of ground breeding birds
was proposed, that would oblige farmers to start mowing from the centre of the plot and spiral
outwards;
A minimum animal stock per area was suggested. However, too much effort was required to
perform the physical checks of animal stocking density;
For the mountainous region, a payment for areas with natural constraints dependent on animal
stocks was considered (maintenance of alpine pastures).
In order to overcome this issue, additional simplification and flexibility would
be essential; more complex requirements can only be implemented if control
requirements are reduced. Indeed, this highlights the point of the risk that
Member States only design measures that can be easily checked rather
than those that result in the greatest benefit. However, given the current
(local and EU) legislative framework, it does not seem possible to overcome this
issue.
4.5 Administrative burden: farmers’ perspective
About 2% of the total of aid received Not perceive a substantial increase since
previous programming period
Compliance cost of higher relevance than administrative
burden
GSAA is considered as a useful
tool
Admin burden higher when several applications necessary (Pillar II)
This section considers the administrative burden borne by farmers. It identifies the
key aspects adding administrative burden for farmers and provides estimates for
the burden in terms of time spend and costs for farmers. The section further
provides qualitative information on the perceptions of farmers on specific schemes
and tools and suggests possible improvements for the future.
Farmers’ perspectives on administrative burden were collected through semi-
structured interviews of 122 farmers distributed more or less evenly over the
12 Member States selected for the case studies. The sample is reflective of the
diversity of the agricultural sector in the EU. It covers farmers with various
Analysis of administrative burden arising from the CAP
129
characteristics, including different farm sizes and participation in different support
schemes.
4.5.1 Farmers’ understanding of the definition of administrative burden
People might have a different opinion on what the term "administrative burden"
entails. Interviewers therefore asked farmers about their understanding of the
term. Most interviewed farmers understand administrative burden as various
obligatory, recurrent tasks as well as the time needed for their execution.
Such tasks may include registration of agricultural practices (e.g. for use of
phytosanitary products or animal registration) or completing an aid application.
However, many farmers refer to any type of paperwork, bureaucratic process, or
office work as administrative burden. Some interviewees also identified CAP
penalties as part of administrative burden. None of the interviewed farmers
confused administrative burden with compliance costs or any other unrelated types
of costs.
In Member States with a longer CAP tradition, farmers generally perceive such CAP-
related tasks as ‘part of the job’. In contrast, some farmers, mostly from the newer
Member States (EU13), are not fully aware of CAP processes and the workload
these entail. Furthermore, when administrative tasks are ‘outsourced’ to private
companies, cooperatives or other associations, farmers often have no clear
perception of the associated administrative burden.
Among interviewed farmers, there are some aspects of administrative systems that
appear to cause confusion:
As national authorities administer CAP payments, some farmers do not
make a distinction between EU and local administrative requirements;
Where tasks linked to the CAP resemble other administrative tasks,
farmers do not always distinguish between CAP-related administration (e.g.
completing an annual declaration for CAP payment purposes) and other
administrative requirements and constraints (e.g. to comply with other EU
directives, or to apply for technical programs linked to an agri-environment
measure, etc.);
With unclear separations between EU rules and national implementation
choices, one-in-ten of interviewed farmers stated that they did not understand
all CAP payment rules, including the distinction between EU and national-level
rules implemented by local administrations. For example, in transmission or
creation cases, both national and EU administrative requirements must be
fulfilled; first, to establish clearly that the farmer owns or rents the parcels
(national level) and, second, to record them in the CAP digital system (EU level).
In this kind of situation, each step creates an administrative burden that may
not be clearly separated in the mind of the farmer.
Interviewers discussed administrative burden with farmers in detail to avoid any
confusion and clearly distinguish burden stemming from CAP related activities from
other activities. This ensures that results from the interviews are comparable across
farmers and countries.
Where part of the time was clearly allocated for different purposes (e.g. checking
the regulation on phytosanitary), it has been deducted from the time spent on

Analysis of administrative burden arising from the CAP
130
administrative burden for IACS aid (only 4 cases). Other than this, we took the
option to keep all the data, including extreme value as it gives an information on
farmers’ perception even when it seems overestimated.
4.5.2 Sources of administrative burden
A distinction can be made between costs for farmers related to administrative
activities and compliance costs. Only the former will be considered in this analysis
and was therefore discussed during interviews.
Farmers identified several administrative tasks which are linked to the CAP aid,
ranging from filling in forms, to double-checking information and time spent on
official controls. Across the interviews, five main activities were identified:
1) The filling in of aid applications, either online, on paper, or in an administration
office;
2) The collection of important documents, to keep an oversight and have
documents ready if controls occur;
3) Checks of data, i.e. the comparison of data from IACS with data from the
farmers’ own records;
4) Measurement of land to provide correct information in the applications, an
activity that is less frequent but usually very time-intensive;
5) Modifications to land areas in IACS, which may involve the redrawing of parcels
and can be time consuming.
Generally, farmers do not spontaneously include activities related to controls (such
as collection of documentation, attending the controls) as part of the administrative
tasks related to aid management. However, even if they are no regular activities,
the preparation for and participation in controls can represent a significant
administrative burden on farmers.
Many farmers rely on external support for the aid application and management.
Support can be provided by cooperatives, associations, banks, or other entities and
might shift the administrative burden in terms of time spent from farmers to the
external support. The analysis therefore also differentiates between costs for
internal activities and external services.
4.5.3 Estimates of time spent on CAP related administrative tasks
Overall time spent on CAP related administrative tasks
For the whole interviewed sample of farmers, the median time spent on CAP-
related administrative tasks is 15 hours per year. This includes all the time
the farmer, potential family members or paid workers spend on administrative
tasks. However, the time farmers report varies significantly. The minimum of
declared time ranges of 0.5-5 hours per year to a maximum range of 260-
350 hours. The median time per Member State ranges from 4 hours in Spain to
30 hours in Germany, Lithuania and Italy (see figure below).

Analysis of administrative burden arising from the CAP
131
Figure 28: Median number of hours spent in administrative tasks
*Bavaria (DE), Emilia Romagna (IT), Andalusia (ES)
Source: Farmer interviews
Several factors might explain the variation in the time farmers spend on
administrative tasks. For example, farmers owning larger farms (measured in UAA)
tend to face greater administrative burden in terms of hours spent. In addition, the
time farmers spend on administrative tasks also increases with the number of
schemes under which they receive aid (see Figure 29), as the overall complexity of
the application process increases. Farmers receiving aid under one scheme spend
on average 14 hours on administrative tasks, while this number increases to about
40 hours for farmers receiving aid under five schemes. The help of external
consultants does not appear to have an effect on the administrative burden
on farmers in terms of time spent.
Figure 29 Relationship between the time spent on administrative tasks and the number
of schemes
Source: Farmer interviews
0
100
200
300
400
1 2 3 4 5 6 7 8
Tim
e s
pent
(hours
)
Number of Schemes
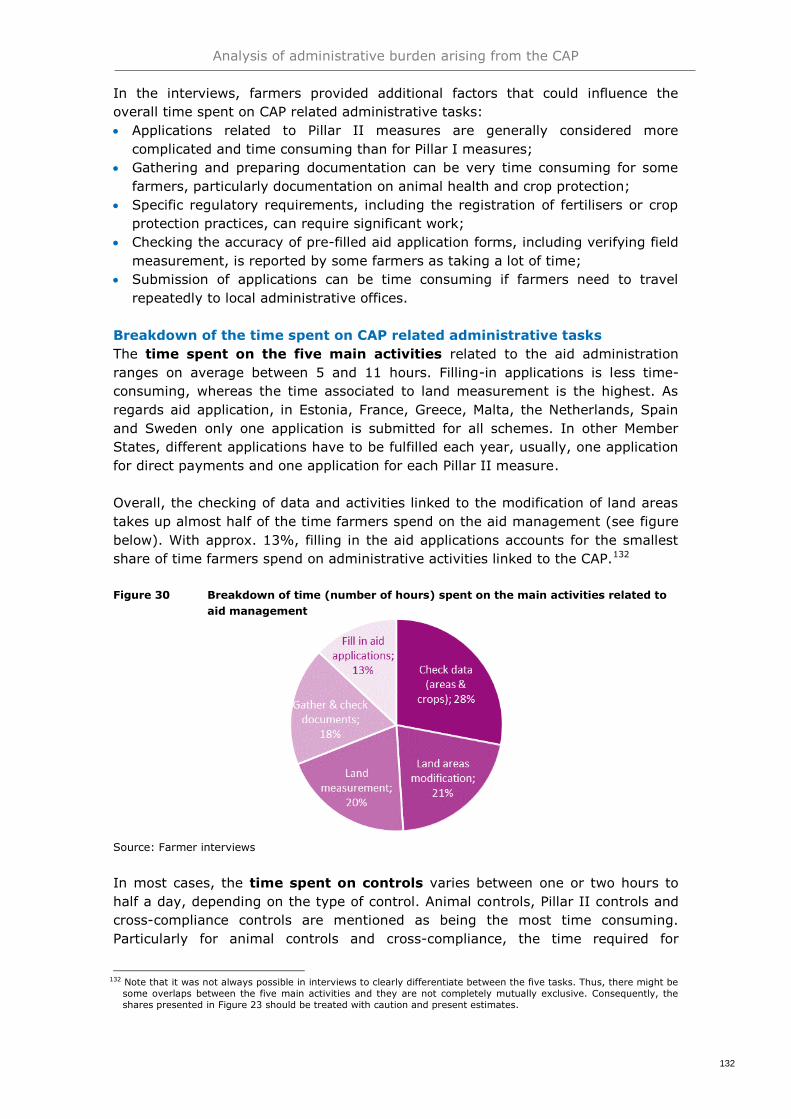
Analysis of administrative burden arising from the CAP
132
In the interviews, farmers provided additional factors that could influence the
overall time spent on CAP related administrative tasks:
Applications related to Pillar II measures are generally considered more
complicated and time consuming than for Pillar I measures;
Gathering and preparing documentation can be very time consuming for some
farmers, particularly documentation on animal health and crop protection;
Specific regulatory requirements, including the registration of fertilisers or crop
protection practices, can require significant work;
Checking the accuracy of pre-filled aid application forms, including verifying field
measurement, is reported by some farmers as taking a lot of time;
Submission of applications can be time consuming if farmers need to travel
repeatedly to local administrative offices.
Breakdown of the time spent on CAP related administrative tasks
The time spent on the five main activities related to the aid administration
ranges on average between 5 and 11 hours. Filling-in applications is less time-
consuming, whereas the time associated to land measurement is the highest. As
regards aid application, in Estonia, France, Greece, Malta, the Netherlands, Spain
and Sweden only one application is submitted for all schemes. In other Member
States, different applications have to be fulfilled each year, usually, one application
for direct payments and one application for each Pillar II measure.
Overall, the checking of data and activities linked to the modification of land areas
takes up almost half of the time farmers spend on the aid management (see figure
below). With approx. 13%, filling in the aid applications accounts for the smallest
share of time farmers spend on administrative activities linked to the CAP.132
Figure 30 Breakdown of time (number of hours) spent on the main activities related to
aid management
Source: Farmer interviews
In most cases, the time spent on controls varies between one or two hours to
half a day, depending on the type of control. Animal controls, Pillar II controls and
cross-compliance controls are mentioned as being the most time consuming.
Particularly for animal controls and cross-compliance, the time required for
132 Note that it was not always possible in interviews to clearly differentiate between the five tasks. Thus, there might be
some overlaps between the five main activities and they are not completely mutually exclusive. Consequently, the
shares presented in Figure 23 should be treated with caution and present estimates.

Analysis of administrative burden arising from the CAP
133
preparation, which mainly consists of gathering the relevant information, is greater
than the time spent on the control itself (one to two days of preparation for half a
day of control).
Typically, farm owners have the main responsibility for aid-related administrative
tasks; from the interviewed sample, farm owners account for 83% of the total
time dedicated to aid administration (ranging from 47% in Lithuania to 100%
in Malta and Sweden). The most frequently mentioned activities carried out by
farmers are filling-in aid applications, followed by land measurement. Other
activities include gathering and checking documents, checking data (areas and
crops) and modifying areas.
4.5.4 Estimates of financial costs of administrative burden for farmers
Using the information of the interviews, it was also possible to monetise the
administrative burden for the farmers of the sample. The analysis differentiates
between
internal costs, that is the value of the time spent by farmers, their families and
employees on administrative tasks; and
external costs, i.e. costs for externalised services.
To estimate the internal costs, Eurostat data on the hourly labour cost (hourly
earnings plus non-wage labour costs and 25% overhead) for skilled agricultural and
fishery workers were used. These values were multiplied with the amount of time
indicated by farmers in the survey (see above). During the interviews, farmers
were asked to estimate their external costs in local currency. To allow for
comparison, the costs were then transformed into Euro.
Total costs for CAP related administrative tasks
The total estimated cost of administrative burden ranges from €12.5 in Malta to
€10,308 in Germany133 per year. Overall, the median total costs are €236 per
farmer and year. The highest median values per country are observed in Sweden
and Italy. The lowest median costs are found in Spain and Malta (see figure below).
This estimate combines internal costs (i.e. the monetised time spent by the farmer,
their family and employees) and external costs (i.e. costs for externalised services).
For three quarters of the sample, the estimated total administrative burden is less
than €1,000. For 90% of the sample it is below €2,000. Excluding extreme values,
the average cost related to aid administration is about €220.
133
In this case, the cost mainly come from external services, and it is possible that it includes other services than just the aid
management.

Analysis of administrative burden arising from the CAP
134
Figure 31: Median amount of costs related to IACS aid in €
*Bavaria (DE), Emilia Romagna (IT), Andalusia (ES)
Source: Farmers interviews
As a proportion of total farm costs, the median cost share for CAP-related
administrative burden is estimated at about 0.4%. For about 85% of all interviewed
farmers, administrative burden stemming from the CAP accounts for less than 2%
of total farm costs. Comparing across Member State, the median administrative
burden cost share varies from 0.05% in the Netherlands to 0.7% in Lithuania.
Figure 32 Distribution of observations for the ratio administrative burden / total costs
(%)
Source: Farmer ’interviews
As a proportion of total CAP aid received, the median cost of administrative
burden is estimated at 2%. For around 54% of interviewed farmers, the cost of
administrative burden represents less than 2% of the total aid received. It is below
4% for more than two thirds of all farmers. Situations where the cost of
administrative burden represents more than 10% of the total aid received arise
mostly where farmers declare significant own time for aid administration in
combination with recourse to external support and limited aid received (i.e. less
than a few thousand euros).
Median of 12 MS
0
100
200
300
400
500
600
700
800
900
1000
SE IT* DE* LT PL FR NL EL EE BG MT ES*
Ad
min
istr
ative
bu
rde
n in
€
0%
20%
40%
60%
80%

Analysis of administrative burden arising from the CAP
135
Across countries, the median of the ratio of the cost of administrative to total aid
received varies from 0.3% in Spain to 5.7% in Estonia. Both France and Spain have
significantly lower median values for the ratio of administrative burden costs to aid
received than is observed in other Member States. In France, the relatively low
amount of time spent on administrative tasks for aid applications can be attributed
to electronic aid application systems that are quick to complete, while received aid
amounts are relatively high. In Spain, it is related to the fact that farmers often
receive assistance from their banks for no additional cost (or the cost is included in
the general fees paid to the bank).
Figure 33 Distribution of observations for the ratio administrative burden / total of aid
received (%)
Source Farmer interviews
Adding these costs to the administrative costs of administrations means a rough
total in the range of 5-6% of administrative burden of the CAP. It needs to be noted
however that such an aggregation has to be treated with care given that the
farmers survey is not based on a representative sample, focuses on administrative
burden and not compliance costs and captures overall costs and not only those
emerging from IACS-related measures.
Breakdown of money spend for CAP related administrative tasks
For the internal administrative tasks carried out by the farm owner, family
members, employees, costs of administrative burden range between €8 and
€7,308, with a median of €178. For about 80% of the farmers, the estimated cost
is under €750. Lower internal costs typically arise when administrative tasks are
‘outsourced’ to an external provider and, consequently, the farmer (or other people
working on the farm) has little involvement in the aid administration. As described
before, the burden in terms of hours spent on administrative tasks is greater for
large farms and farms which receive aid under several schemes. This translates into
higher internal administrative burden in absolute terms, but not necessarily as a
share of aid received.
Within the sample, 43% of the farmers use paid external support for aid-related
administrative tasks. This support is frequently provided by cooperatives or
0%
10%
20%
30%
40%
50%
60%
Less than2%
2% to 4% 4% to 6% 6% to 8% 8% to10%
10% to12%
12% to14%
14% to16%
16% to18%
Morethan 18%

Analysis of administrative burden arising from the CAP
136
professional organisations and, to a lesser extent, by banks or other service
providers. Often, such services are covered through membership fees of
cooperatives or included as part of bank charges. Use of external support appears
more prevalent in Italy, Spain and Sweden, where aid applications are rarely done
internally. In Bulgaria, Greece, Lithuania and Poland, more than half of the
interviewees use external support. While external support is used by less than 30%
of interviewed farmers in Malta, France, the Netherlands, Germany and Estonia.
The highest observed costs of administrative burden are usually found for among
farmers that make use of external services provision, though costs of external
services probably also cover services other than aid administration. External
support costs, vary considerably within the sample and range from €4 on average
in Bulgaria to €6,500 in Lithuania.134 Among those farmers using external support,
half pay less than €620 and 72% less than €2,000. Where high costs are observed,
these may be due to additional services, such as administrative support for control,
accounting or bank services, beyond support provided for the CAP aid applications.
Specific cases of high administrative costs are associated to various changes
to parcels and aid systems:
Parcel-related changes include creation of new parcels, transfer of parcel
ownership, or other changes affecting parcel registrations. For the latter, while
digitalisation of registration systems can generate time savings for routine
activities, it can require more effort when implementation of new or revised
registration software is required;
Changes in compliance rules can create additional administrative costs. This is a
reason for some farmers to ask for consistent rules at least throughout a specific
programming period;
A particular irritant for many farmers arises when they are required to repeat or
resupply information that has already been provided; for example, filling in new
forms information that has been previously supplied or re-drawing parcels limits. In
Member States with a highly digitised systems, complaints tend to focus on parcel
limit issues, whereas for Member States with “paper-based” systems, complaints
about fulfilling in forms are more frequent.
4.5.5 Farmers’ perspectives on specific tools and instruments
Farmers’ perspective on LPIS
Although LPIS is free of charge and free applications are provided by national
authorities in some Member States, many related applications and programmes are
supplied on a commercial basis. From the limited information collected from
farmers, the medium cost for such applications is estimated at around €600-€700
per year.
Within the sample of interviewees who responded to the question, a majority of
farmers indicate that LPIS contributes to a reduction of administrative
burden. Nearly two-thirds indicates (‘agree’ or ‘strongly agree’) that LPIS saves
time and/or simplifies their administrative tasks.
134
A higher number of respondents indicated they use outsourcing for a variety of tasks in Lithuania.

Analysis of administrative burden arising from the CAP
137
Figure 34 Perceived benefits of LPIS
Source: Farmer interviews
However, farmers do not appear to utilise the transferability of the information as
much as possible. Only one third of the farmers using LPIS indicate that they use
the information from the system for other digital or manual farm management
applications and tools. Where this is done, LPIS data is usually used for technical
management of parcels (rotation and history, fertilisation management, rearing
management, etc.). Here, farmers appear to rely on software provided by private
companies or professional organisations.
Technical challenges relating to the use of LPIS mentioned by interviewees include,
for example, difficulties in transferring data from one tool to another or the need to
duplicate work. Some farmers indicated that they prefer “the old way” in order to
avoid “mistakes”.135 Several farmers said that they do not use LPIS because other
services (banks or cooperative) do it for them.
Farmers’ perspective on GSAA
Within the sample of interviewees responding to the question, two-thirds of
farmers consider that the GSAA is a useful tool. In Member States where it
has been operating for several years (France, Spain, Germany, Greece, Estonia),
farmers have a very positive opinion of GSAA. In Member States where use of
GSAA is more recent, not widespread, or where it is implemented exclusively by
administrations (Poland, Malta, Lithuania, Bulgaria, the Netherlands), views on its
usefulness are more divided.
Among farmers using the GSAA, there is a close to even split between those
submitting their aid application autonomously and those using external support. In
France, Germany and the Netherlands, most farmers indicate that they do not have
specific difficulties with GSAA and do not need external support. In these countries,
when external support is used it is usually for a final check to make sure that no
mistakes have been made. Sometimes, administrations provide free support but it
is not always available to all farms (e.g. support is reserved to old farmers or
135 In several interviews, farmers expressed their mistrust in digital tools: less control than with ‘paper method’, fear
that in the medium- long term, farm history will not be saved (with the paper note book, all past practices and
decisions are simply recorded and stored, with the digital data, no one knows how much time present hardware and
software will be in use).
0% 10% 20% 30% 40% 50% 60% 70% 80% 90%100%
The system of identification of parcels simplifiesadministrative tasks
The system of identification of parcels saves time
The system of identification of parcels is useful forgeneral management of the farm
The implementation of the system of identificationof parcels is positive overall
Strongly disagree Disagree Neither agree nor disagree Agree Strongly agree

Analysis of administrative burden arising from the CAP
138
smallest farms). In Malta and Bulgaria, administrations provided almost systematic
support for farmers to make their aid applications. In Italy, applicants are always
helped by agricultural advisors, while aid applications in Spain are always made by
an external service provider, either a cooperative or bank, with the cost included in
the membership fees or bank charges. Generally, farmers with limited computer
skills will often prefer to use external support to submit their applications, as will
farmers that want to be sure of the conformity of their applications.
Among interviewees that stated an opinion, two-thirds of farmers consider that
GSAA is ‘user friendly’. In Member States were the tool is widely used, farmers
recognise that improvements have been made since the first implementation of
GSAA and the use of computer forms is preferred to paper applications.
Farmers with a negative opinion, tend to underline that the application is not
intuitive to use and could be improved, thereby reducing learning times.
Furthermore farmers often pointed out that the usefulness of GSAA is hampered by
their limited computer skills and, accordingly, their needs for training and support,
other farmers point to internet connections that make use of the technology very
slow, in particular when approaching the deadline for submitting the application.
Some farmers also mentioned as a ‘technical problem’ the fact that further filling in
of applications can be blocked when a small error is detected. Also, a few
respondents consider it difficult to obtain assistance from the administration when
needed. Finally, some farmers consider that having information in a paper form is a
safer back-up than digital storage.
One specific source of dissatisfaction arises when, in some cases, satellite pictures
give different results for field calculations, which requires reinvestigation by
authorities and farmers and adds to the administrative burden.
Opinions on the impact of GSAA on farm productivity and on the suitability of the
system for all farmers are mixed. Interviewed farmers largely have a positive
opinion on the GSAA compared to the paper system, with the main advantage that
GSAA saves time, in particular due to pre-filled information, and due to the
reactivity of the system when changes or updates have to be made. Many
interviewed farmers also mentioned that GSAA limits the risk of error in relation to
warning systems. Some respondents also point to time savings from reduced travel
needs, while some think that it allows payment to be made more quickly. A further
advantage comes from the possibility for several persons to work on the forms,
while the availability of historical data is also appreciated.
Farmers’ perspective on greening
Findings from the interviews indicate that administrative burden related to
greening mostly stems from compliance with requirements and declaring
EFAs, rather than from submitting an aid application. Almost all farmers that
benefit from exemptions indicate that submitting the aid application for greening
did not result in a higher administrative burden, as it forms part of the application
for direct payment and is automatically informed through the areas declaration.

Analysis of administrative burden arising from the CAP
139
Around 55% of interviewed farmers subject to greening obligations do not identify
additional administrative tasks related to their greening payment. Among them,
many report that is not possible to isolate an extra-cost, as submission is included
in the annual aid application and data (crop, surfaces) are also used for direct
payment calculation. The remaining 45% tend to identify additional tasks linked to
compliance with greening requirements rather than to the aid application itself.
The main compliance requirements mentioned by interviewed farmers include
maintaining permanent grassland and creating ecological focus areas; i.e.
compliance with rules on prohibitions of phytosanitary products and fertilisers,
sowing and ploughing dates in areas declared as EFAs, in particular for catch crops.
Tasks linked to creating an EFA tend to imply a heavy workload in the first year of
implementation of the system but become more systematic and less burdensome
thereafter.
Beyond compliance requirements, the main administrative task mentioned by
farmers is the measurement and declaration of areas corresponding to EFAs. The
complexity of this task depends on the agricultural system; for example, breeding
farms with important permanent grassland seem to have less difficulty to comply
with greening requirements and thus, a more limited administrative burden. In
some cases, during the first year of implementation of greening, farmers were
provided with training (usually for a half-day) by the administration.
Overall, greening is seen as a quite complex scheme, particularly as concerns the
definition and rules applying for EFAs. However, criticisms of greening mainly
relate to the scheme definition rather than to the associated administrative
burden. The objective of the measure is not always well understood and its
environmental value added is sometimes questioned. Moreover, the calculation of
the financial amount corresponding to the greening payment is not well known. In
terms of compliance, requirements for sowing or ploughing dates are considered as
being too rigid, as well as conditions on pesticides and fertilizers use. In some
cases, to be sure to reach the 5% criteria, greening requirements led farmers to
dedicate land to EFAs, by converting it to set-aside.
Concerning aid administration itself, the level of accuracy required for the
declaration of EFAs has been mentioned as an issue, with the introduction of a
tolerance threshold perceived as a good option. Numerous farmers also ask for a
stability of the scheme across the programming period; for example, changes
(increase) to the percentage of EFAs generates additional work for farmers needing
to identify new possibilities on their farms.
Farmers’ perspective on penalties
Findings from the interviews indicate that most farmers consider that penalties
are too high, as mistakes are mostly involuntary and linked to the complexity of
the system. Only half of farmers indicate that they know precisely how their
payments are calculated; although the rate varies between Member States, from
20% in France to over 70% in Italy and Germany. Among reasons for lack of
understanding are: errors in national digital system for payments, the complexity of
certain situations (addition of many measures to be paid and the fact that no
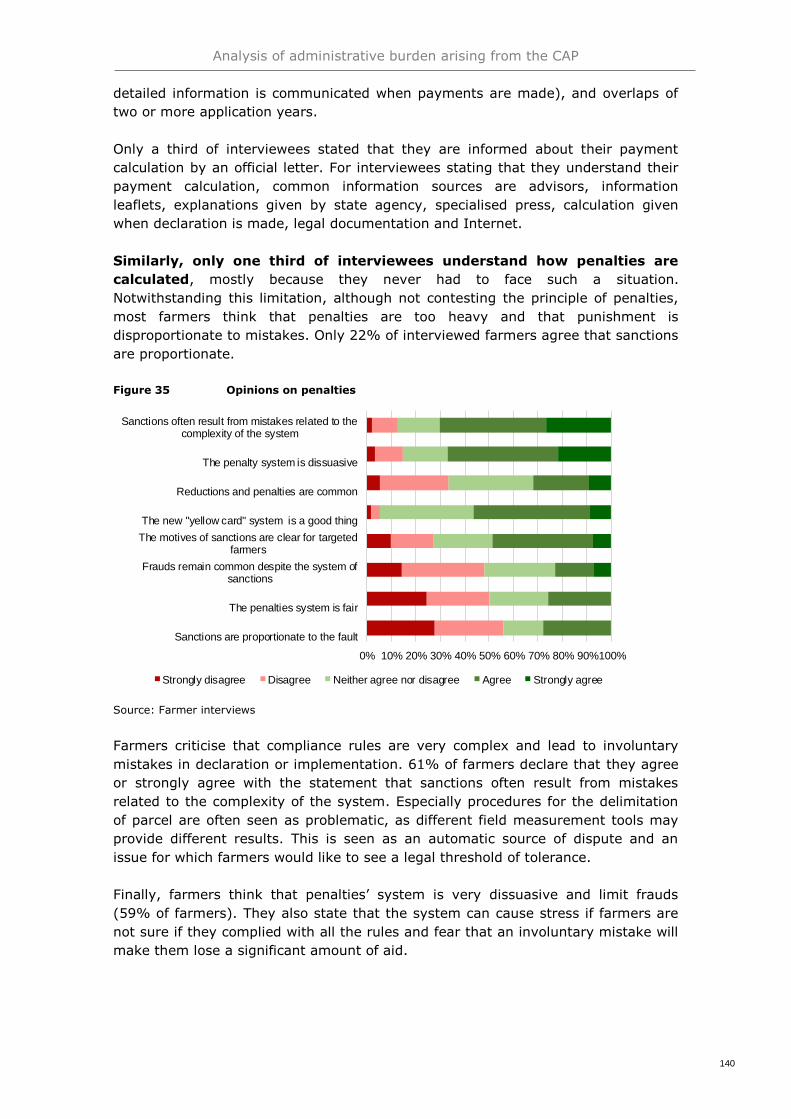
Analysis of administrative burden arising from the CAP
140
detailed information is communicated when payments are made), and overlaps of
two or more application years.
Only a third of interviewees stated that they are informed about their payment
calculation by an official letter. For interviewees stating that they understand their
payment calculation, common information sources are advisors, information
leaflets, explanations given by state agency, specialised press, calculation given
when declaration is made, legal documentation and Internet.
Similarly, only one third of interviewees understand how penalties are
calculated, mostly because they never had to face such a situation.
Notwithstanding this limitation, although not contesting the principle of penalties,
most farmers think that penalties are too heavy and that punishment is
disproportionate to mistakes. Only 22% of interviewed farmers agree that sanctions
are proportionate.
Figure 35 Opinions on penalties
Source: Farmer interviews
Farmers criticise that compliance rules are very complex and lead to involuntary
mistakes in declaration or implementation. 61% of farmers declare that they agree
or strongly agree with the statement that sanctions often result from mistakes
related to the complexity of the system. Especially procedures for the delimitation
of parcel are often seen as problematic, as different field measurement tools may
provide different results. This is seen as an automatic source of dispute and an
issue for which farmers would like to see a legal threshold of tolerance.
Finally, farmers think that penalties’ system is very dissuasive and limit frauds
(59% of farmers). They also state that the system can cause stress if farmers are
not sure if they complied with all the rules and fear that an involuntary mistake will
make them lose a significant amount of aid.
0% 10% 20% 30% 40% 50% 60% 70% 80% 90%100%
Sanctions are proportionate to the fault
The penalties system is fair
Frauds remain common despite the system ofsanctions
The motives of sanctions are clear for targetedfarmers
The new "yellow card" system is a good thing
Reductions and penalties are common
The penalty system is dissuasive
Sanctions often result from mistakes related to thecomplexity of the system
Strongly disagree Disagree Neither agree nor disagree Agree Strongly agree

Analysis of administrative burden arising from the CAP
141
Changes in administrative burden by 2013 CAP reform
Findings from the interviews indicate that only a minority of farmers think that
the administrative burden has decreased since 2015, with new rules and new
requirements (greening, cross-compliance) contributing to a greater burden in
many cases. Overall, a large majority of farmers indicate that there has either been
no change or an increase in administrative burden. However, as shown in the figure
below, there is substantial variation in the balance of responses across Member
States.
Table 21: Answers to the question “How has the administrative burden related to direct
payments and IACS-based rural development measures evolved since 2015?”
Source: Farmer interviews
The main elements that are considered to have increased the administrative burden
on farmers are:
New rules and requirements, both in general and in particular for greening,
cross-compliance and insurance applications: it takes time for the new rules to
be assimilated by the administration and then by farmers; new rules are
perceived as creating increased complexity, especially when the administration
itself does not seem to fully understand them;
More paperwork, despite the development of IT tools as more documents are
required for administrative checks and OTSC;
Delays in payments;
Increased quantity and accuracy of data requirements; in particular for
land measurement.
Conversely, where farmers identify improvements, they link these to enhanced
online application systems.
0%
10%
20%
30%
40%
50%
60%
70%
80%
90%
100%
EL SE BG MT EE FR NL ES* LT DE* PL IT*
Less Burdensome No change More Burdensome

Analysis of administrative burden arising from the CAP
142
4.5.6 Future CAP and opportunities to reduce administrative burdens
The analysis shows that on average the administrative burden for farmers, in
terms of time spent and costs, remain at reasonable levels. However, there are
specific situations where they can be disproportionately high compared to the
amount of aid received. More specifically, the system is efficient when:
The farming system is simple;
Parcels boundaries do not raise issues (e.g. overlaps with neighbours, difficulties
to precisely identify the limits due to specific landscape characteristics,
fragmented parcels, etc.);
The farm benefits from a limited number of CAP measures, especially under the
Pillar II;
There is no change to declare; and
The relationship with the administration is good.
It can become more burdensome for farmers when:
Parcels limits are complicated or when they change;
The farming system is complex;
The farm benefits from various aid schemes;
The farm is small;
The relationship with the paying agency has deteriorated.
There are opportunities during the development and implementation of the future
CAP to address some of the administrative burden issues identified from the survey
of farmers and wider study:
Tailoring Solutions to Farmers’ Needs
Administrative burden depends on several factors, and there is not one solution
which will reduce the burden for all farmers. Rather, a tailored approach is
necessary which is reflective of the differences across farmers, farm holdings, and
types of administrations.
Dependent on the Member State or region this could require authorities to
undertake or refresh segmentation analysis of the beneficiaries so that solutions
can be tailored to their needs. This could be performed on the basis of the size of
the holdings, the complexity of holdings (livestock, arable, permanent crops,
mixed), the number and the types of schemes as well as the payment value. The
analysis has highlighted that all of these factors affect the administrative burden for
farmers. In addition, solutions will vary for beneficiaries, more exactly for
those making direct electronic applications (including those using technological
aids or farm software for other parts of their business),
those using agents or other intermediary bodies to submit their claims
electronically, and
those who need assistance to submit their claims or submit them on paper
forms.

Analysis of administrative burden arising from the CAP
143
The analysis identified several key areas of considerations for Member States:
There is a significant variation in the levels of electronic uptake between Member
States. In some instances all key transactions are managed electronically, whilst
in other cases take up is extremely low (less than 1%). Supporting the farming
population sufficiently could require structural and infrastructure improvements,
such as improving the access to broadband services in remote rural areas;
The cost for this external support is a major variable that need to be factored
into the solutions Member States provide. We found that costs ranges from an
average of €4 to €6 500 between the Member States surveyed. Half of the
farmers pay less than €620 for this service, but costs were more than 10 times
higher for individual cases. The variability observed is mainly due to the scope of
the support contract concerned. Member States will need to reflect whether
beneficiaries will perform tasks themselves or if they opt for options to outsource
administrative tasks;
The level of local physical support for farmers in managing transactions and
applications can act as a disincentive to using electronic tools. For instance,
some Member States provide “Front Office” facilities to farmers. While these
offices present an easy access-point for farmers to receive or communicate
information, they can also present an obstacle to the development of more
advances online tools;
Each solution should have a tailored advice and support service to farmers
which should include support on filling in applications, regulatory and
interpretational guidance and mapping changes. Member States will need to
recognise that some of the opportunities presented by technology such as fewer
physical OTSC may reduce the opportunities for farmers to have face to face
dialogue on rule interpretation and other issues. Training and support will need to
be enhanced for those with limited computer skills to encourage greater electronic
enablement and use of innovations such as GSAA. Technology also allows new
opportunities to reach and educate, such as interactive on-line tools and videos.
Use of Technology Enhancements
For those farmers and beneficiaries that have direct or indirect access to electronic
services, there are a range of measures that should be encouraged and used to
reduce the administrative burden for farmers:
GSAA
GSAA provides several attractive features for farmers, including on-line crosschecks
with paying agency databases and instant anomaly warnings. These features can
help to reduce mistakes in declarations. It also reduces the number of errors and
checks paying agencies need to perform between receipt of the application and the
payment. Therefore, GSAA has the potential to speed up the whole payments
process. GSAA could also reduce travel time and allows several people to work on
one application or to update data.
Analysis of administrative burden arising from the CAP
144
Sentinel and other remote inspection and monitoring tools
Physical OTSC and other controls add burden on farmers who need to be present.
In the future, a greater share of controls could be performed remotely. In-person
inspections could then focus on specific anomalies rather than more general and
comprehensive checks. This in turn would reduce the burden for farmers and most
likely also for authorities.
The move to a monitoring approach however and the frequency with which Member
States receive, interpret and update changes in land use will make changes in
control data on farms far more dynamic than some farmers are familiar. Member
States will need to train and support farmers in the consequence of the move to
monitoring systems and clarify the obligations for farmers to minimise any
administrative burden in the transition period.
Geo-tagging
Geo-tagging provides for an effective means to reduce the burden on farmers
from physical controls. It allows to clarify eligibility anomalies under controlled
conditions without the need for a field inspection. It is also a value-added
supplementary route to provide secondary information for certain crops or schemes
such as details of seed labels. However, its use is not without challenges. Technical
capacity needs to be stepped up to provide an authoritative set of images that can
be used to assure the accuracy of control or declared areas. This may limit its
usefulness in some Member States where technology skills are not yet sufficiently
developed. Again, Member States and paying agencies will need to invest time and
effort to provide help and support so that benefits can be realised.
Integrated farm technology
Member States and paying agencies collect and maintain a significant amount of
spatial and other data which they primarily use for control and monitoring
purposes. The amount of data is likely to increase in future as monitoring systems
will be embedded and new schemes established. These data have the potential to
provide added value to farmers if made available. For example, in areas such
as precision farming these data could help farmers obtain information they may be
unable to source by other means or only at significant cost.
Some farmers expressed frustration that while control data are available, it is
often too difficult to transfer these to other applications. For instance, only a
third of LPIS users use the system to feed other digital applications used in farm
management (or manual management tools). Others were able to access software
solutions which make use of LPIS data to manage parcels (e.g. rotation and history,
fertilisation management, rearing management, etc.). These tools are developed by
private companies or national professional organisations. The limited information
collected from farmers show that the medium cost of these services is around
€600-€700 per year. In some Member States, free applications are provided by
national authorities.
To maximise the potential benefits for farmers, Member States should seek
opportunities to provide access to data where possible. They should work with
farmers, third parties and commercial companies to ensure that farmers can obtain

Analysis of administrative burden arising from the CAP
145
and integrate these data into wider farm management solutions as cost-effectively
as possible.
Procedural and Administrative Enhancements
The forthcoming reforms introduce the potential to reduce the administrative
burden on farmers. These opportunities can arise either from the new regulations
itself, or from Member States adapting their national procedures and policies. The
national approach will become even more important. The move towards national
Strategic Plans places greater responsibility on Member States to define appropriate
monitoring, control and administrative systems and processes. The Strategic Plan
requirement also obliges Member States to explicitly identify the steps and
measures they aim to take to simplify the rules and to reduce administrative
burden for beneficiaries. The following sections explore options how to further
enhance the procedural aspects.
Preventive approach
There has been a move from a detective control approach to more preventative
control approach. Farmers are encouraged and assisted to get their applications
right before submission or adhere to control deadlines. This approach needs further
development to help farmers avoid penalties and delays.
The study found that several Member States adopted an approach where farmers
were encouraged or required to update and confirm key data on an on-going
basis. This reduces the amount of anomalies found and the effort required to
manage these. As control data gets updated more frequently, the level of in-year
change will increase. This further emphasises the benefits for farmers who will be
able to access and manage their holding data on an on-going basis rather than in
the relatively short timeframe of applications.
Member States have established alert systems to notify farmers by e-mail or text
when they have deadlines approaching if farmers did not demonstrate compliance.
For instance, one Member State contacts farmers two weeks before a mowing
deadline to remind them, using spatial information to locate the areas concerned.
The stated aim of the Member state is to expand this feature to crop group
identification and to explore other potential uses, including the detection of nitrogen
fixing crops and cultivated fallow land.
Payment Transparency
Farmers interviewed appear to have a limited understanding on the level of
penalties and their rationale. In addition, the overall calculation of the value of
payments was also not fully clear to many farmers. Calculations are often complex
and require clear explanation. An overall Direct Payment can be composed of
several elements from different schemes, each with their own penalty calculations.
Rates of aid and entitlement values dynamically changed each year in a number of
instances. Elements of this (such as a greater application of the use of payment
capping and redistribution of funds) will persist in future. Member states should
ensure that their technical solutions and approaches allow easy access for farmers
and that that calculations and any penalties are clearly explained and easily
understood.

Analysis of administrative burden arising from the CAP
146
Simplification of Proposals and Applications for Funds
Both the interviews with farmers and the study identified opportunities to reduce
administrative burden for farmers by simplifying proposals and applications for
funds:
Farmers identified the application for IACS Rural Development Measures as
the most burdensome. In particular, the process to initially access and have
multi-annual measures and commitments approved account for around 80% of the
total administrative burden measured. Member States should target this as an area
for simplification in their Strategic Plans.
Member States that integrated annual IACS aid and payment claims into a single
application process showed greater efficiency and administrative benefits for
farmers. Member States should seek opportunities to minimise the amount of
duplication that farmers have to undertake when making their applications and
claims.
Regulatory Enhancements
Similar to procedural enhancements, the analysis points towards regulatory
enhancements that could reduce the administrative burden for farmers.
Stability of Rules and Transitional Measures
Farmers provided clear feedback that there was a greater burden upon them as
a consequence of the frequent changes of the rules of the CAP. The
interviewed farmers also note that the rules are regularly adjusted throughout each
programming period. This may be due to regulatory changes, but could also result
from clearer or revised interpretations of requirements by Member States.
Nevertheless, changing rules after few months or few years of implementation are
a cost driver and increase the administrative burden for farmers. The objective
should be to keep the regulatory framework as stable as possible through the
programming period and to reflect on the potential additional administrative burden
of changes if these are necessary.
Transitional measures could help to reduce the administrative burden for
farmers. Farmers often suffer from a (in their view rushed) implementation of
major regulatory changes within short timeframes. This results in imperfect or
delayed IT solutions, incorrect or delayed payments. The introduction of the
forthcoming changes involve significant scheme changes and a change in approach,
where Strategic Plans delegate more competences to Member States. These
changes should be introduced over a timeframe providing administrators and
farmers with sufficient time to prepare. Suitable transitional measures should be
put in place to ensure that farmers continue to get legitimate access to payments in
the meantime.
Clarity of Regulatory Changes
The study highlighted issues where different CAP measures might be
overlapping or incoherent (e.g. AEC measure, greening and cross-compliance).
This creates a risk for double funding, increases “grey zones” and raises confusion
among farmers and beneficiaries. Avoiding these overlaps and inconsistencies could
enhance clarity and reduce administrative burden. The reforms propose a modified
Analysis of administrative burden arising from the CAP
147
approach to the current regime where cross-compliance and elements of greening
are combined under “conditionality”. In addition, a new ECO-scheme is introduced
to be tailored by each Member State and the IACS-related Rural Development
Measures are largely retained. There is a risk that these arrangements will
perpetuate or even increase the described issues for farmers. It is important that
farmers are provided with clear opportunities and obligations to ensure this risk is
avoided.
Farmers criticised that the stacking of different rules related to CAP instruments
and the lack of transparency in controls increase complexity and the risk for
penalties. Many of the responses in the interviews indicate that the burden related
to Greening is considered to be disproportionate to its environmental impacts.
Specific reference is made to the definition of Permanent Grassland and the
Ecological Focus Areas. Farmers expressed their opinion on opportunities for
simplification. They ask for more flexibility when implementing environmental
measures and in a more results-based approach, which has the potential of being
more effective.
Regulatory Simplifications and Tolerances
The study identified simplification opportunities to reduce the administrative
burden on farmers whilst taking a proportionate view of overall risk to EU funds.
These include:
The introduction of de minimis levels of up to 100 m2 per ineligible feature;
Enhanced use of permitted tolerances around the levels of precision required;
Further development of the use of the “yellow card” system, a more
proportionate and simpler penalty regime;
Potential aid threshold below which requirements for farmers controls are
simplified.
Farmers expressed concerns that complex, incomplete or ambiguous national
legislation can lead to inefficiencies and confusion. This translates in significant time
losses to interpret and understand requirements and can lead to higher error rates.
Opportunities to address these issues include the following:
A discretionary timing and of payment claim deadlines and penalties at Member
State level, rather than centrally legislated;
A more flexible scheme calendar: strict deadlines can significantly increase the
burden to implement and perform controls without contributing to the reliability
of the system;
Greater use of flat rates within Rural Development Measures through flat rates;
Greater reliance upon or use of national or private certification organisation by
Member States either to access confirmation of eligibility, such as organic
schemes, or as alternatives to inspection where these bodies perform similar
assurance checks for their own purposes.
Impact of Proposed Regulatory Changes on Administrative Burden on Farmers
Elements of the proposed regulatory changes have the potential to have a
significant impact on the administrative burden placed on farmers in the future:
The potential for Member States not to use payments entitlements. This could
greatly reduce the administrative burden for farmers who have to manage their
entitlements and have to report entitlement transfers to other farmers;

Analysis of administrative burden arising from the CAP
148
Several proposals could increase administrative burden, such as rules on “genuine
farmers” and the proposals for payment reductions. This would translate into
additional proof of eligibility or the manual reduction of payments based on
complex criteria.
Analysis of administrative burden arising from the CAP
149
5 Conclusions and recommendations
Considerable efforts to simplify the CAP have been made over the past decades and
will continue in the years to come. These have included policy level initiatives
through the amendments made as part of the Omnibus Regulation in 2018. At a
technical level, Member States are also working together to share best practice
experiences and identify opportunities for simplification and modernisation; for
example, through the CAP “Learning Network” or regular conferences such as
“Panta Rhei” for IT. The application of ICT solutions and the use of advanced GIS
tools offer great potential for simplifying CAP systems and procedures and, thereby,
reducing the administrative burden for both administrations (Managing and Paying
Agencies) and beneficiaries. Administrative burden will also be affected by the
introduction of new interventions as well as the move towards a more results-based
policy. Similarly, the increased flexibility and responsibility given to Member States
will have implications for the future costs of managing and controlling CAP
expenditures.
The following sections provide the key findings from this study including their
implications for future policy as well as the overall conclusions
5.1 Key findings and implications for future policy
Overall, 94% of expenditures under the European Agricultural Guarantee Fund
(EAGF) and 53% of expenditures under the European Agricultural Fund for Rural
Development (EAFRD) are subject to IACS system and cross-compliance controls.
For Member States’ competent authorities, total annual administrative costs of
IACS are estimated at between €1.7bn and €1.9bn, corresponding to 3% – 3.3% of
the CAP budget or 3.5% - 3.9% of IACS managed CAP budget. Compared to other
funds, the administrative cost of CAP is below the overall rate for European
Structural and Investment Funds (ESIF), which are estimated at 4% of the public
expenditures. It is also below the administrative costs of the EU, which represent
around 6% of the total EU budget. Within this amount, 14% is attributed to
annualised set-up costs136, 12% to running costs, and 74% to management and
control costs.
For the EU as a whole, the average annual cost of IACS administration is estimated
at €10 per hectare of Utilised Agricultural Area, with a range across Member States
from €2 to €200 per hectare. Administrative costs per hectare of UAA are
particularly high for small MS.
When compared to the previous programming period, and excluding set-up costs,
IACS-related administrative costs are estimated to have increased by one third;
with a range at the level of Member States from an increase of 15% to as much as
60%.
136 Corresponding to total cumulative set-up costs over a seven-year period divided by seven.
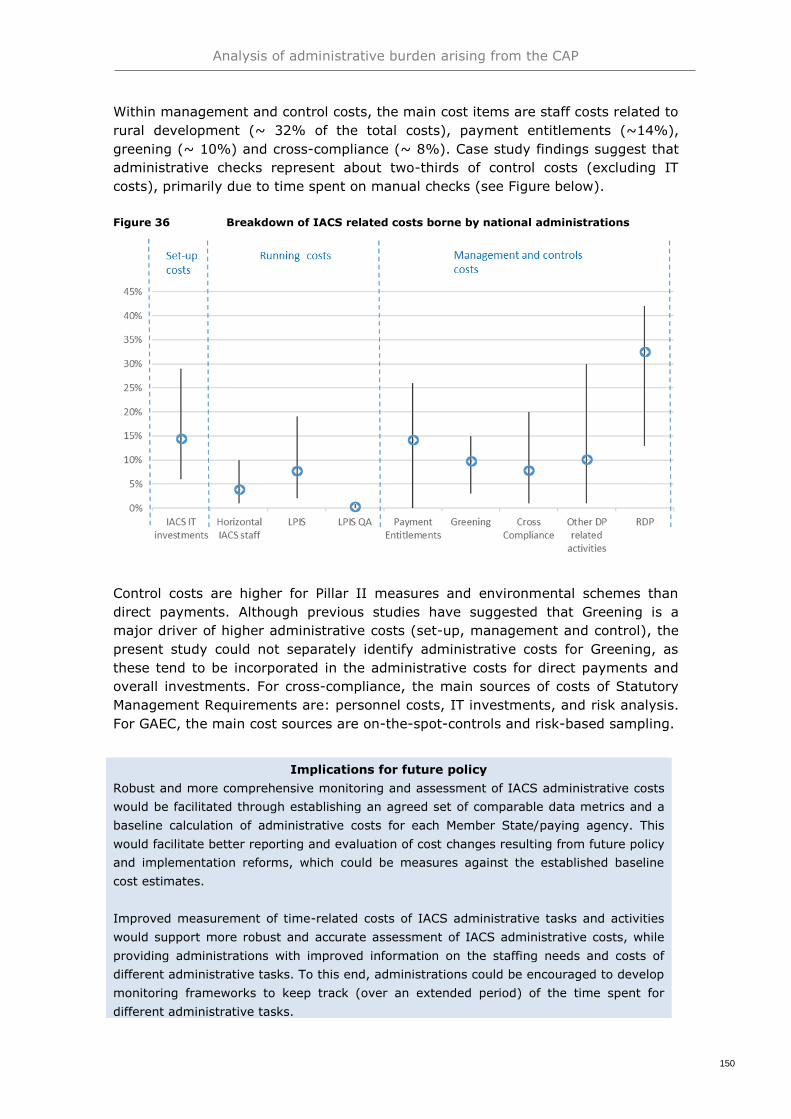
Analysis of administrative burden arising from the CAP
150
Within management and control costs, the main cost items are staff costs related to
rural development (~ 32% of the total costs), payment entitlements (~14%),
greening (~ 10%) and cross-compliance (~ 8%). Case study findings suggest that
administrative checks represent about two-thirds of control costs (excluding IT
costs), primarily due to time spent on manual checks (see Figure below).
Figure 36 Breakdown of IACS related costs borne by national administrations
Control costs are higher for Pillar II measures and environmental schemes than
direct payments. Although previous studies have suggested that Greening is a
major driver of higher administrative costs (set-up, management and control), the
present study could not separately identify administrative costs for Greening, as
these tend to be incorporated in the administrative costs for direct payments and
overall investments. For cross-compliance, the main sources of costs of Statutory
Management Requirements are: personnel costs, IT investments, and risk analysis.
For GAEC, the main cost sources are on-the-spot-controls and risk-based sampling.
Implications for future policy
Robust and more comprehensive monitoring and assessment of IACS administrative costs
would be facilitated through establishing an agreed set of comparable data metrics and a
baseline calculation of administrative costs for each Member State/paying agency. This
would facilitate better reporting and evaluation of cost changes resulting from future policy
and implementation reforms, which could be measures against the established baseline
cost estimates.
Improved measurement of time-related costs of IACS administrative tasks and activities
would support more robust and accurate assessment of IACS administrative costs, while
providing administrations with improved information on the staffing needs and costs of
different administrative tasks. To this end, administrations could be encouraged to develop
monitoring frameworks to keep track (over an extended period) of the time spent for
different administrative tasks.

Analysis of administrative burden arising from the CAP
151
Institutional arrangements from Member States (centralised operational model with
a single paying agency or regional model) have a significant impact on the
administrative costs of IACS. To the extent that a decentralised model inhibits
economies of scale or raises transaction costs (e.g. through less cost-effective and
more burdensome administrative structures and processes) it can introduce
additional overhead costs.
Choices over information technology solutions and systems architecture are another
area with an important bearing on administrative costs. When faced by major
reforms, both the level of integration and the modernity of IT systems affect the
speed and cost of development and adaptation of administrative systems. Member
States covered by the study reported development cycles of between one and four
years, with an average of three years for implementing changes to meet the
requirement of the CAP reforms. Using packaged solutions can have the advantage
of sharing the costs of development, reducing and simplifying integration
development and testing costs. However, there is a risk in exposing administration
to high costs and managerial challenges by introducing major changes to IT when
CAP reforms are being discussed.
The study finds that establishing an IT module for registering payment entitlements
did not pose any particular difficulties for Member States, which were often able to
adapt existing IT systems. The main sources of difficulties have come from the
initial allocation of entitlements and the ex-ante determination of eligible area.
Some Member States also struggled with the technical definition and assessment of
eligibility of active farmers, young farmers and new entrants, as well as the
validation of land for the national reserve.
The study finds that a variety of set-up factors affect the cost structure of Member
States, ranging from geographic considerations (e.g. mountainous areas), historical
factors (e.g. continuity of funding), structural conditions (e.g. regionalisation),
technological advancements (e.g. adoption of GSAA) to political ambitions (e.g.
environmental conditions). Particularly the latter combined with flexibility in the
interpretation of legal prescriptions, fears of auditors and lack of alignment between
stakeholders lead to what is often interpreted as gold-plating. Concrete examples of
gold-plating could however not be quantified in this study as it is often the outcome
of intentional choices with expected benefits (and can as such not be declared
Undertaking an ex ante assessment of the task requirements – i.e. new tasks and changes
to existing tasks – for implementing changes resulting from legislative reforms could
support better assessment of their cost impact, and help to identify areas where new rules
impose significant additional administrative burden, and where it may be appropriate to
assess options that could deliver a better balance between costs and benefits of changes
to legislation.
Implications for future policy
MS should be encouraged to share best practice around system development lifecycles and
innovative approaches that have the potential to speed up IT delivery times and reduce
administrative burdens. Member States should carefully assess the impacts of IT changes
with respect to major regulatory change. Panta Rhei is an appropriate forum for this.

Analysis of administrative burden arising from the CAP
152
“unnecessary”) or overcompensated by other implementation decisions. A particular
role therein plays the adoption of technologies (including technological uptake).
Excluding compliance cost related to the implementation of CAP measures, the
estimated burden of CAP administrative requirements for farmers corresponds to
about 2% of total of aid received. Contrary to administrations, most farmers do not
report a substantial increase in their administrative burden due to the rules and
new requirements (greening, cross-compliance) introduced by the CAP 2013
reform. For farmers, compliance with greening regulation generates greater costs
than the administrative burden from submitting their aid applications. In those
Member States with experience of GSAA, the system is considered as a useful tool
for farmers that provides time savings compared to a paper system. The
administrative burden for farms is higher when several applications need to be
made, particularly where Pillar II applications are involved, and when the farm has
complex land plots requiring extra effort to check and/or modify pre-filled land
areas.
The study finds that changes aimed at simplifying obligations on farmers can
sometimes lead to additional administration costs for Member States needing to
adapt IT systems (e.g. yellow card). For the administration, the retrospective
element is considered particularly difficult to implement. Also, Member States
indicate the they frequently find it necessary to initiate developments of their IT
systems based on assumptions made in advance of regulations being agreed, which
can necessitate subsequent adaptation causing implementation delays.
Both administrations and farmers view the LPIS as an important tool for reducing
administrative burden. LPIS quality has improved greatly since its inception, mostly
due to technological advances in aerial photography such as higher resolution
images and more frequent acquisition. Similarly, the LPIS QA is seen as a positive
influence on overall quality and accuracy. Of the LPIS models in use, the
Agricultural Parcel (single crop) and the Farmer’s Block are regarded as the most
effective for administrative checks due to the tighter delineation of eligible land and
the direct link to a particular beneficiary. However, in terms of administrative
maintenance cost and efficiency, the Physical Block system is more stable, with
faster and cheaper update requirements.
The GSAA system can substantially improve cost-effectiveness at national/regional
level, bringing benefits in terms of time saving and better information quality,
providing stable information at farm and land parcel level. The cost savings due to
GSAA vary between Member States depending on the timing of its introduction.
Compared to Member States with GSAA in place for several years, costs of controls
are about 50% higher in Member States that have only recently implemented
GSAA. Given that the majority of Member States are recent adopter, the full
Implications for future policy
Continued engagement with and among Member States is important to identify cost-efficient
approaches for implementing CAP regulations and reforms. Consideration should also be
given to the length of development cycles for the IACS IT system, and the IACS annual
cycle, to ensure that IT systems can be developed and/or adapted in time to meet the entry
into force of new legislative provisions.
Analysis of administrative burden arising from the CAP
153
benefits of GSAA are not yet visible. Nevertheless, there appears to be a general
consensus that GSAA reduces errors in aid applications, increases the uptake of
electronic applications, reduces digitisation costs, and reduces administrative and
on-the-spot controls.
Practical use, together with pilots and evaluations, has shown the impact of
Sentinel monitoring systems in reducing administrative burden, including: the
potential to simplify the annual claims process, increased accuracy and
simplification of farmers’ aid application, with the opportunity to replace on-the-
spot checks, which are required to cover 5%137 of applications”. The introduction of
Sentinel monitoring poses some challenges: monitoring via satellites may require
significant additional specialised labour; Sentinel is unlikely to fully replace other
forms of imagery used to accurately validate parcel boundaries and features,
particularly parcels of less than 0.5 ha, which could create additional administrative
costs. Sentinel is most likely to be cost-effective for Member States with large
numbers of farmers and corresponding high volumes of checks.
Spatial software tools used in tandem with Sentinel imagery use probability
assessments where land changes are flagged as potential anomalies often using
“traffic light” coding. The higher the level of probability required then the greater
the number of potential anomalies that may require follow up or investigation. This
in turn can drive up administrative costs and burdens for both administrations and
farmers.
Geotagging technology is seen as a promising addition to the tools for spatial and
technical monitoring, providing an effective means to monitor areas that are not
fully covered by imagery and for validating crop types and features, while providing
administrative savings for farmers. However, challenges exist, such as the technical
skill needed by farmers, and ensuring that technology applications are tamper-
proof. Benefits arising from the use of drones are seen to be more marginal, with
their most realistic use being for targeted campaigns on specific areas where
physical access is difficult for traditional on-the-spot controls. Drones are
considered less cost-effective than other technologies (e.g. geotagging, Sentinel,
robotics) and they face legal and privacy limitations. Robots can be usefully
deployed to check calculations and evaluate applications; a robot can handle a daily
workload of 6 employees evaluating more than 400 applications.
137
Lower control rates are permissible in certain circumstances - in accordance with Article 36 of Regulations 809/2014
Implications for future policy
To derive the benefits of monitoring and investment in spatial software tools, probability
levels for the investigation of anomalies by field visits or other means should be set at
proportionate levels between the cost-effectiveness of the control and providing assurance
to the fund
Implications for future policy
Member States should examine the cost-benefit opportunities presented through
the integration and optimisation of new technologies in the administration and
control systems.

Analysis of administrative burden arising from the CAP
154
To incorporate results-based RD schemes, IACSs need to be expanded to enable
access and cross-checking of secondary databases, which may be managed by
other state bodies. This requires developing new solutions fitting to new measures,
and providing new interfaces to external data sources required for independent
validation, which may not be available in a format suitable for performing
automated checks. Where this is not possible, manual administrative checks and/or
physical validation in the field will still be required to confirm results. Feedback
from organisations that have trialled result-based approaches or are considering
them indicates that implementation of ambitious result-based schemes may be
difficult. In particular, results-based measurement requires solid indicators
(accuracy, reliability, precision, timeliness etc.) that can be difficult obtain for
aspects such as water pollution, carbon storage, etc.
The study included a wider survey of Member States that was conducted in
September 2018. The survey revealed high levels of uncertainty about the possible
administrative burden of the CAP post 2020. The following points were highlighted
by the survey:
System development and set-up of new systems will most likely continue to
place an important burden to administrations. There are concerns over high
development costs necessary to establish adequate monitoring systems, which
are likely to be additional rather than replacement systems. There is also
concern about the costs of transition from old to new rules and control systems;
The CAP post 2020 is expected to lead to additional data collection requirements
for information that is not currently being captured; for example, data collection
will be required for the set-up of Farm Sustainability Tool for Nutrients or Eco-
Schemes;
Accompanying the proposed new conditionality requirements, several Member
States anticipate a shift in the balance of administrative costs away from
Greening towards cross-compliance, with GAEC taking up slightly more of the
administrative burden than SMR. In addition, if current exemptions on controls
for small holdings are abandoned, this would significantly increase the costs of
controls of the new conditionality requirements for recipients of direct payments
and rural development measures, which would cover a greater number of
farmers.
The proposals covering payment reductions and “genuine farmers” could create
additional administrative burdens, particularly due to taking into account
salaries, labour costs and incomes in the implementation of these provisions.
Collating and maintaining a database of individual salary and labour cost
calculations could be administratively burdensome for some MS;
There are concerns that the inclusion of conditionality rules and eco-schemes will
potentially increase compliance costs for farmers.
Implications for future policy
When designing CAP strategic plans, Member States should be encouraged to take account
of the technical and information requirements for monitoring of results-based
interventions, including estimation of the associated administrative costs. These estimated
costs should be included in the overall assessment of the cost effectiveness of proposed
interventions.

Analysis of administrative burden arising from the CAP
155
Overall, Member State recommendations concerning opportunities to reduce
administrative burden are consistent with the approach envisaged for the CAP post
2020; for example, greater use of monitoring techniques and other technologies to
allow a reduction of traditional inspections. For policy evaluation and environmental
monitoring, the proposal for the CAP post 2020 includes possibilities for the re-use
the information managed in the IACS system.
5.2 Overall conclusions
This study offers the first attempt to measure and gather evidence on the costs
related to the implementation of IACS following the CAP 2013 reform. There are
four key lessons learned from this analysis:
Overall, the CAP 2013 reform led to an increase of the administrative
burden on administrations (managing authorities and paying agencies).
This has however, helped to avoid a significant increase of the burden
on beneficiaries. For the administrations, the total annual administrative costs
of IACS are estimated to represent around 3% of the CAP budget. For farmers,
the share of the administrative burden (without compliance costs) corresponds
to about 2% internal costs and 3% if including external costs out of the total aid
received. Adding up all administrative cost estimates would lead to a rough total
in the range of 5-6% of administrative burden of the CAP. It needs to be noted
however that such an aggregation has to be treated with care given that the
farmers survey is not based on a representative sample, focuses on
administrative burden and not compliance costs and captures overall costs and
not only those emerging from IACS-related measures;
There is considerable variation in the costs between Member States. The
cost drivers can vary depending on governance structures and scale (territory
covered);
Increased automation, digitalisation, and the use of new technologies for
management and controls of the CAP are not only expected to create
benefits for the future but have proven to do so already. The use of
digitisation, GSAA or LPIS is shown to be a key factor in mitigating a further
increase in administration costs. Nevertheless, there are concerns that the CAP
post 2020 might not decrease the burden for administration and farmers;
Finally, the study reveals that there is limited availability and
inconsistency of data on administrative costs related to CAP
implementation. The reduction of the administrative burden of the CAP has
been a priority for many years and one would expect a good knowledge base on
the topic. The EC has already taken actions to collect information on a regular
basis, particularly through the annual survey on costs of controls. This survey,
however, focuses only on the costs of measures and does not collect evidence on
the drivers of these costs.

Analysis of administrative burden arising from the CAP
156
Four main recommendations are drawn from these lessons:
Member States should consider the administrative cost implications of CAP
post 2020 interventions. Administrative costs assessment should be integrated
in Member States’ CAP strategic plans. According to article 95(1) of the proposed
Regulation138, each CAP strategic plans should include “a description of the
elements related to simplification and reduced administrative burden for final
beneficiaries.” The results from the present study demonstrate that the
administrative burden of final beneficiaries is interconnected to the administrative
costs of the competent authorities. It is thus recommended to consider both the
public sector and the final beneficiaries in this section of the CAP strategic plans.
The section should also describe the strategy proposed to collect evidence on the
evolution of the two costs over time.
Member States should seize the opportunity offered by the proposed CAP
reforms to reduce the administrative burden on farmers. In the short term,
the EC should encourage knowledge exchange and capacity building to support
Member States’ efforts to reduce the administrative burden of the CAP. Areas
where Member States could work to enhance support and engagement with farmers
could include:
Undertaking or refreshing segmentation analysis of their beneficiaries so that
solutions can be tailored to their needs (e.g. segmented by size of holding,
complexity or level of technical enablement);
Offering tailored advice and support service to farmers, which should include
support for filling in applications, regulatory and interpretational guidance, and
mapping changes;
Supporting beneficiaries (and their agents) with guidance around more proactive
management and resolution of anomalies and the interaction between data from
monitoring and their geo-spatial aid applications. They may also need to be
trained/guided in the use of geotagging where systems allow this type of
submission;
Using opportunities to provide open access to data, where possible. Member
States should work with farmers, third parties and commercial companies to
ensure that farmers can obtain and integrate these data into wider farm
management solutions as cost-effectively as possible;
Moving from a detective to a more preventative control approach. Before
submission, farmers should be assisted to correctly complete their applications
by encouraging or requiring them to update and confirm key data on an on-
going basis rather than just at the time of application;
Establishing alert systems (e.g. email or text messaging) to notify farmers when
deadlines are approaching, and farmers have yet to demonstrate compliance;
Ensuring that technical solutions and approaches are easy for farmers to access
and that payment calculations and any penalties are clearly explained and easily
understood;
138
COM(2018) 392 final - Proposal for a REGULATION OF THE EUROPEAN PARLIAMENT AND OF THE COUNCIL establishing
rules on support for strategic plans to be drawn up by Member States under the Common agricultural policy (CAP Strategic Plans)
and financed by the European Agricultural Guarantee Fund (EAGF) and by the European Agricultural Fund for Rural Development
(EAFRD) and repealing Regulation (EU) No 1305/2013 of the European Parliament and of the Council and Regulation (EU) No
1307/2013 of the European Parliament and of the Council
Analysis of administrative burden arising from the CAP
157
Using opportunities to minimise duplication of activities and information
provision by farmers when making applications and claims.
The use of technology should be encouraged as it has a positive influence
on the mitigation and/or reduction of the administrative costs. In particular,
the adoption of innovations related to Sentinel, geotagging and spatial software
capable of automatically interpreting land use and landscape features should be
supported. Further development and enhancement of the GSAA also has the
potential to reduce administrative burden.
Using new technologies allows a move from a traditional IACS approach of
sequential compliance control followed by penalties to continuous monitoring that
can proactively provide warnings at application stage and throughout the season to
prevent unintended non-compliance.
The combination of Sentinel satellite imagery, spatial software capable of analysis
and assessing the eligibility of features and land uses based upon probability
assessments and geotagged photography under controlled conditions together
present the opportunity to minimise the need for traditional on-the-spot controls:
The move to monitoring introduces significant cultural and business process
change for administrations especially during the transition from the use of
imagery updates provided cyclically over a period of up to three years (which will
need to continue in tandem for boundaries and other areas of eligibility) to
provide continuous monitoring. This is likely to produce short-term spikes in
activity which will need to be managed and will require a different approach once
this transition has been achieved.
Those Member States that have systems designed to allow or to require
beneficiaries to update details of their holding on a continuous basis are likely to
have a smoother transition and less cultural change to manage than those systems
that deal with most changes as part of annual aid application submissions. Key
areas for consideration in establishing and agreeing national strategic plans and
guidelines for Member States will be:
Ensuring that there is an appropriate agreement of residual risk. Audit control
expectations or fear of financial corrections could negate the benefits from
investments needed to establish and maintain these systems;
Tailoring of solutions to meet the specific needs of Member State and the
interventions they chose to implement. Each Member State will have different
geographical and climatic conditions that will influence environmental, cross-
compliance and rural development measures. IT solutions that are capable of
easily identifying, capturing and maintaining spatial and non-spatial data sources
tailored to specific local needs are likely to be well placed to support future
requirements.

Analysis of administrative burden arising from the CAP
158
Finally, the EC could consider establishing a reporting system to track the
evolution of CAP administrative costs. As the proposed reform for the CAP post
2020 introduces more flexibility in Member States’ implementation choices, it is
urgent to initiate the development of such a framework to avoid inconsistent cost
recording approaches. The methodology implemented in this study, including the
new LPIS Cost-Effectiveness Framework, provides a basis for the establishment of
such a recording system.
As part of the study a cost framework was developed for use in those Member
States participating in case studies to seek to identify specific costs and areas of
administrative burden. It became clear that Member States had no standard
method of identifying their costs and rarely detailed costs at a disaggregated level.
If there is an ambition for meaningful recording of administrative burden going
forward Member States should be able to use and report using a common
framework. Such a framework could have the following elements:
Build upon and adapt the cost and cost effectiveness models used in the study;
The ability to separately identify development costs from running costs at an
aggregated and disaggregated level;
Be able to track benefits and savings over time, for instance reductions in costs
of administrative and on-the-spot checks;
The ability to model estimated costs of change as well as account for the actual
costs of implementation;
Be capable of identifying aggregate costs by Member State and costs per region
with an agreed method of apportionment of centralised costs;
Have an agreed methodology that allows the apportionment of costs where they
are not easily itemised. Likely metrics could include headcount with a common
method of apportioning direct and indirect numbers and costs e.g.:
o Fully dedicated to IACS work; (e.g. LPIS digitiser, caseworker);
o Partially dedicated to IACS work; (e.g. Co-ordination or senior paying agency
and policy management roles);
o Overheads (e.g. Finance, HR, IT support and maintenance etc.);
Metrics could also include units of work. For instance, the following:
o average time spent per type of control;
o the number of checks and transactions performed per application period;
o average transaction times (e.g. entitlement transfer, land transfer, aid
application).
The model should come with a comprehensive user and support guide. It would be
sensible to work with some willing Member States in the development phase to
identify and resolve implementation issues. There is also the potential to build on
the work done in this study to develop a standardised model to quantify the
administrative burden and the impact of simplification of farmers and beneficiaries.
This could be used to support contributions by Member States towards regulatory
obligations in Strategic Plans going forward. Both should be capable of being
adapted for use for other non-IACS areas of CAP expenditure where there was an
identified beneficial use.
159
GETTING IN TOUCH WITH THE EU
In person
All over the European Union there are hundreds of Europe Direct
information centres. You can find the address of the centre nearest you at:
https://europa.eu/european-union/contact_en
On the phone or by email
Europe Direct is a service that answers your questions about the European
Union. You can contact this service: – by freephone: 00 800 6 7 8 9 10 11
(certain operators may charge for these calls), – at the following standard
number: +32 22999696, or – by email via: https://europa.eu/european-
union/contact_en
FINDING INFORMATION ABOUT THE EU
Online
Information about the European Union in all the official languages of the EU
is available on the Europa website at: https://europa.eu/european-
union/index_en
EU publications
You can download or order free and priced EU publications from:
https://publications.europa.eu/en/publications. Multiple copies of free
publications may be obtained by contacting Europe Direct or your local
information centre (see https://europa.eu/european-union/contact_en).
EU law and related documents
For access to legal information from the EU, including all EU law since 1952
in all the official language versions, go to EUR-Lex at: http://eur-
lex.europa.eu
Open data from the EU
The EU Open Data Portal (http://data.europa.eu/euodp/en) provides access
to datasets from the EU. Data can be downloaded and reused for free, for
both commercial and non-commercial purposes.

doi: 10.2762/521652
ISBN: 978-92-79-98021-3
KF-0
5-1
8-1
07-E
N-N
[Ca
talo
gu
e n
um
be
r]