Embed Size (px)
Citation preview

Analysis and Reports• Safety Event Manager with QPrecision
• Analyzing Safety Event Data
5/11/2016 2
• Safety Event Manager with QPrecision supports data-
driven decision making through its Reports features.
• Reports leverage data and help analyze trends in
safety event management.
• Safety Event Manager with QPrecision reports are
flexible, easy to run and cover multiple aspects of
safety events.
• SEM with QPrecision offers the following types of
reports:
• Predefined Reports – a library of predefined
reports templates in standard and enhanced
formats
• Ad Hoc Report Builder – reporting engine to
create custom reports
• Data Analysis Privileges
5/11/20163
• Ability to perform data analysis is based on a specific
user privilege.
• Reports options as well as data in the report output
depend on your assigned user role and privileges.
• Data analysis privileges are available to the following
user roles:
• Event Managers
• Department Leaders
• Analysts
• Custom Users
• Data analysis privileges are assigned by the System
Administrator.
5/11/2016 4
Accessing Reports Options
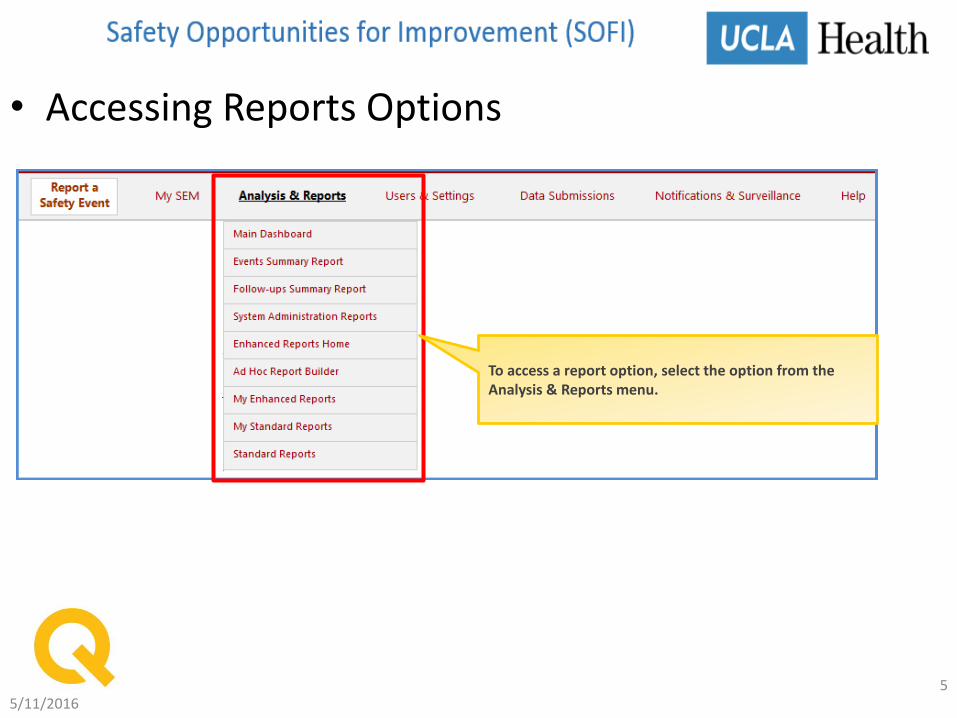
• Accessing Reports Options
5/11/20165
To access a report option, select the option from the Analysis & Reports menu.
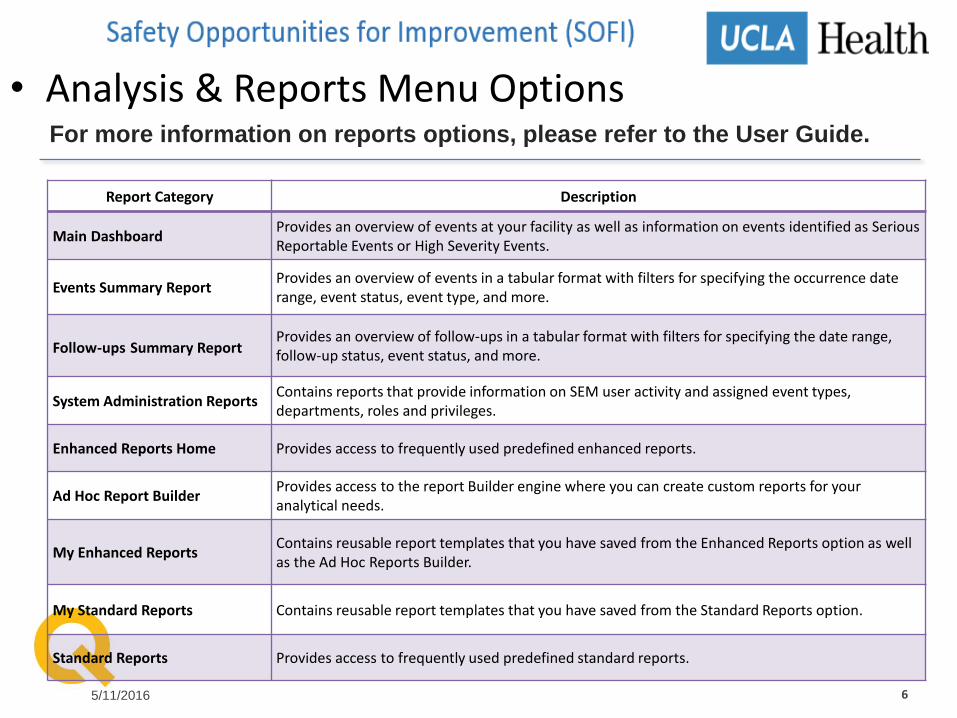
Report Category Description
Main DashboardProvides an overview of events at your facility as well as information on events identified as Serious Reportable Events or High Severity Events.
Events Summary ReportProvides an overview of events in a tabular format with filters for specifying the occurrence date range, event status, event type, and more.
Follow-ups Summary ReportProvides an overview of follow-ups in a tabular format with filters for specifying the date range, follow-up status, event status, and more.
System Administration ReportsContains reports that provide information on SEM user activity and assigned event types, departments, roles and privileges.
Enhanced Reports Home Provides access to frequently used predefined enhanced reports.
Ad Hoc Report BuilderProvides access to the report Builder engine where you can create custom reports for your analytical needs.
My Enhanced ReportsContains reusable report templates that you have saved from the Enhanced Reports option as well as the Ad Hoc Reports Builder.
My Standard Reports Contains reusable report templates that you have saved from the Standard Reports option.
Standard Reports Provides access to frequently used predefined standard reports.
• Analysis & Reports Menu Options
5/11/2016 6
For more information on reports options, please refer to the User Guide.
5/11/2016 7
Enhanced Reports
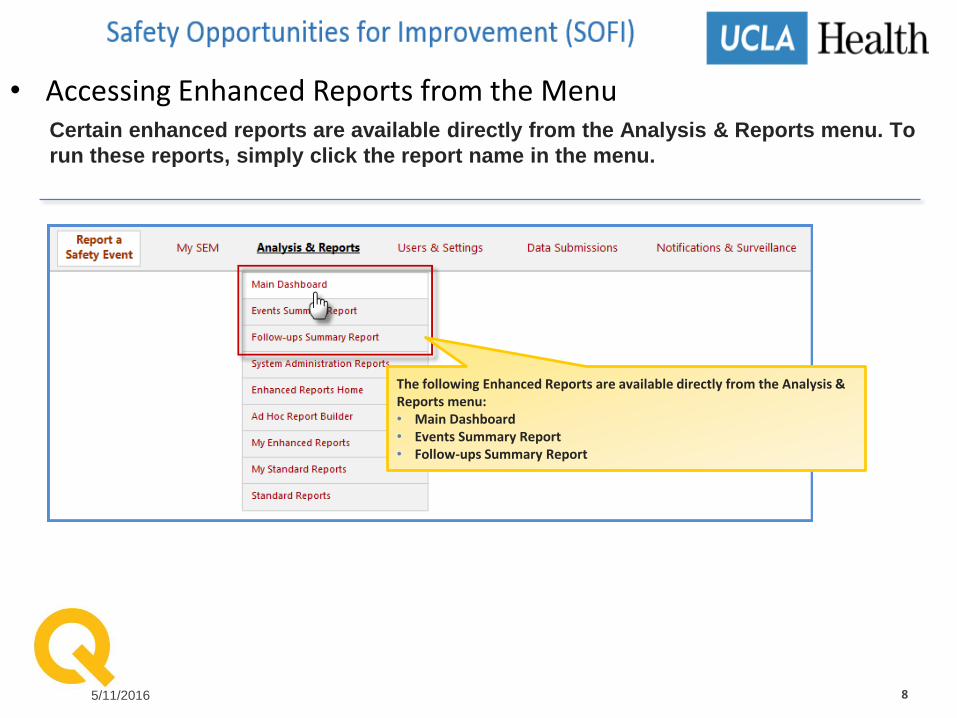
• Accessing Enhanced Reports from the Menu
5/11/2016 8
Certain enhanced reports are available directly from the Analysis & Reports menu. To
run these reports, simply click the report name in the menu.
The following Enhanced Reports are available directly from the Analysis & Reports menu: • Main Dashboard• Events Summary Report• Follow-ups Summary Report
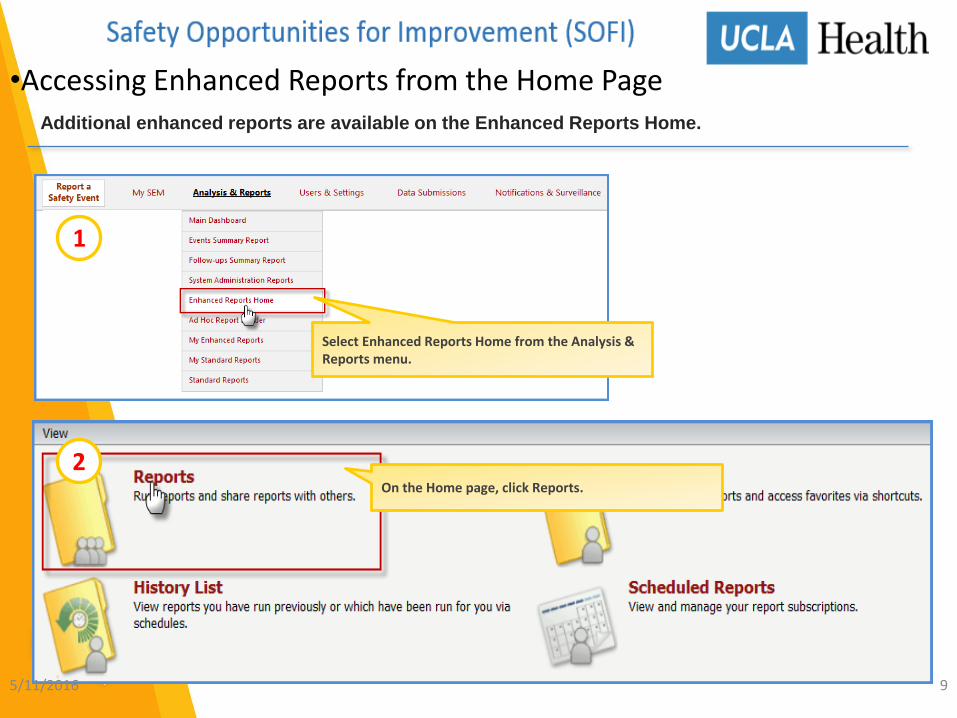
•Accessing Enhanced Reports from the Home Page
5/11/2016 9
1
Select Enhanced Reports Home from the Analysis & Reports menu.
2On the Home page, click Reports.
Additional enhanced reports are available on the Enhanced Reports Home.
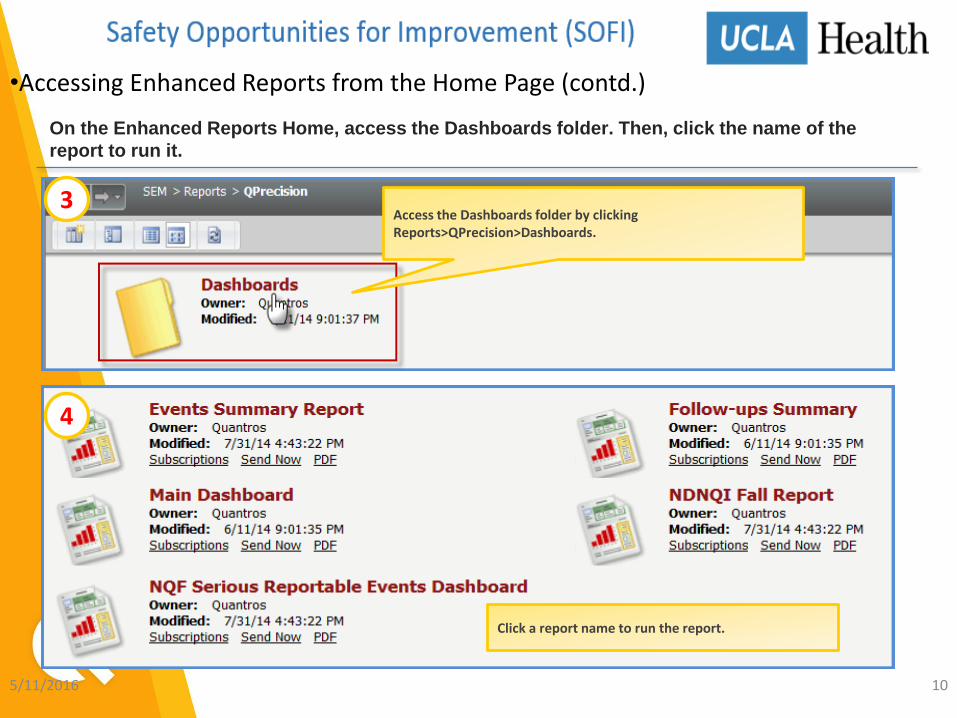
•Accessing Enhanced Reports from the Home Page (contd.)
5/11/2016 10
3Access the Dashboards folder by clicking Reports>QPrecision>Dashboards.
4
Click a report name to run the report.
On the Enhanced Reports Home, access the Dashboards folder. Then, click the name of the
report to run it.
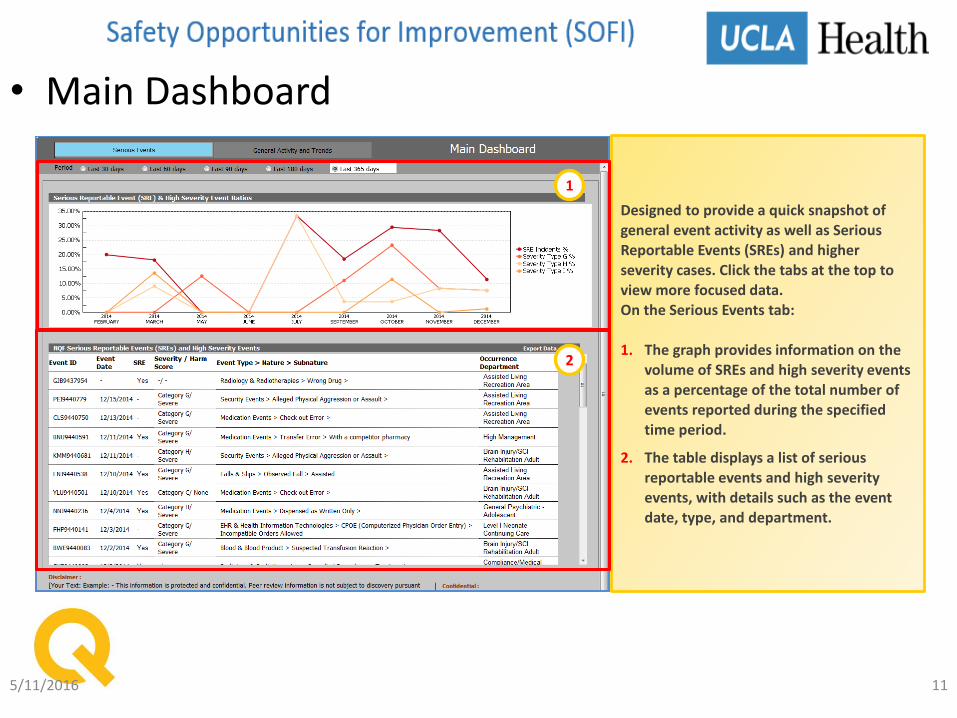
• Main Dashboard
5/11/2016 11
Designed to provide a quick snapshot of general event activity as well as Serious Reportable Events (SREs) and higher severity cases. Click the tabs at the top to view more focused data. On the Serious Events tab:
1. The graph provides information on the volume of SREs and high severity events as a percentage of the total number of events reported during the specified time period.
2. The table displays a list of serious reportable events and high severity events, with details such as the event date, type, and department.
1
2

• Main Dashboard (Contd.)
5/11/2016 12
On the General Activity and Trends tab, find information on incident counts across event types and departments. Select a time period and toggle between Event Type or Department to view related information in the table and graphs. In the table (1), the arrows provide a quick visual indicator of the general trend in event counts (increase or decrease).
1
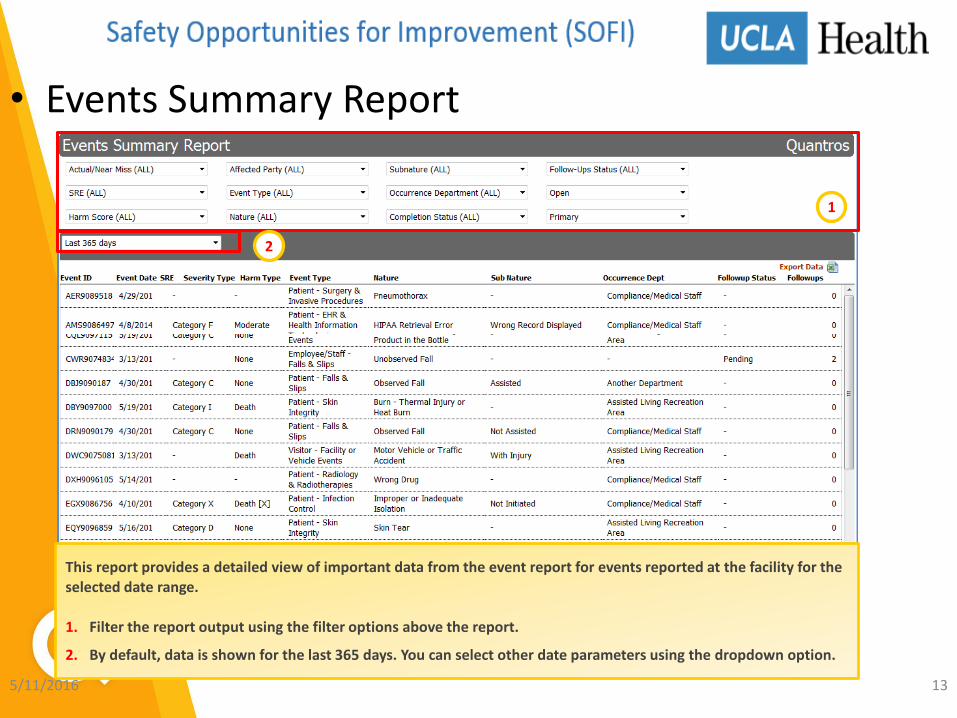
• Events Summary Report
5/11/2016 13
This report provides a detailed view of important data from the event report for events reported at the facility for the selected date range.
1. Filter the report output using the filter options above the report.
2. By default, data is shown for the last 365 days. You can select other date parameters using the dropdown option.
1
2
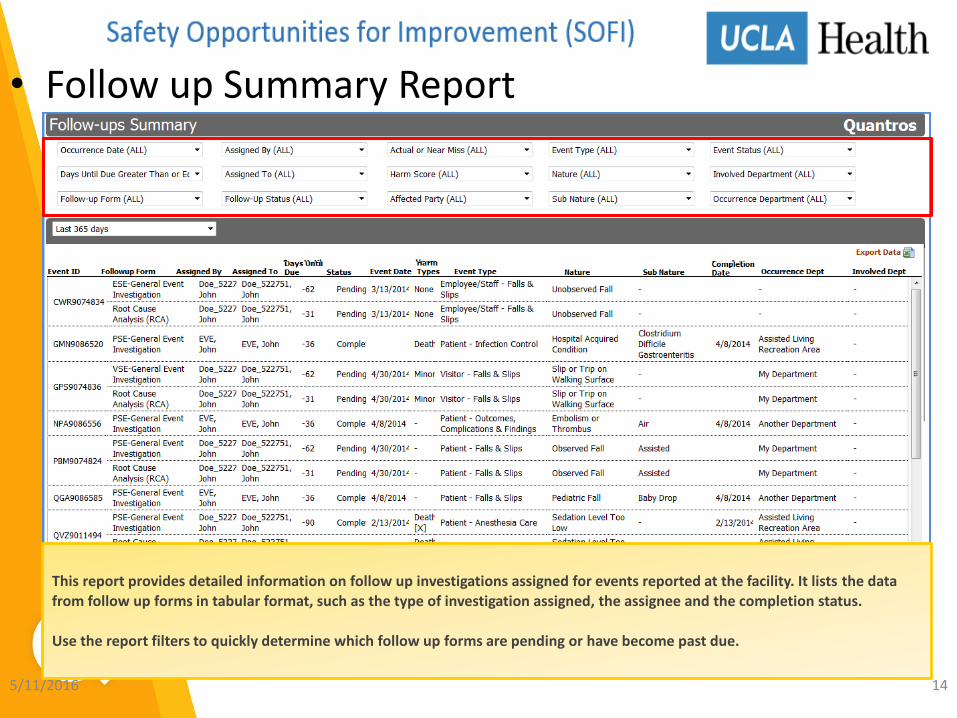
• Follow up Summary Report
5/11/2016 14
This report provides detailed information on follow up investigations assigned for events reported at the facility. It lists the data from follow up forms in tabular format, such as the type of investigation assigned, the assignee and the completion status.
Use the report filters to quickly determine which follow up forms are pending or have become past due.
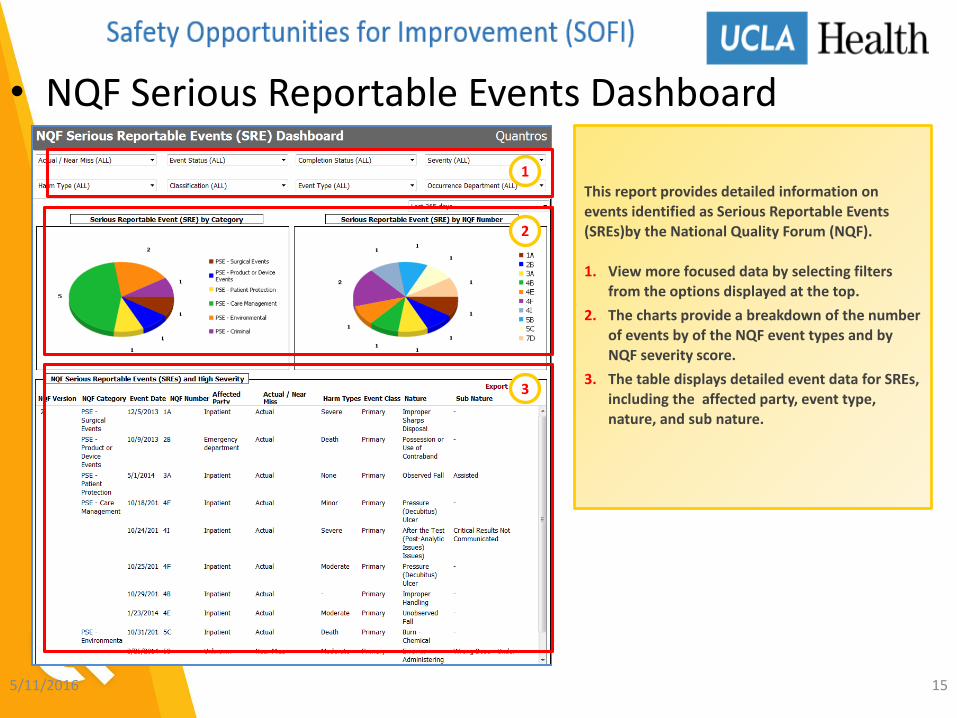
• NQF Serious Reportable Events Dashboard
5/11/2016 15
This report provides detailed information on events identified as Serious Reportable Events (SREs)by the National Quality Forum (NQF).
1. View more focused data by selecting filters from the options displayed at the top.
2. The charts provide a breakdown of the number of events by of the NQF event types and by NQF severity score.
3. The table displays detailed event data for SREs, including the affected party, event type, nature, and sub nature.
1
2
3
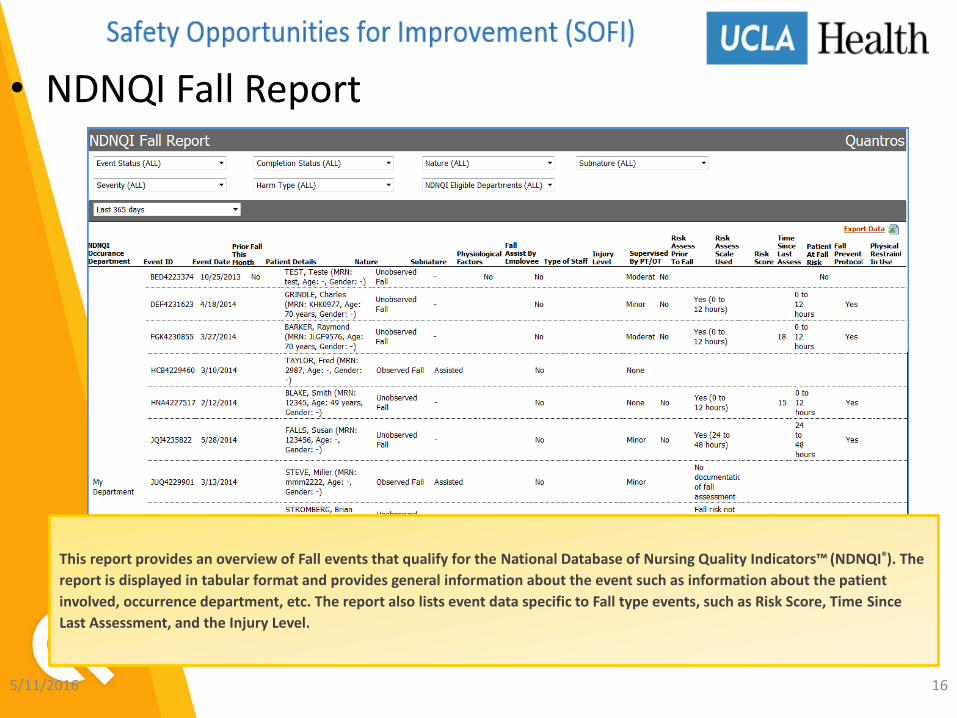
• NDNQI Fall Report
5/11/2016 16
This report provides an overview of Fall events that qualify for the National Database of Nursing Quality Indicators™ (NDNQI®). The
report is displayed in tabular format and provides general information about the event such as information about the patient
involved, occurrence department, etc. The report also lists event data specific to Fall type events, such as Risk Score, Time Since
Last Assessment, and the Injury Level.
5/11/2016 17
Working with Enhanced
Reports Options
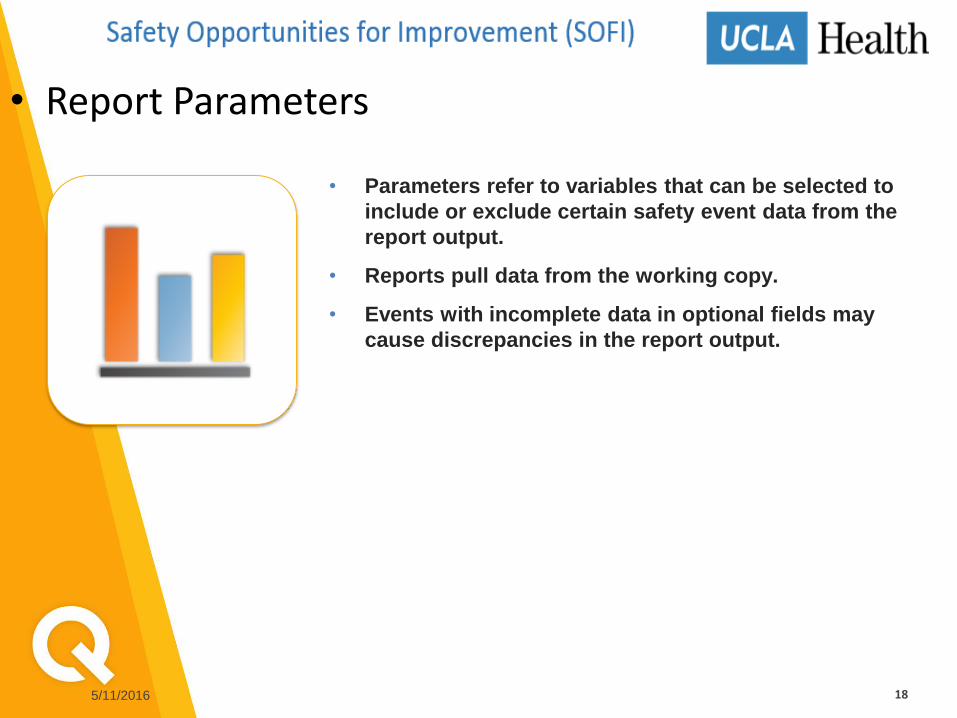
• Report Parameters
5/11/2016 18
• Parameters refer to variables that can be selected to
include or exclude certain safety event data from the
report output.
• Reports pull data from the working copy.
• Events with incomplete data in optional fields may
cause discrepancies in the report output.
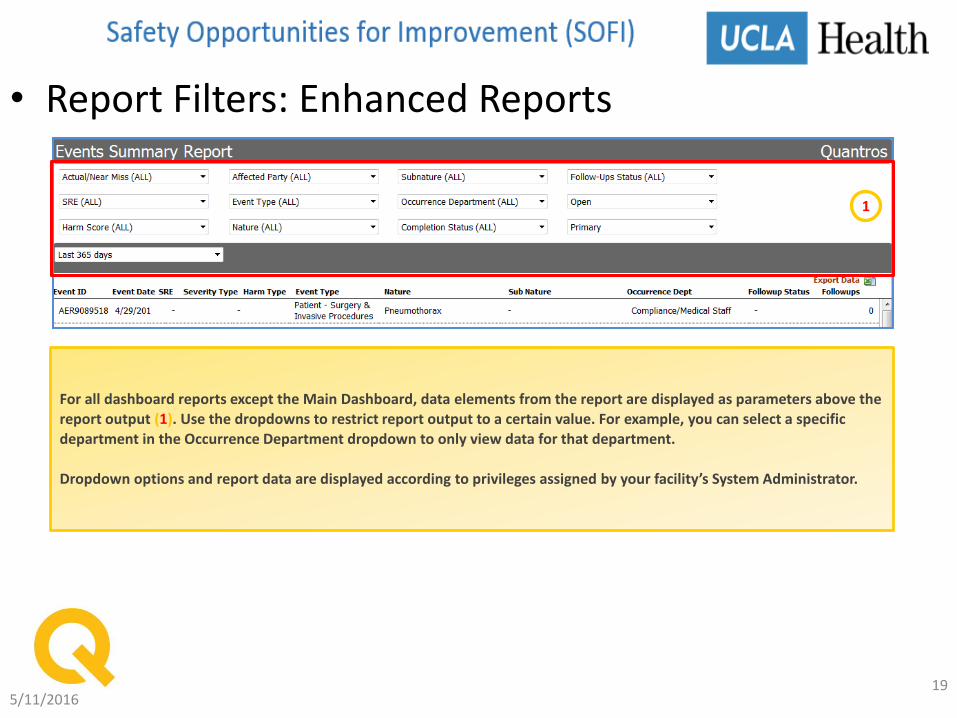
• Report Filters: Enhanced Reports
5/11/201619
For all dashboard reports except the Main Dashboard, data elements from the report are displayed as parameters above the report output (1). Use the dropdowns to restrict report output to a certain value. For example, you can select a specific department in the Occurrence Department dropdown to only view data for that department.
Dropdown options and report data are displayed according to privileges assigned by your facility’s System Administrator.
1
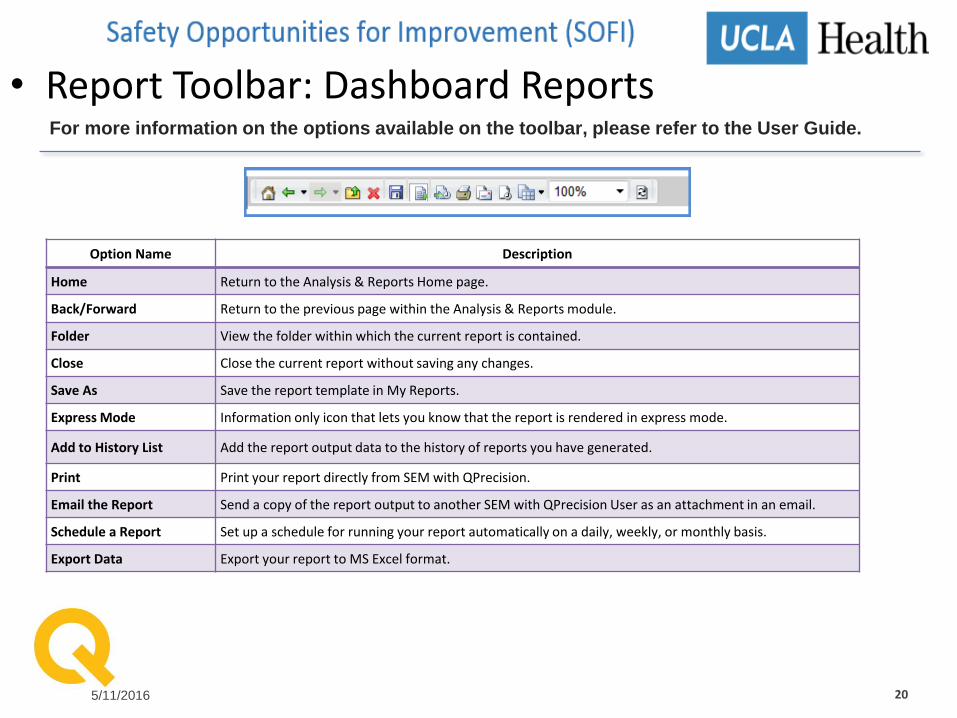
• Report Toolbar: Dashboard Reports
5/11/2016 20
Option Name Description
Home Return to the Analysis & Reports Home page.
Back/Forward Return to the previous page within the Analysis & Reports module.
Folder View the folder within which the current report is contained.
Close Close the current report without saving any changes.
Save As Save the report template in My Reports.
Express Mode Information only icon that lets you know that the report is rendered in express mode.
Add to History List Add the report output data to the history of reports you have generated.
Print Print your report directly from SEM with QPrecision.
Email the Report Send a copy of the report output to another SEM with QPrecision User as an attachment in an email.
Schedule a Report Set up a schedule for running your report automatically on a daily, weekly, or monthly basis.
Export Data Export your report to MS Excel format.
For more information on the options available on the toolbar, please refer to the User Guide.
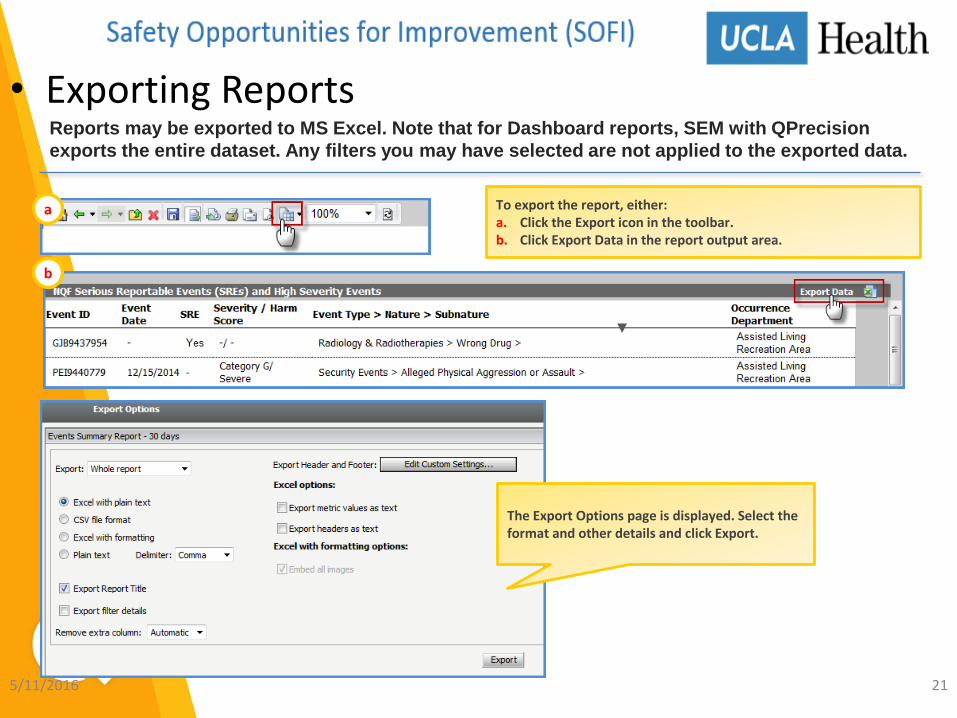
• Exporting Reports
5/11/2016 21
To export the report, either:a. Click the Export icon in the toolbar.b. Click Export Data in the report output area.
The Export Options page is displayed. Select the format and other details and click Export.
Reports may be exported to MS Excel. Note that for Dashboard reports, SEM with QPrecision
exports the entire dataset. Any filters you may have selected are not applied to the exported data.
a
b
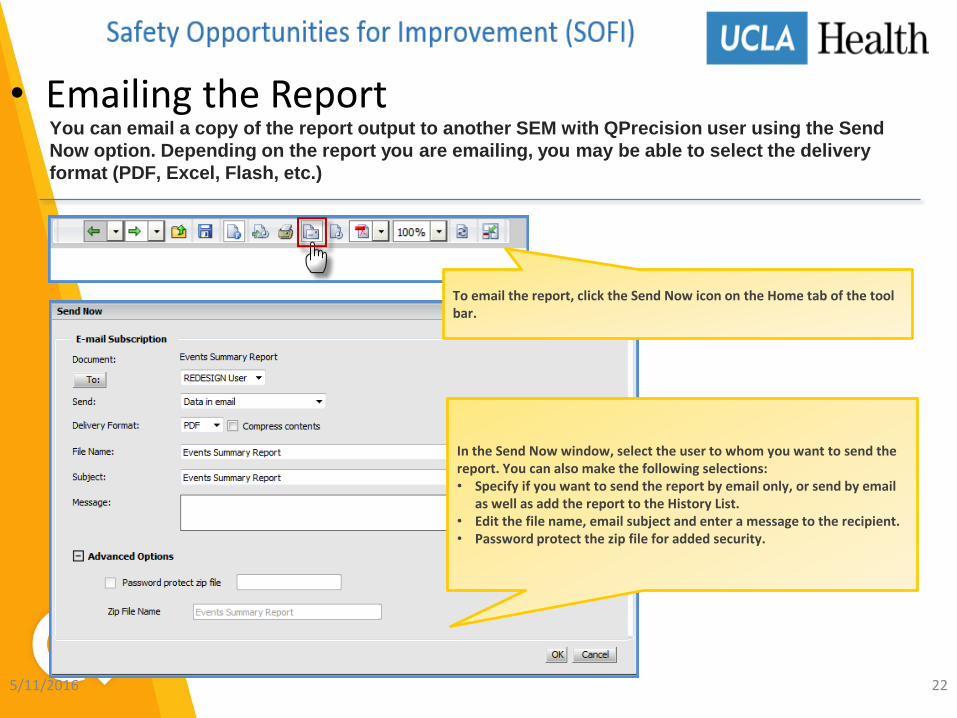
• Emailing the Report
5/11/2016 22
To email the report, click the Send Now icon on the Home tab of the tool bar.
You can email a copy of the report output to another SEM with QPrecision user using the Send
Now option. Depending on the report you are emailing, you may be able to select the delivery
format (PDF, Excel, Flash, etc.)
In the Send Now window, select the user to whom you want to send the report. You can also make the following selections:• Specify if you want to send the report by email only, or send by email
as well as add the report to the History List. • Edit the file name, email subject and enter a message to the recipient.• Password protect the zip file for added security.
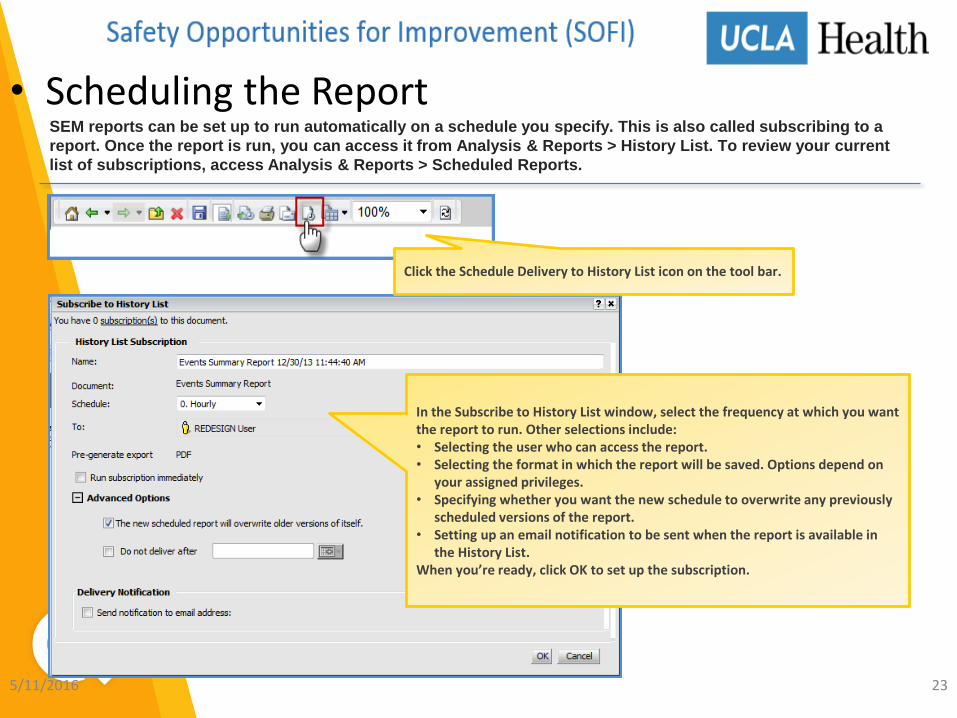
• Scheduling the Report
5/11/2016 23
Click the Schedule Delivery to History List icon on the tool bar.
SEM reports can be set up to run automatically on a schedule you specify. This is also called subscribing to a
report. Once the report is run, you can access it from Analysis & Reports > History List. To review your current
list of subscriptions, access Analysis & Reports > Scheduled Reports.
In the Subscribe to History List window, select the frequency at which you want the report to run. Other selections include:• Selecting the user who can access the report.• Selecting the format in which the report will be saved. Options depend on
your assigned privileges. • Specifying whether you want the new schedule to overwrite any previously
scheduled versions of the report. • Setting up an email notification to be sent when the report is available in
the History List.When you’re ready, click OK to set up the subscription.
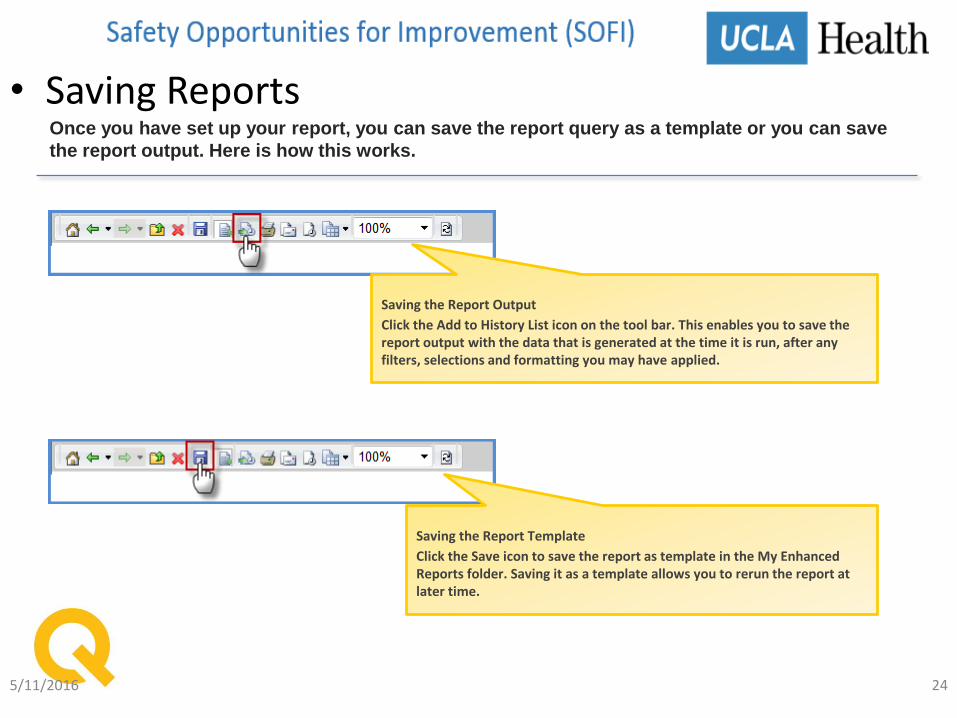
• Saving Reports
5/11/2016 24
Saving the Report Output
Click the Add to History List icon on the tool bar. This enables you to save the report output with the data that is generated at the time it is run, after any filters, selections and formatting you may have applied.
Once you have set up your report, you can save the report query as a template or you can save
the report output. Here is how this works.
Saving the Report Template
Click the Save icon to save the report as template in the My Enhanced Reports folder. Saving it as a template allows you to rerun the report at later time.
5/11/2016 25
Ad Hoc Reports
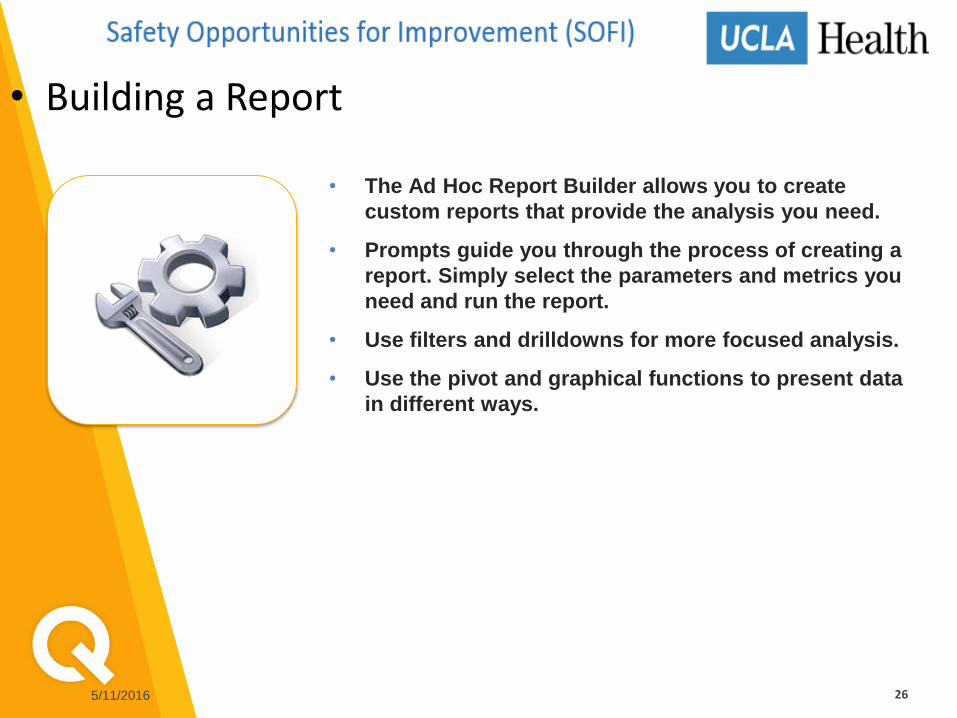
• Building a Report
5/11/2016 26
• The Ad Hoc Report Builder allows you to create
custom reports that provide the analysis you need.
• Prompts guide you through the process of creating a
report. Simply select the parameters and metrics you
need and run the report.
• Use filters and drilldowns for more focused analysis.
• Use the pivot and graphical functions to present data
in different ways.
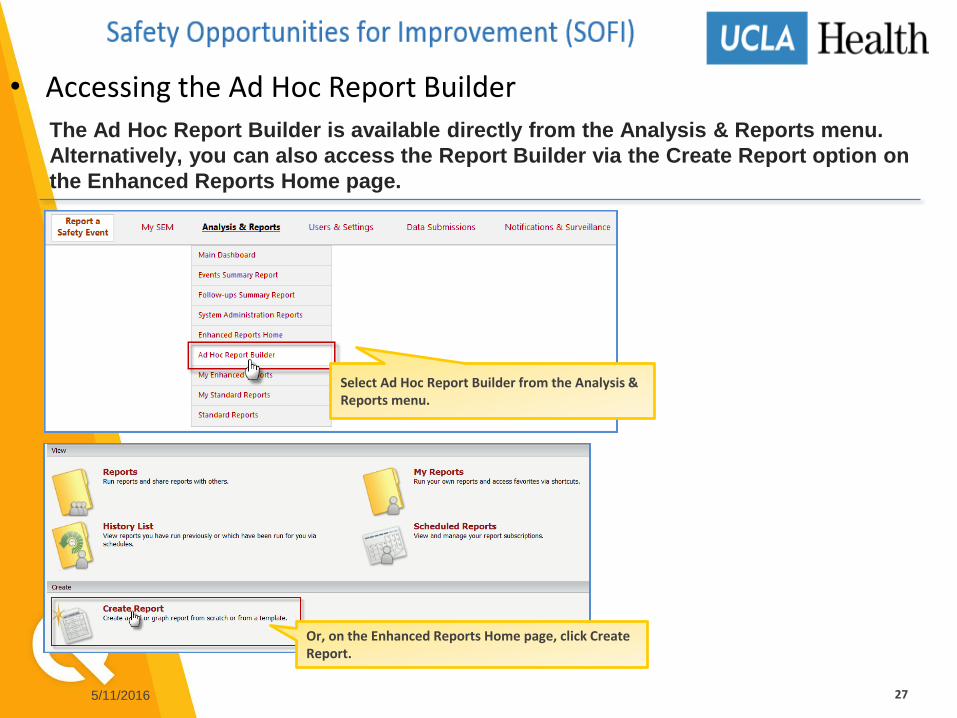
• Accessing the Ad Hoc Report Builder
5/11/2016 27
The Ad Hoc Report Builder is available directly from the Analysis & Reports menu.
Alternatively, you can also access the Report Builder via the Create Report option on
the Enhanced Reports Home page.
Select Ad Hoc Report Builder from the Analysis & Reports menu.
Or, on the Enhanced Reports Home page, click Create Report.
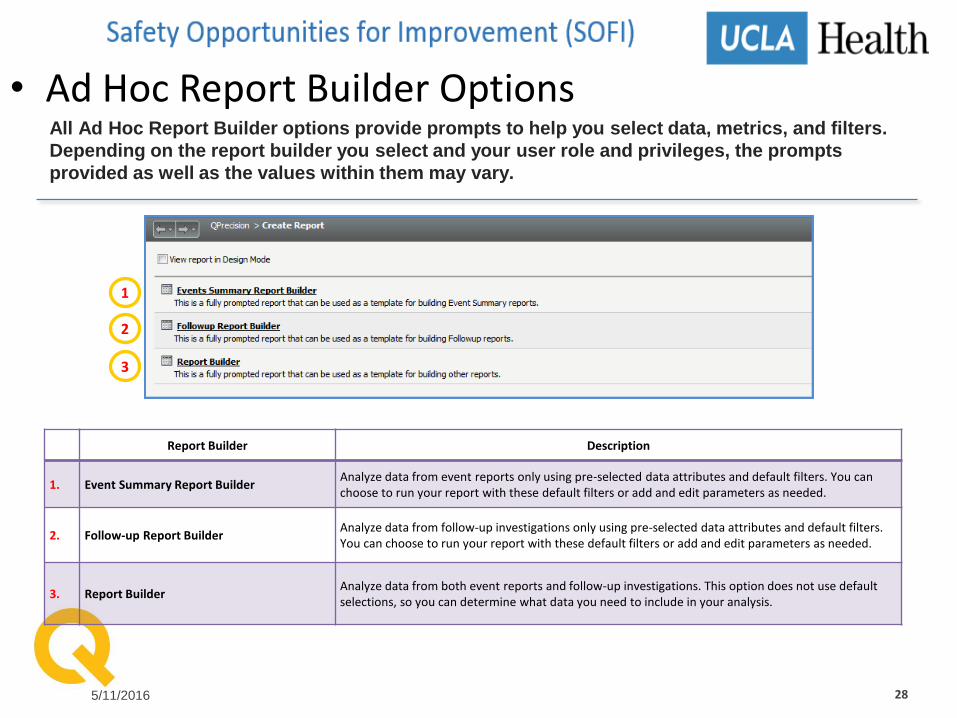
• Ad Hoc Report Builder Options
5/11/2016 28
Report Builder Description
1. Event Summary Report BuilderAnalyze data from event reports only using pre-selected data attributes and default filters. You can choose to run your report with these default filters or add and edit parameters as needed.
2. Follow-up Report BuilderAnalyze data from follow-up investigations only using pre-selected data attributes and default filters. You can choose to run your report with these default filters or add and edit parameters as needed.
3. Report BuilderAnalyze data from both event reports and follow-up investigations. This option does not use default selections, so you can determine what data you need to include in your analysis.
All Ad Hoc Report Builder options provide prompts to help you select data, metrics, and filters.
Depending on the report builder you select and your user role and privileges, the prompts
provided as well as the values within them may vary.
1
2
3
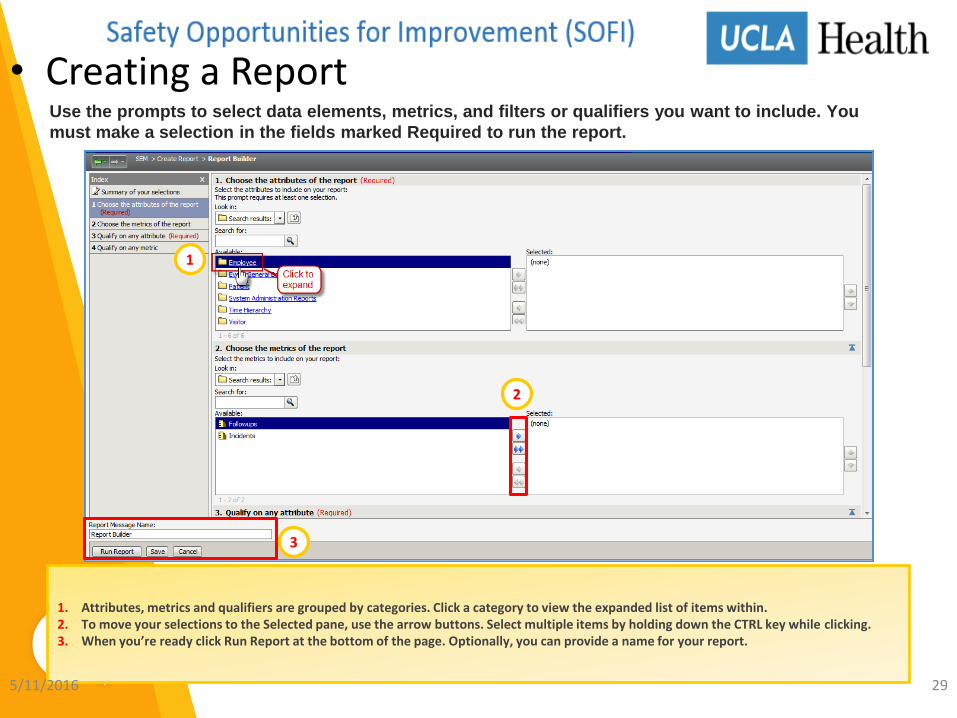
1. Attributes, metrics and qualifiers are grouped by categories. Click a category to view the expanded list of items within.2. To move your selections to the Selected pane, use the arrow buttons. Select multiple items by holding down the CTRL key while clicking. 3. When you’re ready click Run Report at the bottom of the page. Optionally, you can provide a name for your report.
• Creating a Report
5/11/2016 29
Use the prompts to select data elements, metrics, and filters or qualifiers you want to include. You
must make a selection in the fields marked Required to run the report.
1
2
3
• Step 1: Selecting an Attribute
5/11/2016 30
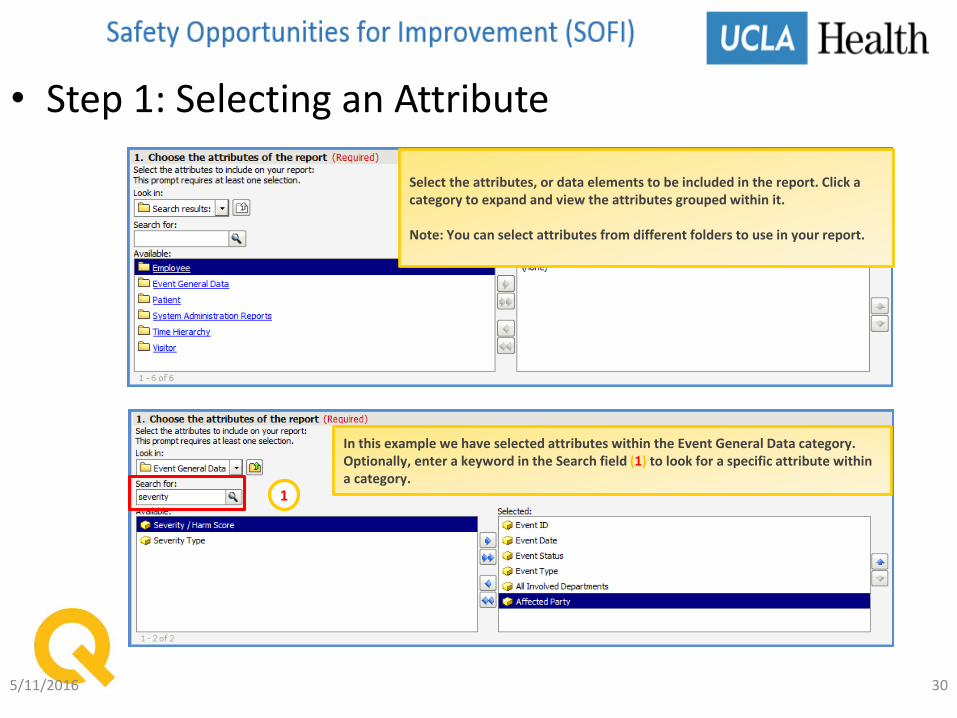
In this example we have selected attributes within the Event General Data category. Optionally, enter a keyword in the Search field (1) to look for a specific attribute within a category.
1
Select the attributes, or data elements to be included in the report. Click a category to expand and view the attributes grouped within it.
Note: You can select attributes from different folders to use in your report.
• Step 2: Selecting a Metric
5/11/2016 31
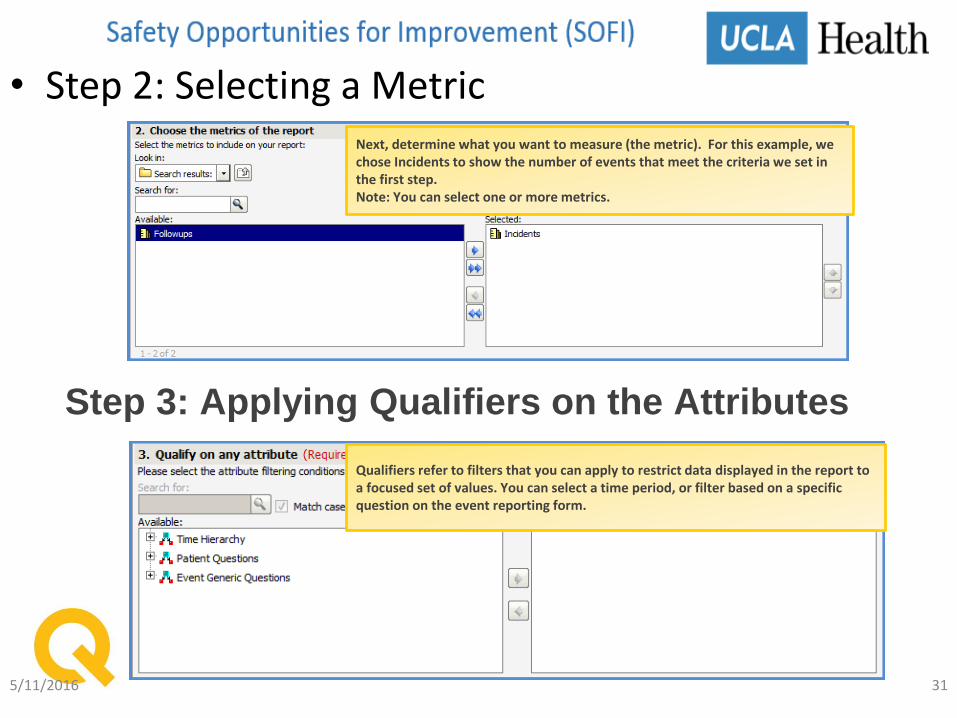
Qualifiers refer to filters that you can apply to restrict data displayed in the report to a focused set of values. You can select a time period, or filter based on a specific question on the event reporting form.
Next, determine what you want to measure (the metric). For this example, we chose Incidents to show the number of events that meet the criteria we set in the first step. Note: You can select one or more metrics.
Step 3: Applying Qualifiers on the Attributes
• Step 3: Applying Qualifiers (Contd.)
5/11/2016 32
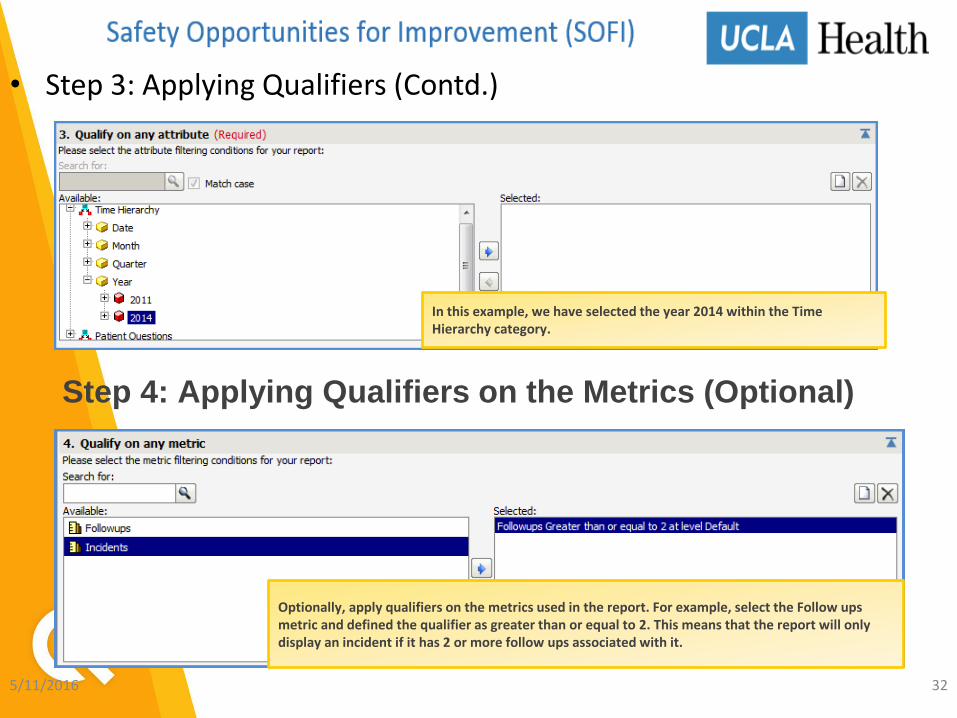
Optionally, apply qualifiers on the metrics used in the report. For example, select the Follow ups metric and defined the qualifier as greater than or equal to 2. This means that the report will only display an incident if it has 2 or more follow ups associated with it.
In this example, we have selected the year 2014 within the Time Hierarchy category.
Step 4: Applying Qualifiers on the Metrics (Optional)
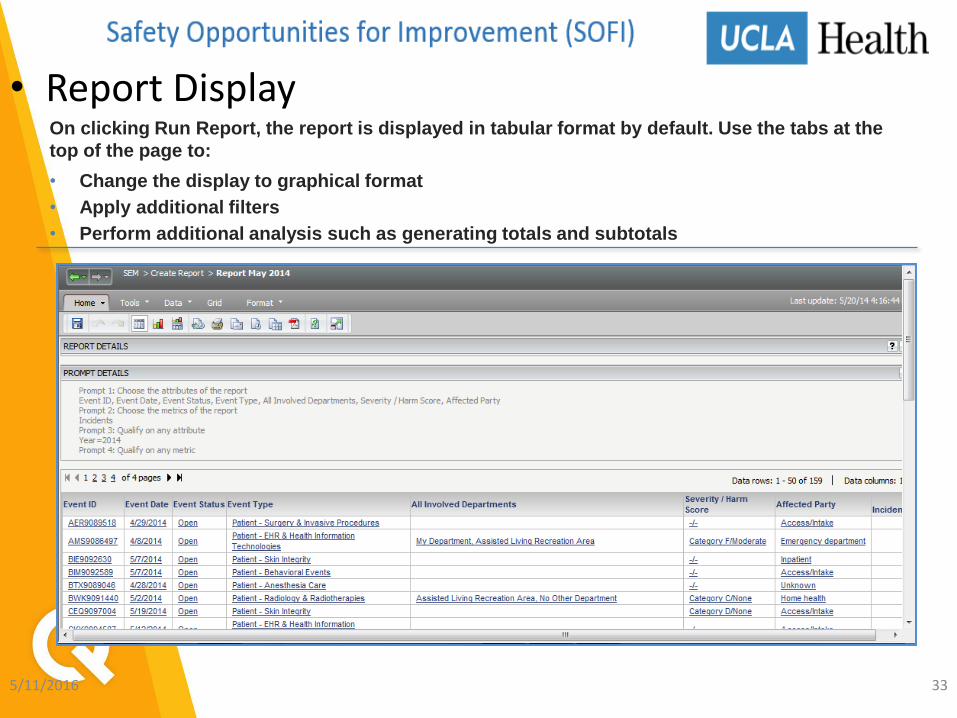
• Report Display
5/11/2016 33
On clicking Run Report, the report is displayed in tabular format by default. Use the tabs at the
top of the page to:
• Change the display to graphical format
• Apply additional filters
• Perform additional analysis such as generating totals and subtotals
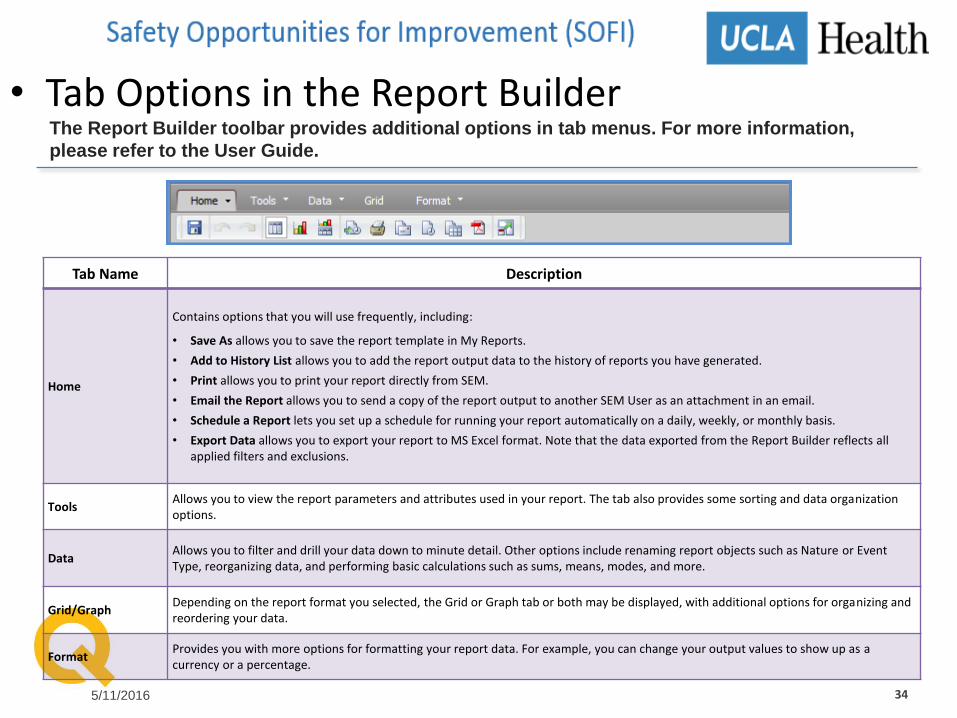
• Tab Options in the Report Builder
5/11/2016 34
Tab Name Description
Home
Contains options that you will use frequently, including:
• Save As allows you to save the report template in My Reports.
• Add to History List allows you to add the report output data to the history of reports you have generated.
• Print allows you to print your report directly from SEM.
• Email the Report allows you to send a copy of the report output to another SEM User as an attachment in an email.
• Schedule a Report lets you set up a schedule for running your report automatically on a daily, weekly, or monthly basis.
• Export Data allows you to export your report to MS Excel format. Note that the data exported from the Report Builder reflects all applied filters and exclusions.
ToolsAllows you to view the report parameters and attributes used in your report. The tab also provides some sorting and data organization options.
DataAllows you to filter and drill your data down to minute detail. Other options include renaming report objects such as Nature or Event Type, reorganizing data, and performing basic calculations such as sums, means, modes, and more.
Grid/GraphDepending on the report format you selected, the Grid or Graph tab or both may be displayed, with additional options for organizing and reordering your data.
FormatProvides you with more options for formatting your report data. For example, you can change your output values to show up as a currency or a percentage.
The Report Builder toolbar provides additional options in tab menus. For more information,
please refer to the User Guide.
• Enhanced Reports FAQsQ: When I run my enhanced report, I see a message that says no data can be returned because
the applied filters exclude all data. What does that mean?
A: The filters (qualifiers) you selected may be too restrictive to generate the report. Remove any optional filters and/or select the broadest category of metrics and qualifiers. Once the report is run, you can use the drilldown and filters options to further analyze the data.
Q: How often is the data in the enhanced reports database refreshed?
A: Report Builder data is real time. Data in the enhanced reports is refreshed every 30 minutes. System Administration enhanced reports are also real time.
Q: Why don’t I see an option to export my enhanced reports to MS Excel?
A: Exporting reports is a separate optional privilege that needs to be assigned by your facility’s System Administrator. Contact your SEM with QPrecision System Administrator if you need this ability.
5/11/2016 35
5/11/2016 36
Standard Reports
• About Standard Reports
5/11/2016 37
• SEM with QPrecision offers a library of predefined
standard reports templates for frequently needed
reports.
• Some reports are available at both the facility and
corporate levels. For a full list, please refer to the User
Guide.
• Standard reports almost always include both open and
closed events.
• The default time frame for standard reports is from the
first of the previous month until the current date.
• All standard reports can be printed or exported to
Microsoft Excel or PDF formats. You must have the
associated privileges assigned to you by your System
Administrator.
• Accessing Standard Reports
5/11/2016 38
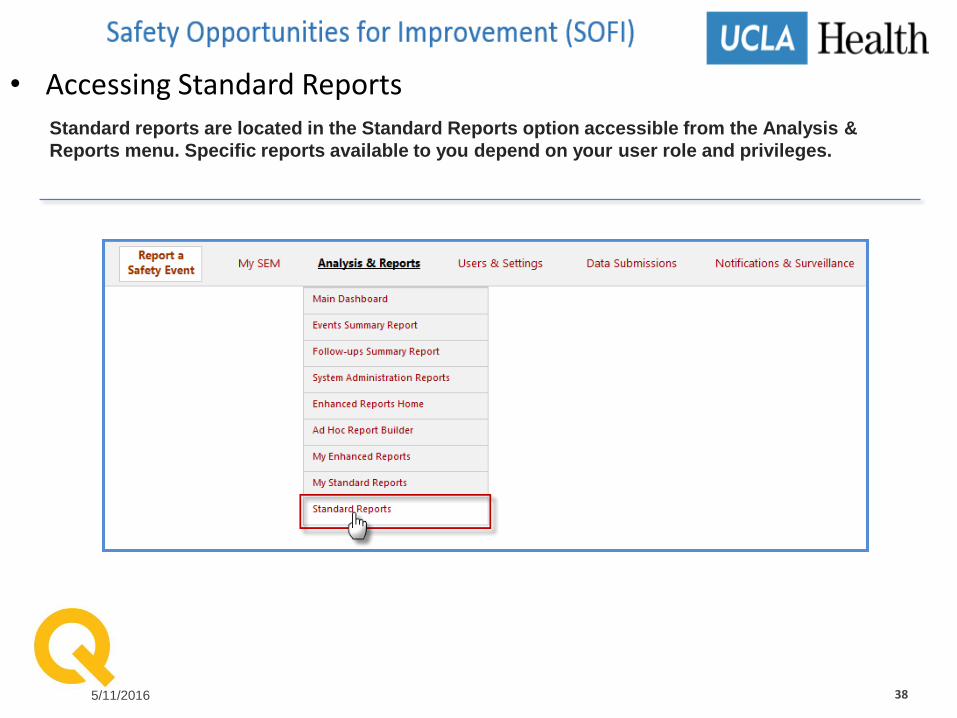
Standard reports are located in the Standard Reports option accessible from the Analysis &
Reports menu. Specific reports available to you depend on your user role and privileges.
• Standard Reports Categories
5/11/2016 39
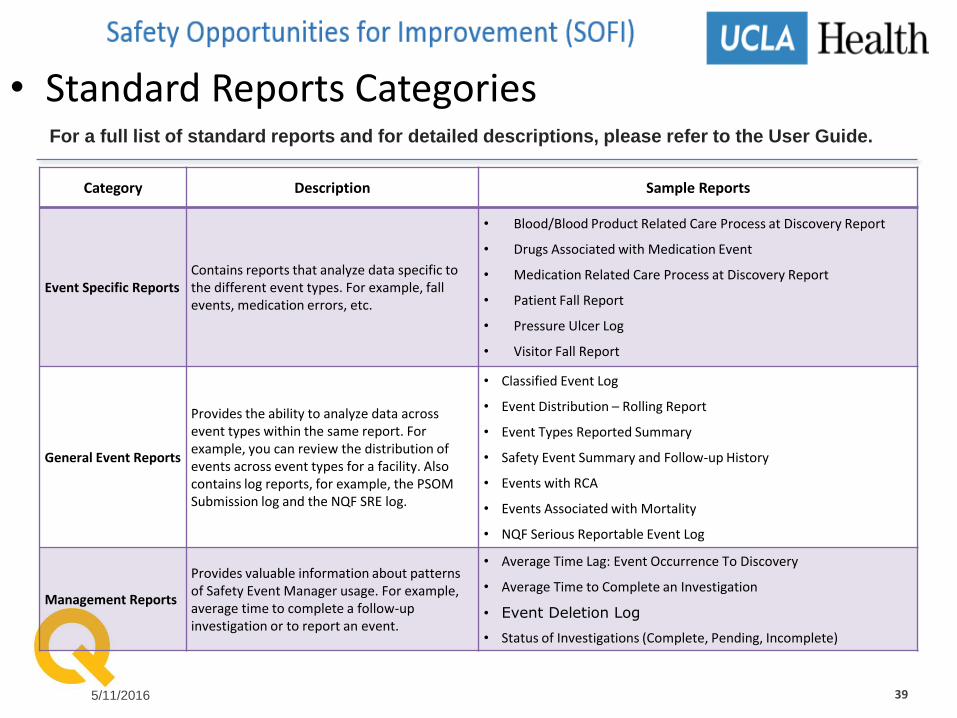
Category Description Sample Reports
Event Specific ReportsContains reports that analyze data specific to the different event types. For example, fall events, medication errors, etc.
• Blood/Blood Product Related Care Process at Discovery Report
• Drugs Associated with Medication Event
• Medication Related Care Process at Discovery Report
• Patient Fall Report
• Pressure Ulcer Log
• Visitor Fall Report
General Event Reports
Provides the ability to analyze data across event types within the same report. For example, you can review the distribution of events across event types for a facility. Also contains log reports, for example, the PSOM Submission log and the NQF SRE log.
• Classified Event Log
• Event Distribution – Rolling Report
• Event Types Reported Summary
• Safety Event Summary and Follow-up History
• Events with RCA
• Events Associated with Mortality
• NQF Serious Reportable Event Log
Management Reports
Provides valuable information about patterns of Safety Event Manager usage. For example, average time to complete a follow-up investigation or to report an event.
• Average Time Lag: Event Occurrence To Discovery
• Average Time to Complete an Investigation
• Event Deletion Log
• Status of Investigations (Complete, Pending, Incomplete)
For a full list of standard reports and for detailed descriptions, please refer to the User Guide.
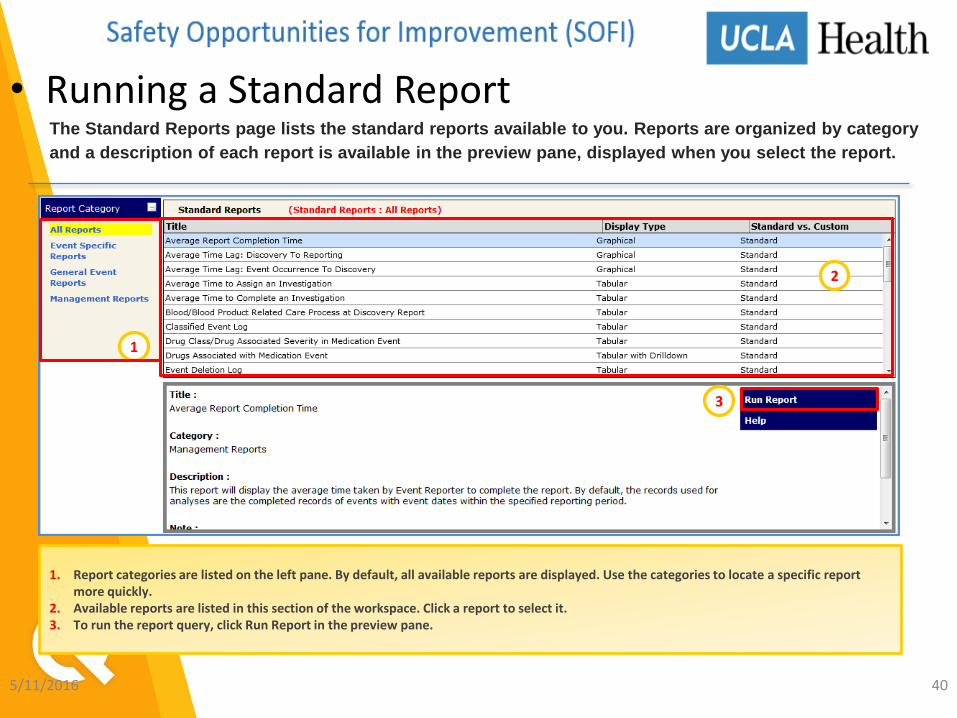
1. Report categories are listed on the left pane. By default, all available reports are displayed. Use the categories to locate a specific report more quickly.
2. Available reports are listed in this section of the workspace. Click a report to select it. 3. To run the report query, click Run Report in the preview pane.
• Running a Standard Report
5/11/2016 40
The Standard Reports page lists the standard reports available to you. Reports are organized by category
and a description of each report is available in the preview pane, displayed when you select the report.
1
2
3
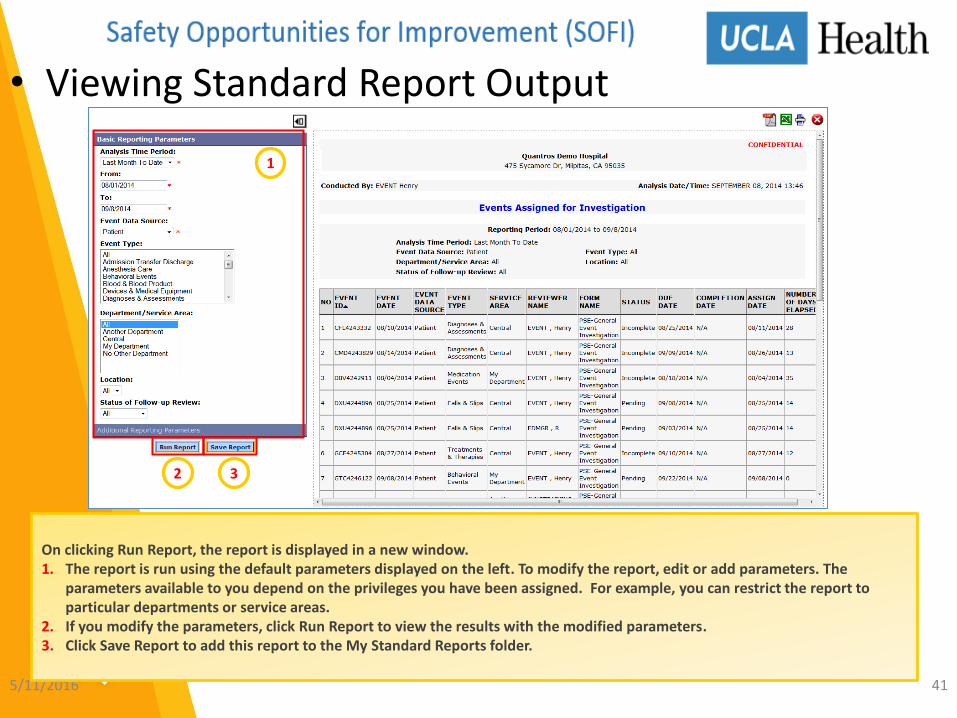
• Viewing Standard Report Output
5/11/2016 41
On clicking Run Report, the report is displayed in a new window. 1. The report is run using the default parameters displayed on the left. To modify the report, edit or add parameters. The
parameters available to you depend on the privileges you have been assigned. For example, you can restrict the report to particular departments or service areas.
2. If you modify the parameters, click Run Report to view the results with the modified parameters.3. Click Save Report to add this report to the My Standard Reports folder.
Continue here
1
2 3
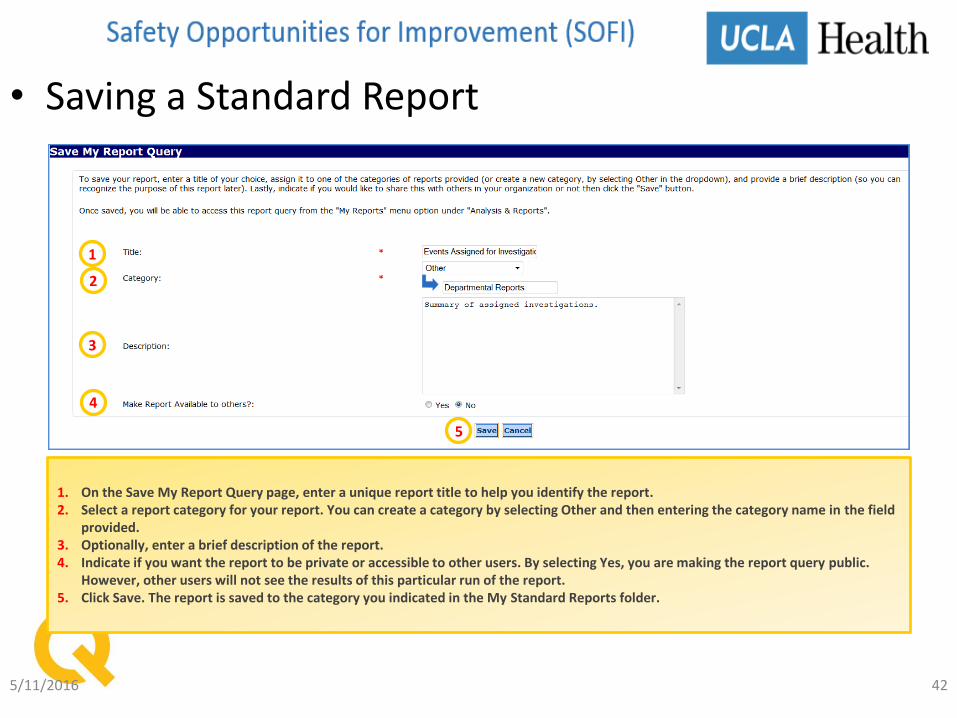
1. On the Save My Report Query page, enter a unique report title to help you identify the report.2. Select a report category for your report. You can create a category by selecting Other and then entering the category name in the field
provided. 3. Optionally, enter a brief description of the report. 4. Indicate if you want the report to be private or accessible to other users. By selecting Yes, you are making the report query public.
However, other users will not see the results of this particular run of the report. 5. Click Save. The report is saved to the category you indicated in the My Standard Reports folder.
• Saving a Standard Report
5/11/2016 42
1
2
3
4
5
5/11/2016 43
My Standard Reports
• About My Standard Reports
5/11/2016 44
• My Standard Reports stores all saved standard report
queries.
• It also displays public reports saved by other users.
• Reports are organized by categories for easy retrieval.
• When Quantros updates the list of report parameters,
saved report queries will need to be run and saved
again.
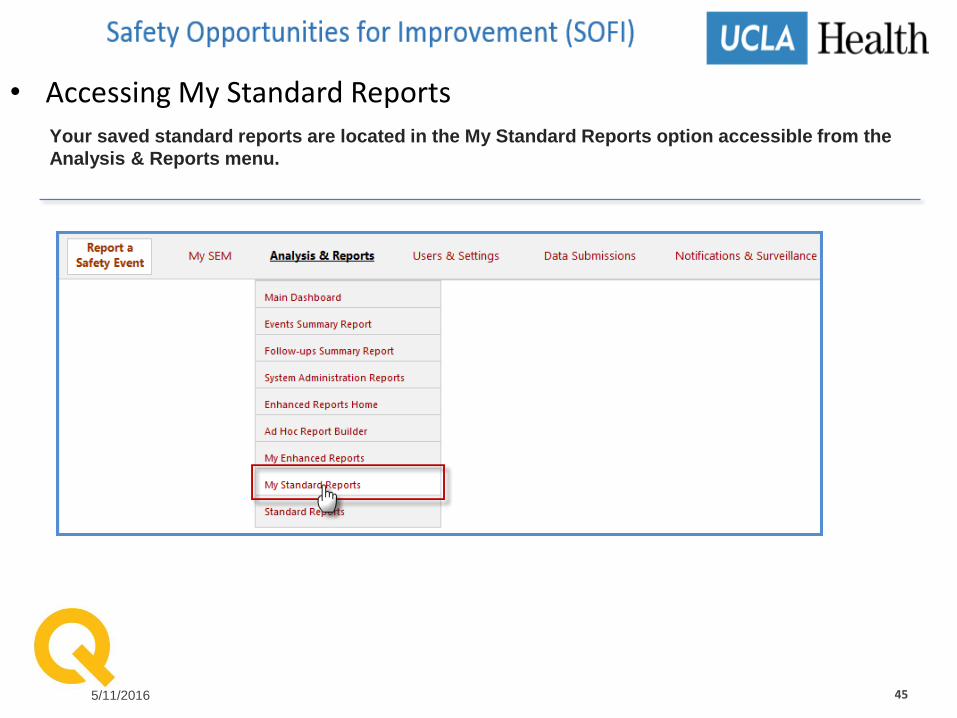
• Accessing My Standard Reports
5/11/2016 45
Your saved standard reports are located in the My Standard Reports option accessible from the
Analysis & Reports menu.
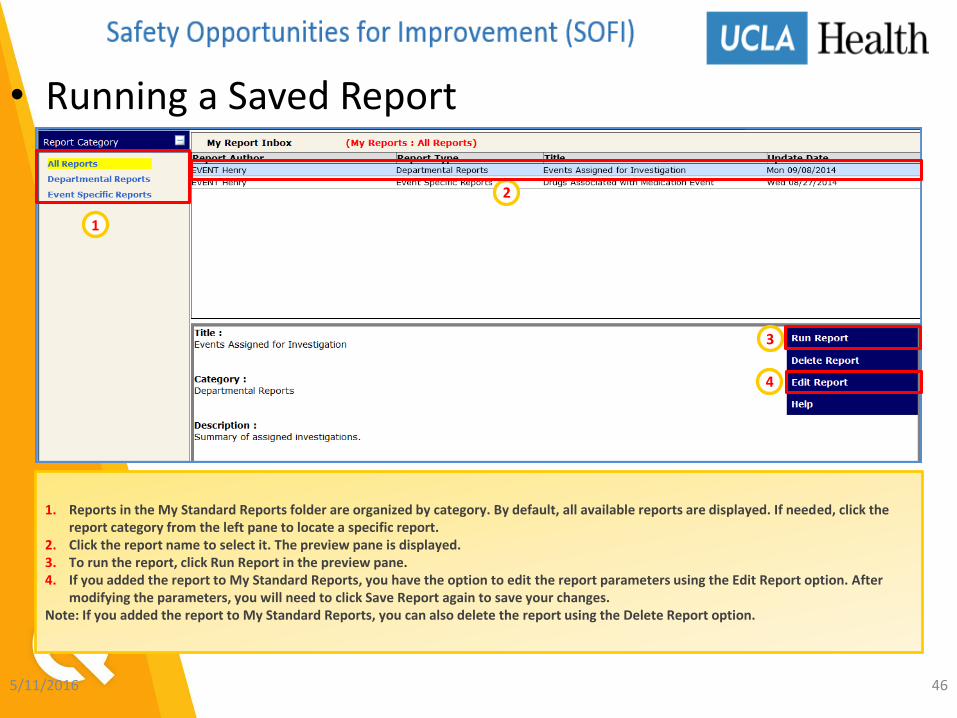
1. Reports in the My Standard Reports folder are organized by category. By default, all available reports are displayed. If needed, click the report category from the left pane to locate a specific report.
2. Click the report name to select it. The preview pane is displayed. 3. To run the report, click Run Report in the preview pane. 4. If you added the report to My Standard Reports, you have the option to edit the report parameters using the Edit Report option. After
modifying the parameters, you will need to click Save Report again to save your changes. Note: If you added the report to My Standard Reports, you can also delete the report using the Delete Report option.
• Running a Saved Report
5/11/2016 46
1
2
3
4
• Key Takeaways
5/11/2016 47
• Safety Event Manager with QPrecision reports are flexible, easy to run and cover multiple aspects of safety events.
• Select from a library of pre-defined report templates or create a custom report using the Report Builder option.
• For enhanced reports, use the Subscription option to set up a schedule for reports to run automatically.
• Save your reports as templates for later use or save the report data at the time it is generated.
• Tools & Resources
5/11/2016 48
• Help
– User Guide
– Online Help
• Quantros Support
• http://Quantros.com/supportportal.htm
• Quantros Member Center (customer only support portal): email request for login access to [email protected]
– Email: [email protected]
– Dial (408) 957-3300 (5:00 am – 6:00 pm PST, Monday –Friday)
– For emergency help after support hours, call 1-888-827-4248, option 2. This service is for Severity 1 issues only.