Embed Size (px)
Citation preview
InvestorPresentation
Forward - Looking Statements
2
This presentation may contain certain forward-looking statements concerning our future performance and should be considered as good
faith estimates made by the Company. These forward-looking statements reflect management expectations and are based upon currently available data. Actual results are subject to future events and uncertainties, which
could materially impact the Company’s actual performance.
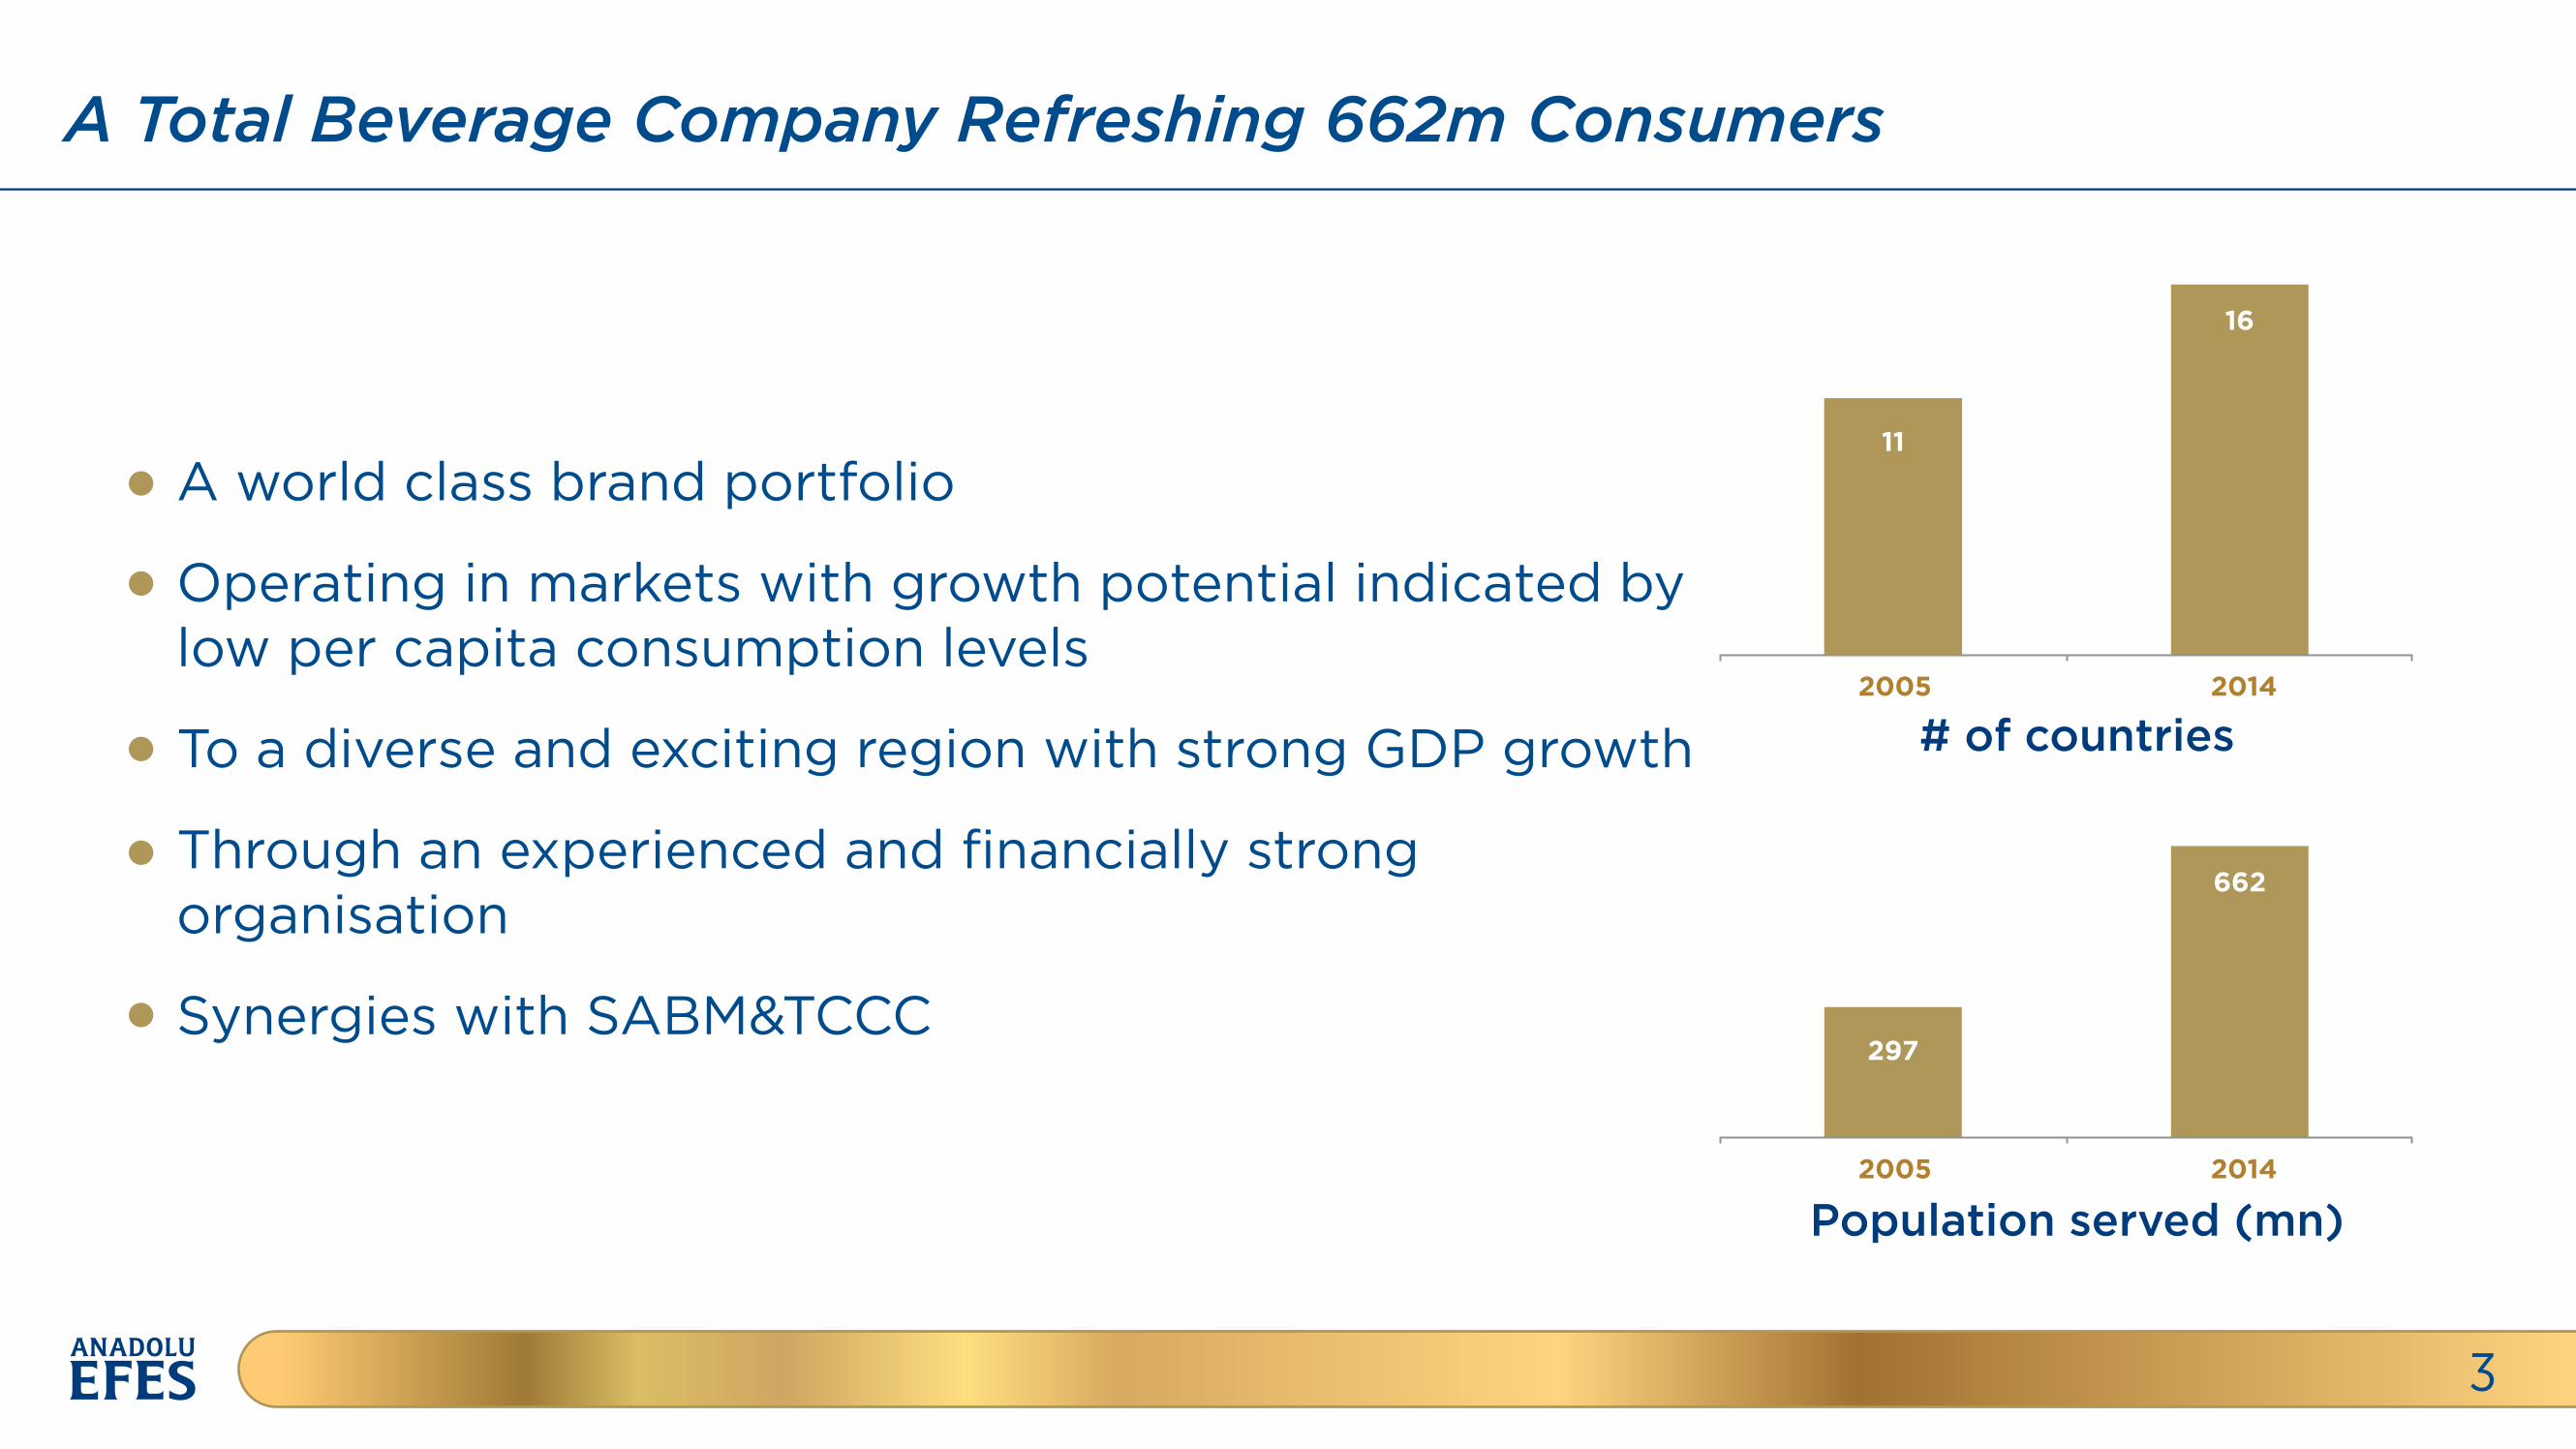
A Total Beverage Company Refreshing 662m Consumers
3
A world class brand portfolio
Operating in markets with growth potential indicated by low per capita consumption levels
To a diverse and exciting region with strong GDP growth
Through an experienced and financially strong organisation
Synergies with SABM&TCCC
2005 2014
16
# of countries
2005
297
2014
662
Population served (mn)
11
Public
25.6%
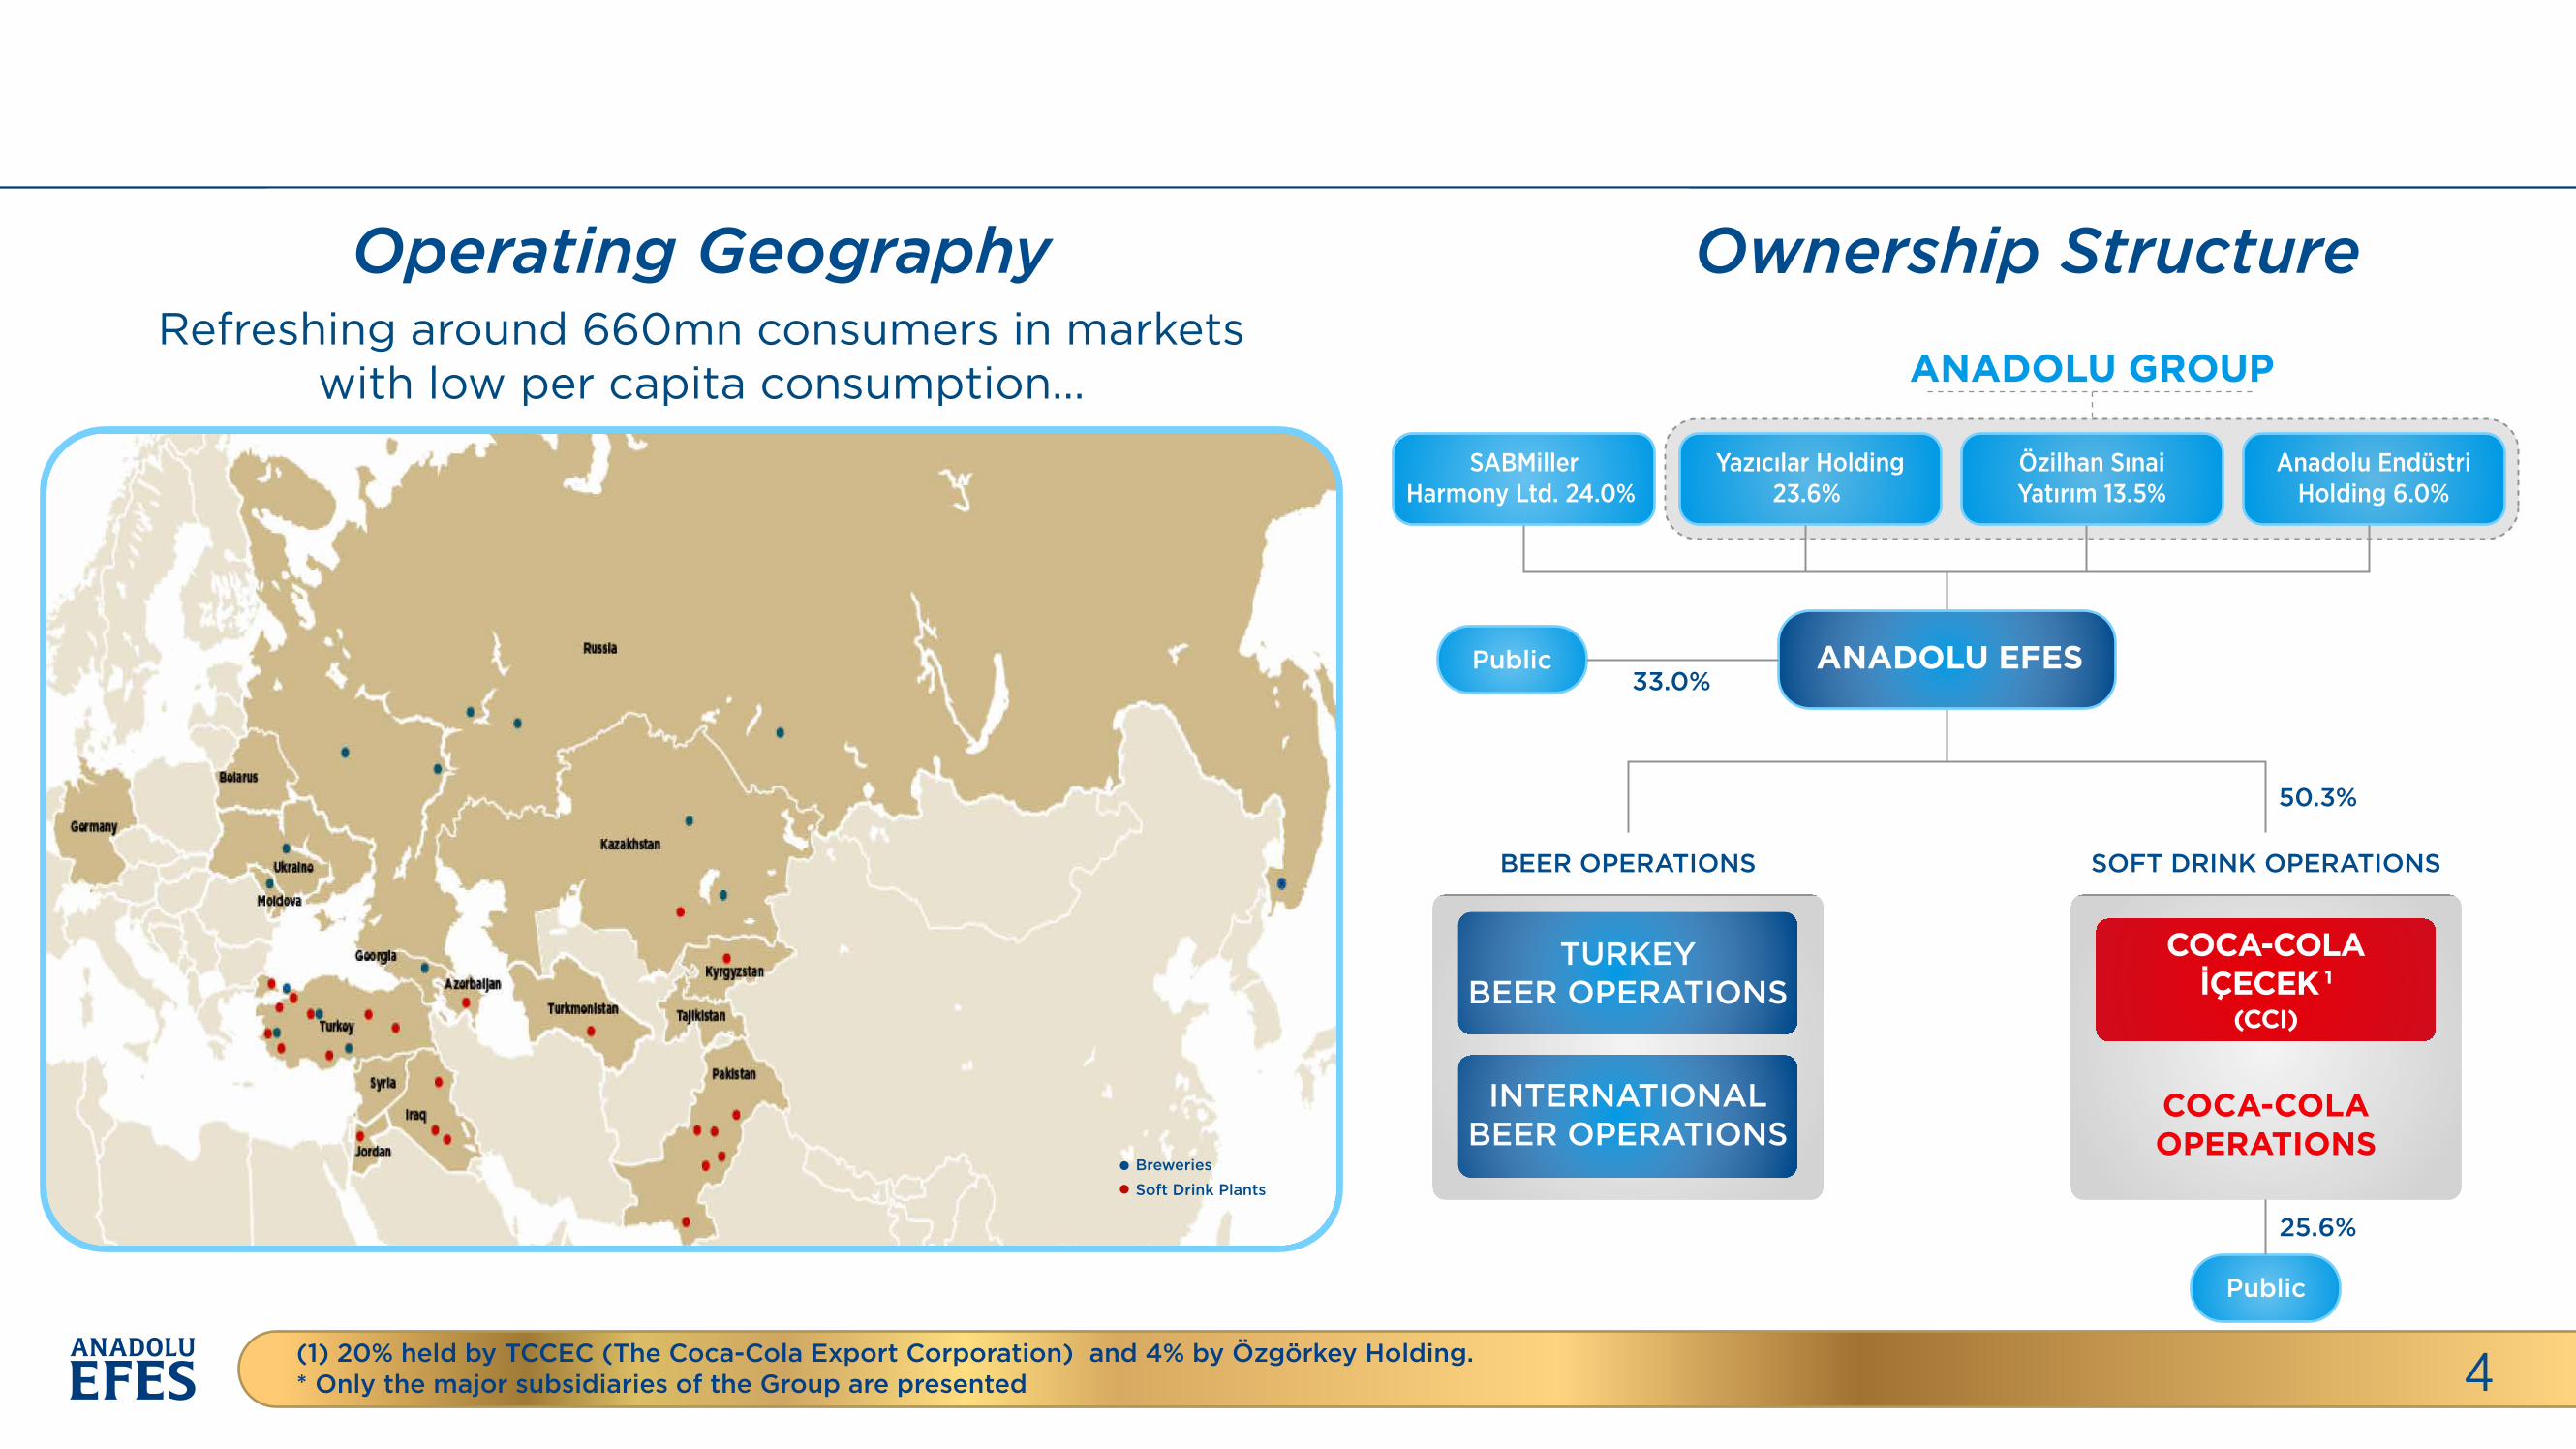
Operating Geography Ownership Structure
4
Refreshing around 660mn consumers in markets with low per capita consumption... ANADOLU GROUP
SABMillerHarmony Ltd. 24.0%
Yazıcılar Holding23.6%
Özilhan SınaiYatırım 13.5%
Anadolu EndüstriHolding 6.0%
ANADOLU EFES33.0%
50.3%
Public
BEER OPERATIONS SOFT DRINK OPERATIONS
(1) 20% held by TCCEC (The Coca-Cola Export Corporation) and 4% by Özgörkey Holding.* Only the major subsidiaries of the Group are presented
TURKEYBEER OPERATIONS
INTERNATIONALBEER OPERATIONS
COCA-COLAOPERATIONS
COCA-COLAİÇECEK 1
(CCI)
Breweries
Soft Drink Plants
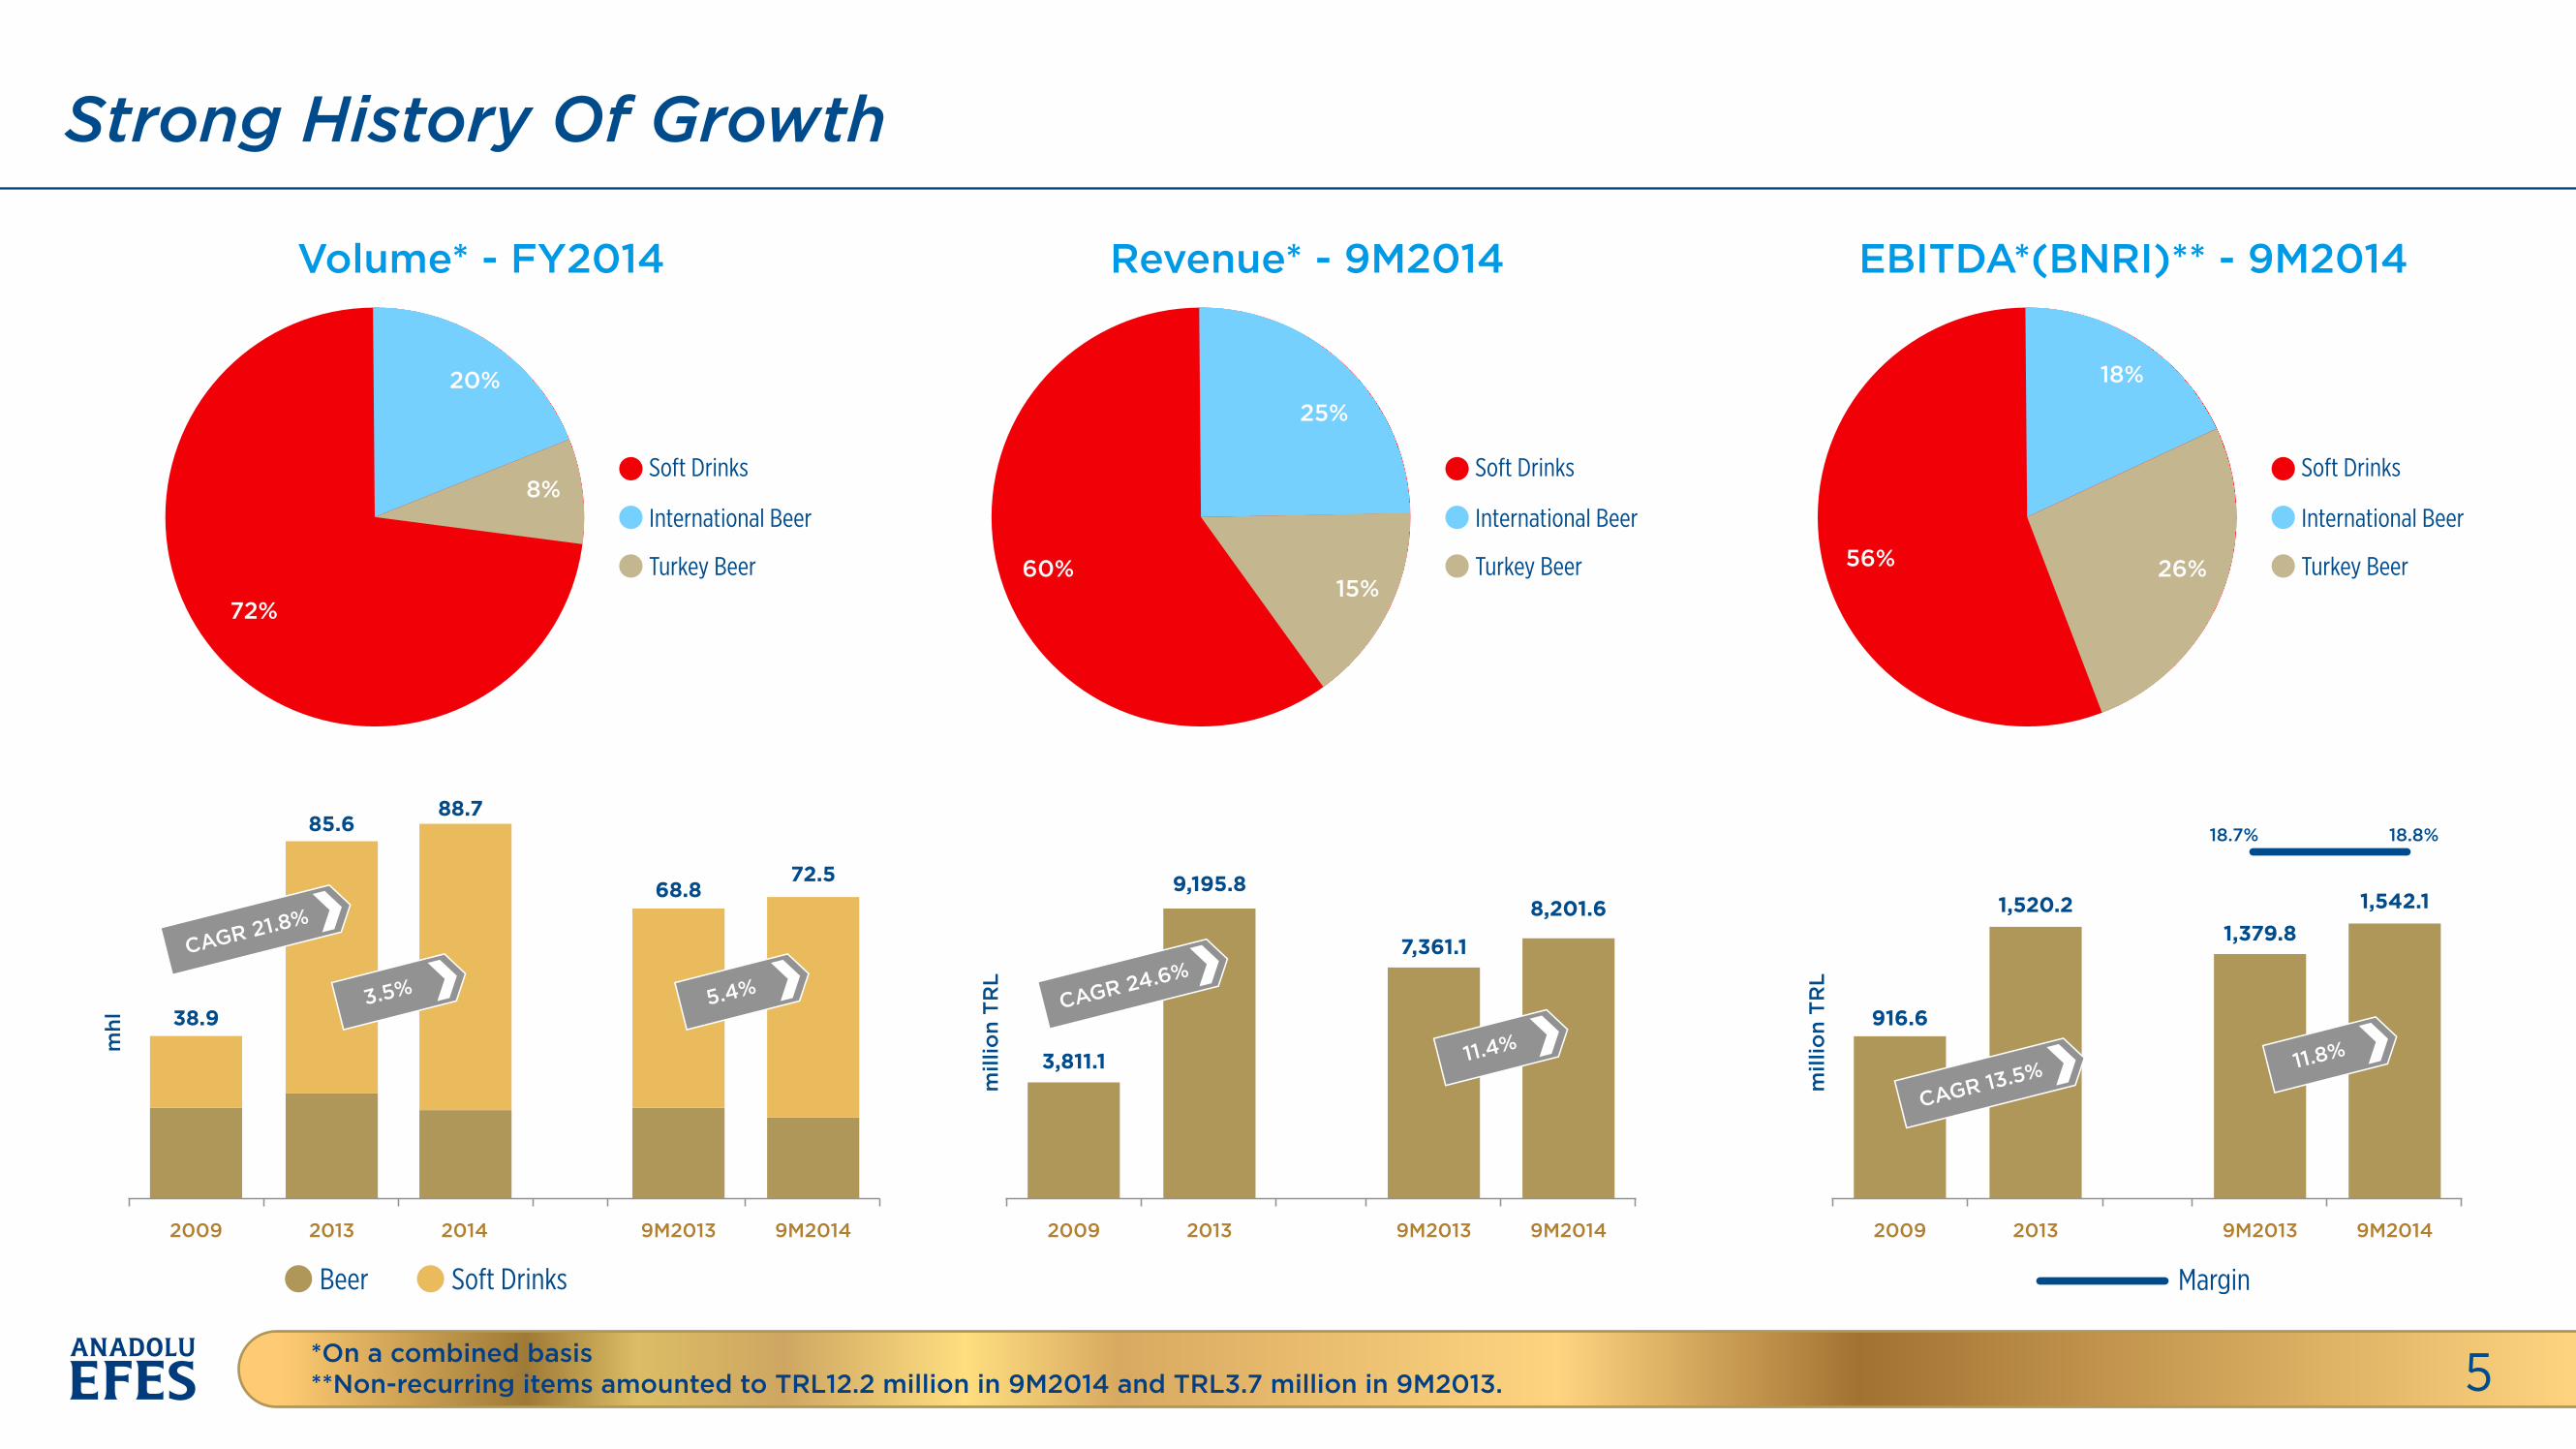
Strong History Of Growth
5*On a combined basis**Non-recurring items amounted to TRL12.2 million in 9M2014 and TRL3.7 million in 9M2013.
Volume* - FY2014
20%
8%
72%
Soft Drinks
International Beer
Turkey Beer
Revenue* - 9M2014
25%
15% 60%
Soft Drinks
International Beer
Turkey Beer
EBITDA*(BNRI)** - 9M2014
18%
26% 56%
Soft Drinks
International Beer
Turkey Beer
mhl
2009 2013 2014 9M2013 9M2014
38.9
85.688.7
68.872.5
Beer Soft Drinks
CAGR 21.8%
5.4%3.5%m
illio
n T
RL
2009 2013 9M2013 9M2014
3,811.1
9,195.8
7,361.1
8,201.6
CAGR 24.6%
11.4%
mill
ion
TR
L
2009 2013 9M2013
18.7% 18.8%
9M2014
916.6
1,520.21,379.8
1,542.1
CAGR 13.5% 11.8%
Margin
Strategy For Sustainable Value Creation
6
Consumer led portfolio strategy-capturing value in soft drinks and beer
Leverage strategic alliances to expand into new markets, categories and brands
Operate through two distinct companies to maintain focus, build capability & support investment
In beer markets...
Restore margins & shares through continued focus on cost reduction, accelerated capability development & execution of brand/package development strategy
In CCI markets...
Drive sparkling category in Turkey, expand margins in Pakistan & Iraq, expand sparkling portfolio, profitable growth in juice/iced tea
Continued focus on sustainability, capability, development and risk management
Improve balance sheet health, FCF, working capital management & a diverse funding strategy
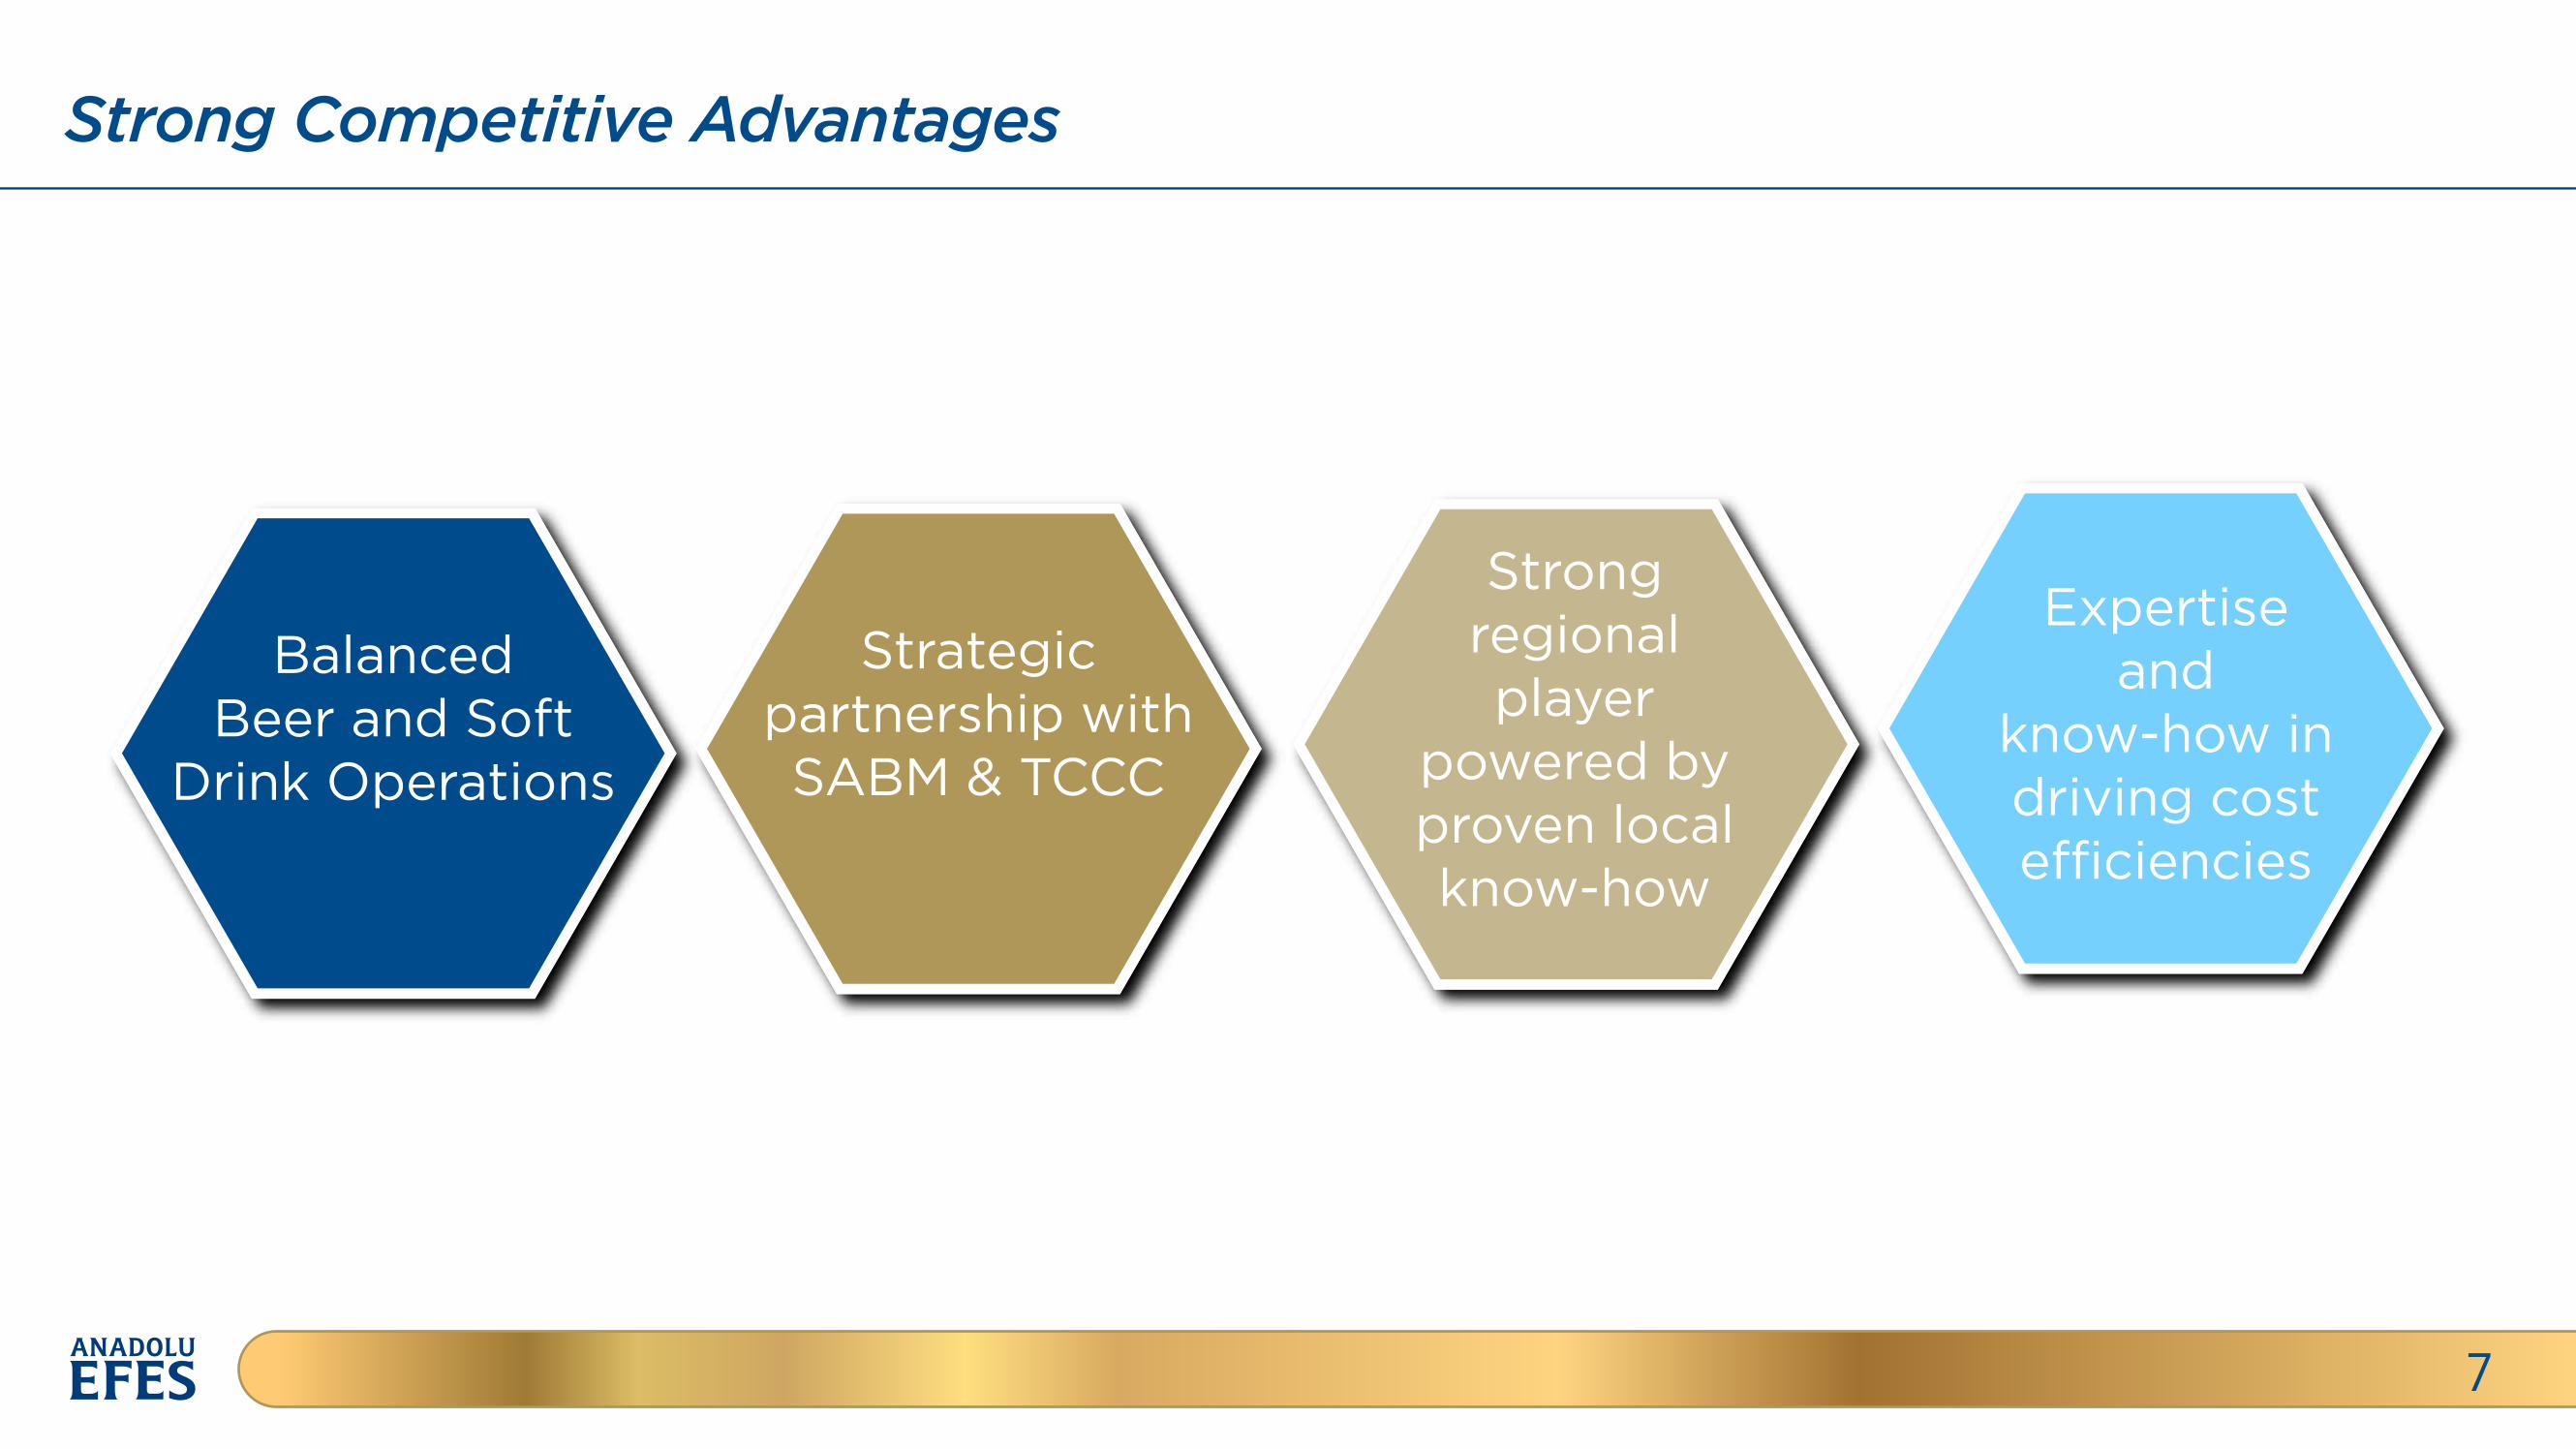
Strong Competitive Advantages
7
Balanced Beer and Soft
Drink Operations
Strong regional player
powered by proven local know-how
Expertise and
know-how in driving cost e�ciencies
Strategic partnership with SABM & TCCC
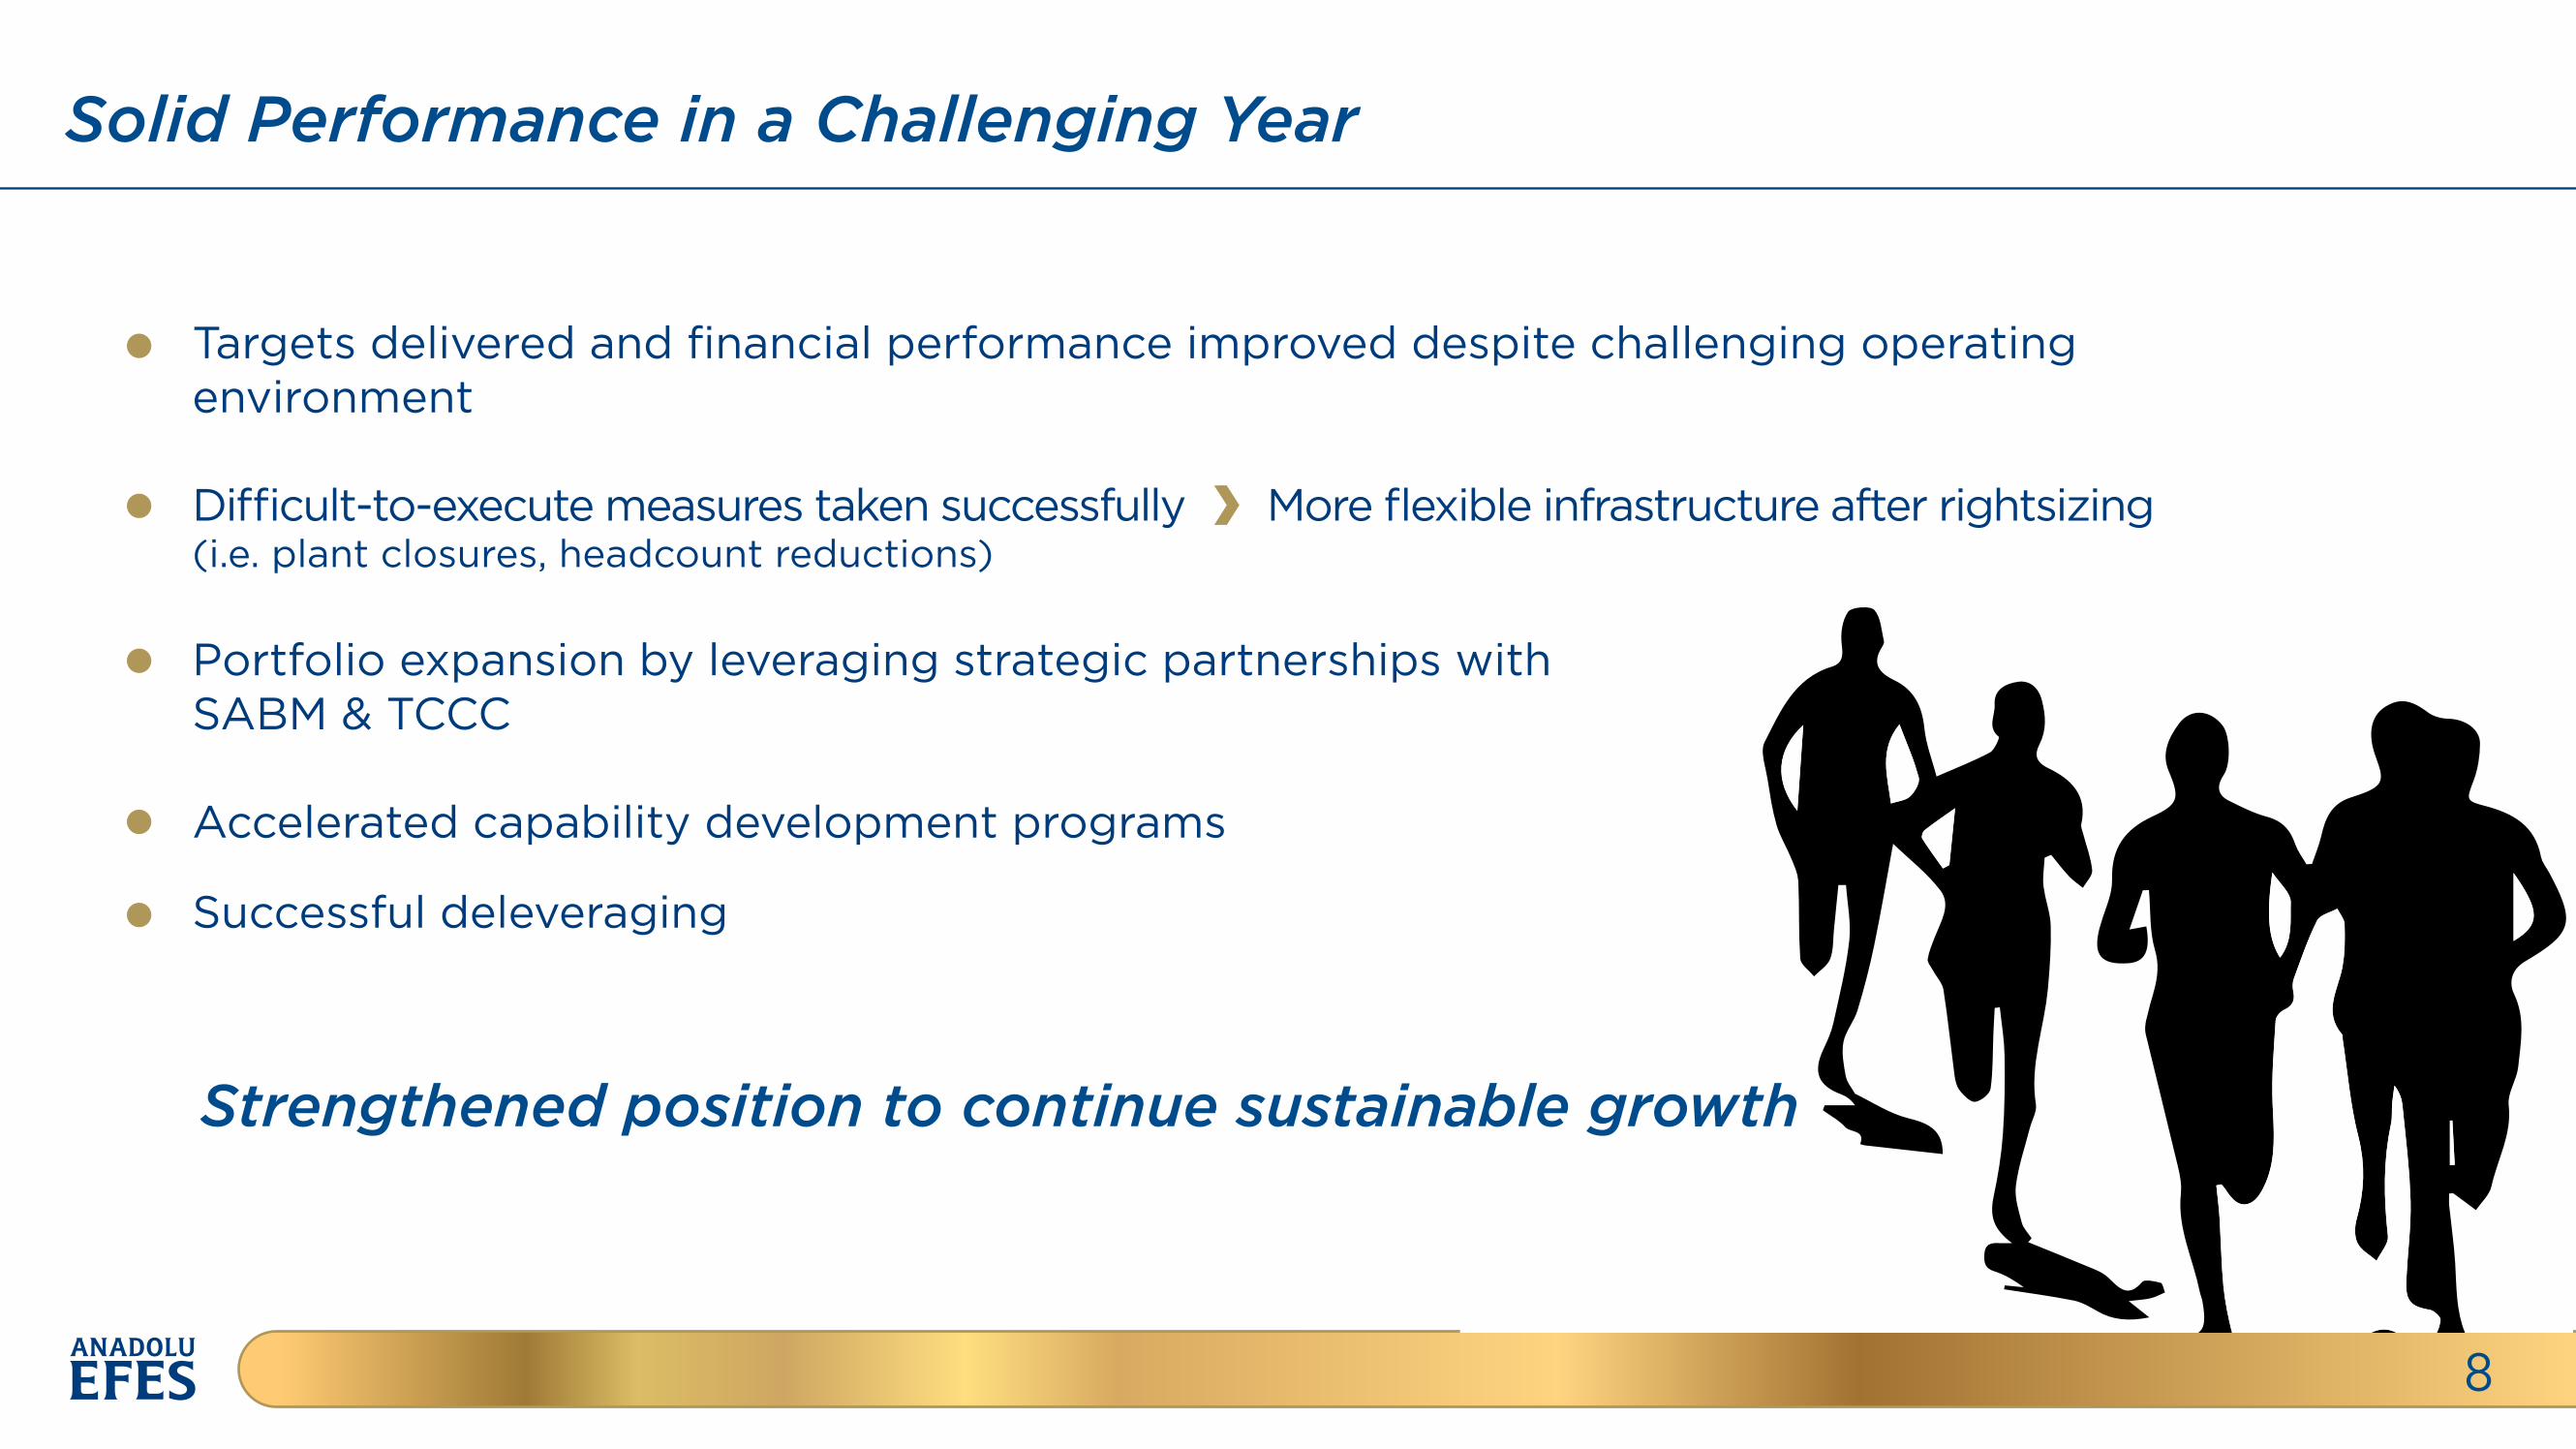
Strengthened position to continue sustainable growth
Solid Performance in a Challenging Year
8
Targets delivered and financial performance improved despite challenging operating environment
Di�cult-to-execute measures taken successfully More flexible infrastructure after rightsizing (i.e. plant closures, headcount reductions)
Portfolio expansion by leveraging strategic partnerships withSABM & TCCC
Accelerated capability development programs
Successful deleveraging
Beer Operations
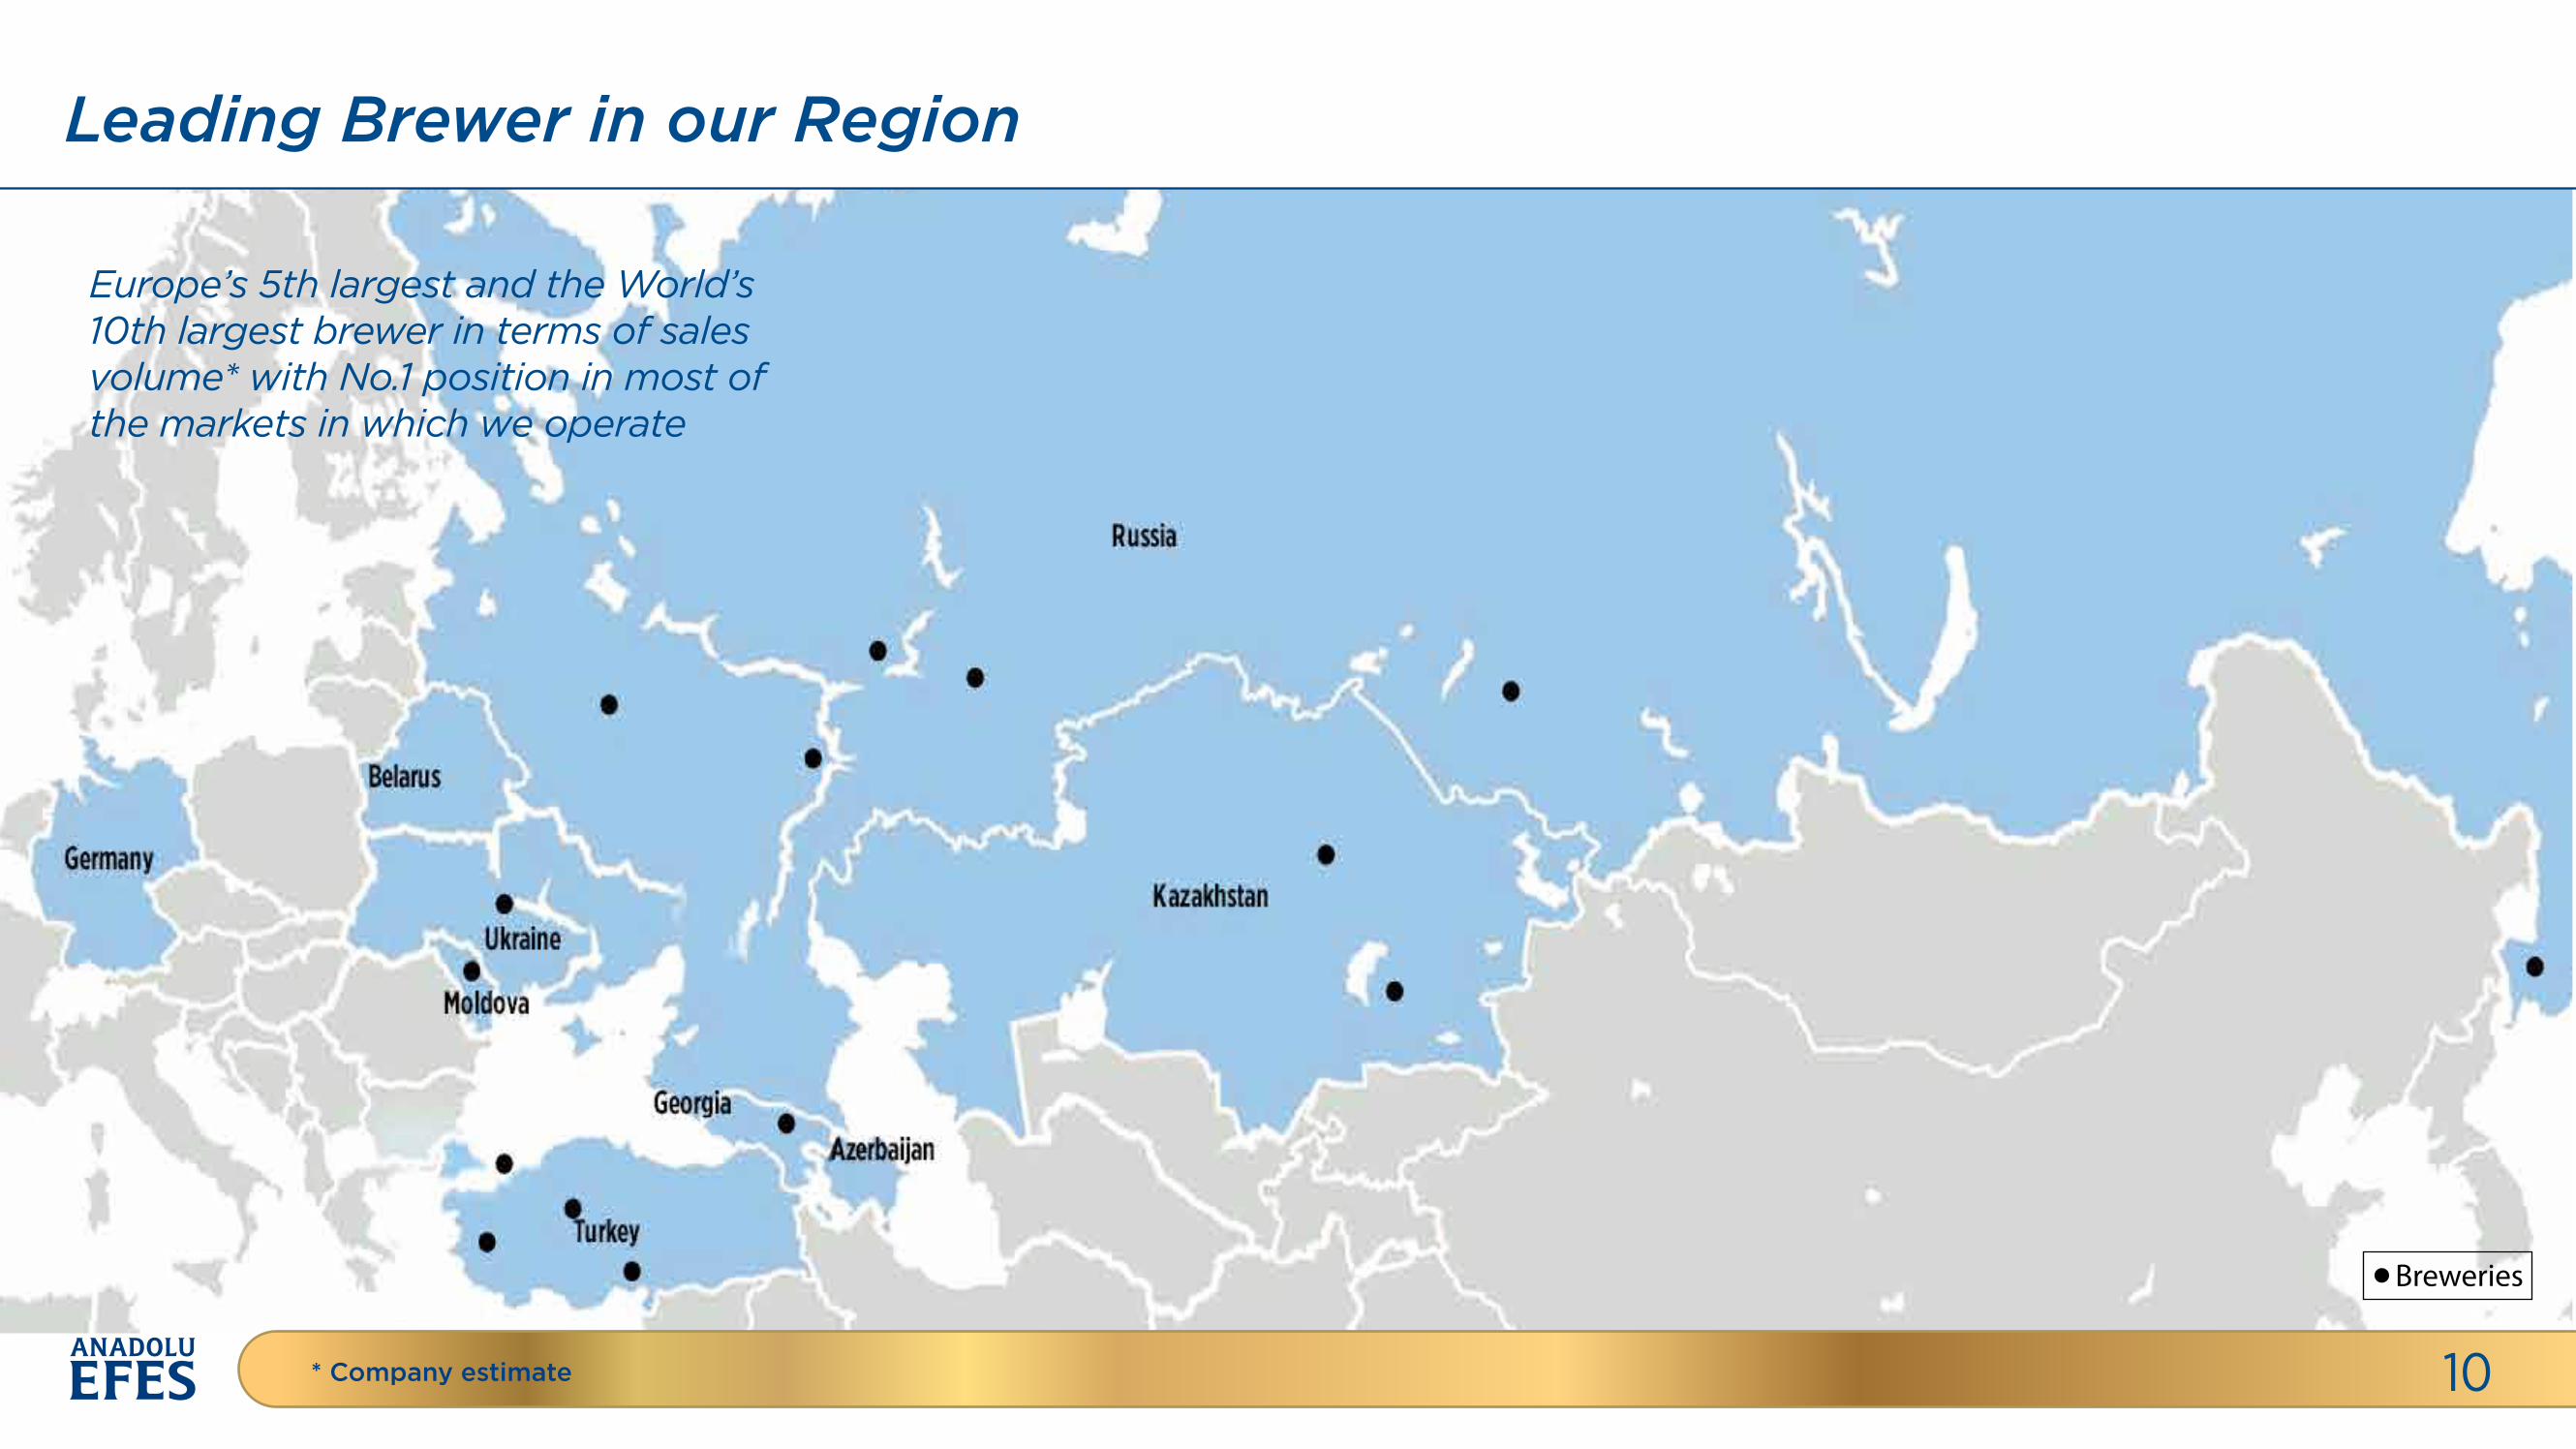
Europe’s 5th largest and the World’s 10th largest brewer in terms of sales volume* with No.1 position in most of the markets in which we operate
Leading Brewer in our Region
10* Company estimate
Breweries
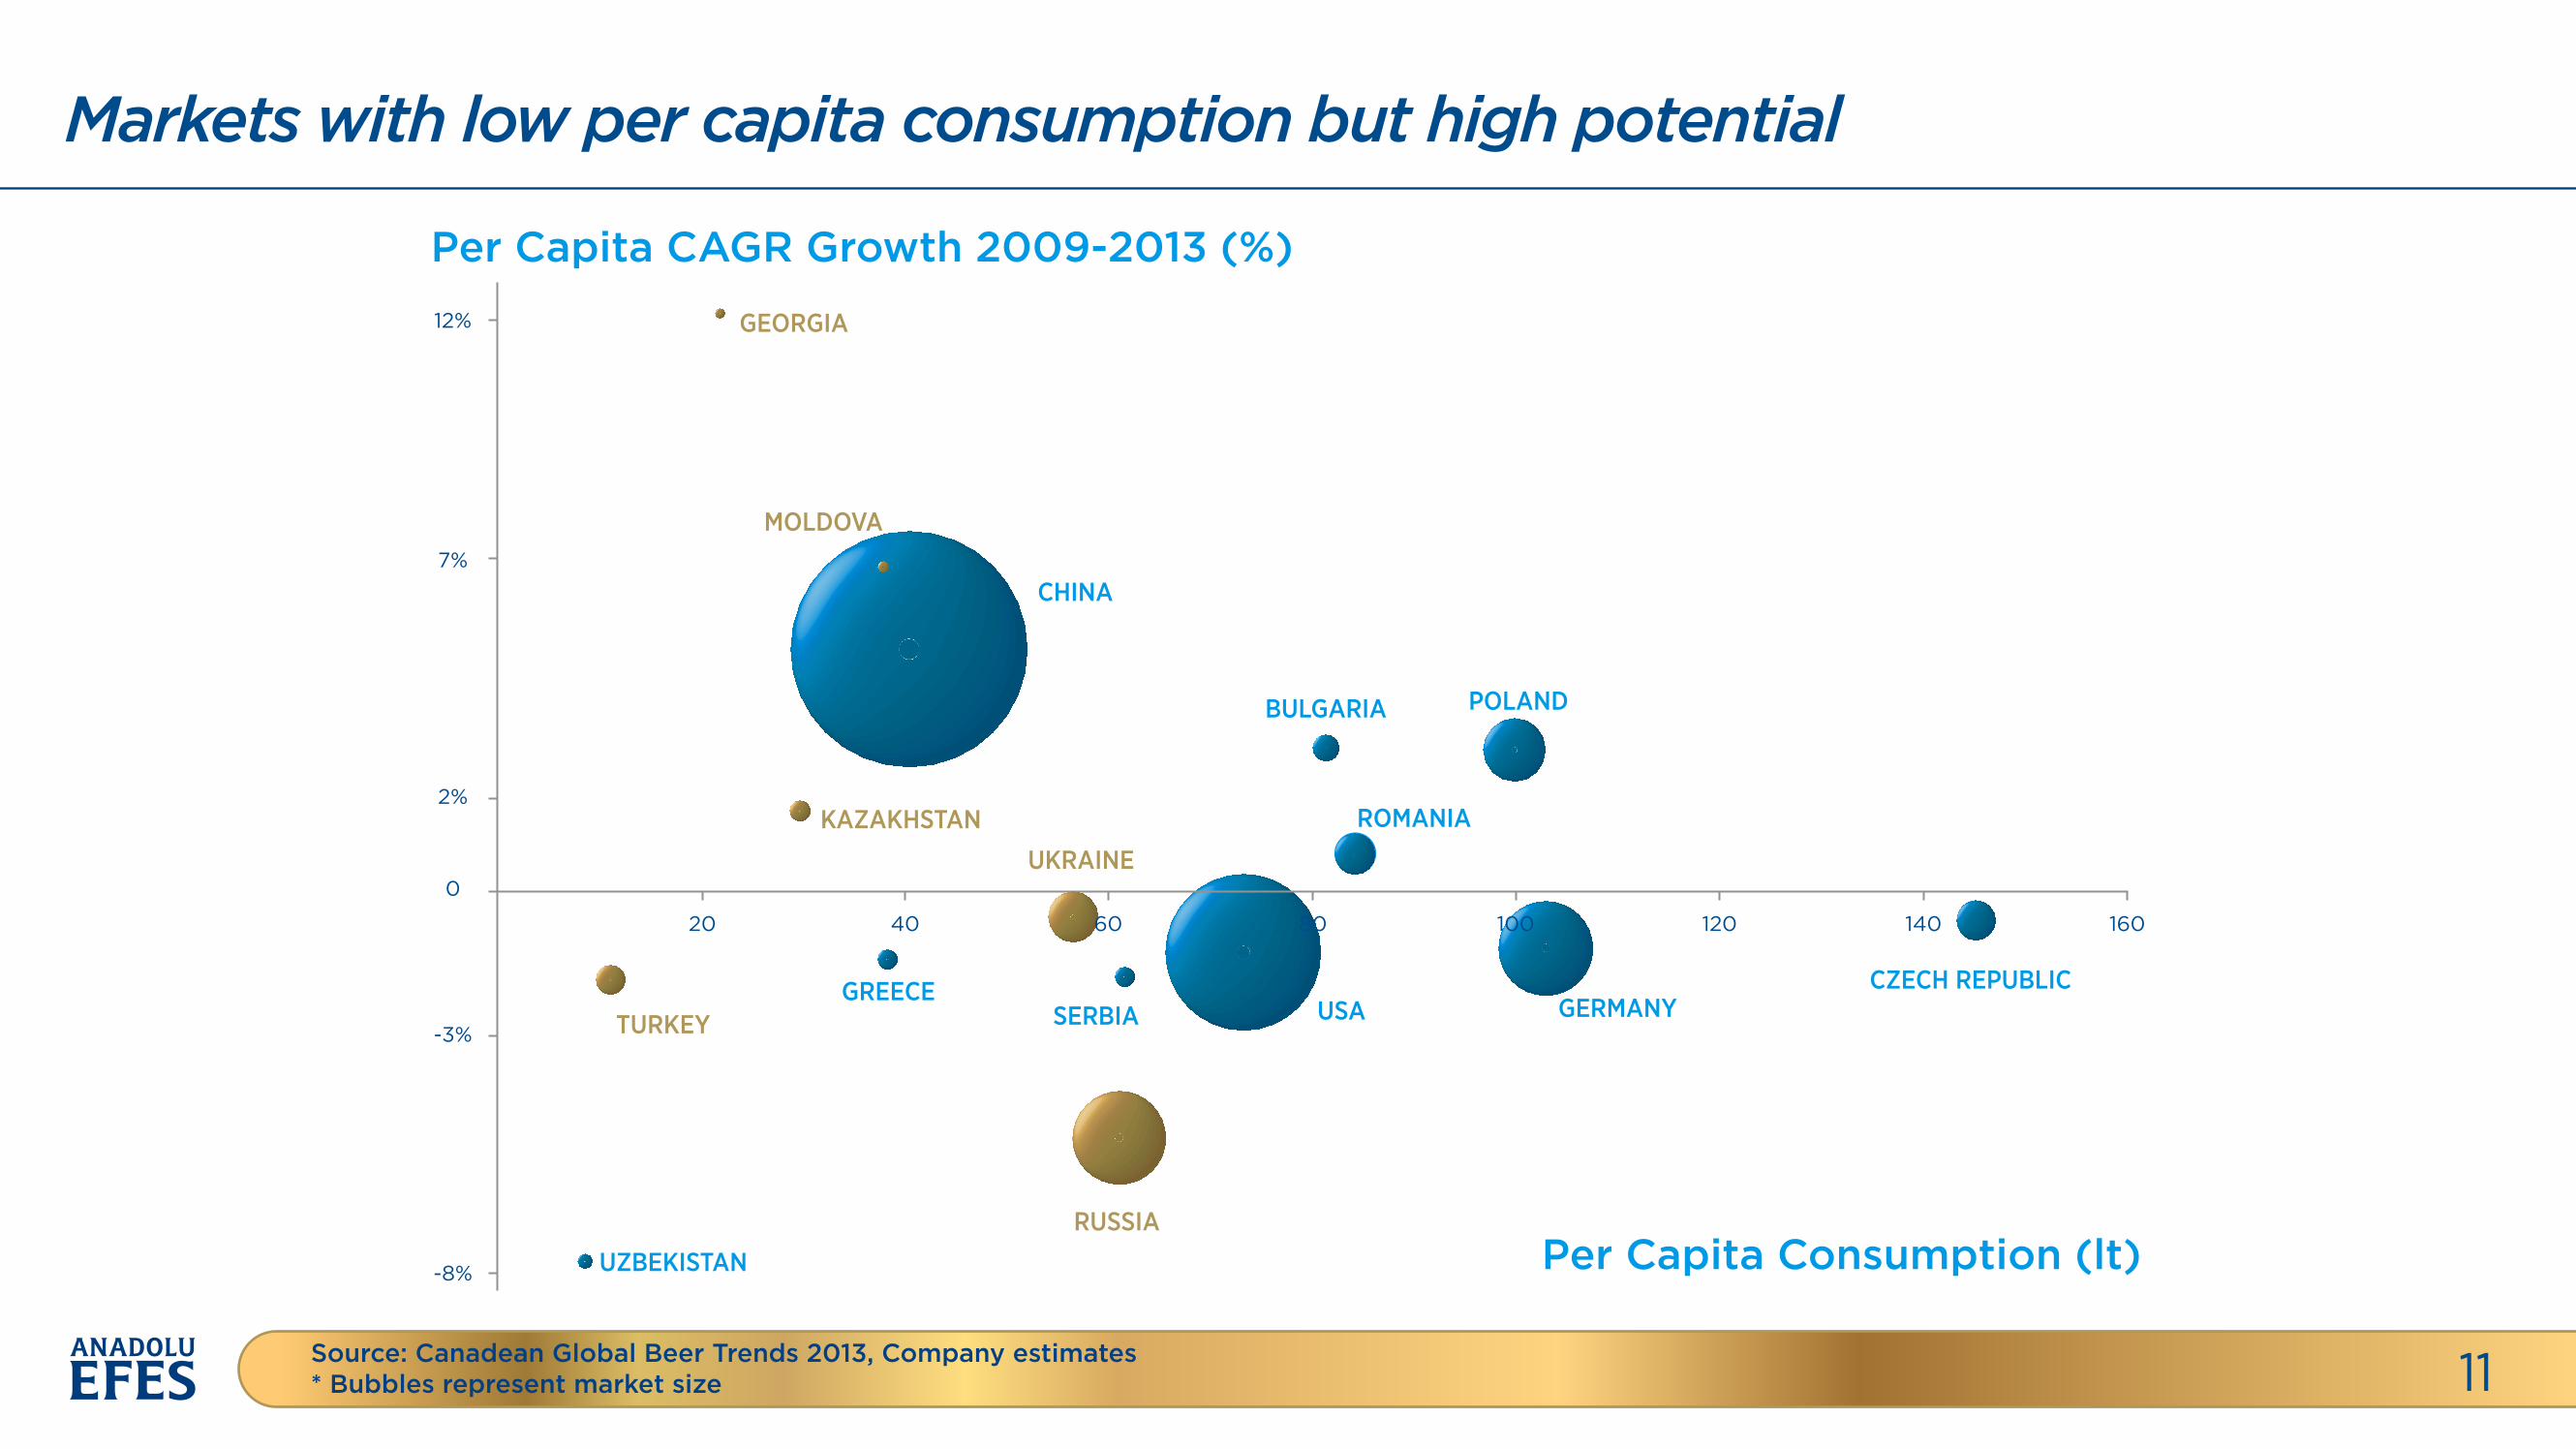
Markets with low per capita consumption but high potential
11Source: Canadean Global Beer Trends 2013, Company estimates* Bubbles represent market size
Per Capita CAGR Growth 2009-2013 (%)
GEORGIA
MOLDOVA
KAZAKHSTAN
UKRAINE
TURKEY
RUSSIA
CHINA
BULGARIA POLAND
ROMANIA
GERMANYCZECH REPUBLIC
USASERBIAGREECE
UZBEKISTAN Per Capita Consumption (lt)
12%
7%
2%
120 140 160
-3%
-8%
0
20 40 80 10060
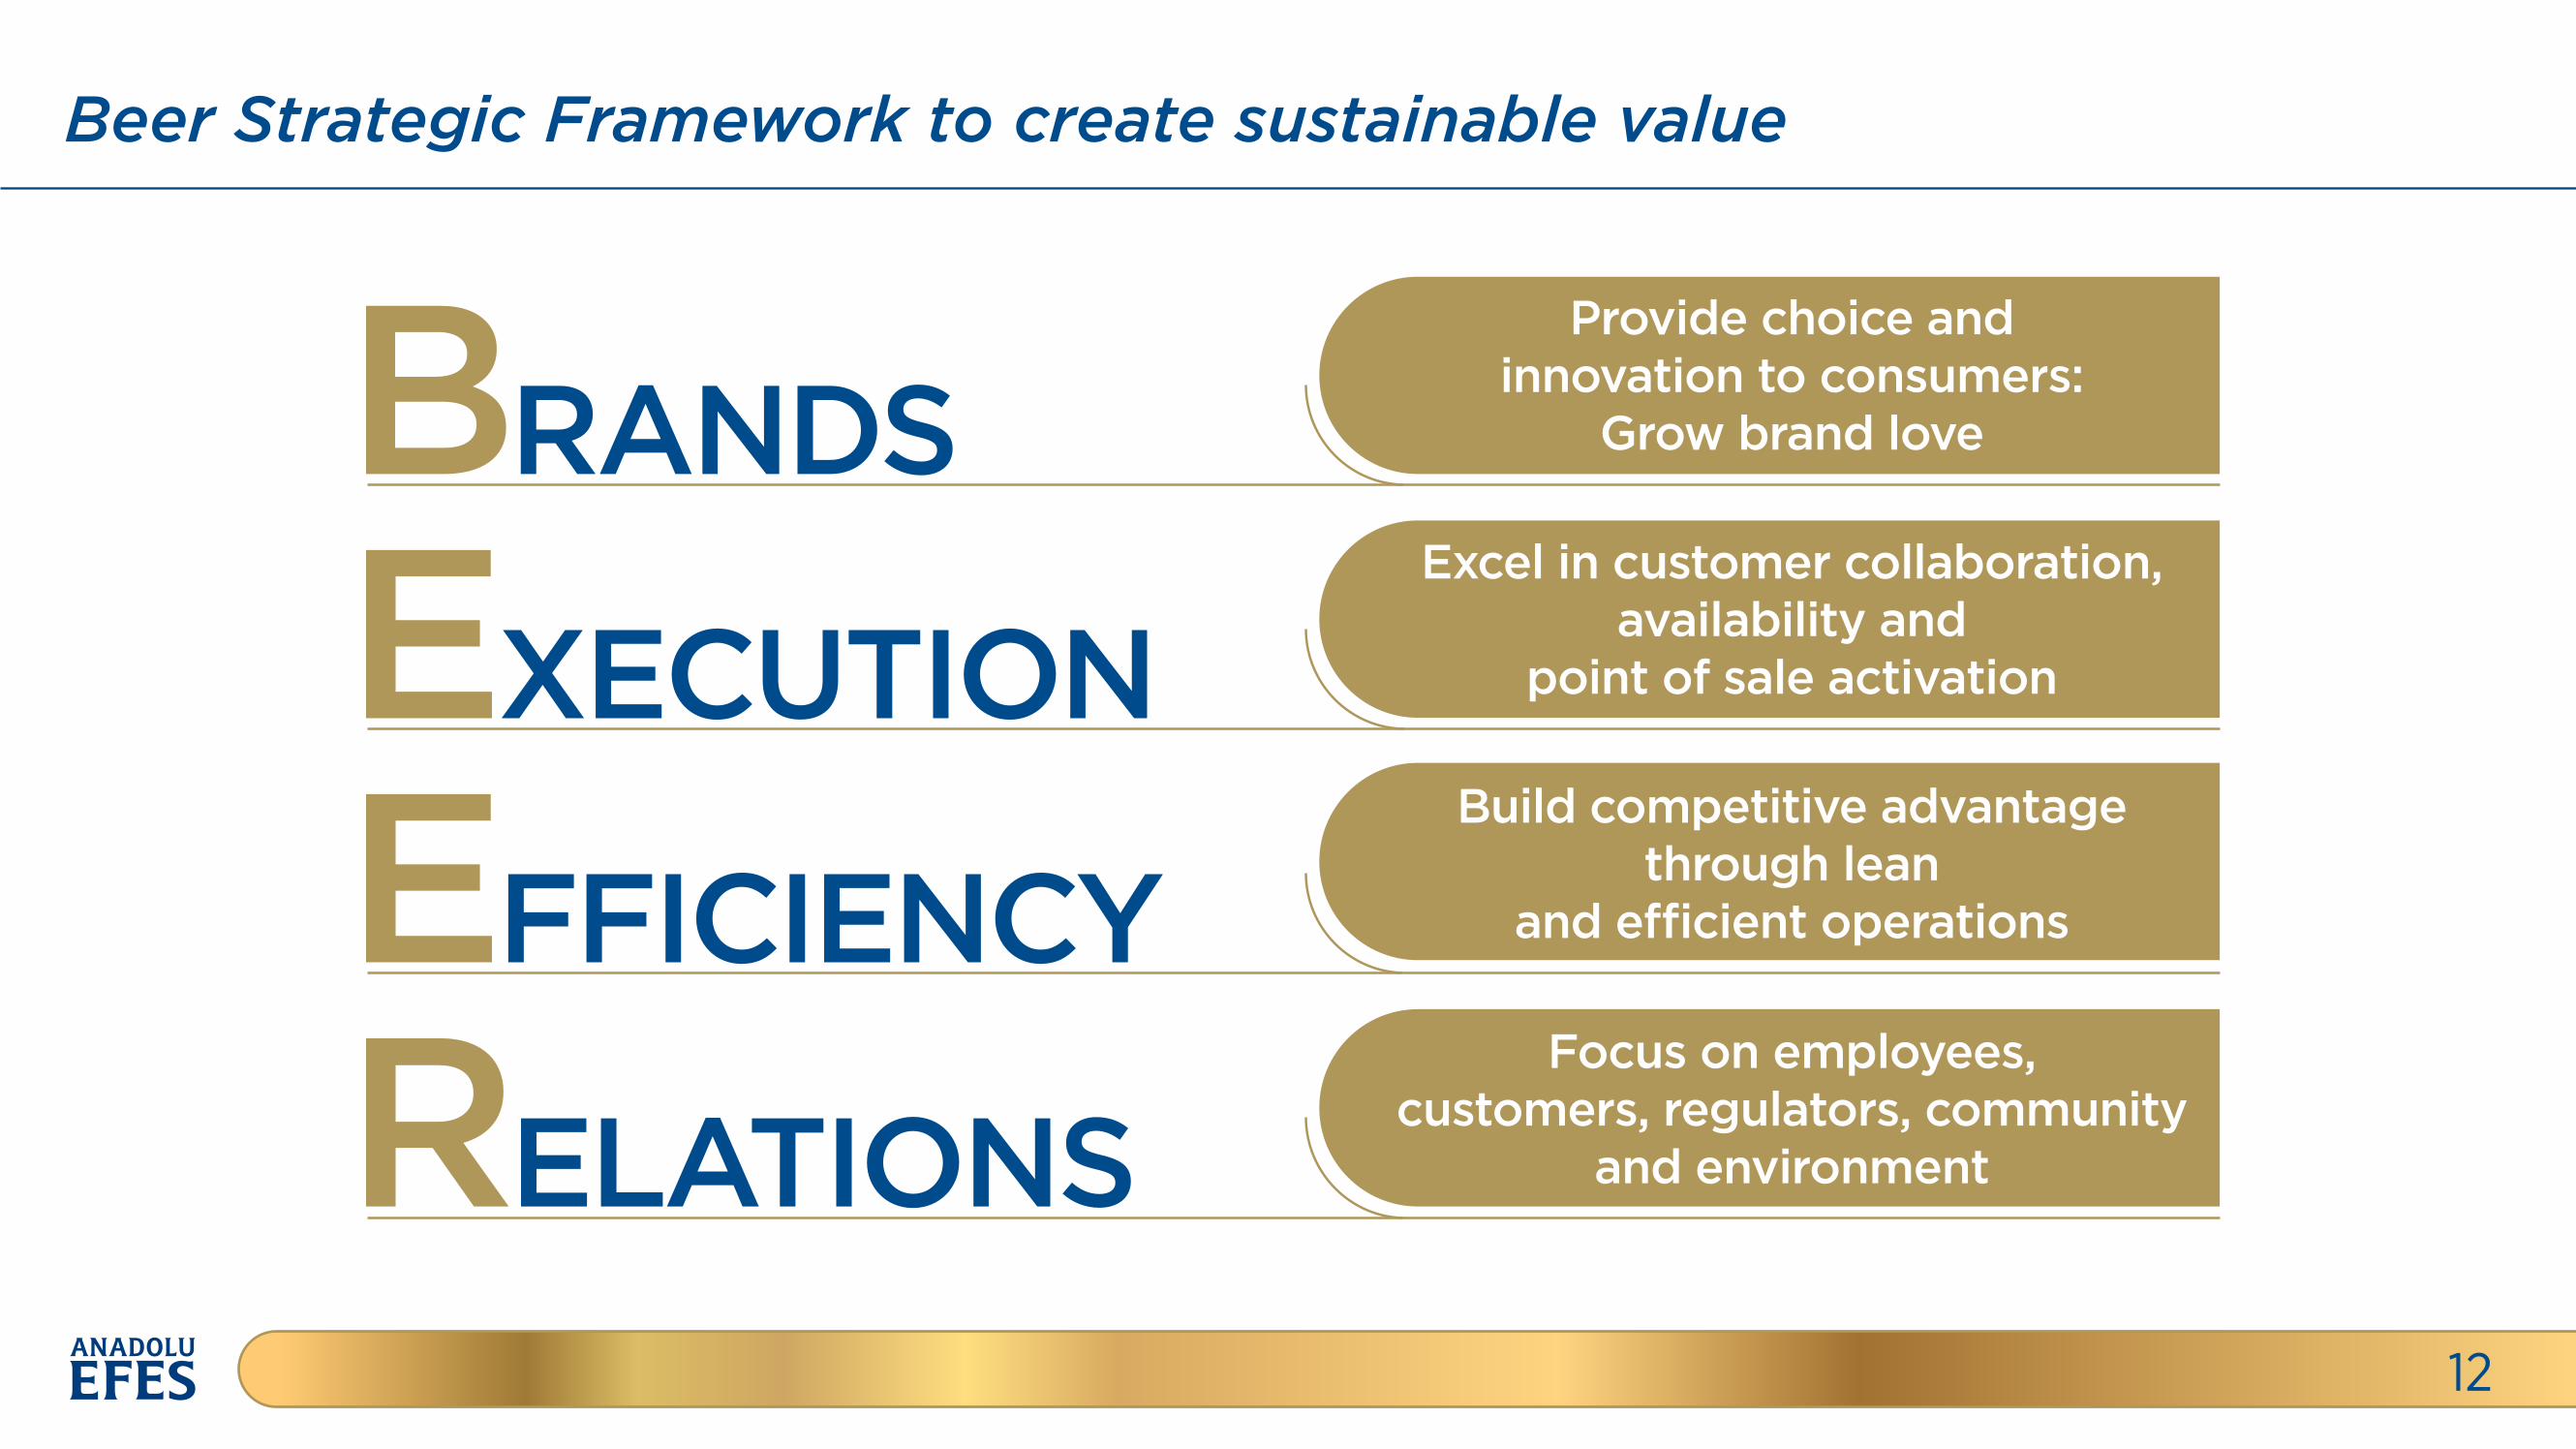
Beer Strategic Framework to create sustainable value
12
BRANDS
EXECUTION
EFFICIENCY
RELATIONS
Provide choice andinnovation to consumers:
Grow brand love
Excel in customer collaboration,availability and
point of sale activation
Build competitive advantagethrough lean
and e�cient operations
Focus on employees,customers, regulators, community
and environment
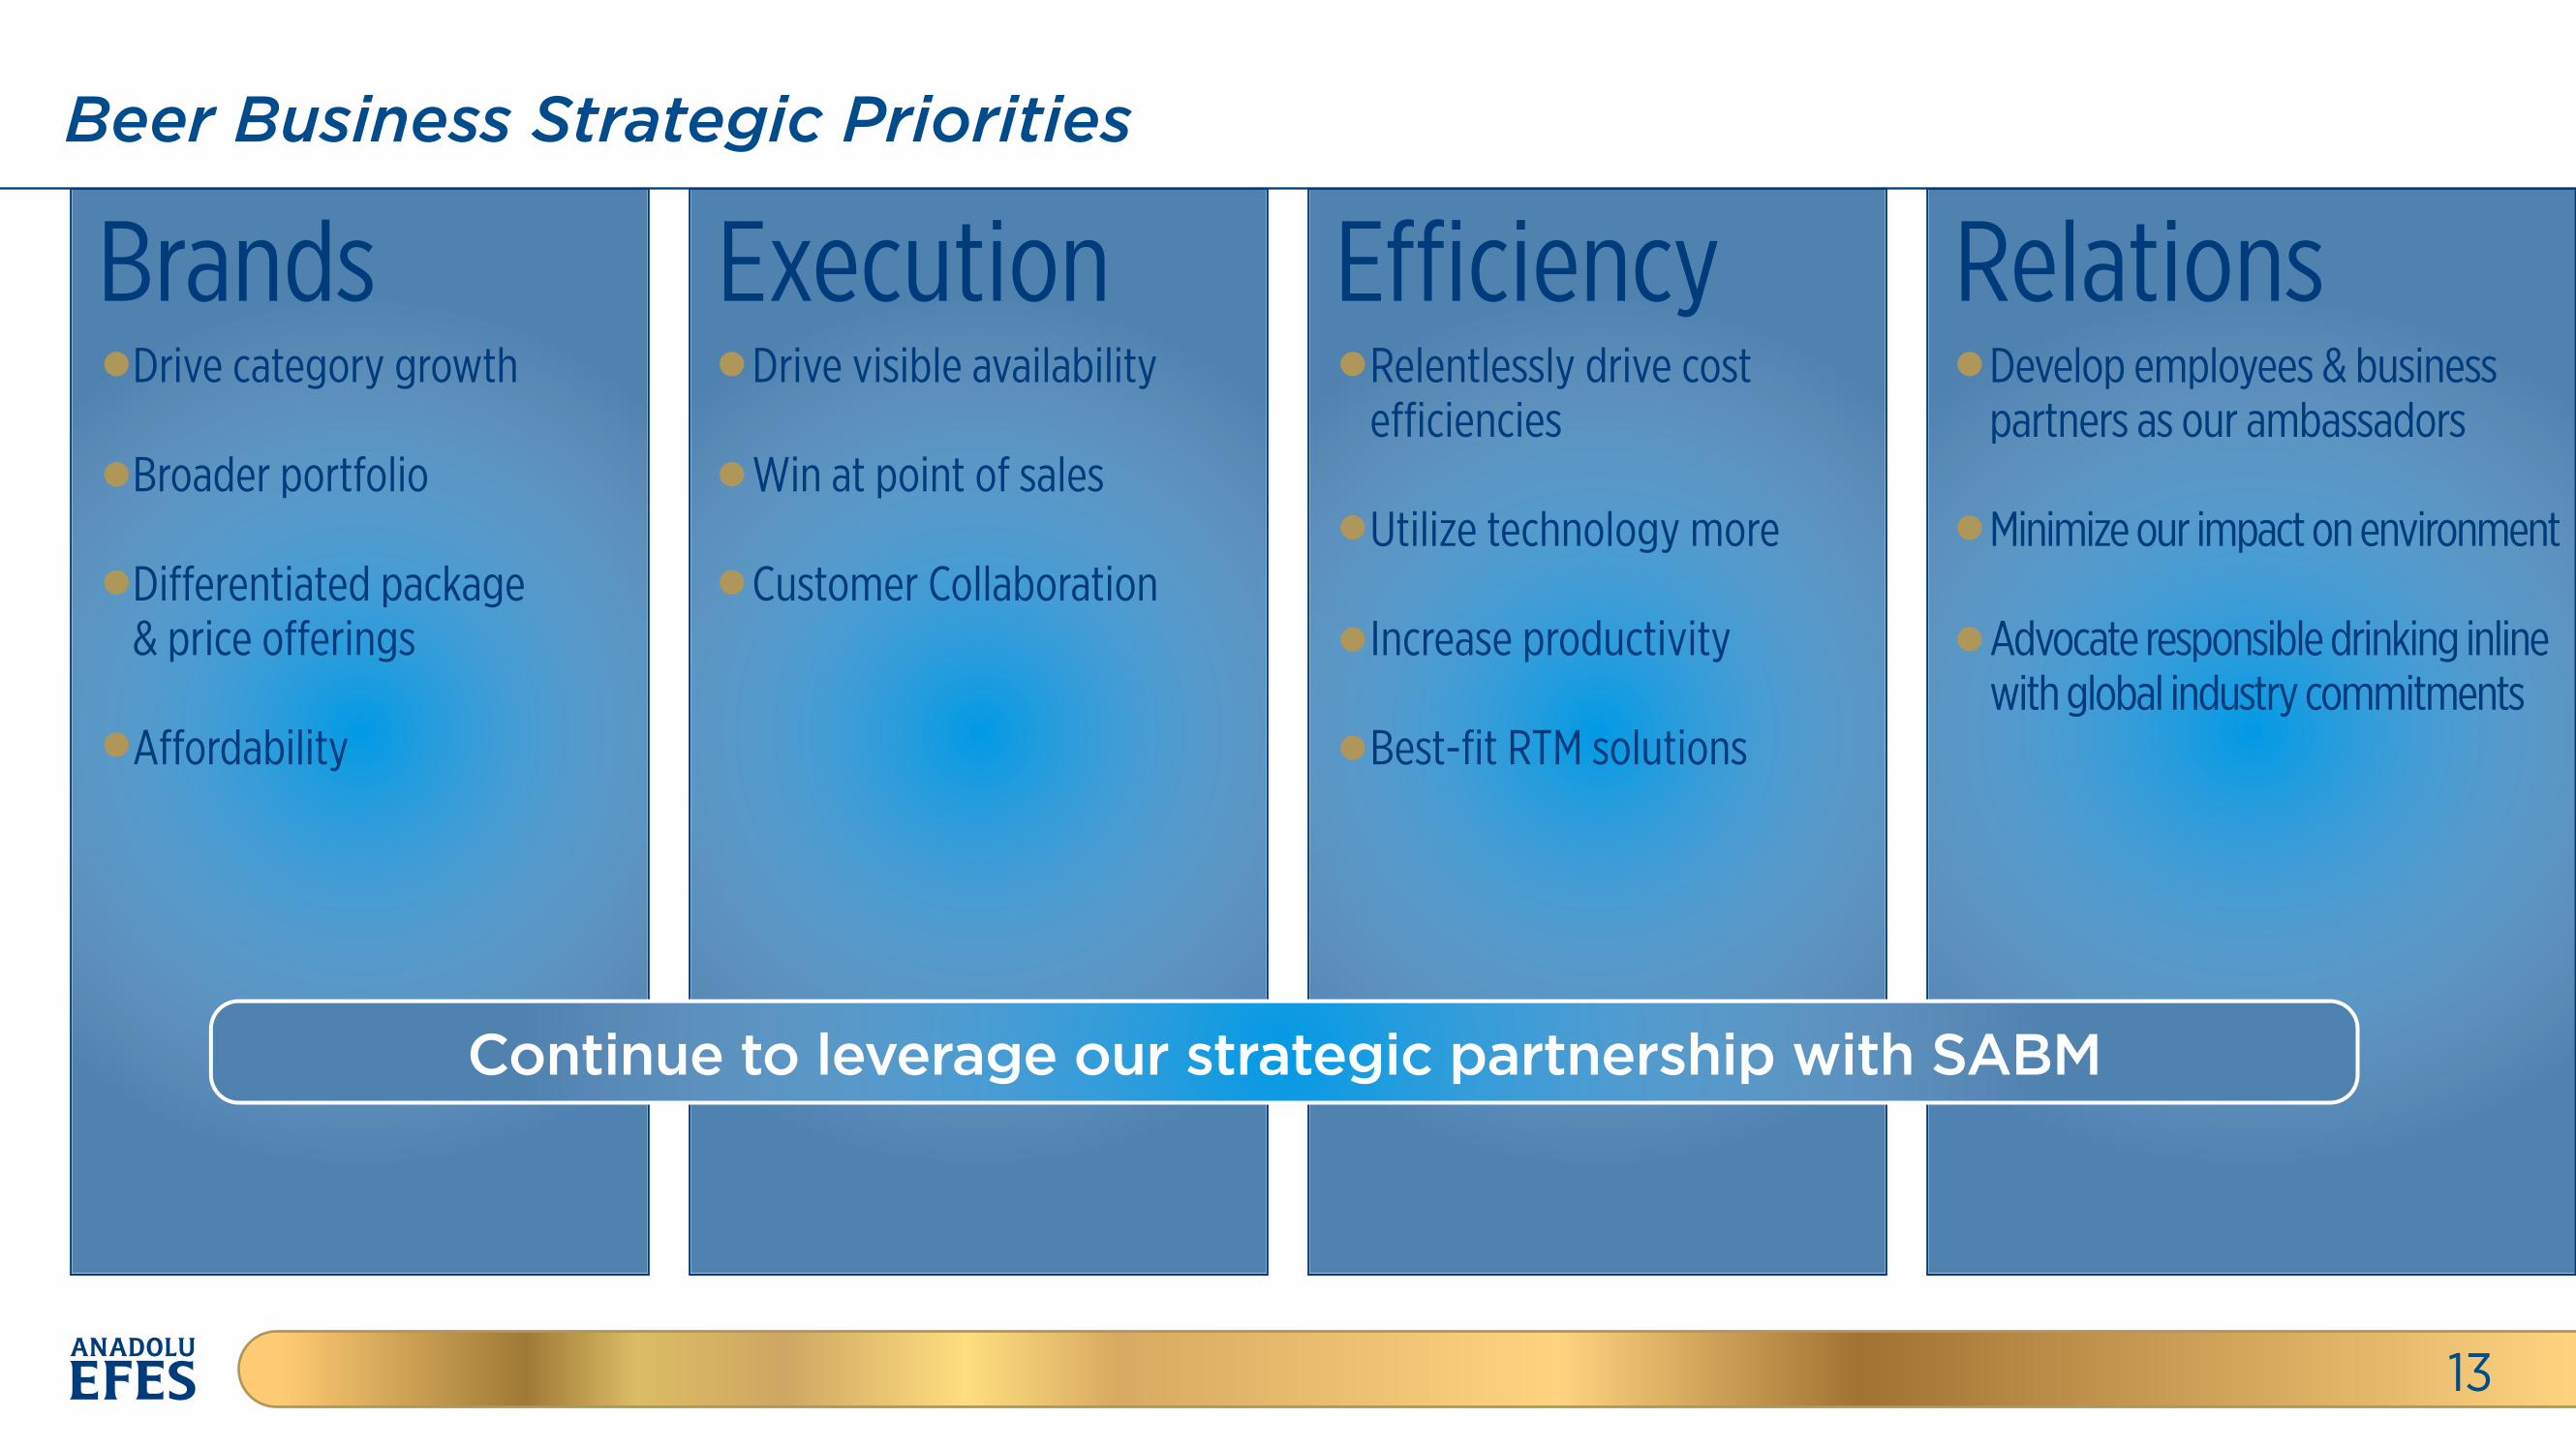
Beer Business Strategic Priorities
13
Brands Execution E�iciency RelationsDrive category growth
Broader portfolio
Di�erentiated package& price o�erings
A�ordability
Drive visible availability
Win at point of sales
Customer Collaboration
Relentlessly drive coste�iciencies
Utilize technology more
Increase productivity
Best-fit RTM solutions
Develop employees & business partners as our ambassadors Minimize our impact on environment
Advocate responsible drinking inlinewith global industry commitments
Continue to leverage our strategic partnership with SABM
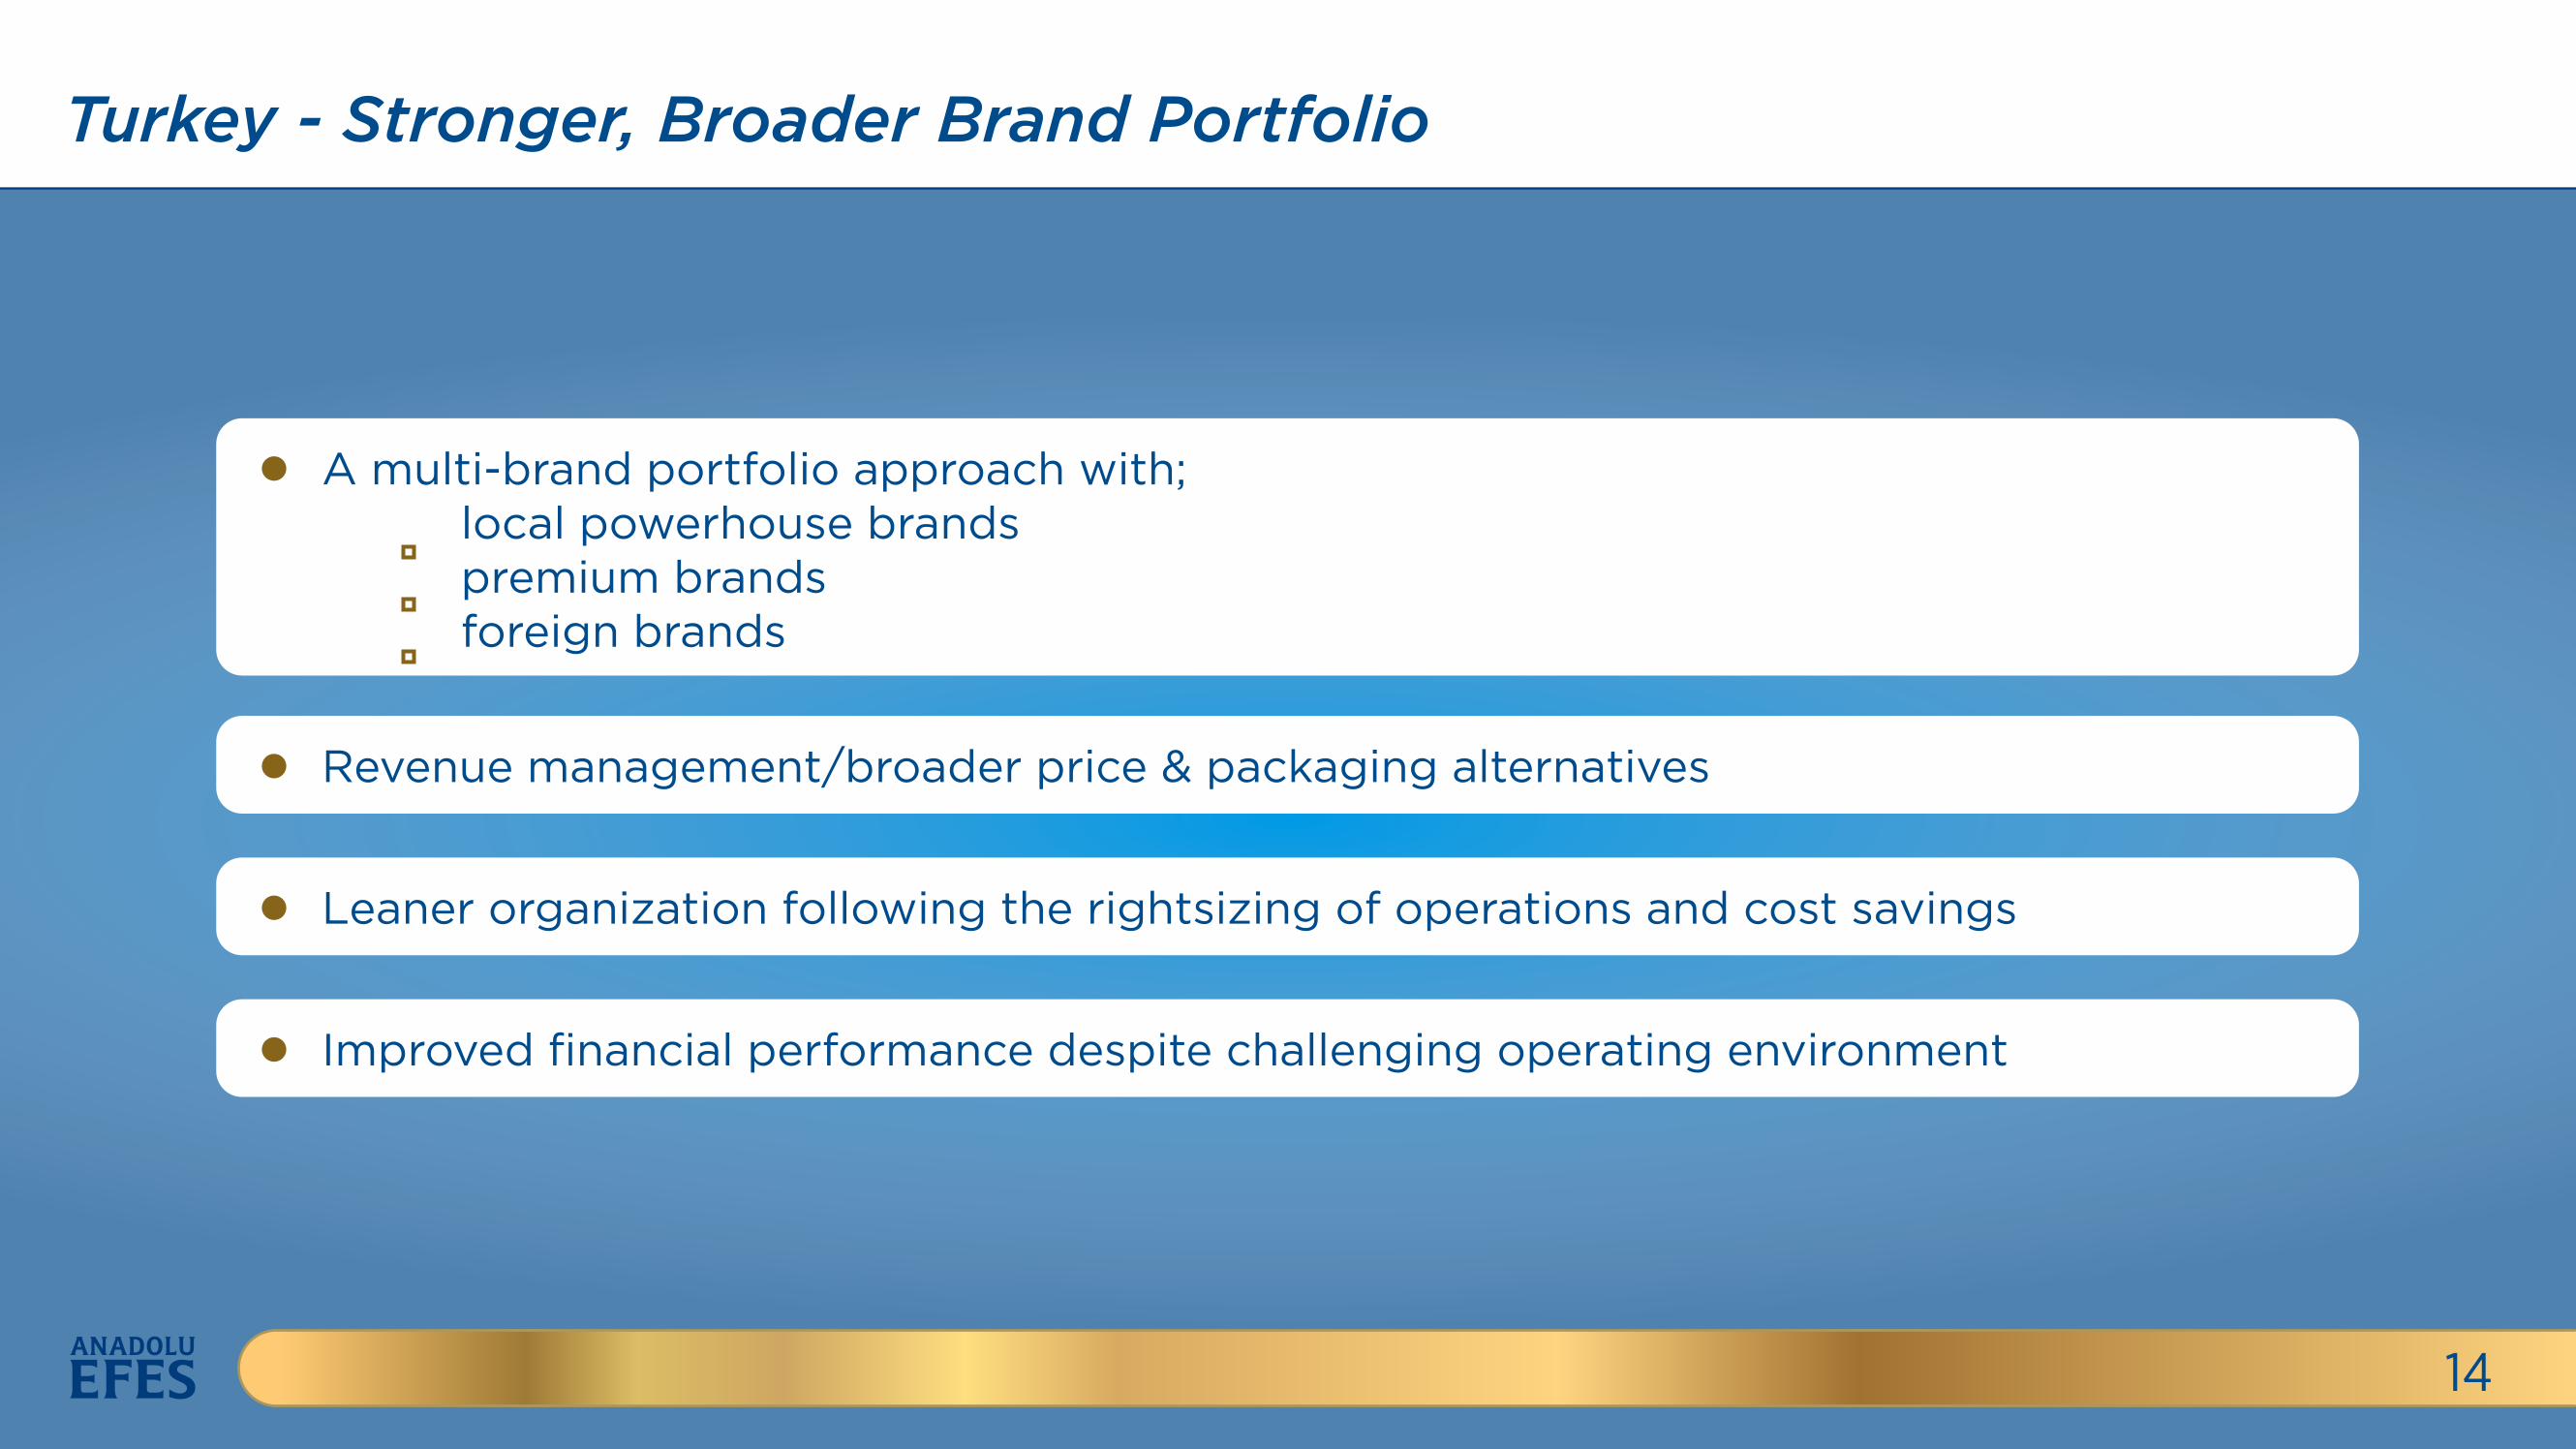
Turkey - Stronger, Broader Brand Portfolio
14
A multi-brand portfolio approach with; local powerhouse brands premium brands foreign brands
Revenue management/broader price & packaging alternatives
Leaner organization following the rightsizing of operations and cost savings
Improved financial performance despite challenging operating environment
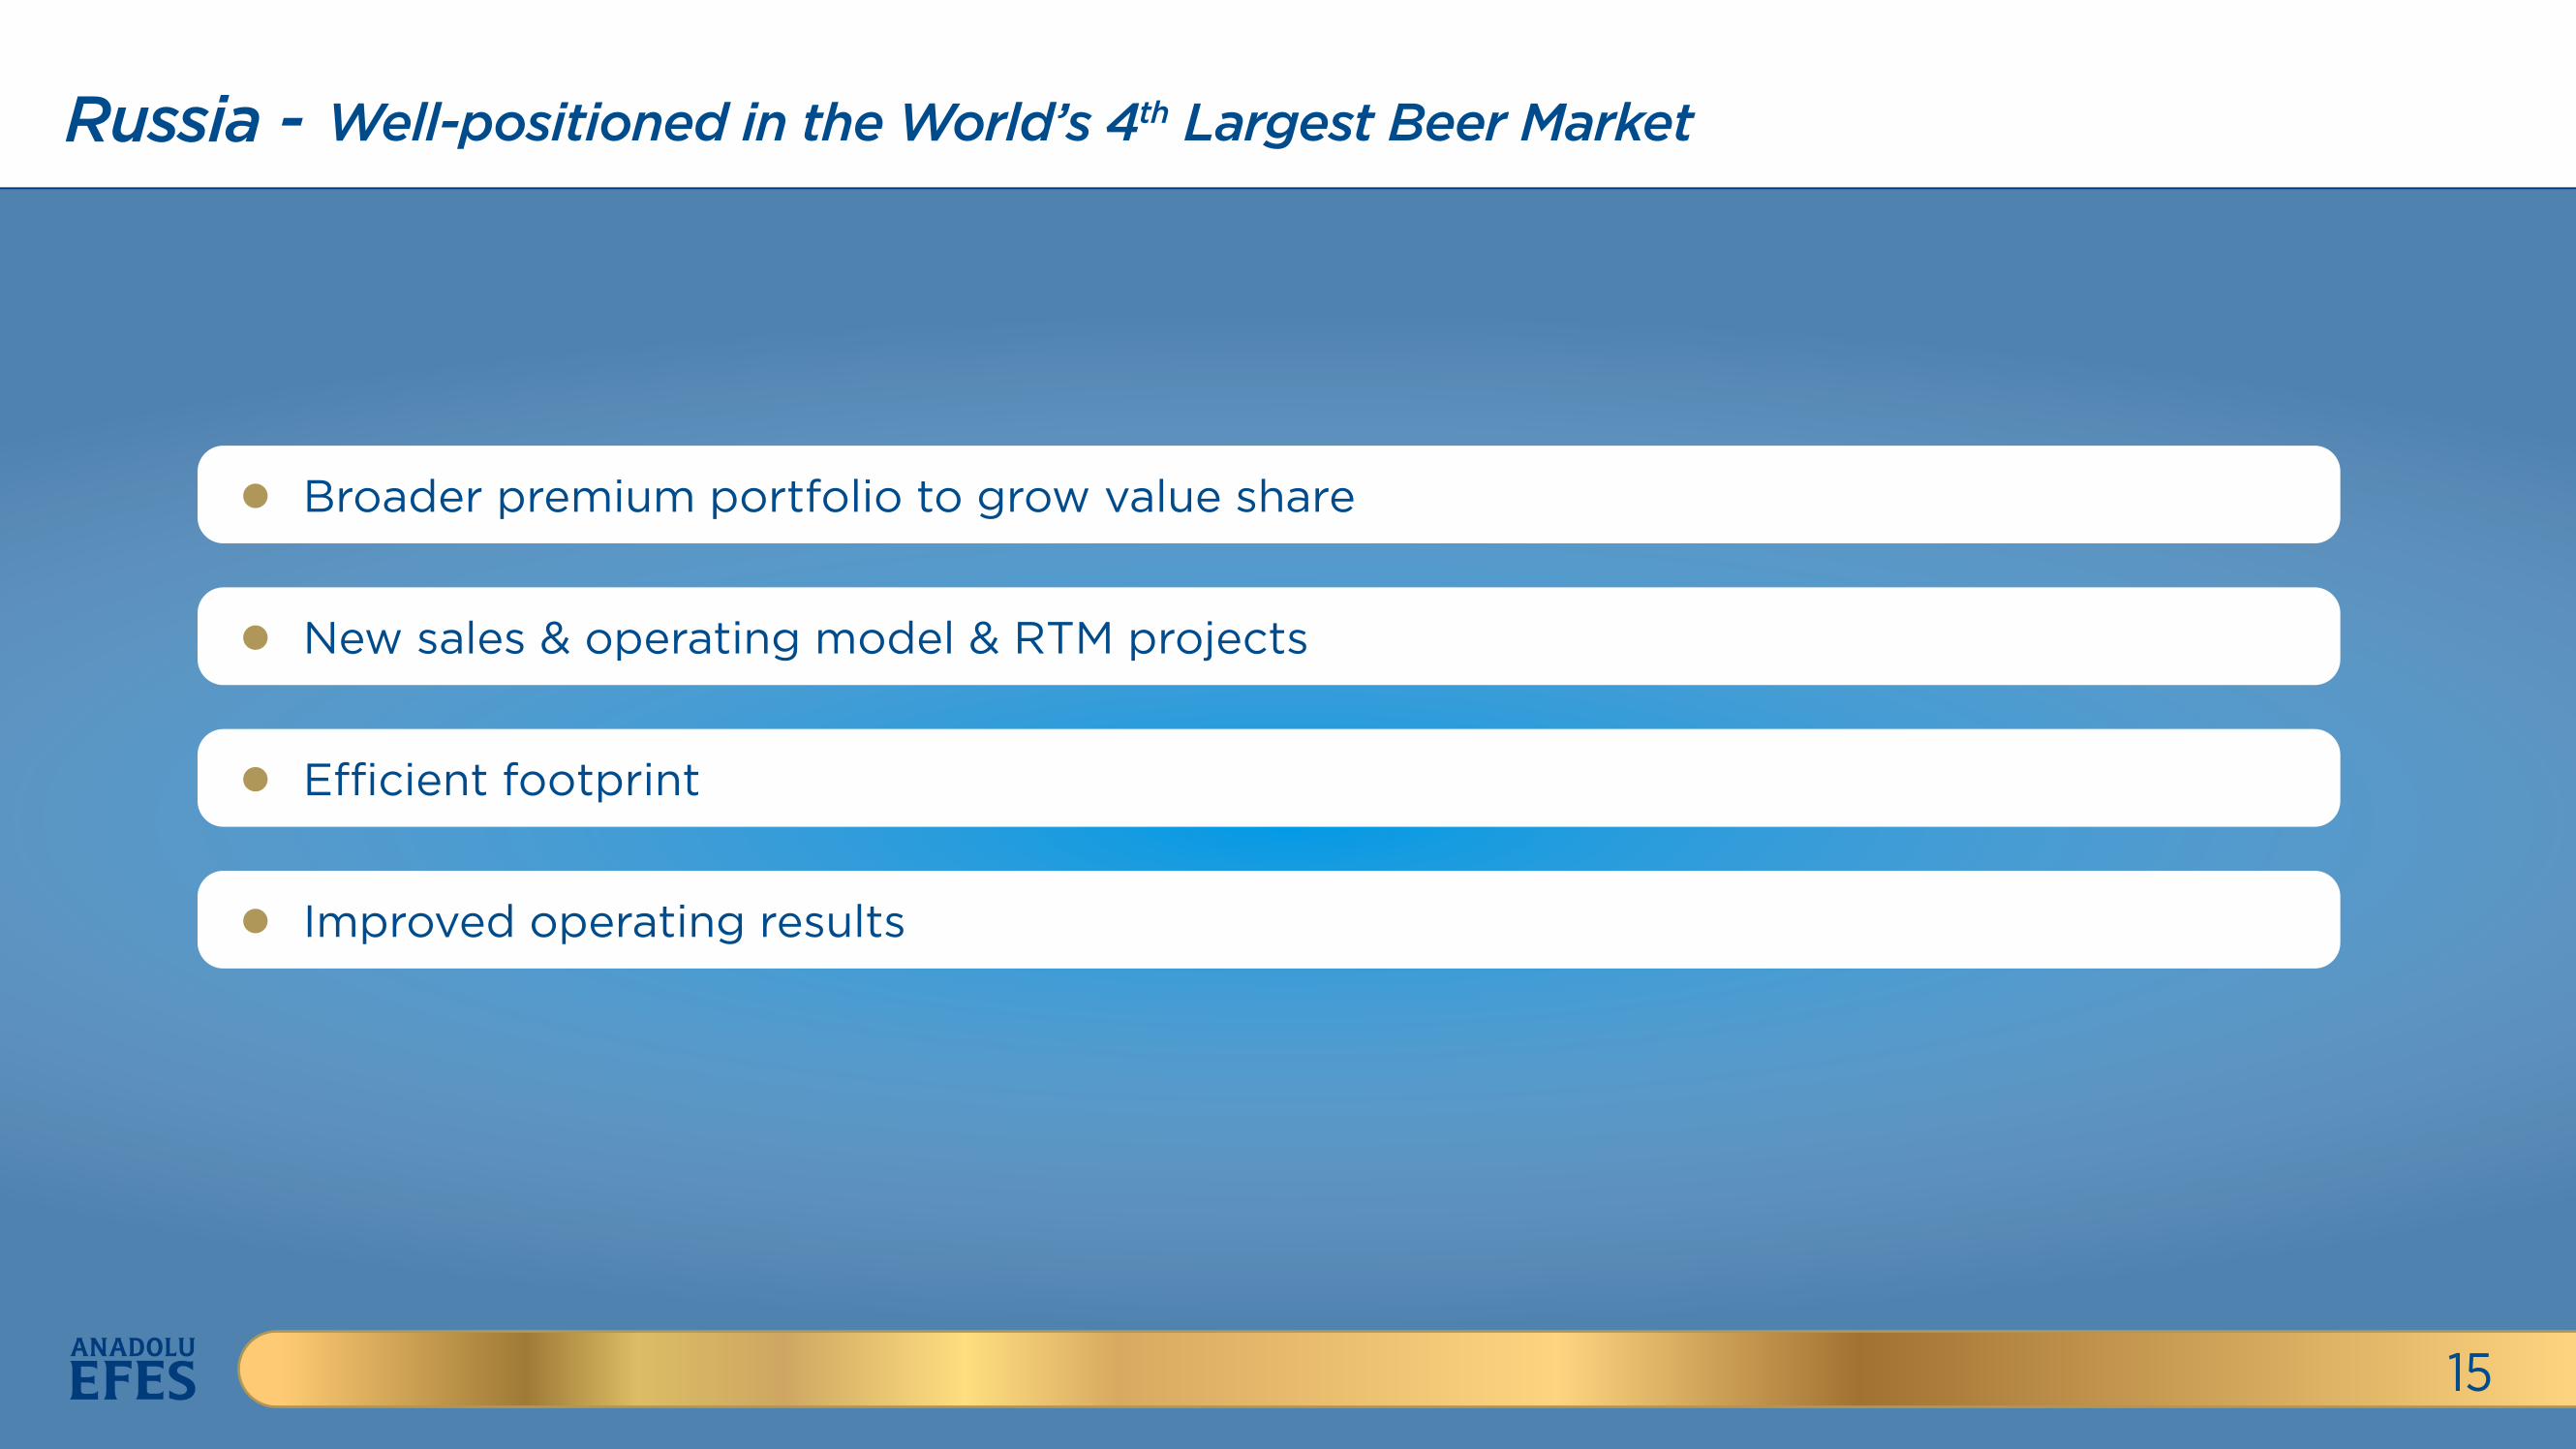
Russia - Well-positioned in the World’s 4th Largest Beer Market
15
Broader premium portfolio to grow value share
New sales & operating model & RTM projects
E�cient footprint
Improved operating results
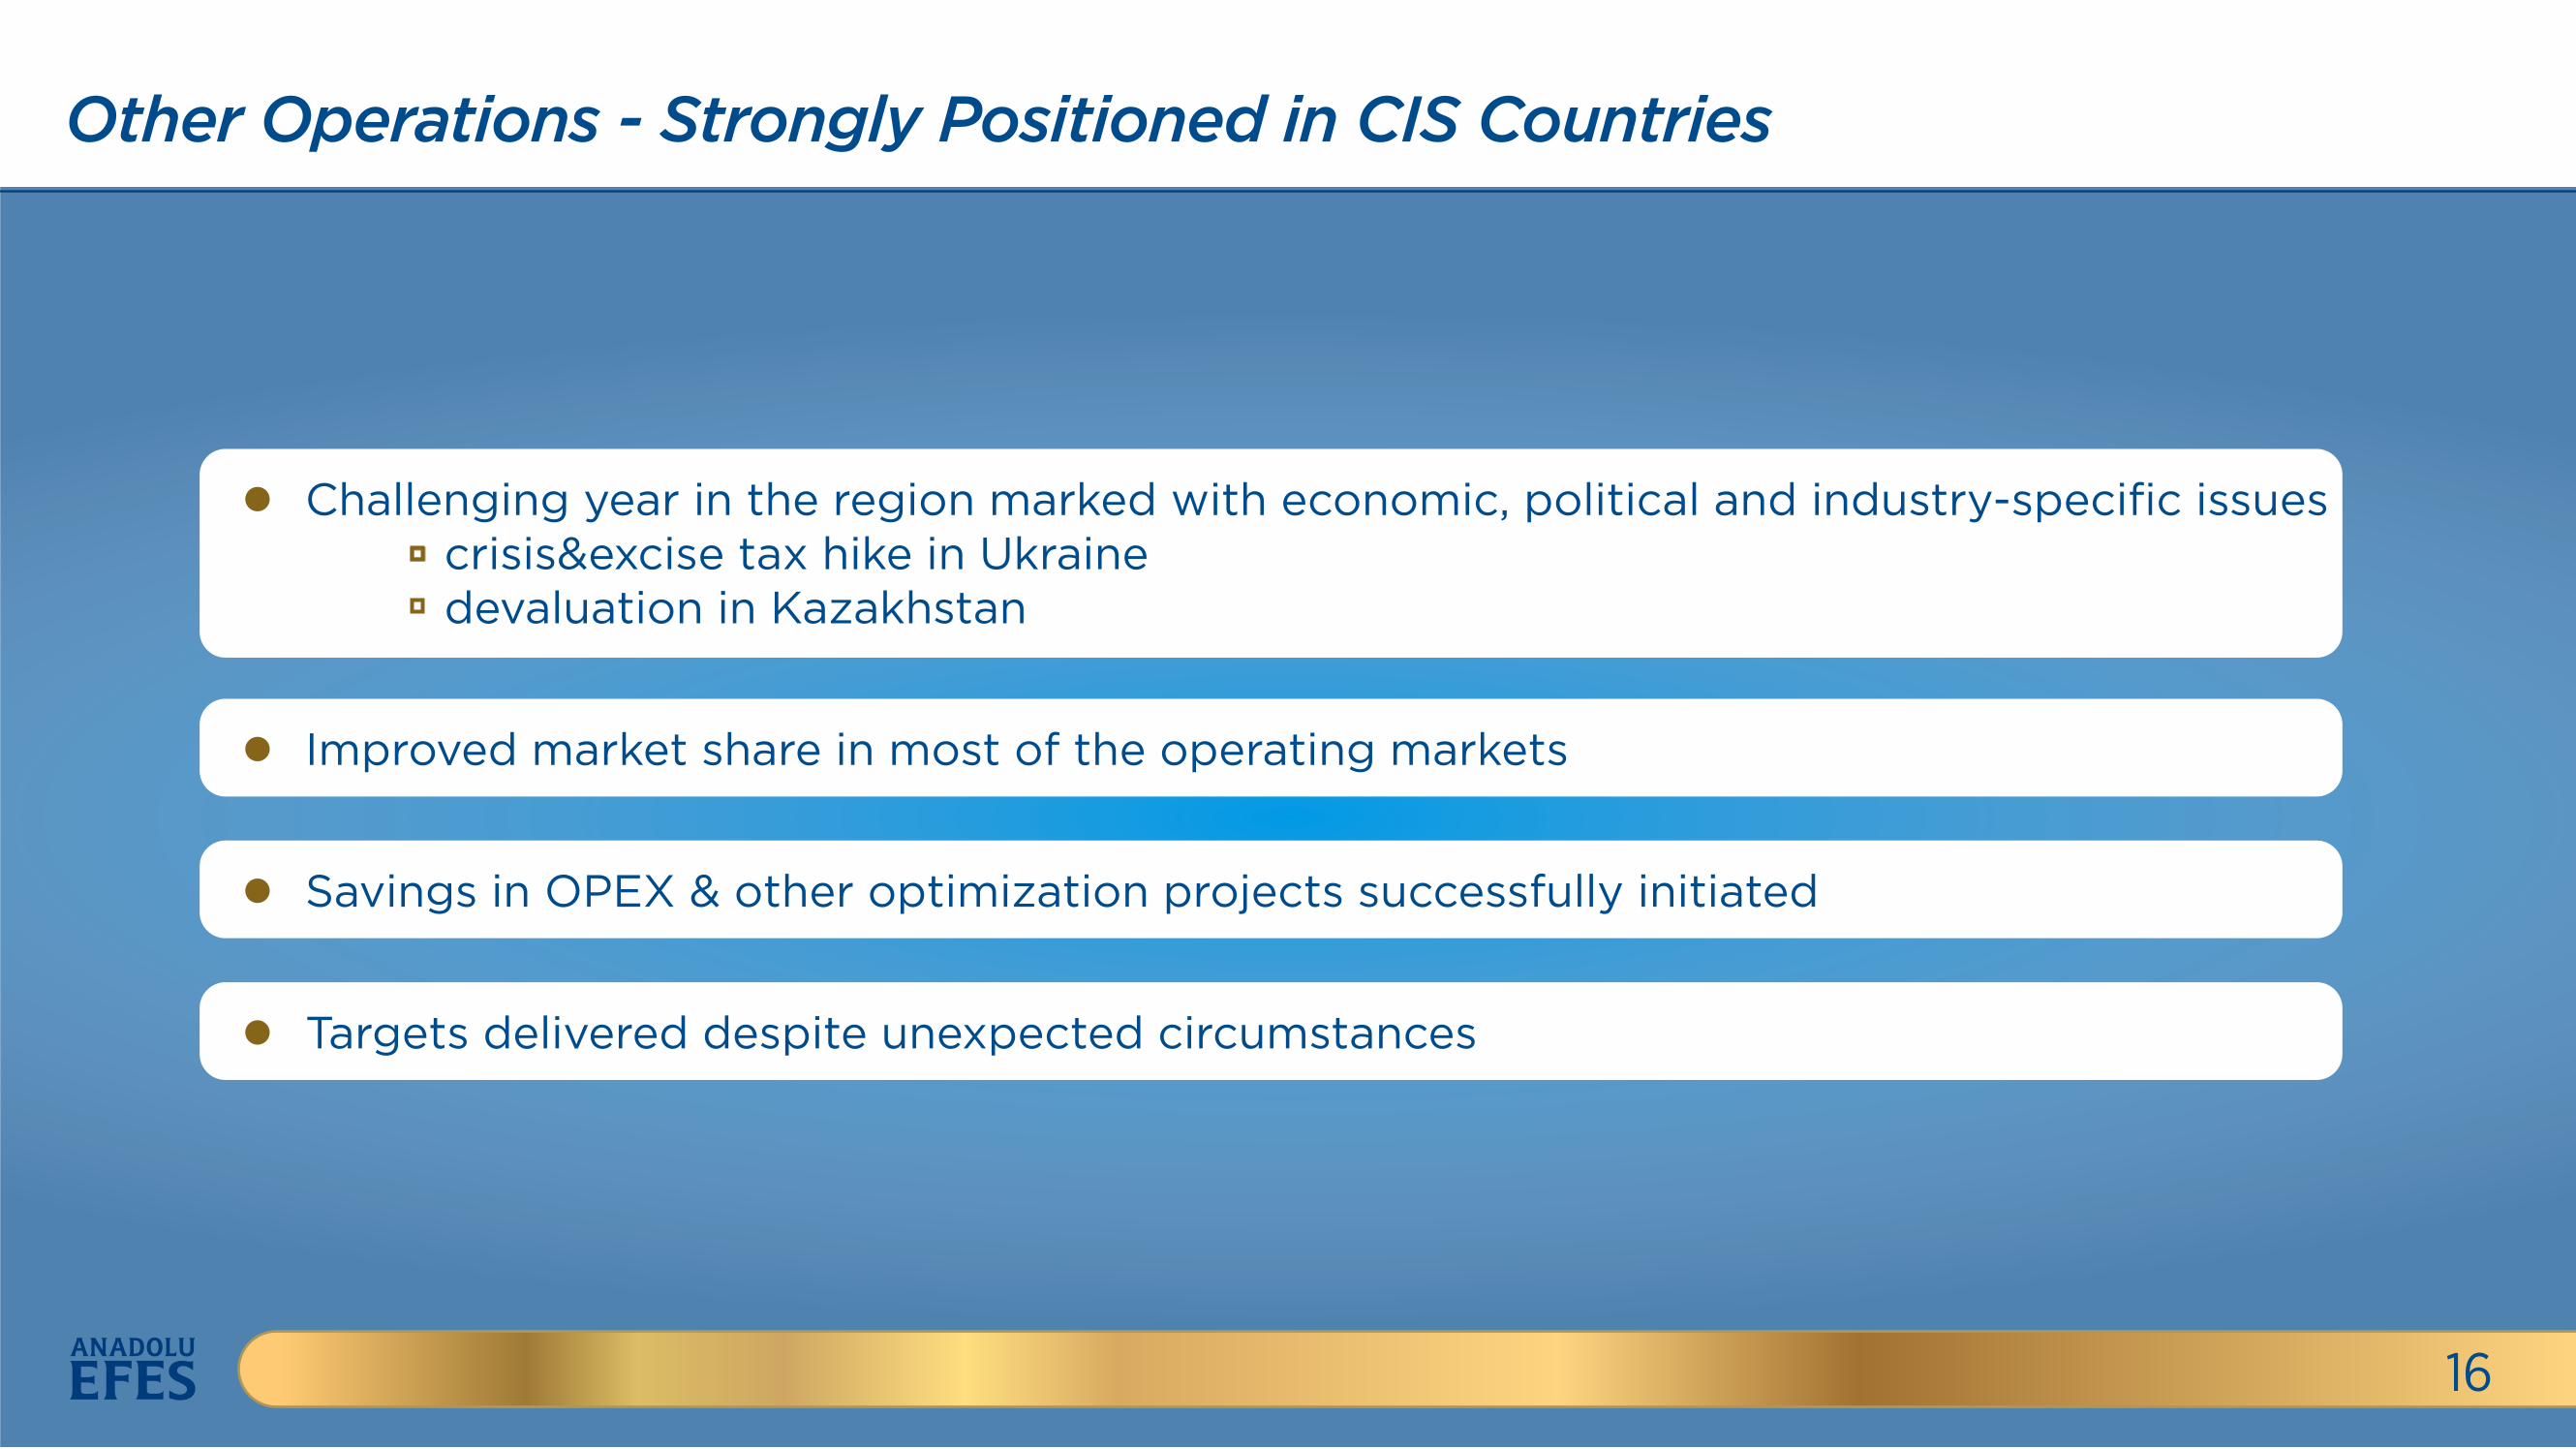
Other Operations - Strongly Positioned in CIS Countries
16
Broader premium portfolio to grow value share
New sales & operating model & RTM projects
E�cient footprint
Improved operating results
Challenging year in the region marked with economic, political and industry-specific issues crisis&excise tax hike in Ukraine devaluation in Kazakhstan
Improved market share in most of the operating markets
Savings in OPEX & other optimization projects successfully initiated
Targets delivered despite unexpected circumstances
Beer OperationsSoft Drink Operations
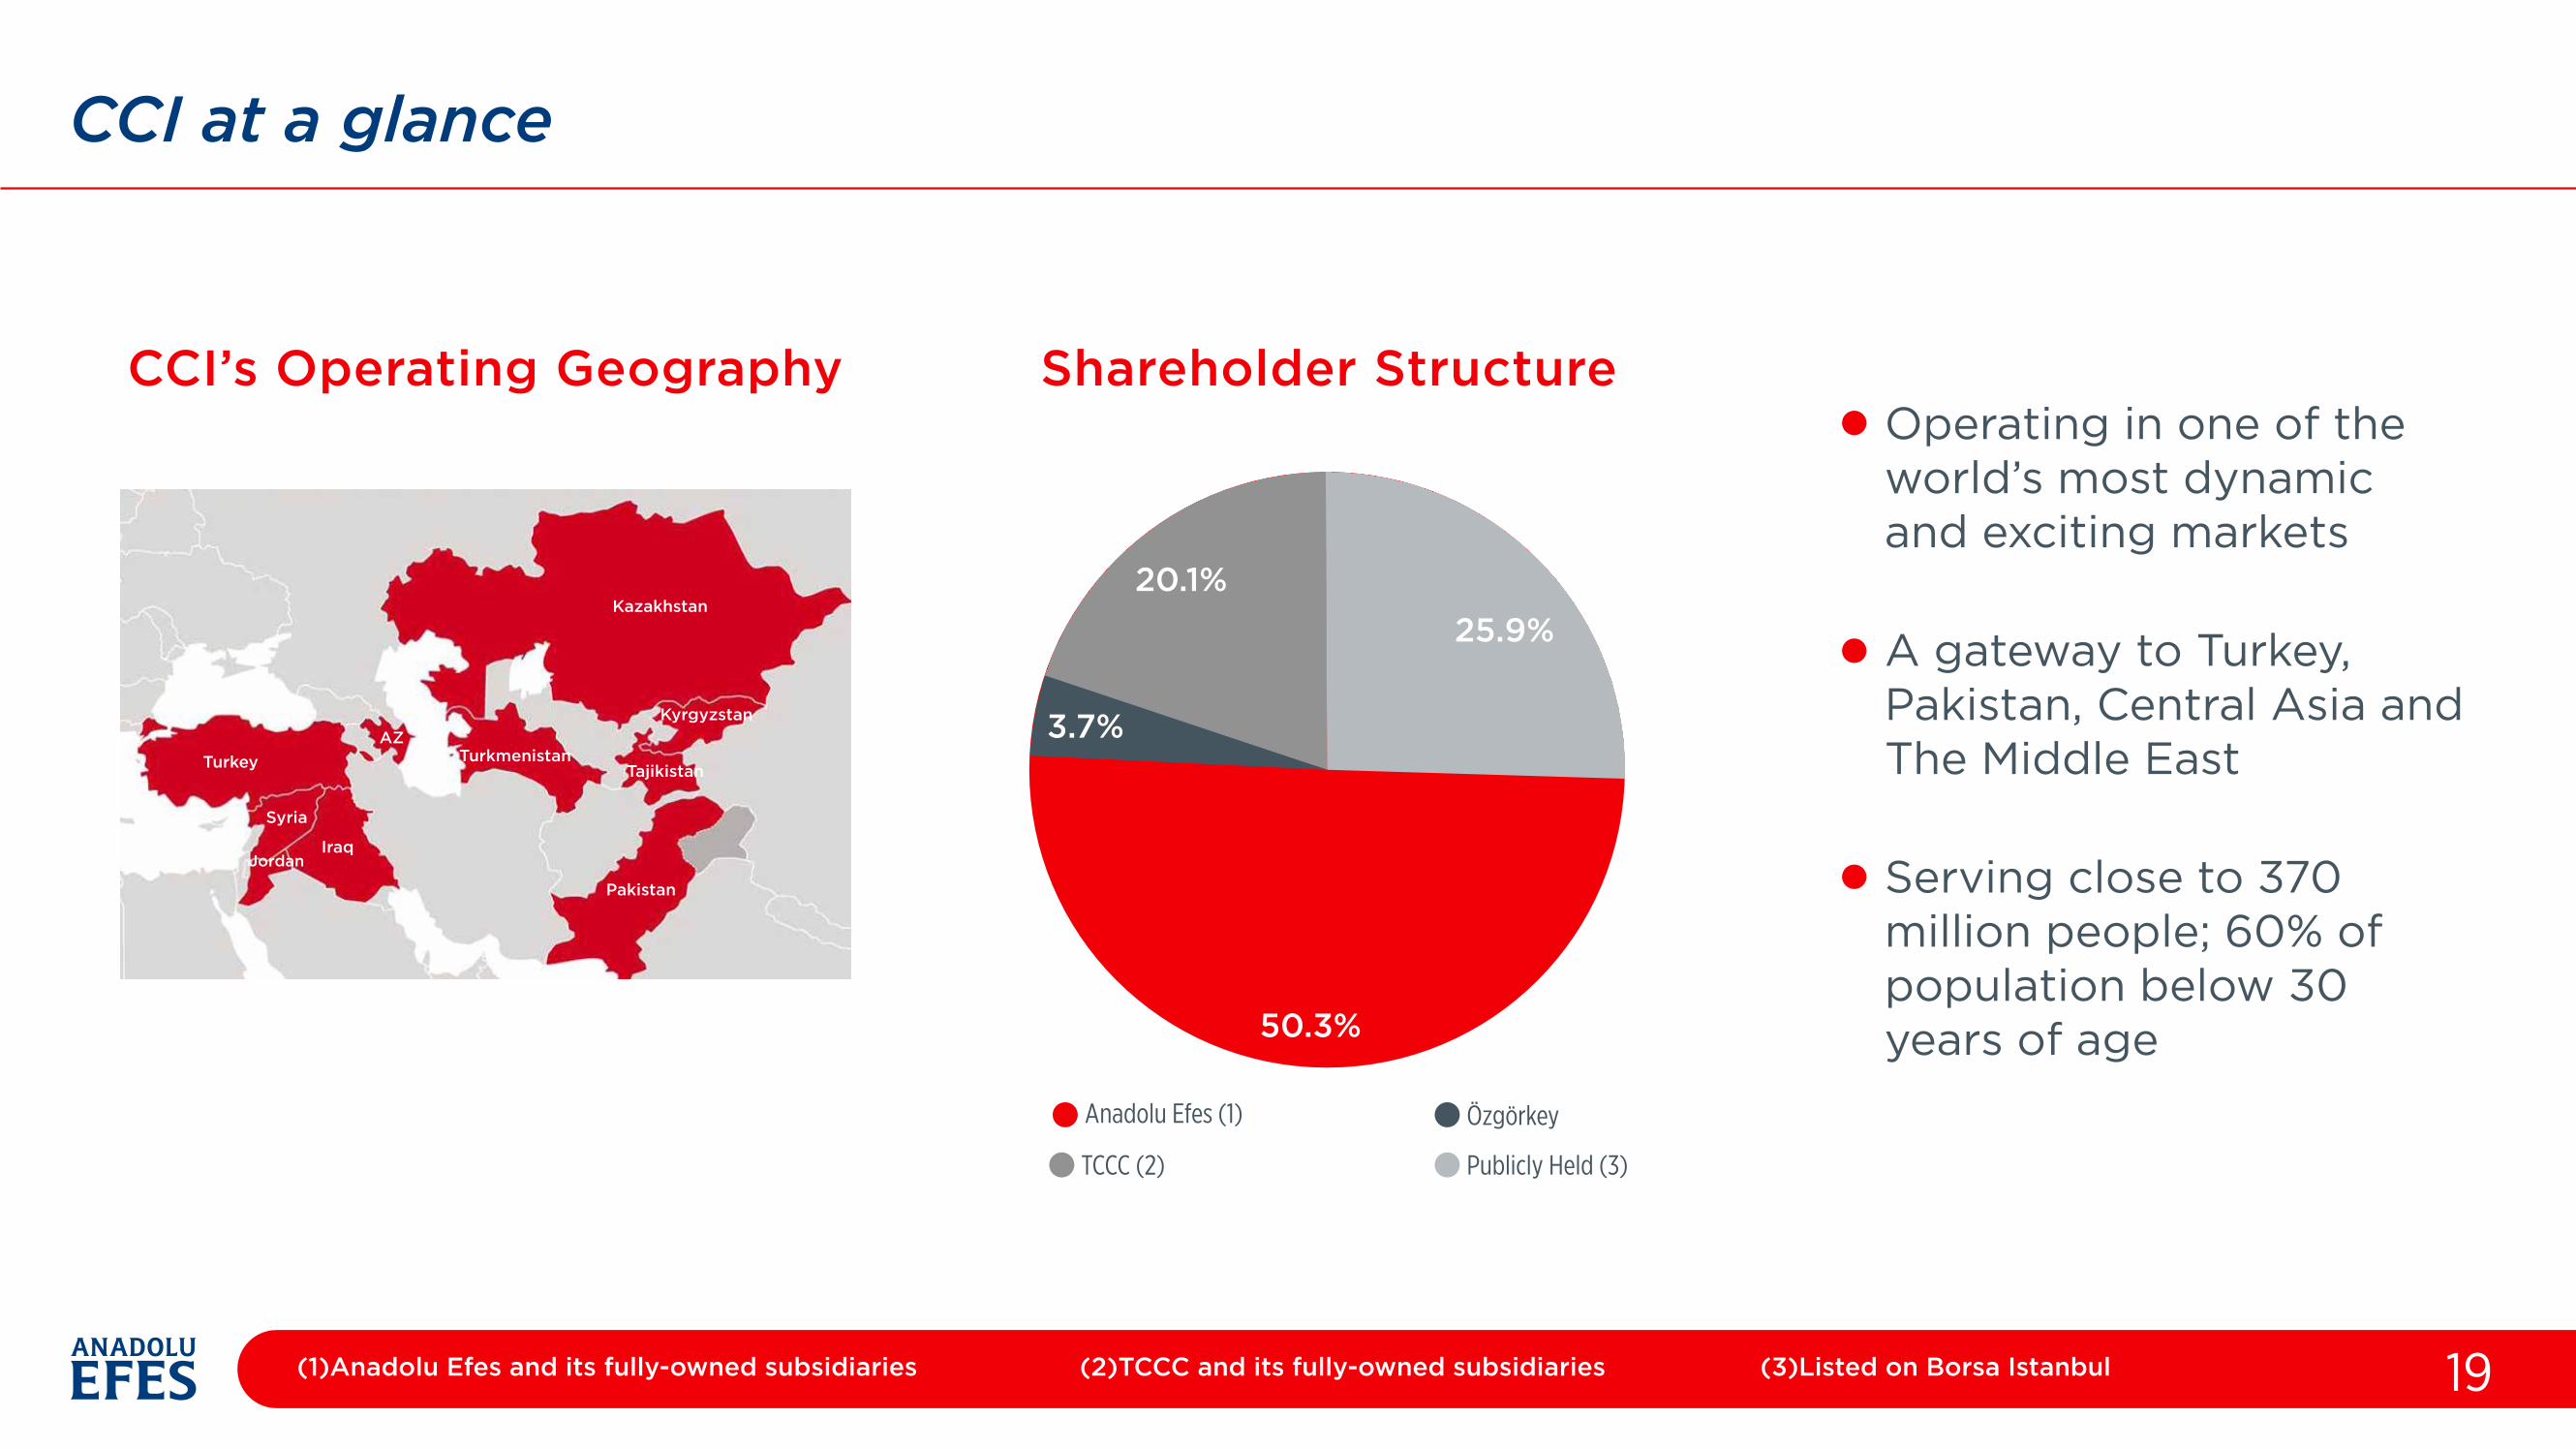
CCI at a glance
19
Shareholder Structure
3.7%
25.9% 20.1%
Anadolu Efes (1) Özgörkey
TCCC (2) Publicly Held (3)
Operating in one of the world’s most dynamic and exciting markets
A gateway to Turkey, Pakistan, Central Asia and The Middle East
Serving close to 370 million people; 60% of population below 30 years of age50.3%
(1)Anadolu Efes and its fully-owned subsidiaries (2)TCCC and its fully-owned subsidiaries (3)Listed on Borsa Istanbul
CCI’s Operating Geography
Turkey Turkmenistan
Pakistan
Tajikistan
AZ
Kazakhstan
Kyrgyzstan
Syria
IraqJordan
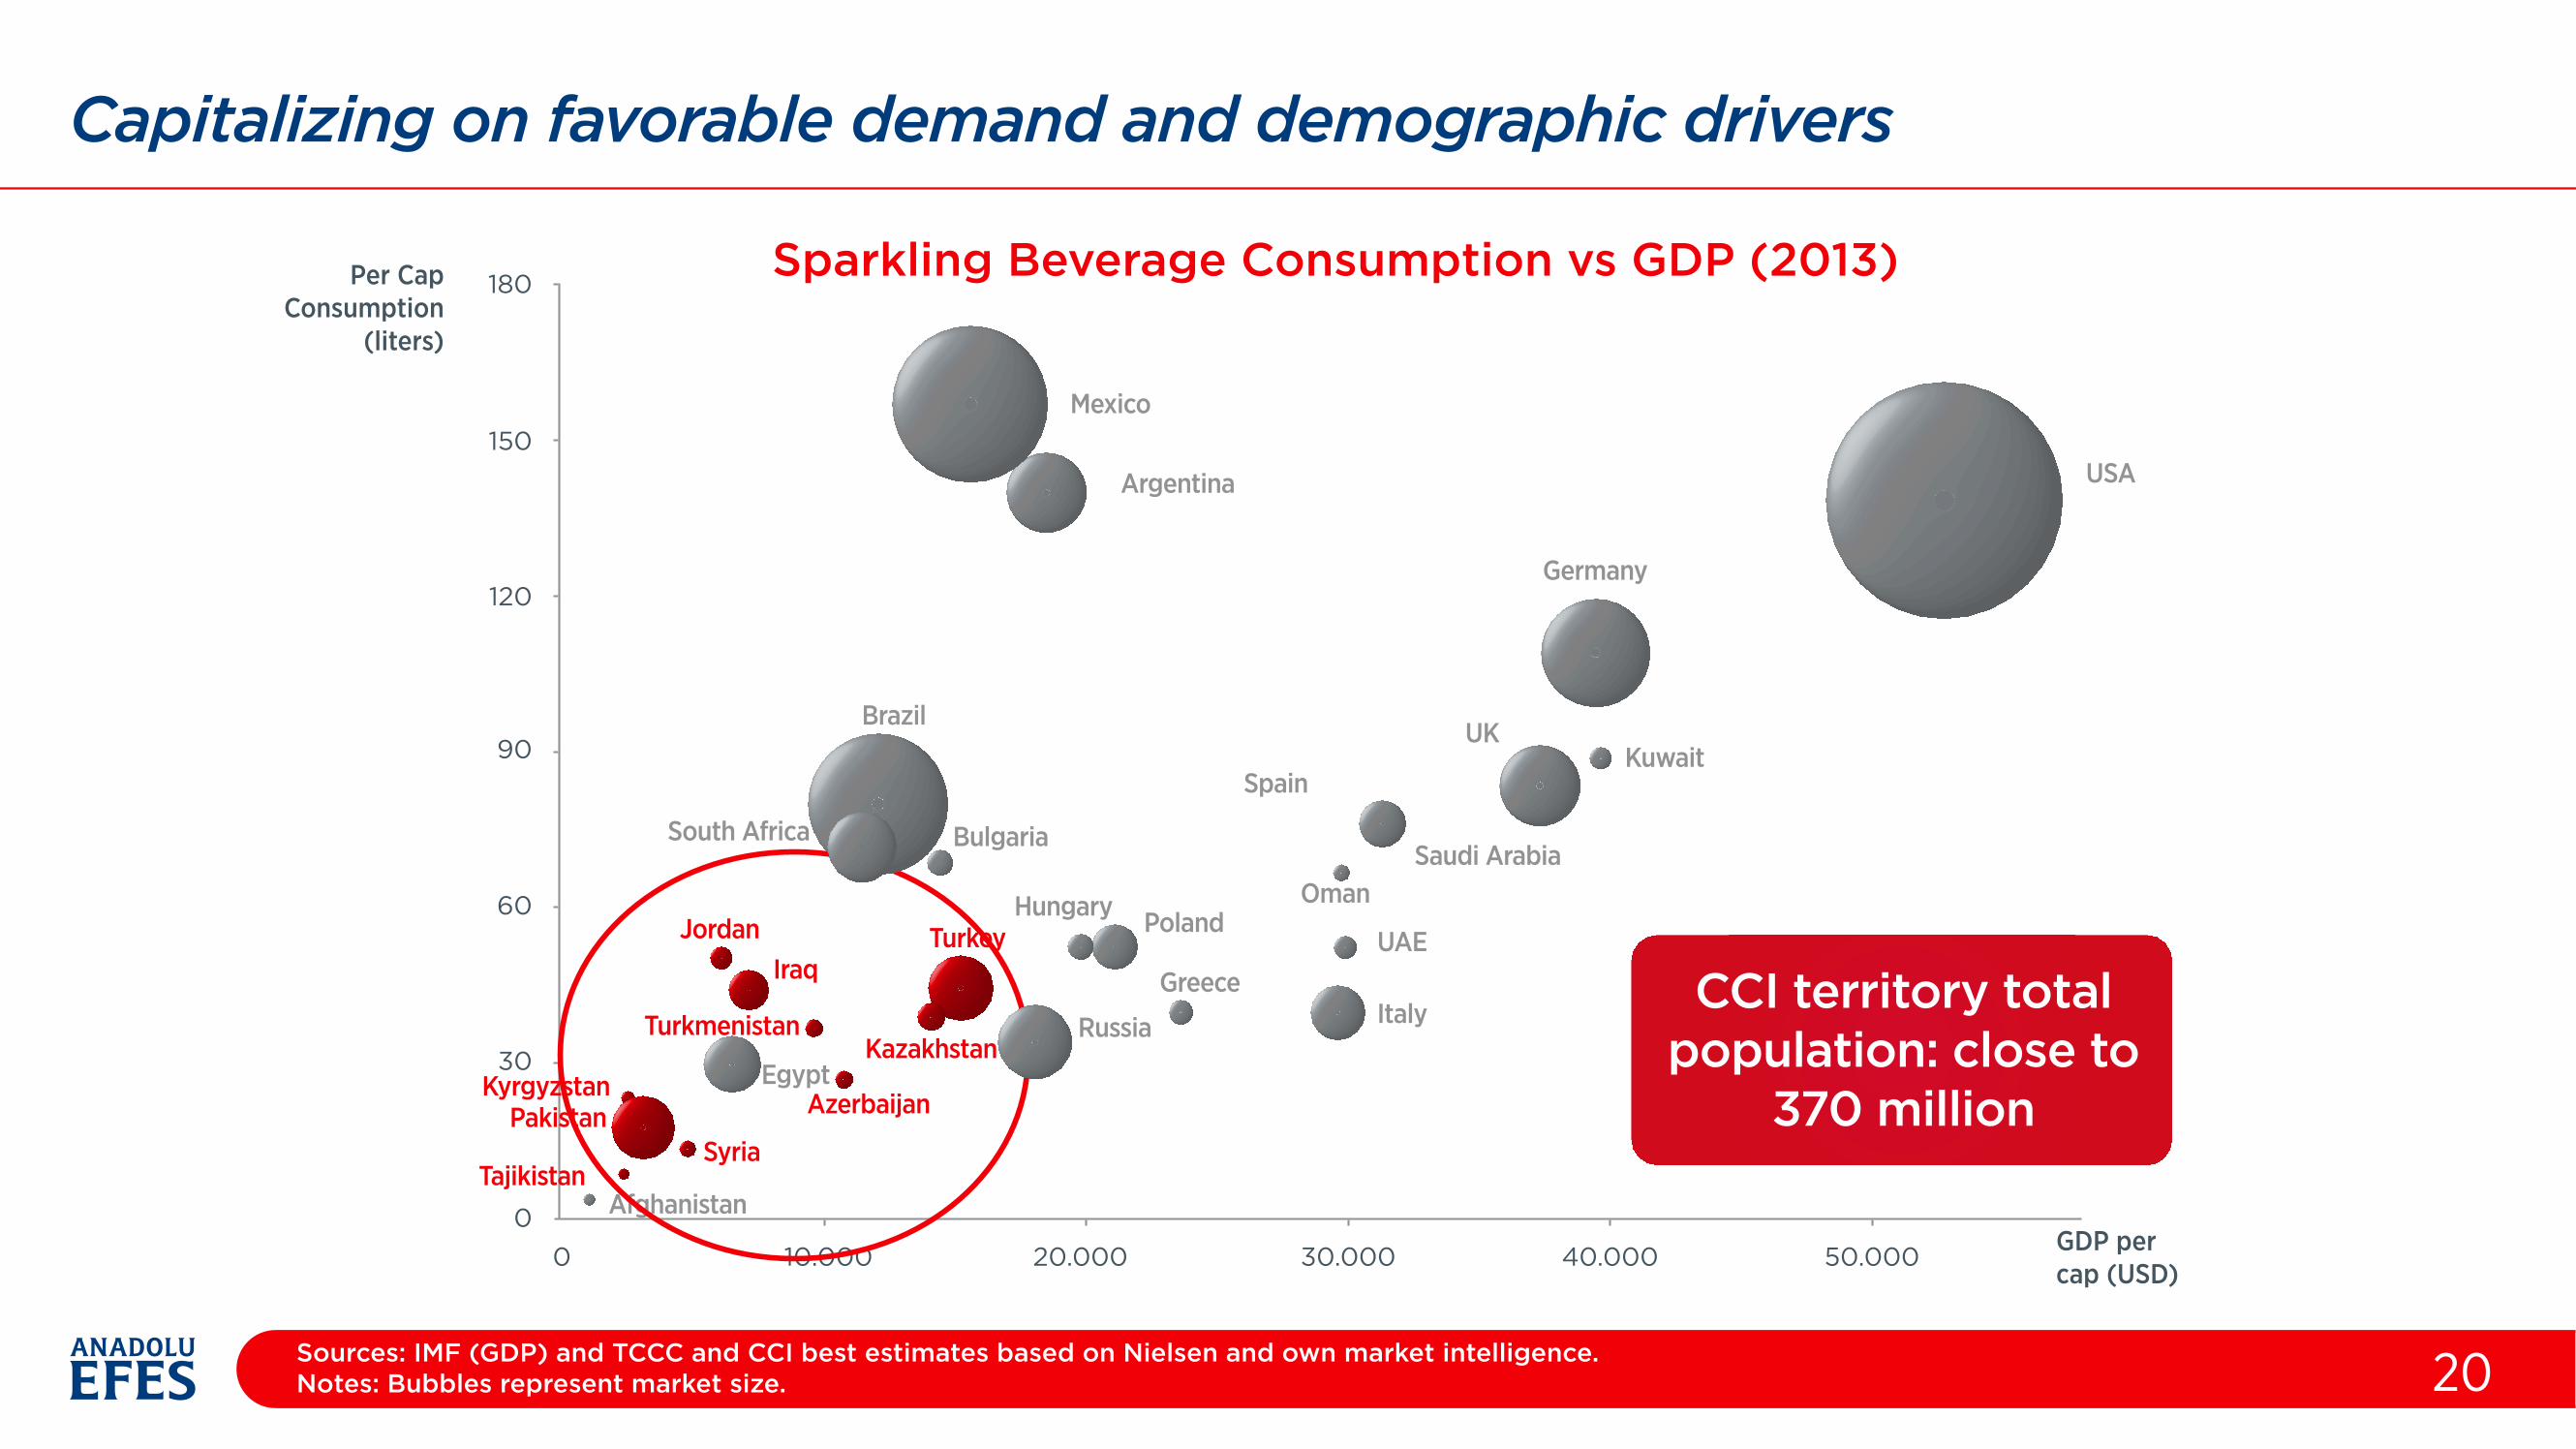
Capitalizing on favorable demand and demographic drivers
20
Sparkling Beverage Consumption vs GDP (2013)Per CapConsumption
(liters)
150
120
90
60
30
00 10.000 20.000 30.000 40.000 50.000
180
GDP percap (USD)
CCI territory totalpopulation: close to
370 million
Mexico
Argentina USA
Germany
KuwaitUK
Saudi Arabia
Spain
Oman
UAE
Italy
Brazil
Bulgaria
Hungary Poland
Greece
Russia
South Africa
Afghanistan
EgyptAzerbaijan
Kazakhstan
TurkeyJordanIraq
Turkmenistan
KyrgyzstanPakistan
SyriaTajikistan
Sources: IMF (GDP) and TCCC and CCI best estimates based on Nielsen and own market intelligence.Notes: Bubbles represent market size.
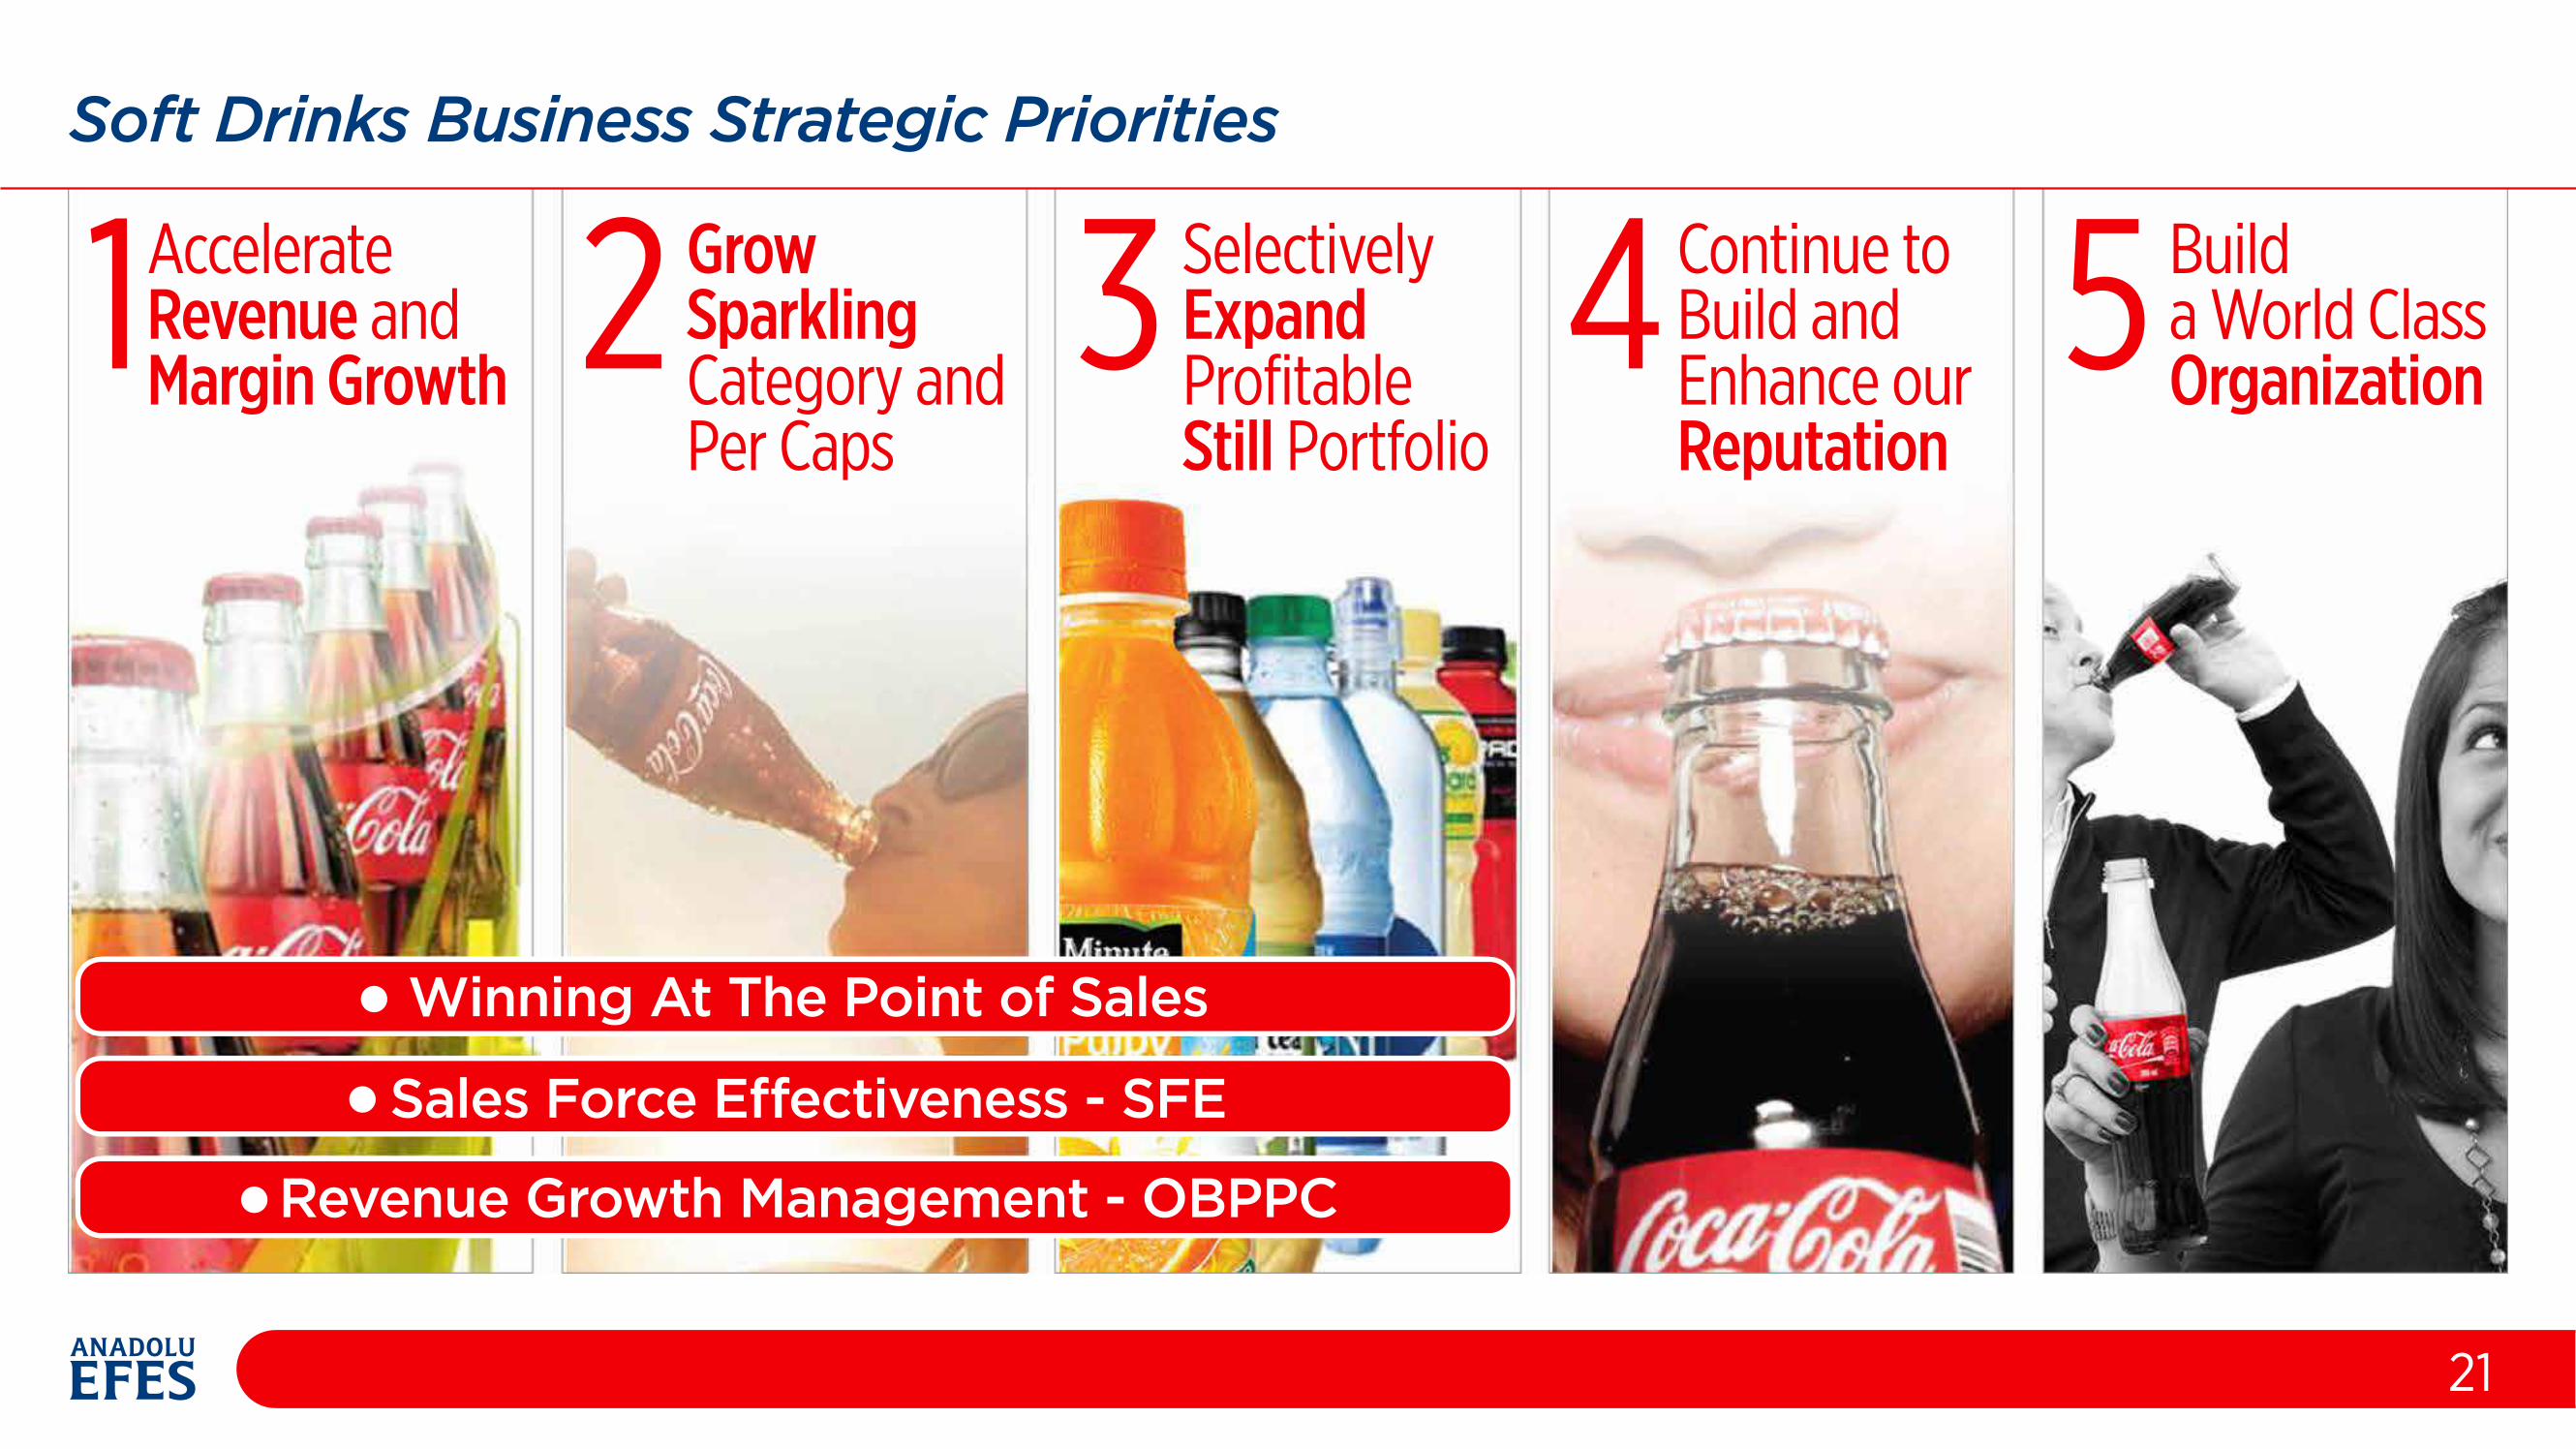
Soft Drinks Business Strategic Priorities
Winning At The Point of Sales
Sales Force E�ectiveness - SFE
Revenue Growth Management - OBPPC
1AccelerateRevenue andMargin Growth 2 Grow
SparklingCategory andPer Caps
3 SelectivelyExpandProfitableStill Portfolio
4Continue toBuild andEnhance ourReputation
5 Builda World ClassOrganization
21
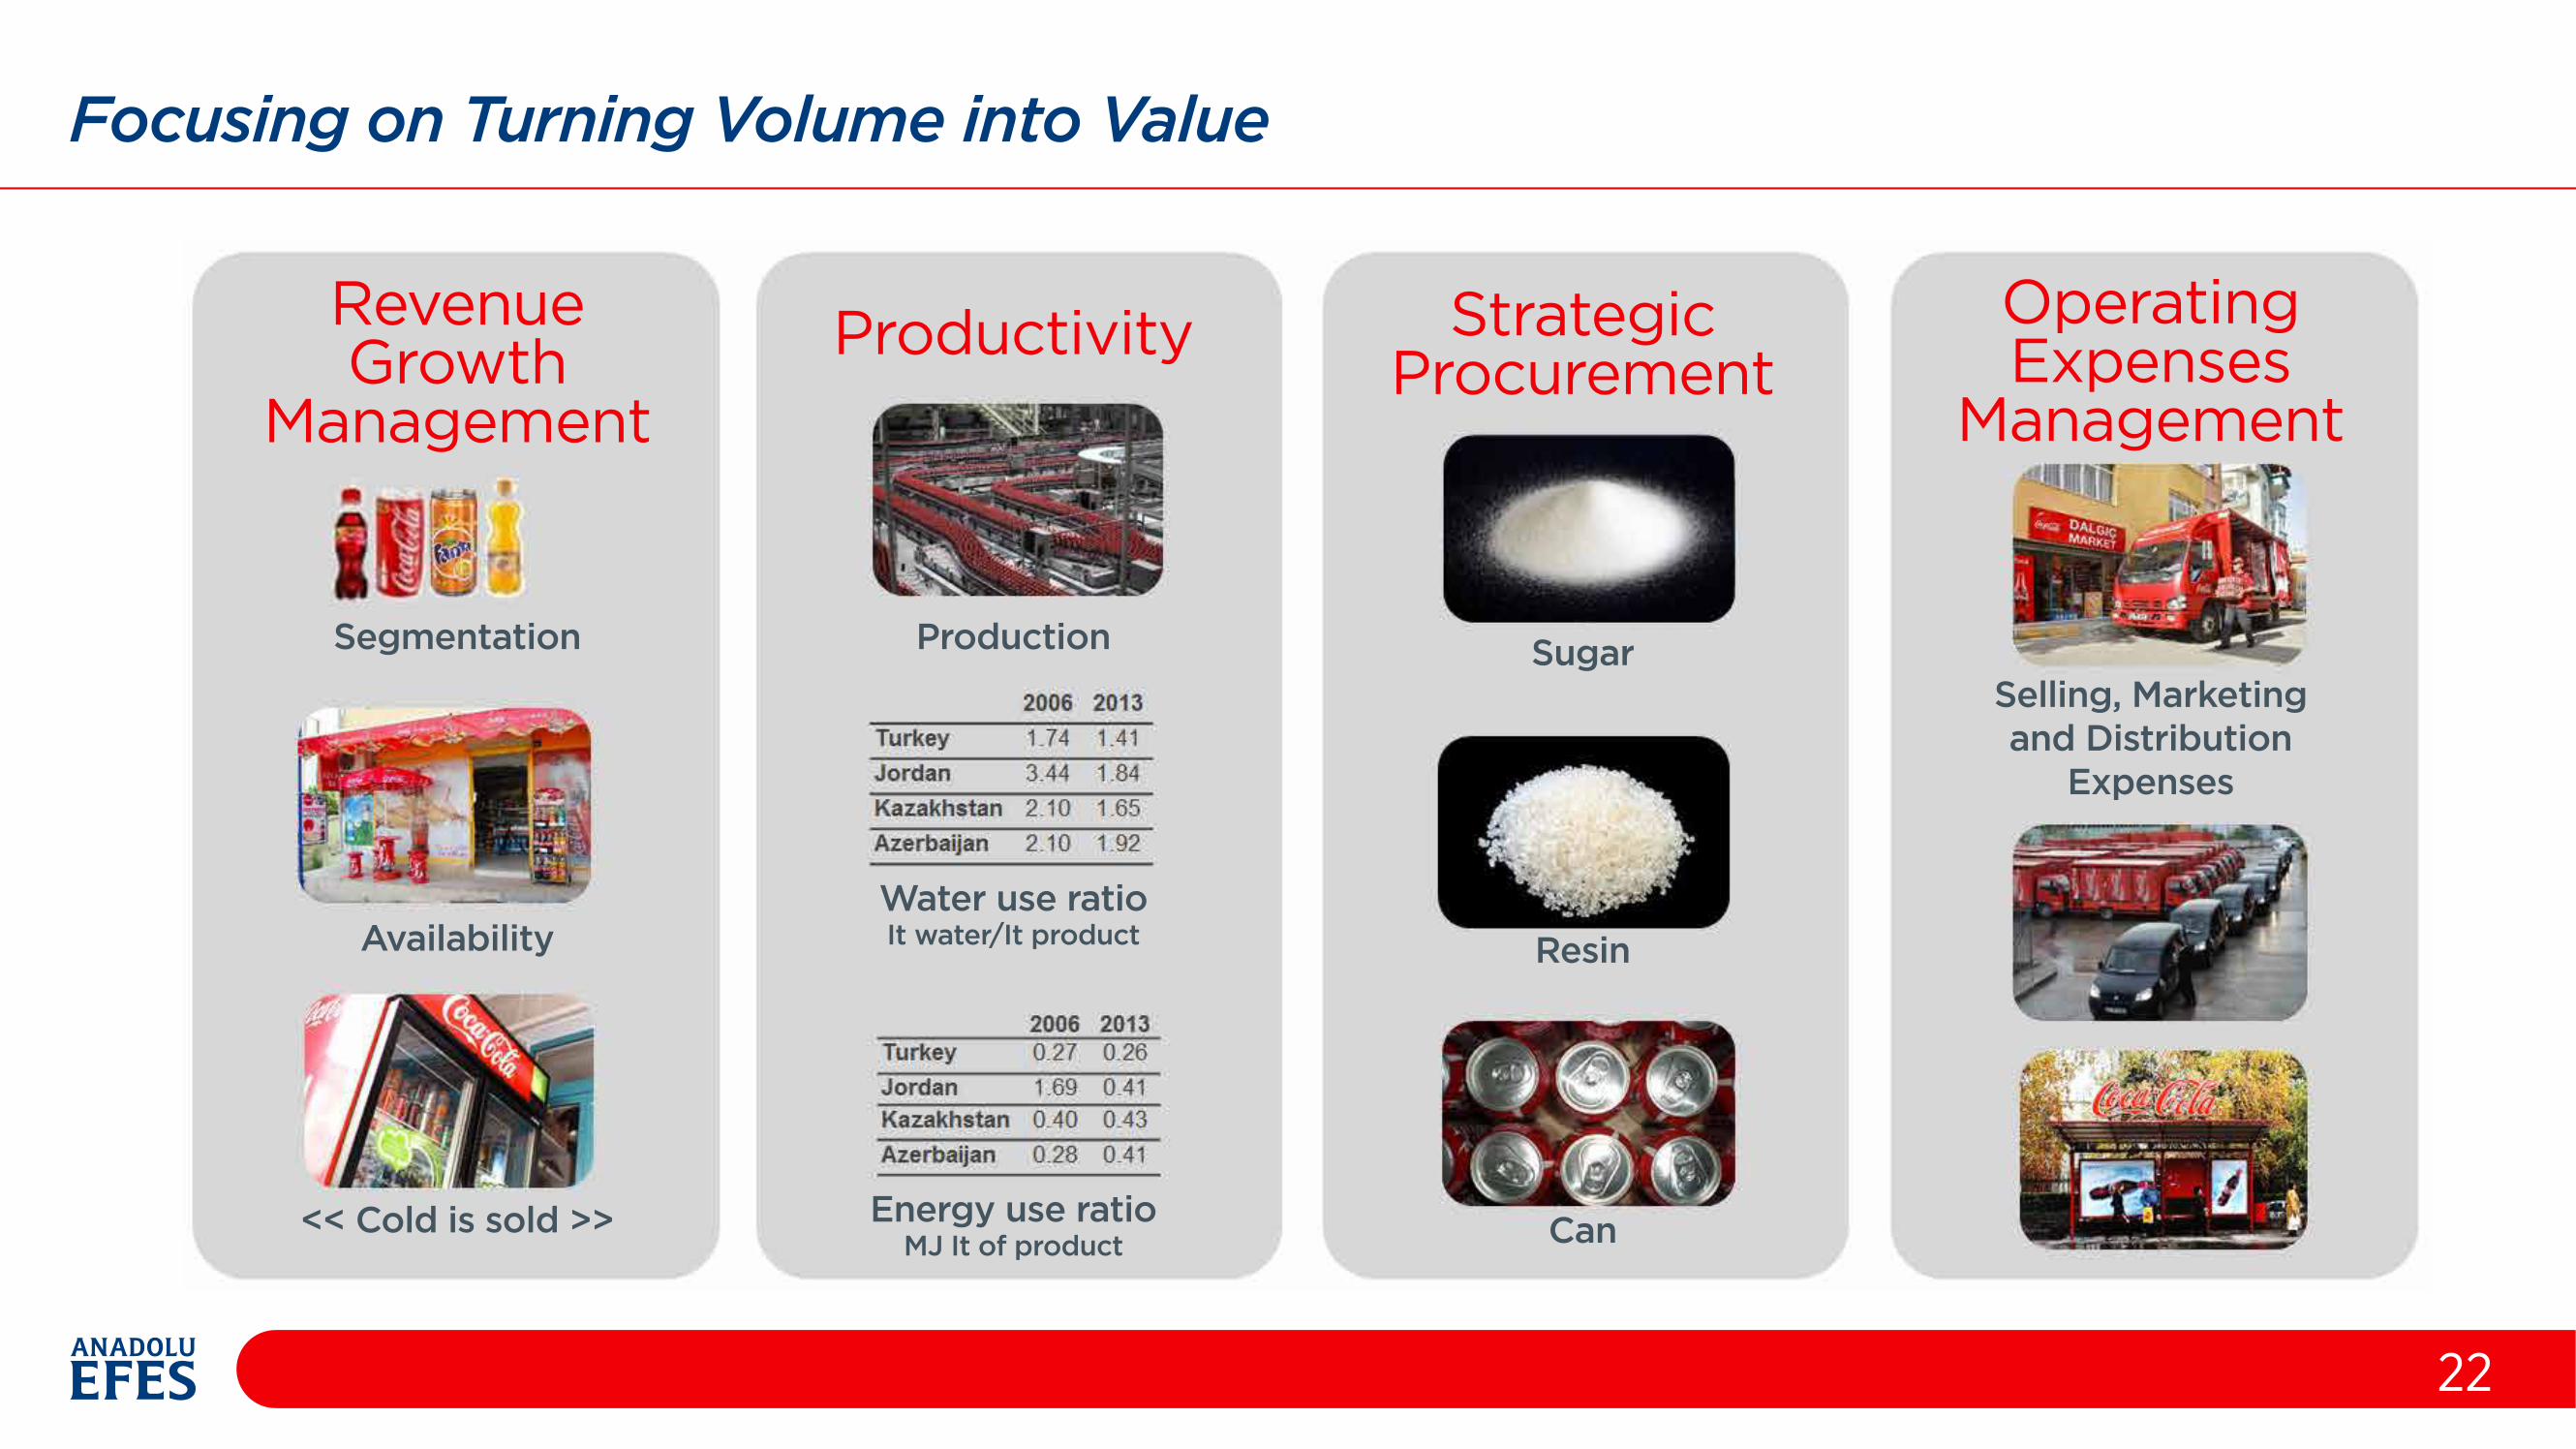
Focusing on Turning Volume into Value
22
RevenueGrowth
Management
Segmentation Production SugarSelling, Marketingand Distribution
Expenses
Resin
Can
Water use ratioIt water/It product
Energy use ratioMJ It of product
Availability
<< Cold is sold >>
Productivity StrategicProcurement
OperatingExpenses
Management
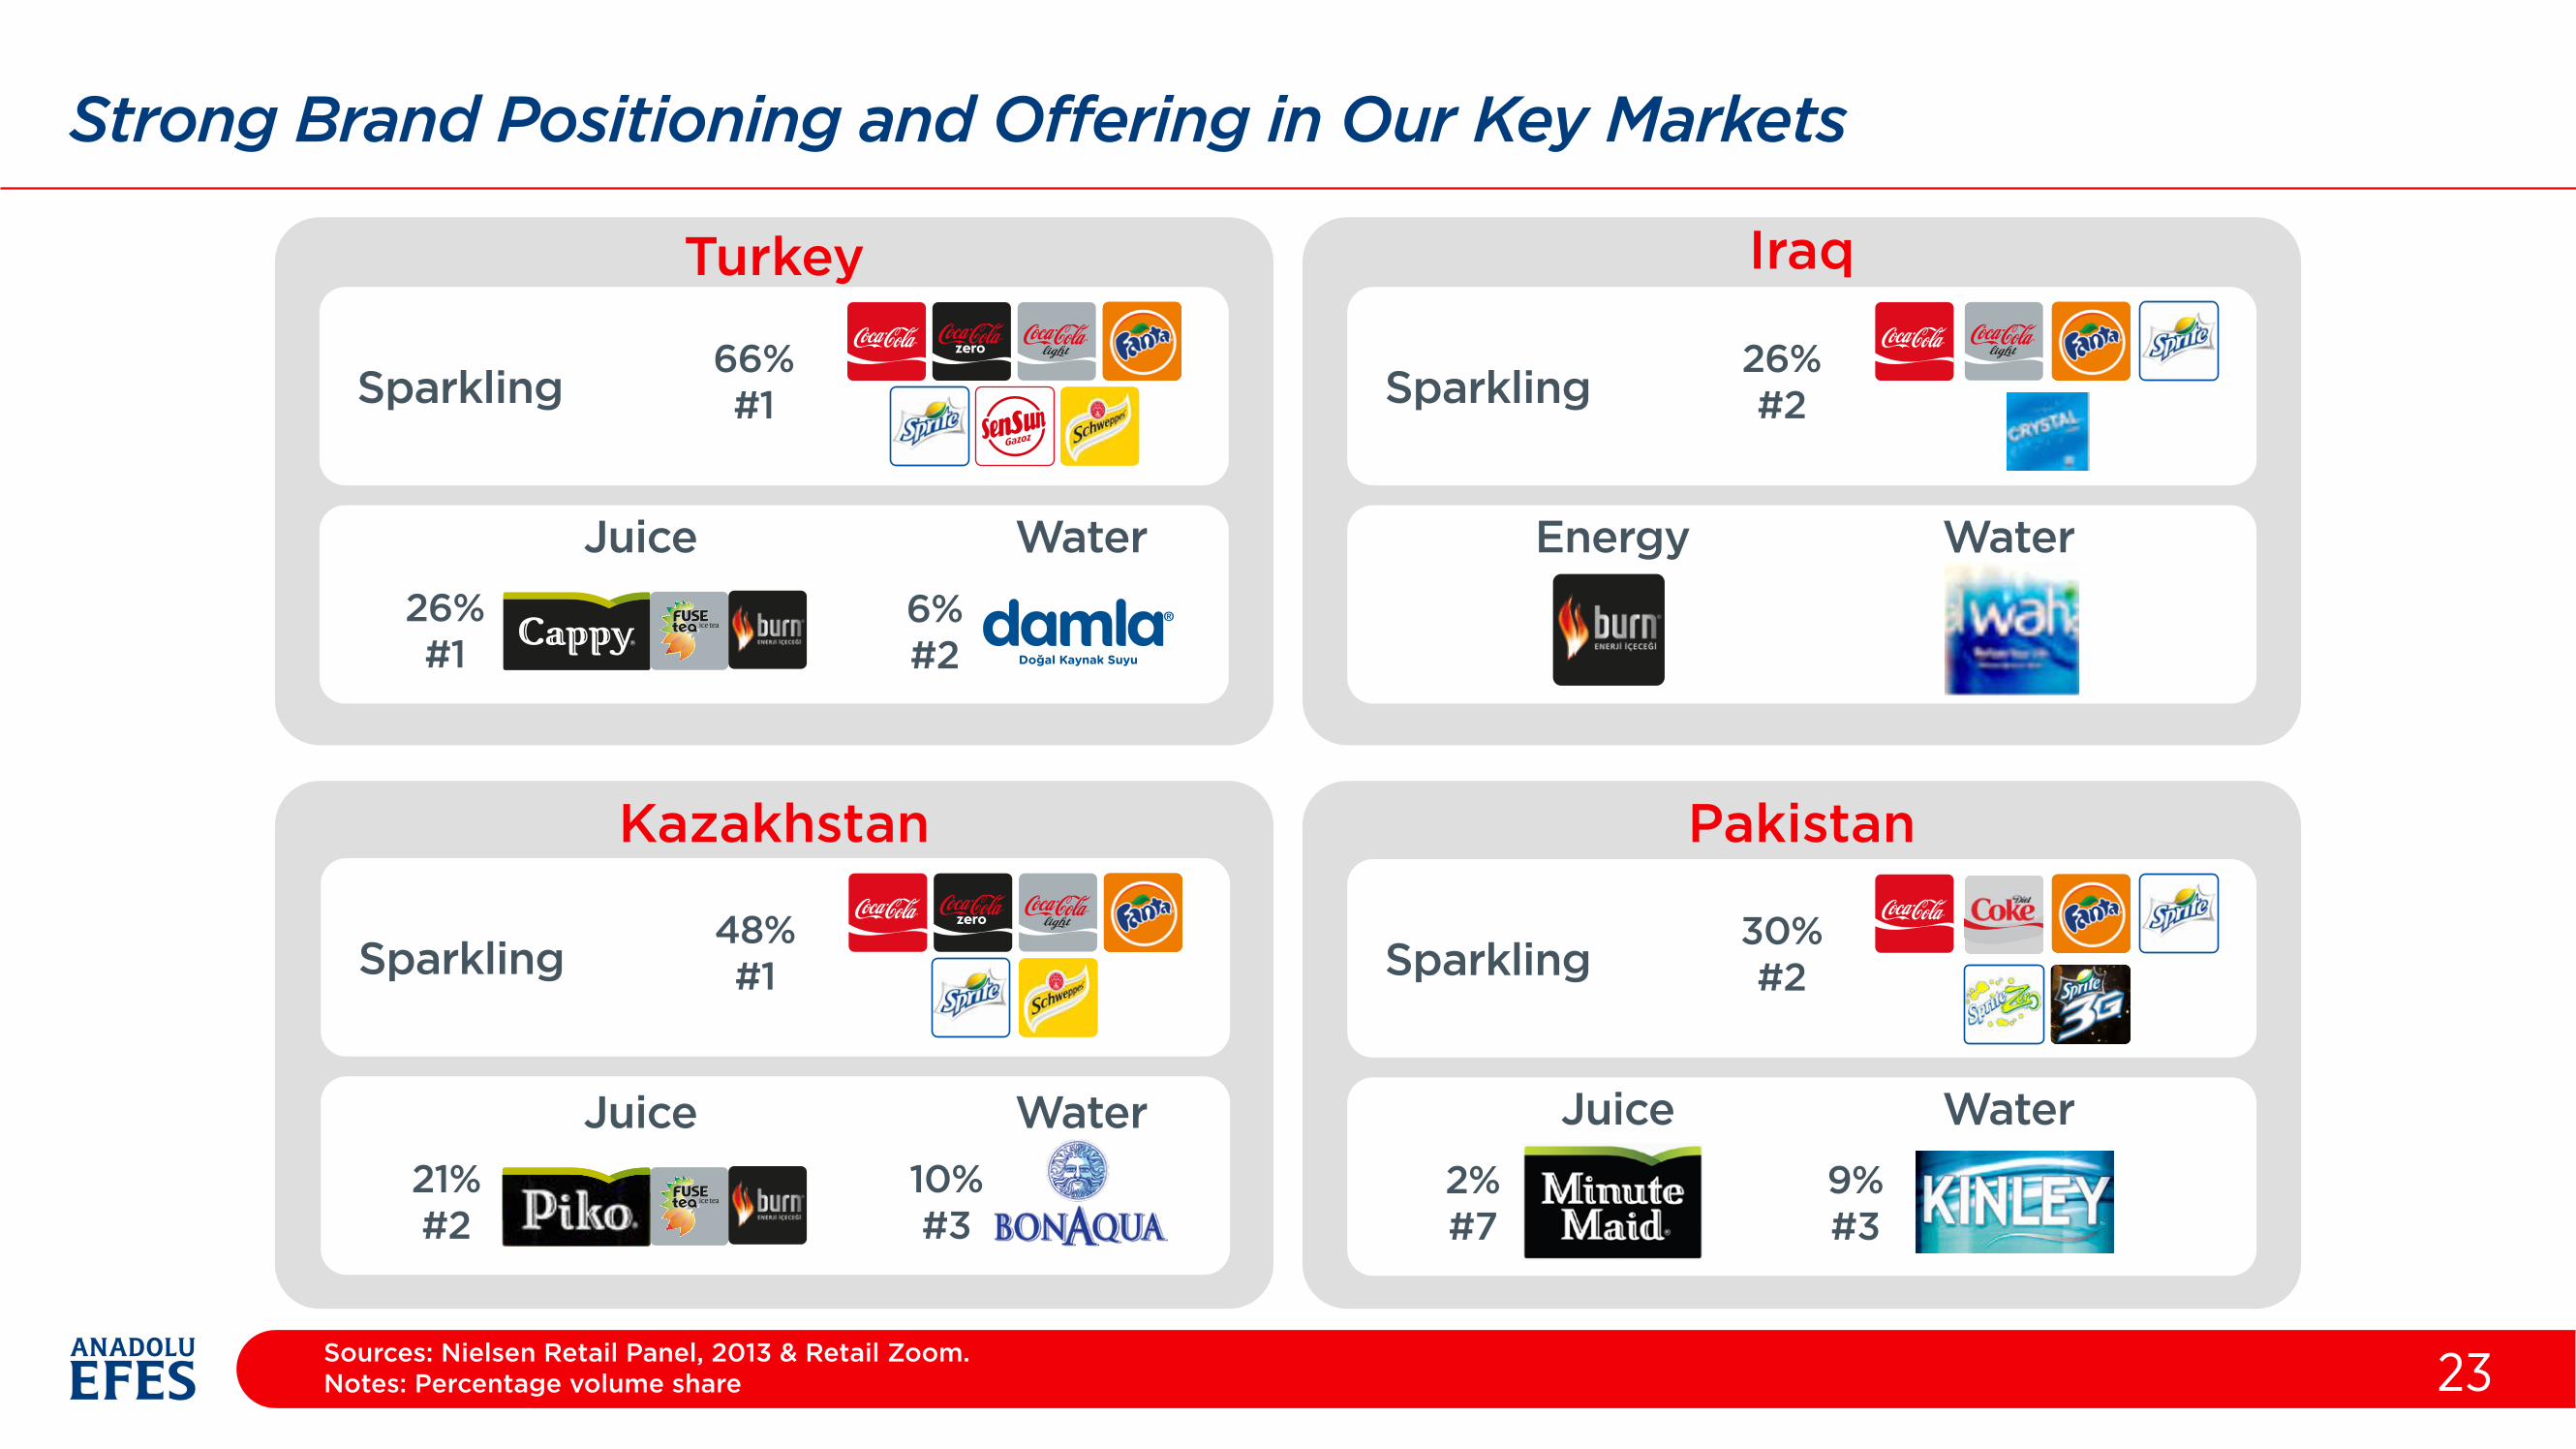
Strong Brand Positioning and Offering in Our Key Markets
23
Turkey
Kazakhstan
Iraq
Pakistan
Sparkling
Juice Water
66%#1
26%#1
6%#2
Sparkling48%#1
21%#2
10%#3
Sparkling
Juice Water
30%#2
2%#7
9%#3
Sparkling
Energy Water
26%#2
Sources: Nielsen Retail Panel, 2013 & Retail Zoom.Notes: Percentage volume share
Juice Water

Beer OperationsFinancials & Outlook
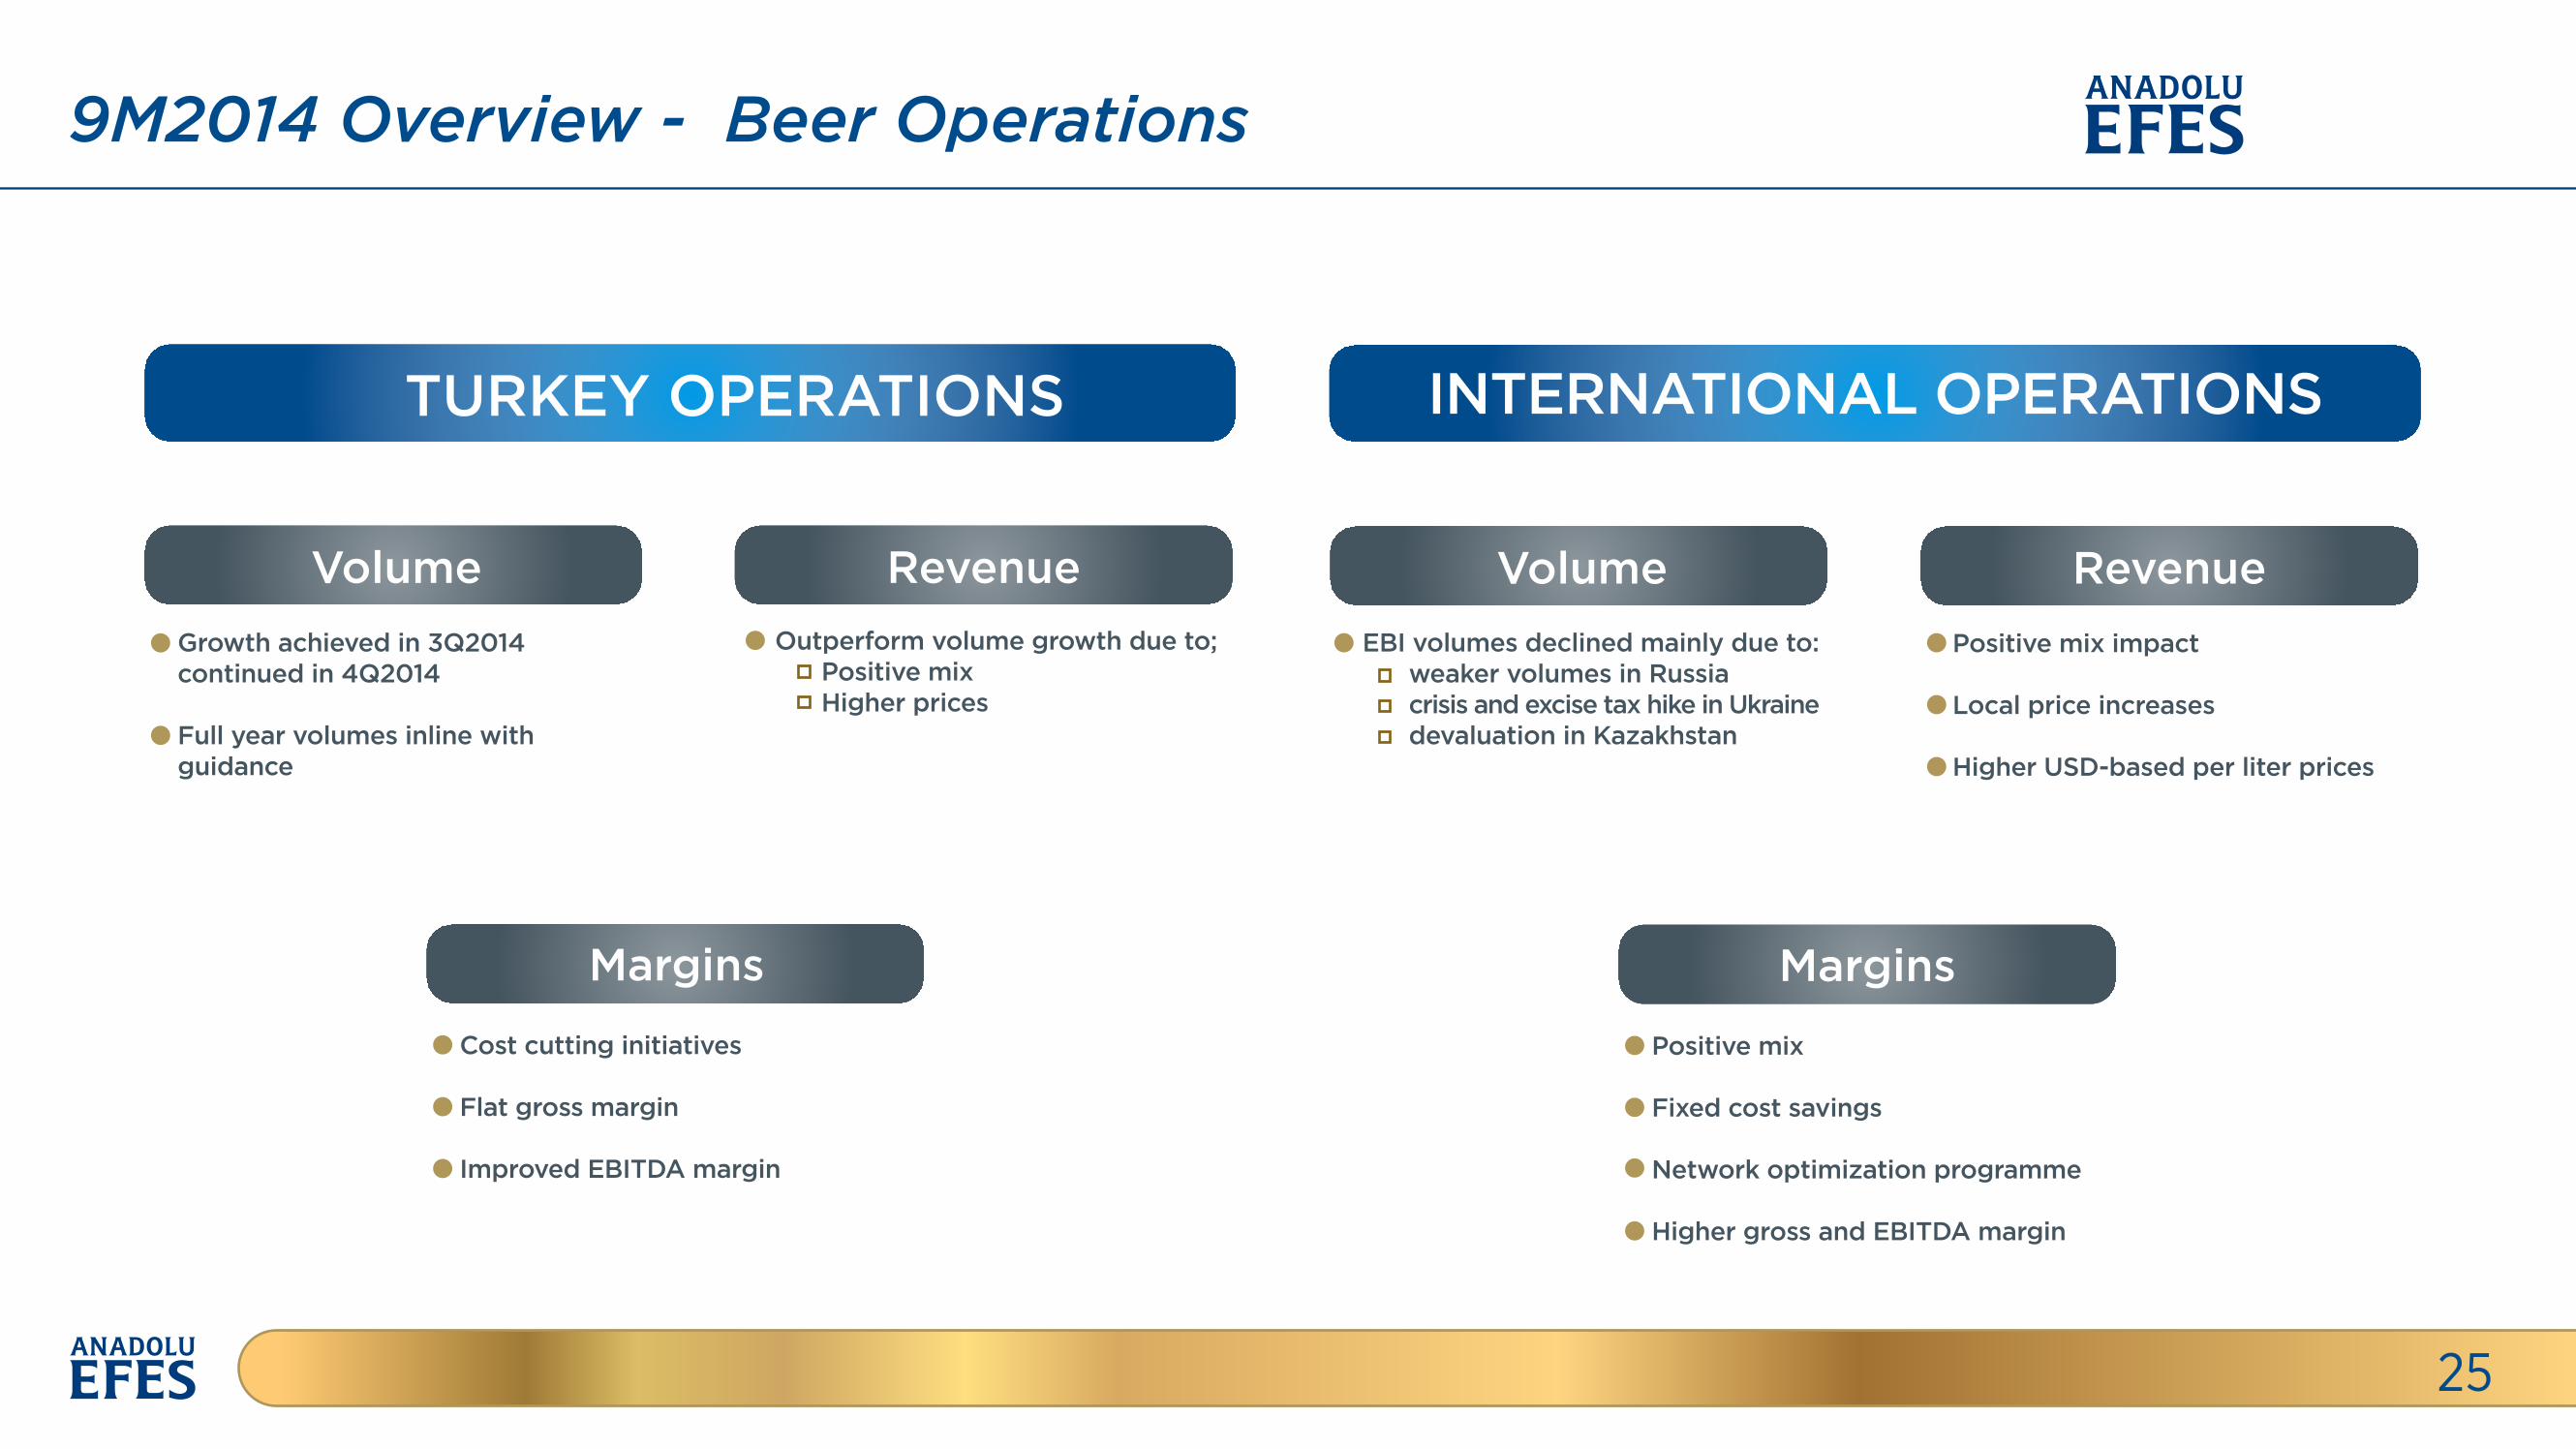
9M2014 Overview - Beer Operations
25
TURKEY OPERATIONS INTERNATIONAL OPERATIONS
Volume RevenueGrowth achieved in 3Q2014continued in 4Q2014
Full year volumes inline withguidance
EBI volumes declined mainly due to: weaker volumes in Russia crisis and excise tax hike in Ukraine devaluation in Kazakhstan
Margins
Cost cutting initiatives
Flat gross margin
Improved EBITDA margin
Volume RevenuePositive mix impact
Local price increases
Higher USD-based per liter prices
Margins
Positive mix
Fixed cost savings
Network optimization programme
Higher gross and EBITDA margin
Outperform volume growth due to; Positive mix Higher prices
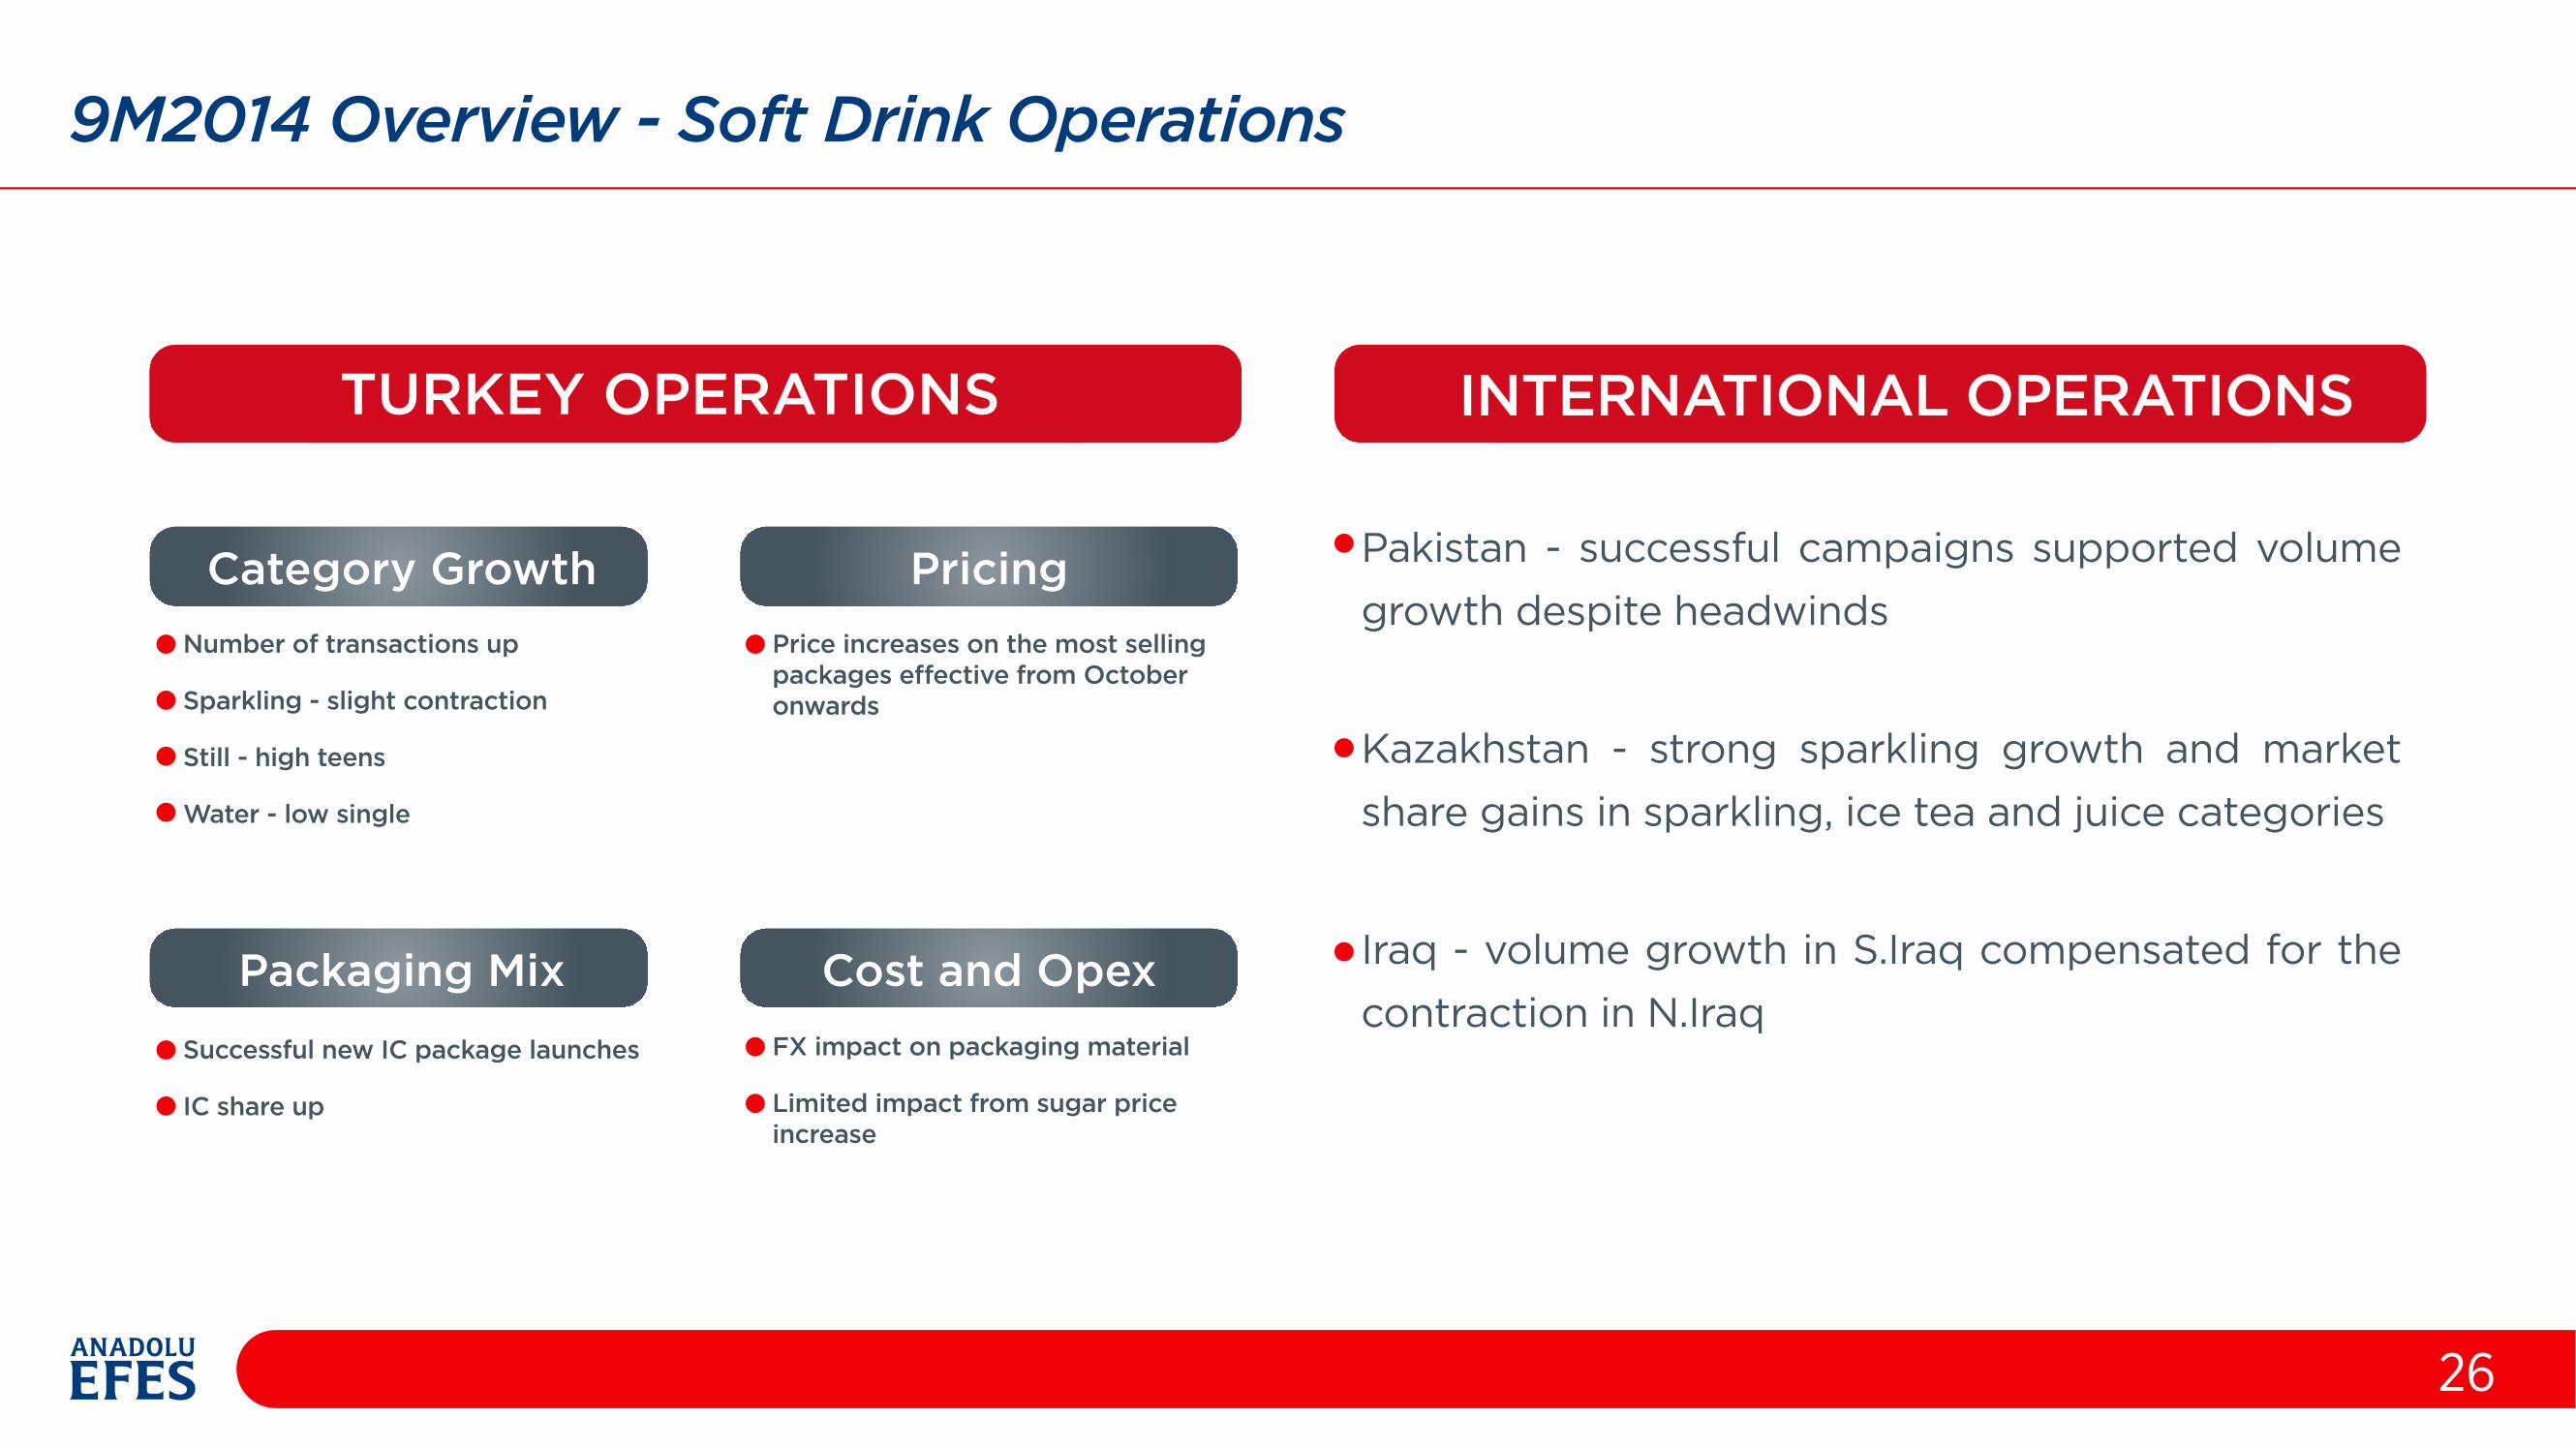
9M2014 Overview - Soft Drink Operations
26
TURKEY OPERATIONS INTERNATIONAL OPERATIONS
Category Growth Pricing
Packaging Mix Cost and Opex
Number of transactions up
Sparkling - slight contraction
Still - high teens
Water - low single
Price increases on the most selling packages e�ective from October onwards
Pakistan - successful campaigns supported volume growth despite headwinds
Kazakhstan - strong sparkling growth and market share gains in sparkling, ice tea and juice categories
Iraq - volume growth in S.Iraq compensated for the contraction in N.Iraq
FX impact on packaging material
Limited impact from sugar price increase
Successful new IC package launches
IC share up

Turkey Beer Market – FlattishRussian Beer Market – Mid-to-high single digit decline
Efes Turkey Volume – Low-to-mid single digit declineEfes Russia Volume – Low-to-mid single digit declineTotal Beer Volume – Low-to-mid single digit decline
Sales Revenues – GrowEBITDA growth > Revenue growthEBITDA margin expansion – Both in Turkey and Russia
2014 Outlook
27
BEER OPERATIONS
Sales volumes - mid-single digit growthSales revenue growth > volume growthEBITDA (BNRI) growth in line with revenue growth
ON A CONSOLIDATED BASIS

Turkey Beer Financial Performance
28
mhl
2009 2013 9M2013 9M2014
8.5
7.3
2014
7.15.8 5.5
Total -6.0%Domestic -5.6%
CAGR -3.8%
* Sales volume including exports
-3.2%
Volume
mill
ion
TR
L
2009 2013 9M2013 9M2014
1,264.2
1,517.5
1,231.5 1,239.7
CAGR 4.7%
0.7%
Revenue
EBITDAm
illio
n T
RL
2009 2013 9M2013
32.2% 33.5%
9M2014
503.0
419.7 396.0 415.3
CAGR -4.4%4.9%
marg
in

International Beer Financial Performance
29m
illio
n U
SD
2009 2013 9M2013 9M2014
857.3
1,300.5
1,037.1944.9
CAGR 11.0%-8.9%
mhl
2009 2013 9M2013 9M2014
13.6
18.2
2014
17.414.5 14.1
CAGR 7.6%
Volume
-2.7%
-4.8%
Revenue
EBITDA (BNRI)m
illio
n U
SD
2009 2013 9M2013
12.3% 13.7%
9M2014
170.1140.1 128.0 129.4
CAGR -4.7% 1.0%
marg
in

Soft Drinks Financial Performance
30
2014 OUTLOOKConsolidated - High single-digit volume growth Turkey - Low single-digit volume growth International - mid-teen volume growth
Net revenue growth > volume growth
EBITDA margin lower vs. 2013
mu/
c
2009 2013 9M2013 9M2014
438.9
573.6
2014
577.9
462.5 480.0
CAGR 6.9%
3.8%
0.7%
mill
ion
TR
L
2009 2013 9M2013 9M2014
2,407.5
5,186.4
4,183.94,902.5
CAGR 21.2%
17.2%
mill
ion
TR
L
2009 2013 9M2013 9M2014
368.7
892.1786.8
890.6CAGR 24.7%
13.2%
Turk
eyV
olu
me
Rev
enue
EB
ITD
A
18.8% 18.2%
marg
inIn
tern
atio
nal
Vo
lum
em
u/c
2009 2013 9M2013 9M2014
147.6
484.2
2014
552.8
391.7452.6
CAGR 34.6%
15.5%
14.2%