Embed Size (px)
Citation preview

Atmos. Chem. Phys., 16, 5111–5137, 2016
www.atmos-chem-phys.net/16/5111/2016/
doi:10.5194/acp-16-5111-2016
© Author(s) 2016. CC Attribution 3.0 License.
An overview of the first decade of PollyNET: an emerging
network of automated Raman-polarization lidars for
continuous aerosol profiling
Holger Baars1, Thomas Kanitz1,a, Ronny Engelmann1, Dietrich Althausen1, Birgit Heese1, Mika Komppula2,
Jana Preißler4,b, Matthias Tesche7,c, Albert Ansmann1, Ulla Wandinger1, Jae-Hyun Lim5, Joon Young Ahn5,
Iwona S. Stachlewska6, Vassilis Amiridis8, Eleni Marinou8,21, Patric Seifert1, Julian Hofer1, Annett Skupin1,
Florian Schneider1, Stephanie Bohlmann1, Andreas Foth1,16, Sebastian Bley1, Anne Pfüller2,†, Eleni Giannakaki2,
Heikki Lihavainen3, Yrjö Viisanen3, Rakesh Kumar Hooda3,12, Sérgio Nepomuceno Pereira4, Daniele Bortoli4,
Frank Wagner4,20, Ina Mattis20, Lucja Janicka6, Krzysztof M. Markowicz6, Peggy Achtert7,d, Paulo Artaxo9,
Theotonio Pauliquevis10, Rodrigo A. F. Souza11, Ved Prakesh Sharma12, Pieter Gideon van Zyl13,
Johan Paul Beukes13, Junying Sun14, Erich G. Rohwer15, Ruru Deng17, Rodanthi-Elisavet Mamouri8,18, and
Felix Zamorano19
1Leibniz Institute for Tropospheric Research, Permoserstraße 15, 04318 Leipzig, Germany2Finnish Meteorological Institute, Kuopio, Finland3Finnish Meteorological Institute, Helsinki, Finland4Évora University, Institute for Earth Sciences, Évora, Portugal5National Institute of Environmental Research, Incheon, Republic of Korea6Institute of Geophysics, Faculty of Physics, University of Warsaw, Warsaw, Poland7Department for Environmental Science and Analytical Chemistry, and Department of Meteorology, Stockholm University,
Stockholm, Sweden8IAASARS, National Observatory of Athens, Athens, Greece9Institute of Physics, University of São Paulo, São Paulo, Brazil10Department of Biological Sciences, Federal University of São Paulo at Diadema, Diadema, Brazil11Coordination of Meteorology, University of the State of Amazonas, Manaus, Brazil12The Energy and Resources Institute, New Delhi, India13Unit for Environmental Sciences and Management, North-West University, Potchefstroom, South Africa14Key Laboratory of Atmospheric Chemistry of CMA, Institute of Atmospheric Composition, Chinese Academy of
Meteorological Sciences, Beijing, China15Physics Department, Stellenbosch University, Stellenbosch, South Africa16Leipzig Institute for Meteorology, University of Leipzig, Leipzig, Germany17School of Geography and Planning, Sun Yat-sen University, Guangzhou, China18Cyprus University of Technology, Department of Civil Engineering and Geomatics, Limassol, Cyprus19Laboratory of Atmospheric Research, University of Magallanes, Punta Arenas, Chile20Hohenpeißenberg Meteorological Observatory, Deutscher Wetterdienst, Hohenpeißenberg, Germany21Laboratory of Atmospheric Physics, Aristotle University of Thessaloniki, Thessaloniki, Greeceanow at: European Space Agency, ESTEC, Noordwijk, the Netherlandsbnow at: Centre for Climate and Air Pollution Studies, School of Physics, National University of Ireland Galway,
Galway, Irelandcnow at: School of Physics, Astronomy and Mathematics, University of Hertfordshire, Hatfield, UKdnow at: School of Earth and Environment, University of Leeds, Leeds, UK†deceased
Correspondence to: Holger Baars ([email protected])
Published by Copernicus Publications on behalf of the European Geosciences Union.

5112 H. Baars et al.: PollyNET
Received: 10 August 2015 – Published in Atmos. Chem. Phys. Discuss.: 15 October 2015
Revised: 9 March 2016 – Accepted: 30 March 2016 – Published: 25 April 2016
Abstract. A global vertically resolved aerosol data set cover-
ing more than 10 years of observations at more than 20 mea-
surement sites distributed from 63◦ N to 52◦ S and 72◦W to
124◦ E has been achieved within the Raman and polarization
lidar network PollyNET. This network consists of portable,
remote-controlled multiwavelength-polarization-Raman li-
dars (Polly) for automated and continuous 24/7 observa-
tions of clouds and aerosols. PollyNET is an independent,
voluntary, and scientific network. All Polly lidars feature
a standardized instrument design with different capabilities
ranging from single wavelength to multiwavelength systems,
and now apply unified calibration, quality control, and data
analysis. The observations are processed in near-real time
without manual intervention, and are presented online at
polly.tropos.de. The paper gives an overview of the obser-
vations on four continents and two research vessels obtained
with eight Polly systems. The specific aerosol types at these
locations (mineral dust, smoke, dust-smoke and other dusty
mixtures, urban haze, and volcanic ash) are identified by
their Ångström exponent, lidar ratio, and depolarization ra-
tio. The vertical aerosol distribution at the PollyNET locations
is discussed on the basis of more than 55 000 automatically
retrieved 30 min particle backscatter coefficient profiles at
532 nm as this operating wavelength is available for all Polly
lidar systems. A seasonal analysis of measurements at se-
lected sites revealed typical and extraordinary aerosol condi-
tions as well as seasonal differences. These studies show the
potential of PollyNET to support the establishment of a global
aerosol climatology that covers the entire troposphere.
1 Introduction
Aerosol particles have been depicted as one important and
underdetermined component that affects the Earth’s energy
budget. Their complex nature regarding size, shape, and
chemical composition, their highly variable temporal and
spatial distribution in the atmosphere, and their complex in-
teractions with clouds require strong effort in their observa-
tion and characterization (IPCC, 2014; Stevens and Feingold,
2009). In addition, the volcanic eruption hazards of Eyjaf-
jallajökull and Grimsvötn for aircraft safety in Europe have
shown the need for near-real-time information of height-
resolved aerosol concentration on continental scales.
Lidars are a key instrument for the characterization of
aerosols and their impact on the Earth’s environment as
they are able to provide vertically resolved information of
aerosols. With multiwavelength-Raman-polarization lidars,
aerosol layers can be characterized in terms of types, size
distribution, and concentration (Ansmann and Müller, 2005;
Müller et al., 2007; Ansmann et al., 2012).
As a global coverage of height-resolved aerosol moni-
toring is strongly needed, either space-borne lidars, e.g.,
CALIOP (Cloud–Aerosol Lidar with Orthogonal Polariza-
tion) aboard the polar-orbiting CALIPSO satellite (Cloud–
Aerosol Lidar and Infrared Pathfinder Satellite Observation,
Winker et al., 2009) or ground-based networks of ceilome-
ters, micro-pulse lidars, or scientific Raman lidars are applied
(Bösenberg et al., 2007; Hoff and Pappalardo, 2010). The
shortcomings of the space-borne lidar CALIOP are the need
for a priori information of aerosol type to retrieve particle
backscatter coefficient profiles and the low temporal resolu-
tion, because it overpasses the same area only every 16th day.
Ceilometer (e.g., Flentje et al., 2010) and micro-pulse lidar
(Welton et al., 2001) networks are operated 24/71 at many lo-
cations world wide and deliver valuable data on the vertical
aerosol distribution but are not able to distinguish aerosols
in terms of their size distribution, shape, or extinction ef-
ficiency, and thus their type (Spinhirne et al., 1995; Heese
et al., 2010; Stachlewska et al., 2012).
Comprehensive efforts have been made to establish
ground-based research lidar networks. Within EARLINET,
the European Aerosol Research Lidar Network2 (Pappalardo
et al., 2014), aerosol profiling and characterization is per-
formed within Europe by different Raman and polarization
lidars three times per week. Most of the lidar systems within
EARLINET are prototypes leading to a huge variety of partly
manually controlled system setups. EARLINET members
have developed lidar techniques and algorithms in order to
harmonize the lidar measurements, to setup quality stan-
dards, to perform systematic test routines, and to improve
the lidar data evaluation (e.g., Böckmann et al., 2004; Pap-
palardo et al., 2004; Freudenthaler, 2008; Pappalardo et al.,
2014; Wandinger et al., 2015; Freudenthaler, 2016; Bravo-
Aranda et al., 2016; Belegante et al., 2016). Many of these
efforts led also to a significant benefit for PollyNET. Recently,
EARLINET also demonstrated the potential of continuous
operation (Sicard et al., 2015) like done within PollyNET.
The American Lidar Network ALINE (Antuña et al., 2012;
Barbosa et al., 2014) and the Commonwealth of Indepen-
dent States Lidar Network CISLiNet (Chaikovsky et al.,
2006) consist of mixed prototype lidar systems, too. Within
the Asian Dust Network (AD-NET, Sugimoto et al., 2008),
standardized lidar instruments, mostly with 2-wavelength
backscatter (at 532 and 1064 nm) and 1-wavelength depo-
1Continuously 24 h a day, 7 days per week.2Now part of the Aerosols, Clouds, and Trace gases Research
InfraStructure (ACTRIS).
Atmos. Chem. Phys., 16, 5111–5137, 2016 www.atmos-chem-phys.net/16/5111/2016/
H. Baars et al.: PollyNET 5113
larization (at 532 nm) capabilities, are applied and the atten-
uated backscatter coefficients and the volume depolarization
ratio are automatically retrieved. At the six primary stations
of AD-NET also Raman capabilities are available (Sugimoto
et al., 2014). This network covers aerosol observations in the
Asian dust belt.
Motivated by the urgent need for robust multiwavelength-
Raman-polarization lidars that are easy to operate and al-
low aerosol typing, a portable lidar system, called Polly, has
been developed at the Leibniz Institute for Tropospheric Re-
search (TROPOS) with international partners during the last
decade (Althausen et al., 2009; Engelmann et al., 2016). The
aim was to develop a sophisticated multiwavelength-Raman-
polarization lidar for scientific purpose, but with the advan-
tages of an easy-to-use and well-characterized instrument
with same design, same automated operation, and same cen-
tralized data processing in line with the CIMEL Sun pho-
tometer of AERONET (Holben et al., 2001). The Polly sys-
tems have been developed for continuous, stand-alone opera-
tion in remote environments and were successfully deployed
in the high northern latitudes of Finland (> 30 cm snow and
<−20 ◦C, Hirsikko et al., 2014), in the rain forest of the
Amazonian Basin with temperatures of> 30 ◦C and high rel-
ative humidity (Baars et al., 2012), and under permanent me-
chanical stress from motor vibrations plus rough sea aboard
the research vessel Polarstern (Kanitz et al., 2013a).
As the number of Polly systems and measurement sites has
increased with time, an independent, voluntary, international
network of cooperating institutes, the so-called PollyNET
(Althausen et al., 2013), has evolved as an additional con-
tribution to the world wide aerosol observational efforts.
Namely the Finnish Meteorological Institute (FMI), the Na-
tional Institute of Environmental Research (NIER) in Korea,
the Évora University in Portugal (UE-ICT), the University
of Warsaw (UW) in Poland, the German Meteorological Ser-
vice (DWD), and the National Observatory of Athens (NOA)
in Greece contribute actively to the network by operating
Polly systems. Each group contributes with its expertise and
knowledge to the network and to joint scientific projects.
Polly lidar measurements have been performed at more
than 20 locations in Europe, the Amazon rain forest, south-
ern Chile, South Africa, India, China, Korea, and over the
Atlantic Ocean and very different aerosol types and aerosol
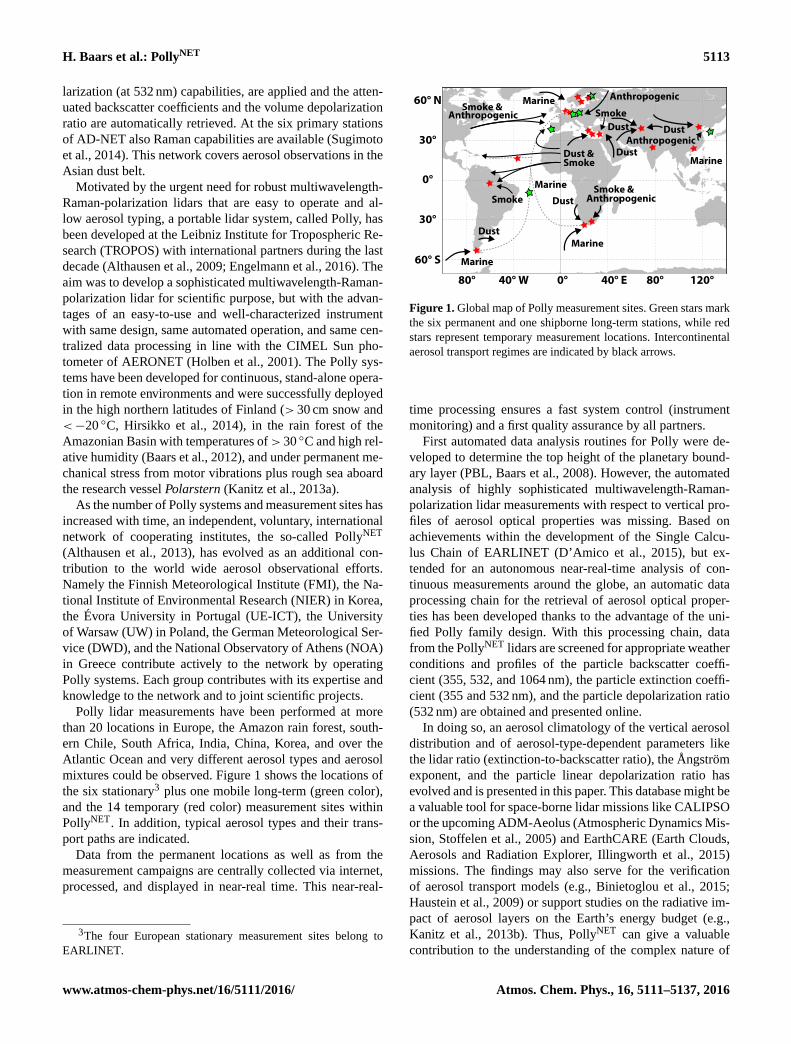
mixtures could be observed. Figure 1 shows the locations of
the six stationary3 plus one mobile long-term (green color),
and the 14 temporary (red color) measurement sites within
PollyNET. In addition, typical aerosol types and their trans-
port paths are indicated.
Data from the permanent locations as well as from the
measurement campaigns are centrally collected via internet,
processed, and displayed in near-real time. This near-real-
3The four European stationary measurement sites belong to
EARLINET.
Marine
Marine
DustSmoke
Anthropogenic
Dust
AnthropogenicDust
Dust &
Smoke &Anthropogenic
Smoke &
0° 40° E 120°40° W80°
0°
30°
30°
80°
60° S
60° N Marine
Smoke Marine
DustSmoke
Anthropogenic
Marine
Dust
Figure 1. Global map of Polly measurement sites. Green stars mark
the six permanent and one shipborne long-term stations, while red
stars represent temporary measurement locations. Intercontinental
aerosol transport regimes are indicated by black arrows.
time processing ensures a fast system control (instrument
monitoring) and a first quality assurance by all partners.
First automated data analysis routines for Polly were de-
veloped to determine the top height of the planetary bound-
ary layer (PBL, Baars et al., 2008). However, the automated
analysis of highly sophisticated multiwavelength-Raman-
polarization lidar measurements with respect to vertical pro-
files of aerosol optical properties was missing. Based on
achievements within the development of the Single Calcu-
lus Chain of EARLINET (D’Amico et al., 2015), but ex-
tended for an autonomous near-real-time analysis of con-
tinuous measurements around the globe, an automatic data
processing chain for the retrieval of aerosol optical proper-
ties has been developed thanks to the advantage of the uni-
fied Polly family design. With this processing chain, data
from the PollyNET lidars are screened for appropriate weather
conditions and profiles of the particle backscatter coeffi-
cient (355, 532, and 1064 nm), the particle extinction coeffi-
cient (355 and 532 nm), and the particle depolarization ratio
(532 nm) are obtained and presented online.
In doing so, an aerosol climatology of the vertical aerosol
distribution and of aerosol-type-dependent parameters like
the lidar ratio (extinction-to-backscatter ratio), the Ångström
exponent, and the particle linear depolarization ratio has
evolved and is presented in this paper. This database might be
a valuable tool for space-borne lidar missions like CALIPSO
or the upcoming ADM-Aeolus (Atmospheric Dynamics Mis-
sion, Stoffelen et al., 2005) and EarthCARE (Earth Clouds,
Aerosols and Radiation Explorer, Illingworth et al., 2015)
missions. The findings may also serve for the verification
of aerosol transport models (e.g., Binietoglou et al., 2015;
Haustein et al., 2009) or support studies on the radiative im-
pact of aerosol layers on the Earth’s energy budget (e.g.,
Kanitz et al., 2013b). Thus, PollyNET can give a valuable
contribution to the understanding of the complex nature of
www.atmos-chem-phys.net/16/5111/2016/ Atmos. Chem. Phys., 16, 5111–5137, 2016

5114 H. Baars et al.: PollyNET
atmospheric particles which is a prerequisite to understand
their complex interactions with clouds.
The scope of this paper is (a) to introduce this network and
its strategy, (b) review the scientific results obtained in the
last decade, and (c) demonstrate the potential for future re-
search. Here, a global statistical overview is provided, while
intensified studies for each station are presented in specific
publications.
The paper is structured as follows: Sect. 2 gives a brief in-
troduction into the Polly systems. In Sect. 3, the different
measurement locations are introduced, and the main find-
ings of more than 10 years of Polly observations are sum-
marized providing an overview of aerosol-type-dependent
properties observed within PollyNET. Section 4 presents the
data analysis algorithm, which is explained in more detail in
the Appendix A. The applicability and potential of the auto-
mated algorithm for the Polly systems is discussed for one
example case of a Saharan dust event observed at Leipzig
in 2012 (Sect. 5). In Sect. 6, the currently most comprehen-
sive harmonized aerosol information from ground-based li-
dars worldwide is presented based on the automatically ana-
lyzed global data set of PollyNET. At the end of the paper, a
conclusion and future plans are given.
2 The portable lidar Polly
The first Polly system (Althausen et al., 2009) is a one-
wavelength Raman lidar at 532 nm with an emitted laser
energy of 120 mJ and a primary mirror of 20 cm in diam-
eter. Data are acquired with 37.5 m vertical resolution and
averaged over 450 shots (15 Hz laser frequency). Figure 2
shows the first profiles of the backscatter and extinction coef-
ficients measured by Polly on 10 December 2002 in Leipzig,
Germany. The backscatter coefficient is 10 Mm−1 sr−1 in
the boundary layer that extended up to about 350 m height.
Optically thin, lofted layers were present between 700 and
1100 m height. While the first measurement lasted only about
24 min, this system was continuously improved for automatic
operation and now runs unattended in 24/7 mode. The latest
developed PollyXT (with extended capabilities) is a so-called
3+ 2+ 2+ 1+ 1+ 14 Raman, polarization, and water-vapor
lidar with near-range capabilities. This system emits light
at 1064, 532, and 355 nm at an energy of 180, 110, 60 mJ.
The receiver unit consists of a primary mirror of 30 cm in
diameter. With this setup the backscatter coefficient at 1064,
532, and 355 nm, and the extinction coefficient at 532 and
355 nm can be determined. Thus, aerosols can be charac-
terized by their lidar ratio and Ångström exponent (Müller
et al., 2007), but also in terms of microphysical properties
and the single scattering albedo (e.g., Ansmann and Müller,
2005). In addition, two polarization-sensitive channels allow
the determination of the particle linear depolarization ratio
43 elastic, 2 Raman, 2 depolarization, 1 water-vapor, 1 near-
range elastic, and 1 near-range Raman signals.
0.0
0.5
1.0
1.5
2.0
0Bsc. coe�. (Mm-1sr-1)
Hei
ght (
km)
AO
D = 0.14
5 10 100 200Ext. coe�. (Mm-1)
Figure 2. Profiles of (a) particle backscatter and (b) extinction
coefficients at 532 nm measured with the first-generation Polly in
Leipzig, Germany on 10 December 2002.
(Freudenthaler et al., 2009) at 355 and 532 nm providing in-
formation on the shape of the scatterer. With this informa-
tion, e.g., mixed-dust layers can be analyzed for the fractions
of pure dust and other aerosol types (Tesche et al., 2011;
Baars et al., 2012; Kanitz et al., 2013a). Vertical profiles of
aerosol properties up to 20 km height can be derived with
this receiver unit. Additionally, profiles of the water-vapor
mixing ratio can be determined via the measurement of the
inelastic water-vapor backscatter at 407 nm wavelength (Re-
ichardt et al., 2012; Foth et al., 2015). Below about 600–
800 m a.g.l. (above ground level), the overlap of the laser
beam and the receiver field of view is incomplete and needs
to be corrected (e.g., with the methodology described by
Wandinger and Ansmann, 2002). As a consequence, a second
detection unit together with a near-range telescope was added
to the system to detect the elastic and inelastic backscatter at
532 and 607 nm in the lowermost height range above the sys-
tem. As a result, the determined overlap function of the far-
range channels can be verified and backscatter and extinc-
tion profiles can be obtained down to about 100 m a.g.l. The
data of all channels are acquired with a vertical resolution of
7.5 m in temporal steps of 30 s (laser frequency 20 Hz). Fur-
ther system details are given by Althausen et al. (2009) and
Engelmann et al. (2016). The specific system setup at each
location is given in Table 1.
Atmos. Chem. Phys., 16, 5111–5137, 2016 www.atmos-chem-phys.net/16/5111/2016/

H. Baars et al.: PollyNET 5115
Ta
ble
1.
Over
vie
wo
fm
easu
rem
ent
site
sw
ith
loca
tio
n,
nu
mb
ero
fav
aila
ble
mea
sure
men
td
ays
(sta
tus:
31
Dec
emb
er2
01
5fo
ro
ng
oin
gm
easu
rem
ents
),d
om
inan
tae
roso
lty
pes
,an
d
tim
ep
erio
do
fo
bse
rvat
ion
.C
on
sid
ered
aero
sol
typ
esar
eth
efo
llow
ing
:cl
ean
con
tin
enta
l(c
c),
po
llu
ted
con
tin
enta
l(p
c),
mar
ine
(m),
min
eral
du
st(m
d),
and
smo
ke
(s).
Po
lly
lid
arty
pe
(1st
–fi
rst
Po
lly
syst
emow
ned
by
TR
OP
OS
,O
CE
AN
ET
–P
oll
yX
Tfo
rsh
ipb
orn
eo
bse
rvat
ion
sow
ned
by
TR
OP
OS
,al
lo
ther
sar
eP
oll
yX
Tsy
stem
sow
ned
by
the
inst
itu
tio
nas
nam
ed,
mo
red
etai
lsse
eE
ng
elm
ann
etal
.,2
01
6)
and
corr
esp
on
din
gm
easu
rem
ent
cap
abil
itie
s:b
ack
scat
ter
coef
fici
entβ
,ex
tin
ctio
nco
effi
cien
tα
,an
dd
epo
lari
zati
on
rati
oδ
atU
V(3
55
nm
),
VIS
(53
2n
m),
and
IR(1
06
4n
m)
wav
elen
gth
s,w
ater
vap
or
(WV
),ab
solu
teca
lib
rati
on
of
the
dep
ola
riza
tio
nch
ann
els
(δ-c
al.)
,an
dn
ear-
ran
ge
(NR
)d
etec
tio
nu
nit
.
Sit
eL
atit
ud
eL
on
git
ud
eA
ltit
ud
e#
day
sA
ero
sol
typ
esP
erio
dU
sed
lid
arU
VV
ISIR
WV
δ-c
alN
R
Åre
,S
wed
en6
3.4◦
N1
3.1◦
E4
25
m6
4cc
Jun
20
14
–S
ep2
01
41
st–
α,β
––
––
Ath
ens,
Gre
ece
38
.0◦
N2
3.7◦
E9
0m
14
9p
c,m
,m
d,
sM
ay2
01
5–
Mar
20
16
NO
Aα
,β
,δ
α,β
,δ
βx
xV
IS
Bae
ng
ny
eon
g,
Ko
rea
38
.0◦
N1
24
.7◦
E2
0m
50
3p
c,m
,m
dO
ct2
01
0–
on
go
ing
NIE
R–
α,β
,δ
––
––
Bei
jin
g,
urb
an,
Ch
ina
39
.9◦
N1
16
.3◦
E6
0m
10
cc,p
c,m
dJa
n2
00
5–
Jan
20
05
1st
–α
,β
––
––
Bei
jin
g,
rura
lat
SD
Z,
Ch
ina
40
.7◦
N1
17
.1◦
E1
16
m2
60
cc,p
c,m
dA
pr
20
09
–M
ar2
01
01
st–
α,β
––
––
Cab
auw
,th
eN
eth
erla
nd
s5
2.0◦
N4
.9◦
E−
1m
50
cc,p
c,m
Sep
20
14
–N
ov
20
14
OC
EA
NE
Tα
,β
,δ
α,β
,δ
βx
xV
IS
Du
shan
be,
Taj
ikis
tan
38
.6◦
N6
8.9◦
E8
64
m2
74
md
,p
c,cc
Mar
20
15
–o
ng
oin
gT
RO
PO
S∗
α,β
,δ
α,β
,δ
βx
x–
Ela
nd
sfo
nte
in,
So
uth
Afr
ica
26
.3◦
S2
9.4◦
E1
74
5m
30
2cc
,p
c,s
Dec
20
09
–Ja
n2
01
1F
MI
α,β
,δ
α,β
β–
––
Évo
ra,
Po
rtu
gal
38
.5◦
N7
.9◦
W2
90
m7
36
cc,m
,m
d,s
May
20
09
–o
ng
oin
gU
E-I
CT
α,β
α,β
,δ
β–
––
Fin
ok
alia
,G
reec
e3
5.3◦
N2
5.7◦
E2
45
m3
5cc
,m
d,
mJu
n2
01
4–
Jul
20
14
OC
EA
NE
Tα
,β
,δ
α,β
,δ
βx
xV
IS
Ho
hen
pei
ßen
ber
g,
Ger
man
y4
7.8◦
N1
1.0◦
E1
15
m5
9cc
,p
c,m
dS
ep2
01
5–
on
go
ing
DW
Dα
,β
α,β
,δ
β–
xV
IS
Hy
yti
älä,
Fin
lan
d6
1.8◦
N2
4.3◦
E1
47
m1
56
ccA
pr
20
14
–S
ep2
01
4F
MI
α,β
α,β
,δ
βx
x–
Kra
uth
ause
n,
Ger
man
y5
0.9◦
N6
.4◦
E9
5m
61
cc,
pc
Ap
r2
01
3–
May
20
13
IfT∗
α,β
α,β
,δ
βx
x–
Ku
op
io,
Fin
lan
d6
2.7◦
N2
7.5◦
E1
95
m7
76
ccO
ct2
01
2–
on
go
ing
FM
Iα
,β
α,β
,δ
βx
x–
Lei
pzi
g,
Ger
man
y5
1.4◦
N1
2.4◦
E1
25
m1
st–
α,β
––
––
IfT∗
α,β
,δ
2α
,β
,δ
1β
x2
x2
–
18
45
cc,
pc,
md
Jan
20
06
–o
ng
oin
gO
CE
AN
ET
α,β
,δ
α,β
,δ
βx
xU
V3,V
IS
Lin
den
ber
g,
Ger
man
y5
2.2◦
N1
4.1◦
E1
15
m9
2cc
,p
c,m
dJu
n2
01
5–
Sep
20
15
DW
Dα
,β
α,β
,δ
β–
xV
IS
Man
aus,
Bra
zil
2.6◦
S6
0.0◦
W8
3m
21
3cc
,s,
md
Jan
20
08
–N
ov
20
08
IfT∗
α,β
,δ
α,β
β–
––
Mel
pit
z,G
erm
any
51
.5◦
N1
2.9◦
E8
3m
42
cc,p
c,m
dM
ay2
00
8–
Jul
20
08
1st
–α
,β
––
––
48
cc,p
c,m
dS
ep2
01
3–
Oct
20
13
OC
EA
NE
Tα
,β
,δ
α,β
,δ
βx
xV
IS
69
cc,p
c,m
dA
pr
20
15
–Ju
l2
01
5O
CE
AN
ET
α,β
,δ
α,β
,δ
βx
xV
IS
New
Del
hi4
,In
dia
28
.4◦
N7
7.2◦
E2
43
m1
42
pc,
s,m
dM
ar2
00
8–
Mar
20
09
FM
Iα
,β
,δ
α,β
β–
––
Nic
osi
a,C
yp
rus
35
.1◦
N3
3.4◦
E1
74
m4
3m
d,m
,s,
pc
Mar
20
15
–A
pr
20
15
NO
Aα
,β
,δ
α,β
,δ
βx
xV
IS
Pal
las,
Fin
lan
d6
8.0◦
N2
4.2◦
E1
95
m6
7cc
Sep
20
15
–D
ec2
01
5F
MI
α,β
α,β
,δ
βx
x–
PR
D,
Xin
ken
,C
hin
a2
2.6◦
N1
13
.6◦
E1
0m
22
pc
Oct
20
04
–O
ct2
00
41
st–
α,β
––
––
PR
D,
Gu
ang
zho
u,
Ch
ina
23
.1◦
N1
13
.4◦
E2
5m
20
9p
cN
ov
20
11
–Ju
n2
01
2If
T∗
α,β
α,β
,δ
βx
x–
Pu
nta
Are
nas
,C
hil
e5
3.2◦
S7
0.9◦
W4
0m
96
cc,m
Nov
20
09
–M
ar2
01
0If
T∗
α,β
,δ
α,β
β–
––
Ste
llen
bo
sch
,S
ou
thA
fric
a3
4.0◦
S1
8.9◦
E1
20
m1
12
cc,p
c,s
Dec
20
10
–M
ar2
01
1If
T∗
α,β
α,β
,δ
β–
––
Sto
ckh
olm
,S
wed
en5
9.4◦
N1
8.1◦
E1
6m
11
39
cc,m
Au
g2
01
0–
Jun
20
14
1st
–α
,β
––
––
War
saw
,P
ola
nd
52
.2◦
N2
1.0◦
E1
12
m2
08
cc,p
c,m
d,
sJu
n2
01
3–
on
go
ing
UW
α,β
,δ
α,β
,δ
βx
xU
V,
VIS
5
R/V
Pola
rste
rnA
tlan
tic
N–
SIf
T∗
α,β
,δ
α,β
,δ
1β
––
–
22
7m
,m
d,
pc,
sO
ct2
00
9–
on
go
ing
OC
EA
NE
Tα
,β
,δ
α,β
,δ
βx
xU
V3,V
IS
R/V
Mete
or
Atl
anti
c≈
15◦
N2
6m
d,
m,
sA
pr
20
13
–M
ay2
01
3O
CE
AN
ET
α,β
,δ
α,β
,δ
βx
xV
IS
∗T
he
syst
emla
bel
edIf
T(f
orm
erab
bre
via
tion
of
the
Inst
itute
for
Tro
posp
her
icR
esea
rch)
was
upgra
ded
wit
han
addit
ional
UV
dep
ola
riza
tion
chan
nel
and
anew
dat
aac
quis
itio
nin
Januar
y2015
and
isnow
label
edT
RO
PO
S.
1D
epola
riza
tion
at532
nm
since
Apri
l2010;
2U
Vdep
ola
riza
tion
rem
oved
,W
Vch
annel
andδ-c
al.im
ple
men
ted
inA
ugust
2011;
3si
nce
August
2015;
4m
easu
rem
ents
atG
ual
Pah
ari;
5al
read
yex
isti
ng
–in
stal
lati
on
pla
nned
for
2016.
www.atmos-chem-phys.net/16/5111/2016/ Atmos. Chem. Phys., 16, 5111–5137, 2016

5116 H. Baars et al.: PollyNET
By the end of the year 2014, eight Polly systems have been
developed and employed. All these lidars differ slightly from
each other as the capabilities have continuously expanded
from the very first Polly version to the latest extended ver-
sion. Nevertheless, they feature a similar design, the same
data format, and benefit from unified calibration and quality
assurance routines. An overview of the different systems in-
cluding their capabilities and different characteristics can be
found in Engelmann et al. (2016).
3 Global measurement locations and published results
of PollyNET
The Polly systems have been deployed for vertical profiling
of aerosols and clouds at measurement sites from 64◦ N to
53◦ S and from 71◦W to 125◦ E. This includes areas with
Arctic conditions in Finland (63◦ N, 27◦ E), tropical condi-
tions in the Amazon basin (3◦ S, and 60◦W), and the Antarc-
tic regime at the southern peak of South America at Punta
Arenas (53◦ S, 71◦W). Notable measurement sites are the
two research vessels Meteor and Polarstern, which allow lon-
gitudinal and latitudinal cross section observations along the
Atlantic (Kanitz et al., 2013a, 2014b). Details on the position
and the measurement periods of each station as well as the
number of measurement days by the end of 2015 are given in
Table 1.
The global distribution of the measurement stations al-
lows the characterization of the main aerosol types, i.e., the
aerosol types used for the measurements of the space-borne
lidar CALIOP (clean continental, polluted continental, ma-
rine, mineral dust, and smoke aerosol, Winker et al., 2009).
Thus, PollyNET is a valuable tool for satellite validation.
A review of published results of measurements within
PollyNET is given in the following. Focus is set on ob-
servations in Asia (Sect. 3.1), in the Southern Hemisphere
(Sect. 3.2), on the Atlantic Ocean (Sect. 3.3), and within
the European Aerosol Research Lidar Network EARLINET
(Sect. 3.4).
3.1 Asia
In October 2004, first Raman lidar measurements with the
1st Polly were performed in Xinken (22.6◦ N, 113.6◦ E,
5 m a.s.l.), Pearl River Delta (PRD), China. Haze layers were
observed up to 3 km a.g.l. during the diurnal cycle. The par-
ticle optical depth (AOD, 532 nm) ranged from 0.3 to 1.7
(average 0.92). The mean lidar ratio of the haze layer was
35 to 59 sr (average 47 sr) (Ansmann et al., 2005; Müller
et al., 2006). The observations were continued in Beijing,
China in January 2005. In contrast to PRD, almost clean air
was observed throughout the Beijing campaign and the ob-
served air masses generally originated from the greater Gobi
area (arid desert and steppe). Very low lidar ratios of approxi-
mately 25 sr were found in a case of background aerosol con-
ditions with an AOD of 0.05 (Tesche et al., 2007, 2008). For
dust- and pollution-loaded air, the extinction coefficients var-
ied between 100 and 300 Mm−1 and lidar ratios of 30 to 45 sr
were observed within the PBL.
In 2009/2010, the 1st Polly returned to the area of Beijing.
In the framework of the European Aerosol Cloud Climate
and Air Quality Interactions (EUCAARI, Kulmala et al.,
2011), Polly was operated at the Global Atmospheric Watch
station of Shangdianzi (SDZ, 40.6◦ N, 117◦ E, 225 m a.s.l.)
∼ 100 km northeast of Beijing (Hänel et al., 2012) for 1 year
to cover a full annual cycle. A statistical analysis of all night-
time observations showed a distinct haze layer up to 1.5 and
a second layer up to 2.5–5 km a.g.l. The extinction coefficient
was 200–600 Mm−1 in the haze layer and 50–100 Mm−1 in
the elevated layer. The column AOD ranged from about 0.3
during northerly air flows to about 0.95 during southerly air
flows. The haze layer was characterized with a lidar ratio
of about 60 sr indicating anthropogenic fine-mode aerosol.
The analysis of the elevated layer showed a broad distri-
bution of the lidar ratio from 40–90 sr caused most prob-
ably by a complex mixture of aged desert dust, biomass-
burning smoke, and industrial pollution over eastern Asia
(Hänel et al., 2012).
The investigation of the vertical aerosol distribution in
China was continued in Guangzhou, PRD (23◦ N, 114◦ E)
from October 2011 for more than half a year in the frame-
work of the project “Megacities-Megachallenge” funded by
the German Research Foundation (DFG). This campaign
marked the first deployment of a PollyXT in China. The ur-
ban background aerosol of 0.45 AOD showed a low particle
depolarization ratio of less than 5 %. Lofted layers were ob-
served from 2 to 3.5 km altitude, consisting of a significant
fraction of non-spherical dust particles indicated by an in-
creased particle depolarization ratio of 20 % (Heese et al.,
2012, 2015).
In the framework of EUCAARI, the Finnish Meteorologi-
cal Institute (FMI) performed measurements with a PollyXT
at Gual Pahari (28◦ N, 77◦ E, 243 m a.s.l.), close to New
Delhi, India for more than 1 year in 2008 and 2009 (Komp-
pula et al., 2012). Aerosol layers frequently extended up to
5 km altitude. The aerosol characterization showed an annual
cycle of continental aerosol during summer (low lidar ratio)
and a higher influence of strongly absorbing aerosol in au-
tumn and winter (high lidar ratio). Nevertheless, the mean
extinction coefficient between 1 and 3 km a.g.l. was highest
during summer (142 Mm−1 at 532 nm).
The most eastern PollyNET measurement site is at
Baengnyeong Island, Korea (38◦ N, 125◦ E). The long-term
observations started in autumn 2010 and are still ongoing.
The PBL usually extends up to 1.2–1.4 km a.g.l. Frequently,
lofted layers at altitudes from 2.4–2.8 and 5.2–5.8 km were
observed. A high amount of continental aerosol, especially
Asian dust, was found with values of the particle depolariza-
tion ratio larger than 25 %. The measurements are ongoing
Atmos. Chem. Phys., 16, 5111–5137, 2016 www.atmos-chem-phys.net/16/5111/2016/

H. Baars et al.: PollyNET 5117
and are input for a detailed analysis of Asian dust and pollu-
tion, its optical properties, and vertical distribution.
3.2 Southern Hemisphere
A highlight in PollyNET are the first multiwavelength Ra-
man and polarization lidar observations of optical and mi-
crophysical particle properties in the Amazon Basin (close
to Manaus, Brazil, 3◦ S, 60◦W) from January to Novem-
ber 2008 (Baars et al., 2012) performed in the framework of
EUCAARI. The analysis of all measurements showed strong
differences between the pristine wet and the polluted dry
season. During the wet season, African smoke and dust ad-
vection frequently interrupted the pristine phases (Ansmann
et al., 2009; Baars et al., 2011). Under pure pristine con-
ditions, the extinction coefficients and AOD (532 nm) were
as low as 10–30 Mm−1 and < 0.05, respectively. In con-
trast, biomass-burning smoke plumes up to 3–5 km altitude
showed extinction coefficients of the order of 100 Mm−1 and
an AOD of 0.26 during the dry season. Ångström exponents
were 1.0–1.5, and the observed lidar ratios at 355 and 532 nm
were 50–80 sr (Baars et al., 2011, 2012). Seifert et al. (2015)
studied the relationship between aerosol properties, temper-
ature, and the efficiency of heterogeneous ice formation in
thin stratiform clouds using the data set obtained in Brazil.
It was found that the fraction of ice-containing clouds was
enhanced by a factor of 1.5 to 2 in the dry compared to the
wet season.
Another EUCAARI experiment was performed at Elands-
fontein (25◦ S, 27◦ E, 2.7 km a.s.l.), South Africa from 2009
to 2011 (Korhonen et al., 2014; Giannakaki et al., 2015). The
PBL extended up to 1.4–2.2 km a.g.l. Lofted layers (mean al-
titude 2.1–2.5 km) were observed throughout the measure-
ment period and showed a high variability in their opti-
cal properties and their contribution to the total AOD, due
to different source areas and travel paths. Mean lidar ra-
tios at 355 nm were 57± 20 sr (December to February),
59± 22 sr (March to May), 65± 23 sr (June to August),
and 89± 21 sr (September to November). During southern
hemispheric spring a considerable fraction of light-absorbing
biomass-burning aerosol was identified in the lofted layers by
high lidar ratios.
Shorter measurement campaigns of a few months were
performed at Punta Arenas, Chile and Stellenbosch, South
Africa (Kanitz et al., 2013a). At the University of the Magel-
lanes, the southernmost multiwavelength Raman and polar-
ization lidar measurements were performed with a PollyXT
in 2009/2010 for about 4 months (Kanitz et al., 2014a).
Within this period, optically thin lofted layers were observed
only eight times during the 24/7 measurements. These layers
could be tracked backwards to Australian bush fires and to
the Patagonian desert. However, the atmospheric conditions
were dominated by the marine and clean continental back-
ground as indicated by AODs lower than 0.05 in about 95 %
of all cases (Kanitz et al., 2013a). The PBL extended usually
up to 1.2 km a.g.l.
Based on these measurements and the Polarstern cruise
data, Kanitz et al. (2011) contrasted the temperature de-
pendence of heterogeneous ice formation efficiency between
the Southern Hemisphere and the Northern Hemisphere. At
comparable temperatures, a much higher fraction of ice-
containing clouds was found in the Northern Hemisphere,
suggesting that the increased aerosol load in the northern-
hemispheric free troposphere is responsible for this contrast.
3.3 Shipborne measurements
Polly lidar observations have been performed aboard the Ger-
man research vessel Polarstern since 2009. The aerosol data
set of the first 2 years was used to characterize the vertical
aerosol distribution over the Atlantic Ocean in both hemi-
spheres. The maximum mean AOD (532 nm) of 0.27 was
found in the Saharan outflow region (0–15◦ N). The mean
AOD of the marine background aerosol over the ocean was
about 0.05. The AOD was found to be 1.6 times higher at
northern midlatitudes (30–60◦) compared to their southern
counterpart. The extinction coefficient for the vertical col-
umn from 1–5 km (lofted aerosol above the marine boundary
layer) was 2.5 times higher in the Northern Hemisphere.
Lofted layers of Patagonian dust were observed up to 4 km
altitude near the east coast of Argentina. A layer with very
low AOD of 0.02–0.03 showed a dust-related lidar ratio of
42± 17 sr at 532 nm. At the west coast of North Africa pure
Saharan dust (lidar ratio of 50–60 sr at 355 and 532 nm), and
mixed dust/smoke plumes (about 60 sr at 355 nm and 45 sr at
532 nm) were observed (Kanitz et al., 2013a).
The second research vessel used as a platform for Polly is
the German Meteor. A cross section of the Saharan dust layer
was recorded during a latitudinal transect from the Caribbean
to the west coast of Africa (Cape Verde). The optical prop-
erties of aged Saharan dust were determined 4500 km away
from the source region with a transport time of > 10 days
and for fresh dust after 2–3 days close to the Saharan desert.
The aged dust showed a lidar ratio of about 45 sr and a par-
ticle linear depolarization ratio of about 20 % for both wave-
lengths of 355 and 532 nm. For the fresh dust layer, mean
lidar ratios of 64 and 50 sr and particle linear depolarization
ratios of 22 and 26 % at 355 and 532 nm wavelength, respec-
tively, were determined (Kanitz et al., 2014b).
3.4 Long-term measurements at four European sites
within EARLINET
EARLINET is a scientific network of ground-based aerosol
lidars with coordinated measurement times and harmonized
data quality assurance (Pappalardo et al., 2014). Polly sys-
tems fulfill the EARLINET requirements for instrumental
quality assurance and are operated at 4 of the 28 EARLINET
measurement sites (Leipzig, Kuopio, Évora, and Warsaw).
www.atmos-chem-phys.net/16/5111/2016/ Atmos. Chem. Phys., 16, 5111–5137, 2016

5118 H. Baars et al.: PollyNET
0 10 20 30 40Particle depolarization ratio, %
20
40
60
80
100
120
Lida
r rat
io (5
32 n
m),
sr
Amaz
on (a
ged)
North American over Warsaw
DustPolluted dustBBADust+BBAUrbanVolcanic
0 10 20 30 40
0
1
2
3
Å ngs
tröm
exp
onen
t (Ex
tinct
ion)
Amazon (aged)
Iberian Peninsula (winter)
Portuguese (< 2 days)
North American over Portugal
North American over Warsaw
DustPolluted dustBBADust+BBAUrbanVolcanic
20 40 60 80 100 120Lidar ratio (532 nm), sr
0
1
2
3
Ångs
tröm
exp
onen
t (Ex
tinct
ion)
Asian Dust
Amazon (aged)
Iberian Peninsula (winter)
Portug
uese
(< 2
days
)
South Africa
North American over Portugal
North American over Warsaw
DustPolluted dustBBADust+BBAUrbanVolcanic
Saharan dustand African BBAin Amazonia
Saharan dustand African BBAin Amazonia
Saharan dustand African BBAin Amazonia
(a) (b) (c)
Particle depolarization ratio, %
Figure 3. Comparison of intensive properties for different aerosol types as measured within PollyNET based on Table 2. Particle depolariza-
tion ratios are based on measurements at 532 nm if available, otherwise at 355 nm (compare Table 2).
At TROPOS in Leipzig, Germany, continuous observa-
tions with Polly systems have been performed since 2006
and thus the most comprehensive data set within PollyNET
is available for this location. Measurements with the first
Polly system were used to develop an automated algorithm
for PBL-top determination. Maximum PBL-top heights ex-
tended up to 1.4, 1.8, 1.2, and 0.8 km in spring, summer,
autumn, and winter, respectively (Baars et al., 2008). Anal-
ysis of the intensive aerosol properties showed the follow-
ing aerosol types ordered by the frequency of occurrence: ur-
ban/pollution aerosol, Saharan dust and corresponding mix-
tures, aged biomass-burning aerosol, and volcanic ash. The
lidar ratio and depolarization ratio at 355 nm were found
to range from 45–65 sr and 0–7 %, respectively, for urban
pollution, from 30–60 sr and 7–13 % for dusty mixtures,
and from 42–67 sr and 15–23 % for aged biomass-burning
aerosol (Illingworth et al., 2015). Further data at the wave-
lengths of 532 and 1064 nm can be found in the EARLINET
data base (The EARLINET publishing group 2000-2010,
2014).
Polly observations have also been performed by the Uni-
versity of Évora, Portugal since 2011. Clear differences in the
intensive optical properties were found for layers of Asian
and Saharan dust, anthropogenic aerosol from North Amer-
ica and Europe, and biomass-burning smoke from North
America and from the Iberian Peninsula (Preißler et al.,
2013b; Pereira et al., 2014). Three out of four lofted layers
were observed during spring and summer. The mean layer
height varied between 3.8± 1.9 and 2.3± 0.9 km in sum-
mer and winter, respectively. In a statistical analysis evi-
dence for the impact of travel distance on the aerosol opti-
cal properties was found. Aerosol layers of the same type
showed increasing mean Ångström exponents with increas-
ing travel distance (Preißler et al., 2013b). A lofted layer
of Saharan dust was observed with an AOD of up to 1.9
in April 2011 (Preißler et al., 2011). Saharan-dust-specific
extinction-related Ångström exponents were 0.0± 0.2 with
mean lidar ratios of 45± 8 and 53± 7 sr (355, 532 nm), and
a mean particle linear depolarization ratio of 28± 4 % (at
532 nm) was found. Pereira et al. (2014) studied relatively
fresh forest fire smoke observed in lofted aerosol layers.
Particle depolarization ratios of about 5 % were found to-
gether with lidar ratios above 60 sr at altitudes higher than
3 km a.g.l. The single-scattering albedo was retrieved via in-
version and ranged from 0.82 to 0.92 for the six analyzed
layers of forest-fire smoke.
Continuous observations are also available at Kuopio, Fin-
land since 2011 (Hirsikko et al., 2014) and Warsaw, Poland
since 2013. Profiles of backscatter and extinction coefficients
from the regular EARLINET measurement can be found in
the EARLINET data base (access via actris.eu) and are reg-
ularly published (The EARLINET publishing group 2000-
2010, 2014).
3.5 Summarizing discussion
The above-mentioned measurement efforts led to a very valu-
able data set of long-term aerosol lidar observations. To our
knowledge, regular lidar obervations have been performed
for the first time at all the locations listed above except
for the EARLINET site of Leipzig (there, in Leipzig, reg-
ular lidar observations started already in 1999 with the lab-
based EARLINET lidar MARTHA). Therefore, the PollyNET
data set represents the only long-term information of vertical
aerosol profiles on a continuous basis at these sites.
Table 2 gives an overview of the retrieved aerosol-type-
related optical properties for the very different aerosol types
and conditions observed within PollyNET as described above,
while Fig. 3 contrasts the corresponding intensive proper-
ties against each other. Such a data set is a valuable input
for aerosol typing approaches and can be used for, e.g., data
analysis algorithms of the new generation of space-borne li-
dars (Illingworth et al., 2015; Groß et al., 2015).
Atmos. Chem. Phys., 16, 5111–5137, 2016 www.atmos-chem-phys.net/16/5111/2016/

H. Baars et al.: PollyNET 5119
Table 2. Overview of aerosol properties as derived within PollyNET by the end of 2014. LR is the lidar ratio, Åα the extinction-
related Ångström exponent, and δpar the particle linear depolarization ratio at 1= 355 nm, 2
= 532 nm. ± indicates standard deviation.
E14=Eyjafjallajökull, PRD=Pearl River Delta, SDZ=Shangdianzi.
Aerosol type 355 nm-LR [sr] 532 nm-LR [sr] Åα δpar [%] Reference
Dust
Saharan over Portugal 45± 11 53± 7 0.0± 0.2 28± 42 Preißler et al. (2011)
Saharan near Cape Verde 50–60 50–60 0.1± 0.2 – Kanitz et al. (2013a)
Saharan near Cape Verde 52± 2 0.4± 0.4 27± 21 Illingworth et al. (2015)
Saharan over Leipzig 55± 6 50± 5 0.1± 0.4 27± 42 this paper
Asian over Portugal 55± 9 46± 14 2.0± 0.9 – Preißler et al. (2013b)
Patagonian 42± 17 – Kanitz et al. (2013a)
Polluted dust
Saharan over Portugal 52± 20 51± 11 0.4± 1.2 13± 62 Preißler et al. (2013b)
Saharan over Warsaw 55± 20 70± 10 0.5± 0.1 20± 52 Janicka et al. (2015)
Saharan over Leipzig 53± 3 19± 11 Illingworth et al. (2015)
Biomass-burning aerosol (BBA)
Amazon (aged) 62± 12 64± 15 1.2± 0.4 2.5± 11 Baars et al. (2012)
Iberian Peninsula (winter) 51± 17 54± 25 1.4± 0.5 ≤ 52 Preißler et al. (2013a)
Portuguese (< 2 days) 56± 6 56± 6 1.5± 0.2 5± 12 Pereira et al. (2014)
South Africa 89± 20 83± 23 1.8± 0.5 – Giannakaki et al. (2015)
North American over Portugal 58± 17 56± 28 2.2± 0.7 2–6 Preißler et al. (2012)
North American over Leipzig 42± 6 10± 11 Illingworth et al. (2015)
North American over Warsaw 75± 30 95± 25 1.5± 0.2 8± 51 and 8± 52 Janicka et al. (2015)
Saharan dust+African BBA mix
near Cape Verde 64± 8 50± 5 0.1± 0.3 22± 11 and 26± 12 Kanitz et al. (2014b)
West of Africa (8–21◦ N, 23◦W) 61± 4 45± 11 0.7± 0.3 21± 21 Kanitz et al. (2013a)
in the Caribbean 45± 12 45± 7 0.1± 0.4 20± 11 and 20± 12 Kanitz et al. (2014b)
in Amazonia 40–50 60–70 ≈ 0 4–51 Ansmann et al. (2009)
Urban
PRD at Xinken, China 47± 6 – Ansmann et al. (2005)
PRD at Guangzhou, China 48± 11 4± 42 Heese et al. (2015)
Beijing dust influenced 38± 7 – Tesche et al. (2007)
Beijing continental background 25± 5 – Tesche et al. (2007)
SDZ (Beijing plume) 60± 20 – Hänel et al. (2012)
North American over Portugal 46± 23 51± 25 1.2± 1.1 – Preißler et al. (2013b)
European over Portugal 64± 23 76± 33 1.2± 1.0 – Preißler et al. (2013b)
European at Leipzig 57± 4 52± 4 1.4± 0.2 3± 11 Illingworth et al. (2015)
Indian mean 50± 23 42± 24 1.0± 0.8 – Komppula et al. (2012)
Volcanic ash
E14 obs. near. Bremerhaven 55± 10 61± 1 ≈ 1 30–381 Kanitz (2012)
E14 obs. in Évora 39± 10 34± 4 0.7± 0.6 – Sicard et al. (2012)
Seasonal analysis
South Africa Spring 89± 21 82± 25 1.8± 0.9 Giannakaki et al. (2015)
South Africa Summer 57± 20 39± 18 2.4± 0.9 Giannakaki et al. (2015)
South Africa Autumn 59± 22 58± 26 1.8± 0.7 Giannakaki et al. (2015)
South Africa Winter 65± 23 60± 23 1.8± 0.6 Giannakaki et al. (2015)
South Africa Wet 67± 26 69± 32 2.0± 0.8 Giannakaki et al. (2015)
South Africa Dry 67± 24 63± 24 1.8± 0.7 Giannakaki et al. (2015)
India Spring 45± 15 36± 20 1.1± 0.8 Komppula et al. (2012)
India Summer 57± 28 53± 28 0.7± 0.7 Komppula et al. (2012)
India Autumn 77± 33 60± 41 1.3± 1.0 Komppula et al. (2012)
India Winter 46± 19 37± 21 1.4± 0.7 Komppula et al. (2012)
SDZ, China Spring 58± 9 Hänel et al. (2012)
SDZ, China Summer 61± 9 Hänel et al. (2012)
SDZ, China Autumn 59± 9 Hänel et al. (2012)
SDZ, China Winter 68± 11 Hänel et al. (2012)
www.atmos-chem-phys.net/16/5111/2016/ Atmos. Chem. Phys., 16, 5111–5137, 2016

5120 H. Baars et al.: PollyNET
A first collection of intensive properties (lidar ratio at
355 and 532 nm, Ångtröm exponents and particle depolar-
ization ratio) was presented for different aerosol types by
Müller et al. (2007) obtained mainly by ground-based field
campaigns including some of the very first PollyNET mea-
surements in China. Other similar overviews of aerosol-type-
dependent properties are given for case studies in Europe,
the Sahara, and on Cape Verde by Groß et al. (2015) (li-
dar ratio, particle depolarization ratio; ground-based and air-
borne), and for air-borne observations over North America
by Burton et al. (2012, 2013) (lidar ratio, particle depolariza-
tion ratio, color ratio). Intensive aerosol optical properties (li-
dar ratio and Ångström exponents) of different aerosol types
observed within EARLINET in 2009 to be used for future
space missions (Amiridis et al., 2015) where presented by
Schwarz (2016).
The PollyNET findings give an additional valuable contri-
bution to the growing lidar-based aerosol climatology due
to the different measurement locations and the partly larger
sampling times, compared to the unique data sets reported by
Müller et al. (2007), Burton et al. (2012), Groß et al. (2015),
and Schwarz (2016). For example, mineral dust and its mix-
tures could be sampled within PollyNET at very different lo-
cations and thus represent a wide variation of source loca-
tions (Sahara, Patagonia, Asia) and pollution contribution.
For overlapping aerosol types and regions, like Saharan
dust observed far from the source in Europe (Germany and
Poland), findings reported by Müller et al. (2007), Groß
et al. (2015), and Schwarz (2016) were mostly confirmed
as well as the findings from Burton et al. (2012) and Groß
et al. (2015) for dust transported across the Atlantic. But
also extraordinary observations like the characterization of
Patagonian dust with low lidar ratio values of 42± 17 sr
at 532 nm compared to Saharan dust observation (> 50 sr)
could be achieved. These data support findings from Sakai
et al. (2003) (Asian dust) and Burton et al. (2012) (Mexi-
can dust), that mineral dust from different source have dis-
tinguishable different optical properties.
From Fig. 3 it becomes obvious that the particle depo-
larization ratio is an indispensable quantity for the discrim-
ination of dust particle from other aerosol types and their
mixtures. Within EARLINET, the provision of the parti-
cle depolarization ratio to the data base is not yet standard
and thus, available observational data suffer from the lack
of this important quantity. As a consequence, the network-
oriented characterization of different aerosol types based
on lidar ratio and Ångström exponent needs ancillary data
(Schwarz, 2016). However, much progress has been made to
incorporate polarization measurements within EARLINET
(Freudenthaler, 2016; Bravo-Aranda et al., 2016; Belegante
et al., 2016) from which PollyNET has benefited as well so
that this parameter will be available routinely in the near-
future.
Comparing the different unique data sets concerning BBA,
the PollyNET findings confirm subsets of the previous studies.
For example, for North American wildfire smoke observed
over Europe, a wide range of values for the lidar ratio was
observed within PollyNET (42± 6 sr in Leipzig to 75± 30 sr
in Warsaw). These observations are consistent with the wide
range of values reported for the lidar ratio by Müller et al.
(2007) and Groß et al. (2015) for measurements in Europe
and by Burton et al. (2012) for air-borne measurements close
to the source.
A complete new contribution to the emerging global
aerosol data set are the BBA observations in South Africa and
Amazonia within PollyNET. The observed values are quite
different to those mentioned before with moderate lidar ra-
tios (mean values between 60 and 65 sr) for aged Amazonian
smoke and high lidar ratios (mean values between 80 and
90 sr) for smoke observed in South Africa. In South Africa,
lidar ratios up to 110 sr could even be observed delivering
unique data for highly absorbing aerosol which will be fur-
ther investigated. It is obvious that in contrast to other aerosol
types, BBA has a very wide spread of intensive optical
properties. Reasons for that are the different plants burned,
the different soils, the different burning types (flaming and
smoldering), and the different transport processes. This wide
range of values makes the differentiation of BBA from ur-
ban and industrial aerosol rather ambiguous. Burton et al.
(2013) stated that two-wavelengths depolarization measure-
ments might be appropriate for distinguishing those aerosol
types while Müller et al. (2007) proposed to use the lidar ra-
tio detected at two wavelengths. Both proposed features are
already available in the latest Polly generations (Engelmann
et al., 2016) so that future measurements might help for a
better characterization of these important aerosol types.
While the results presented above are a valuable contri-
bution to the global aerosol data set, most of the results are
based on time-consuming manual analysis. To overcome this
constraint in an enlarging network, an automated retrieval for
the determination of aerosol optical properties has been de-
veloped and is presented in the next section.
4 Automated determination of quantitative aerosol
lidar products
Polly systems are designed to operate continuously, i.e., ac-
cumulate up to 2880 raw files per day. Naturally, a robust
automatic data analysis algorithm is necessary to make use
of such an amount of data. Thanks to equal system setup and
data format this could be achieved within PollyNET. The pro-
cessing chain extends from taking the measurement to ob-
taining aerosol optical profiles and contains the following
steps:
– near-real-time transfer of the measurement data to the
data server;
– pre-processing of the data (e.g., background and range
correction);
Atmos. Chem. Phys., 16, 5111–5137, 2016 www.atmos-chem-phys.net/16/5111/2016/

H. Baars et al.: PollyNET 5121
– cloud and fog screening;
– quality assurance;
– search for 30 min periods of suitable conditions for the
retrieval of aerosol optical profiles;
– determination of the reference height range 1zref fol-
lowing the approach presented by Freudenthaler (2009).
After these steps the optical profiles are calculated us-
ing the well-known optical retrieval algorithms similar to
the ones used for the EARLINET Single Calculus Chain
(SCC, D’Amico et al., 2015). The choice between the pre-
ferred Raman method (Ansmann et al., 1992) and the Klett
method (Klett, 1981; Fernald, 1984) is based on the signal-
to-noise ratio (SNR) in the channels detecting the Raman
scattered light (387 and 607 nm). Then, either profiles of
the backscatter and extinction coefficient (Raman method) or
the backscatter coefficient only (Klett method) can be deter-
mined. From the profile of the volume linear depolarization
ratio (EARLINET standards, see Freudenthaler, 2016) and
the backscatter coefficient profile, the particle linear depolar-
ization ratio is calculated. For high quality in the depolariza-
tion measurements, a 190◦-calibration is automatically per-
formed for the TROPOS, FMI, and UW systems three times
a day since 2012 (for system details and overview see Engel-
mann et al., 2016, and Table 1). Before the implementation
of the 190◦-calibration, the calculation of the linear depo-
larization ratio was also possible, but needed manual cali-
bration and processing. Thus, automatically retrieved depo-
larization profiles are only available for systems performing
the190◦-calibration. Finally, the vertical aerosol profiles are
stored and displayed at polly.tropos.de in near-real time with-
out any manual intervention. The complete procedure for the
automatic determination of aerosol optical profiles is illus-
trated in Fig. 4 and explained in more detail in Appendix A.
The online presentation contains also profiles of mid-level
and cirrus clouds, which is important not only for quality as-
surance but also in applications concerning cloud research.
To analyze aerosol optical properties only, which is the fo-
cus of this paper, a post-processing is applied offline on the
retrieved profiles. This is namely a cloud-screening based on
the quantitative optical properties to exclude the aforemen-
tioned mid-level and cirrus clouds. More details are given in
Appendix A.
A measurement example with variable and complex
aerosol and cloud layering from Leipzig in August 2012 is
discussed in the following to show the potential and applica-
bility of the described algorithms.
5 Saharan dust event on 19–20 August 2012, Leipzig,
Germany
In this section, an example for the automated PollyNET data
analysis is discussed. Figure 5 presents the temporal evo-
Pre-processing including cloud screeningand quality assurance
Search for cloud-free periods of ∆t=30 min
Determination of the reference height range ∆90°-Calibration
Klett
Extinction and backscatter coeff.
Backscatter coeff.with fixed lidar ratio
Volume depolarization ratioNo profiles
Particle depolarization ratioLidar ratio Ångström exponents
Not found
Post-processing
Raman
Near-real- time transfer to data server
Figure 4. Schematic description of the steps for the automatic data
analysis. For details see the text and Appendix A.
lution of the range-corrected signal at 532 nm observed in
Leipzig from 19 to 20 August 2012, together with profiles
of the backscatter coefficient determined automatically for
30 min time periods. For the sake of visibility only every sec-
ond profile is shown. At the bottom of Fig. 5, green and blue
lines indicate the choice of the retrieval method, i.e., the Ra-
man method or Klett method (with a lidar ratio of 55 sr as
a good representative for most aerosol types, Müller et al.,
2007), respectively. Time periods without available retrievals
are indicated in red. The algorithm uses the Raman method
for the night-time observations and automatically switches
to the Klett method when the SNR in the Raman channel is
too low during daytime (solar background). In this specific
summer case, Klett backscatter profiles were retrieved from
about 04:00 to 19:00 UTC.
The day of 19 August 2012 started with no clouds and
a clean free troposphere. From about 10:00 UTC a lofted
aerosol layer was observed in the free troposphere between
2 and 5 km a.g.l. Backward trajectory and dust model analy-
sis, as well as EARLINET station alerts, suggested that this
aerosol layer contained Saharan dust. This was confirmed
by the derived aerosol optical properties (see Fig. 6). From
19 to 21 August, more aerosol layers appeared, resulting in
a more complex vertical aerosol distribution. In the morning
of 20 August, Saharan dust was finally observed from near
surface up to 7 km altitude. While the 19 August was com-
pletely cloud-free and a pronounced PBL development was
observed, on 20 August clouds on top of the PBL (around
1.5 km) and above the major aerosol layer (up to 12.5 km)
occurred and can be seen by high backscatter intensity (white
coloring) in Fig. 5. The arrival of a frontal precipitation
system shortly before midnight led to an opaque sky with
fast descending cloud base. The following precipitation (not
www.atmos-chem-phys.net/16/5111/2016/ Atmos. Chem. Phys., 16, 5111–5137, 2016

5122 H. Baars et al.: PollyNET
Hei
ght (
km a
gl)
0 2(Mm-1 sr-1)
19 08 2012
0
100
Sign
al (a
.u.)
20 08 2012Time (UTC)
Figure 5. Temporal development of backscatter intensity in terms of range-corrected signal at 532 nm in Leipzig on 19 and 20 August 2012.
Corresponding automatically derived particle backscatter coefficient profiles at 532 nm are overlaid in black. The color bar at the bottom
shows the retrieval status: green – Raman, blue – Klett, red – no retrieval. A change of neutral-density filters at around 08:15 UTC on
20 August results in a changed backscatter intensity.
shown) on 21 August finally ended the observation of the
Saharan dust event over Leipzig. Note the change of the in-
tensity in signal due to a change in the neutral-density filter
strength on 20 August at around 08:15 UTC.
First, the automatic retrieval focusing on the 532 nm
backscatter coefficient on 19 August is discussed. During this
day, 42 out of 48 possible 30 min profiles of the backscat-
ter coefficient (532 nm) could be determined and thus an
excellent coverage of the aerosol conditions was achieved.
The retrieval of the remaining six profiles (between 05:10–
05:40, 11:10–11:40, 14:50–15:30, and 16:00–17:00 UTC)
failed due to the strict constraints for finding an appropri-
ate reference height (Sect. A5). Most of these cases were re-
jected due to the increased background noise at higher alti-
tudes during the day so that no automatic reference altitude
range could be properly identified. At 355 nm, 44 profiles
could be determined (not shown), while at 1064 nm, 41 pro-
files were derived (not shown). The slightly decreasing num-
ber of profiles is due to the increasing difficulties in calibra-
tion at longer wavelengths due to the smaller contribution of
molecular scattering to the total scattering.
On 20 August 2012, the complex aerosol layering and the
presence of clouds complicated an unambiguous determina-
tion of particle backscatter coefficient profiles. However, the
automatic analysis performed very well for this day. Nei-
ther the neutral-density filter change around 08:15 UTC nor
the occasional occurrence of clouds led to disturbed parti-
cle backscatter coefficient profiles and in total 23 profiles
of the backscatter coefficient at 532 nm could be retrieved
(9 and 13 profiles at 355 and 1064 nm, respectively). The low
number of profiles is mainly due to the strict constraints con-
cerning reference height retrieval in connection with the de-
creased SNR during daytime. Considerably good coverage
was observed from midnight until noon. Later, occasional
clouds above the Saharan dust layer and the high solar el-
evation angle (low SNR) prohibited an automatic determina-
tion of the reference height. With the beginning of the frontal
overpass at around 18:00 UTC on 20 August 2012, aerosol
profiles could only be retrieved occasionally depending on
the presence of low and mid-level clouds during this period.
Note that the threshold values (Appendix A) could be ad-
justed to retrieve a higher number of profiles. However, the
automated algorithm has been strictly designed to produce
reliable profiles for many different and complex atmospheric
conditions. This leads to a decreased coverage for specific
scenarios for which the strict constraints of the retrieval dis-
miss the determination of a reference height.
During the development of the automated retrieval and the
search of best-practice threshold values, the automatically
determined profiles have been compared with manually an-
alyzed profiles for specific time periods. For the presented
observation from 19 to 20 August 2012, the time period of
19 August 19:00–20:00 UTC was selected to show the eval-
uation of the automated retrieval. While the manual stan-
dard EARLINET analysis was performed for the usual 1 h
averaging time, the automated analysis was kept in 30 min
averaging mode. Thus, the two closest profiles around that
EARLINET analysis time period were used in the compar-
ison effort shown in Fig. 6. Error bars for the automatic
retrievals are not presented for clarity of the illustration.
Typically, uncertainties are in the range of 5–10 % for the
backscatter coefficient and 10–20 % for the extinction coef-
ficient retrieved with the Raman method (Althausen et al.,
2009; Baars et al., 2012; Engelmann et al., 2016).
A very good agreement was found for the manually
and automatically derived particle backscatter coefficients
(Fig. 6, top panel). The backscatter coefficient at 532 nm
is nearly identical and only the temporal variation leads to
Atmos. Chem. Phys., 16, 5111–5137, 2016 www.atmos-chem-phys.net/16/5111/2016/

H. Baars et al.: PollyNET 5123
0 0.4 0.8 1.2 1.60
2
4
6
Hei
ght [
km]
TROPOS, Leipzig, Germany, 19082012
Backscatter coeff. [Mm-1 sr-1]
532 10640 0.4 0.8 1.2 1.6
man: 1900-2000auto: 1905-1935auto: 1936-2006
man: 1900-2000auto: 1905-1935auto: 1936-2006
man: 1900-2000auto: 1919-1949auto: 1950-2020
man: 1900-2000auto: 1905-1935auto: 1936-2006
man: 1900-2000auto: 1905-1935auto: 1936-2006
355 532
Volumeman: 1900-2000auto: 1905-1935auto: 1936-2006
Particleman: 1900-2000auto: 1905-1935auto: 1936-2006
355
0 50 100 150Extinction coeff. [Mm ]-1
0 0.1 0.2 0.3 0.4 0.5Depolarization ratio
0 0.4 0.8 1.2 1.6
0 50 100 150Extinction coeff. [Mm ]-1
Figure 6. Comparison of manually (man) and automatically (auto)
derived optical products for 19 August 2012 between 19:00 and
20:20 UTC. Backscatter coefficient at 355, 532, and 1064 nm (top
panels), extinction coefficient at 355 and 532 nm, and linear polar-
ization ratio at 532 nm (bottom panels) is shown. For the sake of
clarity, error bars are only shown for the manual analysis. Errors for
the automatic retrieval are in the same order.
small differences. At 355 nm, the agreement in the Saharan
dust layer is good, while there are differences in the PBL (no
profiles at 355 nm are available below 500 m because of de-
tector problems at 387 nm). These differences are partly re-
lated to high temporal aerosol variability in the PBL, which
is more pronounced at shorter wavelengths for small parti-
cles. At 1064 nm the agreement is reasonably good consid-
ering the well-known difficulties in calibrating the 1064 nm
backscatter coefficient (Heese et al., 2010). The profiles of
the extinction coefficients, which are determined with the
Raman method and thus without the application of a refer-
ence height interval, show a very good agreement consid-
ering only 30 min averaging of the weak Raman channels
(Fig. 6, bottom, left and center panels). No information is
given below 1 km a.g.l. due to the incomplete overlap of the
laser beam and the receiver field of view.
The comparison of the volume and particle depolarization
ratio (Fig. 6, bottom right panel) shows a very good agree-
ment and confirms the robustness of the 190◦-calibration,
which was developed within EARLINET during the last
years (Pappalardo et al., 2014) and leads to significant im-
provements for depolarization measurements.
The example above demonstrates that the developed auto-
matic data analysis algorithm works well even under com-
plex atmospheric conditions. The algorithm has been applied
on the complete data set of PollyNET until end of 2014 and
the results are presented in the following section.
6 Automatically retrieved aerosol profiles from
PollyNET
The complete data set of PollyNET was processed with the
automatic algorithm described in Sect. 4 and Appendix A.
The Polly systems differ in their capabilities and characteris-
tics (Engelmann et al., 2016), e.g., full overlap height, wave-
lengths detected etc. and thus the derived optical quantities
reach from single Raman solutions at 532 nm (like the 1st
generation Polly) to 3+ 2+ 1 and 3+ 2+ 2+ 1+ 1+ 1 data
for the latest generation of Polly systems (see Table 1). As all
Pollys have at least the elastic channel at 532 nm and the cor-
responding Raman channel at 607 nm, the overview is given
in terms of the particle backscatter coefficient at 532 nm to
present the most complete set of vertically resolved aerosol
optical properties covering day and night observed within
PollyNET.
Such knowledge of typical aerosol conditions might be
used, e.g., for the estimation of the typical ice nucleus par-
ticle concentration in the whole troposphere (Mamouri and
Ansmann, 2015) or to represent typical aerosol conditions in
atmospheric models.
6.1 Overview
An overview of all derived 30 min particle backscatter coef-
ficient profiles at each location is given in Fig. 7. Light grey
lines indicate the single profiles and, thus, the variability of
the vertical aerosol distribution at each site. In addition, the
mean (black), the median (blue), the 25- and 75 %-percentile
(purple), and the 5- and 95 %-percentile (red) profiles are
plotted.
The top panel of Fig. 7 shows the results for the four
measurement locations in northern Europe: Åre, Stockholm,
Hyytiälä, and Kuopio, followed by the central European sta-
tions Cabauw, Krauthausen, Leipzig, and Warsaw. The re-
sults of the southern European stations at Évora and Fi-
nokalia and for the shipborne observations aboard Polarstern
and Meteor are given in the center panel. Below, the de-
termined profiles for the Asian sites Delhi, PRD, Beijing,
and Baengnyeong are shown. The last panel presents the de-
rived profiles of the particle backscatter coefficient at the
stations Punta Arenas, Manaus, Stellenbosch, and Elands-
fontein (Southern Hemisphere).
www.atmos-chem-phys.net/16/5111/2016/ Atmos. Chem. Phys., 16, 5111–5137, 2016

5124 H. Baars et al.: PollyNET
Figure 7. Profiles of 532 nm particle backscatter coefficients at the PollyNET measurement sites. Individual 30 min profiles are shown as thin
grey lines. Median (blue), mean (black), 25 and 75 % percentile (purple), and 5 and 95 % percentile (red) profiles are given. The location and
number (N ) of the presented profiles is given in each plot. Details of the specific stations can be found in Table 1.
From Fig. 7 one can see the different climatological
aerosol conditions at the different locations. The highest
aerosol load was determined in China in the height range be-
low 1 km with values of the 75 % (PRD) and 95 % (Beijing)
percentile of 7.8 and 23 Mm−1 sr−1, respectively. In contrast,
the aerosol conditions at Punta Arenas can be regarded as
pristine, marine conditions with backscatter coefficients less
than 1.5 Mm−1 sr−1 in more than 95 % of all observations.
The overview of the European sites shows an increase of the
vertical extent of free-tropospheric aerosol layers from north-
ern to southern Europe, and also from the western to the east-
ern sites.
As expected for northern European stations, the observed
aerosol load was very low (typically less than 2 Mm−1 sr−1
in the PBL). In Stockholm and Hyytiälä, a slightly stronger
particle backscatter was observed on average compared to
the other two sites, probably due to the fact that observa-
tions were only performed in the summer half year. The main
Atmos. Chem. Phys., 16, 5111–5137, 2016 www.atmos-chem-phys.net/16/5111/2016/

H. Baars et al.: PollyNET 5125
aerosol load was usually trapped in the lowermost 1–2 km at
all sites.
Compared to northern Europe, the vertical aerosol profiles
in central Europe were significantly different. At Cabauw,
a coastal but also heavily populated area, almost no aerosol
was observed above 3 km. There, most of the aerosol was
trapped within the marine-influenced PBL, which did not ex-
ceed 1 km in depth during the autumn observations.
As typical for continental sites, a higher aerosol load, a
stronger aerosol variability, and a larger vertical extent of
aerosol was observed at Krauthausen, Leipzig, and Warsaw
compared to the Nordic countries and Cabauw. One has
to mention that only for Leipzig a representative long-term
statistic is available. On average, aerosol seems to prevail
in the lowermost 3 km for all central European sites, while
for Warsaw a slightly higher mean value above 2 km was
observed compared to the other locations. Maximum values
(95 % percentile profile) increase from west to east (left to
right panels in Fig. 7) and confirms the findings reported in
Wandinger et al. (2004).
The profiles recorded at Évora and Finokalia (Fig. 7, cen-
ter panel) show significant aerosol load up to 5 km. The mea-
surements at these sites were performed in the outflow of the
deserts of North Africa. Primarily dust and mixed-dust layers
contributed to the high aerosol load in the free troposphere.
The same is valid for the Meteor cruise (also Fig. 7, cen-
ter panel) which was primarily performed to track the Sa-
haran dust layer over the Atlantic Ocean. The north-south
cross sections made aboard Polarstern were also influenced
by dust when the research vessel passed the West African
coast. For the shipborne observations, a steep increase in par-
ticle backscattering was observed in the transition from the
free troposphere to the boundary layer of about 1 km depth.
This was most probably caused by marine aerosol that is con-
stantly present over the oceans.
At the Asian sites the vertical aerosol extent was compa-
rably high (up to 5 km a.g.l.). There, anthropogenic aerosol
sources contributed significantly to the aerosol load. The
Korean site of Baengnyeong has the lowest aerosol load,
while in PRD, an economically fast growing region, the
strongest mean aerosol backscatter profile was measured.
The most extreme values, however, were observed near Bei-
jing (SDZ, 95 %-percentile profile values of 23 Mm−1 sr−1).
While aerosol was mainly trapped in the lowermost 2 km in
PRD (with a weak haze layer up to 3.5 km), at New Delhi,
India, aerosol scattering was stronger in the lowest 1 km
and was distributed to higher levels with significant aerosol
backscatter up to 4 km height. On average, mean values of
about 1 Mm−1 sr−1 were observed at 3.5 km a.g.l. – more
than on average in the PBL at Punta Arenas.
The measurements on the mainlands of the Southern
Hemisphere show strong contrasts in the vertical backscat-
ter profiles. At Punta Arenas, in the mid-latitudes of South
America, pristine conditions with almost no aerosol in the
free troposphere were observed. The aerosol conditions sig-
nificantly differed near Manaus in Amazonia. Pristine con-
ditions as well as smoke-influenced backscatter profiles
were observed. Interestingly, the extreme profiles (95 %-
percentile) of high aerosol load are less pronounced than in
Leipzig, while the vertical extent was similar. Above 5 km,
no aerosol was observed at this tropical location during the
nearly one-year observation period.
The measurements at the two sites in South Africa, a sub-
tropical region, differ significantly from each other. Stel-
lenbosch, which can be regarded as a coastal site, shows
low backscatter coefficients without extreme values through-
out the year. Aerosol was mainly present in the lowermost
3 km. The lidar observations in Elandsfontein took place
on a plateau at 1745 m a.s.l. near the urban and industrial
area of Johannesburg-Pretoria and were influenced by lo-
cal smoke and pollution. There, aerosol was observed up
to 3.5 km a.g.l., and higher mean and extreme values than
in Stellenbosch were observed. Highest values were found
close to the ground.
6.2 Seasonal analysis
The PollyNET stations have been partly operated on a con-
tinuous long-term basis as in Leipzig, Baengnyeong, Évora,
Stockholm, and Kuopio. The most comprehensive data set
exists for Leipzig with 17 749 determined profiles of the
backscatter coefficient collected within nine years. Such sta-
tions allow for an analysis with respect to different seasons.
The seasonal median and extreme profiles may be of particu-
lar interest, if representative aerosol profiles at specific loca-
tions are needed as a priori input for models or data retrieval
algorithms.
Figure 8 shows the automatically determined 532 nm
backscatter coefficient profiles for spring (March to May:
MAM), summer (June to August: JJA), autumn (Septem-
ber to November: SON), and winter (December to February:
DJF) for the five stations mentioned above. The northern Eu-
ropean sites Kuopio and Stockholm show a similar seasonal
cycle. Aerosol above the PBL was usually observed in sum-
mertime only. Then aerosol was occasionally observed up to
the tropopause. These lofted aerosol layers originated usually
from wild fires in the sub-Arctic hemisphere, namely Alaska,
Canada, and Siberia (e.g., Müller et al., 2005). In wintertime,
aerosol was usually trapped in the PBL, which was often be-
low the detection limit of the lidars of 500 m. Domestic heat-
ing is the major source of particulate pollution during this
part of the year. Spring and autumn were very clean seasons
at both locations, with aerosol below 1 km. As during winter,
almost no lofted aerosol layers were observed during these
seasons.
Leipzig is representative for a moderately polluted, con-
tinental, mid-latitude site. While spring and summer show
almost no differences above 1.8 km a.g.l., it is obvious that
the lowest aerosol load was observed during autumn due to
frequent wash out. In winter, local emissions increased the
www.atmos-chem-phys.net/16/5111/2016/ Atmos. Chem. Phys., 16, 5111–5137, 2016

5126 H. Baars et al.: PollyNET
Figure 8. Profiles of 532 nm particle backscatter coefficients determined for spring (MAM), summer (JJA), autumn (SON), and winter
period (DJF) from PollyNET measurements. The number (N ) of the presented profiles is given in each plot. All profiles are shown by thin
grey lines. Median (blue), mean (black), 25 and 75 % percentile (purple) and 5 and 95 % percentile (red) profiles are given. Details of the
specific station can be found in Table 1.
aerosol load in the lowermost 1.5 km while free-tropospheric
aerosol layers were rare. Advection of Saharan dust and long-
range-transported smoke occurred typically from spring to
early autumn visible by the increased 75 and 95 %-percentile
profile above the PBL of these seasons.
For Évora, representative for southwestern Europe, the
median profiles are very similar for all seasons, which re-
flects a strong marine influence of the Atlantic Ocean. How-
ever, the 75 and 95 %-percentile profile clearly show the
Saharan dust season in Évora, which was strongest during
spring and summer. During this time, aerosol up to 5 km was
detected with high particle backscatter coefficients.
At the Korean site of Baengnyeong Island, a pronounced
seasonal aerosol structure is visible for all backscatter pro-
files. Aerosol above the marine PBL (1 km in depth on aver-
age) was observed relatively often during the Asian dust sea-
son in spring. In summer, frequently lofted aerosol layers up
to 4 km height were observed during the rare measurements
(N = 15). There were two distinct patterns: aerosol within
the PBL and directly above, and a PBL-independent lofted
Atmos. Chem. Phys., 16, 5111–5137, 2016 www.atmos-chem-phys.net/16/5111/2016/

H. Baars et al.: PollyNET 5127
aerosol layer advected between 2 and 4 km. Also evident is
the high relative humidity during the summer months in Ko-
rea, which is revealed by the increasing backscatter coeffi-
cient with height within the PBL (on average below 1.5 km
in depth). Aerosol conditions during autumn were similar to
those in spring, while in wintertime a shallow PBL and oc-
casional lofted aerosol layers up to 3 km were observed.
7 Conclusions
Thanks to continuous efforts in hardware developments and
the resulting instrumental automation, a powerful global
network of Raman-polarization lidar systems could be es-
tablished with PollyNET. Permanent as well as temporary
sites form a network of Polly instruments which range
from single-wavelength Raman lidars (first version) to two-
telescope multiwavelength-Raman-polarization lidars (latest
development). A brief review of milestones illustrates the
potential of such a network with respect to aerosol typing
and the development of a global aerosol climatology. The li-
dar data collected within PollyNET between 2006 and 2014
were used as input to an automated data processing proce-
dure which is described in this paper.
For all 21 measurement locations, more than 55 000 30-
min backscatter profiles, either determined with the Raman
or the Klett method at 532 nm, were retrieved. From that
data set, the vertical aerosol distribution and its quantification
in terms of particle backscatter for the northern European,
central European, southern European, Asian, and Southern
Hemispheric sites as well as for the ship cruises across the
Atlantic Ocean was discussed. The most extreme values were
determined in China in the vertical height range below 1 km
with values of the 75 % (PRD) and 95 % (Beijing) percentile
of 7.8 and 23 Mm−1 sr−1, respectively. In comparison, the
aerosol conditions at Punta Arenas can be regarded as pris-
tine, marine conditions with backscatter coefficients smaller
than 1.5 Mm−1 sr−1 in more than 95 % of all observations.
The strongest vertical extent of aerosol layers was observed
at New Delhi, India, with significant aerosol load up to typi-
cally 4 km. The overview of the European sites shows an in-
crease of the vertical extent of free-tropospheric aerosol from
northern to southern Europe, and also from the western to the
eastern sites. Furthermore, a seasonal analysis has been per-
formed for the long-term sites, which shows the potential of
such a global Raman lidar network in supporting the estab-
lishment of a global aerosol climatology covering the whole
troposphere. All currently analyzed data are shown online at
polly.tropos.de and are available on demand for further use
in agreement with the respective station representatives.
8 Future work
Polly observations with extended near-range capabilities
have been used on a prototype basis to perform closure stud-
ies with ground-based observations of the Spectral Aerosol
Extinction Monitoring System (SAEMS, Skupin et al., 2014)
and unmanned airborne vehicles (UAV, Altstädter et al.,
2015). In the future, such closure studies will be done more
frequently due to the extension of the atmospheric moni-
toring site Melpitz, near Leipzig, Germany, to a new Euro-
pean Supersite for aerosol and cloud observations. The up-
graded site will include a Polly system, a mobile SAEMS,
and the already available ground-based in situ instrumenta-
tion for aerosol characterization. The combination of Polly
with cloud radar measurements showed promising results
(Bühl et al., 2013) and will be further exploited in future
studies.
PollyNET will be expanding over the next years, and
Polly systems of the latest standards are planned for new
permanent sites at the GAW/ACTRIS site of Finokalia
(Crete/Greece), at the GAW observatory of the German Me-
teorological Service at Hohenpeißenberg, and at the new
TROPOS outpost at Mindelo (Cape Verde). Furthermore,
temporary observations in Tajikistan, Cyprus, Israel, and the
Arctic aboard Polarstern are already ongoing or scheduled
for the near future. Thanks to the growing 4-D aerosol clima-
tology and the UV capabilities, PollyNET will significantly
contribute to the ground-truthing studies in support of the
future space-borne lidars onboard ESA’s Aeolus and Earth-
CARE satellites.
Future activities will include the implementation of an
automated layer detection algorithm and additional quality-
control measures designed to enable the automated estima-
tion of aerosol-type-dependent intensive aerosol properties.
Moreover, the potential of the depolarization and spectral ca-
pabilities will be further exploited as well as the new pos-
sibilities which arise from the implementation of near-range
channels in almost all systems. These efforts will be done in
close collaboration with EARLINETs Single Calculus Chain
development (SCC, D’Amico et al., 2015) and will lead to a
further merging of PollyNET with EARLINET and Cloudnet
(Illingworth et al., 2007) in the framework of ACTRIS-2.
www.atmos-chem-phys.net/16/5111/2016/ Atmos. Chem. Phys., 16, 5111–5137, 2016

5128 H. Baars et al.: PollyNET
Appendix A: Ways towards an automated retrieval for
multiwavelength-Raman-polarization lidars
In the following, the automatic retrieval of profiles of the
backscatter and extinction coefficient as well as the depo-
larization ratio is explained. The steps listed below have to
be considered to retrieve automatically optical products from
the lidar measurements:
1. discard inappropriate weather conditions (fog and pre-
cipitation)
2. preprocess signals
– background and range correction
– cloud screening
– temporal averaging
3. determine the reference height range 1zref
– calculate Rayleigh fits (Freudenthaler, 2009) for
several 1zref
– assess the determined 1zref
– find the optimum 1zref
4. calculate profiles of particle backscatter coefficient βaer
by applying 1zref
5. calculate profiles of particle extinction coefficient αaer
by the Raman method and volume and particle linear
depolarization ratio.
An overview of the retrieval steps is given in Fig. A1. The
single steps are explained below.
A1 Discard inappropriate weather conditions
During rain events the roof cover of a Polly closes automat-
ically, the laser is switched off, but the data acquisition is
ongoing; therefore the netcdf data file is continuous. Thus,
such rain events can be easily monitored. In case of fog, the
regular analysis is prohibited due to high atmospheric atten-
uation of the emitted light within a very low height range.
Such measurement periods are identified and flagged, if the
raw lidar signal level is lower than 30 photon counts in total
within the first 300 to 900 m. The corresponding rain or fog
flagged lidar profiles are discarded from further analysis.
A2 Lidar signal preprocessing: raw signal correction
Each acquired raw lidar signal is corrected for background
and range. Because in Polly systems only photon counting
is applied, no dark-current correction has to be made. After-
ward, a overlap correction (Wandinger and Ansmann, 2002)
is applied for specific systems to improve the near-range ca-
pabilities. Polly overlap characteristics do usually not signifi-
cantly change because of the fixed optical setup and the tem-
perature stable housing. Nevertheless, in the worst case the
Input: raw lidar signals at emission wavelength λ Raw signal correction
Cloud screening at high temporal resolution Averaging of cloud-free signals with ∆t=30 min
Discard inappropriate weather conditions
Decide from SNR of Raman channels whether to apply Klett or Raman method
Determination of the reference height range from elastic channels
Input: T and p profiles from GDAS or SA.
Raman Klett
Extinction and backscatter coeff. Backscatter coeff. with fixed lidar ratio = 55 sr
Volume depolarization ratio (systems with ∆90° calibration)
No profiles
Reference height found
Particle depolarization ratio Lidar ratio Ångström exponents
No cloud-free periods
Not found
xxx periods for data analysis
Post-processing
Figure A1. Schematic description of the automatic retrieval in
PollyNET. Details are given in the text. GDAS=Global Data As-
similation System, SA= standard atmosphere.
lowest height bins could be affected due to small tempera-
ture changes and are thus discarded.
A3 Lidar signal preprocessing: cloud screening
Cloud screening is performed based on range- and
background-corrected signals following Baars et al. (2008).
The wavelet covariance transform technique (WCT) detects
heights at which strong signal peaks exceed a defined thresh-
old value. The signal increase at the base of low clouds (liq-
uid water) is typically much stronger than at lofted aerosol
layers. This allows us to identify low-level clouds in the lidar
signal and to flag them in the data quality information. High
clouds, especially cirrus, may not be effectively screened, but
this is not of interest as long as a reference height range can
be found (see Sect. A5). Cirrus can be removed later after the
determination of the optical products (see Sect. A6).
The cloud screening is performed with the raw temporal
resolution of 30 s. In case of insufficient SNR, e.g., due to
very clean air intrusion, the averaging period increases up to
300 s. Below the instrument-characteristic minimum overlap
height (typically 200 m), i.e., the height up to which no over-
lap between the receiver-field-of-view and the laser beam
is achieved, low-level clouds cannot be identified. However,
those measurements would have been already flagged as fog
(see Sect. A1) and are thus not considered anymore.
The data processing steps for cloud screening are summa-
rized in the following:
1. calculation of SNR (Heese et al., 2010);
2. calculation of the normalized WCT (Baars et al., 2008);
3. a cloud base is detected at the height at which
the normalized WCT falls first below a threshold
of −0.1 (355 nm) or −0.3 (532 and 1064 nm, Baars
Atmos. Chem. Phys., 16, 5111–5137, 2016 www.atmos-chem-phys.net/16/5111/2016/

H. Baars et al.: PollyNET 5129
et al., 2008) above 200 m a.g.l. and with SNR> 2. The
SNR threshold is used to avoid mal-detection due to
noise.
After the whole measurement period was analyzed and
screened for clouds, the pre-processing algorithm looks for
as many as possible 30 min intervals that are completely
flagged as cloud-free in the lowermost 9 km.
A4 Lidar signal preprocessing: averaging of cloud-free
signals
The range- and background-corrected lidar signals in the se-
lected 30 min intervals are averaged and serve as input for the
reference height finding procedure. The search for the cloud-
free signals is continuous and not fixed to specific times;
i.e., the 30 min average interval is moved in raw-resolution
steps signal by signal until a clear-sky interval is found. This
has the advantage that the occasional short occurrence of low
clouds, as often observed at marine locations, does not sig-
nificantly disturb the analysis of the whole measurement pe-
riod. The only disadvantage is that the final 30 min backscat-
ter profiles are not in the same time periods for each day. The
30 min averaging is applied to the lidar signals in order to in-
crease the SNR. Lower temporal resolutions are only used, if
the analysis focuses on short-term processes during the day,
e.g., for specific 2-D radiative transfer calculations.
A5 Automatic reference height determination
In the following, a new approach to find automatically the
reference height zref is presented based on the ideas of
Freudenthaler (2009). zref covers usually an interval of up
to 2000 m which is denominated as 1zref. The selection of a
single height bin (7.5–37.5 m) has been avoided considering
the influence of noise on the final backscattering retrieval.
For the search of the best suited reference height interval
1zref, the Rayleigh fit (see A5.1) is performed for as many as
possible height intervals1ztest of width from 500 to 1000 m,
for which the total SNR is greater than the threshold. The
threshold value is wavelength dependent and ranges from 1
to 2. Several tests are performed to obtain the quality of all
1ztest for being an appropriate 1zref. Finally, the 1ztest with
the best quality test results is selected as reference. On the
other hand, if no suitable 1zref can be found, no backscatter
profile is retrieved. The detailed approach to derive the ref-
erence height range 1zref for the Polly systems at 355, 532,
and 1064 nm is described in the following.
A5.1 Rayleigh fit
For the reference height range 1zref, high altitudes are pre-
ferred in order to have aerosol-free conditions at which only
Rayleigh scattering at molecules occurs. The Rayleigh scat-
tering in pure molecular air at the height z and the wave-
length λ can be easily calculated from profiles of tempera-
ture and pressure (Bucholtz, 1995). For the study presented
here, vertical profiles of temperature and pressure from the
GDAS (Global Data Assimilation System, http://ready.arl.
noaa.gov/gdas1.php) are used for that purpose, while for the
near-real-time profiles at the website, usually standard atmo-
sphere (SA) data are applied until GDAS data are available
and the lidar data are reprocessed. As a consequence of pure
Rayleigh scattering in 1zref, the range- and background cor-
rected elastic backscatter signal P(z)z2 in this height range
should be completely proportional to the molecular attenu-
ated backscatter coefficient. This can be tested by a so-called
Rayleigh fit. The Rayleigh fit, i.e., a lidar signal normalized
by the attenuated molecular backscatter coefficient (βattmol) for
the reference height interval 1zref, with a lower and upper
boundary of zref(min) and zref(max), is calculated for a specific
wavelength λ by
P norm(z,λ)z2= P(z,λ)z2
zref(max)∫zref(min)
βattnmol(z
′,λ)dz′
zref(max)∫zref(min)
P(z′,λ)z′2dz′
. (A1)
βattmol is centered at the reference height zref in dependence of
the molecular backscatter and extinction coefficient βmol and
αmol, respectively, according to the general lidar equation for
a pure molecular atmosphere:
βattmol (z,zref,λ)= βmol(z,λ)exp
−2
zref∫z
αmol(z′,λ)dz
. (A2)
For a better understanding, Fig. A2 visualizes profiles of
the Rayleigh fit (i.e., P norm) at 355, 532, and 1064 nm with
1zref between 8 and 10 km altitude. Regions of pure molec-
ular scattering can be identified by the good agreement be-
tween the Rayleigh fit and the observed attenuated molecu-
lar backscatter coefficient. However, as soon as aerosols con-
tribute to the scattering and absorption in the atmosphere, the
two curves deviate significantly from each other (see Fig. A2
below 7 km). This is much more pronounced at 1064 than at
355 nm as Rayleigh scattering is ∝ λ−4. For the analysis of
the 1064 nm channel this has to be considered as it causes
difficulties in the calibration of the backscatter coefficient in
the IR not only for automatic retrievals. After the Rayleigh
fit has been calculated for as many reference height intervals
1ztest as possible, quality tests are applied to assess their va-
lidity.
A5.2 Quality test 1: pure Rayleigh conditions
The test checks, if the particle-caused extinction is lower than
the uncertainty of the measurement (Freudenthaler, 2009).
The ratio of the normalized signal and the attenuated molec-
www.atmos-chem-phys.net/16/5111/2016/ Atmos. Chem. Phys., 16, 5111–5137, 2016

5130 H. Baars et al.: PollyNET
00.0 0.5 1.0 1.5
00 5 10
0
5
10
15
0 20 40 60
Rang
e [k
m]
Atten. mol. bsc. coeff. Normalized signal
355 nm 1064 nm532 nm
0
5
10
15
0.0 20Backscatter coeff. [Mm-1 sr-1]
Rang
e [km
]
00.0 0.5 1.0 1.5 2.0
00.0 0.05 0.1
355 nm 1064 nm532 nm
10Backscatter coeff. [Mm-1 sr-1] Backscatter coeff. [Mm-1 sr-1]
Backscatter coeff. [Mm-1 sr-1] Backscatter coeff. [Mm-1 sr-1] Backscatter coeff. [Mm-1 sr-1]
Figure A2. Rayleigh fit (normalized lidar signal) calibrated be-
tween 8 and 10 km and profiles of the attenuated molecular
backscatter coefficient at 355 nm (left panels), 532 nm (center pan-
els), and 1064 nm (right panels). x axis zoomed in for lower panels.
ular backscatter coefficient is calculated by
P norm
βattmol
≈
(βaer+βmol)exp
(−2
z∫0
(αaer+αmol)dz
)
βmol exp
(−2
z∫0
αmoldz
)
= BSRexp
−2
z∫0
(αaer)dz
, (A3)
with the backscatter ratio
BSR=βaer+βmol
βmol
. (A4)
If 1ztest is characterized by pure Rayleigh conditions, BSR
becomes unity and Eq. (A3) can be simplified to
lnP norm
βattmol
≈−2
z∫0
(αaer)dz (A5)
and thus
d
dz
(lnP norm
βattmol
)≈−2αaer. (A6)
Finally, the particle extinction coefficient can be derived by
obtaining the deviation in Eq. (A6) with a least-square fit.
The smaller αaer, the better the estimation of pure Rayleigh
conditions as βaer�βmol is assumed. If the uncertainty
1αaer is higher than αaer itself, 1ztest is considered to be
of pure Rayleigh conditions and confirmed to be a potential
1zref.
-0.5 -0.25 0 0.25 0.50
5
10
15
-2 -1 0 1 2
Rang
e [k
m]
-0.04 -0.02 0 0.02 0.04Residual [Mm-1 sr-1]
355 nm 1064 nm532 nm
Residual [Mm-1 sr-1]Residual [Mm-1 sr-1]
Figure A3. Residual of the Rayleigh fit shown in Fig. A2 for 355 nm
(left panels), 532 nm (center panels), and 1064 nm (right panels).
A5.3 Quality test 2: near- and far-range cross criteria
As also discussed by Freudenthaler (2009), if the lidar sig-
nal is normalized in a pure molecular atmosphere (Rayleigh
conditions), the corresponding normalized signal should be
equal or higher than the molecular signal, but not lower, at
all heights. If the latter happens, the residual defined as
Residual= P norm(z)z2−βatt
mol (z,zref) , (A7)
is negative and the conditions in1ztest have not been aerosol
free. In this case, 1ztest is inappropriate and discarded. Due
to the nature of noise in the lidar signals, technically the test
is performed for profile sections of 500 m width. For each
of these profile sections the mean of P norm plus its standard
deviation must be larger than the mean of βattmol minus its stan-
dard deviation to pass the test. Of course, this criterion is not
valid in the height range of incomplete overlap, which has to
be excluded from the test. This test has proven to be a pow-
erful tool to detect signal distortions in 1ztest.
It can be concluded, the closer βattmol(z, zref) and
P norm(z)z2, the better the agreement, the lower the residu-
als, and the higher the quality of the test interval with re-
spect to pure Rayleigh conditions. For illustration, the corre-
sponding residuals for the examples in Fig. A2 are given in
Fig. A3. The residuals are about zero in 1zref and are pos-
itive when deviating significantly from the molecular atten-
uated backscatter coefficient profile. Thus, for this example
the test is successful and 1ztest accepted for further testing.
A5.4 Quality test 3: white-noise criterion
Lidar signals are influenced by different noise sources.
The normalized real lidar signal will consequently deviate
from the ideal no-noise lidar signal within 1ztest. For pure
Rayleigh conditions the deviation should be limited to white
noise. Otherwise, signal distortions or particle contributions
cannot be excluded. The normalized lidar signal is checked
for only white noise with the Durbin–Watson test (e.g., Back-
Atmos. Chem. Phys., 16, 5111–5137, 2016 www.atmos-chem-phys.net/16/5111/2016/

H. Baars et al.: PollyNET 5131
haus, 1990):
d =
N∑n=2
(1n−1n−1)2
N∑n=1
(1n)2
≈ 2 with 1= y− y∗ (A8)
and
y = P norm(z)z2−βatt
mol (z,zref)= Residual. (A9)
y∗ is the linear regression of y. No autocorrelation, i.e., per-
fect white noise, is given for d = 2. For d = 0 and d = 4 cor-
relation and anticorrelation, respectively, is given. As a good
compromise between perfect white noise and a little autocor-
relation, which is existent in every data series, the success
criterion for this test has been defined to 1<d < 3.
A5.5 Quality test 4: SNR check
The last prerequisite is a SNR≥ 5 over the whole test range
1ztest of discrete bin range 1iref (e.g., 33 bins for 1000 m
with 30 m vertical raw resolution) with the upper and lower
boundary ztest(max) and ztest(min), respectively:
SNRtest =
ztest(max)∑ztest(min)
N −1irefNb√ztest(max)∑ztest(min)
N +Nb
≥ 5, (A10)
with N the raw photon counts and Nb the mean background
noise.
A5.6 Selection of optimum reference height
From all successfully tested 1ztest, the optimum one has to
be selected for being 1zref. For that purpose, the residuals
(Eq. A7) are investigated by means of simple statistical tests
and a weighting function X is defined to find the minimum
deviation from the ideal 1ztest:
X(1ztest)=|µ(1ztest)|σ (1ztest) |g (1ztest)|
msre(1ztest)A∗ (1ztest) , (A11)
with the absolute mean value µ, the standard deviation σ ,
the slope g, the mean square root error msre from a linear
regression, and the Anderson–Darling test coefficient A∗ of
the Residual.
The lower |µ|, σ , |g|, and msre, the better is the desired
condition. The Anderson–Darling test checks for normal dis-
tribution of the residual values leading to a coefficient A∗.
The lower the coefficient A∗, the better is the hypothesis
of normal distribution. If a certain value is exceeded, the
residual values are not normally distributed (Freudenthaler,
2009). As for the ideal 1ztest, X would be 0, the refer-
ence height interval 1zref is finally chosen for that 1ztest for
which the weighting function becomes minimal. Depending
on the SNR in the inelastic channel, either the Raman (Ans-
mann et al., 1992) or Klett–Fernald method (Fernald, 1984)
is applied, and thus either particle backscatter and extinction
coefficients or particle backscatter coefficient only are cal-
culated. Afterward, the particle depolarization ratio is cal-
culated from the particle backscatter coefficient profile and
from the volume depolarization profile, which is directly ob-
tained from the measurements by applying the190◦-method
(Freudenthaler et al., 2009).
A6 Postprocessing for aerosol properties
The postprocessing acts as the final quality check for the re-
trieved profiles of the particle backscatter and extinction co-
efficients. This is of importance as one wants to create an
aerosol climatology and thus needs to exclude profile frag-
ments that are contaminated by light fog or cirrus clouds. It is
worth noting that these profiles have passed all preprocessing
tests and thus are valid. However, they have to be excluded
within the presented study of this paper as the focus is on
aerosols only. The procedure for that is briefly described in
the following:
1. The retrieved profile is excluded from the statistics, if
the particle backscatter coefficient (532 nm) is higher
than 50 Mm−1 sr−1 below 300 m altitude which indi-
cates fog.
2. Cirrus and other clouds are identified by applying the
WCT (Sect. A3 and Baars et al., 2008) on the pro-
file of the backscatter coefficient (dilation of 240 m).
The cloud base is detected at the height at which
WCT<−5× 10⁻¹ Mm−1 sr−1, and as a consequence
only the backscatter profile up to 120 m (half dilation)
below the cloud base is used for the aerosol climatology
to avoid the influence of precipitating ice crystals (see
Bühl et al., 2013) in the particle profile below the cloud.
3. In addition, if the Klett method is applied, the profile of
the backscatter coefficient is set as invalid in the low-
ermost range of the incomplete overlap (from 700 to
1500 m depending on the Polly type).
After these steps, the remaining profiles are considered to be
valid and used for the creation of the aerosol statistics.
www.atmos-chem-phys.net/16/5111/2016/ Atmos. Chem. Phys., 16, 5111–5137, 2016

5132 H. Baars et al.: PollyNET
Acknowledgements. First of all, we want to thank the TROPOS
workshops and staff members for their permanent effort. The idea
of Polly has been always supported by the directors of TROPOS
Jost Heintzenberg and Andreas Macke. The authors acknowledge
support through the following projects and research programs:
– EUCAARI funded by the European Union (FP6, grant
no. 036 833-2)
– ACTRIS under grant agreement no. 262 254 of the European
Union Seventh Framework Programme (FP7/2007-2013)
– ACTRIS-2 under grant agreement no. 654109 from the Eu-
ropean Union’s Horizon 2020 research and innovation pro-
gramme
– the China National Basic Research and Development Program
(2002CB410801 and 2002CB211605 and 2014CB441201)
– “High Definition Clouds and Precipitation for Climate Pre-
diction – HD(CP)2” (FKZ: 01LK1209C and 01LK1212C)
funded by Federal Ministry of Education and Research in Ger-
many (BMBF)
– “Megacities-Megachallenge – Informal Dynamics of Global
Change” (SPP 1233) funded by the German Research Foun-
dation (DFG)
– FCT (fundação para a Ciência e a tecnologia) under the
grant SFRH/BPD/81132/2011 and in the framework of
the project FCOMP-01-0124-FEDER-029212 (PDTC/CEO-
MET/4222/2012)
– ICT project (UID/GEO/04683/2013) with reference POCI-01-
0145-FEDER-007690 in the frame of the COMPETE 2020
(Operational Program Competitiveness and Internationaliza-
tion) European Regional Development Fund.
– the Gottfried Wilhelm Leibniz Association (OCEANET
project in the framework of PAKT)
– BEYOND (funded under: FP7-REGPOT-2012-2013-1) under
grant agreement no. 316 210
– National Science Centre, Poland (NCN) Project SONATA-BIS
no. 2012/05/E/ST10/01578
– Foundation of science and technology of Poland (FNITP)
Grant no. 519/FNITP/115/2010
– Polarstern expeditions AWI_PS75_00, AWI_PS77_00,
AWI_PS81_00, AWI_PS83_00
– FAPESP and CNPq.
We also thank the LBA Central Office at INPA (The Brazilian
National Institute for Amazonian Research) for support. Many
improvements, both, in terms of hard and software were trig-
gered by the fruitful discussions and network activities within
EARLINET. Last but not least, we appreciate the contribu-
tions of the individuals that have been involved in supporting,
enabling, and maintaining Polly measurements over the last decade.
Edited by: E. Gerasopoulos
References
Althausen, D., Engelmann, R., Baars, H., Heese, B., Ansmann, A.,
Müller, D., and Komppula, M.: Portable Raman Lidar Pol-
lyXT for automated profiling of aerosol backscatter, extinction,
and depolarization, J. Atmos. Ocean. Tech., 26, 2366–2378,
doi:10.1175/2009JTECHA1304.1, 2009.
Althausen, D., Engelmann, R., Baars, H., Heese, B., Kanitz, T.,
Komppula, M., Giannakaki, E., Pfüller, A., Silva, A. M.,
Preißler, J., Wagner, F., Rascado, J. L., Pereira, S., Lim, J.-H.,
Ahn, J. Y., Tesche, M., and Stachlewska, I. S.: PollyNET: a net-
work of multiwavelength polarization Raman lidars, Proc. SPIE,
8894, 88940I–88940I-10, doi:10.1117/12.2028921, 2013.
Altstädter, B., Platis, A., Wehner, B., Scholtz, A., Wildmann, N.,
Hermann, M., Käthner, R., Baars, H., Bange, J., and Lampert,
A.: ALADINA – an unmanned research aircraft for observing
vertical and horizontal distributions of ultrafine particles within
the atmospheric boundary layer, Atmos. Meas. Tech., 8, 1627–
1639, doi:10.5194/amt-8-1627-2015, 2015.
Amiridis, V., Marinou, E., Tsekeri, A., Wandinger, U., Schwarz, A.,
Giannakaki, E., Mamouri, R., Kokkalis, P., Binietoglou, I., Solo-
mos, S., Herekakis, T., Kazadzis, S., Gerasopoulos, E., Proes-
takis, E., Kottas, M., Balis, D., Papayannis, A., Kontoes, C.,
Kourtidis, K., Papagiannopoulos, N., Mona, L., Pappalardo, G.,
Le Rille, O., and Ansmann, A.: LIVAS: a 3-D multi-wavelength
aerosol/cloud database based on CALIPSO and EARLINET, At-
mos. Chem. Phys., 15, 7127–7153, doi:10.5194/acp-15-7127-
2015, 2015.
Ansmann, A. and Müller, D.: Lidar and atmospheric aerosol par-
ticles, in: Lidar – Range-Resolved Optical Remote Sensing of
the Atmosphere, vol. 102 of Springer Series in Optical Sciences,
edited by: Weitkamp, C., Springer, Berlin, Heidelberg, 105–141,
2005.
Ansmann, A., Wandinger, U., Riebesell, M., Weitkamp, C., and
Michaelis, W.: Independent measurement of extinction and
backscatter profiles in cirrus clouds by using a combined Ra-
man elastic-backscatter lidar, Appl. Optics, 31, 7113–7131,
doi:10.1364/AO.31.007113, 1992.
Ansmann, A., Engelmann, R., Althausen, D., Wandinger, U.,
Hu, M., Zhang, Y., and He, Q.: High aerosol load over
the Pearl River Delta, China, observed with Raman li-
dar and Sun photometer, Geophys. Res. Lett., 32, L13815,
doi:10.1029/2005GL023094, 2005.
Ansmann, A., Baars, H., Tesche, M., Müller, D., Althausen, D., En-
gelmann, R., Pauliquevis, T., and Artaxo, P.: Dust and smoke
transport from Africa to South America: lidar profiling over
Cape Verde and the Amazon rainforest, Geophys. Res. Lett., 36,
L11802, doi:10.1029/2009GL037923, 2009.
Ansmann, A., Seifert, P., Tesche, M., and Wandinger, U.: Profiling
of fine and coarse particle mass: case studies of Saharan dust
and Eyjafjallajökull/Grimsvötn volcanic plumes, Atmos. Chem.
Phys., 12, 9399–9415, doi:10.5194/acp-12-9399-2012, 2012.
Antuña, J. C., Landulfo, E., Clemesha, B., Zaratti, F., Quel, E.,
Bastidas, A., Estevan, R., and Barja, B.: Lidar community in
Latin America: a decade of challenges and successes, in: Re-
viewed and Revised Papers of the 26th International Laser Radar
Conference, 25–29 June 2012, Porto Heli, Peloponnesus, Greece,
25–29, 2012.
Baars, H., Ansmann, A., Engelmann, R., and Althausen, D.: Con-
tinuous monitoring of the boundary-layer top with lidar, At-
Atmos. Chem. Phys., 16, 5111–5137, 2016 www.atmos-chem-phys.net/16/5111/2016/

H. Baars et al.: PollyNET 5133
mos. Chem. Phys., 8, 7281–7296, doi:10.5194/acp-8-7281-2008,
2008.
Baars, H., Ansmann, A., Althausen, D., Engelmann, R., Artaxo, P.,
Pauliquevis, T., and Souza, R.: Further evidence for significant
smoke transport from Africa to Amazonia, Geophys. Res. Lett.,
38, L20802, doi:10.1029/2011GL049200, 2011.
Baars, H., Ansmann, A., Althausen, D., Engelmann, R., Heese, B.,
Müller, D., Artaxo, P., Paixao, M., Pauliquevis, T., and Souza, R.:
Aerosol profiling with lidar in the Amazon Basin during the
wet and dry season, J. Geophys. Res.-Atmos., 117, D21201,
doi:10.1029/2012JD018338, 2012.
Backhaus, K.: Multivariate Analysemethoden: Eine anwendung-
sorientierte Einführung, mit 137 Tabellen, 6th Edn., Springer,
Berlin, 37–39, 1990.
Barbosa, H. M. J., Lopes, F. J. S., Silva, A., Nisperuza, D., Barja,
B., Ristori, P., Gouveia, D. A., Jimenez, C., Montilla, E., Mar-
iano, G. L., Landulfo, E., Bastidas, A., and Quel, E. J.: The
first ALINE measurements and intercomparison exercise on li-
dar inversion algorithms, Optica pura y aplicada, 47, 99–108,
doi:10.7149/OPA.47.2.109, 2014.
Belegante, L., Bravo-Aranda, J. A., Freudenthaler, V., Nicolae, D.,
Nemuc, A., Alados-Arboledas, L., Amodeo, A., Pappalardo, G.,
D’Amico, G., Engelmann, R., Baars, H., Wandinger, U., Pa-
payannis, A., Kokkalis, P., and Pereira, S. N.: Experimental as-
sessment of the lidar polarizing sensitivity, Atmos. Meas. Tech.
Discuss., doi:10.5194/amt-2015-337, in review, 2016.
Binietoglou, I., Basart, S., Alados-Arboledas, L., Amiridis, V., Ar-
gyrouli, A., Baars, H., Baldasano, J. M., Balis, D., Belegante,
L., Bravo-Aranda, J. A., Burlizzi, P., Carrasco, V., Chaikovsky,
A., Comerón, A., D’Amico, G., Filioglou, M., Granados-Muñoz,
M. J., Guerrero-Rascado, J. L., Ilic, L., Kokkalis, P., Maurizi,
A., Mona, L., Monti, F., Muñoz Porcar, C., Nicolae, D., Pa-
payannis, A., Pappalardo, G., Pejanovic, G., Pereira, S. N., Per-
rone, M. R., Pietruczuk, A., Posyniak, M., Rocadenbosch, F.,
Rodríguez-Gómez, A., Sicard, M., Siomos, N., Szkop, A., Ter-
radellas, E., Tsekeri, A., Vukovic, A., Wandinger, U., and Wag-
ner, J.: A methodology for investigating dust model performance
using synergistic EARLINET/AERONET dust concentration re-
trievals, Atmos. Meas. Tech., 8, 3577–3600, doi:10.5194/amt-8-
3577-2015, 2015.
Böckmann, C., Wandinger, U., Ansmann, A., Bösenberg, J.,
Amiridis, V., Boselli, A., Delaval, A., De Tomasi, F., Frioud, M.,
Grigorov, I. V., Hågård, A., Horvat, M., Iarlori, M., Komguem,
L., Kreipl, S., Larchevêque, G., Matthias, V., Papayannis, A.,
Pappalardo, G., Rocadenbosch, F., Rodrigues, J. A., Schneider,
J., Shcherbakov, V., and Wiegner, M.: Aerosol lidar intercom-
parison in the framework of the EARLINET project. 2. Aerosol
backscatter algorithms, Appl. Optics, 43, 977–989, 2004.
Bösenberg, J., Hoff, R., Ansmann, A., Müller, D., Antuña, J.,
Whiteman, D., Sugimoto, N., Apituley, A., Hardesty, M., Wel-
ton, J., Eloranta, E., Arshinov, Y., Kinne, S., and Freudenthaler,
V.: Plan for the Implementation of the GAW Aerosol Lidar Ob-
servation Network (GALION), WMO/TD 178, WMO, Hamburg,
Germany, 2007.
Bravo-Aranda, J. A., Belegante, L., Freudenthaler, V., Alados-
Arboledas, A., Nicolae, D., Granados-Muñoz, M. J., Guerrero-
Rascado, J. L., Amodeo, A., D’Amico, G., Engelmann, R., Pap-
palardo, G., Kokkalis, P., Mamouri, R., Papayannis, A., Navas-
Guzmán, F., Olmo, F. J., Wandinger, U., and Haeffelin, M.:
Assessment of lidar depolarization uncertainty by means of
a polarimetric lidar simulator, Atmos. Meas. Tech. Discuss.,
doi:10.5194/amt-2015-339, in review, 2016.
Bucholtz, A.: Rayleigh-scattering calculations for the terrestrial at-
mosphere, Appl. Optics, 34, 2765–2773, 1995.
Bühl, J., Ansmann, A., Seifert, P., Baars, H., and Engelmann, R.:
Toward a quantitative characterization of heterogeneous ice for-
mation with lidar/radar: comparison of CALIPSO/CloudSat with
ground-based observations, Geophys. Res. Lett., 40, 4404–4408,
doi:10.1002/grl.50792, 2013.
Burton, S. P., Ferrare, R. A., Hostetler, C. A., Hair, J. W., Rogers, R.
R., Obland, M. D., Butler, C. F., Cook, A. L., Harper, D. B., and
Froyd, K. D.: Aerosol classification using airborne High Spec-
tral Resolution Lidar measurements – methodology and exam-
ples, Atmos. Meas. Tech., 5, 73–98, doi:10.5194/amt-5-73-2012,
2012.
Burton, S. P., Ferrare, R. A., Vaughan, M. A., Omar, A. H.,
Rogers, R. R., Hostetler, C. A., and Hair, J. W.: Aerosol
classification from airborne HSRL and comparisons with the
CALIPSO vertical feature mask, Atmos. Meas. Tech., 6, 1397–
1412, doi:10.5194/amt-6-1397-2013, 2013.
Chaikovsky, A., Ivanov, A., Balin, Y., Elnikov, A., Tulinov, G.,
Plusnin, I., Bukin, O., and Chen, B.: Lidar network CIS-LiNet
for monitoring aerosol and ozone in CIS regions, in: Twelfth
Joint International Symposium on Atmospheric and Ocean Op-
tics/Atmospheric Physics, International Society for Optics and
Photonics, Proc. SPIE, 6160, 616035, doi:10.1117/12.675920,
2006.
D’Amico, G., Amodeo, A., Baars, H., Binietoglou, I., Freuden-
thaler, V., Mattis, I., Wandinger, U., and Pappalardo, G.:
EARLINET Single Calculus Chain – overview on method-
ology and strategy, Atmos. Meas. Tech., 8, 4891–4916,
doi:10.5194/amt-8-4891-2015, 2015.
Engelmann, R., Kanitz, T., Baars, H., Heese, B., Althausen, D.,
Skupin, A., Wandinger, U., Komppula, M., Stachlewska, I. S.,
Amiridis, V., Marinou, E., Mattis, I., Linné, H., and Ansmann,
A.: The automated multiwavelength Raman polarization and
water-vapor lidar PollyXT: the neXT generation, Atmos. Meas.
Tech., 9, 1767–1784, doi:10.5194/amt-9-1767-2016, 2016.
Fernald, F. G.: Analysis of atmospheric lidar observations – some
comments, Appl. Optics, 23, 652–653, 1984.
Flentje, H., Heese, B., Reichardt, J., and Thomas, W.: Aerosol
profiling using the ceilometer network of the German Meteo-
rological Service, Atmos. Meas. Tech. Discuss., 3, 3643–3673,
doi:10.5194/amtd-3-3643-2010, 2010.
Foth, A., Baars, H., Di Girolamo, P., and Pospichal, B.: Water
vapour profiles from Raman lidar automatically calibrated by mi-
crowave radiometer data during HOPE, Atmos. Chem. Phys., 15,
7753–7763, doi:10.5194/acp-15-7753-2015, 2015.
Freudenthaler, V.: The telecover test: A quality assurance tool for
the optical part of a lidar system, in: 24th International Laser
Radar Conference, http://nbn-resolving.de/urn/resolver.pl?urn=
nbn:de:bvb:19-epub-12958-1 (last access: 11 February 2015),
2008.
Freudenthaler, V.: Lidar Rayleigh-fit criteria, in: EARLINET-
ASOS 7th Workshop, available at: http://nbn-resolving.de/
urn/resolver.pl?urn=nbn:de:bvb:19-epub-12970-6 (last access:
11 February 2015), 2009.
www.atmos-chem-phys.net/16/5111/2016/ Atmos. Chem. Phys., 16, 5111–5137, 2016

5134 H. Baars et al.: PollyNET
Freudenthaler, V.: About the effects of polarising optics on lidar
signals and the 190-calibration, Atmos. Meas. Tech. Discuss.,
doi:10.5194/amt-2015-338, in review, 2016.
Freudenthaler, V., Esselborn, M., Wiegner, M., Heese, B.,
Tesche, M., Ansmann, A., Müller, D., Althausen, D., Wirth, M.,
Fix, A., Ehret, G., Knippertz, P., Toledano, C., Gasteiger, J.,
Garhammer, M., and Seefeldner, M.: Depolarization ratio pro-
filing at several wavelengths in pure Saharan dust during
SAMUM 2006, Tellus B, 61, 165–179, doi:10.1111/j.1600-
0889.2008.00396.x, 2009.
Giannakaki, E., Pfüller, A., Korhonen, K., Mielonen, T., Laakso, L.,
Vakkari, V., Baars, H., Engelmann, R., Beukes, J. P., Van Zyl, P.
G., Josipovic, M., Tiitta, P., Chiloane, K., Piketh, S., Lihavainen,
H., Lehtinen, K. E. J., and Komppula, M.: One year of Raman
lidar observations of free-tropospheric aerosol layers over South
Africa, Atmos. Chem. Phys., 15, 5429–5442, doi:10.5194/acp-
15-5429-2015, 2015.
Groß, S., Freudenthaler, V., Wirth, M., and Weinzierl, B.: Towards
an aerosol classification scheme for future EarthCARE lidar ob-
servations and implications for research needs, Atmos. Sci. Lett.,
16, 77–82, doi:10.1002/asl2.524, 2015.
Hänel, A., Baars, H., Althausen, D., Ansmann, A., Engelmann, R.,
and Sun, J. Y.: One-year aerosol profiling with EUCAARI Ra-
man lidar at Shangdianzi GAW station: Beijing plume and
seasonal variations, J. Geophys. Res.-Atmos, 117, D13201,
doi:10.1029/2012JD017577, 2012.
Haustein, K., Pérez, C., Baldasano, J. M., Müller, D., Tesche, M.,
Schladitz, A., Esselborn, M., Weinzierl, B., Kandler, K., and
von Hoyningen-Huene, W.: Regional dust model performance
during SAMUM 2006, Geophys. Res. Lett., 36, L03812,
doi:10.1029/2008GL036463, 2009.
Heese, B., Flentje, H., Althausen, D., Ansmann, A., and Frey,
S.: Ceilometer lidar comparison: backscatter coefficient retrieval
and signal-to-noise ratio determination, Atmos. Meas. Tech., 3,
1763–1770, doi:10.5194/amt-3-1763-2010, 2010.
Heese, B., Althausen, D., Bauditz, M., Bao, R., Deng, R., and Li, Z.:
Lidar depolarization and sun photometer polarization measure-
ments for particle characterization over Guangzhou, China, in:
Reviewed and Revised Papers of the 26th International Laser
Radar Conference, 25–29 June 2012, Porto Heli, Peloponnesus,
Greece, 505–509, 2012.
Heese, B., Althausen, D., Baars, H., Bohlmann, S., and Deng, R.:
Aerosol properties over Southeastern China from multiwave-
length Raman and depolarization lidar measurements, 27th ILRC
International Laser Radar Conference, New York, USA, 5–
10 July, 2015.
Hirsikko, A., O’Connor, E. J., Komppula, M., Korhonen, K.,
Pfüller, A., Giannakaki, E., Wood, C. R., Bauer-Pfundstein, M.,
Poikonen, A., Karppinen, T., Lonka, H., Kurri, M., Heinonen,
J., Moisseev, D., Asmi, E., Aaltonen, V., Nordbo, A., Rodriguez,
E., Lihavainen, H., Laaksonen, A., Lehtinen, K. E. J., Laurila,
T., Petäjä, T., Kulmala, M., and Viisanen, Y.: Observing wind,
aerosol particles, cloud and precipitation: Finland’s new ground-
based remote-sensing network, Atmos. Meas. Tech., 7, 1351–
1375, doi:10.5194/amt-7-1351-2014, 2014.
Hoff, R. M. and Pappalardo, G.: The GAW Aerosol Lidar Observa-
tion Network (GALION) as a source of near-real time aerosol
profile data for model evaluation and assimilation, AGU Fall
Meeting Abstracts, San Francisco, p. G8, 2010.
Holben, B. N., Tanré, D., Smirnov, A., Eck, T. F., Slutsker, I.,
Abuhassan, N., Newcomb, W. W., Schafer, J. S., Chatenet, B.,
Lavenu, F., Kaufman, Y. J., Castle, J. V., Setzer, A., Markham, B.,
Clark, D., Frouin, R., Halthore, R., Karneli, A., O’Neill, N. T.,
Pietras, C., Pinker, R. T., Voss, K., and Zibordi, G.: An
emerging ground-based aerosol climatology: aerosol optical
depth from AERONET, J. Geophys. Res., 106, 12067–12098,
doi:10.1029/2001JD900014, 2001.
Illingworth, A. J., Hogan, R. J., O’Connor, E. J., Bouniol, D.,
Brooks, M. E., Delanoe, J., Donovan, D. P., Eastment, J. D.,
Gaussiat, N., Goddard, J. W. F., Haeffelin, M., Klein Baltink,
H., Krasnov, O. A., Pelon, J., Piriou, J.-M., Protat, A., Russchen-
berg, H. W. J., Seifert, A., Tompkins, A. M., van Zadelhoff, G.-J.,
Vinit, F., Willen, U., Wilson, D. R., and Wrench, C. L.: Cloud-
net – continuous evaluation of cloud profiles in seven operational
models using ground-based observations, B. Am. Meteor. Soc.,
88, 883–898, 2007.
Illingworth, A. J., Barker, H. W., Beljaars, A., Ceccaldi, M., Chep-
fer, H., Clerbaux, N., Cole, J., Delanoë, J., Domenech, C., Dono-
van, D. P., Fukuda, S., Hirakata, M., Hogan, R. J., Huener-
bein, A., Kollias, P., Kubota, T., Nakajima, T., Nakajima, T.
Y., Nishizawa, T., Ohno, Y., Okamoto, H., Oki, R., Sato, K.,
Satoh, M., Shephard, M., Velázquez-Blázquez, A., Wandinger,
U., Wehr, T., van Zadelhoff, G.-J.: The EarthCARE Satellite: The
next step forward in global measurements of clouds, aerosols,
precipitation and radiation, B. Am. Meteorol. Soc., 96, 1311–
1332, doi:10.1175/BAMS-D-12-00227.1, 2015.
IPCC: Climate Change 2013: The Physical Science Basis, Con-
tribution of Working Group I to the Fifth Assessment Re-
port of the Intergovernmental Panel on Climate Change, Cam-
bridge University Press, Cambridge, UK, New York, USA,
doi:10.1017/CBO9781107415324, 2014.
Janicka, L., Stachlewska, I., Markowicz, K., Baars, H., Engel-
mann, R., and Heese, B.: Lidar measurements of Canadian forest
fire smoke episode observed in July 2013 over Warsaw, Poland,
in: Reviewed and Revised Papers of 27th ILRC International
Laser Radar Conference, 5–10 July 2015, New York, USA, 2015.
Kanitz, T.: Vertical Distribution of Aerosols Above the Atlantic
Ocean, Punta Arenas (Chile), and Stellenbosch (South Africa):
Characterization, Solar Radiative Effects and Ice Nucleating
Properties, PhD thesis, Faculty III Process Sciences, Technische
Universität Berlin, Berlin, 2012.
Kanitz, T., Seifert, P., Ansmann, A., Engelmann, R., Althausen, D.,
Casiccia, C., and Rohwer, E. G.: Contrasting the impact
of aerosols at northern and southern midlatitudes on het-
erogeneous ice formation, Geophys. Res. Lett., 38, L17802,
doi:10.1029/2011GL048532, 2011.
Kanitz, T., Ansmann, A., Engelmann, R., and Althausen, D.: North-
south cross sections of the vertical aerosol distribution over the
Atlantic Ocean from multiwavelength Raman/polarization lidar
during Polarstern cruises, J. Geophys. Res.-Atmos., 118, 2643–
2655, doi:10.1002/jgrd.50273, 2013a.
Kanitz, T., Ansmann, A., Seifert, P., Engelmann, R., Kalisch, J.,
and Althausen, D.: Radiative effect of aerosols above the north-
ern and southern Atlantic Ocean as determined from shipborne
lidar observations, J. Geophys. Res.-Atmos., 118, 12556–12565,
doi:10.1002/2013JD019750, 2013b.
Kanitz, T., Ansmann, A., Foth, A., Seifert, P., Wandinger, U., Engel-
mann, R., Baars, H., Althausen, D., Casiccia, C., and Zamorano,
Atmos. Chem. Phys., 16, 5111–5137, 2016 www.atmos-chem-phys.net/16/5111/2016/

H. Baars et al.: PollyNET 5135
F.: Surface matters: limitations of CALIPSO V3 aerosol typ-
ing in coastal regions, Atmos. Meas. Tech., 7, 2061–2072,
doi:10.5194/amt-7-2061-2014, 2014a.
Kanitz, T., Engelmann, R., Heinold, B., Baars, H., Skupin, A., and
Ansmann, A.: Tracking the Saharan Air Layer with shipborne
lidar across the tropical Atlantic, Geophys. Res. Lett., 41, 1044–
1050, doi:10.1002/2013GL058780, 2014b.
Klett, J.: Stable analytical inversion solution for processing lidar
returns, Appl. Optics, 20, 211–220, 1981.
Komppula, M., Mielonen, T., Arola, A., Korhonen, K., Lihavainen,
H., Hyvärinen, A.-P., Baars, H., Engelmann, R., Althausen, D.,
Ansmann, A., Müller, D., Panwar, T. S., Hooda, R. K., Sharma,
V. P., Kerminen, V.-M., Lehtinen, K. E. J., and Viisanen, Y.:
Technical Note: One year of Raman-lidar measurements in Gual
Pahari EUCAARI site close to New Delhi in India – Seasonal
characteristics of the aerosol vertical structure, Atmos. Chem.
Phys., 12, 4513–4524, doi:10.5194/acp-12-4513-2012, 2012.
Korhonen, K., Giannakaki, E., Mielonen, T., Pfüller, A., Laakso,
L., Vakkari, V., Baars, H., Engelmann, R., Beukes, J. P., Van Zyl,
P. G., Ramandh, A., Ntsangwane, L., Josipovic, M., Tiitta, P.,
Fourie, G., Ngwana, I., Chiloane, K., and Komppula, M.: Atmo-
spheric boundary layer top height in South Africa: measurements
with lidar and radiosonde compared to three atmospheric models,
Atmos. Chem. Phys., 14, 4263–4278, doi:10.5194/acp-14-4263-
2014, 2014.
Kulmala, M., Asmi, A., Lappalainen, H. K., Baltensperger, U.,
Brenguier, J.-L., Facchini, M. C., Hansson, H.-C., Hov, Ø.,
O’Dowd, C. D., Pöschl, U., Wiedensohler, A., Boers, R.,
Boucher, O., de Leeuw, G., Denier van der Gon, H. A. C., Fe-
ichter, J., Krejci, R., Laj, P., Lihavainen, H., Lohmann, U., Mc-
Figgans, G., Mentel, T., Pilinis, C., Riipinen, I., Schulz, M.,
Stohl, A., Swietlicki, E., Vignati, E., Alves, C., Amann, M.,
Ammann, M., Arabas, S., Artaxo, P., Baars, H., Beddows, D.
C. S., Bergström, R., Beukes, J. P., Bilde, M., Burkhart, J. F.,
Canonaco, F., Clegg, S. L., Coe, H., Crumeyrolle, S., D’Anna,
B., Decesari, S., Gilardoni, S., Fischer, M., Fjaeraa, A. M., Foun-
toukis, C., George, C., Gomes, L., Halloran, P., Hamburger, T.,
Harrison, R. M., Herrmann, H., Hoffmann, T., Hoose, C., Hu,
M., Hyvärinen, A., Hõrrak, U., Iinuma, Y., Iversen, T., Josipovic,
M., Kanakidou, M., Kiendler-Scharr, A., Kirkevåg, A., Kiss, G.,
Klimont, Z., Kolmonen, P., Komppula, M., Kristjánsson, J.-E.,
Laakso, L., Laaksonen, A., Labonnote, L., Lanz, V. A., Lehtinen,
K. E. J., Rizzo, L. V., Makkonen, R., Manninen, H. E., McMeek-
ing, G., Merikanto, J., Minikin, A., Mirme, S., Morgan, W. T.,
Nemitz, E., O’Donnell, D., Panwar, T. S., Pawlowska, H., Pet-
zold, A., Pienaar, J. J., Pio, C., Plass-Duelmer, C., Prévôt, A.
S. H., Pryor, S., Reddington, C. L., Roberts, G., Rosenfeld, D.,
Schwarz, J., Seland, Ø., Sellegri, K., Shen, X. J., Shiraiwa, M.,
Siebert, H., Sierau, B., Simpson, D., Sun, J. Y., Topping, D.,
Tunved, P., Vaattovaara, P., Vakkari, V., Veefkind, J. P., Viss-
chedijk, A., Vuollekoski, H., Vuolo, R., Wehner, B., Wildt, J.,
Woodward, S., Worsnop, D. R., van Zadelhoff, G.-J., Zardini, A.
A., Zhang, K., van Zyl, P. G., Kerminen, V.-M., S Carslaw, K.,
and Pandis, S. N.: General overview: European Integrated project
on Aerosol Cloud Climate and Air Quality interactions (EU-
CAARI) – integrating aerosol research from nano to global
scales, Atmos. Chem. Phys., 11, 13061–13143, doi:10.5194/acp-
11-13061-2011, 2011.
Mamouri, R. E. and Ansmann, A.: Potential of polarization li-
dar to provide profiles of CCN- and INP-relevant aerosol pa-
rameters, Atmos. Chem. Phys. Discuss., 15, 34149–34204,
doi:10.5194/acpd-15-34149-2015, 2015.
Müller, D., Mattis, I., Wandinger, U., Ansmann, A., Althausen, D.,
and Stohl, A.: Raman lidar observations of aged Siberian and
Canadian forest fire smoke in the free troposphere over Ger-
many in 2003: microphysical particle characterization, J. Geo-
phys. Res., 110, D17201, doi:10.1029/2004JD005756, 2005.
Müller, D., Tesche, M., Eichler, H., Engelmann, R., Althausen, D.,
Ansmann, A., Cheng, Y. F., Zhang, Y. H., and Hu, M.: Strong
particle light absorption over the Pearl River Delta (south China)
and Beijing (north China) determined from combined Raman li-
dar and Sun photometer observations, Geophys. Res. Lett., 33,
L20811, doi:10.1029/2006GL027196, 2006.
Müller, D., Ansmann, A., Mattis, I., Tesche, M., Wandinger, U.,
Althausen, D., and Pisani, G.: Aerosol-type-dependent lidar ra-
tios observed with Raman lidar, J. Geophys. Res., 112, D16202,
doi:10.1029/2006JD008292, 2007.
Pappalardo, G., Amodeo, A., Pandolfi, M., Wandinger, U., Ans-
mann, A., Bösenberg, J., Matthias, V., Amiridis, V., De Tomasi,
F., Frioud, M., Iarlori, M., Komguem, L., Papayannis, A., Roca-
denbosch, F., and Wang, X.: Aerosol lidar intercomparison in the
framework of the EARLINET project. 3. Raman lidar algorithm
for aerosol extinction, backscatter, and lidar ratio, Appl. Optics,
43, 5370–5385, 2004.
Pappalardo, G., Amodeo, A., Apituley, A., Comeron, A., Freuden-
thaler, V., Linné, H., Ansmann, A., Bösenberg, J., D’Amico,
G., Mattis, I., Mona, L., Wandinger, U., Amiridis, V., Alados-
Arboledas, L., Nicolae, D., and Wiegner, M.: EARLINET: to-
wards an advanced sustainable European aerosol lidar network,
Atmos. Meas. Tech., 7, 2389–2409, doi:10.5194/amt-7-2389-
2014, 2014.
Pereira, S. N., Preißler, J., Guerrero-Rascado, J. L., Silva, A. M.,
and Wagner, F.: Forest fire smoke layers observed in the free tro-
posphere over Portugal with a multiwavelength raman lidar: opti-
cal and microphysical properties, Scient. World J., 2014, 11 pp.,
doi:10.1155/2014/421838, 2014.
Preißler, J., Wagner, F., Pereira, S. N., and Guerrero-Rascado, J. L.:
Multi-instrumental observation of an exceptionally strong Saha-
ran dust outbreak over Portugal, J. Geophys. Res.-Atmos., 116,
D24204, doi:10.1029/2011JD016527, 2011.
Preißler, J., Bravo-Aranda, J., Wagner, F., Granados-Muñoz, M. J.,
Navas-Guzmán, F., Guerrero-Rascado, J. L., Lyamani, H., and
Alados-Arboledas, L.: Optical properties of free tropospheric
aerosol from multi-wavelength Raman lidars over the south-
ern Iberian Peninsula, in: Proceedings of the 9th International
Symposium on Tropospheric Profiling, 3–7 September 2012,
l’Aquila, Italy, 2012.
Preißler, J., Pereira, S., Silva, A. M., and Wagner, F.: Vertically re-
solved optical and microphysical properties of Portuguese forest
fire smoke observed in February 2012, Lidar Technologies, Tech-
niques, and Measurements for Atmospheric Remote Sensing IX,
Proc. SPIE 8894, 88940Y, doi:10.1117/12.2029184, 2013a.
Preißler, J., Wagner, F., Guerrero-Rascado, J. L., and Silva, A. M.:
Two years of free-tropospheric aerosol layers observed over
Portugal by lidar, J. Geophys. Res.-Atmos., 118, 3676–3686,
doi:10.1002/jgrd.50350, 2013b.
www.atmos-chem-phys.net/16/5111/2016/ Atmos. Chem. Phys., 16, 5111–5137, 2016

5136 H. Baars et al.: PollyNET
Reichardt, J., Wandinger, U., Klein, V., Mattis, I., Hilber, B.,
and Begbie, R.: RAMSES: German Meteorological Ser-
vice autonomous Raman lidar for water vapor, temperature,
aerosol, and cloud measurements, Appl. Optics, 51, 8111–8131,
doi:10.1364/AO.51.008111, 2012.
Sakai, T., Nagai, T., Nakazato, M., Mano, Y., and Matsumura, T.:
Ice clouds and Asian dust studied with lidar measurements of
particle extinction-to-backscatter ratio, particle depolarization,
and water-vapor mixing ratio over Tsukuba, Appl. Optics, 42,
7103–7116, doi:10.1364/AO.42.007103, 2003.
Schwarz, A.: Aerosol typing over Europe and its benefits
for the CALIPSO and EarthCARE missions – Statistical
analysis based on multiwavelength aerosol lidar measure-
ments from ground-based EARLINET stations and compar-
ison to spaceborne CALIPSO data, PhD thesis, University
of Leipzig, Germany, http://nbn-resolving.de/urn:nbn:de:bsz:
15-qucosa-199060, 2016.
Seifert, P., Kunz, C., Baars, H., Ansmann, A., Bühl, J., Senf, F.,
Engelmann, R., Althausen, D., and Artaxo, P.: Seasonal vari-
ability of heterogeneous ice formation in stratiform clouds
over the Amazon Basin, Geophys. Res. Lett., 42, 5587–5593,
doi:10.1002/2015GL064068, 2015.
Sicard, M., Guerrero-Rascado, J. L., Navas-Guzmán, F., Preißler, J.,
Molero, F., Tomás, S., Bravo-Aranda, J. A., Comerón, A., Roca-
denbosch, F., Wagner, F., Pujadas, M., and Alados-Arboledas, L.:
Monitoring of the Eyjafjallajökull volcanic aerosol plume over
the Iberian Peninsula by means of four EARLINET lidar stations,
Atmos. Chem. Phys., 12, 3115–3130, doi:10.5194/acp-12-3115-
2012, 2012.
Sicard, M., D’Amico, G., Comerón, A., Mona, L., Alados-
Arboledas, L., Amodeo, A., Baars, H., Baldasano, J. M., Bele-
gante, L., Binietoglou, I., Bravo-Aranda, J. A., Fernández, A. J.,
Fréville, P., García-Vizcaíno, D., Giunta, A., Granados-Muñoz,
M. J., Guerrero-Rascado, J. L., Hadjimitsis, D., Haefele, A.,
Hervo, M., Iarlori, M., Kokkalis, P., Lange, D., Mamouri, R.
E., Mattis, I., Molero, F., Montoux, N., Muñoz, A., Muñoz
Porcar, C., Navas-Guzmán, F., Nicolae, D., Nisantzi, A., Papa-
giannopoulos, N., Papayannis, A., Pereira, S., Preißler, J., Pu-
jadas, M., Rizi, V., Rocadenbosch, F., Sellegri, K., Simeonov, V.,
Tsaknakis, G., Wagner, F., and Pappalardo, G.: EARLINET: po-
tential operationality of a research network, Atmos. Meas. Tech.,
8, 4587–4613, doi:10.5194/amt-8-4587-2015, 2015.
Skupin, A., Ansmann, A., Engelmann, R., Baars, H., and Müller, T.:
The Spectral Aerosol Extinction Monitoring System (SÆMS):
setup, observational products, and comparisons, Atmos. Meas.
Tech., 7, 701–712, doi:10.5194/amt-7-701-2014, 2014.
Spinhirne, J. D., Rall, J. A., and Scott, V. S.: Compact eye safe lidar
systems, Rev. Laser Eng., 23, 112–118, doi:10.2184/lsj.23.112,
1995.
Stachlewska, I., Piadłowski, M., Migacz, S., Szkop, A.,
Zielinska, A., and Swaczyna, P.: Ceilometer observations
of the boundary layer over Warsaw, Poland, Acta Geophys., 60,
1386–1412, doi:10.2478/s11600-012-0054-4, 2012.
Stevens, B. and Feingold, G.: Untangling aerosol effects on clouds
and precipitation in a buffered system, Nature, 461, 607–613,
2009.
Stoffelen, A., Pailleux, J., Källén, E., Vaughan, J. M., Isaksen, L.,
Flamant, P., Wergen, W., Andersson, E., Schyberg, H., Culoma,
A., Meynart, R., Endemann, M., and Ingmann, P.: The Atmo-
spheric Dynamics Mission for global wind field measurement,
B. Am. Meteorol. Soc., 86, 73–87, 2005.
Sugimoto, N., Matsui, I., Shimizu, A., Nishizawa, T., Hara, Y.,
Xie, C., Uno, I., Yumimoto, K., Wang, Z., and Yoon, S.-C.: Li-
dar network observations of tropospheric aerosols, Lidar Remote
Sensing for Environmental Monitoring IX, Proc. SPIE, 7153,
71530A, doi:10.1117/12.806540, 2008.
Sugimoto, N., Nishizawa, T., Shimizu, A., Matsui, I., and Jin, Y.:
Characterization of aerosols in East Asia with the Asian Dust
and Aerosol Lidar Observation Network (AD-Net), Lidar Re-
mote Sensing for Environmental Monitoring XIV, Proc. SPIE,
9262, 92620K, doi:10.1117/12.2069892, 2014.
Tesche, M., Ansmann, A., Müller, D., Althausen, D., En-
gelmann, R., Hu, M., and Zhang, Y.: Particle backscat-
ter, extinction, and lidar ratio profiling with Raman lidar
in south and north China, Appl. Optics, 46, 6302–6308,
doi:10.1364/AO.46.006302, 2007.
Tesche, M., Müller, D., Ansmann, A., Hu, M., and Zhang, Y.:
Retrieval of microphysical properties of aerosol particles
from one-wavelength Raman lidar and multiwavelength Sun
photometer observations, Atmos. Environ., 42, 6398–6404,
doi:10.1016/j.atmosenv.2008.02.014, 2008.
Tesche, M., Gross, S., Ansmann, A., Müller, D., Althausen, D.,
Freudenthaler, V., and Esselborn, M.: Profiling of Saharan
dust and biomass-burning smoke with multiwavelength polar-
ization Raman lidar at Cape Verde, Tellus B, 63, 649–676,
doi:10.3402/tellusb.v63i4.16360, 2011.
The EARLINET publishing group 2000–2010:
EARLINET All Observations (2000–2010),
doi:10.1594/WDCC/EN_all_measurements_2000-2010, 2014.
Wandinger, U. and Ansmann, A.: Experimental determination of
the lidar overlap profile with Raman lidar, Appl. Optics, 41, 511–
514, 2002.
Wandinger, U., Mattis, I., Tesche, M., Ansmann, A., Bösenberg,
J., Chaikovski, A., Freudenthaler, V., Komguem, L., Linné, H.,
Matthias, V., Pelon, J., Sauvage, L., Sobolewski, P., Vaughan,
G., and Wiegner, M.: Air mass modification over Europe:
EARLINET aerosol observations from Wales to Belarus, J. Geo-
phys. Res.-Atmos., 109, D24205, doi:10.1029/2004JD005142,
2004.
Wandinger, U., Freudenthaler, V., Baars, H., Amodeo, A., En-
gelmann, R., Mattis, I., Groß, S., Pappalardo, G., Giunta, A.,
D’Amico, G., Chaikovsky, A., Osipenko, F., Slesar, A., Nicolae,
D., Belegante, L., Talianu, C., Serikov, I., Linné, H., Jansen, F.,
Apituley, A., Wilson, K. M., de Graaf, M., Trickl, T., Giehl, H.,
Adam, M., Comerón, A., Muñoz, C., Rocadenbosch, F., Sicard,
M., Tomás, S., Lange, D., Kumar, D., Pujadas, M., Molero, F.,
Fernández, A. J., Alados-Arboledas, L., Bravo-Aranda, J. A.,
Navas-Guzmán, F., Guerrero-Rascado, J. L., Granados-Muñoz,
M. J., Preißler, J., Wagner, F., Gausa, M., Grigorov, I., Stoy-
anov, D., Iarlori, M., Rizi, V., Spinelli, N., Boselli, A., Wang, X.,
Lo Feudo, T., Perrone, M. R., De Tomasi, F., and Burlizzi, P.:
EARLINET instrument intercomparison campaigns: overview
on strategy and results, Atmos. Meas. Tech., 9, 1001-1023,
doi:10.5194/amt-9-1001-2016, 2016.
Welton, E. J., Campbell, J. R., Spinhirne, J. D., and Scott III, V. S.:
Global monitoring of clouds and aerosols using a network of
micropulse lidar systems, in: Second International Asia-Pacific
Symposium on Remote Sensing of the Atmosphere, Environ-
Atmos. Chem. Phys., 16, 5111–5137, 2016 www.atmos-chem-phys.net/16/5111/2016/

H. Baars et al.: PollyNET 5137
ment, and Space, International Society for Optics and Photonics,
Sendai, Japan, 151–158, doi:10.1117/12.417040, 2001.
Winker, D. M., Vaughan, M. A., Omar, A., Hu, Y., Powell, K. A.,
Liu, Z., Hunt, W. H., and Young, S. A.: Overview of the
CALIPSO mission and CALIOP data processing algorithms, J.
Atmos. Ocean. Tech., 26, 2310–2323, 2009.
www.atmos-chem-phys.net/16/5111/2016/ Atmos. Chem. Phys., 16, 5111–5137, 2016