Embed Size (px)
Citation preview
1
An Invisible Localization Attack to Internet ThreatMonitors
Wei Yu, Xun Wang, Xinwen Fu, Dong Xuan, and Wei Zhao
Abstract— Internet threat monitoring (ITM) systems havebeen deployed to detect widespread attacks on the Internet inrecent years. However, the effectiveness of ITM systems criticallydepends on the confidentiality of the location of their monitors.If adversaries learn the monitor locations of an ITM system,they can bypass the monitors and focus on the uncovered IPaddress space without being detected. In this paper, we study anew class of attacks, theinvisible LOCalization (iLOC) attack.The iLOC attack can accurately and invisibly localize monitorsof ITM systems. In the iLOC attack, the attacker launches low-rate port-scan traffic, encoded with a selectedpseudo-noise code(PN-code), to targeted networks. While the secret PN-code isinvisible to others, the attacker can accurately determine theexistence of monitors in the targeted networks based on whetherthe PN-code is embedded in the report data queried from thedata center of the ITM system. We formally analyze the impactof various parameters on attack effectiveness. We implementthe iLOC attack and conduct the performance evaluation on areal-world ITM system to demonstrate the possibility of suchattacks. We also conduct extensive simulations on theiLOC attackusing real-world traces. Our data show that the iLOC attackcan accurately identify monitors while being invisible to ITMsystems. Finally, we present a set of guidelines to counteract theiLOC attack.
Index Terms— Internet threat monitoring systems, Invisiblelocalization attack, PN-code, Security
I. I NTRODUCTION
In recent years, widespread attacks, such as worms [1],[2], [3] and distributed denial-of-service (DDoS) attacks[4],[5], have been dangerous threats to the Internet. Due to thewidespread nature of these attacks, large-scale traffic moni-toring across the Internet has become necessary in order toeffectively detect and defend against them. Developing anddeployingInternet threat monitoring(ITM) systems (ormotionsensor networks) is a major effort in this direction.
An ITM system consists of a number of monitors and adata center. The monitors are distributed across the Internetand can be deployed at hosts, routers, and firewalls, etc.Each monitor is responsible for monitoring and collectingtraffic addressed to a range of IP addresses within a sub-network. The range of IP addresses covered by a monitor is
Wei Yu is with the Dept. of Computer Science, Texas A&M University,College Station, TX 77843. E-mail: [email protected]. Xun Wang and DongXuan are with the Dept. of Computer Science and Engineering, The OhioState University, Columbus, OH 43210. E-mail:{wangxu, xuan}@cse.ohio-state.edu. Xinwen Fu is with the College of Business and Information Systems,Dakota State University, Madison, SD 57042. Email: [email protected] Zhao is with the School of Science, Rensselaer Polytechnic Institute,Troy, NY 12180. E-mail: [email protected].
A short conference version appears in theProceedings of the 27th IEEEInternational Conference on Computer Communications (INFOCOM) (mini-conference), Phoenix, AZ, April 13-18, 2008.
also referred to as thelocation of the monitor. Periodically,the monitors send traffic logs to the data center. The datacenter analyzes the traffic logs and publishes reports to thepublic. Recall that in order to maximize the usage of suchreports, most existing ITM systems publish the reports onlineand make them accessible to the public. The reports providecritical insights into widespread Internet attacks and areusedin detecting and defending against such attacks. ITM systemshave been successfully used to detect the outbreaks of worms[6] and DDoS attacks [7]. There have been many real-worlddevelopments and deployments of ITM systems. Examplesinclude DOMINO (Distributed Overlay for Monitoring In-terNet Outbreaks) [8], SANs ISC (Internet Storm Center)[6], Internet Sink [9], Network Telescope [10], CAIDA [11],MyNetWatchMan [12], and Honeynet [13], [14].
However, the usability of ITM systems largely depends onthe confidentiality of IP addresses covered by their monitors,i.e., thelocationsof monitors. If the locations of monitors areidentified, the attacker can deliberately avoid these monitorsand directly attack the uncovered IP address space. It isa known fact that the number of sub-networks covered bymonitors is much smaller than the total number of sub-networks in the Internet [6], [9], [10]. In other words, theIP address space covered by monitors represents a very smallportion of the entire IP address space [6]. Hence, bypassingIPaddress spaces covered by monitors willsignificantlydegradethe accuracy of the traffic data collected by the ITM systemin reflecting the real situation of attack traffic. Furthermore,the attacker may also poison ITM systems by manipulatingthe traffic towards and captured by disclosed monitors. Forexample, the attacker may launch high-rate port-scan trafficto disclosed monitors and feign a large-scale worm prop-agation. The attackers may even launch retaliation attacks(e.g., DDoS) against participants (i.e., monitor contributors)of ITM systems, thereby discouraging them from contributingto ITM systems. In summary, the attacker can significantlycompromise the ITM system usability if locations of monitorsare disclosed. It is important to have a thorough understandingof such attacks, in order to effectively protect ITM systems.
In this paper, we conduct a systematic investigation of aclass of attacks which aim to localize monitorsaccuratelyand invisibly. Accuracy is very important for an attackerin identifying monitor locations. Meanwhile, invisibility isalso vital to a successful attack. If the attack attempts areidentified by the defender (such as the ITM administrators),countermeasures can be applied by the defender to reduceor eliminate the effects of the attack by filtering suspicioustraffic (so that the attacker will not be able to identify monitors
2
through traffic analysis [15]), confusing attackers (to make theattacker obtain wrong monitor location information [13]),andeven tracking an attacker to its origin (so that attackers can beheld accountable for their malicious acts [16], [17]).
Several attack schemes to discover the location of monitorshave been investigated [18], [19]. However, our work is thefirst to address an attack aiming to achieve the objectives ofboth accuracy and invisibility. It is challenging for the attackerto achieve these two objectives simultaneously. Intuitively, theattacker can use the high-rate attack traffic, as in [18], [19],to achieve high attack accuracy as follows. The attacker canlaunch high-rate port-scan traffic to a target network. Theattacker then queries the data center for the report on recentport-scan activities. If there is a trafficspikein the report datareflecting the high-rate port-scan traffic sent by the attack,the attacker can determine that the target network is deployedwith monitor(s) which sends traffic report to the data center.However, the drawback of this scheme is its high visibility,since the launched high-rate traffic makes it highly visibletothe defender.
In this paper, we investigate a new class of attacks calledinvisible LOCcalization (iLOC) attack. In theiLOC attack,the attacker launches low-rate port-scan traffic (also referredto as attack traffic) to target networks. The scan traffic isencoded with a carefully selectedpseudo-noise code(PN-code), known by only the attacker. The PN-code embeddedin traffic can be accurately recognized by the attacker evenwith the interference from background traffic aggregated bythe data center but not generated byiLOC. Thus, the attackeris able toaccuratelydetermine the existence of monitors inthe target networks based on whether the same PN-code isembedded in the report data queried from the data centerof the ITM system. The PN-code modulated/embedded scantraffic will appear as innocent noise in both the time andfrequency domains, rendering itinvisible to others who donot know the PN-code. Only those aware of the original PN-code can correctly recover the encoded PN-code and identifythe monitor locations. Therefore, using theiLOC technique,the attacker can accurately localize monitors while evadingdetection.
We conduct both theoretical analysis and experimentalevaluation on theiLOC attack. We derive formulas for boththe accuracy and invisibility of the attack. We analyze anddiscuss the impacts of various attack parameters (e.g., PN-code length, attack traffic rate etc.) on the effectiveness ofattack. Based on the analytical results, we discuss how theattacker can select the attack parameters in order to achieveboth attack accuracy and invisibility. We implement theiLOCattack and perform the performance evaluation on a real-worldITM system, which demonstrates the possibility of theiLOCattack. We also conduct extensive performance evaluationsonthe iLOC attack in a simulated environment. Our evaluationsare based on replaying a large set of real-world Internet traffictraces collected by a real-world ITM system. The evaluationdata demonstrate that the attack can accurately identify thelocations of monitors, while evading detection by those whodonot the know the PN-code used by the attacker. Furthermore,we present a set of guidelines on how to counteract theiLOC
attack.The remainder of the paper is organized as follows. In
Section II, we describe theiLOC attack in detail. In Section III,a formal analysis of attack accuracy and invisibility, and theimpacts of various parameters on the performance ofiLOCattack are presented. In Section IV, we introduce our imple-mentation of theiLOC attack and the validation in the real-world experiments. In Section V, we report our performanceevaluation results on theiLOC attack. In Section VI, wediscuss some preliminary countermeasures against theiLOCattack. In Section VII, we review the related work. Finally,weconclude the paper in Section VIII.
II. iLOC ATTACK
In this section, we will present theiLOC attack in detail.We will first give an overview of theiLOC attack, and thenintroduce the detailed procedures of the attack, followed bydiscussions. Table I summarizes the notations used in thispaper.
A. Overview
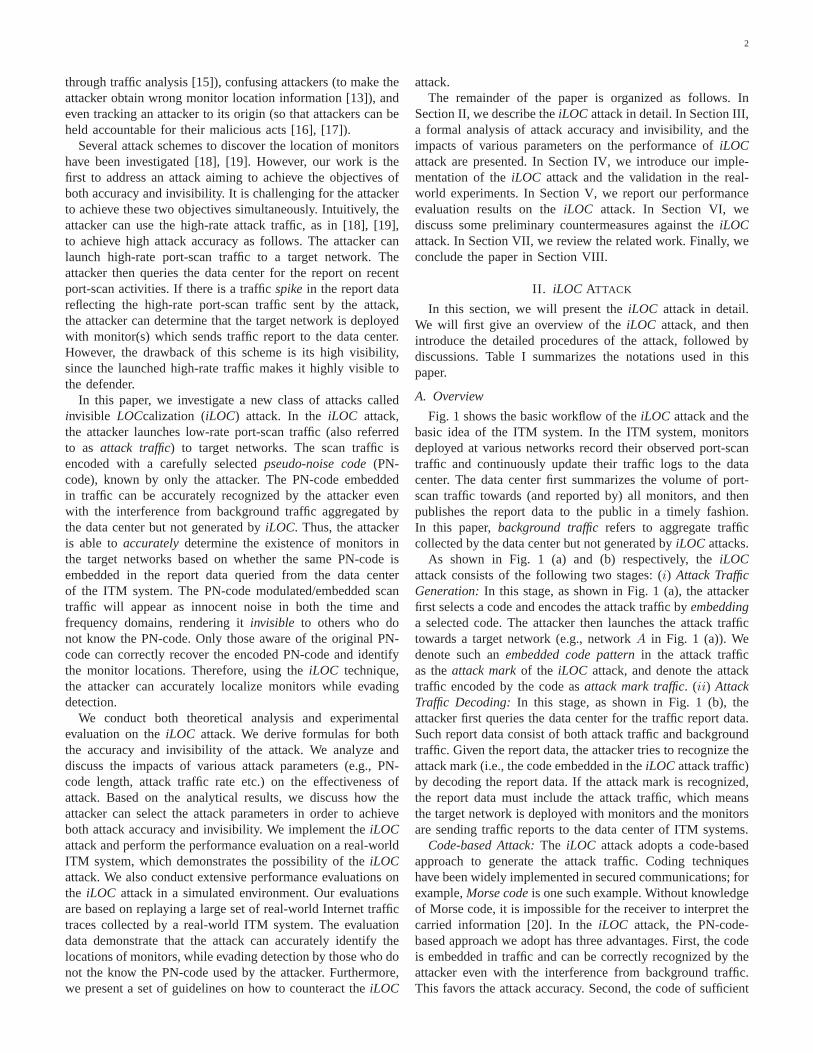
Fig. 1 shows the basic workflow of theiLOC attack and thebasic idea of the ITM system. In the ITM system, monitorsdeployed at various networks record their observed port-scantraffic and continuously update their traffic logs to the datacenter. The data center first summarizes the volume of port-scan traffic towards (and reported by) all monitors, and thenpublishes the report data to the public in a timely fashion.In this paper,background trafficrefers to aggregate trafficcollected by the data center but not generated byiLOC attacks.
As shown in Fig. 1 (a) and (b) respectively, theiLOCattack consists of the following two stages: (i) Attack TrafficGeneration:In this stage, as shown in Fig. 1 (a), the attackerfirst selects a code and encodes the attack traffic byembeddinga selected code. The attacker then launches the attack traffictowards a target network (e.g., networkA in Fig. 1 (a)). Wedenote such anembedded code patternin the attack trafficas theattack markof the iLOC attack, and denote the attacktraffic encoded by the code asattack mark traffic. (ii) AttackTraffic Decoding:In this stage, as shown in Fig. 1 (b), theattacker first queries the data center for the traffic report data.Such report data consist of both attack traffic and backgroundtraffic. Given the report data, the attacker tries to recognize theattack mark (i.e., the code embedded in theiLOC attack traffic)by decoding the report data. If the attack mark is recognized,the report data must include the attack traffic, which meansthe target network is deployed with monitors and the monitorsare sending traffic reports to the data center of ITM systems.
Code-based Attack:The iLOC attack adopts a code-basedapproach to generate the attack traffic. Coding techniqueshave been widely implemented in secured communications; forexample,Morse codeis one such example. Without knowledgeof Morse code, it is impossible for the receiver to interpretthecarried information [20]. In theiLOC attack, the PN-code-based approach we adopt has three advantages. First, the codeis embedded in traffic and can be correctly recognized by theattacker even with the interference from background traffic.This favors the attack accuracy. Second, the code of sufficient
3
length provides enough privacy. That is, the code is onlyknown by the attacker, and thereby the code pattern embeddedin attack traffic can only be recognized by the attacker. Lastly,the code is able to carry information. A longer code is moreimmune to interference, and requires comparatively lower-rateattack traffic as the carrier, which is harder to detect. Allthese characteristics contribute help to achieve the objectivesof attack accuracy and invisibility.
1. Select code2. Encode attack traffic
Data center
monitors
Network ANetwork B
Internet
3. Launch attack traffic
Attacker
Network C
+MONITORS’ LOGUPDATE
: Background Traffic
: Attack Traffic
monitors
(a) Attack stage1: attack traffic generation
4. Query for traffic report
Data center
monitors
Network ANetwork B
Internet
5. Recognize attack mark
Attacker
Network C
+
QUERY RESPONSE
monitors
(b) Attack stage2: attack traffic decoding
Fig. 1. Workflow of theiLOC Attack
Parallel Attack Capacity:Intuitively, one simple way toachieve this parallel attack is to launch port-scan/attacktraffictowards multiple target networks simultaneously by scanninga different port for each target network. For example, if thedata center publishes traffic reports of1000 (TCP/UDP) ports,then the attacker can identify all these1000 networks simul-taneously, attacking each network with a different port. Sinceattack traffic on different ports are summarized separatelyatthe data center, the attacker can still separate, and thus decode,the traffic towards different targets. The attacker, therefore,can localize monitors in multiple networks simultaneouslyand accurately; however, can the attacker further improve theattack efficiency? Assuming that the data center only publishesreports of 1000 ports, can the attacker fingerprint10, 000target networks simultaneously, for example, by attacking10different networks usingoneport? A high-rate port-scan trafficcannot achieve this as it is indiscernible whether a spike inthetraffic report is caused by traffic logs from one network or theother 9 networks. In order to achieve this goal in the code-based attack, the selected code and corresponding encodedattack traffic towards multiple networks for the same portshould not interfere with each other (i.e., each of them can bedecodedindividually andaccuratelyby the attacker, althoughthey are integrated/summarized in the traffic report from theITM data center). The PN-code used by theiLOC attack can
target multiple networks by launching probing traffic on thesame port simultaneously. This unique feature can improve theattack efficiency significantly. The details of how to selectthePN-code will be discussed in the following sections.
B. Attack Traffic Generation Stage
In this attack stage, the attacker: (i) selects the code, aPN-codein our case; (ii) encodes the attack traffic using theselected PN-code; and (iii) sends the encoded attack traffictowards the target network. In the third step, the attacker cancoordinate a large number of compromised bots to generatethe attack traffic [21]; however, this is not the focus of thispaper. In the remaining sections, we will focus on the first andsecond steps.
1) Code Selection:To evade detection, the attack trafficshould be similar to the background traffic. From a large setof real-world traffic traces obtained from SANs ISC [6], [22],we conclude that the background traffic shows random patternsin both the time and frequency domains. The attack objectivesof both accuracy and invisibility, and an attacker’s desireforparallel attacks require that: (i) the encoded attack trafficshould blend in with background traffic, i.e., be random in boththe time and frequency domains, (ii) the code embedded inthe attack traffic should be easily recognizable to the attackeralone, and (iii) the code should support parallel attacks on thesame port.
To meet the above requirements, we choose the PN-code toencode the attack traffic. The PN-code in theiLOC attack is asequence of−1 or +1 with the following features [23], [24],[25]: (i) The PN-code is random and “balanced”. The−1 and+1 are randomly distributed and the occurrence frequenciesof −1 and +1 are nearly equal. This feature contributes togood spectral density properties (i.e., equally spreadingtheenergy over all frequency-bands). It makes the attack trafficappear as noise and blend in with background traffic in bothtime and frequency domains. In Appendix A, we show thatthe traffic encoded by a PN-code is much similar to the trafficwithout including the attack traffic. (ii) The PN-code has ahigh correlation to itself and a low correlation to others (suchas random noise), where the correlation is a mathematicalutility for finding repeating patterns in a signal [25]. Thismakes it feasible for the attacker to accurately recognize attacktraffic (encoded by the PN-code) from the traffic report data,even under the interference of background traffic. (iii) ThePN-code has a low cross-correlation value among differentPN-code instances. The lower this cross-correlation value, theless interference among multiple attack sessions in parallelattack. This makes it feasible for the attacker to conductparallel attacks towards multiple target networks on the sameport.
There are mature PN-code generators such as m-sequencescode, Barker code, gold codes and Hadamard-Walsh codes[23], [24]. In this paper, we use the m-sequence code, whichhas the best autocorrelation (it only highly correlates to itselfwith a sharp autocorrelation peak) [23], [26]. We use thefeedback shift registerto repeatedly generate the M-sequencePN-code due to its popularity and ease of implementation [26].In particular, a feedback shift register consists of two parts.
4
One is an ordinary shift register consisting of a number offlip-flops (two state memory devices). The other is a feedbackmodule to form a multi-loop feedback logic.
TABLE I
NOTATIONS
Notation Definition
L Number of bits in the PN-codeCi =< Ci,1, . . . , Ci,L > Vector to presentith PN-code of lengthL in
which each bitCi,j is either−1 or +1Tq Time unit of each queried data lasts forTs Mark-bit duration as a unit time which is
mapped to a single bit of PN-code in encodedattack traffic
V Mark traffic rate as the high rate of encodedattack traffic inTs
P ∈ [0, ] Attack traffic rate defined as ratio of attacktraffic rate over the background traffic rate
(Ex, σx) Statistical profile of background traffic rate(e.g., meanEx and standard deviationσx)for port x
ψi =< ψi,1, . . . , ψi,L > Vector to present the encoded attack trafficωi =< ωi,1, . . . , ωi,L > Vector to present the background trafficλi =< λi,1, . . . , λi,L > Vector to present the traffic report data which
are queried from the data centerψ′
i=< ψ′
i,1, . . . , ψ′
i,L> Vector to present the shifted vector which is
generated by subtractingE(ψi,j) from ψi
ω′
i=< ω′
i,1, . . . , ω′
i,L> Vector to present the shifted vector which is
generated by subtractingE(ωi,j) from ωi
λ′i=< λ′
i,1, . . . , λ′
i,L> Vector to present the shifted vector which is
generated by subtractingE(λi,j) from λi
Γ(X,Y ) = X ⊙ Y Correlation degree between vectorX andvectorY
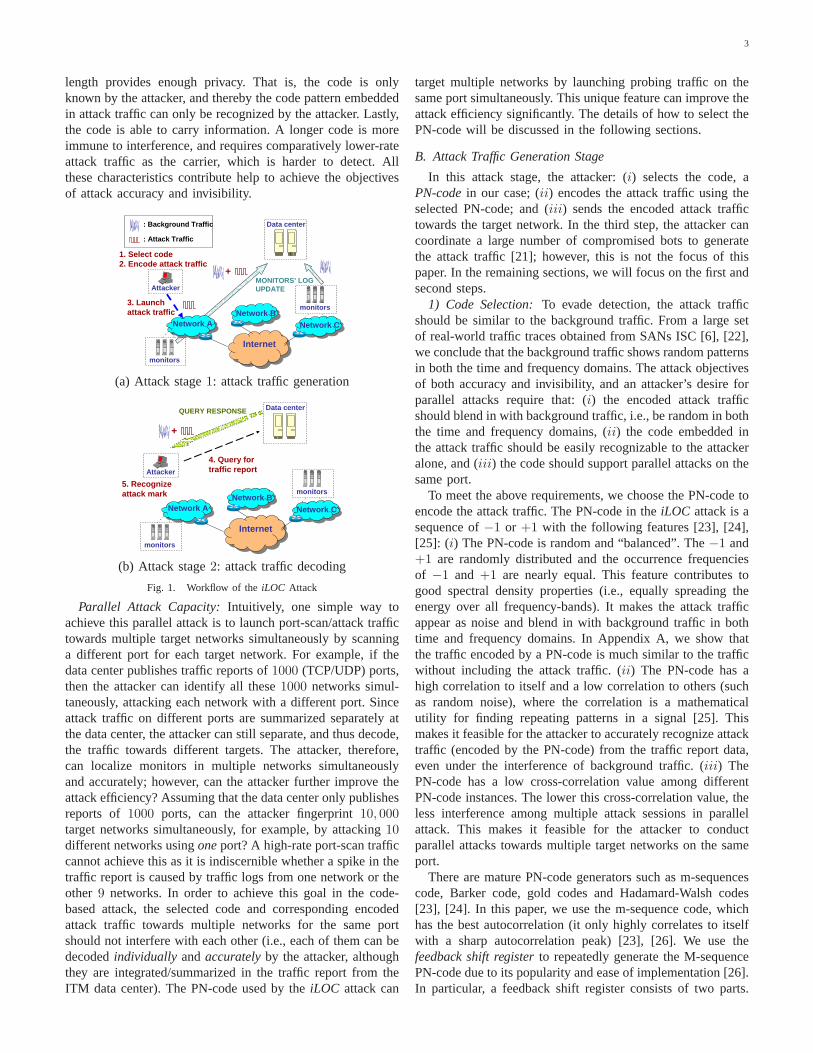
2) Attack Traffic Encoding:During the attack traffic encod-ing process, each bit of the selected PN-code is mapped to aunit time periodTs, denoted asmark-bit duration. The entireduration of launched attack traffic (referred to astraffic launchsession) is TsL, whereL is the length of the PN-code. Afterthe attacker launches port-scans to target networks, he/shealso queries the data center for the traffic report periodically.For brevity, this query interval is set toTs. The detaileddiscussion of determining these parameters will be presentedin Section III.
The encoding is conducted based on the following rules:each bit of the PN-code maps to a mark-bit durationTs;when the PN-code bit is+1, port-scan traffic with a highrate, denoted asmark traffic rate V , is generated in thecorresponding mark-bit duration; when the code bit is−1,no port-scan traffic is generated in the corresponding mark-bit duration. Thus, the attacker embeds the attack trafficwith a special pattern, i.e., theoriginal PN-code. Recall that,after this encoding process, the PN-code patternembeddedin traffic is denoted as theattack mark. If we use Ci =<Ci,1, Ci,2, . . . , Ci,L >∈ {−1,+1}L to represent the PN-codeand useηi =< ηi,1, ηi,2, . . . , ηi,L > to represent the attacktraffic rate, then we haveηi,j = V
2Ci,j + V
2. That is,ηi,j = V
if Ci,j = +1 and ηi,j = 0 if Ci,j = −1 (j = [1, L]). Fig. 2shows one example of the PN-code and the correspondingattack traffic encoded with the PN-code.C. Attack Traffic Decoding Stage
In this stage, the attacker takes the following two steps: (i)The attacker queries the data center for the traffic report data,
+1
PN-code = [+1, -1, +1, -1, +1]
+1 +1
-1-1
Attack Traffic Encoded by PN-code
Traffic Launch Session Duration = 5 · Ts
PN-Code Length = 5
V
TS TS
V
0
Fig. 2. PN-code and Encoded Attack Traffic
which consist of both the attack traffic and the backgroundtraffic. (ii) From the report data, the attacker attempts to rec-ognize the embedded attack mark. The existence of the attackmark determines whether the targeted network is deployedwith monitors or not. As the query of traffic report data isrelatively straightforward, here we only detail the secondstep,i.e., attack mark recognition, as follows.
In the report data queried from the data center, the at-tack traffic encoded with the attack mark is mixed with thebackground traffic which is aggregated by the data center butnot generated byiLOC. It is critical for the iLOC attack toaccurately recognize the attack mark from the traffic reportdata. To address this, we develop a correlation-based scheme.This scheme is motivated by the fact that the original PN-code (used to encode attack traffic) and its correspondingattack mark (embedded in the traffic report data) are highlycorrelated: in fact, they are sharing the same pattern.
The attack mark in the traffic report data is theembeddedform of the original PN-code. The attack mark is similar toits original PN-code, although the background traffic mayintroduce interference and distortion into the attack mark.We adopt the following correlation degree to measure theirsimilarity. Mathematically, thecorrelation degreeis definedas the inner product of two vectors. For two vectorsX =<X1,X2, . . . ,XL > andY =< Y1, Y2, . . . , YL > of lengthL,the correlation degree of vectorX andY is
Γ(X,Y ) =
∑L
i=1XiYi
L, (1)
whereΓ(.) represents the operator for the inner product of twovectors. Based on the above definition, we haveΓ(X,X) =Γ(Y, Y ) = 1, ∀ X,Y ∈ {−1,+1}L.
We use two vectors,ηi =< ηi,1, ηi,2, . . . , ηi,L > andωi =<ωi,1, ωi,2, . . . , ωi,L > to represent the attack traffic (embeddedwith the attack mark) and the background traffic, respectively.We shift the above two vectors by subtracting the meanvalue from the original data, resulting in two new vectors,η′
i =< η′i,1, η
′i,2, . . . , η
′i,L > andω′
i =< ω′i,1, ω
′i,2, . . . , ω
′i,L >.
We continue to use a vectorCi =< Ci,1, Ci,2, . . . , Ci,L >∈{−1,+1}L to represent the PN-code. Thus, the correlationdegree between the PN-code and the (shifted) attack trafficcan be obtained. Similarly, we can also obtain the correlationdegree between the PN-code and the (shifted) backgroundtraffic as follows.
According to the rules of encoding attack traffic discussedin Section II-B.2, ηi = V
2Ci + V
2. Thus, η′
i = ηi −
5
E(ηi) = ηi − V2
= V2Ci. Hence, the correlation degree
between the original PN-code and the (shifted) attack trafficis Γ(Ci, η
′i) = V
2Γ(Ci, Ci) = V
2. Furthermore, we can also
derive the correlation degree between the PN-code and the(shifted) background traffic, i.e.,Γ(Ci, ω
′i). The mean of such
a correlation degree is close to0, since the PN-code haslow correlation with the (shifted) background traffic (i.e.,E[Γ(Ci, ω
′i)] = 1
LE[
∑L
j=1(ω′
i,jCi,j)] ≈ 0). If the standarddeviation of the background traffic rate isσx, the variance ofsuch a correlation degree is
V ar[Γ(Ci, ω′i)] = E[(Γ(Ci, ω
′i) − 0)2] (2)
=1
L2E[
L∑j=1
C2
i,jω′i,j
2] (3)
≈ 1
L2E[
L∑j=1
ω′i,j
2] =
σx2
L. (4)
Thus, the correlation degree between the PN-code and the(shifted) background traffic isΓ(Ci, ω
′i) ≈ σx√
L. Based on the
above discussion, the attacker can choose appropriate attackparameters (e.g., PN-code lengthL and mark traffic rateV )to make the correlation degree (V
2) (between the PN-code and
the attack mark traffic) much larger than the correlation degree( σx√
L) (between the PN-code and the background traffic). As
such, the attacker can accurately distinguish the attack marktraffic from the background traffic.
In the attack mark recognition, vectorλi is used to representthe queried report data, and vectorλ′
i is used to represent theshiftedreport data (by subtractingE(λi,j) from λi). Accordingto the above discussion,λ′
i = η′i +ω′
i (i.e., report data includethe attack traffic and the background traffic) orλ′
i = ω′i
(i.e., report data include only the background traffic). Theattacker uses the correlation degree betweenλ′
i and the PN-code Ci, i.e., Γ(Ci, λ
′i), to distinguish the above two cases
and determine the existence of a PN-code in the report data.If Γ(Ci, λ
′i) is larger than a thresholdTa
1, which is referred toas themark decoding threshold, then the attacker determinesthat the report contains attack traffic as well as the PN-codeCi, and decides whether the target network is deployed withmonitors or not. The accuracy of the correlation degree-basedrecognition scheme is analyzed and evaluated in Sections III,IV and V.
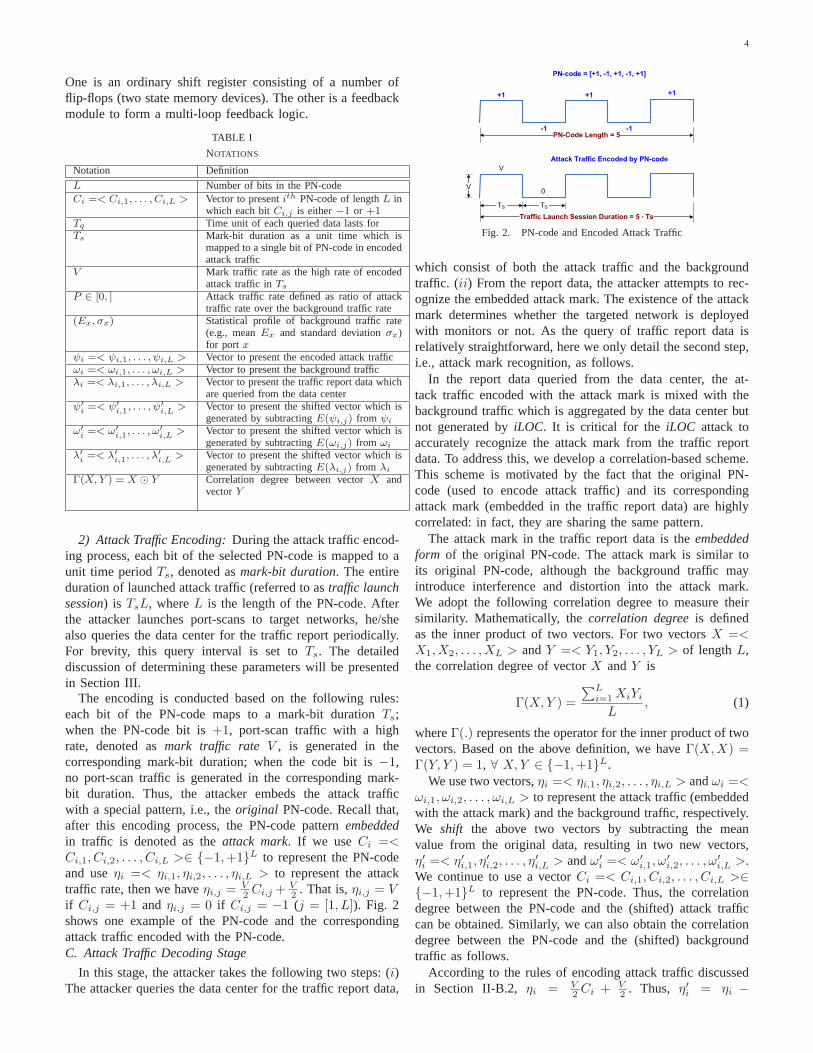
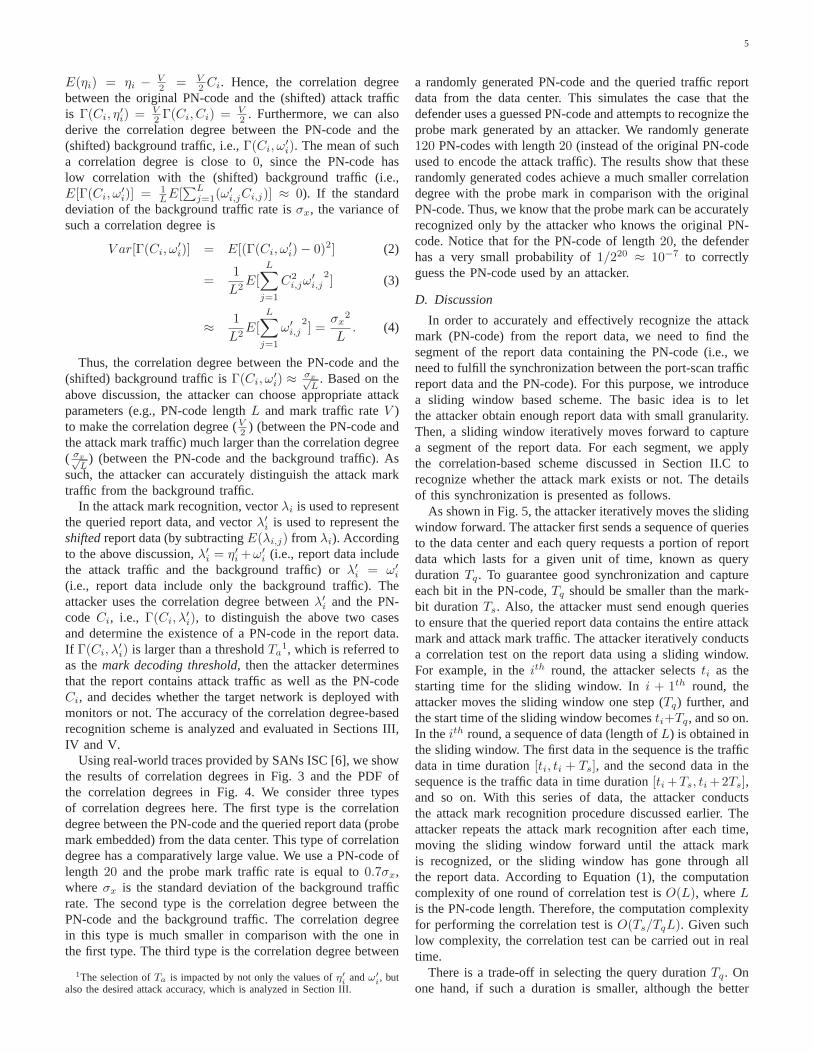
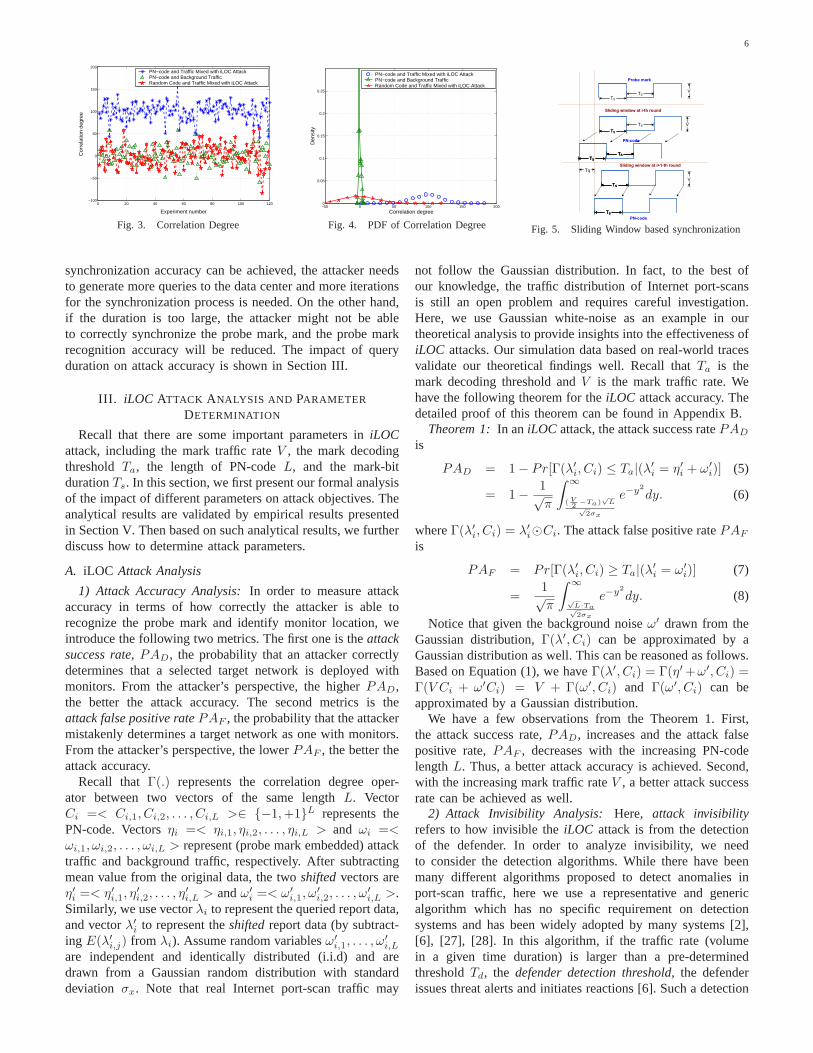
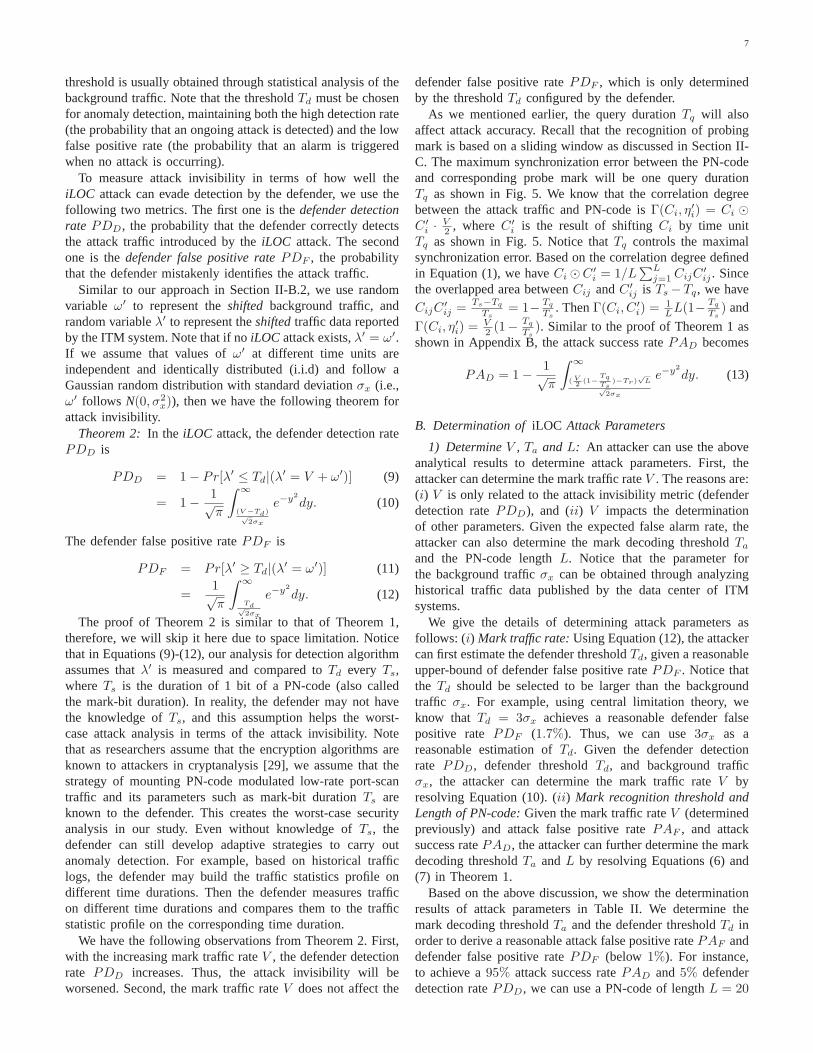
Using real-world traces provided by SANs ISC [6], we showthe results of correlation degrees in Fig. 3 and the PDF ofthe correlation degrees in Fig. 4. We consider three typesof correlation degrees here. The first type is the correlationdegree between the PN-code and the queried report data (probemark embedded) from the data center. This type of correlationdegree has a comparatively large value. We use a PN-code oflength 20 and the probe mark traffic rate is equal to0.7σx,whereσx is the standard deviation of the background trafficrate. The second type is the correlation degree between thePN-code and the background traffic. The correlation degreein this type is much smaller in comparison with the one inthe first type. The third type is the correlation degree between
1The selection ofTa is impacted by not only the values ofη′i
andω′
i, but
also the desired attack accuracy, which is analyzed in Section III.
a randomly generated PN-code and the queried traffic reportdata from the data center. This simulates the case that thedefender uses a guessed PN-code and attempts to recognize theprobe mark generated by an attacker. We randomly generate120 PN-codes with length20 (instead of the original PN-codeused to encode the attack traffic). The results show that theserandomly generated codes achieve a much smaller correlationdegree with the probe mark in comparison with the originalPN-code. Thus, we know that the probe mark can be accuratelyrecognized only by the attacker who knows the original PN-code. Notice that for the PN-code of length20, the defenderhas a very small probability of1/220 ≈ 10−7 to correctlyguess the PN-code used by an attacker.
D. Discussion
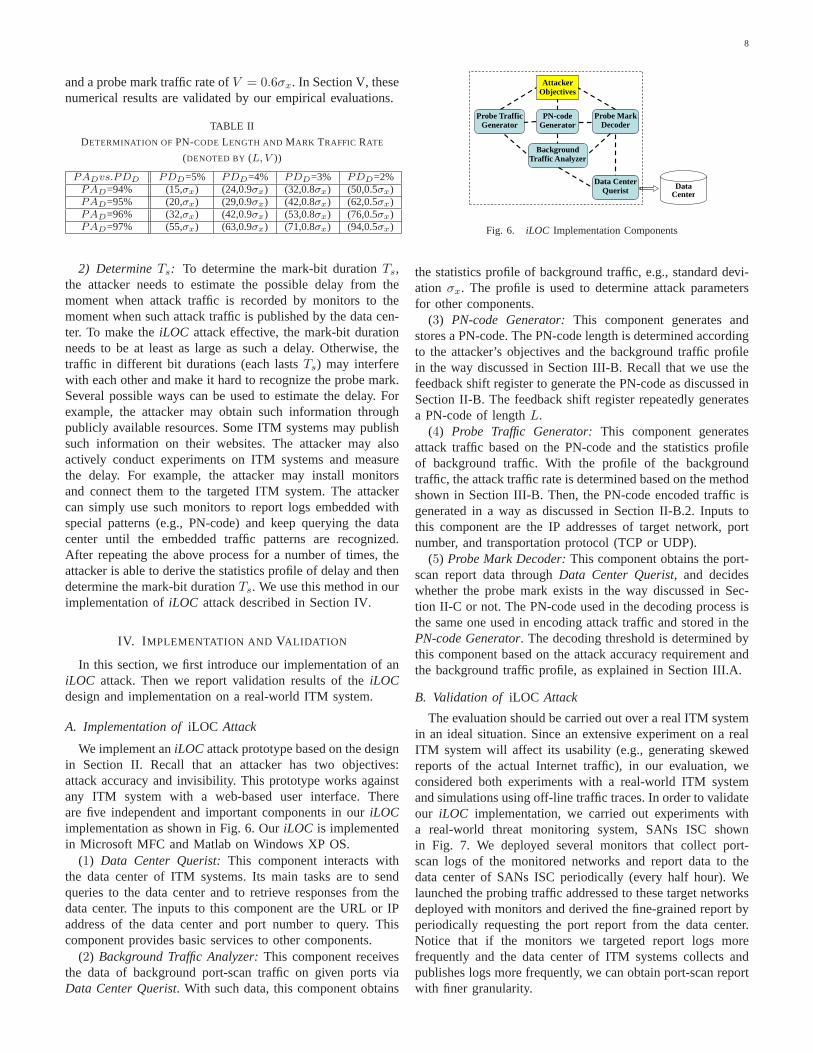
In order to accurately and effectively recognize the attackmark (PN-code) from the report data, we need to find thesegment of the report data containing the PN-code (i.e., weneed to fulfill the synchronization between the port-scan trafficreport data and the PN-code). For this purpose, we introducea sliding window based scheme. The basic idea is to letthe attacker obtain enough report data with small granularity.Then, a sliding window iteratively moves forward to capturea segment of the report data. For each segment, we applythe correlation-based scheme discussed in Section II.C torecognize whether the attack mark exists or not. The detailsof this synchronization is presented as follows.
As shown in Fig. 5, the attacker iteratively moves the slidingwindow forward. The attacker first sends a sequence of queriesto the data center and each query requests a portion of reportdata which lasts for a given unit of time, known as querydurationTq. To guarantee good synchronization and captureeach bit in the PN-code,Tq should be smaller than the mark-bit durationTs. Also, the attacker must send enough queriesto ensure that the queried report data contains the entire attackmark and attack mark traffic. The attacker iteratively conductsa correlation test on the report data using a sliding window.For example, in theith round, the attacker selectsti as thestarting time for the sliding window. Ini + 1th round, theattacker moves the sliding window one step (Tq) further, andthe start time of the sliding window becomesti+Tq, and so on.In theith round, a sequence of data (length ofL) is obtained inthe sliding window. The first data in the sequence is the trafficdata in time duration[ti, ti + Ts], and the second data in thesequence is the traffic data in time duration[ti +Ts, ti +2Ts],and so on. With this series of data, the attacker conductsthe attack mark recognition procedure discussed earlier. Theattacker repeats the attack mark recognition after each time,moving the sliding window forward until the attack markis recognized, or the sliding window has gone through allthe report data. According to Equation (1), the computationcomplexity of one round of correlation test isO(L), whereLis the PN-code length. Therefore, the computation complexityfor performing the correlation test isO(Ts/TqL). Given suchlow complexity, the correlation test can be carried out in realtime.
There is a trade-off in selecting the query durationTq. Onone hand, if such a duration is smaller, although the better
6
0 20 40 60 80 100 120−100
−50
0
50
100
150
200
Experiment number
Cor
rela
tion
degr
ee
PN−code and Traffic Mixed with iLOC AttackPN−code and Background TrafficRandom Code and Traffic Mixed with iLOC Attack
Fig. 3. Correlation Degree
−50 0 50 100 150 2000
0.05
0.1
0.15
0.2
0.25
Correlation degree
Den
sity
PN−code and Traffic Mixed with iLOC AttackPN−code and Background TrafficRandom Code and Traffic Mixed with iLOC Attack
Fig. 4. PDF of Correlation Degree
Sliding window at i-th round
Probe mark
PN-code
Sliding window at i+1-th round
PN-code
V
V
V
TS
TS
TSTS
TS
TSTSTS
TSTSTS
TSTSTS
TSTSTS
Tq
Fig. 5. Sliding Window based synchronization
synchronization accuracy can be achieved, the attacker needsto generate more queries to the data center and more iterationsfor the synchronization process is needed. On the other hand,if the duration is too large, the attacker might not be ableto correctly synchronize the probe mark, and the probe markrecognition accuracy will be reduced. The impact of queryduration on attack accuracy is shown in Section III.
III. iLOC ATTACK ANALYSIS AND PARAMETER
DETERMINATION
Recall that there are some important parameters iniLOCattack, including the mark traffic rateV , the mark decodingthreshold Ta, the length of PN-codeL, and the mark-bitdurationTs. In this section, we first present our formal analysisof the impact of different parameters on attack objectives.Theanalytical results are validated by empirical results presentedin Section V. Then based on such analytical results, we furtherdiscuss how to determine attack parameters.
A. iLOC Attack Analysis
1) Attack Accuracy Analysis:In order to measure attackaccuracy in terms of how correctly the attacker is able torecognize the probe mark and identify monitor location, weintroduce the following two metrics. The first one is theattacksuccess rate, PAD, the probability that an attacker correctlydetermines that a selected target network is deployed withmonitors. From the attacker’s perspective, the higherPAD,the better the attack accuracy. The second metrics is theattack false positive ratePAF , the probability that the attackermistakenly determines a target network as one with monitors.From the attacker’s perspective, the lowerPAF , the better theattack accuracy.
Recall that Γ(.) represents the correlation degree oper-ator between two vectors of the same lengthL. VectorCi =< Ci,1, Ci,2, . . . , Ci,L >∈ {−1,+1}L represents thePN-code. Vectorsηi =< ηi,1, ηi,2, . . . , ηi,L > and ωi =<ωi,1, ωi,2, . . . , ωi,L > represent (probe mark embedded) attacktraffic and background traffic, respectively. After subtractingmean value from the original data, the twoshiftedvectors areη′
i =< η′i,1, η
′i,2, . . . , η
′i,L > andω′
i =< ω′i,1, ω
′i,2, . . . , ω
′i,L >.
Similarly, we use vectorλi to represent the queried report data,and vectorλ′
i to represent theshiftedreport data (by subtract-ing E(λ′
i,j) from λi). Assume random variablesω′i,1, . . . , ω
′i,L
are independent and identically distributed (i.i.d) and aredrawn from a Gaussian random distribution with standarddeviation σx. Note that real Internet port-scan traffic may
not follow the Gaussian distribution. In fact, to the best ofour knowledge, the traffic distribution of Internet port-scansis still an open problem and requires careful investigation.Here, we use Gaussian white-noise as an example in ourtheoretical analysis to provide insights into the effectiveness ofiLOC attacks. Our simulation data based on real-world tracesvalidate our theoretical findings well. Recall thatTa is themark decoding threshold andV is the mark traffic rate. Wehave the following theorem for theiLOC attack accuracy. Thedetailed proof of this theorem can be found in Appendix B.
Theorem 1:In an iLOC attack, the attack success ratePAD
is
PAD = 1 − Pr[Γ(λ′i, Ci) ≤ Ta|(λ′
i = η′i + ω′
i)] (5)
= 1 − 1√π
∫ ∞
( V2
−Ta)√
L√
2σx
e−y2
dy. (6)
whereΓ(λ′i, Ci) = λ′
i⊙Ci. The attack false positive ratePAF
is
PAF = Pr[Γ(λ′i, Ci) ≥ Ta|(λ′
i = ω′i)] (7)
=1√π
∫ ∞
√
L·Ta√
2σx
e−y2
dy. (8)
Notice that given the background noiseω′ drawn from theGaussian distribution,Γ(λ′, Ci) can be approximated by aGaussian distribution as well. This can be reasoned as follows.Based on Equation (1), we haveΓ(λ′, Ci) = Γ(η′ +ω′, Ci) =Γ(V Ci + ω′Ci) = V + Γ(ω′, Ci) and Γ(ω′, Ci) can beapproximated by a Gaussian distribution.
We have a few observations from the Theorem 1. First,the attack success rate,PAD, increases and the attack falsepositive rate,PAF , decreases with the increasing PN-codelengthL. Thus, a better attack accuracy is achieved. Second,with the increasing mark traffic rateV , a better attack successrate can be achieved as well.
2) Attack Invisibility Analysis: Here, attack invisibilityrefers to how invisible theiLOC attack is from the detectionof the defender. In order to analyze invisibility, we needto consider the detection algorithms. While there have beenmany different algorithms proposed to detect anomalies inport-scan traffic, here we use a representative and genericalgorithm which has no specific requirement on detectionsystems and has been widely adopted by many systems [2],[6], [27], [28]. In this algorithm, if the traffic rate (volumein a given time duration) is larger than a pre-determinedthresholdTd, the defender detection threshold, the defenderissues threat alerts and initiates reactions [6]. Such a detection
7
threshold is usually obtained through statistical analysis of thebackground traffic. Note that the thresholdTd must be chosenfor anomaly detection, maintaining both the high detectionrate(the probability that an ongoing attack is detected) and thelowfalse positive rate (the probability that an alarm is triggeredwhen no attack is occurring).
To measure attack invisibility in terms of how well theiLOC attack can evade detection by the defender, we use thefollowing two metrics. The first one is thedefender detectionrate PDD, the probability that the defender correctly detectsthe attack traffic introduced by theiLOC attack. The secondone is thedefender false positive ratePDF , the probabilitythat the defender mistakenly identifies the attack traffic.
Similar to our approach in Section II-B.2, we use randomvariable ω′ to represent theshifted background traffic, andrandom variableλ′ to represent theshiftedtraffic data reportedby the ITM system. Note that if noiLOC attack exists,λ′ = ω′.If we assume that values ofω′ at different time units areindependent and identically distributed (i.i.d) and follow aGaussian random distribution with standard deviationσx (i.e.,ω′ follows N(0, σ2
x)), then we have the following theorem forattack invisibility.
Theorem 2:In the iLOC attack, the defender detection ratePDD is
PDD = 1 − Pr[λ′ ≤ Td|(λ′ = V + ω′)] (9)
= 1 − 1√π
∫ ∞
(V −Td)√
2σx
e−y2
dy. (10)
The defender false positive ratePDF is
PDF = Pr[λ′ ≥ Td|(λ′ = ω′)] (11)
=1√π
∫ ∞
Td√
2σx
e−y2
dy. (12)
The proof of Theorem 2 is similar to that of Theorem 1,therefore, we will skip it here due to space limitation. Noticethat in Equations (9)-(12), our analysis for detection algorithmassumes thatλ′ is measured and compared toTd every Ts,whereTs is the duration of 1 bit of a PN-code (also calledthe mark-bit duration). In reality, the defender may not havethe knowledge ofTs, and this assumption helps the worst-case attack analysis in terms of the attack invisibility. Notethat as researchers assume that the encryption algorithms areknown to attackers in cryptanalysis [29], we assume that thestrategy of mounting PN-code modulated low-rate port-scantraffic and its parameters such as mark-bit durationTs areknown to the defender. This creates the worst-case securityanalysis in our study. Even without knowledge ofTs, thedefender can still develop adaptive strategies to carry outanomaly detection. For example, based on historical trafficlogs, the defender may build the traffic statistics profile ondifferent time durations. Then the defender measures trafficon different time durations and compares them to the trafficstatistic profile on the corresponding time duration.
We have the following observations from Theorem 2. First,with the increasing mark traffic rateV , the defender detectionrate PDD increases. Thus, the attack invisibility will beworsened. Second, the mark traffic rateV does not affect the
defender false positive ratePDF , which is only determinedby the thresholdTd configured by the defender.
As we mentioned earlier, the query durationTq will alsoaffect attack accuracy. Recall that the recognition of probingmark is based on a sliding window as discussed in Section II-C. The maximum synchronization error between the PN-codeand corresponding probe mark will be one query durationTq as shown in Fig. 5. We know that the correlation degreebetween the attack traffic and PN-code isΓ(Ci, η
′i) = Ci ⊙
C ′i · V
2, where C ′
i is the result of shiftingCi by time unitTq as shown in Fig. 5. Notice thatTq controls the maximalsynchronization error. Based on the correlation degree definedin Equation (1), we haveCi ⊙C ′
i = 1/L∑L
j=1CijC
′ij . Since
the overlapped area betweenCij andC ′ij is Ts −Tq, we have
CijC′ij =
Ts−Tq
Ts= 1− Tq
Ts. ThenΓ(Ci, C
′i) = 1
LL(1− Tq
Ts) and
Γ(Ci, η′i) = V
2(1− Tq
Ts). Similar to the proof of Theorem 1 as
shown in Appendix B, the attack success ratePAD becomes
PAD = 1 − 1√π
∫ ∞
( V2
(1−Tq
Ts)−Tr)
√
L√
2σx
e−y2
dy. (13)
B. Determination ofiLOC Attack Parameters
1) DetermineV , Ta andL: An attacker can use the aboveanalytical results to determine attack parameters. First,theattacker can determine the mark traffic rateV . The reasons are:(i) V is only related to the attack invisibility metric (defenderdetection ratePDD), and (ii) V impacts the determinationof other parameters. Given the expected false alarm rate, theattacker can also determine the mark decoding thresholdTa
and the PN-code lengthL. Notice that the parameter forthe background trafficσx can be obtained through analyzinghistorical traffic data published by the data center of ITMsystems.
We give the details of determining attack parameters asfollows: (i) Mark traffic rate:Using Equation (12), the attackercan first estimate the defender thresholdTd, given a reasonableupper-bound of defender false positive ratePDF . Notice thatthe Td should be selected to be larger than the backgroundtraffic σx. For example, using central limitation theory, weknow that Td = 3σx achieves a reasonable defender falsepositive rate PDF (1.7%). Thus, we can use3σx as areasonable estimation ofTd. Given the defender detectionrate PDD, defender thresholdTd, and background trafficσx, the attacker can determine the mark traffic rateV byresolving Equation (10). (ii) Mark recognition threshold andLength of PN-code:Given the mark traffic rateV (determinedpreviously) and attack false positive ratePAF , and attacksuccess ratePAD, the attacker can further determine the markdecoding thresholdTa andL by resolving Equations (6) and(7) in Theorem 1.
Based on the above discussion, we show the determinationresults of attack parameters in Table II. We determine themark decoding thresholdTa and the defender thresholdTd inorder to derive a reasonable attack false positive ratePAF anddefender false positive ratePDF (below 1%). For instance,to achieve a95% attack success ratePAD and5% defenderdetection ratePDD, we can use a PN-code of lengthL = 20
8
and a probe mark traffic rate ofV = 0.6σx. In Section V, thesenumerical results are validated by our empirical evaluations.
TABLE II
DETERMINATION OF PN-CODE LENGTH AND MARK TRAFFIC RATE
(DENOTED BY (L, V ))
PADvs.PDD PDD=5% PDD=4% PDD=3% PDD=2%PAD=94% (15,σx) (24,0.9σx) (32,0.8σx) (50,0.5σx)PAD=95% (20,σx) (29,0.9σx) (42,0.8σx) (62,0.5σx)PAD=96% (32,σx) (42,0.9σx) (53,0.8σx) (76,0.5σx)PAD=97% (55,σx) (63,0.9σx) (71,0.8σx) (94,0.5σx)
2) DetermineTs: To determine the mark-bit durationTs,the attacker needs to estimate the possible delay from themoment when attack traffic is recorded by monitors to themoment when such attack traffic is published by the data cen-ter. To make theiLOC attack effective, the mark-bit durationneeds to be at least as large as such a delay. Otherwise, thetraffic in different bit durations (each lastsTs) may interferewith each other and make it hard to recognize the probe mark.Several possible ways can be used to estimate the delay. Forexample, the attacker may obtain such information throughpublicly available resources. Some ITM systems may publishsuch information on their websites. The attacker may alsoactively conduct experiments on ITM systems and measurethe delay. For example, the attacker may install monitorsand connect them to the targeted ITM system. The attackercan simply use such monitors to report logs embedded withspecial patterns (e.g., PN-code) and keep querying the datacenter until the embedded traffic patterns are recognized.After repeating the above process for a number of times, theattacker is able to derive the statistics profile of delay andthendetermine the mark-bit durationTs. We use this method in ourimplementation ofiLOC attack described in Section IV.
IV. I MPLEMENTATION AND VALIDATION
In this section, we first introduce our implementation of aniLOC attack. Then we report validation results of theiLOCdesign and implementation on a real-world ITM system.
A. Implementation ofiLOC Attack
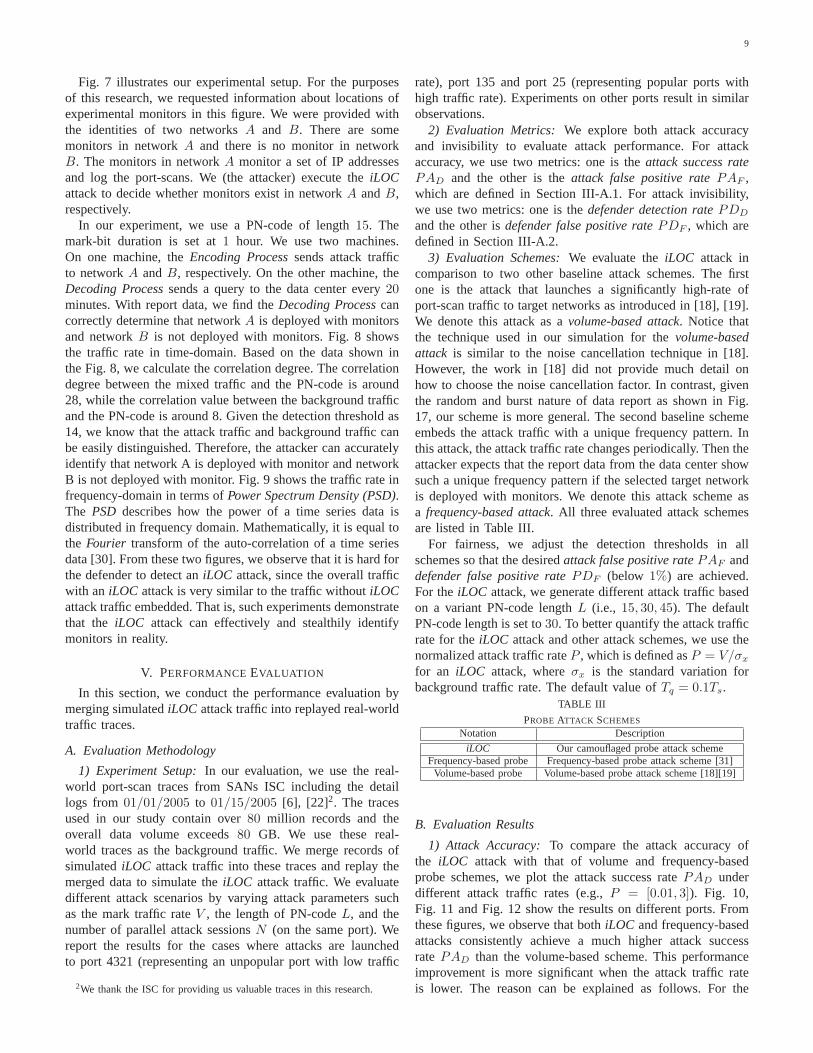
We implement aniLOC attack prototype based on the designin Section II. Recall that an attacker has two objectives:attack accuracy and invisibility. This prototype works againstany ITM system with a web-based user interface. Thereare five independent and important components in ouriLOCimplementation as shown in Fig. 6. OuriLOC is implementedin Microsoft MFC and Matlab on Windows XP OS.
(1) Data Center Querist:This component interacts withthe data center of ITM systems. Its main tasks are to sendqueries to the data center and to retrieve responses from thedata center. The inputs to this component are the URL or IPaddress of the data center and port number to query. Thiscomponent provides basic services to other components.
(2) Background Traffic Analyzer:This component receivesthe data of background port-scan traffic on given ports viaData Center Querist. With such data, this component obtains
Background Traffic Analyzer
PN-code Generator
Probe Mark Decoder
Probe Traffic Generator
Attacker Objectives
Data Center Querist Data
Center
Fig. 6. iLOC Implementation Components
the statistics profile of background traffic, e.g., standarddevi-ation σx. The profile is used to determine attack parametersfor other components.
(3) PN-code Generator:This component generates andstores a PN-code. The PN-code length is determined accordingto the attacker’s objectives and the background traffic profilein the way discussed in Section III-B. Recall that we use thefeedback shift register to generate the PN-code as discussed inSection II-B. The feedback shift register repeatedly generatesa PN-code of lengthL.
(4) Probe Traffic Generator:This component generatesattack traffic based on the PN-code and the statistics profileof background traffic. With the profile of the backgroundtraffic, the attack traffic rate is determined based on the methodshown in Section III-B. Then, the PN-code encoded traffic isgenerated in a way as discussed in Section II-B.2. Inputs tothis component are the IP addresses of target network, portnumber, and transportation protocol (TCP or UDP).
(5) Probe Mark Decoder:This component obtains the port-scan report data throughData Center Querist, and decideswhether the probe mark exists in the way discussed in Sec-tion II-C or not. The PN-code used in the decoding process isthe same one used in encoding attack traffic and stored in thePN-code Generator. The decoding threshold is determined bythis component based on the attack accuracy requirement andthe background traffic profile, as explained in Section III.A.
B. Validation of iLOC Attack
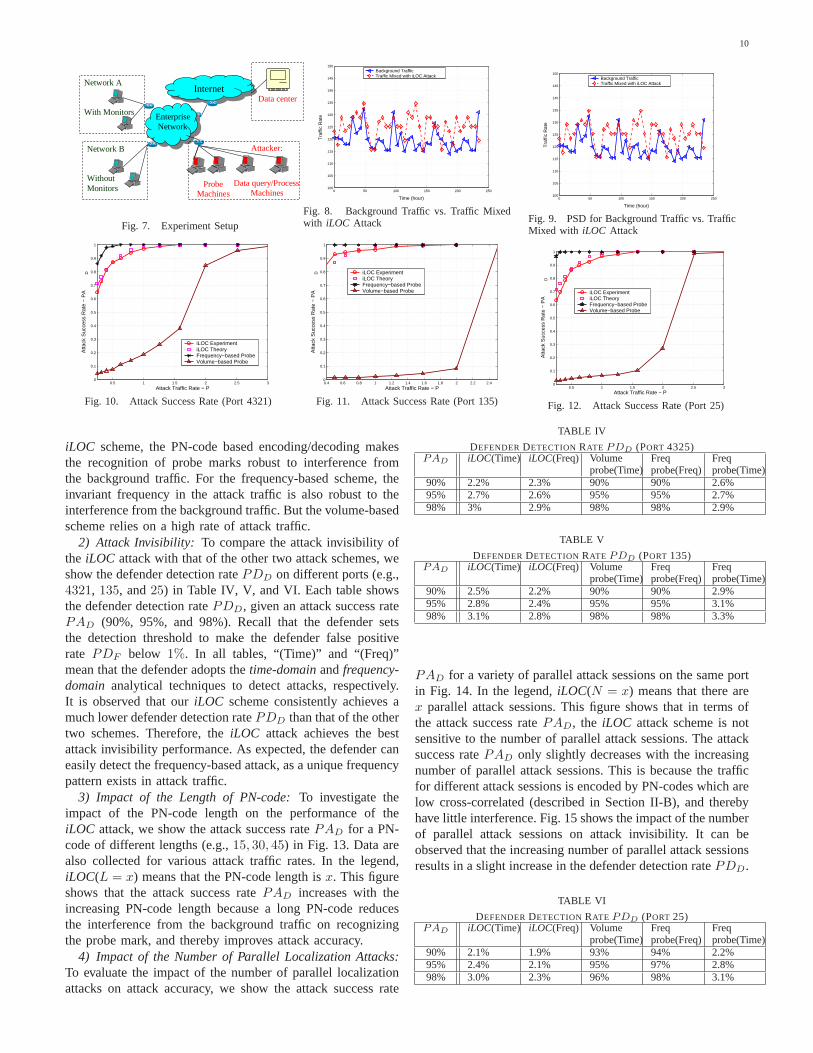
The evaluation should be carried out over a real ITM systemin an ideal situation. Since an extensive experiment on a realITM system will affect its usability (e.g., generating skewedreports of the actual Internet traffic), in our evaluation, weconsidered both experiments with a real-world ITM systemand simulations using off-line traffic traces. In order to validateour iLOC implementation, we carried out experiments witha real-world threat monitoring system, SANs ISC shownin Fig. 7. We deployed several monitors that collect port-scan logs of the monitored networks and report data to thedata center of SANs ISC periodically (every half hour). Welaunched the probing traffic addressed to these target networksdeployed with monitors and derived the fine-grained report byperiodically requesting the port report from the data center.Notice that if the monitors we targeted report logs morefrequently and the data center of ITM systems collects andpublishes logs more frequently, we can obtain port-scan reportwith finer granularity.
9
Fig. 7 illustrates our experimental setup. For the purposesof this research, we requested information about locationsofexperimental monitors in this figure. We were provided withthe identities of two networksA and B. There are somemonitors in networkA and there is no monitor in networkB. The monitors in networkA monitor a set of IP addressesand log the port-scans. We (the attacker) execute theiLOCattack to decide whether monitors exist in networkA andB,respectively.
In our experiment, we use a PN-code of length15. Themark-bit duration is set at1 hour. We use two machines.On one machine, theEncoding Processsends attack trafficto networkA andB, respectively. On the other machine, theDecoding Processsends a query to the data center every20minutes. With report data, we find theDecoding Processcancorrectly determine that networkA is deployed with monitorsand networkB is not deployed with monitors. Fig. 8 showsthe traffic rate in time-domain. Based on the data shown inthe Fig. 8, we calculate the correlation degree. The correlationdegree between the mixed traffic and the PN-code is around28, while the correlation value between the background trafficand the PN-code is around 8. Given the detection threshold as14, we know that the attack traffic and background traffic canbe easily distinguished. Therefore, the attacker can accuratelyidentify that network A is deployed with monitor and networkB is not deployed with monitor. Fig. 9 shows the traffic rate infrequency-domain in terms ofPower Spectrum Density (PSD).The PSD describes how the power of a time series data isdistributed in frequency domain. Mathematically, it is equal tothe Fourier transform of the auto-correlation of a time seriesdata [30]. From these two figures, we observe that it is hard forthe defender to detect aniLOC attack, since the overall trafficwith an iLOC attack is very similar to the traffic withoutiLOCattack traffic embedded. That is, such experiments demonstratethat the iLOC attack can effectively and stealthily identifymonitors in reality.
V. PERFORMANCEEVALUATION
In this section, we conduct the performance evaluation bymerging simulatediLOC attack traffic into replayed real-worldtraffic traces.
A. Evaluation Methodology
1) Experiment Setup:In our evaluation, we use the real-world port-scan traces from SANs ISC including the detaillogs from 01/01/2005 to 01/15/2005 [6], [22]2. The tracesused in our study contain over80 million records and theoverall data volume exceeds80 GB. We use these real-world traces as the background traffic. We merge records ofsimulatediLOC attack traffic into these traces and replay themerged data to simulate theiLOC attack traffic. We evaluatedifferent attack scenarios by varying attack parameters suchas the mark traffic rateV , the length of PN-codeL, and thenumber of parallel attack sessionsN (on the same port). Wereport the results for the cases where attacks are launchedto port 4321 (representing an unpopular port with low traffic
2We thank the ISC for providing us valuable traces in this research.
rate), port 135 and port 25 (representing popular ports withhigh traffic rate). Experiments on other ports result in similarobservations.
2) Evaluation Metrics: We explore both attack accuracyand invisibility to evaluate attack performance. For attackaccuracy, we use two metrics: one is theattack success ratePAD and the other is theattack false positive ratePAF ,which are defined in Section III-A.1. For attack invisibility,we use two metrics: one is thedefender detection ratePDD
and the other isdefender false positive ratePDF , which aredefined in Section III-A.2.
3) Evaluation Schemes:We evaluate theiLOC attack incomparison to two other baseline attack schemes. The firstone is the attack that launches a significantly high-rate ofport-scan traffic to target networks as introduced in [18], [19].We denote this attack as avolume-based attack. Notice thatthe technique used in our simulation for thevolume-basedattack is similar to the noise cancellation technique in [18].However, the work in [18] did not provide much detail onhow to choose the noise cancellation factor. In contrast, giventhe random and burst nature of data report as shown in Fig.17, our scheme is more general. The second baseline schemeembeds the attack traffic with a unique frequency pattern. Inthis attack, the attack traffic rate changes periodically. Then theattacker expects that the report data from the data center showsuch a unique frequency pattern if the selected target networkis deployed with monitors. We denote this attack scheme asa frequency-based attack. All three evaluated attack schemesare listed in Table III.
For fairness, we adjust the detection thresholds in allschemes so that the desiredattack false positive ratePAF anddefender false positive ratePDF (below 1%) are achieved.For theiLOC attack, we generate different attack traffic basedon a variant PN-code lengthL (i.e., 15, 30, 45). The defaultPN-code length is set to30. To better quantify the attack trafficrate for theiLOC attack and other attack schemes, we use thenormalized attack traffic rateP , which is defined asP = V/σx
for an iLOC attack, whereσx is the standard variation forbackground traffic rate. The default value ofTq = 0.1Ts.
TABLE III
PROBE ATTACK SCHEMES
Notation Description
iLOC Our camouflaged probe attack schemeFrequency-based probe Frequency-based probe attack scheme [31]
Volume-based probe Volume-based probe attack scheme [18][19]
B. Evaluation Results
1) Attack Accuracy:To compare the attack accuracy ofthe iLOC attack with that of volume and frequency-basedprobe schemes, we plot the attack success ratePAD underdifferent attack traffic rates (e.g.,P = [0.01, 3]). Fig. 10,Fig. 11 and Fig. 12 show the results on different ports. Fromthese figures, we observe that bothiLOC and frequency-basedattacks consistently achieve a much higher attack successrate PAD than the volume-based scheme. This performanceimprovement is more significant when the attack traffic rateis lower. The reason can be explained as follows. For the
10
Network B Without Monitors
R1
Probe Machines
Attacker:
Internet
Enterprise Network
Data query/Process Machines
Data center
Network A With Monitors
Fig. 7. Experiment Setup
0 50 100 150 200 250100
105
110
115
120
125
130
135
140
145
150
Time (hour)
Tra
ffic
Rat
e
Background TrafficTraffic Mixed with iLOC Attack
Fig. 8. Background Traffic vs. Traffic Mixedwith iLOC Attack
0 50 100 150 200 250100
105
110
115
120
125
130
135
140
145
150
Time (hour)
Tra
ffic
Rat
e
Background TrafficTraffic Mixed with iLOC Attack
Fig. 9. PSD for Background Traffic vs. TrafficMixed with iLOC Attack
0.5 1 1.5 2 2.5 30
0.1
0.2
0.3
0.4
0.5
0.6
0.7
0.8
0.9
1
Attack Traffic Rate − P
Atta
ck S
ucce
ss R
ate
− P
AD
iLOC ExperimentiLOC TheoryFrequency−based ProbeVolume−based Probe
Fig. 10. Attack Success Rate (Port 4321)
0.4 0.6 0.8 1 1.2 1.4 1.6 1.8 2 2.2 2.40
0.1
0.2
0.3
0.4
0.5
0.6
0.7
0.8
0.9
1
Attack Traffic Rate − P
Atta
ck S
ucce
ss R
ate
− P
AD iLOC Experiment
iLOC TheoryFrequency−based ProbeVolume−based Probe
Fig. 11. Attack Success Rate (Port 135)
0.5 1 1.5 2 2.5 30
0.1
0.2
0.3
0.4
0.5
0.6
0.7
0.8
0.9
1
Attack Traffic Rate − P
Atta
ck S
ucce
ss R
ate
− P
AD
iLOC ExperimentiLOC TheoryFrequency−based ProbeVolume−based Probe
Fig. 12. Attack Success Rate (Port 25)
iLOC scheme, the PN-code based encoding/decoding makesthe recognition of probe marks robust to interference fromthe background traffic. For the frequency-based scheme, theinvariant frequency in the attack traffic is also robust to theinterference from the background traffic. But the volume-basedscheme relies on a high rate of attack traffic.
2) Attack Invisibility: To compare the attack invisibility ofthe iLOC attack with that of the other two attack schemes, weshow the defender detection ratePDD on different ports (e.g.,4321, 135, and25) in Table IV, V, and VI. Each table showsthe defender detection ratePDD, given an attack success ratePAD (90%, 95%, and 98%). Recall that the defender setsthe detection threshold to make the defender false positiverate PDF below 1%. In all tables, “(Time)” and “(Freq)”mean that the defender adopts thetime-domainandfrequency-domain analytical techniques to detect attacks, respectively.It is observed that ouriLOC scheme consistently achieves amuch lower defender detection ratePDD than that of the othertwo schemes. Therefore, theiLOC attack achieves the bestattack invisibility performance. As expected, the defender caneasily detect the frequency-based attack, as a unique frequencypattern exists in attack traffic.
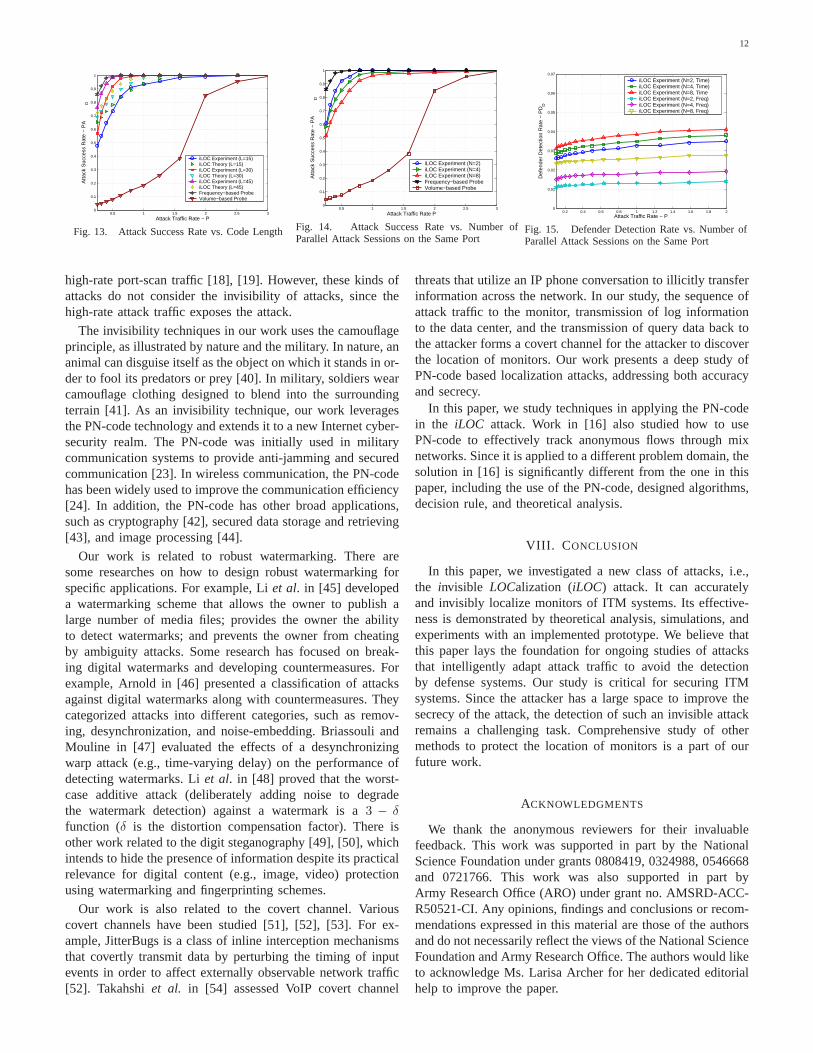
3) Impact of the Length of PN-code:To investigate theimpact of the PN-code length on the performance of theiLOC attack, we show the attack success ratePAD for a PN-code of different lengths (e.g.,15, 30, 45) in Fig. 13. Data arealso collected for various attack traffic rates. In the legend,iLOC(L = x) means that the PN-code length isx. This figureshows that the attack success ratePAD increases with theincreasing PN-code length because a long PN-code reducesthe interference from the background traffic on recognizingthe probe mark, and thereby improves attack accuracy.
4) Impact of the Number of Parallel Localization Attacks:To evaluate the impact of the number of parallel localizationattacks on attack accuracy, we show the attack success rate
TABLE IV
DEFENDERDETECTION RATE PDD (PORT 4325)PAD iLOC(Time) iLOC(Freq) Volume
probe(Time)Freqprobe(Freq)
Freqprobe(Time)
90% 2.2% 2.3% 90% 90% 2.6%95% 2.7% 2.6% 95% 95% 2.7%98% 3% 2.9% 98% 98% 2.9%
TABLE V
DEFENDERDETECTION RATE PDD (PORT 135)PAD iLOC(Time) iLOC(Freq) Volume
probe(Time)Freqprobe(Freq)
Freqprobe(Time)
90% 2.5% 2.2% 90% 90% 2.9%95% 2.8% 2.4% 95% 95% 3.1%98% 3.1% 2.8% 98% 98% 3.3%
PAD for a variety of parallel attack sessions on the same portin Fig. 14. In the legend,iLOC(N = x) means that there arex parallel attack sessions. This figure shows that in terms ofthe attack success ratePAD, the iLOC attack scheme is notsensitive to the number of parallel attack sessions. The attacksuccess ratePAD only slightly decreases with the increasingnumber of parallel attack sessions. This is because the trafficfor different attack sessions is encoded by PN-codes which arelow cross-correlated (described in Section II-B), and therebyhave little interference. Fig. 15 shows the impact of the numberof parallel attack sessions on attack invisibility. It can beobserved that the increasing number of parallel attack sessionsresults in a slight increase in the defender detection ratePDD.
TABLE VI
DEFENDERDETECTION RATE PDD (PORT 25)PAD iLOC(Time) iLOC(Freq) Volume
probe(Time)Freqprobe(Freq)
Freqprobe(Time)
90% 2.1% 1.9% 93% 94% 2.2%95% 2.4% 2.1% 95% 97% 2.8%98% 3.0% 2.3% 96% 98% 3.1%
11
0.05 0.1 0.15 0.2 0.25 0.30.5
0.55
0.6
0.65
0.7
0.75
0.8
0.85
0.9
0.95
1
Atta
ck S
ucce
ss R
ate
− P
AD
iLOC Experiment(L=15)iLOC Theory(L=15)iLOC Experiment(L=30)iLOC Theory(L=30)iLOC Experiment(L=45)iLOC Theory(L=45)
Query Duration − Tq
Fig. 16. Attack Accuracy vs. Query DurationTq
Therefore, parallel attack capability can significantly improvethe attack efficiency without compromising the effectiveness.
The iLOC attack achieves invisibility by using the PN-code,which causes a longer period for theiLOC attack than the onesin [18], [19]. Nevertheless, parallel features ofiLOC attack cansignificantly improve attack efficiency. In the following, weprovide one example to compare the efficiency of our attackwith the one in [18], [19]. This example demonstrates thatour attack is slower than the one in [18], [19] and the parallelfeature of our attack can effectively reduce the performancegap between our attack and the one in [18], [19]. Assume thata system that consists of1200 networks is attacked. Usingone port, the volume-based attack needs1200 time units toperform the attack task. To fulfill the same attack task,iLOCwith 4 attack sessions in parallel using a code length of 15can achieve the desired performance of attack accuracy andinvisibility as shown in Fig. 14. In this case, the total timeforiLOC attack is1200 × 15/4 = 4500 units, which is aroundfour times of the volume-based attack in [18], [19].
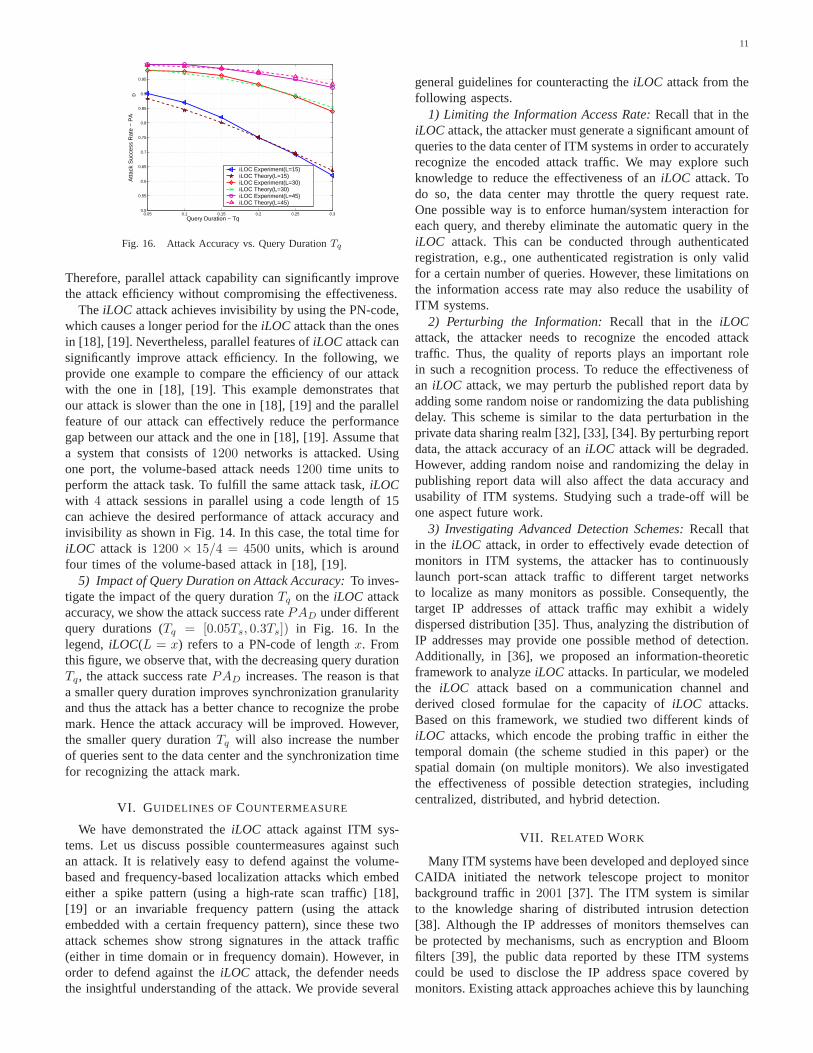
5) Impact of Query Duration on Attack Accuracy:To inves-tigate the impact of the query durationTq on theiLOC attackaccuracy, we show the attack success ratePAD under differentquery durations (Tq = [0.05Ts, 0.3Ts]) in Fig. 16. In thelegend,iLOC(L = x) refers to a PN-code of lengthx. Fromthis figure, we observe that, with the decreasing query durationTq, the attack success ratePAD increases. The reason is thata smaller query duration improves synchronization granularityand thus the attack has a better chance to recognize the probemark. Hence the attack accuracy will be improved. However,the smaller query durationTq will also increase the numberof queries sent to the data center and the synchronization timefor recognizing the attack mark.
VI. GUIDELINES OF COUNTERMEASURE
We have demonstrated theiLOC attack against ITM sys-tems. Let us discuss possible countermeasures against suchan attack. It is relatively easy to defend against the volume-based and frequency-based localization attacks which embedeither a spike pattern (using a high-rate scan traffic) [18],[19] or an invariable frequency pattern (using the attackembedded with a certain frequency pattern), since these twoattack schemes show strong signatures in the attack traffic(either in time domain or in frequency domain). However, inorder to defend against theiLOC attack, the defender needsthe insightful understanding of the attack. We provide several
general guidelines for counteracting theiLOC attack from thefollowing aspects.
1) Limiting the Information Access Rate:Recall that in theiLOC attack, the attacker must generate a significant amount ofqueries to the data center of ITM systems in order to accuratelyrecognize the encoded attack traffic. We may explore suchknowledge to reduce the effectiveness of aniLOC attack. Todo so, the data center may throttle the query request rate.One possible way is to enforce human/system interaction foreach query, and thereby eliminate the automatic query in theiLOC attack. This can be conducted through authenticatedregistration, e.g., one authenticated registration is only validfor a certain number of queries. However, these limitationsonthe information access rate may also reduce the usability ofITM systems.
2) Perturbing the Information:Recall that in theiLOCattack, the attacker needs to recognize the encoded attacktraffic. Thus, the quality of reports plays an important rolein such a recognition process. To reduce the effectiveness ofan iLOC attack, we may perturb the published report data byadding some random noise or randomizing the data publishingdelay. This scheme is similar to the data perturbation in theprivate data sharing realm [32], [33], [34]. By perturbing reportdata, the attack accuracy of aniLOC attack will be degraded.However, adding random noise and randomizing the delay inpublishing report data will also affect the data accuracy andusability of ITM systems. Studying such a trade-off will beone aspect future work.
3) Investigating Advanced Detection Schemes:Recall thatin the iLOC attack, in order to effectively evade detection ofmonitors in ITM systems, the attacker has to continuouslylaunch port-scan attack traffic to different target networksto localize as many monitors as possible. Consequently, thetarget IP addresses of attack traffic may exhibit a widelydispersed distribution [35]. Thus, analyzing the distribution ofIP addresses may provide one possible method of detection.Additionally, in [36], we proposed an information-theoreticframework to analyzeiLOC attacks. In particular, we modeledthe iLOC attack based on a communication channel andderived closed formulae for the capacity ofiLOC attacks.Based on this framework, we studied two different kinds ofiLOC attacks, which encode the probing traffic in either thetemporal domain (the scheme studied in this paper) or thespatial domain (on multiple monitors). We also investigatedthe effectiveness of possible detection strategies, includingcentralized, distributed, and hybrid detection.
VII. R ELATED WORK
Many ITM systems have been developed and deployed sinceCAIDA initiated the network telescope project to monitorbackground traffic in2001 [37]. The ITM system is similarto the knowledge sharing of distributed intrusion detection[38]. Although the IP addresses of monitors themselves canbe protected by mechanisms, such as encryption and Bloomfilters [39], the public data reported by these ITM systemscould be used to disclose the IP address space covered bymonitors. Existing attack approaches achieve this by launching
12
0.5 1 1.5 2 2.5 30
0.1
0.2
0.3
0.4
0.5
0.6
0.7
0.8
0.9
1
Attack Traffic Rate − P
Atta
ck S
ucce
ss R
ate
− P
AD
iLOC Experiment (L=15)iLOC Theory (L=15)iLOC Experiment (L=30)iLOC Theory (L=30)iLOC Experiment (L=45)iLOC Theory (L=45)Frequency−based ProbeVolume−based Probe
Fig. 13. Attack Success Rate vs. Code Length
0.5 1 1.5 2 2.5 30
0.1
0.2
0.3
0.4
0.5
0.6
0.7
0.8
0.9
1
Attack Traffic Rate P
Atta
ck S
ucce
ss R
ate
− P
AD
iLOC Experiment (N=2)iLOC Experiment (N=4)iLOC Experiment (N=8)Frequency−based ProbeVolume−based Probe
Fig. 14. Attack Success Rate vs. Number ofParallel Attack Sessions on the Same Port
0.2 0.4 0.6 0.8 1 1.2 1.4 1.6 1.8 20
0.01
0.02
0.03
0.04
0.05
0.06
0.07
Attack Traffic Rate − P
Def
ende
r D
etec
tion
Rat
e −
PD
D
iLOC Experiment (N=2, Time)iLOC Experiment (N=4, Time)iLOC Experiment (N=8, TimeiLOC Experiment (N=2, Freq)iLOC Experiment (N=4, Freq)iLOC Experiment (N=8, Freq)
Fig. 15. Defender Detection Rate vs. Number ofParallel Attack Sessions on the Same Port
high-rate port-scan traffic [18], [19]. However, these kinds ofattacks do not consider the invisibility of attacks, since thehigh-rate attack traffic exposes the attack.
The invisibility techniques in our work uses the camouflageprinciple, as illustrated by nature and the military. In nature, ananimal can disguise itself as the object on which it stands inor-der to fool its predators or prey [40]. In military, soldierswearcamouflage clothing designed to blend into the surroundingterrain [41]. As an invisibility technique, our work leveragesthe PN-code technology and extends it to a new Internet cyber-security realm. The PN-code was initially used in militarycommunication systems to provide anti-jamming and securedcommunication [23]. In wireless communication, the PN-codehas been widely used to improve the communication efficiency[24]. In addition, the PN-code has other broad applications,such as cryptography [42], secured data storage and retrieving[43], and image processing [44].
Our work is related to robust watermarking. There aresome researches on how to design robust watermarking forspecific applications. For example, Liet al. in [45] developeda watermarking scheme that allows the owner to publish alarge number of media files; provides the owner the abilityto detect watermarks; and prevents the owner from cheatingby ambiguity attacks. Some research has focused on break-ing digital watermarks and developing countermeasures. Forexample, Arnold in [46] presented a classification of attacksagainst digital watermarks along with countermeasures. Theycategorized attacks into different categories, such as remov-ing, desynchronization, and noise-embedding. BriassouliandMouline in [47] evaluated the effects of a desynchronizingwarp attack (e.g., time-varying delay) on the performance ofdetecting watermarks. Liet al. in [48] proved that the worst-case additive attack (deliberately adding noise to degradethe watermark detection) against a watermark is a3 − δfunction (δ is the distortion compensation factor). There isother work related to the digit steganography [49], [50], whichintends to hide the presence of information despite its practicalrelevance for digital content (e.g., image, video) protectionusing watermarking and fingerprinting schemes.
Our work is also related to the covert channel. Variouscovert channels have been studied [51], [52], [53]. For ex-ample, JitterBugs is a class of inline interception mechanismsthat covertly transmit data by perturbing the timing of inputevents in order to affect externally observable network traffic[52]. Takahshiet al. in [54] assessed VoIP covert channel
threats that utilize an IP phone conversation to illicitly transferinformation across the network. In our study, the sequence ofattack traffic to the monitor, transmission of log informationto the data center, and the transmission of query data back tothe attacker forms a covert channel for the attacker to discoverthe location of monitors. Our work presents a deep study ofPN-code based localization attacks, addressing both accuracyand secrecy.
In this paper, we study techniques in applying the PN-codein the iLOC attack. Work in [16] also studied how to usePN-code to effectively track anonymous flows through mixnetworks. Since it is applied to a different problem domain,thesolution in [16] is significantly different from the one in thispaper, including the use of the PN-code, designed algorithms,decision rule, and theoretical analysis.
VIII. C ONCLUSION
In this paper, we investigated a new class of attacks, i.e.,the invisible LOCalization (iLOC) attack. It can accuratelyand invisibly localize monitors of ITM systems. Its effective-ness is demonstrated by theoretical analysis, simulations, andexperiments with an implemented prototype. We believe thatthis paper lays the foundation for ongoing studies of attacksthat intelligently adapt attack traffic to avoid the detectionby defense systems. Our study is critical for securing ITMsystems. Since the attacker has a large space to improve thesecrecy of the attack, the detection of such an invisible attackremains a challenging task. Comprehensive study of othermethods to protect the location of monitors is a part of ourfuture work.
ACKNOWLEDGMENTS
We thank the anonymous reviewers for their invaluablefeedback. This work was supported in part by the NationalScience Foundation under grants 0808419, 0324988, 0546668and 0721766. This work was also supported in part byArmy Research Office (ARO) under grant no. AMSRD-ACC-R50521-CI. Any opinions, findings and conclusions or recom-mendations expressed in this material are those of the authorsand do not necessarily reflect the views of the National ScienceFoundation and Army Research Office. The authors would liketo acknowledge Ms. Larisa Archer for her dedicated editorialhelp to improve the paper.
13
REFERENCES
[1] D. Moore, C. Shannon, and J. Brown, “Code-red: a case study on thespread and victims of an internet worm,” inProceedings of the 2ndInternet Measurement Workshop (IMW), Marseille, France, November2002.
[2] D. Moore, V. Paxson, and S. Savage, “Inside the slammer worm,” IEEEMagazine of Security and Privacy, vol. 1, no. 4, pp. 33–39, 2003.
[3] W32/MyDoom.B Virus, http://www.us-cert.gov/cas/techalerts/TA04-028A.html .
[4] J. Mirkovic and P. Reiher, “A taxonomy of ddos attack and ddos defensemechanisms,”ACM SIGCOMM Computer Communication Review, vol.34, no. 2, pp. 39–54, 2004.
[5] Internet Security News, http://www.landfield.com/isn/mail-archive/2001/Feb/0037.html .
[6] SANS, Internet Storm Center, http://isc.sans.org/ .[7] D. Moore, G. M. Voelker, and S. Savage, “Infering internet deny-
of-service activity,” in Proceedings of the 10th USENIX SecuritySymposium (SECURITY), Washington, DC, Auguest 2001.
[8] V. Yegneswaran, P. Barford, and S. Jha, “Global intrusion detection inthe domino overlay system,” inProceedings of the 11th IEEE Networkand Distributed System Security Symposium (NDSS), San Diego, CA,Febrary 2004.
[9] V. Yegneswaran, P. Barford, and D. Plonka, “On the designandutility of internet sinks for network abuse monitoring,” inProceedingof Symposium on Recent Advances in Intrusion Detection (RAID),Pittsburgh, PA, September 2003.
[10] D. Moore, “Network telescopes: Observing small or distant securityevents,” inInvited Presentation at the 11th USENIX Security Symposium(SECURITY), San Francisco, CA, August 2002.
[11] Dynamic Graphs of the Nimda Worm, http://www.caida.org/dynamic/analysis/security/nimda .
[12] myNetWatchman, myNetWatchman Project, http://www.mynetwatchman.com .
[13] L. Spitzner, Know Your Enemy: Honeynets, Honeynet Project,http://project.honeynet.org/papers/honeynet .
[14] N. Provos, “Honeyd - a virtual honeypot daemon,” inProceedings ofthe 10th DFN-CERT Workshop, Hamburg, Germany, February 2003.
[15] J. Twucrpss and M. M. Williamson, “Implementing and testing a virusthrottling,” in Proceedings of the 12th USENIX Security Symposium(SECURITY), Washington, DC, August 2003.
[16] W. Yu, X. Fu, S. Graham, D. Xuan, and W. Zhao, “Dsss-based flowmarking technique for invisible traceback,” inProceedings of IEEESymposium on Security and Privacy (S&P), Oakland, CA, May 2007.
[17] V. Sekar, Y. Xie, D. Maltz, M. Reiter, and H. Zhang, “Toward aframework for internet forensic analysis,” inProceeding of the 3rdWorkshop on Hot Topics in Networks (HotNets-III), San Diego, CA,November 2004.
[18] J. Bethencourt, J. Frankin, and M. Vernon, “Mapping internet sensorswith probe response attacks,” inProceedings of the 14th USENIXSecurity Symposium (SECURITY), Baltimore, MD, July-August 2005.
[19] Y. Shinoda, K. Ikai, and M. Itoh, “Vulnerabilities of passive internetthreat monitors,” inProceedings of the 14th USENIX Security Sympo-sium (SECURITY), Baltimore, MD, July-August 2005.
[20] L. Y. Chuang, C. H. Yang, C. H. Yang, and S. L Lin, “An interactivetraining system for morse code users,” inProceedings of Internet andMultimedia Systems and Applications, Honolulu, Hawai, August 2002.
[21] R. Naraine, Botnet Hunters Search for Command and Con-trol Servers, http://www.eweek.com/article2/0,1759,1829347,00.asp .
[22] Dshield, Distributed Intrusion Detection System, http://www.dshield.org/ .
[23] R. K. Pickholtz, D. L. Schilling, and L. B. Milstein, “Theory of spead-spectrum communication - tutorial,”IEEE Transaction on Communica-tion, vol. 30, no. 5, pp. 855–884, 1982.
[24] E. J. Crusellers, M. Soriano, and J. L. Melus, “Spreading codes generatorfor wireless cdma network,”International Journal of Wireless PersonalCommunications, vol. 7, no. 1, 1998.
[25] Robert Dixon, Spread Spectrum Systems, 2nd Edition, John Wiley &Sons, 1984.
[26] Nova Engineering, Linear Feedback Register Shift, http://www.sss-mag.com/pdf/lfsr.pdf .
[27] S. Venkataraman, D. Song, P. Gibbons, and A. Blum, “New streamingalgorithms for superspreader detection,” inProceedings of the 12thIEEE Network and Distributed Systems Security Symposium (NDSS),San Diego, CA, Febrary 2005.
[28] S. Staniford, V. Paxson, and N. Weaver, “How to own the internet in yourspare time,” inProceedings of the 11th USENIX Security Symposium(SECURITY), San Francisco, CA, August 2002.
[29] “Cryptanalysis,” http://en.wikipedia.org/wiki/Cryptanalysis .
[30] R. L. Allen and D. W. Mills, Signal Analysis: Time, Frequency, Scale,and Structure, Wiley and Sons, 2004.
[31] X. Fu, Y. Zhu, B. Graham, R. Bettati, and W. Zhao, “On flow markingattacks in wireless anonymous communication networks,” inProceedingof the 24th International Conference on Distributed Computing Systems(ICDCS), Tokyo, Japan, March 2004.
[32] N. Zhang, S. Wang, and W. Zhao, “A new scheme on privacy preservingassociation rule mining,” inProceeding of the 8th European Conferenceon Principles and Practice of Knowledge Discovery in Databases(PKDD), Pisa, Italy, September 2004.
[33] R. Agrawal, A. Evfimievski, and R. Srikant, “Information sharing acrossprivate database,” inProceeding of the 22th SIGMOD InternationalConference on Management of Data, San Diego, CA, July 2003.
[34] N. Zhang and W. Zhao, “Privacy-preserving data-mining systems,”IEEEComputer, vol. 40, no. 4, April 2007.
[35] A. Lakhina, M. Crovella, and C. Diot, “Mining anomalies using trafficfeature distribution,” inProceedings of ACM SIGCOMM, Philadelphia,PA, August 2005.
[36] W. Yu, N. Zhang, X. Fu, R. Bettati, and W. Zhao, “On localizationattacks to internet threat monitors: An information-theoretic framework,”in Proceedings of IEEE International Conference on Dependable Sys-tems and Networks (DSN) (Performance and Dependability Symposium- PDS), Anchorage, Alaska, June 2008.
[37] CAIDA, Telescope Analysis, http://www.caida.org/analysis/security/telescope .
[38] H. Debar and A. Wespi, “Aggregation and correlation of intrusion-detection alerts,” inProceedings of the 4th International Symposium onRecent Advances in Intrusion Detection, Davis, CA, October 2001.
[39] P. Gross, J. Parekh, and G. Kaiser, “Secure selecticastfor collaborativeintrusion detection systems,” inProceedings of the 3rd InternationalWorkshop on Distributed Event-based Systems (DEBS), May 2004.
[40] A. Anderson, A. Johnston, and P. McOwan,Motion Illusions and ActiveCamouflaging, http://www.ucl.ac.uk/ucbplrd/motion/motion_middle.html .
[41] Chief of Engineers, United States Army: Army facilities compo-nents system user guide, http://www.usace.army.mil/inet/usace-docs/armytm/tm5-304/ , October 1990.
[42] M. Bellare, S. Goldwasser, and D. Miccianciom, “Pseudo-randomnumber generation within cryptographic algorithms: the dss case,” inProceedings of advances in cryptology’97, Lecture Notes inComputerScience, Springer-Verlag, May 1997.
[43] L. Wang and B. B. Hirsbrunner, “Pn-based security design for datastorage,” inProceedings of Databases and Applications, Innsbruck,Austria, February 2004.
[44] X. G. Xia, C. G. Boncele, and G. R. Arce, “A multiresolution watermarkfor digital images,” inProceedings of International Conference on ImageProcessing (ICIP), Washington, DC, October 1997.
[45] Q. M. Li and E. C. Chang, “Zero-knowledge watermark detectionresistant to ambiguity attacks,” inProceedings of the 8th ACM workshopon Multimedia and Security (MMSEC), NY, September 2006.
[46] M. Arnold, “Attacks on digital audio watermarks and countermeasures,”in Proceedings of the 3rd IEEE International Symposium on WebDelivering of Music, Florence, Italy, September 2003.
[47] Alexia Briassouli and Pierre Moulin, “Detection-theorectic analysisof warping attacks in spread-spectrum watermarking,” inProceedingsof IEEE International Conference on Acoustics, Speech, andSignalProcessing (ICASSP), Hong Kong, P.R.China, April 2003.
[48] N. Liu and K. P. Subbalakshmi, “Worst case attack on quantization baseddata hiding,” inProceedings of the 8th IEEE International Symposiumon Multimedia (ISM), San Diego, CA, December 2006.
[49] C. Cachin, “Digital steganography,”http://www.zurich.ibm.com/ ˜ cca/papers/encyc.pdf , 2005.
[50] N. Provos, “Defending against statistical steganalysis,” in Proceedings ofthe 10th USENIX Security Symposium (SECURITY), Washington, D.C,August 2001.
[51] S. Cabuk, C. Brodley, and C. Shields, “Ip covert timing channels:design and detection,” inProceedings of the 2004 ACM Conferenceon Computer and Communications Security (CCS), Washington D.C,October 2004.
[52] G. Shah, A. Molina, and M. Blaze, “Keyboards and covert channels,”in Proceedings of the 15th USENIX Security Symposium (SECURITY),San Diego, CA, July-August 2006.
14
[53] D. Bailey, D. Boneh, E.-J. Goh, and A. Juels, “Covert channels inprivacy-preserving identification systems,” inProceedings of the 2007ACM Conference on Computer and Communications Security (CCS),Alexandria, VA, November 2007.
[54] T.Takahashi and W. Lee, “An assessment of voip covert channelthreats,” in Proceedings of the IEEE International Conference onSecurity and Privacy in Communication Networks (SecureComm), Nice,France, September 2007.
APPENDIX B. PROOF OFTHEOREM 1
i) Derivation of attack success ratePAD. The attacksuccess ratePAD is the probability that an attacker correctlyrecognizes the fact whether a selected target network is de-ployed with monitors. Following this definition, we have
PAD = 1 − Pr[Γ(λ′i, Ci) ≤ Ta|(λ′
iη′i + ω′
i)] (14)
= 1 − Pr[Γ(λ′i, Ci) ≤ Ta − V
2|(λ′
i = ω′i)]. (15)
ThenPAD can be represented by
PAD = 1 −√
L√2πσx
∫ Ta−V2
−∞e
−x2L
2σ2x dx. (16)
Let y2 = x2L2σ2
xandy = x
√L√
2σx
. Then we have
PAD = 1 −√
L√2πσx
∫ (Ta−V2
)√
L√
2σx
−∞
√2σx√L
e−y2
dy (17)
= 1 − 1√π
∫ ∞
( V2
−Ta)√
L√
2σx
e−y2
dy. (18)
ii) Derivation of attack false positive ratePAF . The attackfalse positive ratePAF is the probability that an attacker mis-takenly identifies a selected target network as being deployedwith monitors. If Γ(λ′
i, Ci) follows a Gaussian distributionN(0, σ2
x/L) (for detail see Equation (2) in Section II-C), wehavePAF = Pr[Γ(λ′
i, Ci) ≥ Ta|(λ′i = ω′
i)]. Thus, thePAF
can be presented by
PAF =
√L√
2πσx
∫ ∞
Ta
e−x2L
2σ2x dx. (19)
Let y2 = x2L2σ2
xandy =
√Lx√2σx
, we have
PAF =
√L√
2πσx
∫ ∞
√
LTa√
2σx
(e−y2
√2σx√L
)dy (20)
=1√π
∫ ∞
√
LTa√
2σx
e−y2
dy. (21)
Wei Yu Dr. Wei Yu received the BS degree inElectrical Engineering from Nanjing University ofTechnology in 1992, the MS degree in ElectricalEngineering from Tongji University in 1995, andthe PhD degree in computer engineering from TexasA&M University in 2008. He has been working forCisco Systems Inc. since 2001. His research interestsinclude cyber space security, computer network, anddistributed systems.
Xun Wang Dr. Xun Wang received the BS andMS in computer engineering from The East ChinaNormal University, Shanghai, China, in 1999 and2002, and the PhD degree in Computer Scienceand Engineering from The Ohio State University in2007. He has been working for Cisco Systems, Inc.since 2007. His research interests include networksecurity, overlay networks, and wireless sensor net-works.
Xinwen Fu Dr. Xinwen Fu is an assistant professorin the Department of Computer Science, Universityof Massachusetts Lowell. He received his BS (1995)and MS (1998) in Electrical Engineering from Xi’anJiaotong University, China and University of Scienceand Technology of China respectively. He obtainedhis PhD (2005) in Computer Engineering from TexasA&M University. From 2005 to 2008, he was anassistant professor with the College of Business andInformation Systems at Dakota State University. Insummer 2008, he joined University of Massachusetts
Lowell as a faculty member. Dr. Fu has been publishing papers inprestigiousconferences such as S&P, INFOCOM and ICDCS, journals such as TPDS, andbook chapters. His group won the best paper award at International Conferenceon Communications (ICC) 2008. His current research interestsare in networksecurity and privacy.
Dong Xuan Dr. Dong Xuan received the BS andMS degrees in electronic engineering from ShanghaiJiao Tong University (SJTU), China, in 1990 and1993, and the PhD degree in computer engineeringfrom Texas A&M University in 2001. Currently,he is an associate professor in the Department ofComputer Science and Engineering, The Ohio StateUniversity. He was on the faculty of ElectronicEngineering at SJTU from 1993 to 1997. In 1997,he worked as a visiting research scholar in theDepartment of Computer Science, City University
of Hong Kong. From 1998 to 2001, he was a research assistant/associate inReal-Time Systems Group of the Department of Computer Science, TexasA&M University. He is a recipient of the US National Science Foundation(NSF) CAREER award. His research interests include distributed computing,computer networks and cyber space security.
Wei Zhao Dr. Wei Zhao is currently a full professorof Computer Science and the Dean for the School ofScience at Rensselaer Polytechnic Institute. Between2005 and 2006, he served as the director for theDivision of Computer and Network Systems in theUS National Science Foundation when he was onleave from Texas A&M University, where he servedas Senior Associate Vice President for Research andProfessor of Computer Science. He was the foundingdirector of the Texas A&M Center for InformationSecurity and Assurance, which has been recognized
as a Center of Academic Excellence in Information Assurance Education bythe National Security Agency. Dr. Zhao completed his undergraduate programin physics at Shaanxi Normal University, Xian, China, in 1977. He received theMS and PhD degrees in Computer and Information Sciences at the Universityof Massachusetts at Amherst in 1983 and 1986, respectively. Since then, he hasserved as a faculty member at Amherst College, the University ofAdelaide,and Texas A&M University. As an elected IEEE fellow, Wei Zhao has madesignificant contributions in distributed computing, real-time systems, computernetworks, and cyber space security.