Embed Size (px)
Citation preview

Technological University Dublin Technological University Dublin
ARROW@TU Dublin ARROW@TU Dublin
Doctoral Science
2020
An Investigation into the Application of Raman Spectroscopy for An Investigation into the Application of Raman Spectroscopy for
Cervical Cancer Screening Cervical Cancer Screening
Damien Traynor Technological University Dublin
Follow this and additional works at: https://arrow.tudublin.ie/sciendoc
Part of the Medicine and Health Sciences Commons
Recommended Citation Recommended Citation Traynor, D. (2020) An Investigation into the Application of Raman Spectroscopy for Cervical Cancer Screening, Doctoral Thesis, Technological University Dublin. doi:10.21427/ghg3-qf50
This Theses, Ph.D is brought to you for free and open access by the Science at ARROW@TU Dublin. It has been accepted for inclusion in Doctoral by an authorized administrator of ARROW@TU Dublin. For more information, please contact [email protected], [email protected].
This work is licensed under a Creative Commons Attribution-Noncommercial-Share Alike 4.0 License

i
An investigation into the application of Raman
Spectroscopy for cervical cancer screening
Damien Traynor (B.Sc)
Radiation and Environmental Science Centre (RESC)
School of Physics & Clinical & Optometric Sciences
Technological University Dublin
May 2019
Supervisor: Fiona Lyng

ii
Abstract: An investigation into the application of Raman Spectroscopy for cervical cancer
screening
Raman spectroscopy is a powerful tool that has the potential to be, used for cervical cancer
screening. It is a label-free, low-cost method providing a biochemical fingerprint of a given
sample. The objective of this thesis was to address issues associated with the application of
Raman spectroscopy for cervical cancer screening and to demonstrate the potential for triage
of HPV positive cases.
The first study investigated hormonal effects due to the menstrual cycle, the use of hormone-
based contraceptives (HC) and the onset of menopause on Raman spectra of cervical cells and
determined if these changes would affect the ability to successfully identify dyskaryotic cells.
Spectral changes were observed depending on the day of the menstrual cycle and on the use
of HC. Despite this, high grade (HG) dyskaryotic cells could be discriminated from normal cells
regardless of the day on which the sample was taken or the use of HC.
The second study aimed to extend previous work on blood contamination of cervical smear
samples and to investigate if excessively bloody samples could be rendered suitable for
Raman spectroscopy. ThinPrep liquid based cytology (LBC) specimens were treated by adding
hydrogen peroxide directly to the vial before slide preparation. Good discrimination between
negative and HG cytology could be achieved for samples with no blood contamination
(sensitivity 92%, specificity 93%) and heavy blood contamination (sensitivity 89%, specificity
88%) with poorer classification when samples were combined (sensitivity 82%, specificity
87%). The improved potential of Raman spectroscopy for analysis of ThinPrep specimens
regardless of blood contamination was shown.

iii
The third study investigated Raman spectroscopy for screening for histologically confirmed
cases of CIN using long term biobanked LBC samples. Classification of CIN was compared using
Raman spectra from fresh LBC samples and biobanked LBC samples. Raman spectroscopy was
found to effectively discriminate negative from CIN 3 fresh and biobanked LBC samples. In
addition, it was found that biobanked LBC samples could be combined with fresh LBC samples
and still achieve a similar sensitivity and specificity.
The fourth study investigated the ability of Raman spectroscopy as a triage of HPV positive
cases to discriminate between latent HPV infections and persistent HPV infections which are
clinically more important. The results showed that Raman spectroscopy could distinguish
between patients with latent and persistent HPV infections and a sensitivity and specificity of
90% and 100% respectively was achieved for an unknown test set.

iv
Declaration
I certify that this thesis which I now submit for examination, is entirely my own work and
has not been taken from the work of others, save and to the extent that such work has been
cited and acknowledged within the text of my work.
This thesis was prepared according to the regulations for graduate study by research of the
Technological University Dublin and has not been submitted in whole or in part for another
award in any other third level institution.
The work reported in this thesis conforms to the principles and requirements of the
Technological University Dublin guidelines for ethics in research.
The Dublin Technological University Dublin has permission to keep, lend or copy this thesis
in whole or in part, on the condition that any such use of the material of the thesis be duly
acknowledged.
Signed Date
v
Acknowledgements
On the very outset of this report, I would like to extend my sincere and heartfelt thanks to
my supervisor Prof Fiona Lyng who took a chance and gave me a job 5 years ago and who
has also encouraged me to pursue a PhD. Without her guidance, help and encouragement, I
would not have made it this far.
I am extremely thankful to all the staff of FOCAS Hugh Byrne, Aidan Meade, Orla Howe and
Luke O Neil for their valuable support and guidance in the completion of this project.
I would like to thank my Cerviva colleagues Dr Cara Martin, Prof John O Leary, Dr Christine
White, Stephen Reynolds and Dr. Prerna Tewari for all there help with patient requirement
and testing.
I am extremely lucky to have many people in my life both inside and out of work who have
helped me through this journey. Grace, Sandra, Mam, Dad, Sarah, Alex, Andrew, Amelia,
Ian, Karen, Karen, Garreth, Aisling, Brian, Alex, Maikki, Naomi, Ola, Lucie, Dan, Megan, Jamie
Tadhg, Conor, Andrea, Giuliana, T.J, Caroline, Isha, Declan, Drishya ,Neha, Fionn, Emma,
Agnes, Ken, Christine, Michelle, Jane, Rory, Ulises.
This research was undertaken as part of CERVIVA, the Irish Cervical Screening Research Consortium and we gratefully acknowledge funding from the Health Research Board Collaborative Applied Research Grant, CARG2012/29, and Enterprise Ireland co-funded by the European Regional Development Fund (ERDF) and Ireland’s EU Structural Funds Programme 2007–2013, CF2011 1045.

vi
Abbreviations
ASC Atypical squamous cells
ASC-H Atypical squamous cells of undetermined significance but high
grade changes can’t be ruled out
ASC-U Atypical squamous cells of undetermined significance
CCD Charged coupled device
CIN Cervical Intraepithelial Neoplasia
CWIUH Coombe Women’s and Infants University Hospital
DNA Deoxyribonucleic acid
GDPR General Data protection Regulation
H202 Hydrogen Peroxide
HC Hormone based contraceptive
HG High grade
HPV Human Papilloma virus
hrHPV High risk HPV
HSIL High grade squamous intraepithelial lesion
IMS Industrial Methylated Spirits
LSIL Low grade squamous intraepithelial lesion
LBC Liquid based cervical cytology
LV Latent variables
mRNA Messenger ribonucleic acid
NNLS Non- negative constrained least squares
Pap Papanicolaou stain
PCR Polymerase Chain reaction
PLS-DA Partial least squares discriminate analysis
SIL Squamous Intraepithelial lesion
STM Specimens transport media
TN True negative
TZ Transformation zone

vii
Contents
1 Introduction… .............................................................................................................. 1
1.1 What is Cervical Cancer ............................................................................................. 1
1.2 The Female Reproductive System ........................................................ 1
1.2.1 Stratified squamous epithelium .......................................................... 3
1.2.1 The Menstrual cycle ........................................................................... 4
1.2.3 Hormone Contraceptive ....................................................................... 5
1.3 Cervical Cancer ........................................................................................................... 5
1.3.1 Human Papillomavirus ......................................................................... 6
1.3.1.1 HPV infection… ................................................................................ 6
1.3.1.2 Cell Proliferation and Genome Amplification… .............................. 7
1.3.1.3 Possible Outcomes of a HPV infection… ......................................... 8
1.3.1.4 Persistence......................................................................................... 9
1.3.1.5 Regression… ..................................................................................... 9
1.4 Cervical Screening ..................................................................................................... 10
1.4.1 The Papanicolaou Test ........................................................................ 10
1.4.1.1 Cytology ........................................................................................... 12
1.4.1.2 Bethesda Classification for Cytology ............................................... 12
1.4.1.3 Low grade (LSIL) ............................................................................. 13
1.4.1.4 High grade (HSIL) ............................................................................ 14
1.4.1.5 Squamous Cell Carcinoma ............................................................... 15
1.4.1.6 Inflammation Vs Dyskaryosis .......................................................... 16
1.4.2 HPV Testing ........................................................................................ 17
1.4.3 Colposcopy .......................................................................................... 18

viii
1.4.3.5 Diagnosis Colposcopy ......................................................................... 18
1.4.3.6 Colposcopy Process ............................................................................. 19
1.4.3.7 Biopsy Methods ................................................................................... 20
1.4.4 Histopathology Examination…................................................................ 21
1.4.4.5 CIN histological features ...................................................................... 22
1.4.4.6 Principle of treatment ............................................................................ 23
1.4.4.7 False positives and unnecessary referral to colposcopy ......................... 24
1.4.5 Risk of Psychological Harm ..................................................................... 24
1.4.6 Vaccination… ........................................................................................... 25
1.4.7 Current and future screening practice ....................................................... 25
1.4.7.5 Triage Tests ........................................................................................... 28
1.5 Vibrational Spectroscopic techniques ........................................................................... 29
1.5.1 Raman Spectroscopy ................................................................................ 29
1.5.2 The Raman Spectrum ............................................................................... 33
1.5.3 Raman Instrumentation… ......................................................................... 37
1.5.4 Raman Spectroscopy in Cancer Research… ............................................. 38
1.5.5 Raman Spectroscopy in Cervical Cancer Research .................................. 40
1.6 Cerviva ............................................................................................................................ 43
1.7 Research Question and Hypothesis ................................................................................. 43
1.8 Aim and Objectives ......................................................................................................... 43

ix
2 Materials and Methods ..................................................................................................... 45
2.1 Sample Cohort 1 and 2… .............................................................................................. 45
2.2 HPV Testing ................................................................................................................... 46
2.2.1 CobasR 4800 HPV DNA Test ..................................................................... 46
2.2.2 Aptima HPV mRNA test............................................................................. 48
2.3 Thinprep slide preparation .............................................................................................. 49
2.4 H202 Treatment ................................................................................................................ 49
2.5 Raman Measurements ..................................................................................................... 50
2.6 Pap stain… ...................................................................................................................... 51
2.7 Raman Spectral Processing ............................................................................................. 51
2.7.1 Smoothing ..................................................................................................... 51
2.7.2 Base Line Correction… ................................................................................. 52
2.7.3 Vector Normalization .................................................................................... 52
2.7.4 Glass Subtraction… ........................................................................................ 53
2.8 Partial Least Squares Discriminant analysis (PLSDA) ..................................................... 55
2.9 Cross-Validation ............................................................................................................... 55

x
Chapter 3 : A Study of Hormonal Effects in Cervical Smear Samples Using Raman
Spectroscopy ........................................................................................................................ 57
3.1 Introduction… ................................................................................................................ 58
3.2 Materials and Methods ................................................................................................... 61
3.2.1 Sample collection and Thinprep slide Preparation… .................................. 61
3.2.2 HPV Testing ................................................................................................ 61
3.2.3 Raman Microspectroscopy .......................................................................... 61
3.2.4 Data Pre-Processing and Analysis .............................................................. 61
3.3 Results ........................................................................................................................... 63
3.3.1 Proliferation and Secretory Phase and Postmenopausal Cellular Presentation
on Pap smear 63
3.3.2 Raman signature of Prolieration Phase Vs Sectretory Phase ..................... 64
3.3.3 Raman signature of Postmenopausal samples ........................................... 66
3.3.4 Raman signature associated with women on hormone based
contraceptives 68
3.3.5 Phase of menstrual cycle Vs High Grade Dyskaryosis ............................. 71
3.3.6 HC positive samples Vs High Grade Dyskaryosis ..................................... 74
3.4 Discussion… ............................................................................................................... 76
3.5 Conclusion… ............................................................................................................... 77

xi
Chapter 4: Improved removal of blood contamination from Thinprep cervical cytology
samples for Raman spectroscopic analysis ....................................................................... 78
4.1 Introduction… ............................................................................................................. 79
4.2 Materials and Methods ................................................................................................ 83
4.2.1 Samples and blood treatment ................................................................... 83
4.2.2 Thinprep slide preparation… ................................................................... 84
4.2.3 Raman spectroscopy ................................................................................. 84
4.2.4 Data pre-processing and analysis ............................................................. 84
4.3 Results/Discussion… .................................................................................................. 85
4.4 Conclusion… .............................................................................................................. 95
Chapter:5 The potential of biobanked liquid based cytology samples for cervical cancer
screening using Raman spectroscopy ............................................................................. 96
5.1 Introduction… .......................................................................................................... 97
5.2 Methods................................................................................................................... 98
5.2.1 Sample Collection ................................................................................ 98
5.2.2 Thinprep ............................................................................................... 99
5.2.3 Raman spectroscopy ............................................................................. 99
5.2.4 Data pre-processing and analysis ......................................................... 99
5.3 Results ..................................................................................................................... 100
5.3.1 -250C Vs -800C biobanked LBC samples ............................................ 100
5.3.2 Negative Vs HSIL (fresh LBC samples) Model ................................... 101
5.3.3 Negative Vs HSIL (Biobanked LBC samples) Model ......................... 103
5.3.4 Biobanked Vs Non-Biobanked samples ................................................ 105
5.3.5 Mixed Model ......................................................................................... 107
5.4 Discussion… ............................................................................................................ 109

xii
5.5 Conclusion… .......................................................................................................... 110
Chapter 6: The potential application of Raman spectroscopy to be used as a triage test for
cervical cancer in a primary HPV screening environment ............................................. 111
6.1 Introduction… ......................................................................................................... 112
6.2 Methods.................................................................................................................. 116
6.2.1 Thinprep ......................................................................................... 116
6.2.2 Raman spectroscopy ....................................................................... 117
6.2.3 Data pre-processing and analysis .......................................................... 117
6.2.4 Prediction… ..................................................................................... 117
6.3 Results and Discussion… ......................................................................................... 118
6.3.1 Transcriptionally Active Vs Non-Transcriptionally Active ..................... 118
6.3.2 Prediction… ............................................................................................. 121
6.3.2.1 Method 1… ............................................................................................ 121
6.3.2.2 Method 2… ............................................................................................ 122
6.3.2.3 Comparison of Raman classification, Cytology results, Histology result and
HPV status 123
6.4 Conclusion… ............................................................................................................. 126
Chapter 7: Conclusions and Future Work… ................................................................... 127
7.1 Conclusions ................................................................................................. 128
7.2 Future Work .................................................................................................. 133
Chapter 8: Reference and publications ............................................................................ 136
8.1 References .................................................................................................. 136
8.2 Publications ................................................................................................ 144

xiii
List of Tables
Table 1.1: Tentative Peak Assignments for cells and tissues .................................................. 35
Table 3.1: Sample details including day of menstrual cycle, menopausal status and use of
hormone based contraceptive ............................................................................................... 62
Table 4.1: Sensitivity and specificity from PLS-DA classification of TN and HG cervical
cytology samples with and without blood contamination and combined… ....................... 94
Table 6.1: Non-transcriptionally active Vs Transcriptionally active patient
summary ............................................................................................................................ 119
Table 6.2 Prediction method 1 results ................................................................................ 121
Table 6.3 Prediction method 2 results ................................................................................ 122
Table 6.4 Raman classification ,Cytology result, Histology result and HPV status for
independent set .................................................................................................................. 123

xiv
List of figures
Figure 1.1 Diagram of female reproductive system. ................................................................. 2
Figure 1.2 Pap stained (A) Basal cell small round cells with oval nuclei, fine chromatin and a
high nuclear to cytoplasmic ratio. (B) Small round cells with fine chromatin pattern. (C)
Intermediate cells, large polygonal cells which have round to oval vesicular nuclei. (D)
Superficial cells, large polygonal cells with a small condensed nuclei, angular cytoplasm and
keratohyaline granules ............................................................................................................. 3
Figure 1.3 Schemmatic illustration of the menstrual cycle over 28 days .................................. 4
Figure 1.4 Graphical representation of the HPV genome ....................................................... 7
Figure 1.5 Illustration of Thinprep process of sample collection and processing ................. 11
Figure 1.6 Cytological representation of LSIL on Pap smear ................................................ 13
Figure 1.7 Cytological features of HSIL on Pap smear .......................................................... 14
Figure 1.8 Cytological features of Squamous Cell Carcinoma on Pap smear ...................... 15
Figure 1.9 The cytological presentation of cervicitis on Pap smear ......................................17
Figure 1.10 A graphical representation of the Colposcopy process ..................................... 19
Figure 1.11 (A) Visual appearance of a normal cervix. (B) visual appearance of CIN 1 after the
application of acetic acid to the cervix .................................................................................... 20
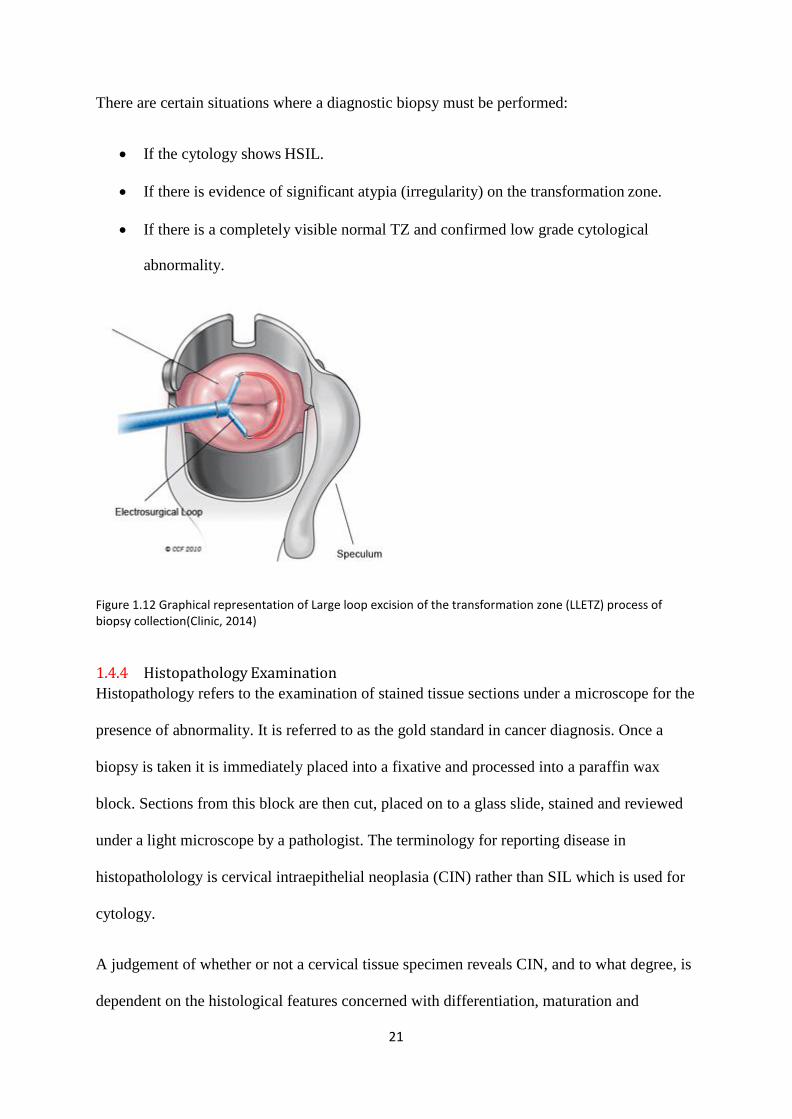
Figure 1.12 Graphical representation of Large loop excision of the transformation zone
(LLETZ) process of biopsy collection ....................................................................................... 21
Figure 1.13 Histological representation of normal (A),CIN I (B), CIN II(C), and CIN III (D) of
H&E stained cervical tissue ................................................................................................... 23

xv
Figure 1.14 Jablonski diagram showing vibrational energy levels of a molecule and the
interaction with light during Rayleigh and Raman scattering ........................................... 29
Figure 1.15 Raman spectrum of cervical cancer CaSki cell line .......................................... 33
Figure 1.16 Raman spectra of a cervical Intermediate cell recorded in the fingerprint region
400-1800cm-1 .............................................................................................................................................................................. 34
Figure 1.17(A) Labram XploRATM Raman spectrometer ................................................... 38
Figure 1.18 Basic Schematic of Raman spectrometer. ........................................................... 38
Figure 2.1 The Cobas® x480 instrument and z480 analyser .................................................. 47
Figure 2.2 Panther instrument............................................................................................... 48
Figure 2.3 300 glass spectra recorded in the fingerprint region 400-1800cm ...................... 54
Figure 2.4 100 Intermediate cell spectra before (blue) and after (red) pre-processing for glass
removal .................................................................................................................................... 54
Figure 3.1 (A) Proliferative phase presentation of a Pap smear, (B) Secretory phase
presentation of a Pap smear,(C) Postmenopausal presentation of a Pap smear .................. 63
Figure 3.2 (A) Mean Raman spectra of intermediate and superficial cells from days 7 to 24. ,
(B) LV scores scatter plot of Proliferative Phase, Days 7-14 Secretory Phase, Days, (C) LV1
loadings, (D) PLS-DA prediction plot ..................................................................................... 65
Figure 3.3 (A) Mean Raman spectra from postmenopausal samples (B) LV scatter scores plot
of postmenopausal (blue) and non-menopausal (red), (C) LV1 loadings, (D) PLS-DA
prediction .............................................................................................................................. 67
Figure 3.4 (A) Mean Raman spectra from HC positive and HC negative cells. (B) LV scatter
scores plot of HC negative (blue) and HC positive (red), (C) LV1 loadings, (D) PLS-DA
prediction plot....................................................................................................................... 70
xvi
Figure 3.5 (A) Pap stained HSIL cells, (B) Mean Raman spectra from negative samples from
days 7-21 of the menstrual cycle (red) and spectra from HSIL positive samples (blue). (C) LV
scores scatter plot of HSIL positive samples (red) and negative samples (blue), (D) LV1
loadings, (E) PLS-DA prediction plot................................................................................... 73
Figure 3.6 (A) Mean Raman spectra from negative HC positive samples (red) and spectra
from HSIL cells (blue),(B) LV scores scatter plot of HSIL samples (red) and negative HC
positive samples (blue), (C) LV1 loadings, (D) PLS-DA prediction plot............................. 75
Figure 4.1 (A) Pap smear after staining. Note the presence of intermediate (blue),
superficial (pink) cells and lymphocytes (indicated by arrows), (B) Bloody smear pattern with
red blood cells, obscuring diagnostic cells. (C) Pap smear contaminated with blood showing
ringed halo effect .................................................................................................................. 80
Figure 4.2 ThinPrep vials graded according to the blood scale index. 0 indicates no visible
evidence of blood and 3 indicates an extremely bloody sample .......................................... 83
Figure 4.3 (A) Untreated Pap smear, blood scale 3 (B) Raman spectra recorded from
untreated Pap smear (C) Treated Pap smear (D) Raman spectra recorded from treated Pap
smear ..................................................................................................................................... 86
Figure 4.4 (A) Mean Raman spectra of HeLa cervical cancer cells treated with blood (blood
scale 2-3) and subsequently treated with H2O2 (red) and HeLa cervical cancer cells not
treated with blood but treated with H2O2 (blue), (B) Mean Raman spectra of true negative
samples (TN), blood scale 2-3, treated with H2O2 (red) and blood scale 0, treated with H2O2,
(C) Mean Raman spectra of high grade (HG) samples, blood scale 2-3 treated with H2O2 (red)
and blood scale 0, treated with H2O2 .............................................................................................................................. 88

xvii
Figure 4.5 (A) LV score scatter plot of 136 spectra acquired from 15 TN samples and 136
spectra acquired from 15 HG samples (blood scale index 0), (B) LV 1 loadings, (C) PLS-DA
prediction plot showing good discrimination between TN (blue) and HG (yellow) ThinPrep
cytology samples ................................................................................................................ 90
Figure 4.6 (A) LV score scatter plot of 185 spectra acquired from 15 TN cytology and 185
spectra acquired from 15 HG cytology samples (blood scale index 2-3), (B) LV1 loadings. (C)
PLS-DA prediction plot showing some discrimination between TN (blue) and HG (yellow)
Thinprep cytology samples, blood scale 2-3 and treated with H2O2 .......................................................... 92
Figure 4.7 (a) LV score scatter plot of 321 spectra from TN cytology and 321 spectra HG
cytology samples (combined blood scale 0 and blood scale 2-3), (b) LV1 loadings. (c) PLS-DA
prediction plot showing some discrimination between TN (blue) and HG (red) Thinprep
cytology samples, combined blood scale 0 and blood scale 2-3 and treated with
H2O2 ........................................................................................................................................................................................................ 93
Figure 5.1 (A) Pap smears stored at -25oC present with intact cellular morphology. (B) High
quality spectra recorded from morphologically normal intermediate and superficial cells in
the spectral range 400-1800cm-1. (C) Pap smears stored at -80oC .................................... 100
Figure 5.2 (A) mean spectra of fresh Negative (red) Vs CIN 3 (blue). (B) is a latent variables
(LV) scores scatter plot of LV1 and LV2, TN (yellow) Vs CIN 3 (blue). (C) LV1(blue) and LV2
(orange) loadings (D) PLS_DA prediction plot CIN 3 (blue), negative (yellow) ................... 102
Figure 5.3 (A) mean spectra of biobanked Negative (red) Vs CIN 3 (blue). (B) latent variables
(LV) scores scatter plot of LV1 and LV2, TN (yellow) Vs CIN 3 (blue). (C) LV1 (blue) LV2
(orange) .(D) PLS_da prediction plot CIN 3 (blue), negative (yellow) .......................... 104

xviii
Figure 5.4 (A) mean spectra of fresh CIN 3 (blue) vs biobanked CIN 3 (red). (B) latent
variables (LV) scores scatter plot of LV1 and LV2, fresh CIN 3 (yellow) Vs biobanked CIN 3.(C)
PLS-DA prediction plot biobanked CIN 3 (blue) vs fresh CIN 3 (yellow) .......................... 106
Figure 5.5 (A) latent variables (LV) scores scatter plot of LV1 and LV2, TN (yellow) Vs CIN 3
(blue). (B) LV1 loadings (blue) and LV2 loadings (orange). (C) PLS-DA prediction plot CIN 3
(blue), negative (yellow) ..................................................................................................... 108
Figure 6.1 Process flowchart for HPV reflex testing diagram .............................................. 115
Figure 6.2 Process flowchart for hrHPV primary testing diagram. ...................................... 115
Figure 6.3 Process flow chart for Raman Spectroscopy as a triage to primary HPV screening ............................................................................................................................. 116
Figure 6.4 (A) Mean spectra of non-transcriptionally active HPV infection (green) Vs samples
with trancriptionally active HPV infection (blue). B) Latent variables (LV) scores scatter plot
of LV1 and LV2 of samples with non-transcriptionally active HPV infection (green) and
transcriptionally active HPV infection (blue). C) LV1 loadings. (D) The PLS-DA prediction plot
............................................................................................................................................. 120

1
1 Introduction
1.1 What is Cervical Cancer? Cellular maturation is a normal part of a cell’s life cycle which involves the growth, ageing
and death of cells. This process of maturation is controlled by the cell’s own genetic makeup.
If a mutation occurs within this genetic makeup, control over the cell’s maturation can be lost
resulting in abnormal growth and a mass of cells known as a tumour (Fouad and Aanei,
2017).
Cervical Cancer is a cancer of the cells of the cervix. It is a slow progressive form of cancer
that has three precancerous stages which are currently screened for via the national cervical
cancer screening programme (CervicalCheck, 2013). The aim of CervicalCheck is to screen
for and prevent the progression of cervical cancer. It does this through a series of molecular
and objective based tests.
1.2 The Female Reproductive System
The female reproductive system is made up of the ovaries, fallopian tubes, uterus and vagina
(Figure 1.1). The ovaries and fallopian tubes control the production and release of eggs
during a women’s menstrual cycle. The vagina allows the passage of a baby and receives the
penis and sperm during intercourse. The uterus provides mechanical support for a developing
foetus and will expel the foetus by forceful contractions of its smooth muscles. Located at the
inferior portion of the uterus is the cervix. The cervix is a 2-4 cm long cylinder shaped tissue
that connects the vagina and uterus. The cervix itself is made up of the ectocervix and
endocerix, where they meet is called the squamous columnar junction. The ectocervix is the
outer portion of the cervix and is lined with stratified non-keratinising squamous epithelium
and is in continuation with the endocervix at the external os. The external os is the opening in
the centre of the ectocervix which connects the vagina to the uterus. The endocervical canal is
located within the cervix between the internal os and the external os which contains glandular

2
epithelium. The squamous columnar junction is where the squamous and glandular
epithelium meet between the endocervix and ectocervix (Koss, 2005).
The site of the squamous columnar junction will change during puberty. This junction is a
known site of metaplasia. Metaplasia is the transformation of vulnerable glandular epithelium
into protective stratified squamous epithelium. Metaplasia occurs due to the glandular
epithelium’s exposure to the acidic environment of the vagina. The area of metaplasia close
to the original position of the squamous columnar junction is known as the transformation
zone. More than 90% of premalignant lesions develop in the transformation zone (Koss,
2005)
Figure 1.1 Diagram of female reproductive system (Medlineplus, 2018)(Canadian Cancer society, 2019)

3
1.2.1 Stratified squamous epithelium
The stratified squamous epithelium is made up of four cell types, Basal, Parabasal,
Intermediate and Superficial cells. Basal cells are immature cells which are parent cells to all
cells which make up the epithelium. They are firmly attached to the basement membrane.
They are small round cells with oval nuclei, fine chromatin and a high nuclear to cytoplasmic
ratio (Figure 1.2 (A)). Parabasal cells lay above the basal cells. Their nuclei occupy about
half of the cell’s cytoplasm and have a fine chromatin pattern (Figure 1.2 (B)). Intermediate
cells are large polygonal cells (Figure 1.2 (C)). They have round to oval vesicular nuclei and
have a diameter 2-3 times the size of a Parabasal cell. Superficial cells are large polygonal
cells. They have small condensed nuclei, angular cytoplasm and keratohyaline granules
(Figure 1.2 (D)) (Koss, 2005).
Figure 1.2:Pap stained (A) Basal cell small round cells with oval nuclei, fine chromatin and a high nuclear to cytoplasmic ratio. (B) Small round cells with fine chromatin pattern. (C) Intermediate cells, large polygonal cells which have round to oval vesicular nuclei. (D) Superficial cells, large polygonal cells with a small condensed nuclei, angular cytoplasm and keratohyaline granules (Basicmedicalkey.com, 2016).
B
C

4
1.2.2 The Menstrual cycle The menstrual cycle (Figure 1.3) is a change that occurs within the female reproductive cycle
that makes pregnancy possible (Silverthorn, 2013). It is controlled by the rise and fall of
hormones. Each cycle is divided between the ovarian and uterine cycle. The ovarian cycle is
made up of the follicular phase, ovulation and luteal phase. The uterine cycle is made up of
menstruation, proliferative and secretory phase. The uterine cycle is the most clinically
relevant for this study. The proliferative phase averages over 14 days for most women and
begins with the start of menstruation. It involves the rapid production of follicle stimulating
hormone and luteinizing hormone which stimulate the growth of follicles which in turn
produce oestrogen which stimulates the rapid growth of the endometrium. The secretory
phase involves the production of progesterone and small amounts of oestrogen which
stimulates the shedding of the endometrium if implantation doesn’t occur (Boron, 2005).
Figure 1.3 Schemmatic illustration of the menstrual cycle over 28 days (Gettyimages, 2018)

5
1.2.3 Hormonal Contraceptive Hormonal contraceptive is the most commonly used method of birth control. In the United
States over 30% of sexually active women use a form of hormone based contraceptive (HC).
There are different forms of contraceptive that are widely available including oestrogen and
progesterone based forms and a combination of the two. The contraceptives work by
lowering the level of follicle stimulating hormone and luteinizing hormone produced, thereby
preventing the growth of the endometrium thus preventing implantation. Progesterone only
pills work by causing cervical mucus to thicken thus preventing the sperm penetrating the
uterus (Boron, 2005). There is no direct link between the amount of hormone present in the
contraceptive and the response of the cervical epithelium. This relationship varies
significantly from patient to patient (Koss, 2005)
1.3 Cervical Cancer
There were an estimated 570,000 new cervical cancer cases and 311,000 deaths from cervical
cancer worldwide in 2018 (Bray et al., 2018). There are three main types of cervical cancer.
Cervical cancer which develops from the squamous epithelium is known as squamous cell
carcinoma and accounts for 80-85% of all detected cervical cancers and will be the main
topic of this research. Cervical cancer which develops from endocervical cells is known as
adenocarcinoma and accounts to approximately 10% to 15% of all invasive cervical cancers
(Koss, 2005). Cervical cancer which develops from the ecto or endocervical cells is known as
adenosquamous carcinoma and accounts for approx. 3% of all detected cervical cancers
(Sahdev, 2010).

6
1.3.1 Human Papillomavirus The Human Papillomavirus, is present in 99% of all cervical cancers worldwide and is the
main aetiological agent associated with the disease. It is sexually transmitted and affects up to
80% of women at some point in their life (Sahdev, 2010). There are over 100 known HPV
types which are classified according to their potential to induce malignant transformations.
HPV 16, 18, 31, 35, 39, 45, 50, 51, 53, 55, 56, 58, 59, 64 and 68 are classified as high risk
types (Sahdev, 2010). HPV 16 and 18 are found in 70% of all cases of cervical cancer
(Sanjosé et al., 2007).
1.3.1.1 HPV Infection
The HPV genome (Figure 1.4) is made up of 8,000 base pairs. It has five early genes E1, E2,
E5, E6, E7 and two late genes, L1 and L2 (Fouad and Aanei., 2017). HPV infection is
thought to start in the basal layer of cells in the epithelium which it gains access via micro
abrasions in the epithelium. The virus first attacks the host cell’s DNA where it uses the host
cell machinery to transcribe its early genes. Following genome amplification, the virus is
maintained in a stable condition via an episome. Viral replication can then begin via the
transcription of E1 and E2 (Zheng and Baker, 2006). E1 is responsible for the helicase which
allows the E2 viral DNA to bind which results in the helicase binding to the replication
associated proteins including DNA polymerase alpha primase. E2 also has a role in the
binding of the viral episome to the chromosome undergoing mitosis which allows for
segregation of the HPV episome into each progenitor cell (Zheng and Baker, 2006).

7
Figure 1.4 Graphical representation of the HPV genome (Semantic Scholar, 2019)
1.3.1.2 Cell Proliferation and Genome Amplification
The increased proliferation of HPV infected cells is a result of the HPV oncogenes E6 and E7
working with E1 and E2. Together these proteins stimulate the progression of the infected
cells into the S-phase of its life cycle (Zheng and Baker, 2006). This method of progression is
first controlled by E7 which involves the binding and degradation of the retinoblastoma
protein (pRb). Under normal conditions the role of pRb is to control the expression of
proteins that are required for cell cycle progression. The degradation of pRb results in the
release of E2F. E2F is then free to recruit proteins for viral replication and cellular proteins
cyclin A and E which control S-phase progression. The role of E6 is to degrade the tumour
suppressor protein P53 which is overly produced due to the function of E7. Under normal
conditions P53 acts as a regulator of the cell cycle that triggers growth arrest or apoptosis to
prevent the replication of damaged DNA. The lack of P53 due to E6 results in the replication
of damaged DNA. The complete HPV life cycle involves the expression of both minor and
major coat proteins which allow genome packaging. This involves a change in splice site
usage which results in a switch from the production from E1^E4, E5 mRNA to E1^E4, L1
transcript which facilities the end of genome amplification and gives way to genome
packaging (Johansson , et al.,2012, Doorbar .,2005, Milligan et al.,2007). Encapsidation of
the genome requires the accumulation of E2 and the collection of infectious virions in the
nucleus. Virus maturation is then free to occur in superficial cells, which is triggered by a

8
change from a reducing to an oxidizing environment within the cell (Doorbar .,2005). This
change enables the accumulation of disulphide bonds between L1 proteins resulting in the
production of infectious HPV virions (Holmgren , et al,2005).
1.3.1.3 Possible Outcomes of a HPV infection
HPV DNA can be detected in the epithelial tissues due to its presence as virus particles on the
surface of the epithelium. This detection can be misinterpreted as HPV latency. To cause a
lesion or to initiate a latent infection, the virus particles have to gain access to the epithelial
basal cells at a sufficiently high level. Each type of virus has a specific epithelial site where it
can initiate a productive life cycle, as well as sites where the virus entry occurs in the absence
of lesion formation. At low titres or at non permissive epithelial sites an asymptomatic
infection can occur, in which viral genomes may exist in the basal layer without gene
expression or lesion formation. This is a form of latency as it does not trigger an immune
response. Certain high risk HPV types at a particular epithelial site can deregulate viral gene
expression which has the potential to lead to neoplasia. Persistent high risk HPV infections
can lead to the accumulation of genetic errors and the progression to cancer (Zheng and
Baker, 2006, Youssef et al., 2016)

9
1.3.1.4 Persistence
If a HPV infection is not cleared by the host immune system, it can persist over many years
resulting in intermittent or constant disease. In order for a persistent infection to occur, HPV
must maintain the viral genome in the epithelial stem cell and the host immune system must
fail to recognise it and clear the infection (Doorbar et al., 2012).
1.3.1.5 Regression
Persistent infection with high risk HPV is necessary but not sufficient for the development of
squamous carcinoma of the cervix or its precursor lesions CIN 1, 2, 3. A CIN 1 lesion
represents a chronic HPV infection, in which HPV DNA is episomal and intact viron
production and shedding is occurring. In women who are immune competent, many CIN 1
lesions (up to 58% over 24 months) will eventually regress without treatment (Burd, 2003).
Only 2% will progress to high grade lesions. High grade lesions are less likely to regress. The
risk for progression to invasive cancer at 24 months in women with high–grade lesions is 1-
2%. However CIN 1 and CIN 2 regression rates vary due to the subjectivity involved in their
diagnosis (Rodriguez et al., 2012 ). The main reason for over treatment of patients remains
the lack of a diagnostic test to directly identify lesions that are likely to progress or regress.

10
1.4 Cervical Screening
CervicalCheck is the national cervical screening programme for Ireland. It provides a free
cervical smear for all eligible women (1.1 million) between the ages of 25 and 60. The
purpose of screening is to reduce the incidence and mortality of cervical cancer
(CervicalCheck, 2013).
There are four current screening/diagnostic tests currently in use by CervicalCheck for
cervical cancer:
1) Papanicolaou test
2) HPV test
3) Colposcopy
4) Histopathology
1.4.1 The Papanicolaou Test
The Papanicolaou test (Pap test) is named after its inventor George Papanicolaou.
Papanicolaou’s work in cytology involving the female genital tract helped cytology diagnosis
gain credibility ( Koss, 2005). Since it was introduced in hospitals in the 1940’s the Pap test
has become the most commonly used method for identifying cervical cancer and its
associated pre-cancerous lesions.
Within the last 10 to 15 years conventional cytology has been replaced by liquid based
cytology (LBC) such as ThinPrep or SurePath. Conventional cytology and LBC both share
them same method of sampling cells from the transformation zone of the cervix with a
cervical brush or spatula. In the case of conventional smears, the cells are directly spread onto
a glass slide, fixed and stained. In the case of LBC, the cervical brush in rinsed in a vial of
preservative fluid and transferred to the lab where a uniform layer of cells on a glass slide is
prepared and then fixed and stained (Rozemeijer et al., 2016). The LBC method improves
sample quality by producing a more even layer of cells and helps remove unwanted cellular

11
material such as red blood cells and inflammatory cells (leukocytes). Specimen vials can also
be stored allowing an additional smear to be made if necessary and ancillary techniques to be
performed on the same sample. The Pap smear generally has a specificity of 96.5% but its
sensitivity can vary from 30-85% depending on the prevalence of the disease within the
population (Nanda et al., 2000). Thinprep (Figure 1.5) is the preferred method of sample
processing employed throughout Ireland, hence all samples used in this study will only be
processed using the ThinPrep method.
Figure 1.5 Illustration of Thinprep process of sample collection and processing (HeakthDxs,2017)

12
1.4.1.1 Cytology
Cytology is the study of the microscopic appearance of cells. Cytologists are trained to
identify the type of cells that are normally present in different areas of the body. The cells are
then screened to detect either changes in the morphology of the cells or the presence of
inappropriate cells that are associated with particular conditions.
1.4.1.2 Bethesda Classification for Cytology
CervicalCheck employs the Bethesda Classification system for its terminology of squamous
intraepithelial lesions (SIL). This is divided into three categories:
1) Low grade SIL (LSIL) which includes HPV- associated cellular changes and mild
dyskaryosis.
2) High grade SIL (HSIL) which includes moderate dyskaryosis and severe dyskaryosis
3) Query squamous cell carcinoma
Cytological changes in squamous cells which are not normal and do not fit the criteria for SIL
are classed as atypical squamous cells (ASC). ASC is divided into two subcategories:
1) ASC-US Atypical Squamous cells of undetermined significance.
2) ASC-H Atypical Squamous cells of undetermined significance but high grade changes
cannot be ruled out (CervicalCheck 2013).

13
1.4.1.3 Low grade (LSIL)
The cytological features of LSIL (Figure 1.6) are:
Abnormal/irregular chromatin pattern
Irregular nuclear membrane
Irregular nuclear contours
Nuclear enlargement
Hyperchromasia
Hypochromasia
Multi-nucleation
Seen in Intermediate and Superficial cells
Often seen with Koilocytic changes
Features correspond to changes in CIN 1
Nuclear to cytoplasmic ration
Figure 1.6 Cytological representation of LSIL on Pap smear (CPLmag.com, 2019)

14
1.4.1.4 High grade (HSIL)
The cytological features of HSIL (Figure 1.7) are:
Nuclear enlargement
An increase in the nuclear to cytoplasmic ratio
Abnormal nuclear morphology
Nuclear contours
Seen in immature cells – parabasal and metaplastic
Figure 1.7 Cytological features of HSIL on Pap smear (CPLmag.com, 2019)

15
1.4.1.5 Squamous Cell Carcinoma
The cytological features of Squamous Cell Carcinoma (Figure 1.8) are:
Windowing- irregular chromatin distributed causing holes
Fibre/tadpole/ bizarre cells
Keratinisation
Diathesis
Blood
Invasive squamous cell carcinoma can’t be diagnosed on cervical cytology, but these features
can suggest invasion.
Figure 1.8 Cytological features of Squamous Cell Carcinoma on Pap smear (eurocytology.eu, 2019)

16
1.4.1.6 Inflammation Vs Dyskaryosis
Cells are susceptible to injury. The response of tissues or cells to injury is known as
inflammation. When inflammation occurs in the cervix the condition is called cervicitis
(Figure 1.9). Inflammatory smears usually contain abundant polymorphs and histiocytes. If
the inflammation persists lymphocytes, plasma cells and multinucleated histiocytes may be
seen. A dirty background may be seen. Epithelial cells are not involved in the process of
inflammation but they do react to it via a process of degeneration and regeneration
(Shambayati.,2011)
Nuclear changes associated with inflammation are:
Wrinkling of nuclear membrane
Condensation of chromatin
Nuclear death
Nuclear enlargement
Course but regular granulation of chromatin
Prominent nucleoli
Multi-nucleation
Cytoplasmic changes associated with inflammation are:
Vacuolisation
Perinuclear halo
Altered staining pattern
Dense cytoplasm
Cytoplasmic projections

17
There are many cytological similarities between inflammation and dyskaryosis. However,
dyskaryosis will usually show coarse chromatin granularity with uneven distribution and
irregular nuclear membranes with contours. The causes of inflammation can vary but could
be related to the use of intrauterine devices, radiation, cytotoxic drugs, hormones or infection
(Shambayati., 2011).
Figure 1.9 The cytological presentation of cervicitis on Pap smear. Note the high level of polymorphs (General cytopathology, 2016)
1.4.2 HPV Testing HPV testing has been incorporated in most cervical cancer screening programmes and can be
applied in three ways
1. Primary screening
2. Management and triage
3. Test of cure
At present HPV testing is currently only being used by Cervical Check as a triage test for Pap
smears graded as LSIL on cytology and as a test of cure following treatment at colposcopy.
HPV testing will be discussed in more detail in the section on current screening practice
(section 1.1.31).

18
1.4.3 Colposcopy
As of 2013 there are currently 15 colposcopy services available as part of CervicalCheck.
Women can be referred to colposcopy for a number of reasons:
Abnormal vaginal bleeding
Suspicious cervix
Abnormal cytology referral
HPV result
The CervicalCheck guidelines (CervicalCheck, 2013) state that 90% of women with a high
grade cytological abnormality should be offered an appointment for colposcopy within four
weeks of the result being issued. All women with low grade cytological abnormalities should
be offered an appointment within eight weeks.
1.4.3.5 Diagnosis at Colposcopy
Colposcopy plays an important role in the evaluation of women with suspected cervical
abnormalities. It allows the identification of the site of the abnormality as well as an
estimation of the grade of abnormality including the presence or absence of features which
are suggestive of invasive cancer. As a procedure used alone however, it has diagnostic
limitations with a lack of correlation between the colposcopic and histological diagnosis, lack
of reproducibility and difficulties in assuring the optimum site (transformation zone) and the
quality of any biopsies taken (Powers, 2011).

19
1.4.3.6 Colposcopy Process
A speculum is used to spread apart the walls of the vagina before dilute acetic acid is applied
to the cervix under direct vision (Figure 1.10). The diagnosis is made using visual
recognition. The acetic acid interacts with the cell’s protein structure. Abnormal tissue will
show up as a white area (Figure 1.11). The intensity of the colour change as well as the
sharpness of the margins helps discriminate between grades of abnormality. (low or high
grade). New blood vessel formation often accompanies high grade on the cervix. Invasive
cancer often presents with abnormal blood vessel formation (CervicalCheck, 2013) A review
of colposcopy services demonstrated sensitivity and specificity levels for discrimination
between high and low grades of disease to be 96% and 48% respectively (CervicalCheck,
2013). The performance of colposcopy increases with the severity of the lesion. However a
study showed that colposcopy had a detection accuracy of only 52% for high grade lesions
(Zuchna et al., 2010) which confirms that some lesions may be difficult to detect and
highlights the risk of a false-negative biopsy result. When compared to the identification of
glandular lesions at colposcopy the sensitivity of colposcopy for glandular lesions drops to
9.8% (Ullal.A et al., 2009) which again highlights the difficulty in identifying areas of
abnormality.
Figure 1.10 A graphical representation of the Colposcopy process ( manhattancenterforgynecology, 2019)

20
Figure 1.11 (A) Visual appearance of a normal cervix. (B) visual appearance of CIN 1 after the application of acetic acid to the cervix (Shekinah Medical Centre, 2017)
1.4.3.7 Biopsy Methods
A histological diagnosis can be obtained by taking one or more diagnostic punch biopsies
using a tissue sampling forceps, small loop biopsy or by complete removal of the atypical
area using an excisional biopsy via a large loop excision of the transformation zone (LLETZ)
(Figure 1.12). The aim when taking a biopsy is to sample an area which is indicative of the
most abnormal area of cervical tissue to provide confirmation of the colposcopic impression.
The accuracy of the biopsy is dependent on the target site chosen by the colposcopist. There
are two types of biopsy that can be taken during colposcopy - punch or cone biopsy. Punch
biopsies are small pieces of tissue a few millimetres in diameter that are removed from the
cervical mucosa. Cone biopsies/excision biopsies are made up of cone shaped portions if
cervical tissue and taken with the aim of removing all the pathological tissue on the cervix.
This is both diagnostic and therapeutic (Bulten et al., 2011).
B
21
There are certain situations where a diagnostic biopsy must be performed:
If the cytology shows HSIL.
If there is evidence of significant atypia (irregularity) on the transformation zone.
If there is a completely visible normal TZ and confirmed low grade cytological
abnormality.
Figure 1.12 Graphical representation of Large loop excision of the transformation zone (LLETZ) process of biopsy collection(Clinic, 2014)
1.4.4 Histopathology Examination
Histopathology refers to the examination of stained tissue sections under a microscope for the
presence of abnormality. It is referred to as the gold standard in cancer diagnosis. Once a
biopsy is taken it is immediately placed into a fixative and processed into a paraffin wax
block. Sections from this block are then cut, placed on to a glass slide, stained and reviewed
under a light microscope by a pathologist. The terminology for reporting disease in
histopatholology is cervical intraepithelial neoplasia (CIN) rather than SIL which is used for
cytology.
A judgement of whether or not a cervical tissue specimen reveals CIN, and to what degree, is
dependent on the histological features concerned with differentiation, maturation and

22
stratification of cells and nuclear abnormalities. The proportion of the thickness of the
epithelium showing mature and differentiated cells is used for grading CIN. More severe
degrees of CIN are likely to have a greater proportion of the thickness of epithelium
composed of undifferentiated cells, with only a narrow layer of mature, differentiated cells on
the surface.
Nuclear abnormalities such as enlarged nuclei, increased nuclear-cytoplasmic ratio, and
increased intensity of nuclear staining (hyperchromasia), nuclear polymorphism and variation
in nuclear size (anisokaryosis) are assessed when a diagnosis is being made. There is often a
strong correlation between the proportion of epithelium revealing maturation and the degree
of nuclear abnormality. As the severity of CIN increases, the number of mitotic figures also
increases; these may be seen in the superficial layers of the epithelium. The less
differentiation in an epithelium, the higher the level at which mitotic figures are likely to be
seen (Bulten et al., 2011).
1.4.4.5 CIN histological features
In CIN 1 there is good maturation with minimal nuclear abnormalities and few mitotic
figures, undifferentiated cells are confined to the deeper layers (lower third) of the
epithelium. Cytopathic changes due to HPV infection may be observed in the full thickness
of the epithelium (Figure 1.13(A)). CIN 2 is characterized by dysplastic cellular changes
mostly restricted to the lower half or the lower two-thirds of the epithelium, with more
marked nuclear abnormalities than in CIN1. Mitotic figures may be seen throughout the
lower half of the epithelium (Figure 1.13(B)). In CIN 3 differentiation and stratification may
be totally absent or present only in the superficial quarter of the epithelium with numerous
abnormal mitotic figures. Nuclear abnormalities extend throughout the thickness of the
epithelium.

23
Figure 1.13 Histological representation of normal (A),CIN I (B), CIN II (C), and CIN III (D) of H&E stained cervical tissue (Medicoapps.org ,2019)
1.4.4.6 Principles of treatment
Not all women who attend colposcopy will require treatment. If the colposcopist is able to
identify a high grade lesion and can clearly identify its limits, then immediate treatment is
possible. This is known as a see and treat approach (CervicalCheck, 2013). If the
colposcopist assessment or biopsy reports a low grade lesion then the decision to treat is a
clinical one. Treatment is not mandatory in such cases. The colposcopist will make a decision
based on the likelihood that the lesion will regress, the age of the patient and if the patient is
willing to return for future appointments.
The aim of treating a CIN lesion is to remove the whole of the transformation zone to prevent
the development of invasive disease. There are different methods available. Options include
laser or cryotherapy (ablation) or diagnostic excision. Laser treatment uses a high energy
beam of light to heat the intracellular water of the target cells, thus killing them. Cryotherapy
works by freezing target cells resulting in irreversible cellular damage and death. LLETZ
treatment works by cutting away the whole of the transformation zone with a wire loop that
has been heated (Shambayati, 2011). All have similar treatment outcomes for the eradication
B C

24
of CIN. Physical risks associated with colposcopy include lower abdominal pain, cramps,
fainting and vaginal discharge (Sankaranarayanan et al., 2003).
1.4.4.7 False positives and unnecessary referral to colposcopy
From the 1st of September 2012 to the 31st of August 2013 in Ireland, 702 patients were
referred to colposcopy based on an ASCUS cytology result, 146 based on an ASC-H and 799
based on a LSIL result, all of which were reported as having a negative biopsy after
colposcopy (CervicalCheck, 2013). The colposcopic biopsy is regarded as the gold standard
on which a final result will be issued. However histological examination is by no means
perfect. Arbyn et al. (2007) reported that factors related to colposcopy biopsy, sampling and
interpretation errors were the most common cause of discrepancy between the cytology result
and the corresponding histology result. Zuchna et al.(2010) found that the sensitivity of
colposcopic-directed biopsy for the detection of CIN 2 was 52%, which confirms that many
lesions may be difficult to detect. Another possible source of error that could account for the
high volume of negative biopsies could be the number of false positive HPV DNA results. If
the HPV infection is newly acquired the infection will likely resolve in the first 6 months
(Adams et al., 2006).
1.4.5 Risk of Psychological Harm
For women, the receipt of an abnormal smear test frequently leads to a higher level of anxiety
(Gray et al., 2006). Often a result of an abnormal smear leads to fear on the part of the
women that she has cancer. Gray et al. (2006) reported a high prevalence of anxiety among
women with a low grade smear despite attempts to improve the way abnormal smear results
are communicated. They determined that those who are at the highest risk of anxiety tend to
be younger, have children, be smokers and have a high level of physical activity.

25
1.4.6 Vaccination
There are two clinical approaches for the prevention of cervical cancer. The first is mass
screening and treatment for pre-cancer, the second approach is vaccination to prevent
infection of HPV. In 2010, two licensed HPV vaccines became available in Ireland, Cervarix
and Gardasil. Cervarix is a bivalent vaccine against HPV types 16, 18 while Gardasil is a
quadrivalent vaccine against HPV 6, 11, 16, 18. The efficacy of the HPV vaccine has been
demonstrated in multiple studies (Baldur-Felskov et al., 2014, Munoz et al., 2010, Adams et
al., 2006, Garland et al., 2016). All have shown a significant reduction in the rate of high
grade histological abnormalities. Vaccination is a preventive approach as it is used with the
intention of preventing HPV infection from occurring. Given the link between HPV and
developing cervical cancer, women who have been vaccinated will have a reduced risk of
developing the disease, however these women will still have to be screened, as vaccination
does not cover all forms of the virus and may not be effective for women exposed to the virus
prior to vaccination (Garland et al., 2016).
1.4.7 Current and future screening practice
Liquid based cytology (LBC) was introduced in the 1990’s as a means of replacing
conventional cytology to improve cytology test performance. A LBC sample will be sent to
the lab where it will be processed using either the Thinprep or SurepathTM methods. These
two methods while similar involve different sample processing techniques. Thinprep uses a
cell filtration system to remove unwanted cells (red and white blood cells). SurepathTM uses a
density gradient centrifugation to remove unwanted cells. Both result in a circular monolayer
of cells on a glass slide. In 2008 automated image analysis was introduced which allowed
cytologist to be shown an area of interest on the slide that most likely contained abnormal
cells. This resulted in a quick screening time for each sample and a reduced detection error
(Arbyn et al., 2008).

26
In 2012 HPV testing was introduced by CervicalCheck as a test of cure following treatment
at colposcopy. There are over 100 different types of HPV, 12 of which have been identified
as carcinogenic and associated with a higher risk of progression to malignancy. The HPV
virus/genome can be identified in exfoliated cells which allows for HPV testing to be
performed on LBC samples. There are two common methods employed for HPV testing. The
first is a nucleic acid amplification method and the second is a signal amplification method.
Nucleic acid amplification involves the targeting and amplification of a particular HPV gene.
Signal amplification involves the use of RNA probes to hybridise viral DNA. These
RNA/DNA hybrids are then identified by a secondary structure. The Hybrid Capture 2 (HC2)
HPV DNA assay from Qiagen was the first HPV test to become commercially available. It
can identify 13 HPV types (16, 18, 31, 33, 35, 39, 45, 51, 52, 56, 58, 59 and 68) (Wong et al.,
2012). The Aptima E6 and E7 mRNA HPV test employs nucleic acid sequence base
amplification for E6 and E7 viral oncoproteins. The over expression of E6 and E7 mRNA is
associated with increased severity of disease (Haedicke et al., 2016). While these two tests
can provide information on the patient’s HPV status they do not provide information on
which types of HPV are present. The ability to identify which type of HPV is present allows
for further risk stratification in HPV positive patients due to the risk posed by the various
types of HPV. HPV 16 and 18 are associated with a higher risk of developing disease
(Garland et al., 2016). The Roche Cobas 4800 HPV test is specifically designed to identify
HPV 16 and 18 while also detecting the presence of HPV 31, 33, 35, 39, 45, 51, 52, 56, 58,
59, 66 and 68 (Poljak et al., 2016).
In 2015 HPV testing was utilised by CervicalCheck as part of a triage when low grade
cytological abnormalities were detected on primary liquid based cytology screening. Women
who present with LSIL but who are negative for HPV are at a very low risk of developing
cervical cancer within the next 5 years and should return to routine screening. Women with

27
HSIL are at a higher risk of developing the disease and would be directly referred to
colposcopy. The HPV test that has recently been introduced into the screening programme
has high sensitivity values but low specificity values (Cobas test, 95.2% sensitivity, 24%
specificity (Dillner et al., 2008, Rozemeijer et al., 2016)). The high sensitivity has led to
HPV testing being considered as a primary screening replacement for cytology. Despite this
high sensitivity there remains a low specificity as HPV is widespread in under 35 year olds.
While the HPV DNA tests currently available as part of a screening programme can indicate
the presence and specific genotype of HPV they cannot distinguish between the transient and
acute infection of minor clinical relevance and a transforming infection which is clinically
more significant. If used as a primary screening tool, HPV DNA testing could result in a high
proportion of women being unnecessarily being referred to colposcopy.
Molecular biomarkers have the potential to be used for the management of women who test
positive for HPV. P16INK4a is seen as a biomarker that could be used to identify a
transforming infection. The activation of E6 and E7 can be detected indirectly by the
accumulation of P16INK4a protein within the exfoliated cells. P16 INK4a is not currently being
used as part of any screening programme, however it does have the potential to be used as a
primary screening test, in combination with or as a replacement for other triage tests (HPV
testing). A recent study (Garland et al., 2016) reported sensitivity rates based on initial
pathologist reviews of 76.4% to 80.01%.

28
1.4.7.5 Triage Tests
The aim of a primary screening test is to identify patients most at risk, not to provide a
diagnosis. At present the Pap test is the primary screening test followed by HPV testing
followed by diagnosis on histology. Most of these tests are still subjective and a result is
largely based on who is screening the sample. There are plans to adopt HPV testing as the
primary screening method to identify patients most at risk. However, the identification of
HPV does not correlate with the presence of disease as the infection is often transient. The
application of primary HPV screening will require a high sensitivity for the detection of all
high risk HPV types which will result in a reduction in specificity as it will include all the
weaker carcinogenic HPV genotypes thus increasing the burden of hrHPV positive women
needing follow up (Arbyn et al.,2009). To address this, additional triage tests are still
required.
The use of cytology as a triage test is one possibility. Cytology has proven itself to be an
effective primary screening method for cervical cancer with a specificity of 96.5% but a
sensitivity of between 30- 85% (Nanda et al., 2000)
Biomarkers which are widely expressed in transforming infections could be used as a triage
test. The PALMS study conducted a large scale clinical trial to assess whether p16/ki-67 dual
stained cytology could provide high sensitivity for CIN2+ in screening while maintaining
high specificity. The report concluded that p16/ki-67 dual-stained cytology had superior
sensitivity and non-inferior specificity over the Pap test for the detection of CIN2+ and could
help with the limitations for primary HPV screening (Ikenberg et al., 2013).
Other methods based on optical spectroscopy could represent a new approach for cervical
cancer screening and this is the main topic of this PhD thesis.

29
1.5 Vibrational Spectroscopic techniques
Vibrational spectroscopic techniques are potential tools for the non-invasive, label free
investigation of biological samples at a molecular level (Bellisola et al., 2012,Downes et al.,
2010). Vibrational spectroscopy is a fast developing discipline that is showing a strong
potential in the field of cervical cancer screening and was first proposed by Wong et al.
(1991). Vibrational spectroscopy (FTIR and Raman) analyses vibrations within a molecule;
these vibrations are characteristic of the molecular structure, resulting in a spectroscopic
fingerprint (Lyng et al., 2015).
1.5.1 Raman Spectroscopy
Raman spectroscopy was named in honour of its inventor C.V. Raman along with K.S.
Krishnan. Raman spectroscopy is based on the Raman Effect/ Raman scattering which is used
to detect and measure the presence of certain molecules. Raman scattering occurs when the
vibrational state of a molecule is changed after its interaction with a photon which results in a
change in the frequency of the photon. Raman scattering can be further broken down into two
types Stokes and anti-Stokes Raman scattering (Figure 1.14)
Figure 1.14 Jablonski diagram showing the change in vibrational energy of a molecule upon interaction with a photon. In Rayleigh scattering, the predominate form of light scattering, the electrons are excited to a virtual state before returning to the original vibrational energy level. In Stokes and Anti-Stokes Raman scattering, the electrons are excited to a virtual energy state, before returning to a higher and lower energy state (with respect to the original energy state) respectively (Biomed.tamu.edu. 2016)
30
In order for Stokes scattering to occur a molecule needs to be excited to a virtual energy level
that comprises a distortion of an electron cloud so when it then returns to the first excited
vibrational state, a photon with a lower energy (longer wavelength) is emitted. The energy
difference between the incident and emitted photon excite the molecule to a higher vibrational
state ( Gauglitz et al. 2003; Ball 2001).
In anti-Stokes scattering the molecule is in a higher vibrational energy level so when
subsequently excited to a virtual energy level, relaxes, and returns to the ground vibrational
state. In this case, the energy difference between emitted and excited photon is converted to
radiant energy and a vibrational quantum has been annihilated (Gauglitz et al. 2003; Ball 2001).
For a molecular vibration to be Raman active, a change in net molecular polarizability must
occur. The polarizability (α) represents the ability of an applied electric field, E, to induce a
dipole moment, μ0, in an atom or molecule; a process represented mathematically by the
equations below (Ball 2001):
o E
Equation 1.1 Dipole moment.
At the molecule’s nuclear geometry equilibrium the polarizability has a value, α0. In case of
displacement, ∆r, away from the molecule’s equilibrium geometry, the instantaneous
polarization α is given by:

31
o
r
r
Equation 1.2 Instantaneous polarization at equilibrium displacement where
r
represents the change in polarizability as a function of displacement.
If the molecule is vibrating in a sinusoidal fashion, ∆r can be written as a sinusoidal function
in terms of the frequency of the vibration, νs, and the time, t:
∆𝑟𝑟 = 𝑟𝑟𝑚𝑚𝑚𝑚𝑚𝑚 𝑐𝑐𝑐𝑐𝑐𝑐(2𝜋𝜋𝜋𝜋𝜋𝜋)
Equation 1.3 Equilibrium displacement when the molecule vibrates in a sinusoidal
fashion where rmax is the maximum vibrational amplitude.
Light of a particular frequency, νo, has an associated electric field, E, which also has sinusoidal
behaviour:
E Emax cos2 v0t
Equation 1.4 Electric field where Emax is the maximum electric field frequency.
Equations 1.1 to 1.4 can thus be written into equation 1.5 so that the first term represents the
scattered phenomenon of a photon with the same intensity as the incident photon – Rayleigh
scattering. The second term represents the Raman scattering of frequency v0+vs (anti-Stokes
scattering) when the frequency of the scattered photon increases by molecular motion, vs; and
v0-vs (Stokes scattering) when the frequency decreases.

32
E cos(2 t) E r d
cos(2 t) cos(2 t) ⇔ 0 0 max 0 max max
dr s 0
⇔ E cos 2 v t
Emax
rmax
cos 2 t v
v cos 2 t v v
o o max o 2
r o s o s
Equation 1.5 Scattered light component frequencies by oscillating polarization in which
v0 is the frequency of incident light and vs is the frequency of the scattered molecular
motion.

33
1.5.2 The Raman Spectrum
The Raman spectrum of cells and tissues is made up of a superposition of many biochemical
components including DNA, RNA, proteins, lipids and carbohydrates. A Raman plot is the
intensity of the scattered light which is measured in arbitrary units vs. the Raman shift which
is measured in wavenumbers (cm-1). The shift provides information on the vibrational,
rotational and other low frequency transitions in a given sample. The full spectral range
extends from 400-3500cm-1. The fingerprint region extends from 400-1800 cm-1 and the high
wavenumber region extends from 2800-3500 cm-1 (Figure 1.15).
Figure 1.15 Raman spectrum of cervical cancer CaSki cell line. The variation of Raman shift wavelength is expressed in wavenumbers (cm-1) and can be observed along the X-axis whilst the intensity is represented along the Y-axis. The fingerprint and the high wavenumber (HW) regions of the spectrum are indicated by the arrows.
Biological studies typically focus on the fingerprint region of the spectrum between
wavenumbers 400cm-1 to 1800cm-1 (Figure 1.16). It is important to note that Raman peaks
representing the Raman active molecules often overlap and can obscure one another. Some
are narrow bands whereas others are broader. A tentative assignment of Raman peaks is
presented in Table 1.1.

34
Wavenumber cm
0.08
0.06
0.04
0.02
0
-0.02
400 600 800 1000 1200 1400 1600 1800
Figure 1.16 Raman spectra of a cervical Intermediate cell recorded in the fingerprint region 400-1800cm-1.
Wavenumber cm-1
Arb
.Un
its

35
Table 1.1Tentative Peak Assignments for Raman spectra of cells and tissues (Movasaghi et al. 2007)
Raman peak
position [cm-1]
Proteins Lipids Carbohydrates Nucleic acids
482 Glycogen
577 Glycogen
622 C-C twist Phe
643 C-C twist Tyr
727 CH2 def C-C head A
752 Sym br. Trp
781 U,C,T ring br
826 Out of Plane
ring br.Tyr
PO2 a.str
851 Ring br. Tyr,C-
C str. Pro
852 Glycogen
937 Glycogen
985 C-C head
1002 Sym. Ring br.
Phe
1033 C-H in plane
Phe, C-C str
1044 Glycogen
1060 C-N str

36
1082 C-N str Chain C-C str C-O str,
Glycogen
1096 Chain C-C str C-C str
1106 Glycogen
1123 C-N str Chain C-C str C-O str
1152 C-N str
1207 C-C6H5 str.
Phe, Trp
1238 C-N str, Amide
III
1261 Glycogen
1334 Glycogen
1338 Trp G
1366 Sym. Str. CH3
1381 Glycogen
1450 CH2 def CH2 def
1458 Glycogen
1487 CH2 def G,A
1560 Tyr, Trp
1575 A,G ring br
1584 C=C str, C=C
bend. Trp, Phe
1605 C=C Phe, Tyr

37
1642 C=O str, C=C
sym. Str.
1669 C=O str. Amide
I
1.5.3 Raman Instrumentation
The Raman microspectrometer used in this study (Labram XploRATM Raman spectrometer)
(Figure 1.17 (A)) consists of a Raman spectrometer joined to an optical microscope which
facilitates focusing of the Raman laser on particular areas of interest in the cells. A 532 nm
green Argon ion laser (Figure 1.17 (B)) was used and focused through an x100 objective lens.
The objective lens also allows for the collection of the Raman scattered light. The scattered
light is then dispersed by the diffraction grating onto a charged coupled device, which
converts it into an electrical signal which is projected as a spectrum. The grating used will
determine the spectral resolution via the groove density of the grating. Typically 300-1800
grooves/mm are used. The presence of a notch filter prevents the elastically scattered light
(Rayleigh scattering) from reaching the detector (Figure 1.18).

38
Figure 1.17(A) Labram XploRATM Raman spectrometer. The spectrometer is linked to a confocal microscope, which allows the user to view the sample surface and direct the laser accordingly. Figure 1.17 (B) A 532 nm green Argon ion laser focused through an x100 microscope objective.
Figure 1.18 Basic Schematic of Raman spectrometer. The argon ion laser is deflected by a series of mirrors onto the sample surface. Scattered light is collected by the objective lens and sent through a filter onto a holographic grating and finally onto a CCD (Laboratory,T.P.K. Spectroscopic Characterization, 2012)
1.5.4 Raman Spectroscopy in Cancer Research
Raman spectroscopy has the potential to play an important role in diagnostic cytology,
histology, biopsy targeting, surgical targets, treatment monitoring and drug studies (Baker et
al., 2018). A study conducted by Pirro et al used fibre based Raman spectroscopy for intra-
operative guidance of brain surgery aiming to minimise the amount of brain tissue removal
by identifying brain cancer (glioma) from normal brain tissue. They concluded that Raman
spectroscopy could accurately differentiate normal brain from dense cancer and normal brain
invaded by cancer cells, with a sensitivity of 93% and a specificity of 91% (Pirro et al.,
2017).
B

39
A study conducted by Brozek-Pluska et al, attempted to use Raman spectroscopy for imaging
as well as diagnosis of breast cancer based on paraffin embedded tissue sections that were
cancerous and non-cancerous from the same patient. They concluded that Raman bands
associated with carotenoids, proteins and lipids dominated the spectra obtained from
cancerous tissue when compared to non-cancerous tissue (Brozek-Pluska et al., 2012).
Biofluids are an up and coming trend in the field of spectroscopy. Given the ease of
collection and general acceptance by patients, biofluidscan give an accurate snap shot of a
patient’s health (Baker et al., 2018). A recent study conducted by (Medipally et al., 2017)
aimed to develop a high throughput Raman spectroscopy method for rapid screening of liquid
blood plasma from prostate cancer patients. Sample preparation parameters were
investigated, with the aim of identifying a combination that would reduce the overall
acquisition time for spectra from peripheral blood plasma, reduce the complexity of sample
preparation and retain the classification accuracy from Raman spectroscopic diagnostics.
They identified spectral differences in the region around 1155 and 1523 cm-1 that were highly
expressed in healthy volunteers compared to prostate cancer patients. Control versus cancer
cases could be classified with similar discriminating features using both 785 and 532 nm laser
lines and the discriminating features were resonant at 532 nm. A sensitivity and specificity of
96.5% and 95% respectively was achieved (Medipally et al., 2017).
A recent study conducted by Behl et al, attempted to standardise the protocol for Raman
spectroscopy for oral cancer screening. Testing various collection methods the study was able
to record high quality spectra from cells obtained from both the ventral side of the tongue and
the buccal mucosa. The study utilised the Thinprep method of sample preparation cells were
recorded on a glass substrate (Behl et al., 2017).

40
1.5.5 Raman Spectroscopy in Cervical Cancer Research
In 1998, MahadevanJansen. et al (1998) developed an in vivo fiberoptic probe for the clinical
diagnosis of cervical pre-cancers. They determined that an acquisition time of 90 seconds was
required to obtain adequate spectra of the cervix however if they increased the power of the
excitation source they could reduce that acquisition time to less than 20 seconds. Longer
acquisition times increase signal to noise ratio however too long of an acquisition can result
in burning of the sample resulting in a spectrum with ill-defined Raman bands not suitable for
analysis.
Another clinical trial by the same group (Utzinger, et al., 2001) showed that in vivo Raman
spectra resemble ex vivo cervix tissue. This study was also completed using acquisition times
of 60-180 seconds which is longer than is clinically accepted.A study conducted by
Robichaux-Viehoever et al. (2007) utilized clinically feasible acquisition times of 5 seconds.
The study concluded by stating that they were able to distinguish between benign and high
grade dysplasia with a sensitivity and specificity of 89% and 81% respectively. A probe
based study investigated the effect of race, ethnicity, body mass index, parity and social
economic status on Raman spectra from patients with a normal cervix and determined that
only body mass index and parity resulted in significant variation within the spectral profile
(Vargis et al., 2011). A study conducted by Krishna et al. (2006) used formalin fixed cervical
tissues using Raman and FTIR spectroscopy. They reported the ability to distinguish between
normal and malignant tissues based on differences in protein, lipids, and nucleic acid peaks
and stronger amide III assignments, indicating disorder, helical secondary-protein structure in
malignant conditions. A recent study Kanter et al. (2009) categorized the spectra according to
the menstrual cycle and menopausal status and histopathological classification as determined
by the pathologist. The results showed that incorporating the women’s hormonal status and
particular point in the menstrual cycle and menopausal state resulted in a classification

41
accuracy of 94%. Kamemoto et al. (2010) reported the ability to distinguish normal cervical
tissue from invasive cervical cancer tissue using frozen tissue sections. The discrimination
was mainly based on collagen and CH stretching bands. A study conducted by Rashid et al.
(2014) attempted to utilise formalin fixed paraffin embedded cervical tissue sections for
Raman spectroscopy analysis. They concluded that they were effectively able to distinguish
negative/normal tissues from pre-cancer tissue based on a reduction in glycogen and an
increase in nucleic acids. The pre-cancer tissue loses differentiation with increased
proliferation which resulted in reduced levels of glycogen while the cells that make up the
normal tissue accumulated glycogen as they matured. Most Raman studies investigating
cervical cancer fail to incorporate HPV into their analysis. Jess et al. (2007) outlined the
clinical importance of Raman spectroscopy for identification of HPV infection. Fixed and
live cell lines were recorded which included PHK cells that express the E7 gene of HPV 16
and CaSki cells which are a HPV 16 containing cervical carcinoma derived cell line. The
results demonstrated a change in the Raman peaks most likely associated with DNA and
protein which are consistent with an active HPV infection and changes associated with
neoplasia. Ostrowska et al. (2010) used Raman and FTIR spectroscopy to study cervical
cancer cell lines. HPV-negative (C33a) and low HPV copy number (SiHa) cell lines were
investigated. Both cell lines were found to be biochemically similar but different when
compared to mid (HeLa) and high (CaSki) HPV copy number cervical cancer cell lines. They
reported variations in protein, nucleic acid and lipid bands. Using partial least squares
regression analysis with HPV copy number as a target, the spectral profile of the cells could
be used to evaluate the degree of HPV infection. Vargis et al. (2012) utilised both cell lines
and cytology samples to investigate the potential of Raman microspectroscopy to detect the
presence of HPV. They achieved discrimination between HPV negative normal human
keratinocytes (NHEK), HPV negative cervical cancer cell line (C33a) and HPV positive

42
cervical cancer cell lines (HeLa and SiHa) with an accuracy of 89-93%. A study conducted
by Rubina et al. (2013) used Raman spectroscopy to identify negative cervical cytology
samples from cervical cancer samples. The results showed that the spectra were contaminated
with blood and removal of this blood with the use of a red blood cell lysing agent, however,
failed to improve the sensitivity values of 79%. Bonnier et al outlined the crucial need to
adapt Raman spectroscopy protocols to reach suitable reproducibility for screening a large
cohort of patients (Bonnier et al., 2014). The study demonstrated the use of H2O2 and
industrial methylated spirits to remove contaminating blood residue which contributed to
variability in the spectroscopic data sets. This was achieved without altering cell morphology
or spectral features. Ultimately this work further demonstrated the potential of Raman
spectroscopy to be used as a cervical cancer screening method based on improved sample
preparation. A study conducted by (Duraipandian et al.,2018) outlined Raman spectroscopy
ability to detect high-grade cervical cytology using morphologically normal appearing cells.
They reported high rates of sensitivity and specificity for classifying HSIL cases based on
intermediate and superficial cells. They also reported that intermediate and superficial cells
could be mixed when recording and still be used for HSIL diagnosis as the biochemical
difference between negative and HSIL samples were more than the biochemical differences
between intermediate and superficial cells. A recent study defined the Raman spectral
signatures of cervical exfoliated cells present in liquid-based cytology Pap test specimens and
compared the signature of high-grade dysplastic cells to each of the normal cell types
(Kearney et al., 2017). The study demonstrated that Raman spectroscopy can identify
biochemical signatures associated with the most common cell types seen in liquid-based
cytology samples; superficial, intermediate, and parabasal cells. In addition, biochemical
changes associated with high grade dysplasia could be identified suggesting that Raman
spectroscopy could be used to aid current cervical screening tests.

43
1.6 CERVIVA
This body of work was performed as a continuation of on-going research on the application
of Raman spectroscopy into cervical cancer screening which was conducted under the
direction of the CERVIVA consortium (www.cerviva.ie).
CERVIVA is an Irish research consortium that was founded in 2005 by Prof
John O’Leary and Dr Cara Martin. The aim of CERVIVA is to provide research in the field
of HPV associated diseases while supporting CervicalCheck and national agencies.
CERVIVA is funded by the HRB, The Irish Cancer Society, and Friends of the Coombe and
works closely with universities, government health agencies and biotechnology companies.
1.7 Research Question and Hypothesis
Research Question:
Can Raman spectroscopy be used as a tool for cervical cancer screening?
Hypothesis
We hypothesise that Raman spectroscopy can be used to differentiate between
normal and abnormal cervical cytology smear samples.
1.8 Aims and Objectives
To conduct a study of variability due to hormonal effects in cervical Pap smear
samples using Raman spectroscopy
To conduct a study on the removal of contaminating blood from cervical Pap smear
samples and the implications for cervical cancer screening using Raman spectroscopy
To assess the utility of frozen biobanked samples for cervical cancer screening using
Raman spectroscopy
To assess the utility of Raman spectroscopy as a triage test for cervical cancer
screening

44
Chapter 2
Materials and Methods
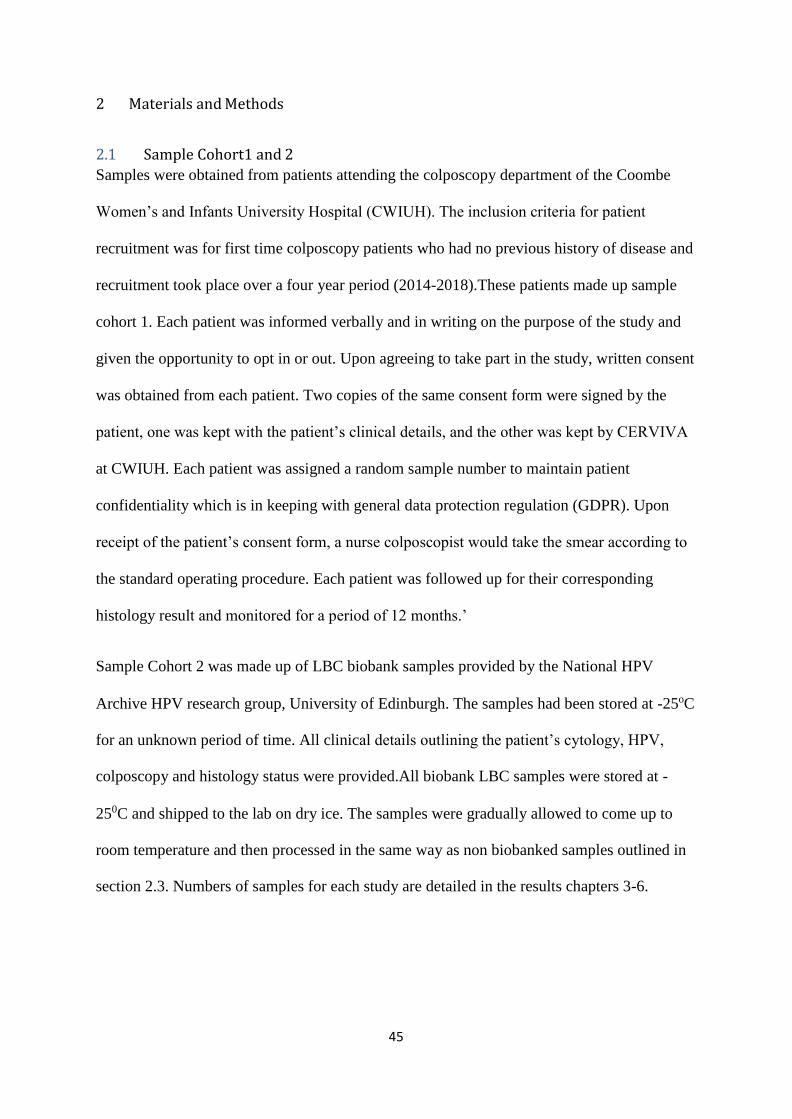
45
2 Materials and Methods
2.1 Sample Cohort1 and 2
Samples were obtained from patients attending the colposcopy department of the Coombe
Women’s and Infants University Hospital (CWIUH). The inclusion criteria for patient
recruitment was for first time colposcopy patients who had no previous history of disease and
recruitment took place over a four year period (2014-2018).These patients made up sample
cohort 1. Each patient was informed verbally and in writing on the purpose of the study and
given the opportunity to opt in or out. Upon agreeing to take part in the study, written consent
was obtained from each patient. Two copies of the same consent form were signed by the
patient, one was kept with the patient’s clinical details, and the other was kept by CERVIVA
at CWIUH. Each patient was assigned a random sample number to maintain patient
confidentiality which is in keeping with general data protection regulation (GDPR). Upon
receipt of the patient’s consent form, a nurse colposcopist would take the smear according to
the standard operating procedure. Each patient was followed up for their corresponding
histology result and monitored for a period of 12 months.’
Sample Cohort 2 was made up of LBC biobank samples provided by the National HPV
Archive HPV research group, University of Edinburgh. The samples had been stored at -25oC
for an unknown period of time. All clinical details outlining the patient’s cytology, HPV,
colposcopy and histology status were provided.All biobank LBC samples were stored at -
250C and shipped to the lab on dry ice. The samples were gradually allowed to come up to
room temperature and then processed in the same way as non biobanked samples outlined in
section 2.3. Numbers of samples for each study are detailed in the results chapters 3-6.

46
The number of samples selected and overall number of spectra recorded for each chapter was
determined by the availability of samples recruited from CWIUH and the National HPV
Archive HPV research group while ensuring that the same number of spectra was recorded
for each category. This helped to ensure no bias with regards to leave one patient out cross
validation and model prediction. As this was a pilot study and sample numbers were limited,
power calculations were not applicable.
2.2 HPV Testing
2.2.1 CobasR 4800 HPV DNA Test
The Cobas 4800 (Roche Diagnostics) is an automated system for the extraction of HPV DNA
and the detection by real time PCR of 14 different high risk HPV types (16, 18 , 31,33, 35,
39, 45, 51, 52, 56, 58, 59, 66 and 68) with the ability to genotype for HPV 16 and 18. The
system consists of two parts, the first is a sample extraction and preparation instrument
(X480) and the second is an analyser (z480) which carries out real time PCR on the processed
samples (Figure 2.1).
The system starts once the samples are loaded and a barcode is assigned to each sample.
After sample loading, the reagents (SDS magnetic glass particles, wash buffer, lysis buffer
positive control, negative control, PCR master mix, Proteinase K, Magnesium ions) and
consumables (96 well plate, deep well plate, 1000 l tips and reagent reservoirs) are scanned.
The rest of the process is automated, which involves 400 l of the LBC samples being
collected and digested under denaturing conditions at elevated temperatures, before the cells
are lysed by a chaotropic reagent which results in the release of HPV nucleic acids. These
nucleic acids are negatively charged and will bind to the positively charged magnetic glass
particles, which are held in place with a magnetic plate. The nucleic acids are then washed
and separated from the glass particles before they are amplified and detected by real time

47
PCR. Approximately 200 nucleotides are targeted by the primers for the PCR reaction which
are located within the L1 region of the HPV genome. The master mix contains primers
designed for 14 different high risk genotypes (16, 18, 31, 33, 35, 39, 45, 51, 52, 56, 58, 59, 66
and 68). Fluorescent oligonucleotides probes will then bind to the sequences within these
primers during PCR. A meta-analysis of 23 industrialised countries using the Hybrid Capture
2 (HC2) HPV assay indicate that the pooled sensitivity of primary HPV screening in the
detection of CIN 2+ and CIN 3+ was 95.2% (95% CI: 92.5% to 97.1%) and 98.2% (95% CI:
96.7% to 99.1%). The specificity reported in detecting CIN 2+ was 88% and CIN 3+ was
87.6% (HIQA,2017).
Figure 2.1The Cobas® x480 instrument and z480 analyser. The cobas® x480 (left) is an automated system that extracts DNA from ThinPrep cervical cytology specimens. The z480 analyser (right) then amplifies and detects the presence of 14 different high risk HPV genotypes.

48
2.2.2 Aptima HPV mRNA test
The Aptima assay (Hologic Gen-Probe, san Diego, Ca, USA) is an automated target
amplification assay that detects the presence of E6/E7 mRNA from 14 high risk HPV types
with the entire process being automated and carried out by a dedicated system, the Panther
instrument (figure 2.2).
Figure 2.2 Panther instrument which runs the Aptima HPV assay, and detects HPV mRNA from 14 high risk HPV types. All samples as well as assay reagents and consumables were loaded into the Panther system prior to beginning an assay run. Panther functions were controlled through the use of the on board computer, shown to the right of the main instrument.
The first step involves the transfer of 1 ml of the test sample into transport media (STM)
which causes the cells to lyse and prevents RNA degradation. The STM tubes are then placed
into the sample racks and placed into the Panther instrument. HPV amplification reagents,
HPV enzyme reagents, HPV internal control reagent and HPV selection reagents are loaded
into the instrument. Positive and negative calibrators are present within the system. The
samples are then run. mRNA is isolated using capture oligomers which are bound to
magnetic micro particles. The oligomers bind to the target sequences in the mRNA target,
before the complex is removed from the solution using magnets while the supernatant is

49
aspirated. The complex is then washed before the mRNA is amplified through the use of an
MMLV reverse transcriptase and T7 RNA polymerase. The reverse transcriptase is used to
generate a DNA copy of the target mRNA sequence containing a promoter sequence for T7
RNA polymerase. T7 RNA polymerase produces multiple copies of RNA amplicon from the
DNA copy template. Detection of the amplicon is achieved by HPA using single-stranded
nucleic acid probes with chemiluminescent labels that are complementary to the amplicon
which are detected through an illuminometer. The detection step is completed by the
software which analyses the signal in order to produce the assay results.
2.3 ThinPrep slide preparation
A slide was prepared for each sample using a ThinPrep 2000 processor (Hologic Inc;
Marlborough, MA 01752, America). The Thin Prep processor starts by homogenizing the
sample by spinning the filter, creating shear forces in the fluid that are strong enough to
disaggregate randomly joined material, break up blood, mucus and non-diagnostic debris.
The cells are then collected onto the membrane of the filter and transferred onto a glass slide
to create a circular monolayer deposit of cells 20 mm in diameter and a few microns in
thickness. The slide is then ejected automatically into a fixative bath of 95% ethanol.
2.4 H2O2 treatment LBC samples can contain varying levels of blood according to a blood scale index (0-3).
Blood can also be present even though it may not be visible to the human eye, however it has
previously been shown that Raman spectroscopy can detect these low levels of hemoglobin
present (Bonnier et al., 2014) thus blood is deemed a limiting factor and should be removed.
An in house method of utilizing H2O2 for the removal of blood was applied to all samples
regardless of whether there was visual evidence of blood present in the LBC samples or not
(Bonnier et al., 2014). The H2O2 method works by oxidizing the hemoglobin present within
the blood. The ThinPrep slides were covered in H2O2 for 30 seconds before washing in 70%

50
industrial methylated spirits (IMS) for 3 minutes, followed by multiple dips in 100% IMS to
remove any remaining H2O2. The slides were then allowed to air dry and ready for
spectroscopic analysis.
2.5 Raman Measurements
All samples used as part of this study were recorded on a HORIBA Jobin Yvon XploRATM
system (Villeneuve d’Asq, France), which is connected to an Olympus microscope Bx41
equipped with a X10 and X100 objectives (MPlanN, Olympus). The equipped laser is a 532
nm green argon ion laser with a spot size of 1-2 μm. The power of the laser was set at 100%.
The confocal hole and slit was set at 100 μm with a 1200 lines/mm grating. The 1200 grating
gives a spectral resolution of 3 cm-1 per pixel.
The Raman spectrometer was calibrated to the spectral line of silicon, 520 cm-1. The dark
current, the reference spectrum of polystyrene and of the NIST standard and the daily laser
intensity were recorded. A CCD detector (Andor, 1024x256 pixels) was used and Labspec
v6.0 software (Horiba Jobin Yvon) was used to operate the Raman spectrometer. One Raman
spectrum was recorded from the nucleus of each cell for 30 seconds and averaged over two
accumulations. This helps to increase the intensity of the scattered photons and reduces noise.
The number of cells recorded from each sample depended on the quality of the cells present
on the slide. A suitable cell would present on the slide as a single cell not obscured by
surrounding material with the nucleus and cytoplasm being well defined. As all the cells
recorded (Superficial and Intermediate) were morphologically normal, they were consistent
in their size and shape and overall appearance (section 1.2.1). A good quality Pap smear
would allow 25 cells to be recorded per sample. The coordinates of each cell was recorded in
each sample and saved using the Labspec software. A typical slide could take between 35-40
minutes to complete recording. Chapter 3 involved the recording of dyskaryotic cells from 15
HPV positive, high grade dyskaryotic samples. As these cells were not morphologically

51
normal and could be present in low numbers it took additional time (20-30 minutes) to screen
for these abnormal cells. Samples were also recorded randomly (ie. not recorded in batches
according to any biological class) across a four year time period. This helped avoid any batch
effects in our recording.
2.6 Pap stain
The Pap stain was carried out on each ThinPrep slide after Raman spectral recording. The
protocol was carried out in the following manner. Each slide was soaked in a bath of equal
parts distilled water and glycerol for 10 minutes. The slides were then washed in distilled
water for 2 minutes. The slides were then submerged in hematoxylin for 2 minutes and
washed in running hot tap water for 2 minutes. 1 % acetic was then added and washed off in
distilled water for 1 minute. The slides were then submerged in 70% and 95% industrial
methylated spirits (IMS), followed by 3 minutes in OG6. The slides were then washed in
100% IMS for 2 minutes followed by Xylene for 1 minute. The slides were then mounted in
Coverquick and cover slipped. The Pap stain was only performed once the spectroscopic
analysis was complete.
2.7 Raman Spectral Processing
All sample data was pre-processed regardless of when or how the samples were recruited to
avoid bias. Data was normalised and analysed using Matlab software (Mathworks) and
specific scripts developed and adapted for uploading of the spectra and their pre-processing,
including smoothing (Savitzky-Golay K=5, K=13) baseline correction (Rubberband) , vector
normalization and glass subtraction
2.7.1 Smoothing
Smoothing is employed for the removal of high frequency components. Savitzky- Golay
filtering is a common technique employed (Gautam et al., 2015). The goal of smoothing is to

52
remove rough changing components of the spectra and to highlight slow changes in intensity
so that it’s easier to see trends in data.
2.7.2 Base Line Correction
A common problem when using Raman spectroscopy is fluorescence. When a sample
fluoresces the fluorescing photons can be detected by the photon detector thereby distorting
the Raman spectrum obtained from the test sample resulting in an elevation of intensity
which can obscure biological peaks particularly those in the fingerprint region. Rubberband
baseline correction is employed to correct this change in intensity. First the spectrum is
divided up into a given number of ranges. The lowest point in each range is determined, then
the initial baseline is built out of those points. All the points on the spectrum are then drawn
down by the difference between the lowest point on the baseline.
2.7.3 Vector normalization
Raman spectra can exhibit a change in intensity levels even when recording the same sample
due to different Raman conditions such as a change in laser alignment or power levels.
Raman spectra from the same sample could have different intensity levels. Normalization is
the process that corrects for this change in intensity by making sure the intensity of a given
band (1004 cm-1) of the same material is similar across all the spectra recorded under slightly
different conditions. Vector normalisation involves calculating the norm which is defined as
the square root of the sum of the squared intensities of the spectrum. Each of the Raman
intensities corresponding to a Raman shift is divided by the norm to obtain the normalized
spectrum (Gautam et al., 2015).This is a standard operating procedure for all Raman
spectroscopic analysis.
53
2.7.4 Glass subtraction
Glass is the only substrate used in cytopathology as it is inexpensive and allows the
processing of hundreds of samples a day. Its use in Raman spectroscopy, however, is
hampered by the fact that glass exhibits broad peaks at 550 and 1100cm-1 which overlap with
the biological spectra in the fingerprint region thus resulting in the need for the spectra to be
corrected for glass background.
There are two ways that the contribution of glass to the spectra can be reduced. The first
involves the fine focus of the laser on the target cell’s nucleus. Focusing the laser on the
upper portion of the nucleus to increase the distance between the laser and the glass slide
reduces the glass contribution to the spectra. The second involves the use of an in house
developed algorithm based on non-negativity constrained least squares (NNLS). In NNLS,
the coefficients are not allowed to become less than zero. Using a matrix of 300 glass spectra
(Figure 2.3), and a set of cellular components (nucleic acids, proteins, and carbohydrates), a
non-negative vector is found that estimates the contributions of the cellular components and
glass to the recorded cell spectrum. This vector is then multiplied by the glass matrix and cell
components, before being subtracted from the original recorded cell spectrum (Figure 2.4).
After these pre-processing steps, the data was mean centered and subjected to partial least
squares discriminant analysis (PLSDA). It is possible to use other forms of substrate such as
calcium fluoride which don’t require subtraction, as this does not contribute a Raman signal
to the spectrum in the fingerprint region. This substrate is very expensive, however, and as it
is thicker than a glass slide, Thinprep technology cannot be used for slide preparation.

54
Figure 2.3 300 glass spectra recorded in the fingerprint region 400-1800cm-1
Figure 2.4 100 Intermediate cell spectra before (blue) and after (red) pre-processing for glass removal.
-1
-1

55
2.8 Partial least squares discriminant analysis (PLSDA)
Partial least squares discriminant analysis (PLSDA) is a chemometric technique used to
optimise the separation between different groups of samples. It is a supervised form of
multivariate analysis which works as a linear classifier. Its aim is to maximise the variance
between groups and to minimise the variation within each group. The loadings/latent
variables (LVs) can be plotted to give information on the source of the variation between
groups. PLSDA was chosen over multivariate techniques for a number of reasons. The first
being that it can analyse data with numerous variables and it works well on data that is noisy.
The limitations of PLSDA can be, that it can over fit a model meaning that it can classify
training data well but not new data. This can be corrected for by using a validation data set or
a method of cross validation (Ballabio et al., 2013). Mean centering (dividing all the
variables by the mean) was performed on the pre-processed spectra before PLSDA modelling
to adjust for the variance between large and small unit variables, leaving the relevant variance
(between the samples) for analysis.
2.9 Cross –Validation
Cross-validation is a model validation technique used to assess how results will generalize to
a new dataset. It is mainly used to determine prediction (how well a model will predict in
practice). The main reason for using cross validation instead of conventional validation is that
conventional validation requires a 70:30 split of the data. 70% for training and 30% for
testing (Dobbin K et al., 2011). However in most cases there isn’t enough data available to
separate out 70% for training and 30% for testing without losing modelling or test capability,
hence the use of cross validation (Kohavi., 1995). Cross validation is performed by dividing
samples into validation groups. Each group is then removed from the training set one at a
time. The model is then calibrated on the remaining training samples and is then used to
predict samples of the cross validation group (Ballabio et al., 2013). In this study one
methods of cross validation was performed.

56
Leave one patient out = A test set is determined by leaving out each patient sample
one at a time and comparing it to the training set. Every sample is tested. This helps
ensures bias is avoided.

57
Chapter 3
A study of hormonal effects in cervical smear
samples using Raman spectroscopy.
Adapted from: Traynor D, Kearney P, Ramos I, Martin CM, O'Leary JJ, Lyng FM. A study
of hormonal effects in cervical smear samples using Raman spectroscopy. J.
Biophotonics. 2018;e201700240.

58
3.1 Introduction:
Until recently the primary method for cervical screening was based on the Papanicolaou
test (Pap test). The Pap test requires cells to be scraped from the cervix, fixed to a glass slide,
stained and reviewed by a trained cytologist. Cellular abnormalities are identified by the
cytologist based on cellular morphology and staining characteristics and classified according
to the degree of dysplasia (Low grade or High grade). The advantage of the Pap test is that it is
a widely accepted screening based test with a high specificity of 95-98% and a sensitivity of 74-
96% (Kitchener et al., 2011). The variability in the rates of sensitivity can be due to sampling
technique; the subjectivity of the cytology based screening and can result in a high rate of
gynaecological referral and patient recall which adds to cost and patient stress. Persistent
infection with high risk human papillomavirus (HPV), such as HPV types 16, 18, is accepted as
the major cause of cervical pre-cancer and cancer (Walboomers et al., 1999 ). HPV DNA testing
has a higher sensitivity (>95%) but lower specificity (~ 84%) than the Pap test (Cuzick et al.,
2013) and these tests are expensive, time-consuming and provide no information on cervical
cytopathology. Current gold standard methods for detection of cervical cancer and pre-cancer
are therefore limited and there is an unmet clinical need for new objective screening or
diagnostic tests. Optical spectroscopic techniques, such as Raman or infrared spectroscopy, are
label-free, non-invasive and have several advantages over traditional approaches, including
objectivity, speed and cost. These methods can provide quantitative information based on the
spectroscopic signature of the biochemical components of the sample allowing diagnosis to be
based on biochemical changes rather than on morphological changes. The focus of the present
study is on Raman spectroscopy, which is based on inelastic light scattering. The coupling of
the light generates vibrations within the material and these vibrations are characteristic of the
chemical structure, the energy of the scattered light is reduced by an amount equal to the
vibrational energy and from this a rapid, label free, non-destructive measurement of the

59
complete biochemical fingerprint of a biological sample can be obtained. Over the past 15
years, the potential of Raman spectroscopy together with multivariate statistical analysis has
been demonstrated for the detection of a variety of cancers, including cervical cancer (Diem et
al., 2013, Lyng et al., 2015). In initial infrared spectroscopy studies on cervical cytopathology
samples ( González-Solís et al., 2013, Wong et al., 1991), spectra were recorded from cell pellets
rather than from single cells and the presence of metaplastic cells, endocervical columnar cells,
polymorphs, blood, cervical mucus and debris were all identified as confounding factors (Wong
et al., 2002, Chiriboga et al., 1998, Cohenford et al., 1997, Diem et al., 2002, Wood et al.,
1998). Recent studies by Ramos et al. (2016) and Bonnier et al. (2014) addressed the variability
in Raman spectra from cervical smear samples and reported a new method to clear blood
residue contamination before Raman spectroscopy based on pre- treatment of the slides with
hydrogen peroxide. This method significantly minimised variability and resulted in the
collection of highly reproducible data and was employed in this study to reduce variability
based on the presence of blood residue. Physiological factors such as hormonal changes during
the menstrual cycle or during menopause may also be potential sources of variability in the
normal cervix.
The cellular make up of an individual woman’s smear is dependent on which day during
the menstrual cycle the sample was taken. Days 1-4 are classed as the menstruation phase of
the cycle when bleeding will occur and smear samples are generally not taken during this phase.
Days 5-13 are classified as the proliferative phase. During this phase oestrogen levels reach
their peak resulting in complete maturation of the squamous epithelium and the cervical smear
will present with a higher ratio of superficial cells to intermediate cells. Days 14-28 are
classified as the secretory phase where progesterone production reaches its peak and prevents
complete maturation of the epithelium. The cervical smear will present with a higher ratio of
intermediate cells to superficial cells. During menopause, levels of both oestrogen and

60
progesterone will drop dramatically and there is a gradual arrest of the maturation of the
squamous epithelium. This results in the loss of superficial and intermediate cells leading to
the final atrophic stage where the squamous epithelium is composed entirely of parabasal cells.
The use of hormone based contraceptives (HC) will affect the natural hormone mediated
maturation process of the cervical epithelium. A study by Romeo et al. (2002) used infrared
spectroscopy to investigate hormonal influences on cervical cells throughout the menstrual
cycle and showed spectral changes such as increases in the 1200-1000 cm-1 region due to
glycogen increases around ovulation (mid cycle). Cervical cells from women on HC did not
show the same degree of spectral changes as cells from women not on HC. Despite the
variability throughout the menstrual cycle, principal component analysis (PCA) showed good
discrimination between high grade dysplasia and normal samples collected at different phases
of the menstrual cycle.
A more recent study by Kanter et al,(2009) has shown that hormonal differences due
to the menstrual cycle can influence the Raman spectra acquired from the cervix in vivo.
Spectra were divided into four groups, pre-menopausal proliferative phase (days 1-14), pre-
menopausal secretory phase (day 15-28+), peri-menopausal and post-menopausal. Spectral
differences were mainly observed at 1250, 1300 and 1320 cm-1, most likely due to changes in
the proteins collagen and elastin (Movasaghi et al.,2007). Incorporating hormonal status into
their dysplasia classification algorithm increased the classification accuracy from 88% to 94%.
The main objective of our study was to investigate hormone associated changes in the Raman
spectra of cytologically negative ThinPrep cervical smear samples related to; (1) the menstrual
cycle, (2) the onset of menopause and (3) the use of hormone based contraceptives. A further
objective was to determine if any changes observed would interfere with the ability to
discriminate normal and high grade dyskaryotic cervical smear samples caused by HPV
infection.

61
3.2 Materials and methods
3.2.1 Sample collection and ThinPrep slide preparation
Cervical smear samples collected in PreservCyt solution were obtained from the Cytology
Department at the Coombe Women and Infants University Hospital (CWIUH), Dublin, Ireland
(recruitment period 2014-2018), after routine cytological screening had been performed.
Ethical approval for use of encoded samples for the study was granted by the CWIUH Research
Ethics Committee (no. 28-2014). Clinical data which was recorded relating to the samples
included cytology result, date of last menstrual period, age at time of smear test and reported
use of hormonal based contraceptives. No information on smoking status was available. A total
of 60 cervical smear samples, 45 confirmed as cytology negative and 15 confirmed high grade
dyskaryosis (high grade squamous intraepithelial lesion (HSIL)) samples, were used for this
study. A slide was prepared for each sample as outlined in section 2.3 and 2.4.
3.2.2 HPV Testing
HPV testing was carried out as outlined in section 2.2.1
3.2.3 Raman Microspectroscopy
Raman recording was carried out as outlined in section 2.5-2.6. 25 cells were recorded from
each cytologically confirmed negative test sample and 35 dyskaryotic cells were recorded in
total from the 15 confirmed HSIL samples.
3.2.4 Data Pre-Processing and Analysis
Data Pre-processing and analysis was preformed as outlined in section 2.7-2.9
From the data provided by the patient about their last menstrual period and the day on which
the sample was taken, the day of the menstrual cycle the smear was taken was calculated. It
was assumed that each patient follows the standard 28 day cycle. Samples were only available
from days 7-24 of the cycle. Table 3.1 shows the sample details including day of the menstrual
cycle, menopausal status and use of hormone based contraceptive (HC).

62
Table 3.1 Sample details including day of the menstrual cycle, menopausal status and use of hormone based contraceptive
Sample number
Cytology
Result
Day of cycle
Postmenopausal
HPV Result
Contraceptive
1 Negative 7 No Negative None
2 Negative 9 No Negative None
3, 4, 5, 6, 7 Negative 10 No Negative None
8, 9 Negative 11 No Negative None
10, 11, 12, 13, 14 Negative 12 No Negative None
15, 16, 17, 18, 19, 20, 21, 22 Negative 13 No Negative None
23, 24 Negative 16 No Negative None
25, 26 Negative 20 No Negative None
27 Negative 21 No Negative None
28 Negative 24 No Negative None
29, 30, 31, 32, 33, 34, 35
Negative Not
applicable
Postmenopausal
Negative
None
36, 37, 38, 39, 40, 41, 42, 43,
44, 45
Negative Not
applicable
No
Negative Hormone based
Contraceptive
46, 47, 48, 49, 50, 51, 52, 53,
54, 55, 56, 57, 58, 59, 60
High Grade Not
applicable
No
Positive
None

63
A B
3.3 Results
3.3.1 Proliferative and Secretory Phase and Postmenopausal Cellular Presentation on
Pap smear.
The proliferative and secretory phase presentation of a Pap smear are shown in Figure 3.1(A)
and Figure 3.1(B) respectively. A higher ratio of superficial (pink stained) to intermediate (blue
stained) cells in the proliferative phase compared to a higher ratio of intermediate (blue stained)
to superficial (pink stained) cells in secretory phase can be observed. A postmenopausal Pap
smear is shown in Figure 3.1(C). A lack of cellular material, mucus and cellular debris can be
observed which caused difficulties in recording good quality spectra.
Figure 3.1 (A) Proliferative phase presentation of a Pap smear. Note the higher ratio of superficial (pink stained) to intermediate (blue stained) cells, (B) Secretory phase presentation of a Pap smear. Note the higher ratio of intermediate (blue stained) to superficial (pink stained) cells, (C) Postmenopausal presentation of a
Pap smear. Note the lack of cellular material, mucus and cellular debris. Bar = 35 m.
C

64
3.3.2 Raman signature of Proliferative Phase Vs Secretory Phase
The spectral data from the Pap smears was divided up according to the day of the menstrual
cycle the sample was taken on. Figure 3.2(A) shows the mean Raman spectra of cells from
days 7 to 24 of the menstrual cycle. Increases in the Amide I (1640-1650 cm-1)(see Table 1.1),
Phenylalanine and Tyrosine (1605-1610 cm-1) and glycogen (480 cm-1) bands over time were
observed. The latent variables (LV) scores scatter plot Figure 3.2(B) shows reasonable
separation between the proliferative phase (blue) and the secretory phase (red). Some
overlapping is observed which is most likely due to the fact that each woman will differ slightly
between the days of the menstrual cycle and the levels of oestrogen and progesterone present.
The LV1 loadings shown in Figure 3.2(C) highlight areas similar to those highlighted in the
mean Raman spectra Figure 3.2(A). The discrimination is mainly based on glycogen (480, 937,
1381, 1458 cm-1) which is more present in the secretory samples (red) due to the higher levels
of progesterone which promotes sub nuclear glycogen accumulation (Nair et al., 2010) and
proteins (CH2 def, 1450 cm-1) and Amide I (1669 cm-1) which are higher in samples collected
from the proliferative phase of the cycle. The prediction plot from the PLSDA model Figure
3.2(D) shows reasonably good classification of menstrual cycle phase (proliferative phase or
secretory phase) with sensitivity of 83% and specificity of 86%.

65
Variable
200 400 600 800 1000 1200
11 dd ee tt cc ii dd ee rr PP VV CC YY
400 600 800 1000 1200 1400 1600 1800
-1
-1
0.12 A
Day 7
Day 9
1640-1650cm-1
0.1 Day 11
Day 12
Day 13
0.08
0.06
Day 14
Day 16
Day 24
480 cm 0.04
0.02
0
-0.02 600 800 1000 1200 1400 1600
-1
Wavenumbers (cm )
0.1
B 0.05
0
-0.05
-0.1
-0.15
D
600 800 1000 1200 1400 1600
-1
Wavenumbers (cm )
Figure 3.2 (A) Mean Raman spectra of intermediate and superficial cells from days 7 to 24. Shading denotes
the standard deviation. Glycogen (480 cm-1), Amide I (1640-1650 cm-1), Phenylalanine and Tyrosine (1605-1610
cm-1) show increases in intensity over time (B) LV scores scatter plot of Proliferative Phase, Days 7-14 (Blue) Vs Secretory Phase, Days 15-24 (Red ), (C) LV1 loadings show that discrimination is based on based on glycogen (480, 937, 1381, 1458 cm-1) and proteins (CH2 def, 1450 cm-1) and Amide I (1669 cm-1) , (D) PLSDA prediction
937 cm
C 1669
1381 cm -1
480
1458 cm-1
Y C
V P
red
icte
d 1
LV
1 (
12.1
1%
)
16
05
-1610
cm-1

66
plot which has a sensitivity of 83% and specificity of 86%.

67
3.3.3 Raman signature of postmenopausal samples
Most women are generally screened for cervical cancer up until the age of 65. Between the
ages of 48-55 most women are said to be menopausal. Hence it is important to determine if Pap
smears collected from postmenopausal women will have a similar Raman signature to non-
postmenopausal women. Mucus and cellular debris present on postmenopausal samples
obscure the little cellular material that is present on the slide and make it very difficult to obtain
good spectra hence the number of spectra recorded is severely reduced and it is difficult to
draw any firm conclusions. Figure 3.3(A) shows the mean and standard deviation spectra of
the 22 postmenopausal cells recorded. Figure 3.3(B) shows good discrimination between the
two sample types. The loadings shown in Figure 3.3(C) shows that the discrimination is based
on glycogen (852, 1106, 1138 cm-1) and nucleic acids (781 cm-1) proteins (1450 cm-1) and
Amide I (1669 cm-1). Figure 3.3(D) shows the PLSDA prediction plot which has a sensitivity
of 100% and specificity of 95%.
Atrophic samples were not available as part of this study. No firm conclusions can be drawn
from this data set except that postmenopausal samples can represent a problem for Raman
based screening based on their Pap smear presentation due to mucus, cellular debris and lack
of cellular material.

68
200 400 600 800 1000 1200
Variable
400 600 800 1000 -11200 1400 1600 1800
WavenuWmbavenumers ber(cms cm)-1
Postmenopausal
Figure 3.3 (A) Mean Raman spectra from postmenopausal samples. Shading denotes the standard deviation, (B) LV scatter scores plot of postmenopausal (blue) and non-menopausal (red), (C) LV1 loadings, (D) PLSDA prediction plot
B
600 800 1000 1200 1400 1600
D Wavenumbers (cm ) -1
C 1106 1669
852
781 1138
1450
A
600 800 1000 1200 1400 1600
Ram
an In
ten
sity
(A
rb.U
nit
s)
LV
1 (
37
.98
%)

69
3.3.4 Raman signature associated with women on hormone based contraceptives.
The clinical details obtained indicated if the patient was on some form of hormone based
contraceptive (HC). However information on which type of contraceptive they are currently on
was not included. The aim of this part of the study was to determine if Pap smears collected
from women on HC will have a similar Raman signature to women who are not on HC. Figure
3.4(A) shows that the levels of glycogen (482 cm-1 and 855-939 cm-1) in the HC positive
samples are lower when compared to the controls. The controls were made up of the samples
collected throughout the menstrual cycle which were HC negative. Tryptophan and
Phenylalanine at peak position (1584-1605 cm-1) and Amide I at peak (1669 cm-1) are higher
in HC samples compared to the control. The lower levels of glycogen in the HC samples could
be linked to lower levels of progesterone due to its role in promoting sub-nuclear glycogen
accumulation. The same could be said for the higher levels of proteins detected (Phenylalanine,
Tryptophan, and Amide I). There is also a consistent change in the shoulder of Amide I, which
is a change in Amide I protein position and folding between HC positive and negative samples.
Overall protein synthesis may be increased due to the constant level of hormones present.
The LV scores scatter plot Figure 3.4(B) shows good separation between HC positive
samples and HC negative samples. There is a small amount of overlapping which could be due
to a number of factors. Multiple types of contraceptive are available which contain different
types and levels of hormones, including implants, injectable contraceptive, progesterone pills,
oestrogen and progesterone pills, combined oral and the patch all of which work by maintaining
a constant level of hormones in the body thus preventing the rise and fall of oestrogen and
progesterone. Hence they may work differently and individual patients will also respond
differently to the levels of hormones present. The loadings 3.4(C) from LV1 show that glycogen
(483 and 1386 cm-1) and proteins and lipids (1146, 1450, 1566 cm-1) and Amide I (1669 cm-1)
are the main discriminating factors between HC positive and HC negative samples

70
400 600 800 1000 1200 1400 1600 1800
Std
HC postive
HC Negative
400 600 800 1000 1200 1400 1600 1800 -1
The PLSDA prediction plot Figure 3.4(D) shows excellent classification with a sensitivity of
100% and specificity of 100%.
0.12
A 0.1 1669 cm
-1
0.08
0.06 939 cm-1
1605 cm -1
0.04 855 cm-1
0.02 482 cm-1
1584 cm -1
600 800 1000 1200 1400 1600
Wavenumbers (cm )
Ram
an In
ten
sity
(A
rb.U
nit
s)

70
200 400 600 800 1000 1200
Variable
Figure 3.4 (A) Mean Raman spectra from HC positive and HC negative cells. Shading denotes the standard deviation, (B) LV scatter scores plot of HC negative (blue) and HC positive (red), (C) LV1 loadings, (D) PLSDA prediction plot.
B C 1669 cm
-
1386 cm
482
1146
1450 cm
-1 1566 cm
-
600 800 1000 1200 1400 1600
Wavenumbers (cm ) -1
D LV
1 (
41.6
7%
)

71
3.3.5 Phase of Menstrual Cycle vs High Grade Dyskaryosis
It is important to determine if the changes observed throughout the menstrual cycle as seen in
Figure 3.2(A) would affect the ability of Raman spectroscopy to discriminate HSIL from
normal cells affected by the normal maturation of the cervical epithelium controlled by both
the rise and fall of progesterone and oestrogen. For this part of the study, spectra from HSIL
cells Figure 3.5(A) were recorded from 15 HPV positive, high grade dyskaryotic samples and
compared to an equivalent number of spectra from negative samples from days 7-21 of the
menstrual cycle, all of which were HPV negative. Figure 3.5(B) shows the mean spectra from
negative samples from days 7-21 of the menstrual cycle and spectra recorded from HSIL cells.
The LV scores scatterplot in Figure 3.5(C) shows that HSIL cells separate well from normal
cells on the first LV. This shows that regardless of when a sample is taken during day 7-21 of
the menstrual cycle, HSIL cells can still be effectively discriminated from cytology negative
cells using Raman spectroscopy. Spectral changes due to the hormonal influence of oestrogen
and progesterone seem to be less than the spectral changes due to the biochemical changes in
the dyskaryotic cells. The loadings from LV1 in Figure 3.5(D) show that glycogen (495, 1080,
1120, 1380, 1458 cm-1), nucleic acids (780 and 1487 cm-1), Amide III and Amide I proteins
(1239 cm-1 and 1669 cm-1 respectively) and tryptophan and phenylalanine (1605 cm-1) mainly
contribute towards the discrimination between normal and HSIL cells. As the HSIL cells are a
result of a high risk HPV infection, the biochemical difference in glycogen, proteins and nucleic
acids can be attributed to the downstream effects of the HPV infection. The predictions plot
Figure 3.5(E) from the PLSDA model shows excellent classification of the negative samples
(all menstrual cycle phases) and the dyskaryotic samples with sensitivity of 98% and a
specificity of 97%. However even with a high sensitivity and specificity between the menstrual
cycle and dyskaryotic cells, recording from dyskaryotic cells is not efficient for Raman
spectroscopy due to the minimal number of dyskaryotic cells present per sample and the
difficulty in locating and recording from them.
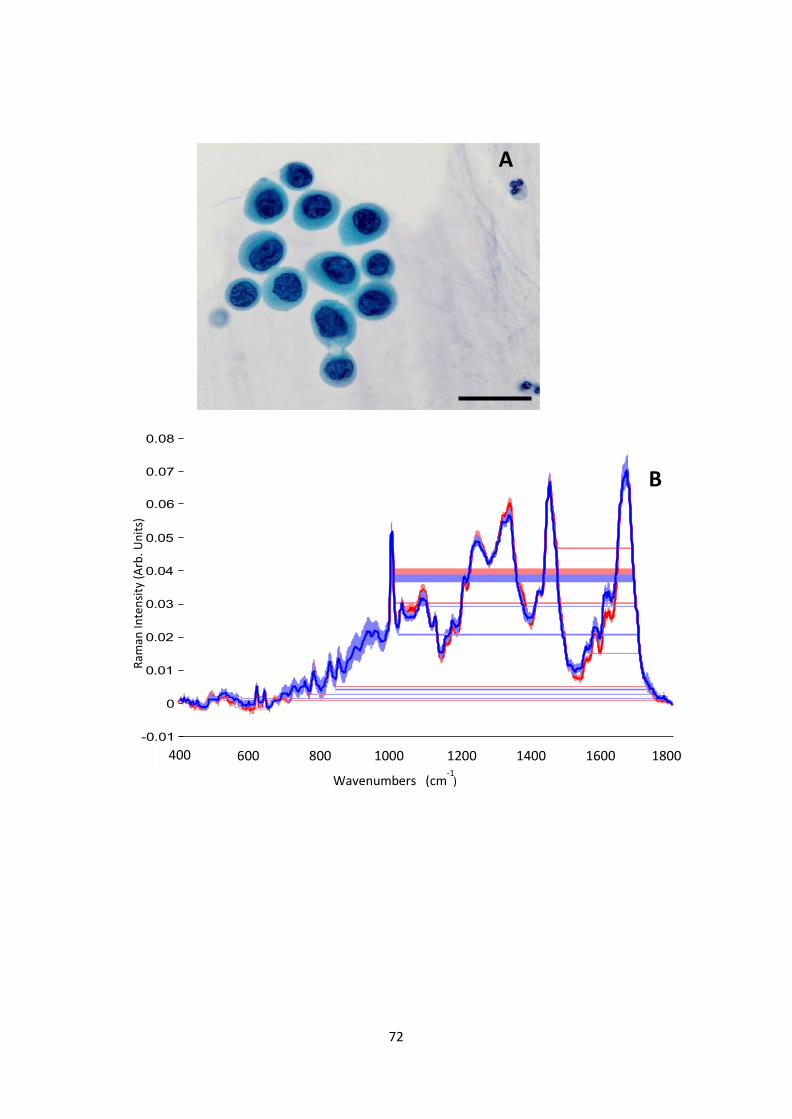
72
400 600 800 1000 1200 1400 1600 1800
Days of Cycle
Dyskaryotic Cells
A
B
400 600 800 1000 1200 1400 1600 1800
Wavenumbers (cm ) -1
Ram
an In
ten
sity
(A
rb. U
nit
s)

73
Variable
200 400 600 800 1000 1200
-1 -1
0.08
C 0.06
0.04
-1
1120 cm
-1
1380 cm
-1
1669 cm-1
0.02
0
-0.02
-0.04
495 cm 780 cm
1239 cm-1
1458 cm
1487 cm-1
-0.06
-0.08
1605 cm-
-0.1
E
600 800 1000 1200 1400 1600
-1
Wavenumbers (cm )
Figure 3.5 (A) Pap stained HSIL cells. Bar = 35 m, (B) Mean Raman spectra from negative samples from days 7- 21 of the menstrual cycle (red) and spectra from HSIL positive samples (blue). Shading denotes the standard deviation, (C) LV scores scatter plot of HSIL positive samples (red) and negative samples (blue), (D) LV1 loadings, (E) PLSDA prediction plot.
LV
1 (
23.8
2%
)
D

74
3.3.6 HC positive samples vs High Grade Dyskaryosis
It is important to determine if the use of HC will also affect the ability of Raman spectroscopy
to discriminate normal HC positive cells from HSIL cells. Figure 3.6(A) shows the mean
Raman spectra of HC positive negative samples and spectra from HSIL cells. The LV scores
scatterplot in Figure 3.6(B) shows that spectra from HC positive samples separate from spectra
from HSIL cells from high grade dyskaryotic samples on the first LV component with minimal
overlap. Figure 3.6(C) shows the LV1 loadings which indicate that the main differences
between the HC positive cells and HSIL cells are very similar to those found for the HC
negative and high grade dyskaryotic samples. Glycogen (482, 1261 and 1381 cm-1), nucleic
acids (781 cm-1), and proteins (1450, 1560 and 1669 cm-1) again contribute towards the
discrimination. As before, it appears that the overtaking of the host cell machinery by HPV
causes more of a biochemical change within the cell than the biochemical changes associated
with the use of HC. Our results are backed up by a study conducted by (Daniel et al., 2017)
which used a linear combination of non-negative least squares from the main biochemicals
associated with tissue and cell composition and confirmed that nucleic acids, glycogen and
protein were the main discriminating factors between negative and HSIL.
The predictions plot from the PLSDA model shows excellent classification of the negative
samples (HC positive) and the HSIL cells from high grade dyskaryotic samples Figure 3.6(D)
with sensitivity of 96% and specificity of 98%.

75
200 400 600 800 1000 1200
Variable
400 600 800 1000 1200 1400 1600 1800
HC Cells
Dyskaryotic cells
B
C 482
1381
1261
1560
1450
781
1669
600 800 1000 1200 1400 1600
Scores on LV1 (26.65%) Wavenumbers (cm ) -1
D
-1
Wavenumbers (cm )
Figure 3.6 (A) Mean Raman spectra from negative HC positive samples (red) and spectra from HSIL cells (blue). Shading denotes the standard deviation, (B) LV scores scatter plot of HSIL samples (red) and negative HC positive samples (blue), (C) LV1 loadings, (D) PLSDA prediction plot.
A
600 800 1000 1200 1400 1600
Ram
an In
ten
sity
(A
rb. U
nit
s)
LV
1 (
26.6
5%
)

76
3.4 Discussion This study has shown that the day a Pap smear is taken during days 7-21 of the
menstrual cycle will have an effect on the spectra with regard to the level of glycogen and
proteins. It should be noted, however, that this study assumes that each patient recruited follows
the standard 28 day cycle, and that the patient details recorded for each sample were correct. It
is possible for women have a longer or shorter cycle, hence this variation may have influenced
our analysis. Postmenopausal samples represent a problem for Raman based screening due to
their lack of cellular material and presence of cellular debris and mucus.
The use of HC causes the most variability. Further study would be required to determine
which hormone is causing the discrimination between HC positive and HC negative samples.
These findings suggest that the use of oral contraceptives and the day on which the Pap smear
was taken during the menstrual cycle should be incorporated into the data analysis to reduce
variability between patient samples. Incorporating this effect into our model would require us
to establish a standard effect of the various types of HC used within the population to identify
any specific changes associated with a particular type/brand. For example a pure oestrogen and
a pure progesterone based HC might produce different effects particularly related to the level
of glycogen present within the cells as progesterone promotes sub-nuclear glycogen
accumulation. Once the standard effect of all HC was established it would then be used to set
a new baseline for the various molecular components (glycogen, Amide I etc) that could be
used to distinguish normal from dyskaryotic cells. Our results can be backed up by other studies
(Kanter et al., 2009) which showed that hormonal status influences Raman spectra from the
cervix in vivo and that incorporating hormonal status into their classification algorithm
increased the accuracy from 88% to 94%. Despite this, however, the variability between days
of the menstrual cycle or use of HC did not hinder the ability of Raman spectroscopy to
discriminate cytology negative cells from HSIL cells. The biochemical changes induced in
HSIL cells due to an active HPV infection were more pronounced than the biochemical changes

77
due to the menstrual cycle or the use of hormone based contraceptives. This makes sense given
that that a chronic HPV infection alters cell cycle regulation, transcribes viral oncogenes and
is producing and shedding HPV virons (Johansson C et al., 2012) thus altering the biochemical
signature of the infected cells when compared to normal/negative cells. However, going
forward, it would not be practical to try and record spectra from these HSIL cells due to time
constraints and the minimal number of cells present per sample.
3.5 Conclusion This study highlights the scope of Raman spectroscopy for cervical screening despite the
presence of biochemical changes associated with the menstrual cycle and the use of HC. It is
acknowledged that the study is limited in focussing only on HSIL positive samples and a further
study would be required to include low grade (LSIL) samples.
78
Chapter 4
Improved removal of blood contamination from
Thinprep cervical cytology samples for Raman
spectroscopic analysis
Adapted from: Traynor D, Kearney P, Ramos I, Martin CM, O'Leary JJ,
Lyng FM. Improved removal of blood contamination from Thinprep cervical cytology
samples for Raman spectroscopic analysis J. Biomed. Opt. 23(5), 055001 (2018)

79
4.1 Introduction
The most common method for cervical screening is based on the Papanicolaou test (Pap test)
which is designed to screen for signs of pre-cancer and cancer of the cervix. The Pap test
requires cells to be scraped from the cervix, fixed to a glass slide, stained and reviewed by a
trained cytologist. Cellular abnormalities are identified based on cellular morphology and
staining characteristics and classified according to the degree of dysplasia. The ThinPrep liquid
based cytology method involves the patient’s cells being transferred into a specimen vial
containing PreservCyt transport medium. PreservCyt is an alcohol based solution that preserves
cell morphology and breaks down biological components such as mucin and blood. The normal
smear pattern is made up of epithelial and non-epithelial components (Figure 4.1(A)). The
epithelial cell components include parabasal cells, intermediate cells, superficial cells,
endocervical and endometrial cells. Non-epithelial cell components include red blood cells,
lymphocytes, histiocytes, polymorphs, mucus and bacteria. Red blood cells are 7-8 m in size
and stain red or pink with the Pap stain. They are often found in cervical samples, either due to
menstruation or inflammation and their presence can also be used as an indicator of disease
(pre-cancer)(Kitchener et al., 2011). A patient’s cervix with a high grade lesion will often bleed
on contact with the cervical brush and as a result the smear becomes contaminated with blood.
The presence of blood in the sample will often dilute diagnostic cells, cover and surround cell
groups, increase screening time and make microscopic interpretation difficult (Figure 4.1(B)).
PreservCyt contains a lysis agent for mucus and red blood cells but excessive blood in the
sample vial will prevent a satisfactory smear being produced. High volumes of red blood cells
will prevent the collection of epithelial cells onto the polycarbonate filter membrane during
processing resulting in a ringed halo effect with red blood cells deposited mostly around the
edges of the smear with very few epithelial cells present (Figure 4.1(C)).

80
Figure 4.1 (A) Pap smear after staining. Note the presence of intermediate (blue), superficial (pink) cells and lymphocytes (indicated by arrows), (B) Bloody smear pattern with red blood cells, obscuring diagnostic cells.
Bar = 35 m. (C) Pap smear contaminated with blood showing ringed halo effect.
Cytology laboratories often annotate Pap smears according to a blood scale index whereby 0
indicates no visible evidence of blood present and 3 indicates an extremely bloody sample
(Figure 4.2). Samples presenting as a 2 or 3 on the blood scale are often either rejected as being
unsatisfactory or treated with a wash solution to lyse more of the red blood cells to increase the
number of epithelial cells present on the slide. This blood scale grading is subjective and is
only based on a visual appearance of a sample. The advantage of the Pap test is that it is a
widely accepted screening based test. However, despite a high specificity of 96.5%, a lower
sensitivity of 85% can be due to sampling, technical and inter-observer errors associated with
the subjectivity of the test (Kitchener et al., 2011). Over the past 20 years, Raman spectroscopy
has shown potential for the diagnosis of cervical cancer both in vivo and ex vivo (Utzinger et
al., 2001, Mahadevan-jansen, 2010, Mo et al., 2009, Duraipandian et al., 2012, Kong et al.,
2015,Santos, et al 2017). Raman spectroscopy is based on inelastic light scattering in which a
sample is illuminated by monochromatic laser light and interactions between the incident
photons and molecules in the sample result in the scattering of the light. The coupling of the
light generates vibrations within the sample which are characteristic of the chemical structure.
B

81
The energy of the scattered light is reduced by an amount equal to the vibrational energy which
is called the Raman shift. This means that the position, peaks and shape of the Raman bands
carry information about the molecular makeup of the sample. The Raman spectrum of cells and
tissues is made up of contributions from many biochemical components including DNA, RNA,
proteins, lipids and carbohydrates (Santos et al 2017) To date, most likely due to confounding
factors such as blood contamination, there have been relatively few studies on Raman
spectroscopy of cervical smear samples (Lyng et al., 2015, Diem et al., 2013, Vargis et al.,
2012, Rubina et al, 2013, Bonnier et al., 2014, Ramos, et al 2015, Kearney et al., 2017). Rubina
et al described the influence of blood on the Raman spectra of cervical cell pellets and how this
might lead to false interpretations. Classification efficiency of 86% and 84% was reported for
normal and abnormal samples respectively and this decreased to 78% and 79% after samples
were treated with red blood cell lysis buffer to reduce blood contamination. A previous study
by our group (Bonnier et al., 2014) addressed many of the issues involved in recording Raman
spectra from liquid based cytology (ThinPrep) samples and described a new method to remove
blood contamination before Raman spectroscopy based on pre-treatment of the slides with
hydrogen peroxide. This was shown to minimise variability and to result in the collection of
highly reproducible data with excellent discrimination between negative and high grade samples.
However, only blood scale 0 and blood scale 1 samples were used for this study as the treatment
was not found to be effective for excessively contaminated blood scale 2 and 3 samples. (Kerr et
al.,2016) investigated the effect of blood contamination on Raman spectra of urine cytology
samples. They determined that spectra recorded from samples with a low level of blood
appeared free from contamination due to the effective removal of many of the red blood cells
using the lysing agent CytoLyt. However, for excessively bloody samples several additional
Raman peaks associated with blood were observed leading to the conclusion that excessively
bloody samples are not suitable for diagnostics with Raman micro-spectroscopy. The aim of

82
the present study was to extend our previous study (Bonnier et al., 2014) to samples annotated
as blood scale 2-3 which would have previously been excluded, to investigate if these
excessively bloody samples could be treated to render them suitable for Raman spectroscopy.
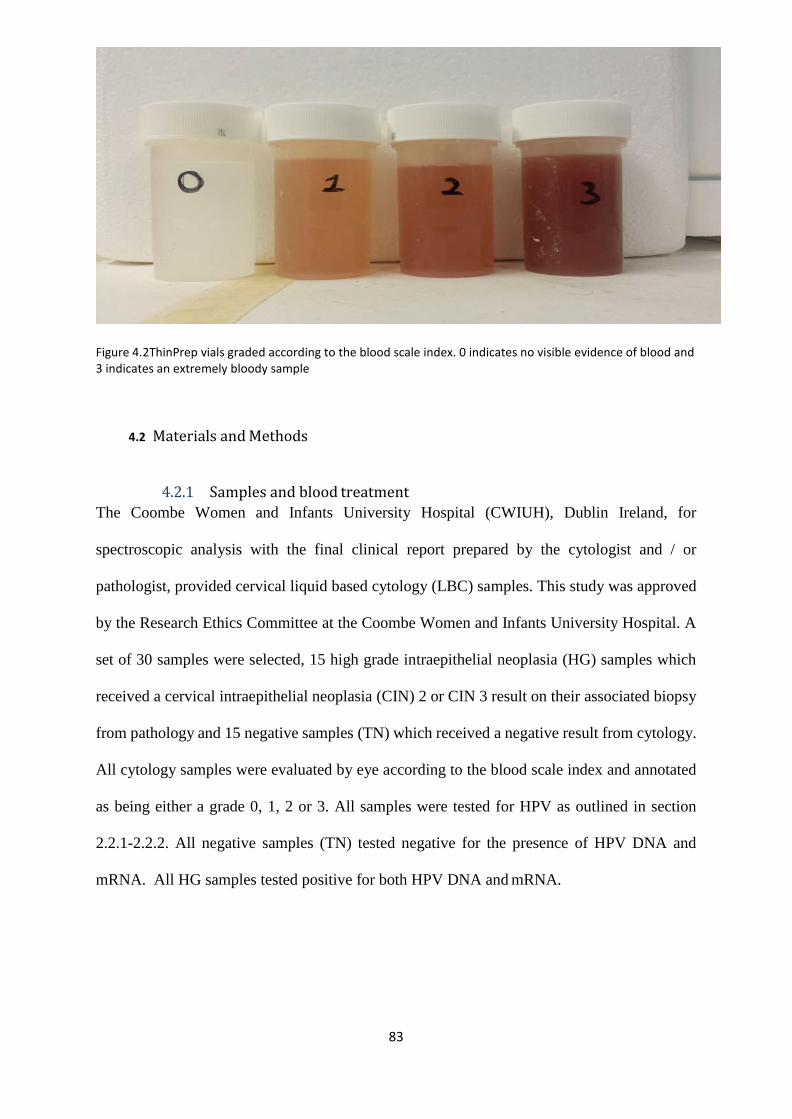
83
Figure 4.2ThinPrep vials graded according to the blood scale index. 0 indicates no visible evidence of blood and 3 indicates an extremely bloody sample
4.2 Materials and Methods
4.2.1 Samples and blood treatment
The Coombe Women and Infants University Hospital (CWIUH), Dublin Ireland, for
spectroscopic analysis with the final clinical report prepared by the cytologist and / or
pathologist, provided cervical liquid based cytology (LBC) samples. This study was approved
by the Research Ethics Committee at the Coombe Women and Infants University Hospital. A
set of 30 samples were selected, 15 high grade intraepithelial neoplasia (HG) samples which
received a cervical intraepithelial neoplasia (CIN) 2 or CIN 3 result on their associated biopsy
from pathology and 15 negative samples (TN) which received a negative result from cytology.
All cytology samples were evaluated by eye according to the blood scale index and annotated
as being either a grade 0, 1, 2 or 3. All samples were tested for HPV as outlined in section
2.2.1-2.2.2. All negative samples (TN) tested negative for the presence of HPV DNA and
mRNA. All HG samples tested positive for both HPV DNA and mRNA.

84
HeLa cervical cancer cells were also prepared and fixed as for Thinprep samples in PreservCyt.
These samples were seeded with blood to mimic excessively bloody cytology samples. This
was achieved by adding blood to the samples until they visually represented a blood scale 2-3
index sample.
Each Thinprep sample vial was mixed for 3 minutes to break up cellular clumps. The sample
was then poured into a 50 ml centrifuge tube and centrifuged for 5 minutes at 300 rpm. The
supernatant was removed and 1 ml of H2O2 was added and mixed for 30 seconds. 20 ml of
PreservCyt was added to neutralise the H2O2. The sample was then centrifuged for 5 minutes
at 600 rpm. Most of the supernatant was removed. The cell pellet was re-suspended multiple
times with a 1ml pipette to break up cell clumps. 20ml of PreservCyt was then added and the
contents poured back into the original vial.
4.2.2 Thinprep slide preparation
The samples were then prepared as outlined in section 2.3
4.2.3 Raman spectroscopy
All Raman analysis was performed as outlined in sections 2.5 and 2.7
4.2.4 Data pre-processing and analysis
All Raman data was pre-processed and analyzed as outlined in sections 2.7.-2.9

85
4.3 Results/ Discussion
Figure 4.3(A) shows an untreated Pap smear, blood scale 3. The slide was coated in blood and
cellular debris. Figure 4.3(B) shows Raman spectra recorded from 5 cells present on the slide.
Overall very few cells were present and often burned on contact with the laser. A high
background was observed together with Raman bands associated with blood at 754, 1311,
1374, 1398, 1588, 1640 cm-1. The high background can be attributed to the cellular debris or a
sub unit of the oxidized hemoglobin on the surface of the cell nuclei which has a weak
fluorescence signal. When a sample fluoresces the fluorescing photons can be detected by the
photon detector in the Raman spectrometer overwhelming the weaker Raman signal and
obscuring the Raman peaks. Figure 4.3(C) shows the same sample from Figure 4.3(A) after
undergoing the blood removal method. Any blood residue has been oxidised with the H2O2
treatment and cellular debris has been reduced allowing for high quality spectra to be recorded
as demonstrated in Figure 4.3(D).

86
D
B
4
x 10 7
0 400 600 800 1000 1200 1400 1600 1800
Figure 4.3 (A) Untreated Pap smear, blood scale 3 shows blood and cellular debris masking diagnostic cells. Bar
= 35 m, (B) Raw Raman spectra recorded from five cells (each colored spectrum is from an individual cell) from a untreated Pap smear (C) Treated Pap smear. Arrows indicate Intermediate cells and Superficial cells .
Bar = 35 m. (D) 25 Raman spectra recorded from individual cells (each colored spectrum is from an individual cell) on a treated Pap smear.
C
cm-1
Ram
an In
ten
sity
(A
rb. U
nit
s)

87
In order to determine if the Raman specific method of blood removal using H2O2 had any effect
on the spectra recorded without any external confounding factors such as inflammation, HPV
infection etc, the protocol was performed on HeLa cervical cancer cells. HeLa cells were
seeded with blood to mimic cytology samples with blood scale index 2-3 and HeLa cells with
no added blood acted as controls. Both sample types were treated with H2O2 and slides prepared
as for the ThinPrep cytology samples. Figure 4.4(A) shows the mean Raman spectra recorded
from 30 HeLa cells with and without blood contamination (blood scale 2-3) and treated with
H2O2. The mean spectra display strong similarities with only minor changes at 1242 cm-1
(Amide III), 1350 cm-1 (DNA/RNA, CH def. in proteins and carbohydrates), 1430 cm-1 (protein,
lipids), and 1669 cm-1 (Amide I). Figure 4.4(B) shows the mean Raman spectra of negative
cytology samples (TN) with and without blood contamination (blood scale 2-3) and treated
with H2O2. The mean spectra display strong similarities with small changes at 1242 cm- 1, 1350
cm-1, 1430 cm-1 and 1669 cm-1 as observed for the HeLa cells. These small changes in the
spectra were consistent throughout all samples tested including the HG samples (Figure
4.4(C)).

88
B
Figure 4.4 (A) Mean Raman spectra of HeLa cervical cancer cells treated with blood (blood scale 2-3) and subsequently treated with H2O2 (red) and HeLa cervical cancer cells not treated with blood but treated with H2O2 (blue), (B) Mean Raman spectra of true negative samples (TN), blood scale 2-3, treated with H2O2 (red) and blood scale 0, treated with H2O2, (C) Mean Raman spectra of high grade (HG) samples, blood scale 2-3 treated with H2O2 (red) and blood scale 0, treated with H2O2.
B
cm-1
cm-1
C
cm-1
Ram
an In
ten
sity
(A
rb. U
nit
s)
Ram
an In
ten
sity
(A
rb. U
nit
s)
Ram
an In
ten
sity
(A
rb. U
nit
s)

89
PLSDA classification of negative cytology samples and high grade cytology samples, blood
scale index 0, is shown in figure 5. Figure 4.5(A) is a latent variables (LV) scores scatter plot
of LV1 and LV2 which shows good discrimination along LV1. The loadings shown in figure
4.5(B), show that the discrimination is based around Raman peaks at 482, 851, 936, 1128, 1338,
1449, 1572, 1655 and 1669 cm-1 which are mainly related to DNA, proteins and glycogen.
Figure 4.5(C) is a PLSDA prediction plot showing good classification of negative and high
grade samples with a sensitivity of 92% and a specificity of 93% (Table 4.1).

90
5A
Figure 4.5 (A) LV score scatter plot of 136 spectra acquired from 15 TN samples and 136 spectra acquired from 15 HG samples (blood scale index 0), (B) LV 1 loadings, (C) PLSDA prediction plot showing good discrimination between TN (blue) and HG (yellow) ThinPrep cytology samples.
B
cm-1

91
PLSDA classification of TN and HG cytology samples, blood scale index 2-3, is shown in
Figure 4.6. Both negative and high grade samples have undergone the Raman specific blood
removal method. Figure 4.6(A) is a LV scores scatter plot of treated TN and HG samples which
show overlap between the samples. The LV1 loadings shown in figure 4.6(B), shows that the
discrimination is based around Raman peaks at 482, 549, 851, 936, 1145, 1182, 1237, 1338,
1449,1576, and 1669 cm-1 and are similar to the loadings shown in figure 4.5(B). The PLSDA
prediction plot is shown in figure 4.6(C) and has a sensitivity of 89% and a specificity of 88%
(Table 4.1).

92
A
cm-1
C
Figure 4.6 (A) LV score scatter plot of 185 spectra acquired from 15 TN cytology and 185 spectra acquired from 15 HG cytology samples (blood scale index 2-3), (B) LV1 loadings. (C) PLSDA prediction plot showing some discrimination between TN (blue) and HG (yellow) Thinprep cytology samples, blood scale 2-3 and treated with H2O2.
B

93
B
cm-1
In order to determine if excessively bloody samples could be treated the same way as non-
bloody samples in terms of data analysis, the Raman spectral data from the two groups (blood
scale 0 and blood scale 2-3) was combined. Figure 4.7(A) shows the LV scores scatter plot
which highlights decreased discrimination between TN and HG cytology. However the
loadings shown in Figure 4.7(B) remain similar to the loadings shown in figure 4.5(B) and
4.6(B) with Raman peaks at 482, 851, 1129, 1184, 1251, 1338, 1449, and 1669 cm-1. The
PLSDA prediction plot is shown in Figure 4.7(C) and has a sensitivity of 82% and a
specificity of 87% (Table 4.1).
Figure 4.7 (a) LV score scatter plot of 321 spectra from TN cytology and 321 spectra HG cytology samples (combined blood scale 0 and blood scale 2-3), (b) LV1 loadings. (c) PLSDA prediction plot showing some discrimination between TN (blue) and HG (red) Thinprep cytology samples, combined blood scale 0 and blood scale 2-3 and treated with H2O2

94
Table 4.1 Sensitivity and specificity from PLSDA classification of TN and HG cervical cytology samples with and without blood contamination and combined.
Sensitivity Specificity
Negative Vs High Grade (blood scale 0) 92% 93%
Negative Vs High Grade (blood scale 2-3) 89% 88%
Combined (blood scale 0 and 2-3) 82% 87%
Interestingly, the loadings (482, 851, 936, 1149, 1338 and 1669 cm-1) remain almost the same
between all three data sets, blood scale 0, blood scale 2-3 and combined, confirming that
glycogen, DNA and proteins are the main discriminating features between negative cytology
and high grade cytology samples regardless of blood contamination. As previously stated, HPV
can integrate its viral DNA into the host cell’s DNA located in the cell nucleus resulting in the
transcription of its viral oncogenes and control over the cell’s life cycle. This results in
increased proliferation which would alter protein, glycogen and nucleic acid levels present
within the cell. However, as mentioned earlier, some spectral features undergo minor changes
following the blood removal method. As these features overlap with the discriminating
features, this results in a reduction in classification efficiency when excessively bloody (blood
scale index 2-3) samples and non-bloody samples (blood scale index 0) samples are combined
for analysis. Comparing sensitivity and specificity of the test groups shows that blood scale 0
samples with no blood contamination performed best with a sensitivity of 92% and specificity
of 93% when compared to excessively bloody blood scale 2-3 samples which had a sensitivity
of 89% and specificity of 88%. Combining the blood scale 0 and blood scale 2-3 samples for
analysis resulted a sensitivity of 82% and specificity of 87%. The high specificity indicates a
good ability to accurately exclude negative samples (few false positives), however the
reduction in sensitivity indicates a reduced ability to accurately detect high grade samples and
an increased likelihood of false negatives.

95
Despite the reduction in classification efficiency, the values are higher than previously reported
for samples with blood contamination. Rubina et al. (2013) reported a classification efficiency
of 78% and 79% for normal and abnormal bloody samples treated with red blood cell lysis
buffer. As far as it is reported this study did not attempt to combine both treated and non-treated
samples together to improve their sensitivity and specificity. In addition, Kerr et al. (2016)
concluded that excessively bloody samples were not suitable for diagnostics with Raman
spectroscopy.
4.4 Conclusion This study demonstrates for the first time that excessively bloody (blood scale 2-3) Thinprep
cervical smear samples can be used for diagnostics with Raman spectroscopy following a
hydrogen peroxide treatment in the collection vial. However, the presence of excessive blood
contamination (blood scale index 2-3) did result in reduced in sensitivity and specificity for
classification of negative and high grade samples. A higher sensitivity and specificity could be
achieved by keeping excessively bloody samples separate from non-bloody samples for
analysis. Although this study has focused only on cervical cytology samples, thyroid, urine and
serous fluid cytology samples may also benefit from such an approach for Raman spectroscopic
analysis. Serous fluid for cytological examination are often contaminated with a high level
blood (pericardium, pleura and peritoneum fluids) and often require additional treatment
methods such a density gradient technique to remove red blood cells which can result in a loss
of diagnostic cellular material. The application of our blood treatment method would prevent
this loss of material and allow Raman spectroscopy to be performed.
While these results are promising for the development of Raman spectroscopy for cervical
cancer screening, Raman spectroscopy in its current form does not have the ability to replace
cytology for cervical cancer screening However it could be used to supplement the Pap test or
as a possible new triage test after HPV testing.

96
Chapter 5
The potential of biobanked liquid based cytology
samples for cervical cancer screening using Raman
spectroscopy.
Adapted from: Traynor, D. (2019)The potential of biobanked liquid based cytology
samples for cervical cancer screening using Raman spectroscopy- J.
Biophotonics.;12:e201800377.

97
5.1 Introduction
Every year millions of cervical Pap tests are performed throughout the world in countries for
purposes of cervical screening. Most Pap tests are performed through use of liquid based
cytology (LBC) where cervical cells are collected before deposition into a volume of liquid
preservative. As not all the material is required for cytological assessment, the surplus, which
would ordinarily be discarded, can be stored within tissue biobanks with due process of
governance. Biobanks constitute a valuable source of material which may support a number
of studies including those on the natural history of disease, evaluation of screening practices,
vaccination effectiveness or the development of new technologies to support screening and
disease management (Fox et al., 2017, Marquez-Curtis et al., 2017, Peakman et al.,2010).
Different collection media for liquid based cytology exist however one of the more common
media is PreservCyt (Hologic). PreservCyt is a methanol based solution that preserves cell
morphology via fixation. Fixation is routinely employed as it allows a “snapshot” of a cell’s
physical and biochemical state to be assessed; methanol is an organic solvent that preserves
cells through dehydration and precipitation of proteins (Troiano et al., 2009). Fixation is
important given that sample collection and assessment is not performed concurrently. In
addition to supporting routine screening, fixation of cells also supports long term storage of
residual material in biobanks.
Current methods for detection of cervical cancer and pre-cancer (CIN) are limited and there is
an unmet clinical need for new screening or diagnostic tests. Recently Raman spectroscopy
has shown potential as a tool for screening and diagnosis of cervical lesions and cancer (Lyng
et al., 2015, Ramos et al., 2016 Rubina et al., 2015).
Due to confounding factors such as sample collection, blood contamination and sample
variability, few studies have been performed using Raman spectroscopy on cervical cytology

98
samples and none to our knowledge have investigated the potential of utilising biobanked
LBC samples. The aim of this feasibility study was to assess the utility and performance of
Raman spectroscopy for the detection of CIN using biobanked LBC samples. Samples stored
at -80oC and -25oC were assessed and the ability of Raman spectra to delineate disease from
no disease was determined. Additionally, Raman spectroscopy was assessed in un-banked
LBC samples as a comparator.
5.2 Methods
5.2.1 Sample collection
Two classes of samples were used for the study, classed as disease and no disease. Samples
with no disease were defined as cytology negative and HPV negative whereas samples with
disease were those associated with a cytological HSIL result and a histologically confirmed
CIN3 result and HPV positivity according to HPV DNA and mRNA status. All samples were
recruited from patients presenting at a colposcopy clinic for the first time, and had no prior
history of disease. Samples were collected from each patient according to the standard
operating procedure issued by Cervical Check, Ireland’s national cervical cancer screening
programme, and the NHS Scottish cervical screening programme. Both procedures are
similar and all samples were biobanked using the same methodology.
133 samples were used in total for this study of which 64 were LBC biobanked samples; 32
with no disease (cytology negative) and 32 with disease (HSIL). Biobanked samples were
provided by the Scottish HPV Archive, a research tissue biobank set up to facilitate HPV
associated research.
Ethical approval for use of the samples was obtained from the East of Scotland Research
Ethics Service - Tayside committee. Biobanked LBC samples used for this study had been
sedimented with the cellular pellet transferred into a 4.5 ml vial for long term storage in

99
PreservCyt. After transit, samples were re-constituted to a volume of 20 ml fresh PreservCyt
solution to resemble the original LBC specimen from which the sample was derived.
A further 64 non biobanked “fresh” LBC samples, 32 with no disease (cytology negative) and
32 with disease (HSIL), were collected in PreservCyt solution from the Coombe Women and
Infants University Hospital (CWIUH), Dublin, Ireland, as part of routine cytological
screening. Ethical approval for use of coded samples for the study was granted by the
CWIUH Research Ethics Committee (no. 28-2014). A further 5 fresh LBC samples with
disease (HSIL) were collected and split into two separate vials. One vial from each sample
underwent the standard biobanking process and was stored for 3 weeks, while the other was
stored at room temperature.
5.2.2 ThinPrep
The samples were prepared as outlined in section 2.3 and 2.4
5.2.3 Raman spectroscopy
All Raman analysis recorded as outlined in section 2.5-2.6 with 25 cells recorded from each
sample. Cell selection was performed as outlined in section 2.5 Raman measurements.
5.2.4 Data pre-processing and analysis
Data was pre-processed and analysed as outlined in section 2.7-2.9

100
5.3 Results
5.3.1 -25oC Vs -80oC biobanked LBC samples
The samples stored at -25oC presented with intact cellular morphology (Figure 5.1(A)) and
allowed for high quality spectra to be recorded (Figure 5.1(B)). The samples stored at -80oC
presented with cell lysis, cellular debris and very little cellular material which prevented the
recording of spectra (Figure 5.1(C)). One possible explanation for this, is the freeze thaw
effect which is commonly used to lyse bacteria and mammalian cells. Storing cells at -80 oC
in PreservCyt without any Dimethyl Sulfoxide and bring up to room temperature can cause
the cells to contract during the thawing process resulting in cell lysis. As a result, only
biobanked samples previously stored at -25oC were used for this study.
0.08
0.06
0.04
0.02
0
-0.02
400 600 800 1000 1200 1400 1600 1800
Wavenumbers cm -1
Figure 5.1 (A) Pap smears stored at -25oC present with intact cellular morphology. Note the presence of superficial and intermediate cells (arrows) on the unstained slide which were selected for Raman spectral recording. (B) High quality spectra recorded from 25 morphologically normal intermediate and superficial cells in the spectral range 400-1800cm-1. (C) Pap smears stored at -80oC. Note lack of cellular material and presence of cellular debris.
B
(Arb
.Un
its)

101
5.3.2 Negative Vs HSIL (fresh LBC samples) Model
In order to determine if biobanked LBC samples could be used to discriminate no disease
(cytology negative) from disease (HSIL) using Raman spectroscopy, fresh (non biobanked)
LBC samples were first examined as a control. Figure 5.2(A) shows mean spectra of
Negative (Red) Vs HSIL (Blue). Figure 5.2(B) is a latent variables (LV) scores scatter plot of
LV1 (Blue) and LV2 (Orange) which shows good discrimination along LV1 and LV2. The
loadings shown in Figure 5.2(C), show that the discrimination is based around Raman peaks
at 484 (glycogen), 575 (glycogen), 881 (nucleic acids), 1004 (proteins Phenylalanine), 1139,
1238 (proteins Amide III), 1487 (proteins), 1575 (nucleic acids), 1605 (proteins) and 1669
cm-1 (proteins Amide I). The LV2 loadings show discrimination is based around 1238
(proteins), 1381 (glycogen), 1450 (proteins and lipids), 1642 (proteins) and 1669cm-1
(proteins) (see table 1.1) (Movasaghi et al.,2007). The PLSDA prediction plot shown in
Figure 5.2(D) and has a sensitivity of 86% and a specificity of 90% for HSIL. Comparing
these results to the results from chapter 3 section 3.3.5, which reported a sensitivity of 98%
and a specificity of 97%, a slight reduction. This is mainly due to a change in cell selection.
In chapter 3, spectra were recorded from morphologically abnormal cells while in chapter 5,
spectra were recorded from morphologically normal cells. Abnormal cells would have a
different biochemical signature due to a chronic HPV infection that cause morphological
change in the cell. However, given the difficulty in locating unstained abnormal cells as
previously discussed, this slight reduction in sensitivity and specificity is acceptable.

102
B
CIN 3
TN
Y C
V P
redic
ted
1 (
Cla
ss 1
)
0.08
A B
0.06
0.04
0.02
0
-0.02
400 600 800 1000 1200 1400 1600 1800
Wavenumbers cm-1
0.15
2
0.1 1.5
0.05 1
0 0.5
-0.05 0
-0.1
-0.5
-0.15
600 800 1000 1200 1400 1600
-1
100 200 300 400 500 600 700 800
Wavenumbers cm -1
Sample
Figure 5.2 (A) mean spectra of fresh Negative (red) Vs HSIL (blue). (B) latent variables (LV) scores scatter plot of LV1 and LV2, Negative (yellow) Vs HSIL(blue). (C) LV1 (blue) and LV2 (orange) loadings (D) PLS_DA prediction plot HSIL (blue), negative (yellow) . Note some slight overlap between HSIL and Negative categories. This could be due to some inconsistencies in Raman recording or due to the fact that not all cells are exhibiting the biochemical signature associated with a HPV infection.
LV
1 (
24
.52
%),
LV
2 (
9.0
0%
)
Arb
.Un
its

103
5.3.3 Negative Vs HSIL (Biobanked LBC samples) Model
In order to determine if the biobanked samples can be used in a similar fashion to the fresh
samples, negative and HSIL biobanked samples were compared. Figure 5.3(A) shows the
mean spectra of biobanked Negative samples Vs HSIL. Figure 5.3(B) is a latent variables
(LV) scores scatter plot of LV1 and LV2 which shows good discrimination along LV1 and
LV2.The loadings from LV1 are shown in Figure 5.3(C) and show that discrimination is
based around Raman peaks, 622 (proteins), 640 (proteins),775 (proteins), 850 (proteins),
1122 (proteins),1152 (proteins), 1207 (proteins), 1450 (proteins), 1560 (proteins), 1605
(proteins), 1642 (proteins) and 1669 cm-1 (proteins). LV2 loadings show discrimination is
based on 1123 (proteins, lipids, carbohydrates), 1338 (proteins) and 1605 cm-1 (proteins)
Raman peaks assigned to phenylalanine 1004 cm-1 show a slight shift between 1003-1004 cm-
1 which is most likely attributed to the methanol based fixation method which suggests a
change in the conformation of the phenylalanine protein (Meade et al.,(2010). The PLSDA
prediction plot shown in Figure 5.3(D) and has a sensitivity of 91% and a specificity of 92%
for HSIL.

104
08
B
06
04
02
02
400 600 800
-1
0.2 2
0.15
1.5
0.5
-0.5
-1
0.
0.
0.
0.
-0.
600 800 1000 1200 1400 1600 100 200 300 400 500 600 700 800 900 1000
Sample
Wavenumber cm -1
Figure 5.3 (A) mean spectra of biobanked Negative (red) Vs HSIL (blue). (B) latent variables (LV) scores scatter plot of LV1 and LV2, TN (yellow) Vs HSIL (blue). (C) LV1 (blue) LV2 (orange) .(D) PLS_DA prediction plot HSIL (blue), negative (yellow) .
LV
1 (
21
.81
%),
LV
2 (
10
.75
%)
Y C
V P
red
icte
d 1
(C
lass 1
)

105
5.3.4 Biobanked Vs non-Biobanked samples
Five fresh HSIL patient samples were split into two separate vials. One vial from each
sample was frozen as described earlier and the other stored at room temperature. Figure
5.4(A) show the mean spectra for biobanked HSIL samples and the same samples kept at
room temperature for 3 weeks after collection. The mean spectra appear identical. There does
not appear to be a difference between the fresh and biobanked samples. While the mean
spectra appear very similar, PLSDA can maximize the separation between the two groups
and present the discrimination in the form of loadings, as outlined in section 2.8. The latent
variable scatter scores plot (Figure 5.4(B)) shows slight discrimination between the sample
types which is most likely due to internal sample variability (Serafin-Higuera et al., 2016)
(LBC samples are variable by nature) and the low number of spectra recorded (60 for room
temperature/biobanked). The PLSDA prediction plot (Figure 5.4(C)) has a sensitivity of 29%
and specificity of 88% for biobanked samples indicating poor discrimination between the two
groups. The low sensitivity highlights that the model was not able to separate between
positive samples (biobanked) and negative samples (non-biobanked) samples. A loadings plot
was not included as this would only show the internal sample variability and not any
biochemical changes associated with the biobanking process. A limiting factor on this study
is the low sample number, this is due to the fact that this section was performed last and no
additional non frozen HSIL samples were available to record.

106
Sco
res
on L
V 2
(1
9.0
9%
)
0.08
0.06
0.08
0.06
0.04
0.04 0.02
0
0.02 -0.02
-0.04
0
-0.06
-0.02
400 600 800 1000 1200 1400 1600 1800
-0.08
-0.06 -0.04 -0.02 0 0.02 0.04 0.06
Wavenumbers cm -1 Scores on LV 1 (8.56%)
1
0.5
0
20 40 60 80 100
Sample
Figure 5.4 (A) mean spectra of fresh HSIL (blue) vs biobanked HSIL (red). (B) latent variables (LV) scores scatter plot of LV1 and LV2, fresh HSIL (yellow) Vs biobanked HSIL.(C) PLSDA prediction plot biobanked HSIL (blue) vs fresh HSIL (yellow).
B
Y C
V P
red
icte
d 1
(C
lass
1)
107
5.3.5 Mixed Model
In order to determine if we could mix fresh and biobanked samples together and still
achieve a sensitivity and specificity similar to the fresh and biobanked models, 15 biobanked
HSIL samples were mixed with 15 fresh HSIL samples and compared with 15 negative
biobanked/ 15 fresh negative samples. The samples were recorded individually (ie. not
mixed) and the spectra from fresh and biobanked samples were pooled into negative and
HSIL categories for analysis. Figure 5.5(A) shows the latent variable scatter scores plot of
the model and we can see clear discrimination between the sample types across LV1 and
LV2. The LV1 loadings (Figure 5.5(B)) show that discrimination is based on 482,
(glycogen), 1443 (proteins, lipids) 1487 (proteins), 1605 (proteins) 1669cm-1 (proteins) while
LV2 shows the discrimination is based around 486 (glycogen), 851 (proteins), 1152
(proteins), 1381 (glycogen), 1450 (proteins/lipids), 1575 (nucleic acids) and 1669 cm-1
(proteins). The loadings show similarities to both the fresh and biobanked loadings, but
overall show that glycogen and proteins are the main discriminating factor between negative
and HSIL samples. PLSDA prediction plot has a sensitivity of 94% and a specificity of 95%
for CIN 3 (Figure 5.5(C)).

108
B
LV
1 (
23.2
8%
), L
V 2
(11.1
7%
)
0.06
0.04
0.15
0.1
0.02
0.05
0
-0.02 0
-0.04 -0.05
-0.06
-0.1
-0.08
-0.1
-0.1 -0.05 0 0.05 0.1 0.15
-0.15
600 800 1000 1200 1400 1600
Scores on LV 1 (23.28%)
2
Wavenumber cm-1
1.5
1
0.5
0
-0.5
-1
100 200 300 400 500 600 700 800 900
Sample
Figure 5.5 (A) latent variables (LV) scores scatter plot of LV1 and LV2, TN (yellow) Vs HSIL (blue). (B) LV1 loadings (blue) and LV2 loadings (orange). (C) PLSDA prediction plot HSIL (blue), negative (yellow)
Score
s o
n L
V 2
(11
.17
%)
Y C
V P
red
icte
d 1
(C
lass 1
)

109
5.4 Discussion
From the results it is clear that samples biobanked at -80oC are not suitable for screening
using Raman spectroscopy due to a lack of cellular material and the presence of cellular
debris. The samples biobanked at -20oC provided high quality smears with intact cellular
material and no cellular debris which made them suitable for Raman spectroscopic analysis.
Spectral differences between fresh negative and HSIL samples were observed with regards to
glycogen, nucleic acids and proteins. HSIL cells often contain little to no glycogen, hence the
use of dilute acetic acid to visualize abnormal cells in colposcopy (CervicalCheck., 2013).
The discrimination associated with changes in proteins and DNA is consistent with the
neoplastic changes that occur in HSIL supported by persistent HPV infection such as
increased cell cycling with coincident increase in replication and levels of nucleic acids
(Serafin-Higuera et al.,2016). The PLSDA prediction plot gives a sensitivity of 86% and a
specificity of 90% for HSIL.
Negative Vs HSIL biobanked sample results showed that discrimination was driven solely by
proteins. Raman peaks associated with nucleic acids/ DNA are not as strongly present as
they are in the non-biobanked samples. Long term storage of biobanked samples is likely to
have led at least to an element of nucleic acids degradation which would explain why nucleic
acid is not discriminatory between negative and HSIL samples. Negative Vs HSIL (non-
biobanked ) showed that discrimination was based on Proteins, glycogen and nucleic acids
which included negative cells, the same category of negative cells from our biobanked
samples. Therefore, the lack of nucleic acids as a discriminatory factor cannot be associated
with the recording of negative cells.
However the PLSDA prediction plot (Figure 3(D)) does show slightly higher sensitivity
(91%) and specificity (92%) rates when compared to fresh samples (86% sensitivity and 90%

110
specificity) indicating that biobanking at -20oC does not preclude discrimination of negative
and HSIL samples on Raman spectroscopy.
The same patient samples that had been split in two with half biobanked and the other half
stored at room temperature showed no discrimination between the samples. Hence the 3 week
period of biobanking at -20oC had no detrimental effects on the physical or biochemical
properties of the samples. The mixed model showed that biobanked and fresh LBC samples
could be combined with an improved sensitivity of 94% and specificity of 95%. A limitation
of this study is the inability to use biobanked LBC samples stored at -800C for Raman
spectroscopic analysis as most biobanks will have samples stored at -800C for long term
storage hence the true potential of using biobanks as a source of patient samples could be lost.
Further research in this area should involve the use of different biobanked specimens
(bronchial and thyroid fine needle aspirations) to investigate any detrimental effects the
biobanking process may have on cytological specimens (Al-Abbadi et al.,2013,O’Dea et al.,
2018).
5.5 Conclusion
Raman spectroscopy can effectively discriminate disease free cervical LBC samples from
those with disease (HSIL) and this is possible using biobank cervical LBC samples stored at -
25oC. Pooling samples stored at -25 oC with fresh samples does not affect the sensitivity and
specificity of Raman spectroscopy for the discrimination of disease. This study demonstrates
that biobanks of cervical LBC samples are a useful resource for future Raman spectroscopy
studies and will facilitate the further assessment of this technology which shows highly
encouraging performance for the detection of cervical disease.

111
Chapter 6 The potential application of Raman spectroscopy to be
used as a triage test for cervical cancer in a primary
HPV screening environment.

112
6.1 Introduction
The current primary method for cervical screening employed by CervicalCheck (Ireland's
national screening program) is the Papanicolaou test (Pap test) and reflex HPV testing
(HIQA, 2017). The Pap test is a widely accepted screening based test with a high specificity
of 95-98% and a sensitivity of 74-96% (Kitchener et al., 2011).The aetiological role of HPV
infection among women with cervical cancer is clearly established (Petry et al., 2017,Youssef
et al., 2016, De Vincenzo et al., 2014). HPV is a double stranded DNA virus that infects the
skin, mucous membrane and the anogenital tract (Zheng and Baker, 2006). It is an extremely
common sexually transmitted infection that occurs in most sexually active men and women.
It is estimated that 80% of all sexually active women will become infected with HPV (Winer
et al., 2003) There are over 100 known HPV types which are classified according to their
potential to induce malignant transformations. HPV 16, 18, 31, 35, 39, 45, 50, 51, 53, 55, 56,
58, 59, 64, and 68 are classified as high risk type HPV (hrHPV). HPV 16, 18, 31, and 45
account for 80% of all cervical cancers (Schiffman et al., 2009). The HPV genome is made
up of 8,000 base pairs. It has five early genes E1, E2, E5, E6, E7 and two late genes, L1 and
L2 (Fouad and Aanei, 2017). The target cells for the initial HPV infection are the immature
basal cells of the epithelium. The virus gains entry through micro-abrasions in the epithelium.
The initial number of copies of the HPV genome in the nucleus of the immature basal cells is
low with a low level of viral proteins being produced. At this stage there is no morphological
change within the nucleus of these infected basal cells hence the infection is now referred to
as a latent infection (Zheng and Baker, 2006). A latent infection would result in a positive
HPV DNA result however there would be no cytological abnormality present and no lesion to
see or treat at colposcopy. As infected basal cells differentiate and move up the epithelium
viral transcription increases which eventually results in the release of the virus as the infected
differentiated cells are shed from the epithelium. In most cases patients will develop

113
immunity against the HPV virus after a period of months or years destroying the virus in the
process (Youssef et al., 2016). These patients will eventually become HPV DNA negative. A
situation can arise where the virus presents at a non-permissive epithelial site in which viral
genomes exist as particles on the surface of the epithelium and this prevents genome
transcription thereby preventing the development of disease. This would still result in a HPV
DNA positive test result due to the presence of HPV nucleic acids. In this situation and in the
case of a latent infection both would represent a non-transcriptionally active HPV infection.
If a patient fails to remove the infection it can become persistent. Persistent infection with high
risk HPV is required for the development of HSIL. Failure to destroy the infection can result
in a rapid increase in the production of E6/ E7 messenger RNA (mRNA) transcripts (Zheng
and Baker, 2006). E6/E7 proteins will disrupt normal cell cycle regulation, control over
apoptosis mechanisms and genetic instability (McGrath et al., 2017). Genetic instability will
result in distorted chromosome distribution and structure and eventually result in a change in
DNA content, therefore genetic instability is critical for the development of cervical cancer,
hence it is not the HPV virus itself that causes disease but the presence of E6/E7 mRNA viral
proteins. Hence this persistent form of infection can be termed a transcriptionally active HPV
infection. This implies that a test designed to detect the over expression of E6 and E7 mRNA
could be more accurate than a test that only detects the presence of viral DNA (Poljak et al.,
2016). Since the association between infection by high risk HPV types and high grade cervical
cancer precursors and cervical cancer is so strong, HPV testing was introduced by
CervicalCheck in 2012 (HIQA, 2017). The HPV virus/genome can be identified in exfoliated
cells which allows for HPV testing to be performed on liquid based cytology (LBC) samples.
Since April 2015 CervicalCheck employs reflex HPV DNA testing on all cytologically
confirmed cases of LSIL, in order to identify patients that are hrHPV positive and more likely
to develop disease (Figure 6.1). Patients who test positive will be referred to colposcopy for

114
further examination and treatment. Any patients who test negative will be returned to routine
screening despite the initial low grade cytology result as they are at a very low risk of
developing disease in the next five years (HIQA, 2017). In a European study it was confirmed
that hrHPV based primary screening (Figure 6.2) provides better protection against cervical
cancer than cytology (Ronco et al., 2014). It works by initially removing all hrHPV DNA
negative patients and returning them to routine screening, thus only patients with an increased
risk of disease will go onto cytological evaluation. This reduces the number of negative samples
a cytologist would have to screen thereby reducing the associated workload of mass screening.
If the cytologist then identifies an abnormality and classifies it as LSIL/HSIL that patient will
then be referred to colposcopy. hrHPV testing used as a primary screening tool has limitations
in that it can’t differentiate between transcriptionally active and non transcriptionally active
forms of the virus.. This inability to distinguish between the different forms of HPV infection
will result in a larger number of samples requiring additional tests and an increase in the number
of patients referred to colposcopy. This underlines the need for more specific triage tests which
could include Raman spectroscopy. The main objective of this study was to assess the ability
of Raman spectroscopy to be used as a triage test in a primary HPV screening environment
(Figure 6.3).

115
Referral to
colposcopy
High risk HPV DNA
detected Return to routine screening
HPV DNA not
detected
Figure 6.1 Process flowchart for HPV reflex testing. Patients will start with an initial Pap smear. If LSIL is detected the patient samples will automatically undergo a HPV DNA test to help rule out a false positive result. If the patient then tests positive for hrHPV DNA they will be refereed to colposcopy.
Figure 6.2 Process flowchart for hrHPV primary testing. Patient samples will be initially tested for the presence
for hrHPV. All negative samples will be returned to routine screening while positive samples will undergo
cytological evaluation. If LSIL/HSIL is reported the patient will be referred to colposcopy. All negative samples
will receive a repeat smear in 6 months and eventually be returned to routine screening.
Pap Smear
Negative = return to routine screening
Reflex HPV test
LSIL
Positive. (High Grade /
Low grade) Colposcopy
Primary HPV screening
Positive HPV DNA
Cytology
Negative Cytology after 6 months
Negative
Negative HPV DNA Routine screening
Positive. (High
Grade / Low
grade)

116
Non-transcriptionally active HPV infection
Figure 6.3 Process flow chart for Raman Spectroscopy as a triage to primary HPV screening. Patient samples will be initially tested for hrHPV. Patients that test negative will return to routine screening. Patients that test positive will undergo Raman spectroscopic analysis to identify patients with a transcriptionally active HPV infection and refer them to colposcopy, Patients identified with a non-transcriptionally active HPV infection will be returned to routine screening.
6.2 Methods
30 HPV DNA and mRNA positive LBC samples and 30 HPV DNA positive and mRNA
negative LBC samples were collected in PreservCyt solution from the Coombe Women and
Infants University Hospital (CWIUH), Dublin, Ireland, after routine cytological screening
and HPV testing had been performed. Ethical approval for use of encoded samples for the
study was granted by the CWIUH Research Ethics Committee (no. 28-2014). HPV
DNA/mRNA positive samples represent the transcriptionally active form of infection and
HPV DNA positive mRNA negative samples represented the non-transcriptionally active
form. A further 14 encoded samples were recruited to validate the classification model which
were made up of a mixture of non-transcriptionally active and transcriptionally active sample
types.
6.2.1 ThinPrep
The samples were then prepared as per section 2.3 and 2.4
Return to routine
screening
Primary
hrHPV
screening
hrHPV DNA -
Raman
Spectroscopy
hrHPV DNA +
Transcriptionally
active HPV
infection
Refer to colposcopy

117
6.2.2 Raman spectroscopy
All Raman analysis recorded as outlined in section 2.5-2.6 .In order to discriminate
transcriptionally active samples from non-transcriptionally active samples, a classification
model was developed from known samples. 30 transcriptionally active samples and 30 non
transcriptionally active samples were recorded (see table 6.1) with 520 cell nuclei being
recorded in total for each sample type with approx. 30 nuclei per sample.
6.2.3 Data pre-processing and analysis
All data was pre-processed as outlined in section 2.7-2.9
6.2.4 Prediction
Since PLSDA is a supervised technique meaning prior knowledge of a sample’s HPV status
is known to build the model, it is important to also include a test set to further validate the
model. The test set was made up of 14 coded samples (transcriptionally active/ non
transcriptionally active). Two methods were employed to validate the model. The first tested
all sample spectra individually to identify how well the model predicts the coded samples, the
second method involved getting the mean of each sample and identifying how well the model
predicts the mean of each sample. Samples with transcriptionally active HPV infection acted
as the positive class as the aim of screening is to identify patients most at risk and who will
require further treatment. Samples with non-transcriptionally active HPV infection acted as a
negative class as they are deemed to be at a lower risk of developing cervical cancer in the
next 5 years and can return to routine screening.

118
6.3 Results and Discussion
6.3.1 Transcriptionally Active Vs Non-Trancriptionally Active
Figure 6.4 (A) shows the mean spectra for non-transcriptionally active samples and
transcriptionally active samples. While both samples appear very similar there are differences
at Raman peak positions 782 cm-1 (nucleic acids) and 1238cm-1 and 1670cm-1 (Proteins
Amide I, Amide III) (table 1.1). Figure 6.4(B) shows latent variables (LV) scores scatter plot
of LV1 and LV2 which shows good discrimination along LV1.The loadings from LV1 are
shown in figure 6.4 (C) and show that discrimination is based around Raman peaks, 483
(glycogen), 727 (Proteins-CH2 def), 782 (nucleic acids- U,C,T, ring br), 851 (proteins-ring br.
Tyr, C-C str), 937 (glycogen), 1002-1004 (Proteins- phenylalanine), 1121 (proteins C-N str,
lipids-Chain C-C str, Carbohydrates- C-O str, 1204 (proteins-C-C6H5 str, Phe, Trp), 1335
(glycogen), 1443 (proteins- CH2 def) 1450 (proteins -CH2 def, lipids CH2 def), 1642 (C=O
str, C=C sym. Str) and 1670 cm-1 (C=O str. Amide I). The PLSDA prediction plot shown in
Figure 6.4 (D) has a sensitivity of 88% and a specificity of 88%. The results show that it is
possible for Raman spectroscopy to distinguish non-transcriptionally active forms of the HPV
infection from the transcriptionally active forms. The LV1 loadings show that discrimination
is mostly based around glycogen and proteins. Glycogen is often found to be lower in
malignant tissue when compared to normal tissue. The high rate of proliferation in malignant
tissue caused by the HPV infection prevents the accumulation of glycogen within the cell
(Lyng et al., 2015). In the regions assigned to proteins there is a marked difference. Raman
peaks assigned to phenylalanine 1004 cm-1 show a slight shift between 1003-1004 cm-1,
which is most likely attributed to the methanol based fixation method which suggests a
change in the conformation of the phenylalanine protein (Meade et al 2010). This shift
appears to occur at random and is not sample specific. Overall protein seems to be the main
discriminating factor between the non- transcriptionally active and transcriptionally active

119
samples. This is most likely down to the altered protein expression due to the persistent HPV
infection taking control of the host cell machinery resulting in the over expression of E6/ E7
viral proteins
Table 6.1 Non-transcriptionally active Vs Transcriptionally active patient summary
Sample Number HPV DNA HPV mRNA
1,2,3,4,5,6,7,8,9,10,11,12,13,14,15,16,
17,18,19,20,21,22,23,24,25,26,27,28,29,30
Positive Negative
31,32,33,34,35,36,37,38,39,40,41,42,43,44
45,46,47,48,49,50,51,52,53,54,55,56,57,58,59,60
Positive Positive

120
A B
cm-1
C D
cm-1
Figure 6.4 (A) Mean spectra of samples with non transcriptionally active HPV infection (green) Vs samples with transcriptionally active HPV infection (blue). B) Latent variables (LV) scores scatter plot of LV1 and LV2 of samples with non-transcriptionally active HPV infection (green) and transcriptionally active HPV infection (blue). C) LV1 loadings. (D) The PLSDA prediction plot.
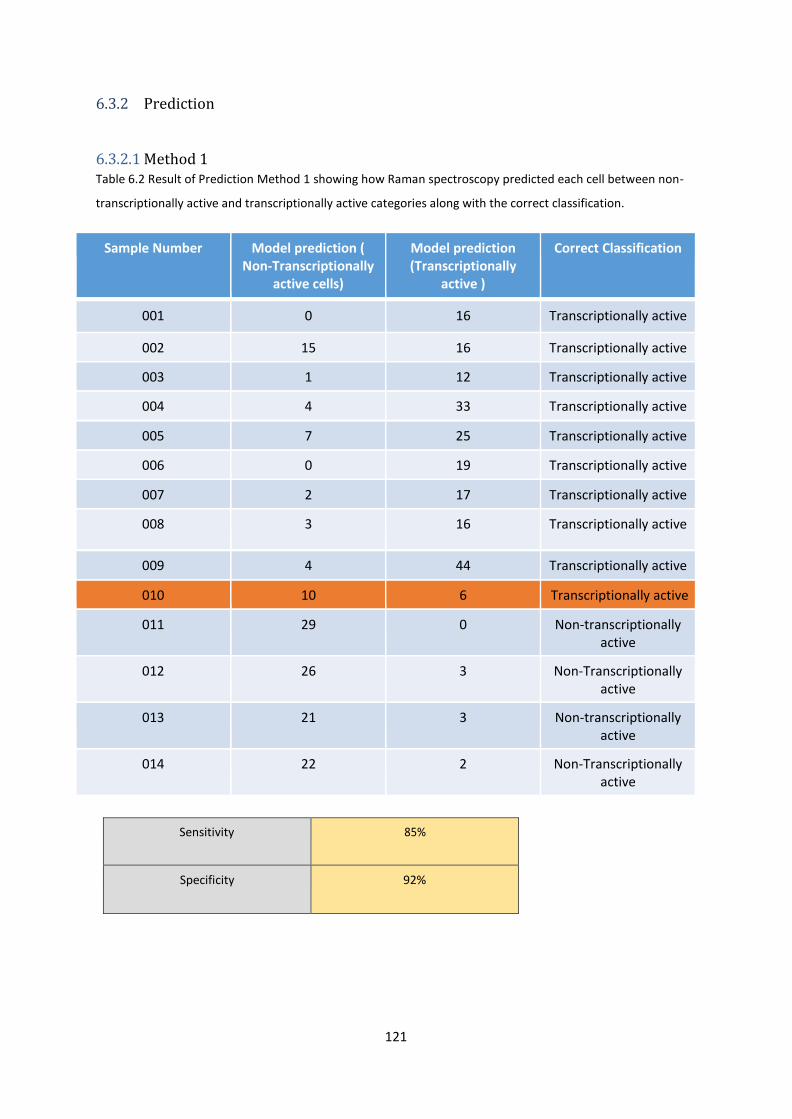
121
6.3.2 Prediction
6.3.2.1 Method 1 Table 6.2 Result of Prediction Method 1 showing how Raman spectroscopy predicted each cell between non-
transcriptionally active and transcriptionally active categories along with the correct classification.
Sample Number Model prediction ( Non-Transcriptionally
active cells)
Model prediction (Transcriptionally
active )
Correct Classification
001 0 16 Transcriptionally active
002 15 16 Transcriptionally active
003 1 12 Transcriptionally active
004 4 33 Transcriptionally active
005 7 25 Transcriptionally active
006 0 19 Transcriptionally active
007 2 17 Transcriptionally active
008 3 16 Transcriptionally active
009 4 44 Transcriptionally active
010 10 6 Transcriptionally active
011 29 0 Non-transcriptionally active
012 26 3 Non-Transcriptionally active
013 21 3 Non-transcriptionally active
014 22 2 Non-Transcriptionally active
Sensitivity 85%
Specificity 92%

122
6.3.2.2 Method 2 Table 6.3 Result of Prediction Method 2 showing how Raman spectroscopy predicted the mean values of each
sample between non-transcriptionally active and transcriptionally active categories along with the correct
classification.
Sample Number Model prediction (Non- transcriptionally active
Mean Cells)
Model prediction (transcriptionally active
Mean Cells)
Correct Classification
001 0 1 Transcriptionally active
002 0 1 Transcriptionally active
003 0 1 Transcriptionally active
004 0 1 Transcriptionally active
005 0 1 Transcriptionally active
006 0 1 Transcriptionally active
007 0 1 Transcriptionally active
008 0 1 Transcriptionally active
009 0 1 Transcriptionally active
010 1 0 Transcriptionally active
011 1 0 Non-transcriptionally active
012 1 0 Non-transcriptionally active
013 1 0 Non-transcriptionally active
014 1 0 Non-transcriptionally active
Sensitivity 90%
Specificity 100%

123
6.3.2.3 Comparison of Raman classification, Cytology result, Histology result and HPV
status . Table 6.4 Raman classification, Cytology result, Histology result and HPV status for the independent test set
Sample Number
Raman Classification
Cytology Histology Cobas HPV DNA Test
Aptima HPV mRNA Test
001 Transcriptionally active
HSIL CIN 2 Positive Positive
002 Transcriptionally active
HSIL CIN3 Positive Positive
003 Transcriptionally active
HSIL CIN 3 Positive Positive
004 Transcriptionally active
HSIL CIN 2 Positive Positive
005 Transcriptionally active
HSIL CIN1 Positive Positive
006 Transcriptionally active
HSIL CIN2 Positive Positive
007 Transcriptionally active
HSIL CIN2 Positive Positive
008 Transcriptionally active
HSIL CIN3 Positive Positive
009 Transcriptionally active
HSIL CIN2 Positive Positive
010 Non Transcriptionally
active
LSIL CIN1 Positive Positive
011 Non- transcriptionally
active
LSIL Negative Positive Negative
012 Non- transcriptionally
active
Negative Negative Positive Negative
013 Non- transcriptionally
active
LSIL Negative Positive Negative
014 Non- transcriptionally
active
Negative Negative Positive Negative

124
From the prediction results it is clear that both method 1 and 2 provided successful validation
of the classification model. Method 1 shows that 9 out of 10 samples with transcriptionally
active HPV infection were successfully predicted and 4 out of 4 samples with a non-
transcriptionally active HPV infection were predicted correctly. Sample 010 was the only
sample to be wrongly predicted. 10 out of 16 cells were predicted to be non-transcriptionally
active when they were from a transcriptionally active sample. Sample 002 also highlights the
need to record multiple spectra from the same sample. Even though the sample was classified
correctly via method 1 there was only 1 cell in the difference between non-transcriptionally
active and transcriptionally active. This demonstrates that not all the cells within a given
sample may classify correctly. This could be down to a number of factors such as sampling
technique, and the size of the infected area and the presence of HPV mRNA in every cell
tested. One possible way to address this issue is to predict the independent test set samples
using the mean spectra from each sample thereby reducing the variability within the data. If
the mean spectra show the biochemical changes associated with the transcriptionally active
infection then correct classification should be achieved . Overall this method gave the model
a sensitivity and specificity of 85% and 92% respectively. It is not possible to know from this
study if the level of abnormality (LSIL/HSIL) affects the number of cells predicting into each
category as all transcriptionally active samples tested were reported as HSIL. Future work
would involve testing LSIL samples that are reported as transcriptionally active to see if this
would affect the number of cells correctly predicted between the two groups.
Method 2 showed an improved result with a sensitivity of 90% and a specificity of 100%
The mean spectra were used for each sample rather than individual cell spectra. This reduced
the variability within the dataset resulting in the increase in sensitivity and specificity.
However sample 010 was again misclassified. A limitation of this study is the relatively low

125
number of latent samples used for prediction. As the main source of sample recruitment was a
colposcopy clinic, most patient referrals were based on HSIL hence most patients had a
transcriptionally active HPV infection so it was difficult to recruit patients who had a non-
transcriptionally active infection.
Table 6.4 shows the Raman classification, cytology result, histology result and HPV DNA/
mRNA status for the independent test set samples. Samples 001-009 show a strong
correlation between Cytology, Histology and HPV testing which are backed up by the Raman
classification result of transcriptionally active. Sample 010’s cytology and histology result
report a LSIL or CIN1 lesion. The positive Aptima mRNA test result indicates that this
patient has a transcriptionally active infection meaning that this patient would be at a higher
risk of developing disease in the next 3-5 years. Given the Raman classification of a negative
result (non transcriptionally active) and all other tests indicate a transcriptionally active
infection, it suggests that this Raman result is a false negative. Samples 011-014 were all
classified as a non-transcriptionally active by Raman spectroscopy which is backed up by the
histology and HPV mRNA tests. The cytology LSIL result could be down to false positives
caused by an inflammatory condition or the regression of a non-transcriptionally active HPV
infection. Either way these patients are at a lower risk of developing cancer in the next 3-5
years and should be returned to routine screening. Apart from sample 010, Raman
spectroscopy was successful in identifying transcriptionally active and non -transcriptionally
active HPV infections which is backed up by the standard screening approach of cytological,
histological and HPV DNA/mRNA testing.
126
6.4 Conclusion
The advantage of employing Raman spectroscopy as a triage test in a primary hrHPV
screening environment is that it would prevent the unnecessary referral of patients with a
non-transcriptionally active HPV infection for cytological evaluation while ensuring that
patients with an increased risk of disease are referred to colposcopy. All analysis could be
performed on the same initial Pap test thereby reducing costs and preventing unnecessary
additional sample collection and delays. Raman spectroscopy can provide a cheap rapid non-
destructive method to identify patients most at risk without subjectivity. Future work on this
subject should involve using a primary screening cohort of samples which would provide a
larger sample base of non-transcriptionally active samples for testing compared to
colposcopy based recruitment.

127
Chapter 7
Conclusions and Future Work

128
7.1 Conclusions
Cervical cancer remains one of the most common cancers affecting women worldwide. Most
developed countries operate a cervical screening programme, which are based on the
cytological evaluation of cervical cells. While this method generally operates with a high
specificity (96.5%), it suffers from a variability in its sensitivity rates (30-85%) (Nanda et al.,
2000). The variability in sensitivity is mainly due to the subjectivity of the associated test.
New technology is, therefore, needed. HPV testing has been incorporated into most cervical
cancer screening programmes as either a form of management and triage or as a test of cure.
Currently, there are plans to introduce HPV screening as a primary method of screening in
Ireland for cervical cancer. This clearly indicates that cervical cancer screening programmes
are attempting to move away from tests based on visual interpretation, which are prone to
subjectivity and human error and more towards molecular tests which are more objective.
The overall goal of cervical screening research is to create new triage tests that identify
women who are HPV positive but who are also at a higher risk of developing cervical cancer.
The triage tests should also be able to identify women who are HPV positive but also at a
lower risk of developing cervical cancer in the next five years and return them to routine
screening. Costs should be reduced and the rates of sensitivity and specificity for disease
should increase.
The research question of this thesis was to assess the potential of Raman spectroscopy as a
new test for cervical cancer screening by investigating the potential hurdles associated with
the disease and technology. Chapter 1 acts as an introduction to the thesis and outlines the
natural history of the disease, the clinical aspects of screening and introduces the Raman
spectroscopy technology. Chapter 2 outlines the materials and methods which were employed
for this thesis.

129
Chapter 3 investigated potential hormonal effects in cervical smear samples using Raman
spectroscopy. The findings from this chapter suggest that the menstrual cycle will have an
effect on the Raman spectra recorded with regards to the levels of glycogen and proteins.
Postmenopausal samples proved to be problematic for Raman spectroscopy due to a lack of
cellular material and the presence of cellular debris. The use of hormone-based
contraceptives resulted in the most variability within the spectra. However all these hormone
based changes did not hinder the ability of Raman spectroscopy to discriminate cytology
negative cells from HSIL cells. Overall, this study highlighted the scope of Raman
spectroscopy for cervical cancer screening despite the presence of biochemical changes
associated with the menstrual cycle and the use of hormone-based contraceptives. Previous
work published by Kanter et al (2009) showed that hormonal differences due to the
menstrual cycle can influence the Raman spectra acquired from the cervix in vivo. Our
study reports similar findings, however our study also addressed the use of hormone
based contraceptives, and if these hormone induced changes will hinder the ability of
Raman spectroscopy to identify dyskaryotic cells, which is the primary goal when
developing a screening test for cervical cancer.
Chapter 4 outlines a study which aimed to improve on our previous published work (Bonnier
et al. 2014) on a method for removal of blood contamination from Thinprep cervical cytology
samples for Raman spectroscopic analysis. Liquid based cytology Thinprep specimens were
treated by adding hydrogen peroxide directly to the vial followed by a process of centrifugation
and pipetting. Good quality Raman spectra were recorded from negative and high-grade
cytology samples which initially presented with heavy blood contamination. This study
demonstrated for the first time the improved potential of Raman spectroscopy for analysis of
ThinPrep specimens regardless of blood contamination. This technique is a continuation of
our previous work (Bonnier et al 2014), however it is novel in that it is not restricted to blood

130
scale 0-1 samples and can be applied to all samples on the blood scale index (blood scale 0-
4).
Chapter 5 assessed the potential of using biobanked liquid based cytology samples for
cervical cancer screening using Raman spectroscopy. The aim of this study was to assess the
ability of Raman spectroscopy to screen for histologically confirmed cases of CIN using
biobanked (LBC) samples. Two temperatures for long-term storage were assessed, -80oC and
-25oC. The utility of Raman spectroscopy for the detection of CIN was compared for fresh
LBC samples and biobanked LBC samples. Two groups of samples were used for the study
with one group associated with disease (CIN3) and the other associated with no disease
(cytology negative). The data indicated that samples stored at -80oC are not suitable for
assessment by Raman spectroscopy due to a lack of cellular material and the presence of
cellular debris. However, the technology can be applied to fresh LBC samples and those
stored at -25oC and is effective in the discrimination of negative samples from those where
CIN 3 has been confirmed. This study demonstrates for the first time that cervical cytology
samples stored within biobanks at temperatures that preclude cell lysis can act as a useful
resource for Raman spectroscopy and will facilitate research and translational studies in this
area. To our knowledge, this is the first study of its kind to investigate the application of
biobanked LBC samples for Raman spectroscopy analysis.
Chapter 6 investigated the potential application of Raman spectroscopy as a triage test for
cervical cancer screening in a primary HPV screening environment. This study outlined the
two possible outcomes of a HPV infection and divided samples into two separate categories,
non-transcriptionally active and transcriptionally active. The latent stage of infection
represents an initial low level of viral proteins being produced, which would still result in a
positive HPV DNA based test even though there would be no cytological abnormality present
and no lesion to see or treat at colposcopy, hence this would result in an unnecessary patient

131
referral. In most cases, a patient would develop immunity against the HPV virus and clear the
virus in the process. If the patient fails to remove the infection, it can result in the rapid
expression of E6 and E7 mRNA transcripts resulting in a transcriptionally active infection. At
this stage, a patient would test positive for both HPV DNA and mRNA and should be
referred to colposcopy for treatment. The aim for this chapter was to determine if Raman
spectroscopy could identify individuals with a transcriptionally active HPV infection in a
primary HPV screening environment to prevent unnecessary referral of those with a non
transcriptionally active HPV infection. In a blind validation study, the results showed that
Raman spectroscopy could successfully identify transcriptionally active samples with a
sensitivity of 90% and a specificity of 100%. A number of previous works (Vargis et al.,
2012 Ostrowska et al., 2010 ,Jess et al., 2007) investigated the ability of Raman spectroscopy
to identify HPV infection. However, most of these studies utilised HPV infected cell lines
rather than ‘real world’ cytology samples. With the current trend of HPV molecular testing
taking over as a primary method of cervical cancer screening it is not sufficient to just detect
the presence of HPV, additional information is required on whether the infection is non-
transcriptionally active or transcriptionally active. If Raman spectroscopy is to be considered
as a possible triage test for cervical screening. Our study advances the Raman spectroscopy
technique for cervical cancer screening but also highlights the potential of Raman
spectroscopy to advance screening technology beyond conventional methods in a cost
effective, label free and non-destructive manner.
Previous studies involving Raman spectroscopy for cervical cancer diagnosis ( Rashid et
al.,2014, Krishna at al., 2006, Kamemoto et al., 2010 and Tan et al 2010) all utilised fixed
tissue sections for their studies however tissue sections are not suitable for a screening based
test given the invasive nature of obtaining an excision biopsy.

132
A study conducted by Rubina et al. (2013) utilised patient cytology samples in a cell pellet
form but was not able to report a sensitivity higher than 79% for disease detection due to
confounding factors such as blood which have been addressed in this thesis. Numerous
studies (Mahadevan-Jansen.,et al 1998, Utzinger.,et al 2001 and Robichaux-Viehoever et
al.,2007) employed a Raman probe for sample recording with the latter reporting a sensitivity
and specificity of 89% and 81% respectively between negative and HSIL. While this
represents a higher sensitivity/specificity rate compared to other studies involving Raman
spectroscopy, it fails to account for long acquisition times of 60-180 seconds or more and the
ability for a clinician to locate and hold the Raman probe against an area of interest on the
cervix. While this probe based method shows potential, the studies reported in this thesis
obtained sensitivity rates between 86-90% and specificity rates of 95-100% for disease across
multiple studies with a larger sample base.
An advantage of this study over others is that it utilises an already established processing
method (Thinprep) for Raman spectroscopic analysis. The technology/ processing method is
already established in all cytology labs, and therefore requires no alterations or additional
costs with regards to sample processing. This means that the Raman spectroscopy method
can fit easily into the current routine workflow. An added benefit of using the Thinprep
method is that after completion of the Raman spectral screening of a given sample, the same
slide could be stained and screened by a cytologist, which could act as a failsafe or as an
additional triage test. Interestingly, in all the studies described in this thesis, Raman spectra
were recorded from morphologically normal intermediate and superficial cells on Thinprep
Pap smears. It was not necessary to find the morphologically abnormal cells on each slide as
is required for cytological screening.
Therefore, this study is unique in that it does not require abnormal cells for screening, it can
utilise an already validated sample processing method (Thinprep), it is non-destructive which

133
allows additional tests to be performed on the same Thinprep slide used for Raman
spectroscopy and would be a cheaper alternative to HPV testing (Cobas/Aptima).
Overall, this study has confirmed our hypothesis that Raman spectroscopy can be utilised for
cervical cancer screening. We have investigated hormonal effects, removal of contaminating
blood from cervical Pap smear samples, utility of frozen biobanked samples for cervical
cancer screening using Raman spectroscopy and the utility of Raman spectroscopy as a triage
test for cervical cancer screening.
7.2 Future Work There is currently a lot of interest in using Raman spectroscopy as a diagnostic aid as the
technique makes it possible to extract information about a given sample non-invasively, non-
destructively and in a label free manner. Spectra can be accumulated, corrected for un-wanted
signal (glass), processed and analysed rapidly. Raman spectroscopy can currently satisfy
many of the criteria required for transforming a vibrational spectroscopic technique into a
diagnostic clinical based test. However, there are limitations with the current Raman
spectroscopy technology. The Raman spectrometer is comprised of three separate
components, which include a light source, light delivery system with collection and a
dispersive element and a detector all of which will have to become robust, compact and be
able to operate efficiently within a lab or clinical based setting. This project was completed
manually, which involved lining up the laser with the centre of the selected cell nucleus and
recording a Raman spectrum. For a clinical based setting or future studies, this process should
become automated. In order for the Raman method to become automated, a standard
operating procedure would have to be established which would be based on a series of
algorithms that allow for the highest quality spectra with high signal to noise ratio to be
recorded. These algorithms would have to account for variations in sample quality and cell
type. An automated cell recognition routine would also have to be developed which could

134
work in tandem with the Raman spectroscopy routine to identify specific cell nuclei and align
the target nuclei with the Raman laser source. The test samples would have to consist of a
monolayer of cells free of debris and blood contamination.
In the studies presented in this thesis, sample recruitment was based at a colposcopy clinic
and limited to patients with no previous history of disease; future studies should involve a
larger more comprehensive sample base, which includes patients with a previous history of
disease. Also future samples should be recruited from a screening population. Given the
introduction of the HPV vaccine with the first round participants about to enter the screening
programme, future studies should also incorporate this demographic.
This body of work was performed as a continuation of on-going research on the application
of Raman spectroscopy into cervical cancer screening which was conducted under the
direction of the CERVIVA consortium (www.cerviva.ie) and the Technological University
Dublin. All findings from this thesis are being used to implement a clinical utility study of
the Raman technology using 1,000 patient samples, funded by the Health Research Board.

135
Chapter 8
References and Publications

136
8.1 References
Adams, A. L. et al. (2006) ‘Negative Colposcopic Biopsy After Positive Human Papilloma
Virus (HPV) DNA Testing’, American Journal of Clinical Pathology, 125(May), pp. 413–
418.
Al-Abbadi MA. Basics of cytology. Avicenna J Med. 2011;1(1) pp. 18-28.
Arbyn M, et al (2008) ‘Liquid compared with conventional cervical cytology: a systematic
review and meta-analysis’, Obstet Gynecol, 111(1), pp. 167–77.
Arbyn, M. et al. (2007) ‘Burden of cervical cancer in Europe: Estimates for 2004’, Annals of
Oncology, 18(10), pp. 1708–1715.
Arbyn, M. and Ronco, G. (2009) ‘How to evaluate emerging technologies in cervical cancer
screening’, Journal of Cancer, 125(11), pp. 2489–2496.
Baker, M. J. et al. (2018) ‘Clinical applications of infrared and Raman spectroscopy: state of
play and future challenges’, The Analyst. Royal Society of Chemistry 143(8),pp.1735-1757
Baldur-Felskov, B. et al. (2014) ‘Early impact of human papillomavirus vaccination on
cervical neoplasia - Nationwide follow-up of young danish women’, Journal of the National
Cancer Institute, 106(3).
Ballabio, D Consonni, V. (2013) ‘Classification toold in chemistry.Part 1: Linear models.
PLSDA’, royal society of chemsitry, 5, pp. 3790–3798.
Ball, D.W., 2001. Theory of Raman Spectroscopy. Spectroscopy, 16(11).
Basicmedicalkey.com
https://basicmedicalkey.com/cervical-benign-and-non-neoplastic-conditions. (accessed
Feburary 10, 2016)
Behl, I. et al. (2017) ‘Development of methodology for Raman microspectroscopic analysis
of oral exfoliated cells’, Analytical Methods. Royal Society of Chemistry, 9, pp. 1–22.
Bellisola, G. Sorio, C. (2012) ‘Infrared spectroscopy and microscopy in cancer research and
diagnosis.’, American journal of cancer research, 2(1), pp. 1–21.
Biomed.tamu.edu
http://biomed.tamu.edu/obsl/OBSL/Research%20Projects/SERS_biosensor.htm (accessed
October ,2016)
Bonnier, F. et al. (2014) ‘Processing ThinPrep cervical cytological samples for Raman
spectroscopic analysis’, Anal. Methods, 6(19), pp. 7831–7841.
Boron, W. F Medical physiology. 3rd edn. Elsevier Ltd 2005. p851-854.
Bosch, F. X. et al. (2002) ‘The causal relation between human papillomavirus and cervical
cancer.’, Journal of Clinical Pathology, 55(4), pp. 244–65.

137
Bray,Freddie. et al (2018) 'Gobal Cancer statistics 2018. Globocan estimates of incidence and
mortality worldwide for 36 cancers in 185 countries'.; CA CANCER J CLIN; 68 pp.394–424.
Brozek-Pluska, B. et al. (2012) ‘Raman spectroscopy and imaging: applications in human
breast cancer diagnosis’, The Analyst, 137(16), p. 3773.
Bulten, J. et al. (2011) ‘European guidelines for quality assurance in cervical histopathology’,
Acta Oncologica, 50(5), pp. 611–620.
Burd, E. et al (2003) ‘Human papillomavirus and cervical cancer’, Clin Microbiol Rev, 16(1),
pp. 1–17.
Canadian Cancer Society
https://www.cancer.ca/en/cancer-information/cancer-type/cervical/cervical-cancer/the-
cervix/?region=on (accessed September 20, 2019)
CervicalCheck (2013) Organisational and Clinical Guidance for Quality Assured Colposcopy
Services.
Chiriboga, L. et al. (1998) ‘Infrared spectroscopy of human tissue. I. Differentiation and
maturation of epithelial cells in the human cervix’, Biospectroscopy, 4(1), pp. 47–53.
Clinic, C.
http://www.clevelandclinic.org/health/healthinfo/docs/0600/0642.asp?index=4711 (accessed
September 20,2019)
Cohenford, M. a et al. (1997) ‘Infrared spectroscopy of normal and abnormal cervical smears:
evaluation by principal component analysis.’, Gynecologic oncology, 66(1), pp. 59–65.
Cplmag.com
http://www.clpmag.com/2019/06/reducing-cervical-cancer (accessed September,2019).
Cuzick, J. et al. (2013) ‘Comparing the performance of six human papillomavirus tests in a
screening population’, British Journal of Cancer, 108(4), pp. 908–913.
Daniel,A et al (2018) 'Near-infrared Raman spectroscopy for estimating biochemical changes
assoicated with different pathological conditions of the cervix’,Spectrochimica Acta Part
A:Molecular and Biochemcial Spectroscopy, 190,pp 409-416.
De Vincenzo, R. et al. (2014) ‘Long-term efficacy and safety of human papillomavirus
vaccination’, International Journal of Women’s Health, 6, pp. 999–1010.
Diem, M. et al. (2002) ‘IR spectra and IR spectral maps of individual normal and cancerous
cells’, Biopolymers - Biospectroscopy Section, 67(4–5), pp. 349–353.
Diem, M. et al. (2013) ‘Molecular pathology via IR and Raman spectral imaging’, Journal of
Biophotonics, 6(11–12), pp. 855–886.
Dillner, J. et al. (2008) ‘Long term predictive values of cytology and human papillomavirus
testing in cervical cancer screening: joint European cohort study’, Bmj, 337, pp. 1754–1754.
Dobbin K, Simon RM (2011). 'Optimally splitting cases for training and testing high
dimensional classifiers'. BMC Med Genomics,4(31).

138
Doorbar J (2005). 'The papillomavirus life cycle'. Journal of Clinical Virology; 32, pp. 7-15
Doorbar, J. et al. (2012) ‘The biology and life-cycle of human papillomaviruses’, Vaccine.
Elsevier Ltd, 30, pp. 55–70.
Downes, A, Elfick, A. (2010) ‘Raman spectroscopy and related techniques in biomedicine’,
Sensors, 10(3), pp. 1871–1889.
Duraipandian.S et al., (2012). “Simultaneous fingerprint and high-wavenumber confocal
Raman spectroscopy enhances early detection of cervical precancer in vivo,” Anal. Chem. 84,
pp.5913–5919.
Duraipandian, S. et al. (2013) ‘Integrated fingerprint and high wavenumber confocal Raman
spectroscopy for in vivo diagnosis of cervical precancer’, Analytical Chemistry, 84(14), p.
85720Z.
Duraipandian, S. et al. (2018) 'Raman spectroscopic detection of high grade cervical
cytology: Using morphologically normal appearing cells' SCI Rep 8:15048 |
Eurocytology.eu
https://www.eurocytology.eu/en/course/843 (accessed September 20, 2019)
Ferlay.J et al., (2015). “Cancer incidence and mortality worldwide: sources, methods and
major patterns in GLOBOCAN 2012,” Int. J. Cancer 136, pp.359–386.
Fouad, Y. A., Aanei, C. (2017) ‘Revisiting the hallmarks of cancer’, American Journal of
Cancer Research, 7(5), pp. 1016–1036.
Fox, J. M. et al. (2017) ‘Methodology for reliable and reproducible cryopreservation of
human cervical tissue’, Cryobiology. Elsevier Ltd, 77, pp. 14–18.
Garland, S. M. et al. (2016) ‘Impact and effectiveness of the quadrivalent human
papillomavirus vaccine: A systematic review of 10 years of real-world experience’, Clinical
Infectious Diseases, 63(4), pp. 519–527.
Gauglitz, G. & Vo-Dinh, T,. Handbook of Spectroscopy , WILEY-VCH,(2003) pp.43.
Gautam, R. et al. (2015) ‘Review of multidimensional data processing approaches for Raman
and infrared spectroscopy’, EPJ Techniques and Instrumentation. EPJ Techniques and
Instrumentation, 2(1), p. 8.
General cytopathology.
http://pathology.jhu.edu/cytopath/masterclass/general/1gen16.htm. (accessed September 21,
2016)
Gettyimages
https://www.gettyimages.ie/detail/illustration/menstrual-cycle-illustration-stock-
graphic/502865065 (accessed January 12, 2018)
González-Solís, J. L. et al. (2013) ‘Cervical cancer detection based on serum sample Raman
spectroscopy’, Lasers in Medical Science, 29(3), pp. 979–985.

139
Gray, N. M. et al. (2006) ‘Psychological effects of a low-grade abnormal cervical smear test
result: Anxiety and associated factors’, British Journal of Cancer, 94(9), pp. 1253–1262.
Haedicke, J. and Iftner, T. (2016) ‘A review of the clinical performance of the Aptima HPV
assay’, Journal of Clinical Virology, 76, pp. S40–S48.
HealthDxS.
https://healthdxs.com/en/thinprep/.( accessed June 13,2017)
HIQA (2017) ‘Health technology assessment of human papillomavirus testing as the primary
screening method for prevention of cervical cancer’, Health Information and Quality
Authority, (May), pp. 1–347.
Holmgren SC, et al (2005). The minor capsid protein L2 contributes to two steps in the
human papillomavirus type 31 life cycle. Journal of Virology; 79( 7): 3938– 3948.
Ikenberg, H. et al. (2013) ‘Screening for cervical cancer precursors with p16/Ki-67 dual-
stained cytology: Results of the PALMS study’, Journal of the National Cancer Institute,
105(20), pp. 1550–1557.
Jess, P. R. T. et al. (2007) ‘Early detection of cervical neoplasia by Raman spectroscopy’,
International Journal of Cancer, 121(12), pp. 2723–2728.
Johansson C, et al (2012). HPV‐16 E2 contributes to induction of HPV‐16 late gene
expression by inhibiting early polyadenylation. The EMBO Journal 2012; 31( 14) pp. 3212–
3227.
Kamemoto, L. E. et al. (2010) ‘Near-infrared micro-Raman spectroscopy for in vitro
detection of cervical cancer’, Appl Spectrosc, 64(3), pp. 255–261.
Kanter, E. M. et al. (2009) ‘Application of Raman spectroscopy for cervical dysplasia
diagnosis’, Journal of Biophotonics, 2(1–2), pp. 81–90.
Kanter. E.M et al., (2009). “Effect of hormonal variation on Raman spectra for cervical
disease detection,” Am. J. Obstet. Gynecol. 200, pp 512 –512.
Kearney, P. et al. (2017) ‘Raman spectral signatures of cervical exfoliated cells from liquid-
based cytology samples.’, Journal of biomedical optics, 22(10), pp. 1–10.
Kerr.L.T et al., (2016). “Methodologies for bladder cancer detection with Raman based urine
cytology,” Anal. Methods 8, pp.4991–5000.
Kitchener, H. C. et al. (2011) ‘MAVARIC - A comparison of automation-assisted and
manual cervical screening: A randomised controlled trial’, Health Technology Assessment,
15(3), pp. 1–176.
Kohavi, R. (1995) ‘A Study of Cross-Validation and Bootstrap for Accuracy Estimation and
Model Selection 2 Methods for Accuracy Estimation’, Proc. of IJCAI, (2)pp. 1137–1145.
Kong.K et al., (2015). “Raman spectroscopy for medical diagnostics—from in- vitro biofluid
assays to in-vivo cancer detection,” Adv. Drug Delivery Rev. 89, pp.121–134.
Koss, L. G. (2005) Diagnostic Cytology and Its Histopathologic Bases. 5th edn, Volume 5.

140
5th edn. Edited by L. G.Koss. Lippincott Williams & Wilkins.
Krishna, C. M. et al. (2006) ‘Vibrational Spectroscopy Studies of Formalin-Fixed Cervix
Tissues Vibrational Spectroscopy Studies of Formalin-Fixed Cervix Tissues’, Biopolymers,
85(3), pp. 214–221.
Laboratory,T.P.K. Spectroscopic Characterization
https://www3.nd.edu/kamatlab/facilities_spectroscopy.html (accessed December 12, 2016)
Lyng, F,et al. (2015) ‘Raman spectroscopy for cytopathology of exfoliated cervical cells’,
Analytical and Bioanalytical Chemistry, 407(27), pp. 8279–8289.
Lyng, F. et al. (2015) ‘Vibrational Microspectroscopy for Cancer Screening’, Applied
Sciences, 5, pp.23-35.
Mahadevan-jansen, A. (2010) ‘Disease Detection’, Arn J Obstet Gynecol., 200(5), pp. 1–13.
Mahadevan‐Jansen, et al (1998) ‘Development of a Fiber Optic Probe to Measure NIR
Raman Spectra of Cervical Tissue In Vivo’, Photochem Photobiol, 68, pp. 427–31.
manhattancenterforgynecology.
https://manhattancenterforgynecology.com/colposcopy/(accessed September 20,2019)
Marquez-Curtis, L. A., McGann, L. E. and Elliott, J. A. W. (2017) ‘Expansion and
cryopreservation of porcine and human corneal endothelial cells’, Cryobiology. Elsevier Ltd,
77, pp. 1–13.
McGrath, C. J. et al. (2017) ‘Role of p16 testing in cervical cancer screening among HIV-
infected women’, Plos one, 12(10), pp. 1–9.
Meade, A. et al (2010) ‘Studies of Chemical fixation effects in Human cell lines using Raman
Mircrospectroscopy’, Bioanalytical chemistry, 369(5), pp. 1781–1791.
Medicoapps.org
https://medicoapps.org/m-cervical-intraepithelial-neoplasia-cin/( accessed September 23,
2019)
Medipally, D. K. R. et al. (2017) ‘Development of a high throughput (HT) Raman
spectroscopy method for rapid screening of liquid blood plasma from prostate cancer
patients’, The Analyst. Royal Society of Chemistry, 142(8), pp. 1216–1226.
Medlineplus
https://medlineplus.gov/ency/imagepages/19263.htm (accessed March 14, 2018).
Milligan SG, et al (2007). Analysis of novel human papillomavirus type 16 late mRNAs in
differentiated W12 cervical epithelial cells. Virology; 360( 1) pp. 172– 181.
Mo, J. et al. (2009) ‘High wavenumber Raman spectroscopy for in vivo detection of cervical
dysplasia’, Anal. Chem, 81(21), pp. 8908–8915.
Movasaghi, Z., Rehman, S., U., R. I. (2007) ‘Raman spectroscopy of biological tissues.’,
Applied Spectroscopy Reviews, 42, pp. 493–541.

141
Munoz, N. et al. (2010) ‘Impact of Human Papillomavirus (HPV)-6/11/16/18 Vaccine on All
HPV-Associated Genital Diseases in Young Women’, Journal of the National Cancer
Institute, 102(5), pp. 325–339.
Nair.A, H. T. (2010) A Case Based, Clinical Guide. Edited by S. Science+ and B. (Genevieve
N.-P. Media. New York: Contemporary Endocrinology.
Nanda K.et al. (2000) ‘Accuracy of the Papanicolaou Test in Screening for and Follow-up of
Cervical Cytologic Abnormalities’, Ann Intern Med, 132, pp. 810–819.
Ostrowska, K. M. et al. (2010) ‘Investigation of the influence of high-risk human
papillomavirus on the biochemical composition of cervical cancer cells using vibrational
spectroscopy’, The Analyst, 135(12), pp. 3087.
O’Dea, D. et al. (2018) ‘Raman spectroscopy for the preoperative diagnosis of thyroid cancer
and its subtypes: An in vitro proof-of-concept study’, Cytopathology, 30(1) pp. 51-60.
Peakman, T. and Elliott, P. (2010) ‘Current standards for the storage of human samples in
biobanks’, Genome Medicine, 2(10), pp. 2–4.
Petry, K. U. et al. (2017) ‘A model to evaluate the costs and clinical effectiveness of human
papilloma virus screening compared with annual papanicolaou cytology in Germany’,
European Journal of Obstetrics Gynecology and Reproductive Biology. Elsevier Ireland Ltd,
212, pp. 132–139.
Pirro, V. et al. (2017) ‘Intraoperative assessment of tumor margins during glioma resection
by desorption electrospray ionization-mass spectrometry’, Proceedings of the National
Academy of Sciences, 114(26), pp.6459.
Poljak, M. et al. (2016) ‘Commercially available molecular tests for human papillomaviruses
(HPV): 2015 update’, Journal of Clinical Virology, 76, pp.3–13
Ramos.I, Malkin.A, and Lyng.F, (2015). “Current advances in the application of Raman
spectroscopy for molecular diagnosis of cervical cancer,” BioMed Res. Int. 9,pp 1–9.
Ramos, I. R. et al. (2016) ‘Raman spectroscopy for cytopathology of exfoliated cervical
cells’, in Faraday Discuss., pp. 187–198.
Rashid, N. et al. (2014) ‘Raman microspectroscopy for the early detection of pre-malignant
changes in cervical tissue’, Experimental and Molecular Pathology. Elsevier Inc., 97(3), pp.
554–564.
Robichaux-Viehoever.A. et al (2007) ‘Characterization of Raman Spectra Measured in Vivo
for the Detection of Cervical Dysplasia’, Applied Spectroscopy, Vol 61(9), pp. 986–993.
Rodriguez, E. F. et al. (2012) ‘Atypical squamous cells of undetermined significance in
patients with HPV positive DNA testing and correlation with disease progression by age
group: An institutional experience’, International Journal of Clinical and Experimental
Pathology, 5(5), pp. 428–435.
Romeo, M. J., Quinn, M. A., Burden, F. R., McNaughton, D (2002) ‘Influence of benign
cellular changes in diagnosis of cervical cancer using IR microspectroscopy’. Biopolymers
67, pp.362–366.

142
Romeo.M, Romeo.M.J, Wood B.R. (2002)’Observing the cycling changes in cervical
epithelium using infrared microspectroscopy’, Vibrational Spectroscopy, 28, pp167-175.
Ronco, G. et al. (2010) ‘Efficacy of human papillomavirus testing for the detection of
invasive cervical cancers and cervical intraepithelial neoplasia: a randomised controlled trial’,
The Lancet Oncology, 11(3), pp. 249–257.
Ronco, G. et al. (2014) ‘Efficacy of HPV-based screening for prevention of invasive cervical
cancer: Follow-up of four European randomised controlled trials’, The Lancet, 383(9916),
pp. 524–532.
Rozemeijer, K. et al. (2016) ‘Comparing SurePath, ThinPrep, and conventional cytology as
primary test method: SurePath is associated with increased CIN II+detection rates’, Cancer
Causes and Control, 27(1), pp. 15–25.
Rozenberg.S et al (2001)’Clinical evidence supporting the rationale for constant oestrogen,
intermittent progestogen hormone replacement therapy’.Eur J Obstet Gynecol Reprod Biol.
Jan;94(1) pp.86-91.
Rubina.S, M. S. Vidyasagar, and C. M. Krishna, (2013). “Raman spectroscopic study on
prediction of treatment response in cervical cancers,Innovative Opt. Health Sci. 6,
1350014
Rubina.S, C, Murali, K. (2015) ‘Raman spectroscopy in cervical cancers: An update’, Journal
of cancer research and therapeutics, 11(1), pp. 10–17.
Vargis.E et al., (2011). “Effect of normal variations on disease classification of Raman
spectra from cervical tissue,” Analyst 136, pp 2981–2987.
Vargis.E et al., (2012). “Near-infrared Raman microspectroscopy detects high- risk human
papillomaviruses,” Transl. Oncol. 5, pp 172–179.
Winer, R. L. et al. (2003) ‘Genital human papillomavirus infection, incidence and risk factors
in a cohort of female university students’, American Journal of Epidemiology, 157, pp. 218–
226.
Sahdev,A et al. (2010)'Cervical tumours',Seminars in Ultrasound, CT and MRI Elsevier Inc.,
31(5), pp399-413.
Sanchez-Rojo et al. (2016)’Cervical cancer detection based on serum sample surface
enhanced Ramannspectroscopy’, Rev Mex Fis,62, pp. 213-218.
Sankaranarayanan R, S. J. (2003) Colposcopy and Treatment of Cervical Intraepithelial
Neoplasia., World Health Organization - International Agency for Research on Cancer
(IARC)
Santos, I.P, Barroso, E.M (2017) ‘Raman spectroscopy for cancer detection and cancer
surgery guidance: translation to the clinics’, Analyst, 142, pp. 3025–3047.
Sanjosé, S. et al. (2007) ‘Worldwide prevalence and genotype distribution of cervical HPV in
women with normal cytology’, Lancet Infect, 7(7), pp. 453–459.

143
Schiffman, M., Clifford, G. and Buonaguro, F. M. (2009) ‘Classification of weakly
carcinogenic human papillomavirus types: Addressing the limits of epidemiology at the
borderline’, Infectious Agents and Cancer, 4(1), p. 8.
Semantic Scholar
https://www.semanticscholar.org/paper/Rethinking-Human-Papillomavirus-Vaccine-for-
Oral-Yu/284f533e2e16c97bd8fe06015bba1af62560e67a (accessed September 20, 2019)
Shambayati, B. (2011) Cytopathology. 1st edn. Oxford University Press p1-25.
Serafïn-Higuera, I. et al. (2016) ‘Differential proteins among normal cervix cells and cervical
cancer cells with HPV-16 infection, through mass spectrometry-based Proteomics in women
from Southern Mexico’, Proteome Science. Proteome Science, 14(1), pp. 1–9.
Shekinah medical
https://shekinahmedical.com/f5/fliers/flierbase.php?title=Colposcopy&graphic=colposcope.jp
g&text=colposcopy (accessed November 21, 2017)
Silverthorn, D. U. Human Physiology: An integrated Approach. 6th edn. Edited by I.
Glenview. Pearson Education. (2013) pp 236-238.
Torre, L. A. et al. (2015) ‘Global Cancer Statistics, 2012’, CA: a cancer journal of clinicians.,
65(2), pp. 87–108.
Troiano, N. W., Ciovacco, W. A. and Kacena, M. A. (2009) ‘The Effects of Fixation and
Dehydration on the Histological Quality of Undecalcified Murine Bone Specimens
Embedded in Methylmethacrylate’, Journal of Histotechnology, 32(1), pp. 27–31.
Ullal, A. Roberts M, Bulmer JN et al. The role of cervical cytology and colposcopy in
detecting cervical glandular neoplasia. Cytopathology, 20(6): pp.359-366
Utzinger.U et al., (2001). “Near-infrared Raman spectroscopy for in vivo detection of
cervical precancers,” Appl. Spectrosc. 55, pp. 955–959.
Walboomers, J. M. M. et al. (1999) ‘Human papillomavirus is a necessary cause of invasive
cervical cancer worldwide’, Journal of Pathology, 189(1), pp. 12–19.
Wong, P. T. et al. (1991) ‘Infrared spectroscopy of exfoliated human cervical cells: evidence
of extensive structural changes during carcinogenesis.’, Proceedings of the National
Academy of Sciences of the United States of America, 88(24), pp. 10988–10992.
Wong, P. T. et al. (2002).’Detailed account of confounding factors in interpretation of FTIR
spectra of exfoliated cervical cells’,Biopolymers, 67: 376-386.
Wong, A. A. et al. (2012) ‘Comparison of the hybrid capture 2 and cobas 4800 tests for
detection of high-risk human papillomavirus in specimens collected in PreserVcyt medium’,
Journal of Clinical Microbiology, 50(1), pp. 25–29.
Wood, B. R. et al. (1998) ‘FTIR Microspectroscopic Study Of Cell Types And Potential
Confounding Variables In Screening For Cervical Malignancies’, Biospectroscopy, 4(2), pp.
75–91.

144
Youssef, M. A. et al. (2016) ‘Prevalence of human papilloma virus (HPV) and its genotypes
in cervical specimens of Egyptian women by linear array HPV genotyping test’, Infectious
Agents and Cancer. Infectious Agents and Cancer, 11(1), pp. 1–10.
Zheng, Z.-M. and Baker, C. C. (2006) ‘Papillomavirus genome structure, expression, and
post-transcriptional regulation.’, Frontiers in bioscience : a journal and virtual library, 11, pp.
2286–302
Zuchna, C. et al. (2010) ‘Diagnostic accuracy of guided cervical biopsies: A prospective
multicenter study comparing the histopathology of simultaneous biopsy and cone specimen’,
American Journal of Obstetrics and Gynecology. Elsevier Inc., 203(4), p. 321-321
8.2 Publications
European Patent – Cervical Sample preparation for reduced variability in Raman
spectra.
Traynor, D. (2019)The potential of biobanked liquid based cytology samples for
cervical cancer screening using Raman spectroscopy- J.
Biophotonics.;12:e201800377.
Traynor, D. (2018) Improved removal of blood contamination from Thinprep
cervical cytology samples for Raman spectroscopic analysis J. Biomed. Opt. 23(5),
055001.
Traynor, D. (2017) A study of variability due to hormonal effects in cervical
smear samples using Raman spectroscopy. J. Biophotonics.;e201700240
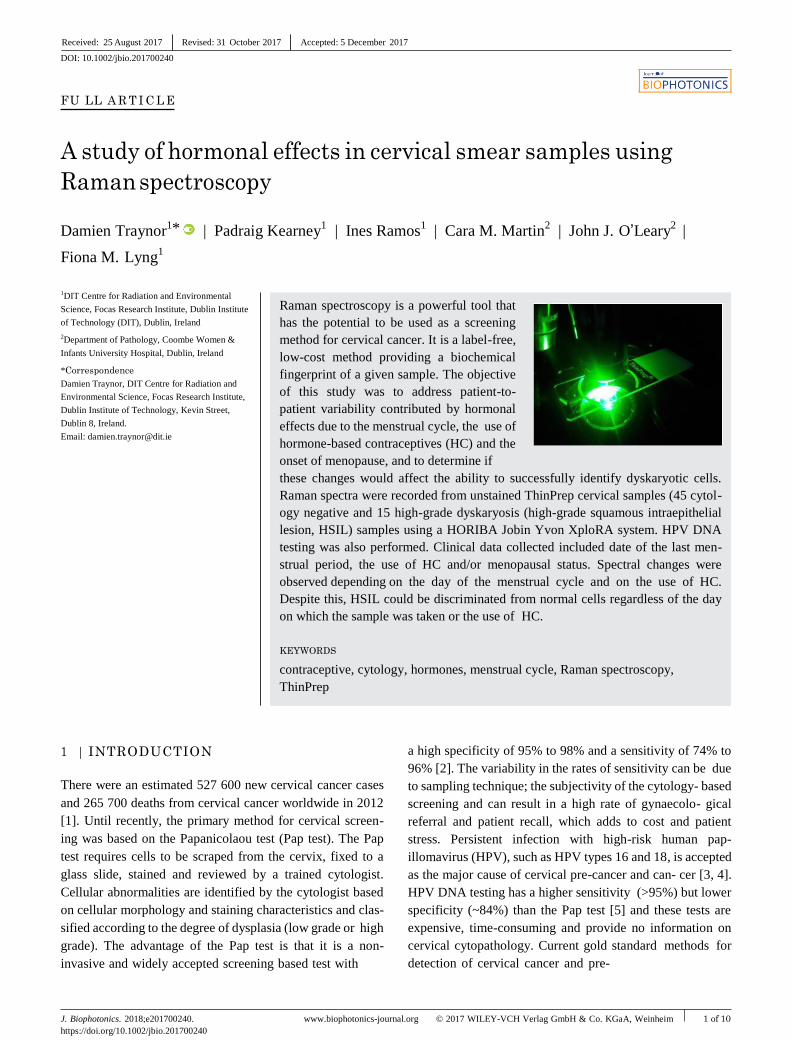
DOI: 10.1002/jbio.201700240
FU LL A R T I C L E
A study of hormonal effects in cervical smear samples using
Raman spectroscopy
Damien Traynor1* | Padraig Kearney
1 | Ines Ramos
1 | Cara M. Martin
2 | John J. O’Leary
2 |
Fiona M. Lyng1
1DIT Centre for Radiation and Environmental
Science, Focas Research Institute, Dublin Institute
of Technology (DIT), Dublin, Ireland
2Department of Pathology, Coombe Women &
Infants University Hospital, Dublin, Ireland
*Correspondence
Damien Traynor, DIT Centre for Radiation and
Environmental Science, Focas Research Institute,
Dublin Institute of Technology, Kevin Street,
Dublin 8, Ireland.
Email: [email protected]
1 | INTRODUCTION
There were an estimated 527 600 new cervical cancer cases
and 265 700 deaths from cervical cancer worldwide in 2012
[1]. Until recently, the primary method for cervical screen-
ing was based on the Papanicolaou test (Pap test). The Pap
test requires cells to be scraped from the cervix, fixed to a
glass slide, stained and reviewed by a trained cytologist.
Cellular abnormalities are identified by the cytologist based
on cellular morphology and staining characteristics and clas-
sified according to the degree of dysplasia (low grade or high
grade). The advantage of the Pap test is that it is a non-
invasive and widely accepted screening based test with
a high specificity of 95% to 98% and a sensitivity of 74% to
96% [2]. The variability in the rates of sensitivity can be due
to sampling technique; the subjectivity of the cytology- based
screening and can result in a high rate of gynaecolo- gical
referral and patient recall, which adds to cost and patient
stress. Persistent infection with high-risk human pap-
illomavirus (HPV), such as HPV types 16 and 18, is accepted
as the major cause of cervical pre-cancer and can- cer [3, 4].
HPV DNA testing has a higher sensitivity (>95%) but lower
specificity (~84%) than the Pap test [5] and these tests are
expensive, time-consuming and provide no information on
cervical cytopathology. Current gold standard methods for
detection of cervical cancer and pre-
J. Biophotonics. 2018;e201700240. www.biophotonics-journal.org © 2017 WILEY-VCH Verlag GmbH & Co. KGaA, Weinheim 1 of 10
https://doi.org/10.1002/jbio.201700240
Received: 25 August 2017 Revised: 31 October 2017 Accepted: 5 December 2017
Raman spectroscopy is a powerful tool that
has the potential to be used as a screening
method for cervical cancer. It is a label-free,
low-cost method providing a biochemical
fingerprint of a given sample. The objective
of this study was to address patient-to-
patient variability contributed by hormonal
effects due to the menstrual cycle, the use of
hormone-based contraceptives (HC) and the
onset of menopause, and to determine if
these changes would affect the ability to successfully identify dyskaryotic cells.
Raman spectra were recorded from unstained ThinPrep cervical samples (45 cytol-
ogy negative and 15 high-grade dyskaryosis (high-grade squamous intraepithelial
lesion, HSIL) samples using a HORIBA Jobin Yvon XploRA system. HPV DNA
testing was also performed. Clinical data collected included date of the last men-
strual period, the use of HC and/or menopausal status. Spectral changes were
observed depending on the day of the menstrual cycle and on the use of HC.
Despite this, HSIL could be discriminated from normal cells regardless of the day
on which the sample was taken or the use of HC.
KEYWORDS
contraceptive, cytology, hormones, menstrual cycle, Raman spectroscopy,
ThinPrep

cancer are, therefore, limited and there is an unmet clinical
need for new objective screening or diagnostic tests. Optical
spectroscopic techniques, such as Raman or infrared spec-
troscopy, are label-free, non-invasive and have several
advantages over traditional approaches, including objectiv-
ity, speed and cost. These methods can provide quantitative
information based on the spectroscopic signature of the bio-
chemical components of the sample allowing diagnosis to be
based on biochemical changes rather than on morpholog- ical
changes. The focus of the present study is on Raman
spectroscopy, which is based on inelastic light scattering. The
coupling of the light generates vibrations within the material
and these vibrations are characteristic of the chemi- cal
structure, the energy of the scattered light is reduced by an
amount equal to the vibrational energy and from this a rapid,
label-free, non-destructive measurement of the com- plete
biochemical fingerprint of a biological sample can be
obtained. Over the past 15 years, the potential of Raman
spectroscopy together with multivariate statistical analysis
has been demonstrated for the detection of a variety of can-
cers, including cervical cancer [6, 7]. In initial infrared spec-
troscopy studies on cervical cytopathology samples [8–10],
spectra were recorded from cell pellets rather than from sin-
gle cells and the presence of metaplastic cells, endocervical
columnar cells, polymorphs, blood, cervical mucus and
debris were all identified as confounding factors [11–16].
Recent studies by Ramos et al. [17] and Bonnier et al. [18]
addressed the variability in Raman spectra from cervical
smear samples and reported a new method to clear blood res-
idue contamination before Raman spectroscopy based on pre-
treatment of the slides with hydrogen peroxide. This method
significantly minimised variability and resulted in the collec-
tion of highly reproducible data and was used in this study to
reduce variability based on the presence of blood residue.
Physiological factors such as hormonal changes during the
menstrual cycle or during menopause may also be potential
sources of variability in the normal cervix.
The cellular make up of an individual woman’s smear is
dependent on which day during the menstrual cycle the
sample was taken [19]. Days 1 to 4 are classed as the men-
struation phase of the cycle when bleeding will occur and
smear samples are generally not taken during this phase.
Days 5 to 13 are classified as the proliferative phase. During
this phase, oestrogen levels reach their peak resulting in
complete maturation of the squamous epithelium and the
cervical smear will present with a higher ratio of superficial
cells to intermediate cells. Days 14 to 28 are classified as the
secretory phase where progesterone production reaches its
peak and prevents complete maturation of the epithelium.
The cervical smear will present with a higher ratio of inter-
mediate cells to superficial cells. During menopause, levels
of both oestrogen and progesterone will drop dramatically
and there is a gradual arrest of the maturation of the squa-
mous epithelium. This results in the loss of superficial and
intermediate cells leading to the final atrophic stage where the
squamous epithelium is composed entirely of parabasal cells.
The use of hormone-based contraceptives (HC) will
affect the natural hormone mediated maturation process of
the cervical epithelium. A study by Romeo et al. [20] used
infrared spectroscopy to investigate hormonal influences on
cervical cells throughout the menstrual cycle and showed
spectral changes such as increases in the 1200 to 1000
cm−1
region due to glycogen increases around ovula- tion
(mid cycle). Cervical cells from women on HC did not show
the same degree of spectral changes as cells from
women not on HC. Despite the variability throughout the
menstrual cycle, principal component analysis (PCA) showed
good discrimination between high-grade dysplasia and
normal samples collected at different phases of the menstrual
cycle.
A more recent study by Kanter et al. [21] has shown that
hormonal differences due to the menstrual cycle can
influence the Raman spectra acquired from the cervix in
vivo. Spectra were divided into 4 groups, namely, pre-
menopausal proliferative phase (days 1-14), pre-menopausal
secretory phase (day 15-28+), peri-menopausal and post-
menopausal. Spectral differences were mainly observed at
1250, 1300 and 1320 cm−1
, most likely due to changes in
the proteins collagen and elastin [22]. Incorporating hor-
monal status into their dysplasia classification algorithm
increased the classification accuracy from 88% to 94%.
The main objective of our study was to investigate
hormone-associated changes in the Raman spectra of cyto-
logically negative ThinPrep cervical smear samples related
to: (1) the menstrual cycle, (2) the onset of menopause and
(3) the use of HC. A further objective was to determine if any
changes observed would interfere with the ability to
discriminate normal and high-grade dyskaryotic (high-grade
squamous intraepithelial lesion, HSIL) cervical smear sam-
ples caused by HPV infection.
2 | MATERIALS AND METHODS
2.1 | Sample collection and ThinPrep slide
preparation
Cervical smear samples collected in PreservCyt solution were
obtained from the Cytology Department at the Coombe
Women and Infants University Hospital (CWIUH), Dublin,
Ireland, after routine cytological screening had been
performed. Ethical approval for use of anonymised samples
for the study was granted by the CWIUH Research Ethics
Committee (no. 28-2014). Clinical data which were recorded
relating to the samples included cytology result, date of last
menstrual period, age at time of smear test and reported use
of HC. No information on smoking status was available. A
total of 60 cervical smear samples,
2 of 10
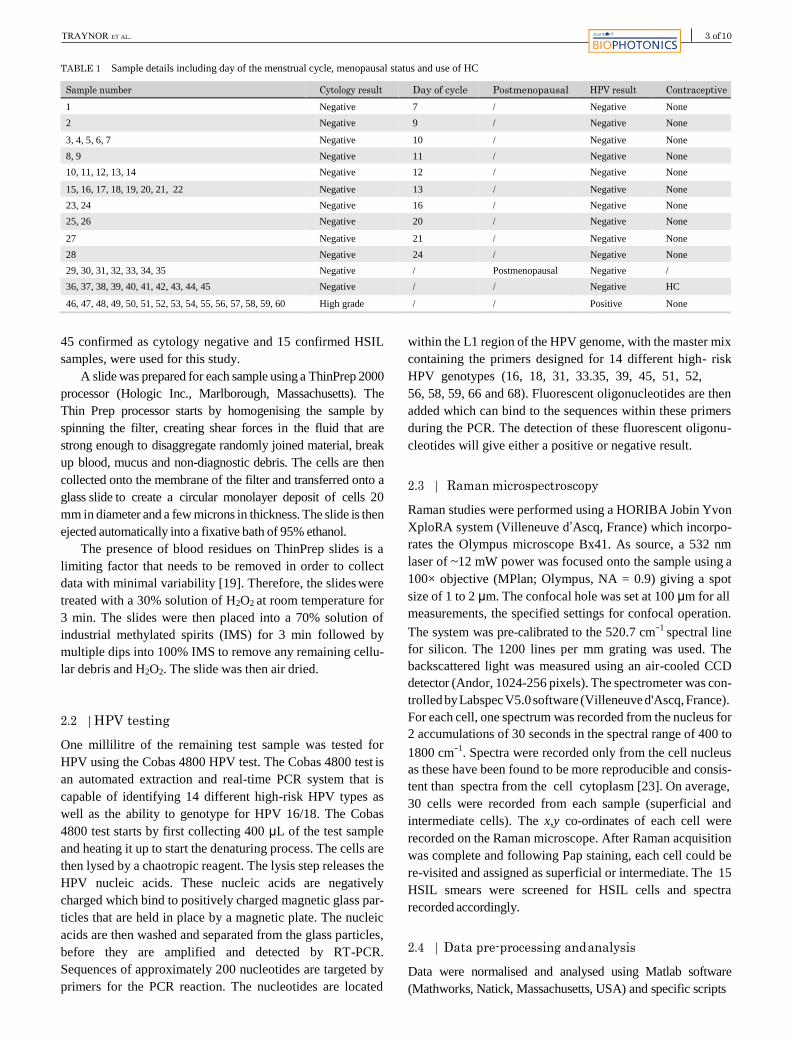
TABLE 1 Sample details including day of the menstrual cycle, menopausal status and use of HC
Sample number Cytology result Day of cycle Postmenopausal HPV result Contraceptive
1 Negative 7 / Negative None
2 Negative 9 / Negative None
3, 4, 5, 6, 7 Negative 10 / Negative None
8, 9 Negative 11 / Negative None
10, 11, 12, 13, 14 Negative 12 / Negative None
15, 16, 17, 18, 19, 20, 21, 22 Negative 13 / Negative None
23, 24 Negative 16 / Negative None
25, 26 Negative 20 / Negative None
27 Negative 21 / Negative None
28 Negative 24 / Negative None
29, 30, 31, 32, 33, 34, 35 Negative / Postmenopausal Negative /
36, 37, 38, 39, 40, 41, 42, 43, 44, 45 Negative / / Negative HC
46, 47, 48, 49, 50, 51, 52, 53, 54, 55, 56, 57, 58, 59, 60 High grade / / Positive None
45 confirmed as cytology negative and 15 confirmed HSIL
samples, were used for this study.
A slide was prepared for each sample using a ThinPrep 2000
processor (Hologic Inc., Marlborough, Massachusetts). The
Thin Prep processor starts by homogenising the sample by
spinning the filter, creating shear forces in the fluid that are
strong enough to disaggregate randomly joined material, break
up blood, mucus and non-diagnostic debris. The cells are then
collected onto the membrane of the filter and transferred onto a
glass slide to create a circular monolayer deposit of cells 20
mm in diameter and a few microns in thickness. The slide is then
ejected automatically into a fixative bath of 95% ethanol.
The presence of blood residues on ThinPrep slides is a
limiting factor that needs to be removed in order to collect
data with minimal variability [19]. Therefore, the slides were
treated with a 30% solution of H2O2 at room temperature for
3 min. The slides were then placed into a 70% solution of
industrial methylated spirits (IMS) for 3 min followed by
multiple dips into 100% IMS to remove any remaining cellu-
lar debris and H2O2. The slide was then air dried.
2.2 | HPV testing
One millilitre of the remaining test sample was tested for
HPV using the Cobas 4800 HPV test. The Cobas 4800 test is
an automated extraction and real-time PCR system that is
capable of identifying 14 different high-risk HPV types as
well as the ability to genotype for HPV 16/18. The Cobas
4800 test starts by first collecting 400 μL of the test sample
and heating it up to start the denaturing process. The cells are
then lysed by a chaotropic reagent. The lysis step releases the
HPV nucleic acids. These nucleic acids are negatively
charged which bind to positively charged magnetic glass par-
ticles that are held in place by a magnetic plate. The nucleic
acids are then washed and separated from the glass particles,
before they are amplified and detected by RT-PCR.
Sequences of approximately 200 nucleotides are targeted by
primers for the PCR reaction. The nucleotides are located
within the L1 region of the HPV genome, with the master mix
containing the primers designed for 14 different high- risk
HPV genotypes (16, 18, 31, 33.35, 39, 45, 51, 52,
56, 58, 59, 66 and 68). Fluorescent oligonucleotides are then
added which can bind to the sequences within these primers
during the PCR. The detection of these fluorescent oligonu-
cleotides will give either a positive or negative result.
2.3 | Raman microspectroscopy
Raman studies were performed using a HORIBA Jobin Yvon
XploRA system (Villeneuve d’Ascq, France) which incorpo-
rates the Olympus microscope Bx41. As source, a 532 nm
laser of ~12 mW power was focused onto the sample using a
100× objective (MPlan; Olympus, NA = 0.9) giving a spot
size of 1 to 2 μm. The confocal hole was set at 100 μm for all
measurements, the specified settings for confocal operation.
The system was pre-calibrated to the 520.7 cm−1
spectral line
for silicon. The 1200 lines per mm grating was used. The
backscattered light was measured using an air-cooled CCD
detector (Andor, 1024-256 pixels). The spectrometer was con-
trolled by Labspec V5.0 software (Villeneuve d'Ascq, France).
For each cell, one spectrum was recorded from the nucleus for
2 accumulations of 30 seconds in the spectral range of 400 to
1800 cm−1
. Spectra were recorded only from the cell nucleus
as these have been found to be more reproducible and consis-
tent than spectra from the cell cytoplasm [23]. On average,
30 cells were recorded from each sample (superficial and
intermediate cells). The x,y co-ordinates of each cell were
recorded on the Raman microscope. After Raman acquisition
was complete and following Pap staining, each cell could be
re-visited and assigned as superficial or intermediate. The 15
HSIL smears were screened for HSIL cells and spectra
recorded accordingly.
2.4 | Data pre-processing and analysis
Data were normalised and analysed using Matlab software
(Mathworks, Natick, Massachusetts, USA) and specific scripts
3 of 10

FIGURE 1 (A) Proliferative phase presentation of a Pap smear. Note the higher ratio of superficial (pink stained) to intermediate (blue stained) cells,
(B) secretory phase presentation of a Pap smear. Note the higher ratio of intermediate (blue stained) to superficial (pink stained) cells, (C) postmenopausal
presentation of a Pap smear. Note the lack of cellular material, mucus and cellular debris. Bar = 35 μm
developed and adapted for uploading of the spectra and their
pre-processing, including smoothing (Savitzky-Golay K = 5, K
= 13), baseline correction (rubberband) and vector normali-
sation. An in house method for glass removal based on non-
negativity constrained least squares was used to remove the
spectral features of glass [23]. The algorithm weights the
values of glass as well as cell components in the acquired
spectra from the cell and further subtracts the glass from the cell
spectra applying non-negative constraints.
Classification methods find mathematical models that are
able to recognise the membership of each sample to its
appropriate class on the basis of a set of measurements.
FIGURE 2 (A) Mean Raman spectra of intermediate and superficial cells from days 7 to 24. Shading denotes the SD, (B) LV scores scatter plot of
proliferative phase, days 7 to 14 (blue) vs secretory phase, days 15 to 24 (red), (C) LV1 loadings, (D) PLS-DA prediction plot
4 of 10

TABLE 2 Tentative peak assignments [22]
Raman shift (cm−1) Proteins Lipids Carbohydrates Nucleic acids
482 Glycogen
577 Glycogen
622 C─C twist Phe
643 C─C twist Tyr
727 CH2 def C─C head A
752 Sym br. Trp
781 U,C,T ring br
826 Out of plane ring br. Tyr PO2 a.Str
851 Ring br. Tyr, C─C str. Pro
852 Glycogen
937 Glycogen
985 C─C head
1002 Sym. Ring br. Phe
1033 C─H in plane Phe, C─C str
1044 Glycogen
1060 C─N str
1082 C─N str Chain C─C str C─O str, glycogen
1096 Chain C─C str C─C str
1106 Glycogen
1123 C─N str Chain C─C str C─O str
1152 C─N str
1207 C─C6H5 str. Phe, Trp
1238 C─N str, amide III
1261 Glycogen
1334 Glycogen
1338 Trp G
1366 Sym. Str. CH3
1381 Glycogen
1450 CH2 def CH2 def
1458 Glycogen
1487 CH2 def G,A
1560 Tyr, Trp
1575 A,G ring br
1584 C─C str, C─C bend. Trp, Phe
1605 C─C Phe, Tyr
1642 C─O str, C─C sym. Str.
1669 C─O str. Amide I
When the classification model has been calibrated, the mem-
bership of unknown samples to one of the defined classes
can be predicted. Although PCA-LDA is the standard
method used to maximise the variations in the X direction,
PLS-DA by rotating both the X and Y axes allows even small
variations to be captured. This was necessary to identify the
normal biochemical changes associated with the menstrual
cycle. Partial least squares discriminant analysis (PLS-DA)
was used to build classification models in this study together
with leave-one patient-out cross-validation. PLS-DA analysis
was performed using the PLS toolbox (Eigenvector Research,
Washington, USA) in the Matlab (Mathworks Inc.) environment.
From the data provided by the patient about their last
menstrual period and the day on which the sample was taken,
the day of the menstrual cycle the smear was taken was
calculated. It was assumed that each patient follows the stan-
dard 28 -day cycle. Samples were only available from days 7
to 24 of the cycle. Table 1 shows the sample details includ-
ing day of the menstrual cycle, menopausal status and use
of HC.
3 | RESULTS AND DISCUSSION
3.1 | Proliferative and secretory phase and
postmenopausal cellular presentation on pap smear
The proliferative and secretory phase presentation of a Pap
smear are shown in Figure 1A,B, respectively. A higher ratio
of superficial (pink stained) to intermediate (blue
5 of 10

FIGURE 3 (A) Mean Raman spectra from postmenopausal samples. Shading denotes the SD, (B) LV scatter scores plot of postmenopausal (blue) and non-
menopausal (red), (C) LV1 loadings, (D) PLS-DA prediction plot
stained) cells in the proliferative phase compared to a higher
ratio of intermediate (blue stained) to superficial (pink
stained) cells in secretory phase can be observed. A post-
menopausal Pap smear is shown in Figure 1C. A lack of
cellular material, mucus and cellular debris can be observed
which caused difficulties in recording good quality spectra.
3.2 | Raman signature of proliferative phase vs
secretory phase
The spectral data from the Pap smears were divided up accord-
ing to the day of the menstrual cycle the sample was taken on. -
Figure 2A shows the mean Raman spectra of cells from days 7
to 24 of the menstrual cycle. Increases in the Amide I (1640-
1650 cm−1
) (see Table 2), Phenylalanine and Tyrosine (1605-
1610 cm−1
) and glycogen (480 cm−1
) bands over time were
observed. The latent variables (LV) scores scatter plot (Figure
2B) shows reasonable separation between the prolifera- tive
phase (blue) and the secretory phase (red). Some overlap- ping is
observed which is most likely due to the fact that each woman
will differ slightly between the days of the menstrual cycle and
the levels of oestrogen and progesterone present. The LV1
loadings shown in Figure 2C highlight areas similar to
those highlighted in the mean Raman spectra (Figure 2A). The
discrimination is mainly based on glycogen (480, 937, 1381 and
1458 cm−1
) that is more present in the secretory samples (red) due
to the higher levels of progesterone, which promotes sub-
nuclear glycogen accumulation [24], and proteins (CH2 def, 1450
cm−1
) and Amide I (1669 cm−1
) which are higher in sam- ples
collected from the proliferative phase of the cycle. The pre-
diction plot from the PLS-DA model (Figure 2D) shows
reasonably good classification of menstrual cycle phase (prolif-
erative phase or secretory phase) with sensitivity of 83% and
specificity of 86%.
3.3 | Raman signature of postmenopausal samples
Most women are generally screened for cervical cancer up
until the age of 65 years. Between the ages of 48 and 55
years, most women are said to be menopausal. Hence, it is
important to determine if Pap smears collected from post-
menopausal women will have a similar Raman signature to
non-postmenopausal women. Mucus and cellular debris pre-
sent on postmenopausal samples obscure the little cellular
material that is present on the slide and make it very diffi- cult
to obtain good spectra, hence the number of spectra
6 of 10

FIGURE 4 (A) Mean Raman spectra from HC positive and HC negative cells. Shading denotes the SD, (B) LV scatter scores plot of HC negative (blue)
and HC positive (red), (C) LV1 loadings, (D) PLS-DA prediction plot
recorded is severely reduced and it is difficult to draw any
firm conclusions. Figure 3A shows the mean and SD spec-
tra of the 22 postmenopausal cells recorded. Figure 3B shows
good discrimination between the 2 sample types. The
loadings shown in Figure 3C show that the discrimination is
based on glycogen (852, 1106 and 1138 cm−1
) and nucleic
acids (781 cm−1
) proteins (1450 cm−1
) and Amide I (1669
cm−1
). Figure 3D shows the PLS-DA prediction plot which
has a sensitivity of 100% and specificity of 95%.
Atrophic samples were not available as part of this study.
No firm conclusions can be drawn from this data set except
that postmenopausal samples can represent a problem for
Raman-based screening based on their Pap smear presentation
due to mucus, cellular debris and lack of cellular material.
3.4 | Raman signature associated with women on HC
The clinical details obtained indicated if the patient was on
some form of HC. However, information on which type of
contraceptive they are currently on was not included. The aim
of this part of the study was to determine if Pap smears
collected from women on HC will have a similar Raman
signature to women who are not on HC.
Figure 4A shows that the levels of glycogen (482 and
855-939 cm−1
) in the HC-positive samples are lower when
compared to the controls. The controls were made up of the
samples collected throughout the menstrual cycle which were
HC-negative. Tryptophan and Phenylalanine at peak position
(1584-1605 cm−1
) and Amide I at peak (1669 cm−1
) are
higher in HC samples compared to the control. The lower
levels of glycogen in the HC samples could be linked to lower
levels of progesterone due to its role in promoting sub-
nuclear glycogen accumulation [24]. The same could be said
for the higher levels of proteins detected (Phenylalanine,
Tryptophan and Amide I). There is also a consistent change
in the shoulder of Amide I, which is a change in Amide I
protein position and folding between HC-positive and HC-
negative samples. Overall, protein
7 of 10

FIGURE 5 (A) Pap stained HSIL cells. Bar = 35 μm, (B) mean Raman spectra from negative samples from days 7 to 21 of the menstrual cycle (red) and
spectra from HSIL samples (blue). Shading denotes the SD, (C) LV scores scatter plot of HSIL samples (red) and negative samples (blue), (D) LV1
loadings, (E) PLS-DA prediction plot
synthesis may be increased due to the constant level of hor-
mones present.
The LV scores scatter plot (Figure 4B) shows good sepa-
ration between HC-positive and HC-negative samples. There
is a small amount of overlapping which could be due to a
number of factors. Multiple types of contraceptive are avail-
able, which contain different types and levels of hormones,
including implants, injectable contraceptive, progesterone
pills, oestrogen and progesterone pills, combined oral and the
patch all of which work by maintaining a constant level of
hormones in the body thus preventing the rise and fall of
oestrogen and progesterone. Hence, they may work differ-
ently and individual patients will also respond differently to
the levels of hormones present. The loadings (Figure 4C)
from LV1 show that glycogen (483 and 1386 cm−1
) and pro-
teins and lipids (1146, 1450 and 1566 cm−1
) and Amide I
(1669 cm−1
) are the main discriminating factors between HC-
positive and HC-negative samples (Figure 4D). The PLS-DA
prediction plot shows excellent classification with a
sensitivity of 100% and specificity of 100%.
3.5 | Phase of menstrual cycle vs HSIL
It is important to determine if the changes observed
throughout the menstrual cycle as seen in Figure 4 would
affect the ability of Raman spectroscopy to discriminate
HSIL from normal cells affected by the normal maturation of
the cervical epithelium controlled by both the rise and fall
of progesterone and oestrogen. For this part of the study,
spectra from HSIL cells (Figure 5A) were recorded from 15
HPV-positive, HSIL samples and compared to an equivalent
number of spectra from negative samples from days 7 to 21
of the menstrual cycle, all of which were HPV-negative.
Figure 5B shows the mean spectra from neg- ative samples
from days 7 to 21 of the menstrual cycle and spectra recorded
from HSIL cells. The LV scores scatterplot in Figure 5C
shows that HSIL cells separate well from nor- mal cells on
the first LV. This shows that regardless of when a sample is
taken during day 7 to 21 of the menstrual cycle, HSIL cells
can still be effectively discriminated from cytology negative
cells using Raman spectroscopy. Spectral changes due to the
hormonal influence of oestrogen and progesterone seem to
be less than the spectral changes due to the biochemical
changes in the dyskaryotic cells. The loadings from LV1
in Figure 5D show that glycogen
(495, 1080, 1120, 1380 and 1458 cm−1
), nucleic acids
(780 and 1487 cm−1
), Amide III and Amide I proteins (1239
and 1669 cm−1
, respectively) and tryptophan and
phenylalanine (1605 cm−1
) mainly contribute towards the
discrimination between normal and HSIL cells. As the HSIL
cells are a result of a high risk HPV infection, the
8 of 10

FIGURE 6 (A) Mean Raman spectra from negative HC positive samples (red) and spectra from HSIL cells (blue). Shading denotes the SD, (B) LV scores
scatter plot of HSIL samples (red) and negative HC positive samples (blue), (C) LV1 loadings, (D) PLS-DA prediction plot
biochemical difference in glycogen, proteins and nucleic
acids can be attributed to the downstream effects of the HPV
infection. The predictions plot (Figure 5E) from the PLS-DA
model shows excellent classification of the nega- tive
samples (all menstrual cycle phases) and the dyskaryo- tic
samples with sensitivity of 98% and a specificity of 97%.
3.6 | HC-positive samples vs HSIL
It is important to determine if the use of HC will also affect
the ability of Raman spectroscopy to discriminate normal
HC-positive cells from HSIL cells. Figure 6A shows the
mean Raman spectra of HC-positive and HC-negative sam-
ples and spectra from HSIL cells. The LV scores scatterplot
in Figure 6B shows that spectra from HC-positive samples
separate from spectra from HSIL cells from HSIL samples on
the first LV component with minimal overlap. Figure 6C
shows the LV1 loadings which indicate that the main differ-
ences between the HC-positive cells and HSIL cells are very
similar to those found for the HC negative and HSIL sam-
ples. Glycogen (482, 1261 and 1381 cm−1
), nucleic acids
(781 cm−1
) and proteins (1450, 1560 and 1669 cm−1
) again
contribute towards the discrimination. As before, it appears
that the overtaking of the host cell machinery by HPV causes
more of a biochemical change within the cell than the
biochemical changes associated with the use of HC. The
predictions plot from the PLS-DA model shows excellent
classification of the negative samples (HC-positive) and the
HSIL cells from HSIL samples (Figure 6D) with sensitivity
of 96% and specificity of 98%.
Kanter et al. [22] showed that hormonal status influences
Raman spectra from the cervix in vivo and that incorporating
hormonal status into their classification algorithm increased
the accuracy from 88% to 94%. However, the present study
and that of Romeo et al. [20] on exfoliated cervical cells
showed good discrimination between normal and abnormal
samples regardless of phase of the menstrual cycle and of
whether the woman was taking oral contraceptives or not.
4 | CONCLUSION
This study has shown that the day a Pap smear is taken dur-
ing days 7 to 21 of the menstrual cycle will have an effect
9 of 10
on the spectra with regard to the level of glycogen and pro-
teins. It should be noted, however, that this study assumes
that each patient recruited follows the standard 28-day cycle,
and that the patient details recorded for each sample were
correct. It is possible for women have a longer or shorter
cycle, hence this variation may have influenced our analysis.
Postmenopausal samples represent a problem for Raman
based screening due to their lack of cellular material and
presence of cellular debris and mucus. The use of HC causes
the most variability. Furthermore, study would be required to
determine which hormone is causing the dis- crimination
between HC-positive and HC-negative samples. These
findings suggest that the use of oral contraceptives and the
day on which the Pap smear was taken during the menstrual
cycle should be incorporated into the data analy- sis to reduce
variability between patient samples.
Despite this, however, the variability between days of the
menstrual cycle or use of HC did not hinder the ability of
Raman spectroscopy to discriminate cytology negative cells
from HSIL cells. The biochemical changes induced in HSIL
cells due to an active HPV infection were more pronounced
than the biochemical changes due to the menstrual cycle or
the use of HC. It is acknowledged that the study is limited in
focussing only on HSIL samples and a further study would
be required to include low-grade samples. In conclusion, this
study highlights the scope of Raman spectroscopy for cervi-
cal screening despite the presence of biochemical changes
associated with the menstrual cycle and the use of HC.
ACKNOWLEDGMENTS
This research was undertaken as part of CERVIVA, the Irish
Cervical Screening Research Consortium and we gratefully
acknowledge funding from the Health Research Board Collabo-
rative Applied Research Grant, CARG2012/29, and Enterprise
Ireland co-funded by the European Regional Development Fund
(ERDF) and Ireland’s EU Structural Funds Programme 2007 to
2013, CF2011 1045. We thank the Cytology staff at the
Coombe Women and Infants University Hospital, Dublin, for
facilitating the study and technical support staff at the FOCAS
Research Institute, Dublin Institute of Technology.
CONFLICT OF INTEREST
There are no conflicts of interest.
ORCID
Damien Traynor http://orcid.org/0000-0001-6531-6653
REFERENCES
[1] L. A. Torre, F. Bray, R. L. Siegel, J. Ferlay, J. Lortet-tieulent, A. Jemal,
CA Cancer J. Clin. 2015, 65, 87.
[2] H. C. Kitchener, R. Blanks, H. Cubie, M. Desai, G. Dunn, R. Legood,
S. Moss, Health Technol. Assess. 2011, 15(3). p. 6–12.
[3] J. M. Walboomers, M. V. Jacobs, M. Manos, F. X. Bosch, J. A. Kummer,
K. V. Shah, P. J. Snijders, J. Peto, C. J. Meijer, N. Munoz, J. Pathol.
1999, 189, 12.
[4] G. Ronco, P. Giorgi-Rossi, F. Carozzi, M. Confortini, P. Dalla Palma,
A. Del Mistro, Lancet Oncol. 2010, 11, 249.
[5] J. Cuzick, L. Cadman, D. Mesher, J. Austin, L. Ashdown-Barr, L. Ho, Br.
J. Cancer 2013, 108, 908.
[6] M. Diem, A. Mazur, K. Lenau, J. Schubert, B. Bird, M. Miljković,
C. Krafft, J. Popp, J. Biophotonics 2013, 6(11–12), 855.
[7] F. Lyng, I. Ramos, O. Ibrahim, H. Byrne, Appl. Sci. 2015, 5(1), 23.
[8] J. L. González-Solís, J. C. Martínez-Espinosa, L. A. Torres-González,
A. Aguilar-Lemarroy, L. F. Jave-Suárez, P. Palomares-Anda, Lasers Med.
Sci. 2014, 29, 979.
[9] S. A. Sánchez-Rojo, B. E. Martínez-Zérega, E. F. Velázquez-Pedroza,
J. C. Martínez-Espinosa, L. A. Torres-González, A. Aguilar-Lemarroy,
L. F. Jave-Suárez, P. Palomares-Anda, J. L. González-Solís, Rev. Mex. Fis.
2016, 62, 213.
[10] P. T. Wong, R. K. Wong, T. A. Caputo, T. A. Godwin, B. Rigas, Proc.
Natl. Acad. Sci. USA 1991, 1991, 88, 10988.
[11] P.T.T. Wong, M.K. Senterman, P. Jackli, R.K. Wong, S. Salib, C.
E. Campbell, R. Feigel, ,W. Faught, M. Fung, Kee Fung. (2002) Biopoly-
mers, 67: 376–386 (2002).
[12] L. Chiriboga, P. Xie, V. Vigorita, D. Zarou, D. Zakim, M. Diem, Biospec-
troscopy 1998, 4, 55.
[13] M. A. Cohenford, T. A. Godwin, F. Cahn, P. Bhandare, T. A. Caputo,
B. Rigas, Oncologia 1997, 66, 59.
[14] M. Diem, L. Chiriboga, P. Lasch, A. Pacifico, Biopolymers 2002, 67, 349.
[15] M. J. Romeo, M. A. Quinn, F. R. Burden, D. McNaughton, Biopolymers
2002, 67, 362.
[16] B. R. Wood, M. A. Quinn, B. Tait, M. Ashdown, T. Hislop, M. Romeo,
D. McNaughton, Biospectroscopy 1998, 4, 75.
[17] I. R. Ramos, A. D. Meade, O. Ibrahim, H. J. Byrne, M. McMenamin,
M. McKenna, A. Malkin, F. M. Lyng, Faraday Discuss. 2016, 187, 187.
[18] F. Bonnier, D. Traynor, P. Kearney, C. Clarke, P. Knief, C. Martin,
F. Lyng, Anal. Methods 2014, 00, 1.
[19] S. Rozenberg, Eur. J. Obstet. Gynecol. Reprod. Biol. 2001, 94(1), 86.
[20] M. Romeo, M. J. Romeo, B. R. Wood, Vib. Spectrosc. 2002, 28, 167.
[21] E. M. Kanter, S. Majumder, G. J. Kanter, E. M. Woest,
A. Mahadevan-Jasen, Arn. J. Obstet. Gynecol. 2009, 200(5), 1.
[22] Z. Movasaghi, S. Rehman, I. Rehman, Appl. Spectrosc. 2007, 42(5), 493.
[23] P. Kearney, D. Traynor, F. Bonnier, F. Lyng, J. O’Leary, C. Martin, J.
Biomed. Opt. 2017, 22(10), 105008. https://doi.org/10.1117/1.JBO.22.
10.105008.
[24] A. Nair, H. Taylor, Amenorrhea. A Case Based, Clinical Guide (Genevieve
Neal-Perry). Contemporary Endocrinology, Springer Science+ Business
Media, New York, 2010, p. 23.
10 of 10
How to cite this article: Traynor D, Kearney P,
Ramos I, Martin CM, O’Leary JJ, Lyng FM. A study
of hormonal effects in cervical smear samples using
Raman spectroscopy. J. Biophotonics. 2018;
e201700240. https://doi.org/10.1002/jbio.201700240

Downloaded From: https://www.spiedigitallibrary.org/journals/Journal-of-Biomedical-Optics on 19 Oct 2019 Terms of Use: https://www.spiedigitallibrary.org/terms-of-use
Improved removal of blood contamination from ThinPrep cervical cytology samples for Raman spectroscopic analysis
Damien Traynor Shiyamala Duraipandian Cara M. Martin John J. O’Leary Fiona M. Lyng
Damien Traynor, Shiyamala Duraipandian, Cara M. Martin, John J. O’Leary, Fiona M. Lyng, “Improved removal of blood contamination from ThinPrep cervical cytology samples for Raman spectroscopic analysis,” J. Biomed. Opt. 23(5), 055001 (2018), doi: 10.1117/1.JBO.23.5.055001.

Journal of Biomedical Optics 055001-1 May 2018 • Vol. 23(5)
Downloaded From: https://www.spiedigitallibrary.org/journals/Journal-of-Biomedical-Optics on 19 Oct 2019 Terms of Use: https://www.spiedigitallibrary.org/terms-of-use
Journal of Biomedical Optics 23(5), 055001 (May 2018)
Improved removal of blood contamination from ThinPrep cervical cytology samples for Raman spectroscopic analysis
Damien Traynor,a,* Shiyamala Duraipandian,a Cara M. Martin,b John J. O’Leary,b and Fiona M. Lynga
aDublin Institute of Technology (DIT), Focas Research Institute, DIT Centre for Radiation and Environmental Science, Dublin, Ireland bCoombe Women and Infants University Hospital, Department of Pathology, Dublin, Ireland
Abstract. There is an unmet need for methods to help in the early detection of cervical precancer. Optical spec-
troscopy-based techniques, such as Raman spectroscopy, have shown great potential for diagnosis of different
cancers, including cervical cancer. However, relatively few studies have been carried out on liquid-based cytol-
ogy (LBC) pap test specimens and confounding factors, such as blood contamination, have been identified.
Previous work reported a method to remove blood contamination before Raman spectroscopy by pretreatment
of the slides with hydrogen peroxide. The aim of the present study was to extend this work to excessively bloody
samples to see if these could be rendered suitable for Raman spectroscopy. LBC ThinPrep specimens were
treated by adding hydrogen peroxide directly to the vial before slide preparation. Good quality Raman spectra
were recorded from negative and high grade (HG) cytology samples with no blood contamination and with heavy
blood contamination. Good classification between negative and HG cytology could be achieved for samples with
no blood contamination (sensitivity 92%, specificity 93%) and heavy blood contamination (sensitivity 89%, speci-
ficity 88%) with poorer classification when samples were combined (sensitivity 82%, specificity 87%). This study
demonstrates for the first time the improved potential of Raman spectroscopy for analysis of ThinPrep spec-
imens regardless of blood contamination. © 2018 Society of Photo-Optical Instrumentation Engineers (SPIE) [DOI: 10.1117/1.JBO
.23.5.055001]
Keywords: Raman spectroscopy; cytology; ThinPrep; cervical precancer; cervical cancer; blood; blood removal.
Paper 170815R received Dec. 19, 2017; accepted for publication Apr. 16, 2018; published online May 4, 2018.
1 Introduction
Cervical cancer is the fourth most common cancer in women
worldwide with an estimated 528,000 cases and 266,000 deaths
in 2012.1 The link between cervical cancer and high risk human
papilloma virus (HPV) infection and the molecular control of
the cell cycle is firmly established.2 The presence of an HPV
infection does not automatically mean the development of
cervical cancer or precancer [cervical intraepithelial neoplasia
(CIN)]. However, the HPV virus can integrate its viral DNA
into the host cell’s DNA located in the cell’s nucleus. This inte-
gration disrupts the host cell’s control of cell growth and rep-
lication and can lead to malignant transformation.3 The most
common method for cervical screening is based on the papani-
colaou test (pap test), which is designed to screen for signs of
precancer and cancer of the cervix. The pap test requires cells to
be scraped from the cervix, fixed to a glass slide, stained, and
reviewed by a trained cytologist. Cellular abnormalities are
identified based on cellular morphology and staining character-
istics and classified according to the degree of dysplasia. The
ThinPrep liquid-based cytology (LBC) method involves the
patient’s cells being transferred into a specimen vial containing
PreservCyt transport medium. PreservCyt is an alcohol-based
solution that preserves cell morphology and breaks down
biological components, such as mucin and blood. The normal
smear pattern is made up of epithelial and nonepithelial compo-
nents [Fig. 1(a)]. The epithelial cell components include para-
basal cells, intermediate cells, superficial cells, endocervical
and endometrial cells. Nonepithelial cell components include
red blood cells, lymphocytes, histiocytes, polymorphs, mucus,
and bacteria. Red blood cells are 7 to 8 μm in size and stain red
or pink with the pap stain. They are often found in cervical
samples, either due to menstruation or inflammation and their
presence can also be used as an indicator of disease (precancer).4
A patient’s cervix with a high-grade (HG) lesion will often bleed
on contact with the cervical brush and, as a result, the smear
becomes contaminated with blood. The presence of blood in the
sample will often dilute diagnostic cells, cover and surround cell
groups, increase screening time, and make microscopic
interpretation difficult [Fig. 1(b)]. PreservCyt contains a lysis
agent for mucus and red blood cells but excessive blood in the
sample vial will prevent a satisfactory smear being produced.
High volumes of red blood cells will prevent the collection of
epithelial cells onto the polycarbonate filter membrane during
processing resulting in a ringed halo effect with red blood cells
deposited mostly around the edges of the smear with very few
epithelial cells present [Fig. 1(c)].
Cytology laboratories often annotate pap smears according to
a blood scale index, where 0 indicates no visible evidence of
blood present and 3 indicates an extremely bloody sample (Fig.
2). Samples presenting as a 2 or 3 on the blood scale are
*Address all correspondence to: Damien Traynor, E-mail: Damien.traynor@dit
.ie 1083-3668/2018/$25.00 © 2018 SPIE

Journal of Biomedical Optics 055001-2 May 2018 • Vol. 23(5)
Downloaded From: https://www.spiedigitallibrary.org/journals/Journal-of-Biomedical-Optics on 19 Oct 2019 Terms of Use: https://www.spiedigitallibrary.org/terms-of-use
Traynor et al.: Improved removal of blood contamination from ThinPrep cervical cytology samples for Raman spectroscopic analysis
Fig. 1 (a) Pap smear after staining. Note the presence of intermediate (blue), superficial (pink) cells, and lymphocytes (indicated by arrows), (b) bloody smear pattern with red blood cells, obscuring diagnostic
cells. Bar ¼ 35 μm. (c) Pap smear contaminated with blood showing ringed halo effect.
often either rejected as being unsatisfactory or treated with a
wash solution to lyse more of the red blood cells to increase the
number of epithelial cells present on the slide. This blood scale
grading is subjective and is only based on a visual appear- ance
of a sample. The advantage of the pap test is that it is a
noninvasive and widely accepted screening-based test. How-
ever, despite a high specificity of 96.5%, a lower sensitivity of
85% can be due to sampling, technical and interobserver errors
associated with the subjectivity of the test.4 Over the past 20
years, Raman spectroscopy has shown potential for the
diagnosis of cervical cancer both in vivo and ex vivo.5–12 Raman
spectroscopy is based on inelastic light scattering in which a
sample is illuminated by monochromatic laser light and inter-
actions between the incident photons and molecules in the sam-
ple result in the scattering of the light. The coupling of the light
generates vibrations within the sample, which are characteristic
of the chemical structure. The energy of the scattered light is
reduced by an amount equal to the vibrational energy, which is
called the Raman shift. This means that the position, peaks, and
shape of the Raman bands carry information about the molecu-
lar makeup of the sample. The Raman spectrum of cells and
tissues is made up of contributions from many biochemical com-
ponents, including DNA, RNA, proteins, lipids, and carbohy-
drates.12 To date, most likely due to confounding factors, such
as blood contamination, there have been relatively few studies
Fig. 2 ThinPrep vials graded according to the blood scale index,
where 0 indicates no visible evidence of blood and 3 indicates an
extremely bloody sample.
on Raman spectroscopy of cervical smear samples.13–19 Rubina
et al.16 described the influence of blood on the Raman spectra of cervical cell pellets and how this might lead to false interpreta-
tions. Classification efficiency of 86% and 84% was reported for
normal and abnormal samples, respectively, and this decreased
to 78% and 79% after samples were treated with red blood cell
lysis buffer to reduce blood contamination. A previous study by
our group17 addressed many of the issues involved in recording
Raman spectra from LBC (ThinPrep) samples and described a
method to remove blood contamination before Raman spectros-
copy based on pretreatment of the slides with hydrogen perox-
ide. This was shown to minimize variability and to result in the
collection of highly reproducible data with excellent discrimina- tion between negative and HG samples. However, only blood
scale 0 and blood scale 1 samples were used for this study as
the treatment was not found to be effective for excessively
contaminated blood scale 2 and 3 samples. Kerr et al.20 inves-
tigated the effect of blood contamination on Raman spectra of
urine cytology samples. They determined that spectra recorded
from samples with a low level of blood appeared free from con-
tamination due to the effective removal of many of the red blood
cells using the lysing agent CytoLyt. However, for excessively
bloody samples, several additional Raman peaks associated with blood were observed leading to the conclusion that excessively
bloody samples are not suitable for diagnostics with Raman
microspectroscopy. The aim of the present study was to extend
our previous study17 to samples annotated as blood scale 2 and 3
to investigate if these excessively bloody samples could be
treated to render them suitable for Raman spectroscopy.
2 Materials and Methods
2.1 Samples and Blood Treatment
Cervical LBC samples were provided by Coombe Women and
Infants University Hospital, Dublin, Ireland, for spectroscopic
analysis with the final clinical report prepared by the cytologist
and/or pathologist. This study was approved by the Research
Ethics Committee at Coombe Women and Infants University
Hospital. A set of 30 samples were selected, 15 HG intraepithe-
lial neoplasia samples, which received a CIN 2 or CIN 3, result
on their associated biopsy from pathology, and 15 negative sam-
ples (TN), which received a negative result from cytology. All

Journal of Biomedical Optics 055001-3 May 2018 • Vol. 23(5)
Downloaded From: https://www.spiedigitallibrary.org/journals/Journal-of-Biomedical-Optics on 19 Oct 2019 Terms of Use: https://www.spiedigitallibrary.org/terms-of-use
¼
Traynor et al.: Improved removal of blood contamination from ThinPrep cervical cytology samples for Raman spectroscopic analysis
cytology samples were evaluated by eye according to the blood
scale index and annotated as being either a grade 0, 1, 2, or 3.
HeLa cervical cancer cells were also prepared and fixed as
for ThinPrep samples in PreservCyt. These samples were seeded
with blood to mimic excessively bloody cytology samples. This
was achieved by adding blood to the samples until they visually
represented a blood scale 2 and 3 index sample.
Each ThinPrep sample vial was mixed for 3 min to break up cellular clumps. The sample was then poured into a 50-ml cen- trifuge tube and centrifuged for 5 min at 300 rpm. The super-
natant was removed and 1 ml of H2O2 was added and mixed for
30 s. About 20 ml of PreservCyt was added to neutralize the
H2O2. The sample was then centrifuged for 5 min at 600 rpm.
Most of the supernatant was removed. The cell pellet was resuspended multiple times with a 1-ml pipette to break up cell clumps. The 20 ml of PreservCyt was then added and the contents poured back into the original vial.
2.2 ThinPrep Slide Preparation
The samples were then prepared using the ThinPrep 2000
processor (Hologic Inc., Marlborough, Massachusetts). The
ThinPrep process begins with the patient’s gynecological sam-
ple being collected by the clinician using either a cervical broom
or brush. The brush/broom is then rinsed in the specimen vial
containing PreservCyt transport medium (ThinPrep Pap Test;
Cytyc Corporation, Boxborough, Massachusetts). The ThinPrep
sample vial is then capped, labeled, and sent to the lab to be
processed. The ThinPrep processor homogenizes the sample by
spinning the filter and creating shear forces that breaks up any
clumped material (blood, mucin, and nondiagnostic material).
The cells are then transferred onto a polycarbonate filter
membrane of the TransCyt filter and transferred onto a
glass slide to produce a circular monolayer of cells ∼20 mm in diameter. The slide is then ejected into a fixative bath of 95% ethanol.
2.3 Raman Spectroscopy
All Raman analyses was performed using a HORIBA Jobin
Yvon XplorRA™ system (Villeneuve d’Ascq, France), which
incorporates an Olympus microscope BX41 equipped with
a ×100 objective (MPlan, Olympus, NA 0.9). A 532-nm diode
laser source was used. Laser power was set to 100% resulting
in 16 mW at the objective. The confocal hole coupled to a slit
aperture of 100 μm was set at 100 μm for all the mea-
surements. The system was precalibrated to the 520.7 cm−1
spectral line for silicon. About 1200 lines/grating mm were
used. The backscatter light was measured using an air-cooled
CCD detector (Andor, 1024 × 256 pixels). The spectrometer
was controlled by Labspec V5.0 software. Two accumulations
of 30 s were performed on each cell nucleus selected. Raman
spectra were acquired from the nuclei of randomly selected
morphologically normal superficial and intermediate cells from
each unstained pap smear.
Fig. 3 (a) Untreated pap smear, blood scale 3, stars indicate recorded nuclei in field-of-view. Bar
¼ 35 μm. (b) Raman spectra recorded from untreated pap smear. (c) Treated pap smear, stars indi- cate
recorded nuclei in field-of-view. Bar ¼ 35 μm. (d) Raman spectra recorded from treated pap smear.

Journal of Biomedical Optics 055001-4 May 2018 • Vol. 23(5)
Downloaded From: https://www.spiedigitallibrary.org/journals/Journal-of-Biomedical-Optics on 19 Oct 2019 Terms of Use: https://www.spiedigitallibrary.org/terms-of-use
¼ ¼
Traynor et al.: Improved removal of blood contamination from ThinPrep cervical cytology samples for Raman spectroscopic analysis
Fig. 4 (a) Mean Raman spectra of HeLa cervical cancer cells treated with blood (blood scale 2 and 3) and subsequently treated with H2O2 (red) and HeLa cervical cancer cells not treated with blood but treated with H2O2 (blue), (b) mean Raman spectra of true negative samples (TN), blood scale 2 and 3, treated with H2O2 (red) and blood scale 0, treated with H2O2, (c) mean Raman spectra of HG samples, blood scale 2 and 3 treated with H2O2 (red) and blood scale 0, treated with H2O2.
2.4 Data Preprocessing and Analysis
Data were normalized and analyzed using MATLAB software
(Mathworks) and specific scripts developed and adapted for
uploading of the spectra and their preprocessing, including
smoothing (Savitzky–Golay K 5, K 13) baseline correc- tion
(rubberband) and vector normalization. The spectra were also
corrected for the glass background using a linear least- squares
method with non-negative constraints. The least-squares model
was developed using spectra from the ThinPrep glass slides and
selected pure biochemicals (e.g., actin, collagen, RNA, DNA,
etc.) that approximate the biochemical composition of cervical
cells. The data were mean centered and subjected to partial least
squares discriminant analysis (PLS-DA). PLS-DA involves the
creation of latent variables to maximize the cova- riation
between known datasets and the response variable which they
are regressed against. PLS-DA is a form of analysis that has the
ability to distinguish between known classifications of sam- ples
(negative, HG) and its aim is to find latent variables and
directions to maximize separation in a multivariate space. To
validate the method leave one patient out cross validation was
performed. This involves data from one patient sample being
removed from the model and the process is repeated until all
samples have been left out once.
3 Results
Figure 3(a) shows an untreated Pap smear, blood scale 3. The
slide was coated in blood and cellular debris. Figure 3(b) shows
Raman spectra recorded from cells present on the slide. Very
few cells were present and often burned on contact with the
laser. A high background was observed together with Raman
bands associated with blood at 754, 1311, 1374, 1398, 1588,
1640 cm−1. The high background can be attributed to the cel-
lular debris or a subunit of the oxidized hemoglobin on the
surface of the cell nuclei, which has a weak fluorescence.11
Figure 3(c) shows the same sample from Fig. 3(a) after under- going the blood removal method. Any blood residue has been
oxidized with the H2O2 treatment and cellular debris has been
reduced allowing for high quality spectra to be recorded as
demonstrated in Fig. 3(d).
In order to determine if the Raman specific method of blood
removal using H2O2 had any effect on the spectra recorded with-
out any external confounding factors, such as inflammation,
HPV infection, etc., the protocol was performed on HeLa cer-
vical cancer cells. HeLa cells were seeded with blood to mimic
cytology samples with blood scale index 2 and 3 and HeLa cells
with no added blood acted as controls. Both sample types were
treated with H2O2 and slides prepared as for the ThinPrep

Journal of Biomedical Optics 055001-5 May 2018 • Vol. 23(5)
Downloaded From: https://www.spiedigitallibrary.org/journals/Journal-of-Biomedical-Optics on 19 Oct 2019 Terms of Use: https://www.spiedigitallibrary.org/terms-of-use
Traynor et al.: Improved removal of blood contamination from ThinPrep cervical cytology samples for Raman spectroscopic analysis
cytology samples. Figure 4(a) shows the mean Raman spectra recorded from 30 HeLa cells with and without blood contami- nation (blood scale 2 and 3) and treated with H2O2. The mean
spectra display strong similarities with only minor changes at
1242 cm−1 (Amide III), 1350 cm−1 (DNA/RNA, CH def. in
proteins and carbohydrates), 1430 cm−1 (protein, lipids), and
1669 cm−1 (Amide I). Figure 4(b) shows the mean Raman spec- tra of negative cytology samples (TN) with and without blood contamination (blood scale 2 and 3) and treated with H2O2. The
mean spectra display strong similarities with small changes at
1242, 1350, 1430, and 1669 cm−1 as observed for the HeLa cells. These small changes in the spectra were consistent throughout all samples tested including the HG samples [Fig. 4(c)].
PLS-DA classification of negative cytology samples and HG
cytology samples, blood scale index 0, is shown in Fig. 5.
Figure 5(a) is a latent variables (LV) scores scatter plot of LV1
and LV2, which shows good discrimination along LV1. The
loadings, as shown in Fig. 5(b), show that the discrimina-
tion is based around Raman peaks at 482, 851, 936, 1128, 1338,
1449, 1572, 1655, and 1669 cm−1, which are mainly related to DNA, proteins, and glycogen. Figure 5(c) is a PLS-DA predic- tion plot showing good classification of negative and HG sam-
ples with a sensitivity of 92% and a specificity of 93% (Table 1).
PLS-DA classification of TN and HG cytology samples, blood
scale index 2 and 3, is shown in Fig. 6. Both negative
and HG samples have undergone the Raman-specific blood
removal method. Figure 6(a) is a LV scores scatter plot of treated
TN and HG samples, which show overlap between the samples.
The LV1 loadings, as shown in Fig. 6(b), show that the discrimi-
nation is based around Raman peaks at 482, 549, 851, 936,
1145, 1182, 1237, 1338, 1449, 1576, and 1669 cm−1 and are
similar to the loadings shown in Fig. 5(b). The PLS-DA predic-
tion plot is shown in Fig. 6(c) and has a sensitivity of 89% and
a specificity of 88% (Table 1).
In order to determine if excessively bloody samples could be
treated the same way as nonbloody samples in terms of data
analysis, the Raman spectral data from the two groups (blood
scale 0 and blood scale 2 and 3) were combined. Figure 7(a)
shows the LV scores scatter plot, which highlights decreased
discrimination between TN and HG cytology. However, the
loadings shown in Fig. 7(b) remain similar to the loadings
shown in Figs. 5(b) and 6(b) with Raman peaks at 482, 851,
1129, 1184, 1251, 1338, 1449, and 1669 cm−1. The PLS-DA
prediction plot is shown in Fig. 7(c) and has a sensitivity of 82%
and a specificity of 87% (Table 1).
Interestingly, the loadings (482, 851, 936, 1149, 1338 and
1669 cm−1) remain almost the same between all three datasets, blood scale 0, blood scale 2 and 3 and combined, confirming
that glycogen, DNA, and proteins are the main discriminating
features between negative cytology and HG cytology samples
regardless of blood contamination. Similar findings have
Fig. 5 (a) LV score scatter plot of Raman spectra acquired from 15 TN samples and 15 HG samples
(blood scale index 0), (b) LV 1 loadings, and (c) PLS-DA prediction plot showing good discrimination
between TN (blue) and HG (red) ThinPrep cytology samples.

Journal of Biomedical Optics 055001-6 May 2018 • Vol. 23(5)
Downloaded From: https://www.spiedigitallibrary.org/journals/Journal-of-Biomedical-Optics on 19 Oct 2019 Terms of Use: https://www.spiedigitallibrary.org/terms-of-use
Traynor et al.: Improved removal of blood contamination from ThinPrep cervical cytology samples for Raman spectroscopic analysis
Table 1 Sensitivity and specificity from PLS-DA classification of TN
and HG cervical cytology samples with and without blood contamina-
tion and combined.
and 2 and 3)
been reported previously.17,19 However, as mentioned earlier,
some spectral features undergo minor changes following the
blood removal method. As these features overlap with the dis-
criminating features, this results in a reduction in classification
efficiency when excessively bloody (blood scale index 2 and 3)
samples and nonbloody samples (blood scale index 0) samples
are combined for analysis. Comparing sensitivity and specificity
of the test groups shows that blood scale 0 samples with no
blood contamination performed best with a sensitivity of 92%
and specificity of 93% when compared to excessively bloody
blood scale 2 and 3 samples, which had a sensitivity of 89% and
specificity of 88%. Combining the blood scale 0 and
blood scale 2 and 3 samples for analysis resulted in a sensitivity
of 82% and specificity of 87%. The high specificity indicates a
good ability to accurately exclude negative samples (few false
positives), however, the reduction in sensitivity indicates a
reduced ability to accurately detect HG samples and an
increased likelihood of false negatives.
Despite the reduction in classification efficiency, the values are higher than previously reported for samples with blood con-
tamination. Rubina et al.16 reported a classification efficiency of
78% and 79% for normal and abnormal bloody samples treated
with red blood cell lysis buffer. In addition, Kerr et al.20 con- cluded that excessively bloody samples were not suitable for diagnostics with Raman spectroscopy.
4 Conclusion
This study demonstrates for the first time that excessively
bloody (blood scale 2 and 3) ThinPrep cervical smear samples
can be used for diagnostics with Raman spectroscopy following
a hydrogen peroxide treatment in the collection vial. However,
the presence of excessive blood contamination (blood scale
index 2 and 3) did result in reduced sensitivity and specificity
for classification of negative and HG samples. A higher sensi-
tivity and specificity could be achieved by keeping excessively
bloody samples separate from nonbloody samples for analysis.
Although this study has focused only on cervical cytology sam-
ples, thyroid, urine, and serous fluid cytology samples may also
Fig. 6 (a) LV score scatter plot of Raman spectra acquired from 15 TN and 15 HG samples (blood scale index 2 and 3), (b) LV1 loadings, (c) PLS-DA prediction plot showing some discrimination between TN
(blue) and HG (red) ThinPrep cytology samples, blood scale 2 and 3 and treated with H2O2.
Sensitivity (%) Specificity (%)
Negative versus HG
(blood scale 0)
92 93
Negative versus HG
(blood scale 2 and 3)
89 88
Combined (blood scale 0 82 87

Journal of Biomedical Optics 055001-7 May 2018 • Vol. 23(5)
Downloaded From: https://www.spiedigitallibrary.org/journals/Journal-of-Biomedical-Optics on 19 Oct 2019 Terms of Use: https://www.spiedigitallibrary.org/terms-of-use
Traynor et al.: Improved removal of blood contamination from ThinPrep cervical cytology samples for Raman spectroscopic analysis
Fig. 7 (a) LV score scatter plot of Raman spectra from TN and HG samples (combined blood scale 0 and blood scale 2 and 3), (b) LV1 loadings, and (c) PLS-DA prediction plot showing some discrimination
between TN (blue) and HG (red) ThinPrep cytology samples, combined blood scale 0 and blood scale
2 and 3 and treated with H2O2.
benefit from such an approach for Raman spectroscopic analy-
sis. Serous fluids for cytological examination are often contami-
nated with a high level of blood (pericardium, pleura, and
peritoneum fluids) and often require additional treatment meth-
ods, such a density gradient technique to remove red blood cells,
which can result in a loss of diagnostic cellular material. The
application of our blood treatment method would prevent this
loss of material and allow Raman spectroscopy to be performed.
While these results are promising for the development of
Raman spectroscopy for cervical cancer screening, Raman
spectroscopy in its current form does not have the ability to
replace cytology for cervical cancer screening and its associated
benefits (e.g., detection of Herpes Simplex virus or actinomyces
like organisms). However, it could be used to supplement the
pap test or it could have potential as a triage test after HPV
testing.
Disclosures
There are no conflicts of interest.
Acknowledgments
This research was undertaken as part of CERVIVA, the Irish
Cervical Screening Research Consortium and we gratefully
acknowledge funding from the Health Research Board Colla-
borative Applied Research Grant, CARG2012/29, and Enter-
prise Ireland cofunded by the European Regional Development
Fund (ERDF) and Ireland’s EU Structural Funds Programme
2007–2013, CF2011 1045. We thank the Cytology staff at
Coombe Women and Infants University Hospital, Dublin, for
facilitating the study and technical support staff at the FOCAS
Research Institute, Dublin Institute of Technology.
References
1. J. Ferlay et al., “Cancer incidence and mortality worldwide: sources,
methods and major patterns in GLOBOCAN 2012,” Int. J. Cancer 136, E359–E386 (2015).
2. F. X. Bosch et al., “The causal relationship between human papilloma-
virus and cervical cancer,” J. Clin. Pathol. 55, 244–265 (2002).
3. B. Shambayati, Cytopathology, 1st ed., pp. 88–89, Oxford University
Press, Oxford (2011).
4. H. C. Kitchener et al., “MAVARIC trial study group,” Health Technol.
Assess. 15, 1–170 (2011).
5. U. Utzinger et al., “Near-infrared Raman spectroscopy for in vivo
detection of cervical precancers,” Appl. Spectrosc. 55, 955–959 (2001).
6. E. M. Kanter et al., “Effect of hormonal variation on Raman spectra for
cervical disease detection,” Am. J. Obstet. Gynecol. 200, 512.e1–512.e5 (2009).
7. E. Vargis et al., “Effect of normal variations on disease classification of
Raman spectra from cervical tissue,” Analyst 136, 2981–2987 (2011).
8. E. Vargis et al., “Sensitivity of Raman spectroscopy to normal patient
variability,” J. Biomed. Opt. 16, 117004 (2011).
9. J. Mo et al., “High wavenumber Raman spectroscopy for in vivo
detection of cervical dysplasia,” Anal. Chem. 81, 8908–8915 (2009).

Journal of Biomedical Optics 055001-8 May 2018 • Vol. 23(5)
Downloaded From: https://www.spiedigitallibrary.org/journals/Journal-of-Biomedical-Optics on 19 Oct 2019 Terms of Use: https://www.spiedigitallibrary.org/terms-of-use
Traynor et al.: Improved removal of blood contamination from ThinPrep cervical cytology samples for Raman spectroscopic analysis
10. S. Duraipandian et al., “Simultaneous fingerprint and high-wavenumber
confocal Raman spectroscopy enhances early detection of cervical
precancer in vivo,” Anal. Chem. 84, 5913–5919 (2012).
11. K. Kong et al., “Raman spectroscopy for medical diagnostics—from in-
vitro biofluid assays to in-vivo cancer detection,” Adv. Drug Delivery
Rev. 89, 121–134 (2015).
12. I. P. Santos et al., “Raman spectroscopy for cancer detection and cancer
surgery guidance: translation to the clinics,” Analyst 142, 3025–3047 (2017).
13. F. M. Lyng et al., “Raman spectroscopy for screening and diagnosis of
cervical cancer,” Anal. Bioanal. Chem. 407, 8279–8289 (2015).
14. M. Diem et al., “Molecular pathology via IR and Raman spectral
imaging,” Biophotonics 6, 855–886 (2013).
15. E. Vargis et al., “Near-infrared Raman microspectroscopy detects high-
risk human papillomaviruses,” Transl. Oncol. 5, 172–179 (2012).
16. S. Rubina, M. S. Vidyasagar, and C. M. Krishna, “Raman spectroscopic
study on prediction of treatment response in cervical cancers,” J. Innovative Opt. Health Sci. 6, 1350014 (2013).
17. F. Bonnier et al., “Processing ThinPrep cervical cytology samples for
Raman spectroscopy analysis,” Anal. Methods 6, 7831–7841 (2014).
18. I. Ramos, A. Malkin, and F. Lyng, “Current advances in the application
of Raman spectroscopy for molecular diagnosis of cervical cancer,” BioMed Res. Int. 9, 1–9 (2015).
19. P. Kearney et al., “Raman spectral signatures of cervical exfoliated cells
from liquid-based cytology samples,” J. Biomed. Opt. 22(10), 105008 (2017).
20. L. T. Kerr et al., “Methodologies for bladder cancer detection with
Raman based urine cytology,” Anal. Methods 8, 4991–5000 (2016).
Damien Traynor holds his BSc degree in medical and molecular cytology from the Dublin Institute of Technology (DIT). He achieved membership of the Academy of Laboratory Science in cytology in 2012 and worked as a primary screener for two years before joining DIT as a research technician. He is working on a Health Research
Board funded clinical evaluation of Raman spectroscopy for the diag- nosis of cervical precancer and is working on his PhD part time.
Shiyamala Duraipandian holds her BE degree in biomedical engi- neering from Adhiyamaan College of Engineering, Anna University. She received her PhD from the Department of Biomedical Engineering, National University of Singapore. She worked as a Marie-Curie fellow in Dublin Institute of Technology. She is working as a staff scientist in Dansk Fundamental Metrologi A/S. Her research is focused on different analytical techniques for pharm.
Cara M. Martin is an assistant professor in molecular pathology and tumor biology in the Department of Histopathology at the Trinity College Dublin. She leads the Cervical Cancer Research Group based in the Coombe Women and Infant’s University Hospital. Her research program consists of translational health services-based research in female gynecological cancers. She has published 57 peer-reviewed articles and 13 book chapters, and has a h-index of 23 and >2500 citations.
John J. O’Leary is a professor/chair of pathology at the Trinity College Dublin and a director of pathology at the Coombe Women and Infants University Hospital, Dublin. He heads a multi-investigator team focused on the molecular characterization of several cancer sys- tems including: ovary, cervix, prostate, thyroid, head and neck cancer, and cancer stem cell biology. He has published more than 190 peer- reviewed papers, and has a h-index of 49 and >9600 citations.
Fiona M. Lyng holds her BSc degree from Trinity College Dublin and her PhD from the University College Dublin. She is a head of the DIT Centre for Radiation and Environmental Science. Her research is focused on translational research for cancer diagnosis and cancer treatment. She has published over 100 peer-reviewed research papers, and has a h-index of 33 and >3500 citations.

DOI: 10.1002/jbio.201800377
FU LL A R TI CLE
The potential of biobanked liquid based cytology samples for
cervical cancer screening using Raman spectroscopy
Damien Traynor1* | Shiyamala Duraipandian
1 | Ramya Bhatia
2 | Kate Cuschieri
2 |
Cara M. Martin3
| John J. O'Leary3
| Fiona M. Lyng1
1DIT Centre for Radiation and Environmental
Science, Focas Research Institute, Dublin Institute
of Technology (DIT), Dublin, Ireland
2HPV Research Group, Division of Pathology,
Queens Medical Research Institute, University of
Edinburgh, Edinburgh, UK
3Discipline of Histopathology, University of
Dublin Trinity College, Dublin, Ireland
*Correspondence
Damien Traynor, DIT Centre for Radiation
and Environmental Science, Focas Research
Institute Dublin Institute of Technology
Kevin Street Dublin 8 Ireland.
Email: [email protected]
1 | INTRODUCTION
Every year millions of cervical Pap tests are performed
throughout the world in countries for purposes of cervical
screening. Most Pap tests are performed through use of liq-
uid based cytology (LBC) where cervical cells are collected
before deposition into a volume of liquid preservative. As not
all the material is required for cytological assessment, the
surplus, which would ordinarily be discarded, can be stored
within tissue biobanks with due process of
governance. Biobanks constitute a valuable source of mate-
rial which may support a number of studies including those
on the natural history of disease, evaluation of screening
practices, vaccination effectiveness or the development of
new technologies to support screening and disease manage-
ment.[1–3]
There were an estimated 527 600 new cervical cancer
cases and 265 700 deaths from cervical cancer worldwide in
2012.[4] This demonstrates the importance of both cervical
screening to reduce the burden of disease and also
J. Biophotonics. 2019;12:e201800377. www.biophotonics-journal.org © 2019 WILEY-VCH Verlag GmbH & Co. KGaA, Weinheim 1 of 8
https://doi.org/10.1002/jbio.201800377
Received: 4 October 2018 Revised: 20 December 2018 Accepted: 13 January 2019
Patient samples are unique and often irreplaceable. This
allows biobanks to be a valuable source of material. The aim
of this study was to assess the ability of Raman spec-
troscopy to screen for histologically confirmed cases of Cer-
vical Intraepithelial neoplasia (CIN) using biobanked liquid
based cytology (LBC) samples. Two temperatures for long
term storage were assessed; 80oC and −25oC. The utility of
Raman spectroscopy for the detection of CIN was compared
for fresh LBC samples and biobanked LBC samples. Two
groups of samples were used for the study with one group
associated with disease (CIN 3) and the other associated with
no disease (cytology negative). The data indicates that
samples stored at −80oC are not suitable for assessment by
Raman spectroscopy due to a lack of cellular material and
the presence of cellular debris. However, the technology can be applied to fresh
LBC samples and those stored at −25oC and is, moreover, effective in the discrimi-
nation of negative samples from those where CIN 3 has been confirmed. Pooled
fresh and biobanked samples are also amenable to the technology and achieve a
similar sensitivity and specificity for CIN 3. This study demonstrates that cervical
cytology samples stored within biobanks at temperatures that preclude cell lysis can
act as a useful resource for Raman spectroscopy and will facilitate research and
translational studies in this area.
biobank, cervical cancer, cervical pre-cancer, cytology, Raman spectroscopy,
ThinPrep

investment in research into new technologies that can
improve the performance and “reach” of cervical screening
Different collection media for liquid based cytology exist
however one of the more common media is PreservCyt
(Hologic). PreservCyt is a methanol based solution that pre-
serves cell morphology via fixation. Fixation is routinely
employed as it allows a “snapshot” of a cell's physical and
biochemical state to be assessed. Methanol is an organic sol-
vent that preserves cells through dehydration and precipita-
tion of proteins.[5] Fixation is important given that sample
collection and assessment is not performed concurrently. In
addition to supporting routine screening, fixation of cells also
supports longer term storage of residual material in biobanks.
The advantage of the Pap test is that it is a widely
accepted screening based test with a high specificity of 95%
to 98% and a sensitivity of 74% to 96%.[6] The variability in
the rates of sensitivity are due to sampling technique and the
variability of the cytology based screening. This can result in
unnecessary gynaecological referral and patient recall.
Persistent infection with high risk human papillomavirus
(HPV), is accepted as the major cause of cervical pre-cancer
and cancer.[7] HPV DNA testing has a higher sensitivity
(>95%) but lower specificity (~84%) than the Pap test.[7]
These tests are expensive, time-consuming and provide no
information on cervical cytopathology.
Current methods for detection of cervical cancer and pre-
cancer (CIN) are limited and there is an unmet clinical need
for new screening or diagnostic tests. Recently Raman spec-
troscopy has shown potential as a tool for screening and
diagnosis of cervical lesions and cancer.[8–10] Raman spec-
troscopy is based on inelastic light scattering where a sample
is illuminated by a monochromatic laser light and interac-
tions between the incident photons and molecules in the
sample result in the scattering of the light. The coupling of
the light generates vibrations within the sample which are
characteristic of the chemical structure. This means that the
position, peaks and shape of the Raman bands carry infor-
mation about the molecular makeup of the sample. The
Raman spectrum of cells and tissues is made up of contribu-
tions from many biochemical components including DNA,
RNA, proteins, lipids and carbohydrates.[11] Raman spec-
troscopy can offer a label free non-destructive method for
cervical cancer screening. It is an objective method, less reli-
ant on operator performance than cytology and potentially
more specific than HPV testing.
Due to confounding factors such as sample collection,
blood contamination and sample variability, few studies have
been performed using Raman spectroscopy on cervical
cytology samples and none to our knowledge have investi-
gated the potential of utilising biobanked LBC samples. The
aim of this feasibility study was to assess the utility and per-
formance of Raman spectroscopy for the detection of CIN
using biobanked LBC samples. Samples stored at −80oC
and −25oC were assessed and the ability of Raman spectra to
delineate disease from no disease was determined. Addi-
tionally, Raman spectroscopy was assessed in un-banked
LBC samples as a comparator.
2 | METHODS
2.1 | Sample collection
Two classes of samples were used for the study, classed as
disease and no disease. Samples with no disease were defined
as cytology negative and HPV negative whereas samples
with disease were those associated with a histologi- cally
confirmed CIN 3 with a HPV positivity according to HPV
DNA and mRNA status. All samples were recruited from
patients presenting at a colposcopy clinic for the first time,
and had no prior history of disease. Samples were col- lected
from each patient according to the standard operating
procedure issued by Cervical Check Irelands national cervi-
cal cancer screening programme and the NHS Scottish cervi-
cal screening programme. Both procedures are similar and all
samples were biobanked using the same methodology.
One hundred thirty-three samples were used in total for
this study of which 64 were LBC biobanked samples; 32
with no disease (cytology negative) and 32 with disease (CIN
3). Biobanked samples were provided by the Scottish HPV
Archive, a research tissue biobank set up to facilitate HPV
associated research.
Ethical approval for use of the samples was obtained from
the East of Scotland Research Ethics Service—Tayside
committee. Biobanked LBC samples used for this study had
been sedimented with the cellular pellet transferred into a
4.5 mL vial for long term storage in PreservCyt. After tran-
sit, samples were re-constituted to a volume of 20 mL fresh
PreservCyt solution to resemble the original LBC specimen
from which the sample was derived.
A further 64 non biobanked “fresh” LBC samples, 32
with no disease (cytology negative) and 32 with disease (CIN
3), were collected in PreservCyt solution from the Coombe
Women and Infants University Hospital (CWIUH), Dublin,
Ireland, as part of routine cytological screening. Eth- ical
approval for use of anonymised samples for the study was
granted by the CWIUH Research Ethics Committee (no. 28-
2014). A further 5 fresh LBC samples with disease (CIN 3)
were collected and split into two separate vials. One vial from
each sample underwent the standard biobanking process and
was stored for 3 weeks, while the other was stored at room
temperature.
2.2 | ThinPrep
The samples were then prepared using the ThinPrep 2000
processor (Hologic Inc., Marlborough, Massachusetts). The
ThinPrep process begins with the patient's gynaecological
2 of 8
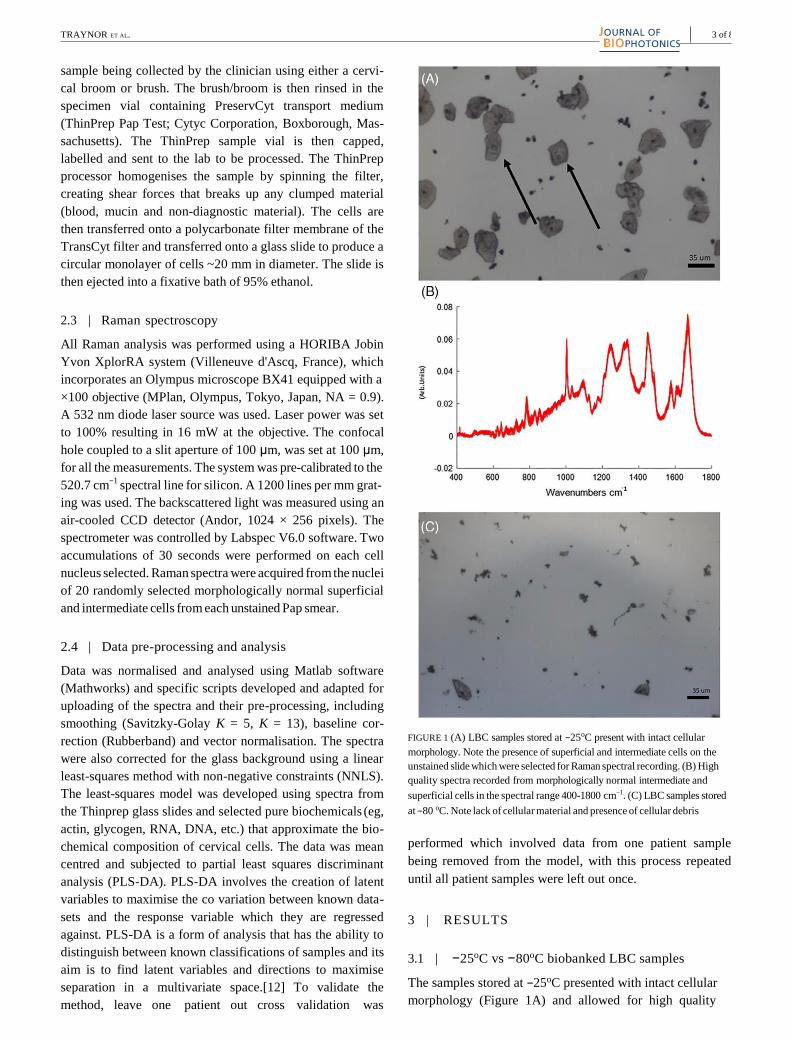
TRAYNOR ET AL.
sample being collected by the clinician using either a cervi-
cal broom or brush. The brush/broom is then rinsed in the
specimen vial containing PreservCyt transport medium
(ThinPrep Pap Test; Cytyc Corporation, Boxborough, Mas-
sachusetts). The ThinPrep sample vial is then capped,
labelled and sent to the lab to be processed. The ThinPrep
processor homogenises the sample by spinning the filter,
creating shear forces that breaks up any clumped material
(blood, mucin and non-diagnostic material). The cells are
then transferred onto a polycarbonate filter membrane of the
TransCyt filter and transferred onto a glass slide to produce a
circular monolayer of cells ~20 mm in diameter. The slide is
then ejected into a fixative bath of 95% ethanol.
2.3 | Raman spectroscopy
All Raman analysis was performed using a HORIBA Jobin
Yvon XplorRA system (Villeneuve d'Ascq, France), which
incorporates an Olympus microscope BX41 equipped with a
×100 objective (MPlan, Olympus, Tokyo, Japan, NA = 0.9).
A 532 nm diode laser source was used. Laser power was set
to 100% resulting in 16 mW at the objective. The confocal
hole coupled to a slit aperture of 100 μm, was set at 100 μm,
for all the measurements. The system was pre-calibrated to the
520.7 cm−1
spectral line for silicon. A 1200 lines per mm grat-
ing was used. The backscattered light was measured using an
air-cooled CCD detector (Andor, 1024 × 256 pixels). The
spectrometer was controlled by Labspec V6.0 software. Two
accumulations of 30 seconds were performed on each cell
nucleus selected. Raman spectra were acquired from the nuclei
of 20 randomly selected morphologically normal superficial
and intermediate cells from each unstained Pap smear.
2.4 | Data pre-processing and analysis
Data was normalised and analysed using Matlab software
(Mathworks) and specific scripts developed and adapted for
uploading of the spectra and their pre-processing, including
smoothing (Savitzky-Golay K = 5, K = 13), baseline cor-
rection (Rubberband) and vector normalisation. The spectra
were also corrected for the glass background using a linear
least-squares method with non-negative constraints (NNLS).
The least-squares model was developed using spectra from
the Thinprep glass slides and selected pure biochemicals (eg,
actin, glycogen, RNA, DNA, etc.) that approximate the bio-
chemical composition of cervical cells. The data was mean
centred and subjected to partial least squares discriminant
analysis (PLS-DA). PLS-DA involves the creation of latent
variables to maximise the co variation between known data-
sets and the response variable which they are regressed
against. PLS-DA is a form of analysis that has the ability to
distinguish between known classifications of samples and its
aim is to find latent variables and directions to maximise
separation in a multivariate space.[12] To validate the
method, leave one patient out cross validation was
FIGURE 1 (A) LBC samples stored at −25oC present with intact cellular
morphology. Note the presence of superficial and intermediate cells on the
unstained slide which were selected for Raman spectral recording. (B) High
quality spectra recorded from morphologically normal intermediate and
superficial cells in the spectral range 400-1800 cm−1. (C) LBC samples stored
at −80 oC. Note lack of cellular material and presence of cellular debris
performed which involved data from one patient sample
being removed from the model, with this process repeated
until all patient samples were left out once.
3 | RESULTS
3.1 | −25oC vs −80oC biobanked LBC samples
The samples stored at −25oC presented with intact cellular
morphology (Figure 1A) and allowed for high quality
3 of 8

FIGURE 2 (A) mean spectra of fresh Negative (red) vs CIN 3 (blue). (B) is a latent variables (LV) scores scatter plot of LV1 and LV2, TN (yellow) vs CIN
3 (blue). (C) LV1(blue) and LV2 (orange) loadings (D) PLS_DA prediction plot CIN 3 (blue), negative (yellow)
spectra to be recorded (Figure 1B). The samples stored at
−80oC presented with cell lysis, cellular debris and very little
cellular material which prevented the recording of spectra
(Figure 1C). One possible explanation for this, is the freeze
thaw effect which is commonly used to lyse bacteria and
mammalian cells. Storing cells at −80oC in PreservCyt with-
out any Dimethyl Sulfoxide and bring up to room tempera-
ture can cause the cells to contract during the thawing process
resulting in cell lysis. As a result, only biobanked samples
previously stored at −25oC were used for this study.
3.2 | Negative vs CIN 3 (fresh LBC samples) model
In order to determine if biobanked LBC samples could be used
to discriminate no disease (cytology negative) from disease
(CIN 3) using Raman spectroscopy, fresh (non biobanked)
LBC samples were first examined as a control. Figure 2A
shows mean spectra of Negative vs CIN 3. Figure 2B is a
latent variables (LV) scores scatter plot of LV1 and LV2,
which shows good discrimination along LV1 and LV2. The
loadings shown in Figure 2C, show that the discrimination is
based around Raman peaks at 484 (glycogen), 575 (glycogen),
881 (nucleic acids), 1004 (proteins Phenylalanine), 1139,
1238 (proteins Amide III), 1487 (proteins), 1575 (nucleic
acids), 1605 (proteins) and 1669 cm−1
(proteins Amide I). The
LV2 loadings show discrimination is based around 1238
(proteins), 1381 (glycogen), 1450 (proteins and lipids), 1642
(proteins) and 1669 cm−1
(proteins) (see Table 1).[13] The
PLS-DA prediction plot shown in Figure 2D and has a sensi-
tivity of 86% and a specificity of 90% for CIN 3.
3.3 | Negative vs CIN 3 (Biobanked LBC samples)
model
In order to determine if the biobanked samples can be used in
a similar fashion to the fresh samples, negative and CIN
4 of 8

5 of 8 TRAYNOR ET AL.
TABLE 1 Tentative peak assignments for Raman spectra of cells and tissues[13]
482 Glycogen
577 Glycogen
622 C C twist Phe
643 C C twist Tyr
727 CH2 def C C head A
752 Sym br. Trp
781 U,C,T ring br
826 Out of Plane ring br.Tyr PO2 a.str.
851 Ring br. Tyr,C C str. Pro
852 Glycogen
937 Glycogen
985 C C head
1002 Sym. Ring br. Phe
1033 C H in plane Phe, C C str.
1044 Glycogen
1060 C N str.
1082 C N str. Chain C C str. C O str., Glycogen
1096 Chain C C str. C C str.
1106 Glycogen
1123 C N str. Chain C C str. C O str.
1152 C N str.
1207 C C6H5 str. Phe, Trp
1238 C N str., Amide III
1261 Glycogen
1334 Glycogen
1338 Trp G
1366 Sym. str. CH3
1381 Glycogen
1450 CH2 def CH2 def
1458 Glycogen
1487 CH2 def G,A
1560 Tyr, Trp
1575 A,G ring br
1584 C C str., C C bend. Trp, Phe
1605 C C Phe, Tyr
1642 C O str., C C sym. str.
1669 C O str. Amide I
3 biobanked samples were compared. Figure 3A shows the
mean spectra of biobanked Negative samples vs CIN 3. Fig-
ure 3B is a latent variables (LV) scores scatter plot of LV1
and LV2 which shows good discrimination along LV1 and
LV2. The loadings from LV1 are shown in Figure 3C and
show that discrimination is based around Raman peaks, 622
(proteins), 640 (proteins),775 (proteins), 850 (proteins),
1122 (proteins), 1152 (proteins), 1207 (proteins), 1450 (pro-
teins), 1560 (proteins), 1605 (proteins), 1642 (proteins) and
1669 cm−1
(proteins). LV2 loadings show discrimination is
based on 1123 (proteins, lipids, carbohydrates), 1338 (pro-
teins) and 1605 cm−1
(proteins) Raman peaks assigned to
phenylalanine 1004 cm−1
show a slight shift between 1003
and 1004 cm−1
which is most likely attributed to the
methanol based fixation method which suggests a change in
the conformation of the phenylalanine protein.[14] The PLS-
DA prediction plot shown in Figure 3D and has a sensitivity
of 91% and a specificity of 92% for CIN 3.
3.4 | Biobanked vs non-Biobanked samples
Five fresh CIN 3 patient samples were split into two separate
vials. One vial from each sample was frozen as described
earlier and the other stored at room temperature. Figure 4A
shows the mean spectra for biobanked CIN 3 samples and the
same samples kept at room temperature for 3 weeks after
collection. The mean spectra appear identical. There does not
appear to be a difference between the fresh and
Raman peak position [cm−1
] Proteins Lipids Carbohydrates Nucleic acids

FIGURE 3 (A) mean spectra of biobanked Negative (red) vs CIN 3 (blue). (B) latent variables (LV) scores scatter plot of LV1 and LV2, TN (yellow) vs
CIN 3 (blue). (C) LV1 (blue) LV2 (orange). (D) PLS_DA prediction plot CIN 3 (blue), negative (yellow)
biobanked samples. The latent variable scatter scores plot
(Figure 4B) shows slight discrimination between the sample
types, which is most likely due to internal sample variability
[15] (LBC samples are variable by nature) and the low num-
ber of spectra recorded (60 for room temperature/bio-
banked). The PLS-DA prediction plot (Figure 4C) has a
sensitivity of 29% and specificity of 88% for biobanked sam-
ples indicating poor discrimination between the two groups.
3.5 | Mixed model
In order to determine if we could mix fresh and biobanked
samples together and still achieve a sensitivity and specific-
ity similar to the fresh and biobanked models, 15 biobanked
CIN 3 samples were mixed with 15 fresh CIN 3 samples and
compared with 15 negative biobanked/ 15 fresh negative
samples. Figure 5A shows the latent variable scatter scores
plot of the model and we can see clear discrimination
between the sample types across LV1 and LV2. The LV1
loadings (Figure 5B) show that discrimination is based on
482, (glycogen), 1443 (proteins, lipids) 1487 (proteins),
1605 (proteins) 1669 cm−1
(proteins) while LV2 shows the
discrimination is based around 486 (glycogen), 851 (pro-
teins), 1152 (proteins), 1381 (glycogen), 1450 (proteins/li-
pids), 1575 (nucleic acids) and 1669 cm−1
(proteins). The
loadings show similarities to both the fresh and biobanked
loadings, but overall show that glycogen and proteins are the
main discriminating factor between negative and CIN 3 sam-
ples. PLS-DA prediction plot has a sensitivity of 94% and a
specificity of 95% for CIN 3 (Figure 5C).
4 | DISCUSSION
From the results it is clear that samples biobanked at −80oC are
not suitable for screening using Raman spectroscopy due to a
lack of cellular material and the presence of cellular debris.
Spectral differences between fresh negative and CIN 3
samples were observed with regards to glycogen, nucleic
acids and proteins. CIN 3 cells often contain little to no gly-
cogen, hence the use of Lugol's solution to visualise abnor-
mal cells in colposcopy.[16] The discrimination associated
6 of 8

7 of 8 TRAYNOR ET AL.
FIGURE 4 (A) mean spectra of fresh CIN 3 (blue) vs biobanked CIN
3 (red). (B) latent variables (LV) scores scatter plot of LV1 and LV2, fresh
CIN 3 (yellow) vs biobanked CIN 3.(C) PLS-DA prediction plot biobanked
CIN 3 (blue) vs fresh CIN 3 (yellow)
with changes in proteins and DNA is consistent with the
neoplastic changes that occur in CIN 3 supported by persis-
tent HPV infection such as increased cell cycling with coin-
cident increase in replication and levels of nucleic acids.[15]
FIGURE 5 (A) latent variables (LV) scores scatter plot of LV1 and LV2,
TN (yellow) vs CIN 3 (blue). (B) LV1 loadings (blue) and LV2 loadings
(orange). (C) PLS-DA prediction plot CIN 3 (blue), negative (yellow)
The PLS-DA prediction plot gives a sensitivity of 86% and a
specificity of 90% for CIN 3.
Negative vs CIN 3 biobanked sample results showed that
discrimination was driven solely by proteins. Raman peaks
associated with nucleic acids/DNA are not as strongly
present as they are in the non-biobanked samples. Long term
storage of biobanked samples is likely to have led at least to
an element of nucleic acids degradation which would explain
why nucleic acid is not discriminatory between neg- ative and
CIN 3 samples. However the PLS-DA prediction plot (Figure
3D) does show slightly higher sensitivity (91%) and
specificity (92%) rates when compared to fresh samples
(86% sensitivity and 90% specificity) indicating that bio-
banking at −20oC does not preclude discrimination of nega-
tive and CIN 3 samples on Raman spectroscopy.
The same patient samples that had been split in two with
half biobanked and the other half stored at room temperature
showed no discrimination between the samples. Hence, the 3
weeks period of biobanking at −20oC had no detrimental
effects on the physical or biochemical properties of the sam-
ples. The mixed model showed that biobanked and fresh LBC
samples could be combined with an improved sensitivity of
94% and specificity of 95%. A limitation of this study is the
inability to use biobanked LBC samples stored at −80oC for
Raman spectroscopic analysis as most biobanks will have
samples stored at -80 oC for long term storage[3] hence, the
true potential of using biobanks as a source of patient samples
could be lost. Further research in this area should involve the
use of different biobank specimens (bronchial and thyroid fine
needle aspirations) to investigate any detrimental effects the
biobanking process may have on cytological specimens17 18
.
5 | CONCLUSION
Raman spectroscopy can effectively discriminate disease free
cervical LBC samples from those with disease (CIN 3) and this is
possible using biobank cervical LBC samples stored at
−25oC. Pooling samples stored at −25oC with fresh samples
does not affect the sensitivity and specificity of Raman spectros-
copy for the discrimination of disease. This study demonstrates
that biobanks of cervical LBC samples are a useful resource for
future Raman spectroscopy studies and will facilitate the further
assessment of this technology which shows highly encouraging
performance for the detection of cervical disease.
ORCID
Damien Traynor https://orcid.org/0000-0001-6531-6653
REFERENCES
[1] J. M. Fox, R. C. Wiggins, J. W. J. Moore, C. Brewer, B. Hunter,
A. C. Andrew, F. Martin, Cryobiology 2017, 77, 14. https://doi.org/10.
1016/j.cryobiol.2017.06.004.
[2] L. A. Marquez-Curtis, L. E. McGann, J. A. W. Elliott, Cryobiology 2017,
77, 1. https://doi.org/10.1016/j.cryobiol.2017.04.012.
[3] T. Peakman, P. Elliott, Genome Med. 2010, 2(10), 2. https://doi.org/10.
1186/gm193.
[4] L. A. Torre, F. Bray, R. L. Siegel, J. Ferlay, J. Lortet-Tieulent, A. Jemal,
CA: A Can J Clin 2015, 65(2), 87. https://doi.org/10.3322/caac.21262.
[5] N. W. Troiano, W. A. Ciovacco, M. A. Kacena, J Histotechnol 2009, 32
(1), 27. https://doi.org/10.1179/his.2009.32.1.27.
[6] H. C. Kitchener, R. Blanks, G. Dunn, L. Gunn, M. Desai, R. Albrow,
J. Mather, D. N. Rana, H. Cubie, C. Moore, R. Legood, A. Gray, S. Moss,
Lancet Oncol 2011, 12(1), 56. https://doi.org/10.1016/S1470-2045(10)
70264-3.
[7] G. Ronco, P. Giorgi-Rossi, F. Carozzi, M. Confortini, P. Dalla Palma,
A. del Mistro, B. Ghiringhello, S. Girlando, A. Gillio-Tos, L. de Marco,
C. Naldoni, P. Pierotti, R. Rizzolo, P. Schincaglia, M. Zorzi, M. Zappa,
N. Segnan, J. Cuzick, New Technologies for Cervical Cancer screening
(NTCC) Working Group, Lancet Oncol. 2010, 11(3), 249. https://doi.
org/10.1016/S1470-2045(09)70360-2.
[8] F. Lyng, D. Traynor, Anal. Bioanal. Chem. 2015, 407(27), 8279.
[9] I. R. Ramos, A. D. Meade, O. Ibrahim, H. J. Byrne, M. McMenamin, M.
McKenna, A. Malkin, F. M. Lyng, Faraday Discuss 2016, 187, 187.
https://doi.org/10.1039/C5FD00197H.
[10] S. Rubina, C. M. Krishna, J. Cancer Res. Ther. 2015, 11(1), 10.
[11] I. P. Santos, E. M. Barroso, Analyst 2017, 142, 3025.
[12] R. G. Brereton, G. R. Lloyd, J. Chemometr. 2014, 28(4), 213. https://doi.
org/10.1002/cem.2609.
[13] Z. Movasaghi, S. Rehman, I. U. Rehman, Appl Spectrosc Rev 2007, 42, 493.
[14] A. Meade, Bioanal Chem 2010, 369(5), 1781. https://doi.org/10.1007/
s00216-009-3411-7.
[15] I. Serafín-Higuera, O. L. Garibay-Cerdenares, B. Illades-Aguiar, E. Flores-
Alfaro, M. A. Jiménez-López, P. Sierra-Martínez, L. D. C. Alarcón-
Romero, Proteome Sci 2016, 14(1), 1. https://doi.org/10.1186/ s12953-016-
0099-4.
[16] CervicalCheck. Organisational and Clinical Guidance for Quality Assured
Colposcopy Services, CervicalCheck - The National Cervical Screening
Programme, Dublin 1, 2013.
[17] M. A. Al-Abbadi, Avicenna J Med. 2011, 1(1), 18.
[18] D. O'Dea, M. Bongiovanni, G. P. Sykiotis, P. G. Ziros, A. D. Meade, F. M.
Lyng, A. Malkin, Cytopathology 2018, 30, 51-60. https://doi.org/10.1111/
cyt.12636.
8 of 8
How to cite this article: Traynor D, Duraipandian S,
Bhatia R, et al. The potential of biobanked liquid
based cytology samples for cervical cancer screening
using Raman spectroscopy. J. Biophotonics. 2019;12:
e201800377. https://doi.org/10.1002/jbio.201800377