Embed Size (px)
Citation preview

1
Combined Raman scattering and ab initio investigation of
pressure-induced structural phase transitions in the
scintillator ZnWO4
D. Errandonea1,∗, F.J. Manjón2, N. Garro3, P. Rodríguez-Hernández4, S. Radescu4,
A. Mujica4, A. Muñoz4, and C.Y. Tu5
1MALTA Consolider Team, Departamento de Física Aplicada - ICMUV, Universitat de
València, Edificio de Investigación, c/Dr. Moliner 50, 46100 Burjassot, Valencia, Spain 2MALTA Consolider Team, Departamento de Física Aplicada - IDF, Universitat
Politècnica de València, 46022 València, Spain 3Fundació General de la Universitat de València-ICMUV, Universitat de València, Polígon
La Coma s/n, 46980 Paterna (Spain) 4MALTA Consolider Team, Departamento de Física Fundamental II, Universidad de La
Laguna, La Laguna 38205, Tenerife, Spain 5Fujian Institute of Research on the Structure of Matter, Chinese Academy of Sciences, Fuzhou,
Fujian 350002, and Graduated School of Chinese Academy of Science, 100039 Beijing, China
Abstract: Room-temperature Raman scattering was measured in ZnWO4 up to 45 GPa.
We report the pressure dependence of all the Raman-active phonons of the low-
pressure wolframite phase. As pressure increases new Raman peaks appear at 30.6 GPa
due to the onset of a reversible structural phase transition to a distorted monoclinic β-
fergusonite-type phase. The low- and high-pressure phases coexist from 30.6 GPa to
36.5 GPa. In addition to the Raman measurements we also report ab initio total-energy
and lattice-dynamics calculations for the two phases. These calculations helped us to
determine the crystalline structure of the high-pressure phase and to assign the observed
∗ Corresponding author, Email: [email protected], Fax: (34) 96 3543146, Tel.: (34) 96 354 4475

2
Raman modes in both the wolframite and β-fergusonite phases. Based upon the ab
initio calculations we propose the occurrence of a second phase transition at 57.6 GPa
from the β-fergusonite phase to an orthorhombic Cmca phase. The pressure evolution
of the lattice parameters and the atomic positions of wolframite ZnWO4 are also
theoretically calculated and an equation of state reported.
PACS NUMBERS: 62.50.+p, 63.20.-e, 78.30.-j
I. Introduction
Materials belonging to the tungstate family (AWO4) have a long history of
practical application, having been first used by Thomas A. Edison in 1896 to detect x-
rays [1]. As a consequence of their technological importance, AWO4 compounds have
been the object of extensive research. The interest in them arises from their optical
properties which form the basis of their wide application as phosphors, laser crystals,
and scintillation detectors [2–4]. Recently, new applications for these materials have
emerged, including large-volume scintillators for high-energy physics [5] and detectors
devoted to the search of rare events (e.g. interactions with weakly-interactive massive
particles) [6]. In particular, zinc tungstate (ZnWO4), also known by its mineral name
sanmartinite, is a wide-gap semiconductor, with band-gap energy close to 4 eV [7], and
is a promising material for the new generation of radiation detectors [8].
It is well known that AWO4 compounds mostly crystallize either in the
tetragonal scheelite (space group (SG): I41/a, Z=4) or in the monoclinic wolframite
(SG: P2/c, Z=2) structures depending on the size of the counter-cation A [9]. In
particular, ZnWO4 has a wolframite-type crystalline structure (see Figure 1(a)) [10],
with two formula units (Z) per crystallographic cell. In this structure, both Zn and W

3
cations have octahedral oxygen coordination and each octahedron shares two corners
with its neighbours. In particular, the WO6 octahedra are highly distorted since two of
the W-O distances are much larger than the other four distances.
High-pressure research has proved to be an efficient tool to improve the
understanding of the main physical properties of AWO4 compounds. Although there is
abundant literature on high-pressure studies in these materials, much of the research has
been carried out on scheelite-structured compounds like CaWO4, SrWO4, BaWO4 and
PbWO4 [11 – 24]. These studies have been recently reviewed [25] and have established
that all the members of the scheelite subfamily of tungstates undergo a sequence of
pressure-driven structural phase transitions with space-group changes I41/a →
I2/a → P21/n in good agreement with the conclusions drawn from the application of the
Bastide’s diagram [26] to ABO4 compounds [23, 25]. Additionally, optical-absorption
measurements on PbWO4 [27] and luminescence studies on SrWO4 [28, 29] showed
that the electronic structure of scheelite tungstates is also strongly affected by pressure.
Given the structural differences between wolframite and scheelite [9], their
structures are expected to be modified in a different way upon compression [30].
However, very little information currently exists on how the crystal structures of
ZnWO4 and isostructural tungstates (e.g. CdWO4 and NiWO4) are affected by pressure.
Only a couple of works reporting Raman measurements under pressure in CdWO4 up to
40 GPa [31] and in ZnWO4 up to 24 GPa [32] have been performed. Some
contradictions and many unanswered questions arise from the information reported in
these two works. For example, ZnWO4 was found to remain stable in the wolframite
structure up to 24 GPa [32], while two phase transitions were reported in CdWO4 at 10
GPa and 20 GPa [31]. In order to improve the knowledge of the physical properties of
wolframite-type tungstates, as part of our project to study the structural stability of

4
orthotungstates, we have carried out Raman spectroscopy measurements on ZnWO4 up
to 45 GPa. The obtained results are interpreted on the basis of first-principles total-
energy and lattice-dynamics calculations. The technical aspects of the experiments and
calculations are described in Sections II and III. The results are presented and discussed
in Sec. IV. Finally, we present the conclusions of this work in Sec. V.
II. Experimental details
The samples used in the present experiments were obtained from a wolframite-
type ZnWO4 single crystal grown by the Czochralski method [33]. In order to get a
high-quality crystal of ZnWO4, the used raw materials such as ZnO and WO3 must be of
high purity. The raw materials used were ZnO (99.9%) and WO3 (99.9%). The initial
compounds were mixed in a carnelian bowl and sintered for almost 3 days at 1320 K.
Then the charge was deposited in a Pt crucible bowl of ∅55x30 mm2 and placed in a
DJL-400 furnace. With the Pt wire rotating at a rate of 12 rpm and a pulling rate of 1.2
mm/h, the crystal was grown. When the procedure was over, the crystal was drawn out
and cooled down to room temperature (RT) at a rate of 10–30 °C/h. The obtained
crystal was optically transparent and colour free and x-ray diffraction measurements at
ambient conditions showed that its diffraction pattern was in agreement with that of
sanmartinite. The refined unit-cell parameters (a = 4.680 Å, b = 5.712 Å, c = 4.933 Å, β
= 90.3°) and atomic positions compare well with earlier reported data from neutron
powder-diffraction [34] (see Table I).
Two different samples were used for our Raman measurements under pressure.
Sample # 1 was a 10 µm-thick plate cleaved along the {010} plane [35] from a ZnWO4
single crystal. It was pressurized up to 21 GPa with a 16:3:1 methanol-ethanol-water
mixture as pressure-transmitting medium. Sample #2 consisted in a pre-pressed pellet
prepared using a finely ground powder obtained from the single crystal of ZnWO4. It

5
was pressurized up to 45 GPa with argon (Ar) to ensure better quasi-hydrostatic
conditions [36, 37]. The pressure was determined by the ruby fluorescence technique
[38] using the pressure scale recalibrated by Dewaele et al. [39]. RT Raman
experiments were performed in backscattering geometry using the 488 nm (2.54 eV)
line of an Ar+-ion laser with a power of less than 100 mW before the DAC to avoid
sample heating. Laser heating of the sample is negligible in the whole pressure range
covered by our experiments because the laser energy is always below the band-gap of
ZnWO4 in both the low and high pressure phases. Note that in wolframite ZnWO4 the
band-gap is Eg = 4 eV [7] and its pressure coefficient is positive (dEg/dP = 10 meV/GPa)
[40], and that Eg is not expected to close more than 1 eV at the pressure-induced phase
transition [27]. A Mitutoyo 20x long-working distance objective was employed for
focusing the laser on the sample and for collecting the Raman spectra. The dispersed
light was analyzed with a Jobin-Yvon T64000 triple spectrometer equipped with a
confocal microscope in combination with a liquid nitrogen-cooled multi-channel CCD
detector. The spectral resolution was better than 1 cm-1 and Ar and He plasma lines were
used to calibrate the Raman and photoluminescence spectra.
III. Calculation technique
Total-energy calculations and lattice-dynamics calculations were done within the
framework of the density-functional theory (DFT) and the pseudopotential method
using the Vienna ab initio simulation package (VASP) of which a detailed account can
be found in Ref. 41 and references therein. The exchange and correlation energy was
initially taken in the generalized-gradient approximation (GGA) according to Perdew-
Burke-Ernzerhof [42] (PBE) prescription. The projector-augmented wave (PAW)
scheme [43] was adopted and the semicore 5p electrons of W were dealt with explicitly
in the calculations. The set of plane waves used extended up to a kinetic energy cutoff

6
of 500 eV. This large cutoff was required to deal with the O atoms within the PAW
scheme to ensure highly converged results. The Monkhorst-Pack grid used for
Brillouin-zone integrations ensured highly converged results (to about 1 meV per
formula unit). We use 24 k-points, 26 k-points, 22 k-points and 6 k-points to study the
wolframite, CuWO4-type, β-fergusonite, and Cmca structures, respectively. At each
selected volume, the structures were fully relaxed to their equilibrium configuration
through the calculation of the forces on atoms and the stress tensor – see Ref. 19. In the
relaxed equilibrium configuration, the forces are less than 0.002 eV/A and the deviation
of the stress tensor from a diagonal hydrostatic form is less than 1 kbar (0.1 GPa). The
highly converged results on forces are required for the calculation of the dynamical
matrix using the direct force constant approach (or supercell method) [44]. The
construction of the dynamical matrix at the Γ point is particularly simple and involves
separate calculations of the forces in which a fixed displacement from the equilibrium
configuration of the atoms within the primitive unit cell is considered. Symmetry aids
by reducing the number of such independent distortions, reducing the amount of
computational effort in the study of the analyzed structures considered in our work.
Diagonalization of the dynamical matrix provides both the frequencies of the normal
modes and their polarization vectors, it allows to us to identify the irreducible
representation and the character of the phonon modes at the zone center.
IV. Results and discussion
A. Raman measurements of the low-pressure phase
A group-theoretical analysis of the wolframite structure of ZnWO4 yields 36
lattice modes at the Γ point: 8 Ag + 10 Bg + 8 Au + 10 Bu, with the 18 even (g)
vibrations being Raman active modes: 8 Ag + 10 Bg. Symmetry assignments of the
modes in the wolframite structure have been previously made for all the eighteen

7
phonons by applying polarization selection rules in ZnWO4 [32, 45, 46]. The symmetry
assignments reported in Ref. 46 are shown in Table II and have been confirmed by our
ab initio calculations, as we will discuss latter. In scheelite-type AWO4 compounds it
has been proved that one can distinguish two types of vibrational modes: internal and
external modes with respect to the WO4 tetrahedra. The internal modes correspond to
normal motions of atoms inside the WO4 tetrahedra, while the external modes involve
motions of WO4 tetrahedra against the A atom. It is expected that the phonon
frequencies of the internal modes will be higher that those of the external modes
because the internal covalent bonding within the WO4 tetrahedra is stronger than the
external lattice binding. Due to the incompressibility of the WO4 tetrahedra, it is also
expected that the Grüneisen parameters of the internal modes were smaller than
those of the external modes. Out of the internal modes, there are four
stretching modes arising from each of the four W-O bonds in the WO4 tetrahedra.
A similar reasoning can be applied to AWO4 wolframites assuming the
incompressibility of WO6 octahedra with respect to the ZnO6 octahedra.
Therefore, one would expect six internal stretching modes arising from each of
the six W-O bonds in the WO6 octahedra. These six internal stretching modes
have been assigned in the literature by means of pressure and temperature
dependent Raman studies and by comparison with other compounds [32, 45, 46].
However, there are important contradictions among different authors on this
assignment.
Figure 2 shows the RT Raman spectra of sanmartinite measured in sample #2 at
selected pressures up to 40.2 GPa. The Raman spectra should correspond to a mixture
of polarizations because of the use of a powder sample. In Fig. 2, it can be seen that up
to 33.3 GPa it is possible to clearly distinguish the eighteen Raman modes of wolframite

8
ZnWO4. Table II summarizes the phonon frequencies we measured at ambient pressure
(0.0001 GPa) and compared them with those reported in the literature and those we
calculated using ab initio lattice dynamics. The agreement between our results and those
previously published [32, 45, 46] is quite good. Table II also summarizes the pressure
coefficients (dω/dP) of the Raman modes of sanmartinite, and their Grüneisen
parameters ( 0 / . /B d dPγ ω ω= , where B0 is the bulk modulus). Figure 3 shows the
pressure evolution of the wolframite phonons extracted from the two different samples
we studied. Results obtained from the two samples agree very well among themselves.
From our experiments we determine slightly different pressure dependences for the
Raman phonons than Perakis et al. [32]. In fact, for three phonons (Ag mode near 342
cm-1, Bg mode near 313 cm-1, and Bg mode near 190 cm
-1) our pressure coefficients
almost double the values previously reported (see Table II). At present we have no
explanation for the observed differences in the pressure coefficients between the two
high-pressure works. However, the fact that our ab initio calculations are in much better
agreement with our measurements (see Table II) gives additional support to the
accuracy of our measurements.
In order to calculate the mode Grüneisen parameters in wolframite ZnWO4 its
bulk modulus at zero pressure is needed. Since this magnitude has not been
experimentally determined yet, we used the value we obtained from our ab initio
calculations (B0 = 140 GPa) to calculate the mode Grüneisen parameters reported in
Table II. The bulk modulus of AWO4 wolframite tungstates can be also estimated from
the cation formal charge of the element A and the mean A-O distance using the
empirical law reported in Ref. 17. This law was originally established for ABX4
compounds with the scheelite, zircon or similar structures, in which the BX4 tetrahedral
units have a very low polyhedral compressibility. However, as a first approximation, the

9
same law can also be applied to wolframite compounds since in these compounds the
WO6 octahedra are significantly less compressible than the AO6 octahedra [47]. Within
this framework, we obtain for ZnWO4 B0 = 130 ± 8 GPa and for CdWO4 B0 = 120 ± 8
GPa. The second value is in good agreement with the bulk modulus obtained from the
low-pressure data reported by Macavei and Schulz [47], confirming the predictive
capability of the model developed by Errandonea et al. [17]. The obtained bulk modulus
for ZnWO4 (130 GPa) is close to our theoretical calculations (140 GPa).
In a first attempt to identify the six internal stretching modes of the W-O atoms
in the distorted WO6 octahedra of ZnWO4, Liu et al. assigned them to the modes at 906,
787 and 407 cm-1 on the basis of the bond lengths and Raman frequencies in the WO6
group [45]. Afterwards, Wang et al. assigned the internal stretching modes to the
phonons observed near 906 cm-1, 787 cm-1, 709 cm-1, 407cm-1, 342 cm-1, and 190 cm-1
on the basis of the temperature dependence of the Raman frequencies [46]. However,
this assignment is in contradiction with the fact that the frequencies of the internal
modes are expected to be higher than those of the external modes. These authors argue
in favour of their assignment that the oxygen sharing between WO6 and ZnO6 octahedra
may cause a considerable overlap in the frequency range for the two types of vibrations.
This overlapping between internal and external modes was already discussed in
scheelite tungstates and molybdates by Tarte and Liegeois-Duyckaerts, who claimed
that no clear distinction can be made between internal and external modes [48, 49].
More recently, Perakis et al. [32] based upon high-pressure Raman-spectroscopy
measurements corrected the previous assignment for the internal stretching modes
including the phonon at 677 cm-1 and not the phonon at 190 cm-1. Our measurements
and calculations support this correction, but also suggest that the Ag phonon at 545 cm-1
is an internal stretching mode in contrast to the Ag phonon at 342 cm-1 previously

10
proposed. The new assignment of the internal stretching modes can be seen in Table II.
It is worth commenting here, that after the assignment we proposed for the internal
stretching modes, they consist of the four Ag modes and the two Bg modes with the
highest frequencies, which is in fully agreement with the idea that in AWO4 compounds
the internal stretching modes are the highest in frequency [19, 20]. As we will discuss
later this conclusion is also supported by our lattice-dynamics calculations.
Recently, the assignment of the internal stretching modes has been obtained in
scheelite-structured orthotungstates after relating the frequencies (ω) of the stretching
W-O modes inside the WO4 tetrahedra with the Pauling’s bond strengths (S) [19, 20].
Using the same approach of Hardcastle and Wachs for tungsten wolframites [50], we
can also obtain the Pauling’s bond strengths in valence units (v.u.) from the stretching
W-O mode frequencies (given in cm-1), which for tungsten oxides is [19, 20]:
SW-O = [0.27613 ln (25823/ω)]-6 (1)
Thus, it is possible to estimate the formal valence of the W ion in ZnWO4 if we consider
all the stretching frequencies of the internal modes of the WO6 octahedra. By taking as
these frequencies those we proposed (see Table II), and considering that the
coordination of W in the wolframite structure is 4 + 2 = 6, we get the estimated total
valence of 0.442 + 0.684 + 0.969 + 1.044 + 1.244 + 1.598 = 5.981 (in v.u.) in perfect
agreement with the formal valence of the W ion. This fact gives additional support to
the new assignment of the internal stretching modes we are proposing here. Following
the same procedure, we can suggest that the internal stretching modes in wolframite
CdWO4 and NiWO4 are at: 900, 775, 710, 690, 550, and 390 cm-1 (CdWO4), and 890,
775, 691, 678, 556, and 424 cm-1 (NiWO4).

11
B. Raman measurements of the high-pressure phase
In Fig. 2, it is possible to see that some changes take place in the Raman spectra
from 30.6 to 40.2 GPa. First we observed the appearance of eight new peaks (depicted
by ticks in Fig. 2) in addition to the eighteen wolframite peaks at 30.6 GPa. In
particular, the new peak located around 900 cm-1 is quite strong. At 33.3 GPa new peaks
emerge, reaching the total number of fourteen, while the wolframite peaks can still be
clearly observed. It also becomes clear that the strong and broad new peak, located
around 900 cm-1, consists of a triplet. At 36.5 GPa most of the wolframite peaks become
very weak and only some of them (e.g. the strongest peak of wolframite located at 1030
cm-1 at this pressure) can be observed. At this pressure the new peaks are already
sixteen. At 40.2 GPa, all the wolframite peaks have disappeared and only the sixteen
new peaks are present. Table III gives the frequencies of the new peaks observed at
40.2 GPa and their pressure coefficients. We think that the changes in the Raman
spectra are caused by the occurrence of a pressure-induced phase transition. The onset
of the transition is located at 30.6 GPa, and a large coexistence region, of both the low-
and high-pressure phases, is observed between 30.6 and 36.5 GPa. The phase transition
is fully completed at 40.2 GPa and it is fully reversible with very little hysteresis, as can
be seen in the spectrum collected at 0.7 GPa after pressure release. In this spectrum all
the observed peaks can be assigned to the eighteen Raman modes of wolframite.
Very similar changes to those we observed in ZnWO4 from 30.6 GPa to 40.2
GPa were found by Jayaraman et al. in CdWO4 between 20 and 28 GPa [31]. In
CdWO4, also sixteen modes can be observed in the high-pressure phase, and they are
located at similar frequencies as those we detected for the high-pressure phase of
ZnWO4. The phonons for the high-pressure phase of both compounds can be compared
in Table III. It can be seen that the phonons of CdWO4 resemble those of ZnWO4, but

12
shifted to lower frequencies, in both the high-pressure and low-pressure phases, due to
the larger atomic mass of the Cd cation (see Tables II and III and Ref. 31). A similar
mass-dependent shift is observed in the Raman spectra of alkaline-earth tungstates
following the series Ba, Sr, Ca [19, 20]. The similitude of the Raman spectra reported
by us for ZnWO4 at 40.2 GPa and that reported by Jayaraman for CdWO4 at 35 GPa
suggests that the structure of the high-pressure phases of ZnWO4 and CdWO4 can be the
same, in a similar way to what is observed in scheelite tungstates [18 - 25]. A
remarkable feature is that the Ag mode that represents the totally symmetric W-O
stretching vibration (ω = 907 cm-1 at ambient pressure and ω = 1013 cm-1 at 30.6 GPa)
in wolframite ZnWO4 drops by about 110 cm-1 in ZnWO4 and 120 cm
-1 in CdWO4 at
the phase transition (see Fig. 3 and Ref. 31). This fact suggests that a W-O coordination
increase takes place at the phase transition. When the coordination of W increases, the
W-O bond lengths usually increase too, and the result is a drop in the frequency of the
internal stretching modes. This kind of behavior is observed for instance in Al2(WO4)3
[51] and in the scheelite tungstates [19, 20] after a pressure-induced phase transition that
imply an increase of the W-O coordination from tetrahedral to octahedral. Another
interesting feature observed in the Raman spectra of the high-pressure phases of ZnWO4
and CdWO4 is the appearance of new modes in the phonon-gap region of their low-
pressure phases (e. g. between 470 and 600 cm-1 in ZnWO4 at 30 GPa, see Fig. 3; for
CdWO4 see Fig. 2 of Ref. 31). These two facts will be very helpful to identify the
structure of the high-pressure phase of ZnWO4.
Before closing this subsection, we would like to mention that a formation of
domains has been observed around 12 GPa in the single crystalline sample (#1). This
domain formation occurs together with a relative change of the phonon intensity. In
particular, the Bg modes, which were much weaker than the Ag modes because of

13
polarization selection rules [52] below 12 GPa, gain in intensity. A similar behavior was
described for single crystalline CdWO4 near 10 GPa [31] and was interpreted as a phase
transition, even though it did not cause any evident change in the Raman spectra or in
the pressure evolution of the phonons. The attribution of the domain formation to
structural phase transitions is challenged by the fact that in powder ZnWO4, Perakis et
al. [32] did not observe any phase transition up to 24 GPa and we did not observe the
onset of it up to 30.6 GPa. A different and more suitable interpretation of this
phenomenology could be based on the the formation of permanent defects on the
sample, as observed recently in optical-absorption measurements in ZnWO4 near 12
GPa [40]. The presence of these defects will cause a breaking of the local structural
symmetry producing the increase of the intensity of the Bg modes. The fact that this
increase is gradual, and simultaneous with the domain formation, suggests that the
domains, observed by us in the single crystal of ZnWO4 and by Jayaraman et al. in
single crystals of CdWO4, are the consequence of the gradual introduction of defects,
which can be precursors of the phase transition observed at much higher pressures [53].
Indeed, the introduction of such defects, which leads to a structure with domains
separated by antiphase boundaries was observed in wolframite-structured FeNbO4 [54].
Finally, it is well-known that in scheelite-structured ABX4 compounds, the
pressure at which the low-pressure phase becomes unstable, is correlated with the
BX4/A radii ratio; the larger this ratio, the higher the transition pressure [30]. Applying
the relationship proposed in Ref. 30 to wolframite-structured ZnWO4 and CdWO4 we
estimate that a pressure-induced phase transition should be expected somewhere beyond
24 GPa and 18 GPa, respectively. These pressures, are close to the pressure were the
onset of the phase transition is observed in the Raman experiments. This fact supports
that only one phase transition is observed in ZnWO4 and CdWO4, being the onset of the

14
transition at 30.6 GPa and 20 GPa, respectively, and the transition completed at 40.2
GPa and 30 GPa, respectively.
C. Ab initio calculations
In a recent work, Manjón et al. have shown experimentally with the help of ab
initio calculations that pressure-induced phase transitions in ABX4 compounds, in
particular in scheelite tungstates and zircons, follow the phenomenological North-East
rule in Bastide’s diagram [23]. In this sense, we present now the results from our
theoretical total-energy calculations of several structural phases of ZnWO4 in order to
study the structural stability of the wolframite structure and its possible high-pressure
phases. Along with the wolframite structure (SG: P2/c) [10], we have considered other
structures, paying special attention to phases located to the North-East with respect to
wolframite in Bastide’s diagram, on account of their observation or postulation in
previous high-pressure works for related compounds: CuWO4-type (SG: 1P ) [55],
orthorhombic-disorder wolframite (SG: Pbcn) [56], M-fergusonite (SG: I2/a) [57], M’-
fergusonite (SG: P21/c) [58], YNbO4-type β-fergusonite (SG: C2/c) [59], monoclinic-
distorted rutile (SG: P2/c) [60], scheelite (SG: I41/a) [61], HgWO4-type (SG: C2/c)
[62], Cmca (SG: Cmca) [18], BaWO4-II-type (SG: P21/n) [63], baddeleyite (SG: P21/c)
[64], and α-SnWO4 (SG: Pnna) [65]. Figure 4 shows the energy-volume curves for the
different structures of ZnWO4 from which the relative stability and coexistence
pressures of the phases can be extracted by the common-tangent construction [66]. In
this figure, we only reported those structures that play a relevant role in the high-
pressure structural behavior of ZnWO4. From Figure 4 it is deduced that the wolframite
phase is stable at zero and low pressure up to 39 GPa, with an equation of state (EOS)
with parameters V0= 137.4 Å3, B0= 140 GPa, and B0’= 4.57, where the parameters V0,
B0, and B0’ are the zero-pressure volume, bulk modulus, and pressure derivative of the

15
bulk modulus, respectively. These parameters were obtained from our calculations
using a third-order Birch-Murnaghan EOS [67]. In the inset of Fig. 4 we show the
calculated P-V relationship obtained for wolframite ZnWO4, which corresponds to the
above reported EOS. The obtained lattice parameters at ambient pressure compare well
with the experimental results with differences within the typical reported systematic
errors in DFT-GGA calculations (see Table I). A similar degree of agreement exists for
the calculated values of the internal parameters of the wolframite phase.
At low pressures there are three structures in close competition with the
wolframite structure: the triclinic 1P , the baddeleyite, and the distorted-rutile structures.
The triclinic CuWO4-type structure, is known to be a metastable phase in wolframite-
type ZnMoO4 [68]. In ZnWO4, the CuWO4-type structure is expected to become stable
at expanded volumes (i.e. negative pressures) according to the phase-transition
systematics established by Bastide [23, 26] based on the ionic radio ratios of the A and
B cation and the X anion in ABX4 compounds. Therefore, it is not strange that this
structure is competitive with wolframite. As a matter of fact, the P2/c-to- 1P transition
is observed in solid solutions of sanmartinite and cuproscheelite (CuWO4) at around
Zn0.78Cu0.22WO4 [69]. This fact suggests that the 1P -to-P2/c phase transition could be
observed in CuWO4 upon compression. This picture is consistent with the idea that
under pressure the electronic structure of an element of the Periodic Table becomes
similar to that of the next-row element as a consequence of the pressure-induced sp-d
electron transfer [70, 71]. In addition, the group-subgroup relationship existent between
the 1P and P2/c space groups makes the proposed transition quite reasonable from the
crystallochemical point of view [72]. On the other hand, the baddeleyite and distorted-
rutile structures have been also observed as metastable phases in compounds
16
isostructural to ZnWO4, e.g. in FeNbO4 [60]. Therefore, it is not strange that these
structures are in close competition with the wolframite structure at low pressures.
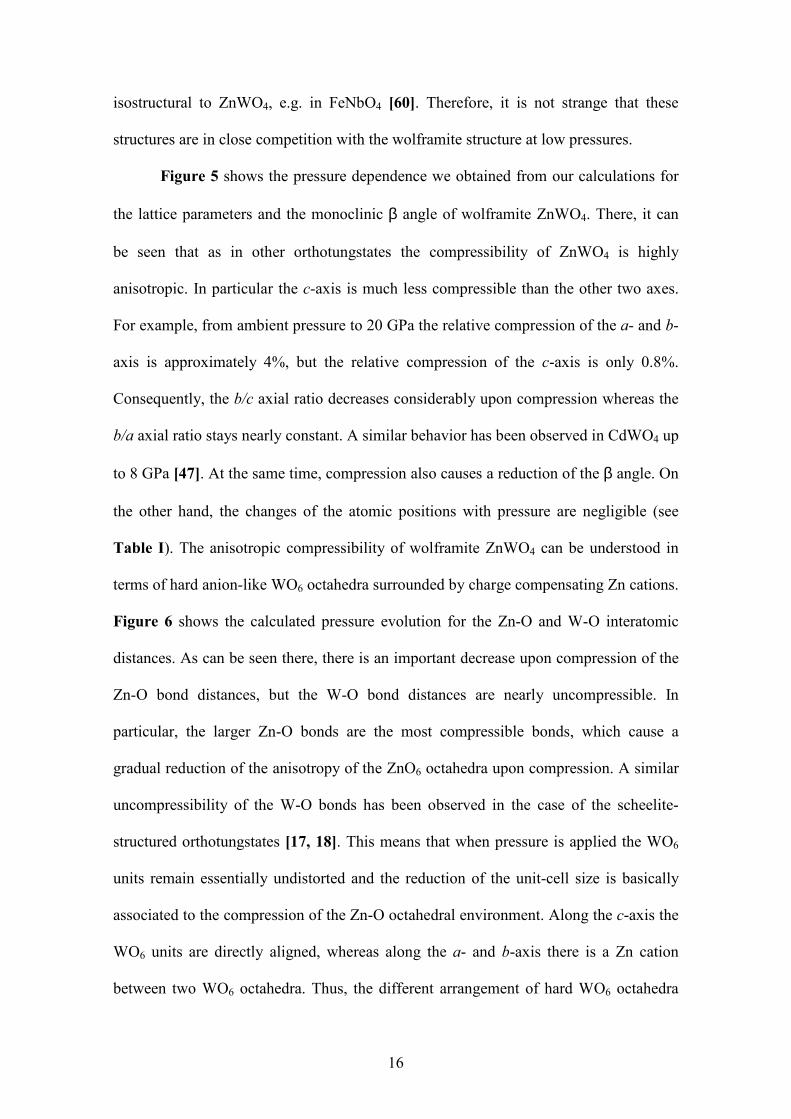
Figure 5 shows the pressure dependence we obtained from our calculations for
the lattice parameters and the monoclinic β angle of wolframite ZnWO4. There, it can
be seen that as in other orthotungstates the compressibility of ZnWO4 is highly
anisotropic. In particular the c-axis is much less compressible than the other two axes.
For example, from ambient pressure to 20 GPa the relative compression of the a- and b-
axis is approximately 4%, but the relative compression of the c-axis is only 0.8%.
Consequently, the b/c axial ratio decreases considerably upon compression whereas the
b/a axial ratio stays nearly constant. A similar behavior has been observed in CdWO4 up
to 8 GPa [47]. At the same time, compression also causes a reduction of the β angle. On
the other hand, the changes of the atomic positions with pressure are negligible (see
Table I). The anisotropic compressibility of wolframite ZnWO4 can be understood in
terms of hard anion-like WO6 octahedra surrounded by charge compensating Zn cations.
Figure 6 shows the calculated pressure evolution for the Zn-O and W-O interatomic
distances. As can be seen there, there is an important decrease upon compression of the
Zn-O bond distances, but the W-O bond distances are nearly uncompressible. In
particular, the larger Zn-O bonds are the most compressible bonds, which cause a
gradual reduction of the anisotropy of the ZnO6 octahedra upon compression. A similar
uncompressibility of the W-O bonds has been observed in the case of the scheelite-
structured orthotungstates [17, 18]. This means that when pressure is applied the WO6
units remain essentially undistorted and the reduction of the unit-cell size is basically
associated to the compression of the Zn-O octahedral environment. Along the c-axis the
WO6 units are directly aligned, whereas along the a- and b-axis there is a Zn cation
between two WO6 octahedra. Thus, the different arrangement of hard WO6 octahedra

17
along the a-, b-, and c-axis accounts for the different compressibility of the three unit-
cell axes. The uncompressibility of the WO6 octahedra in wolframite-structured
orthotungstates, which is similar that of WO4 tetrahedra in scheeliite-structured
orthotungstates, explains why the empirical relation proposed in Ref. 17 for the bulk
modulus of scheelite-structured AWO4 compounds also works accurately for wolframite
ZnWO4 and CdWO4.
As pressure increases, the wolframite structure becomes unstable against a
monoclinic β-fergusonite-type structure. Theoretically, this structure only emerges as a
structurally different and thermodynamically stable phase above a compression
threshold of about 39 GPa. At the transition pressure the atomic volume of the
wolframite phase is 114.89 Å3 (two formula units per unit cell) and the atomic volume
of the β-fergusonite phase is 215.54 Å3 (four formula unit per unit cell). Thus the
occurrence of the phase transition implies a large volume collapse of about 6%, which
suggest that the transition is a first-order reconstructive transformation. The structural
parameters obtained for the β-fergusonite structure at 44.1 GPa are given in Table IV
and a perspective drawing of it is shown in Figure 1(b). As can be seen in the figure, in
the high-pressure phase the packing is more compact than in the wolframite structure,
being in the β-fergusonite-type structure the W atoms coordinated by four O atoms at
1.84 Å and four additional oxygens at 2.64 Å. On the other hand, in the high-pressure
phase the Zn atoms are coordinated by 4 four atoms at a short distance of about 1.95 Å
and by four O atoms at a longer distance of about 2.04 Å, forming a distorted
dodecahedra. This fact implies an increase of the W-O coordination from 4 + 2 to 4 + 4,
which is in good agreement with the drop of the W-O stretching mode observed at the
phase transition. According with our calculation the monoclinic β-fergusonite phase of
ZnWO4 remains as the most stable phase up to 57.6 GPa. On further increase of

18
pressure we found that the orthorhombic Cmca structure that we proposed in a previous
study for CaWO4 and SrWO4 [18] becomes favoured beyond 57.6 GPa. Unfortunately,
our experiments could not be extended up to this pressure in order to check our
theoretical prediction. The crystal parameters of the second high-pressure phase are
given in Table V and a perspective drawing of it is shown in Figure 1(c). The most
interesting feature of this phase is that it implies a W-O coordination increase from 4 +
4 to 8 and a Zn-O coordination increase from 8 to 7 + 4.
The high-pressure structural sequence we are reporting here (wolframite → β-
fergusonite → Cmca) can be rationalized by means of the phase diagram proposed by
Bastide [23, 26]. In this diagram the ABX4 compounds are located according with their
cation-to-anion radii ratios (rA/rX, rB/rX) and expected to undergo pressure-induced
phase transitions following the north-east rule; i.e. a given compound is expected to take
the structure of a compound with larger cation-to-anion radii ratios. According with this
picture, ZnWO4 could probably transform under pressure to the structure of YNbO4 (β-
fergusonite) and after that to an orthorhombic Cmca structure similar to that of BaMnF4
and SrUO4. Please note that it is possible to transform wolframite into β-fergusonite by
means of a klassengleiche transformation and this structure into Cmca by means of
translationengleiche transformation. Therefore, given the group relationships existent
among the three structures, the structural sequence we are proposing here for ZnWO4 is
definite possible on crystallographic grounds. It is important to mention here that the
high-pressure β-fergusonite phase of ZnWO4 is closely related from a structural point of
view to the high-pressure M-fergusonite phase found in scheelite-structured AWO4
compounds [17, 18]. β-fergusonite can be obtained by means of symmetry operations
from wolframite and M-fergusonite can be obtained by means of symmetry operations
from scheelite [73]. Both fergusonite structures are not isostructural but are closely

19
related because both structures consist of zigzag chains of W polyhedra with eight
coordinated A atoms. Apparently, both in wolframite- and scheelite-structured
compounds the fergusonite phases act as a bridge phase between a structure with a low
W coordination (like scheelite and wolframite) and another with high W coordination,
like the Cmca structure.
Table II shows the calculated frequencies and pressure coefficients for the
Raman modes of wolframite ZnWO4. The agreement between calculations and
experiments for the low-pressure phase is quite good, which gives credibility to the
lattice-dynamics calculations we performed for the high-pressure phase of ZnWO4. It is
important to note here that the calculated eigenmodes for wolframite ZnWO4 indicate
that there are modes which involve basically a movement of the WO6 octahedra as rigid
units and other that imply internal vibrations of these octahedra. Therefore, despite
external and internal modes show similar Grüneisen parameters and this prevents a
simple distinction between internal and external modes, as in scheelite-structured
compounds, this distinction can be still applied to wolframite-structured compounds as
we did along the paper. The isolation of the WO6 octahedra is also evident from the
uncompressibility of the W-O already described. According with our lattice-dynamics
calculations the internal stretching modes are the same we proposed in Section II.A.
Let us know discuss the lattice-dynamic calculations performed for the high-
pressure phase of ZnWO4. The present Raman measurements are in good agreement
with the results obtained from our calculations beyond 39 GPa. In particular, the Raman
spectra collected for the first high-pressure phase are best explained for the β-
fergusonite structure. Other candidate structure cannot give account of the measured
Raman spectra. In the first place, the scheelite structure in tungstates has only thirteen
Raman active modes and has a phonon gap from 400 cm-1 to 700 cm-1 [19, 20]. So it

20
cannot explain the Raman spectra we observed in the high-pressure phase and therefore
is discarded as a candidate structure for the high-pressure phase. In the second place, the
M-fergusonite and M’-fergusonite structures in tungstates and the HgWO4 structure
have eighteen Raman active modes [74], but they have their strongest internal stretching
mode well beyond 900 cm-1; i.e., as high as those in the scheelite and wolframite phases
[19, 20]. So these structures cannot explain the drop we observed in the stretching mode
basically because they do not imply an increase in the W-O coordination. In addition,
these structures usually also have a phonon gap, which is not present in our Raman
spectra. Finally, we have found that the β-fergusonite structure gives a phonon spectrum
that can explain reasonably well our experimental results. According to group-
theoretical considerations the β-fergusonite has 18 Raman active modes at the Γ point: 8
Ag + 10 Bg. The frequencies and mode assignment of the different phonon calculated for
this structure at 40 GPa are given in Table III. According with the calculations there
are always two Bg modes very close in frequency to each other, but lattice-dynamics
calculations apparently tend to underestimate the frequency splitting between Bg modes
in fergusonite structures [19, 20]. However, the calculated small splitting between Bg
modes could explain why in the experiments we have only found sixteen modes, since
some of the Bg modes could be degenerated within the accuracy of the experiments. The
qualitative agreement between the calculated and measured phonon frequencies and
pressure coefficients is reasonably good. Indeed, among the different structures
considered in the calculation, the β-fergusonite structure is the only one that gives a
good quantitative agreement with the experiments. In addition, Raman spectra measured
in the β-fergusonite phase of YNbO4 [75] resemble very much those measured for the
high-pressure phases of ZnWO4 and CdWO4. Therefore, we conclude that we found

21
enough evidence to propose that the high-pressure phase of wolframite-structured
AWO4 compounds have a distorted β-fergusonite structure.
V. Conclusions
We have performed RT Raman scattering measurements under pressure in
ZnWO4 up to 45 GPa. The frequency pressure dependence of all first-order modes of
the wolframite phase have been measured up to the completion of the scheelite-to-β-
fergusonite phase transition around 40 GPa. This value of the transition pressure is in
good agreement with the estimated transition pressure (39 GPa) according to our ab
initio total-energy calculations. Our measurements show that the transition to the β-
fergusonite phase starts at 30.6 GPa but it is not completed up to 40.2 GPa. The phase
transition is reversible and occurs with a volume collapse of about 6%. The ab initio
calculations also allows us to determine the pressure evolution of the unit-cell
parameters of wolframite ZnWO4, being observed that its compression is highly
anisotropic. This behavior is related to the different compressibility of Zn-O and W-O
bonds, being the last ones much more rigid than the first ones. The calculations also
suggest the occurrence of a second pressure-induced phase transition from the β-
fergusonite structure to an orthorhombic Cmca structure. Additionally, we have
performed ab initio lattice dynamics calculations for ZnWO4 at selected pressures in the
wolframite and β-fergusonite phases. Our calculated mode frequencies in both
structures agree with the frequencies of the observed Raman modes and have allowed
the assignment and discussion of the nature of the modes.
Acknowledgments
The authors thank A. Cantarero (ICMUV, Universidad de Valencia) for
providing us access to the experimental Raman setup. This work was made possible
through financial support of the MCYT of Spain under grants No. MAT2007-65990-

22
C03-01, MAT2007-65990-C03-03, No. MAT2006-02279, and CSD2007-00045, of the
Generalitat Valenciana under grant No. ACOMP06/81 and GV06/151, and of the
Nature Science Foundation of the Fujian Province of China under grant No.
2005HZ1026. D.E. acknowledges the financial support from the MCYT of Spain
through the “Ramon y Cajal” program. F.J.M. acknowledges the financial support from
“Vicerrectorado de Innovación y Desarrollo de la UPV” through project UPV2008-
0020. T.Y. also acknowledges the support received through the great project of FJIRSM
(SZD08001-2).
References
[1] T.A. Edison, Nature (London) 53, 470 (1896).
[2] W. Chen, Y. Inagawa, T. Omatsu, M. Tateda, N. Takeuchi, and Y. Usuki, Opt.
Commun. 194, 401 (2001).
[3] P. Lecoq, I. Dafinei, E. Auffray, M. Scheegans, M. V. Korzhik, O. V. Missetvich, V.
B. Pavlenko, A. A. Fedorov, A. N. Annenkov, V. L. Kostylev, and V. D. Ligun,
Nucl. Instrum. Methods Phys. Res. A 365, 291 (1995).
[4] M. Ishi and M. Kobayashi, Prog. Cryst. Growth Charact. Mater. 23, 245 (1991).
[5] N. Klassen, S. Shmurak, B. Red’kin, B. Ille, B. Lebeau, P. Lecoq, and M.
Schneegans, Nucl. Instrum. Methods Phys. Res. A 486, 431 (2002).
[6] M. Bravin, M. Bruckmayer, C. Bucci, S. Cooper, S. Giordano, F. von Feilitzsch, J.
Hohne, J. Jochum, V. Jorgens, R. Keeling, H. Kraus, M. Loidl, J. Lush, J.
Macallister, J. Marchese, O. Meier, P. Meunier, U. Nagel, T. Nussle, F. Probst, Y.
Ramachers, H. Sarsa, J. Schnagl, W. Seidel, I. Sergeyev, M. Sisti, L. Stodolsky, S.
Uchaikin, and L. Zerle, Astropart. Phys. 12, 107 (1999).
[7] M. Itoh, N. Fujita, and Y. Inabe, J. Phys. Soc. Jpn. 75, 084705 (2006).

23
[8] F.A. Danevich, V.V. Kobychev, S.S. Nagorny, D.V. Poda, V.I. Tretyak, S.S.
Yurchenko, and Y.G. Zdesenko, Nucl. Instrum. Methods Phys. Res. A 544, 553
(2005).
[9] A.W. Sleight, Acta Cryst. B 28, 2899 (1972).
[10] M. Daturi, M. M. Borel, A. Leclaire, L. Savary, G. Costentin, J. C. Lavalley, and
B. Raveau, J. Chim. Phys. 93, 2043 (1996).
[11] D. Christofilos, S. Ves, and G. A. Kourouklis, Phys. Status Solidi B 198, 539
(1996).
[12] D. Christofilos, K. Papagelis, S. Ves, G. A. Kourouklis, and C. Raptis, J. Phys.:
Condens. Matter 14, 12641 (2002).
[13] D. Errandonea, M. Somayazulu, and D. Häusermann, Phys. Status Solidi B 231, R1
(2002).
[14] D. Errandonea, M. Somayazulu, and D. Häusermann, Phys. Status Solidi B 235,
162 (2003).
[15] V. Panchal, N. Garg, A. K. Chauhan, Sangeeta, and S. M. Sharma, Solid State
Commun. 130, 203 (2004).
[16] D. Errandonea, Phys. Stat. Sol. B 242, R125 (2005).
[17] D. Errandonea, J. Pellicer-Porres, F. J. Manjón, A. Segura, Ch. Ferrer-Roca, R. S.
Kumar, O. Tschauner, P. Rodríguez-Hernández, J. López-Solano, S. Radescu, A.
Mujica, A. Muñoz, and G. Aquilanti, Phys. Rev. B 72, 174106 (2005).
[18] D. Errandonea, J. Pellicer-Porres, F. J. Manjón, A. Segura, Ch. Ferrer-Roca, R. S.
Kumar, O. Tschauner, J. López-Solano, P. Rodríguez-Hernández, S. Radescu, A.
Mujica, A. Muñoz, and G. Aquilanti, Phys. Rev. B 73, 224103 (2006).

24
[19] F. J. Manjón, D. Errandonea, N. Garro, J. Pellicer-Porres, P. Rodríguez-Hernández,
S. Radescu, J. López-Solano, A. Mujica, and A. Muñoz, Phys. Rev. B 74, 144111
(2006).
[20] F. J. Manjón, D. Errandonea, N. Garro, J. Pellicer-Porres, P. Rodríguez-Hernández,
S. Radescu, J. López-Solano, A. Mujica, and A. Muñoz, Phys. Rev. B 74, 144112
(2006).
[21] D. Christofilos, E. Efthimiopoulos, J. Arvanitidis, K. Papagelis, S. Ves, and G.A.
Kourouklis, High Pres. Res. 26, 421 (2006).
[22] J. Lopez-Solano, P. Rodríguez-Hernández, S. Radescu, A. Mujica, A. Muñoz, D.
Errandonea, F.J. Manjon, J. Pellicer-Porres, N. Garro, A. Segura, Ch. Ferrer-Roca,
R.S. Kumar, O. Tschauner, and G. Aquilanti, Phys. Stat. Sol. B 244, 325 (2007).
[23] F.J. Manjon, D. Errandonea, J. Lopez-Solano, P. Rodríguez-Hernández, S.
Radescu, A. Mujica, A. Muñoz, N. Garro, J. Pellicer-Porres, A. Segura, Ch.
Ferrer-Roca, R.S. Kumar, O. Tschauner, and G. Aquilanti, Phys. Stat. Sol. B 244,
295 (2007).
[24] D. Errandonea, EPL 77, 56001 (2007).
[25] D. Errandonea and F.J. Manjón, Progress in Materials Science 53, 711 (2008).
[26] J. P. Bastide, J. Solid State Chem. 71, 115 (1987).
[27] D. Errandonea, D. Martínez-García, R. Lacomba-Perales, J. Ruiz-Fuertes, and A.
Segura, Appl. Phys. Lett. 89, 091913 (2006).
[28] D. Errandonea, Chaoyang Tu, Guohua Jia, I.R. Martın, U.R. Rodrıguez-Mendoza,
F. Lahoz, M.E. Torres, and V. Lavın, Journal of Alloys and Compounds 451, 212
(2008).

25
[29] F. Rivera-Lopez, I.R. Martin, I. Da Silva, C. Gonzalez-Silgo, U.R. Rodriguez-
Mendoza, V. Lavin, F. Lahoz, S.M. Diaz-Gonzalez, M.L. Martinez-Sarrion, L.
Mestres, J. Fernandez-Urban, High Pres. Res. 26, 355 (2006).
[30] D. Errandonea, F. J. Manjón, M. Somayazulu, and D. Häusermann, J. Solid State
Chem. 177, 1087 (2004).
[31] A. Jayaraman, S.Y. Wang, and S.K. Sharma, Current Science 69, 44 (1995).
[32] A. Perakis, E. Sarantapoulou, and C. Raptis, High Pressure Research 18, 181
(2000).
[33] J. C. Brice and P. A. C. Whiffin, Br. J. Appl. Phys. 18, 581 (1967).
[34] P.F. Schofield, K.S. Knight, S.A.T. Redfern, and G. Cressey, Acta Cryst. B. 53,
102 (1997).
[35] R.J. King, Geology Today 21, 33 (2005).
[36] D. Errandonea, Y. Meng, M. Somayazulu, D. Häusermann, Physica B 355, 116
(2005).
[37] D. Errandonea, R. Boehler, S. Japel, M. Mezouar, and L. R. Benedetti, Phys. Rev.
B 73, 092106 (2006).
[38] H.-K. Mao, P. Bell, J. Shaner, and D. Steinberg, J. Appl. Phys. 49, 3276 (1978).
[39] A. Dewaele, P. Loubeyre, and M. Mezouar, Phys. Rev. B 70, 094112 (2004).
[40] R. Lacomba-Perales, M.Sc. Thesis, Universitat de Valencia (2007).
[41] G. Kresse, Computer Code VASP. See: http://cms.mpi.univie.ac.at/vasp
[42] J. P. Perdew , K. Burke and , M. Ernzerhof, Phys. Rev. Lett. 78, 1396 (1997).
[43] P.E. Blöch, Phys. Rev. B 50, 17953 (1994); G. Kresse and D. Joubert, ibid, 59,
1758 (1999).
[44] K. Parlinski, computer code PHONON. See: http://wolf.ifj.edu.pl/phonon.

26
[45] Y. Liu, H. Wang, G. Chen, Y.D. Zhou, B.Y. Gu and B. Q. Hu, J. Appl. Phys. 64,
4651 (1988).
[46] H. Wang, F.D. Medina, Y.D. Zhou, and Q.N. Zhang, Phys. Rev. B 45, 10356
(1992).
[47] J. Macavei and H. Schulz, Zeitschrift fur Kristallographie 207, 193 (1993).
[48] P. Tarte and M. Liegeois-Duyckaerts, Spectrochim. Acta 28A, 2029 (1972).
[49] M. Liegeois-Duyckaerts and P. Tarte, Spectrochim. Acta 28A, 2037 (1972).
[50] F.D. Hardcastle and I.E. Wachs, J. Raman Spectr. 26, 397 (1995).
[51] N. Garg, V. Panchal, A. K. Tiagi, and S. M. Sharma, J. Sol. State Chem. 178, 998
(2005).
[52] These modes were observed because the polarization is partially lost inside the
DAC if the sample is not oriented perfectly parallel to the diamond anvil surface.
[53] F.J. Manjon, D. Errandonea, A. Segura, J.C. Chervin, and V. Muñoz, High
Pressure Research 22, 261 (2002).
[54] R. Theissmann, H. Ehrenberg, H. Weitzel and H. Fuess, Journal of Materials
Science 37, 4431 (2002).
[55] L. Kihlborg and E. Gebert, Acta Cryst. B 26, 1020 (1970).
[56] F. Laves, Acta Cryst. 17, 1476 (1964).
[57] L.N. Kinzhibalo, V.K. Trunov, A.A. Evdokimov, and V.G. Krongauz,
Kristallografiya 27, 43 (1982).
[58] G.M. Wolten, Acta Cryst. 23, 939 (1967).
[59] W.J. Sun, F.J. Ma, and S.J. Zhuang, Scientia Geologica Sinica 1, 78 (1983).
[60] Y. Sugitani, Y. Susuki, and K. Nagashima, American Mineralogist 70, 856 (1985).
[61] A. Zalkin and D. H. Templeton, J. Chem. Phys. 40, 501 (1964).
[62] W. Jeitschko and A. W. Sleight Acta Crystal. 29, 869 (1973).

27
[63] I. Kawada, K. Kato, and T. Fujita, Acta Crystal. 30, 2069 (1974)
[64] J.D. McCullough and K.N. Trueblood, Acta Crystal. 12, 507 (1959).
[65] W. Jeitschko and A.W. Sleight, Acta Crystal. B 30, 2088 (1974).
[66] A. Mujica, A. Rubio, A. Muñoz, and R. J. Needs, Rev. Mod. Phys. 75, 863 (2003).
[67] F. Birch, J. Geophys. Res. 83, 1257 (1978).
[68] S.C. Abrahams, J. Chem. Phys. 46, 2052 (1967).
[69] P.F. Schofield and S.A.T. Redfern, J. Phys.: Condes. Matter 4, 375 (1992).
[70] D. Errandonea, R. Boehler, and M. Ross, Phys. Rev. B 65, 012108 (2002).
[71] H. L. Skriver, Phys. Rev. B 31, 1909 (1985).
[72] L.E. Depero and L. Sangaletti, J. Sol. State Chem. 129, 82 (1997).
[73] H. Weitzel and A. Schrocke, Zeitschrift fur Kristallographie 152, 69 (1980).
[74] G. Blasse, J. Inorg. Nucl. Chem. 37, 97 (1975).
[75] N. Tomasic, A. Gajovic, V. Bermanec, D. S. Su, M. Rajic Linaric, T. Ntaflos, and
R. Schlogl, Phys. Chem. Minerals 33, 145 (2006).

28
Table I: Experimental and calculated crystal parameters of wolframite ZnWO4. Space
group P2/c, Z = 2. Calculated parameters are given at different pressures.
Neutron Diffraction (Ref. 34)
Ambient Pressure
X-ray Diffraction
(This Work)
Ambient
Pressure
Ab initio
Calculations
(This Work)
Ambient Pressure
Ab initio
Calculations
(This Work)
P = 27.2 GPa
a 4.693 Å 4.680 Å 4.741Å 4.516Å
b 5.721 Å 5.712 Å 5.824 Å 5.521 Å
c 4.928 Å 4.933 Å 4.977 Å 4.799 Å
β 90.632º 90.3º 90.759º 89.899º
Zn Site: 2f
x = 0.5
y = 0.6833
z = 0.25
x = 0.5
y = 0.697
z = 0.25
x = 0.5
y = 0.6811
z = 0.25
x = 0.5
y = 0.6780
z = 0.25
W Site: 2e
x = 0
y = 0.1823
z = 0.25
x = 0
y = 0.178
z = 0.25
x = 0
y = 0.1813
z = 0.25
x = 0
y = 0.1873
z = 0.25
O1
Site: 4g
x = 0.2547
y = 0.3772
z = 0.4005
x = 0.244
y = 0.372
z = 0.394
x = 0.2561
y = 0.3741
z = 0.4025
x = 0.2570
y = 0.3908
z = 0.4101
O2
Site: 4g
x = 0.2171
y = 0.8955
z = 0.4360
x = 0.203
y = 0.904
z = 0.456
x = 0.2153
y = 0.8943
z = 0.4365
x = 0.2292
y = 0.9009
z = 0.4348

29
Table II: Ab initio calculated and experimental zero-pressure frequencies, pressure
coefficients, and Grüneisen parameters of the Raman modes in wolframite ZnWO4. The
asterisks indicate the internal stretching modes. The Grüneisen parameter has been
calculated using the calculated bulk modulus B0= 140 GPa as indicated in the text.
Experimenta Experimentb Theorya
Mode ω
[cm-1]
dω/dP
[cm-1/GPa] γ
ω
[cm-1]
dω/dP
[cm-1/GPa]
ω
[cm-1]
dω/dP
[cm-1/GPa]
Bg 91.5 0.95 1.45 91 1.3 83.7 1.02
Ag 123.1 0.65 0.74 123 1.1 118.6 0.48
Bg 145.8 1.2 1.15 145.5 2.05 137.2 1.33
Bg 164.1 0.72 0.61 163.5 0.85 163.3 0.42
Bg 189.6 0.67 0.49 189.5 0.32 182.2 0.41
Ag 196.1 2.25 1.61 195 3.3 185.7 2.52
Bg 267.1 1.32 0.69 266 1.25 261.2 2.16
Ag 276.1 0.87 0.44 274 0.88 263.7 0.82
Bg 313.1 1.74 0.78 314.5 1 298.3 1.44
Ag 342.1 1.74 0.71 341.5 0.85 324.2 1.7
Bg 354.1 3.87 1.53 355 4.6 342.1 3.3
Ag * 407 1.65 0.57 407.5 1.4 383.8 1.84
Bg 514.5 3.18 0.86 515.5 3.3 481.1 3.1
Ag * 545.5 3 0.77 545 3.4 515.4 3.07
Bg * 677.8 3.9 0.80 677 3.9 635.5 3.9
Ag * 708.9 3.3 0.65 708.5 3.3 678.5 3.24
Bg * 786.1 4.4 0.78 787 4.8 753.3 4.0
Ag * 906.9 3.7 0.57 906 4.1 861.8 3.36
aThis work, bRef. 32.

30
Table III: Frequencies at 40 GPa and pressure coefficients of the Raman modes of the
high-pressure phase of ZnWO4. The frequencies and pressure-coefficients obtained after
ab initio calculations are also given. For comparison, the same data form the high-
pressure phase of CdWO4 is given at 35 GPa [31].
ZnWO4 (40.2 GPa)
Raman
ZnWO4 (40 GPa)
Theory
CdWO4 (35 GPa)
Raman Mode ω
[cm-1]
dω/dP [cm-1/GPa]
ω [cm-1]
dω/dP [cm-1/GPa]
ω
[cm-1]
dω/dP [cm-1/GPa]
Ag 140.1 0.29 141.2 0.04 87 1.4
Bg 179.9 0.72 184.6 0.09 112 0.4
Bg 184.7 0.09 150 0.3
Ag 208.1 1.30 226.2 -0.19 183 0.4
Bg 263.2 0.79 243.4 0.32 213 0.3
Bg 243.5 0.32 240 0.3
Ag 300.1 1.02 293.6 0.93 283 0.5
Bg 339.1 1.24 300.3 0.70 322 1.7
Bg 356.1 0.89 300.4 0.70 378 1.1
Ag 402.1 2.07 375.8 0.97 439 2.7
Ag 527.7 1.86 468.6 2.70 495 0.8
Bg 588.5 2.54 591.4 2.97 572 1.2
Bg 600.9 2.50 591.5 2.97
Ag 752.7 2.56 715.3 2.74 677 1.7
Ag 839.1 2.92 832.1 2.47 736 2.0
Bg 886.1 2.30 898.1 2.73 768 1.4
Bg 902.1 2.30 898.4 2.75
Ag 928.0 3.32 906.9 2.54 867 1.7

31
Table IV: Calculated crystal parameters of the β-fergusonite phase of ZnWO4 at 44.1
GPa. Space group C2/c, Z = 4.
a = 6.814 Å, b = 9.177 Å, c = 4.819 Å, and β = 134.976º
Atom Site x y z
Zn 4e 0 0.3750 0.25
W 4e 0 0.8753 0.25
O1 8f 0.1787 0.7994 0.1222
O2 8f 0.3066 0.9507 0.7355
Table V: Calculated crystal parameters of the Cmca phase of ZnWO4 at 76.1 GPa.
Space group Cmca, Z = 8.
a = 7.1807 Å, b = 10.3304 Å, and c = 4.9896 Å
Atom Site x y z
Zn 8e 0.75 0.8585 0.75
W 8f 0.5 0.3920 0.2590
O1 8e 0.75 0.1741 0.75
O2 8f 0.5 0.2758 0.5444
O3 8d 0.6600 0 0
O4 8f 0.5 0.4217 0.8751

32
Figure Captions
Figure 1: (a) Perspective drawing of the crystal structure of wolframite ZnWO4. (b)
Perspective drawing of the crystal structure of the proposed β-fergusonite phase of
ZnWO4. (c) Perspective drawing of the crystal structure of proposed Cmca phase of
ZnWO4. Large circles: Zn, medium circles: W, and small circles: O. The conventional
unit cell is represented with solid lines. W-O and Zn-O bonds are also shown as well as
the different polyhedra.
Figure 2: Raman spectra of wolframite ZnWO4 at different pressures. Ticks indicate the
position of the Raman peaks assigned to the high-pressure phase. All the spectra were
measured on pressure increase with the exception of the spectra marked with (r) which
was taken after pressure release.
Figure 3: Pressure dependence of the Raman mode frequencies of the wolframite (solid
symbols) and β−fergusonite (empty symbols) phases of ZnWO4. Sample #1: squares.
Sample #2: circles. The solid lines are just a guide to the eye. The vertical dashed lines
indicate the range of coexistence of the wolframite and β−fergusonite phases.
Figure 4: Energy-volume curves calculated for ZnWO4. Empty squares: wolframite
struture, solid circles: CuWO4-type structure, solid squares: β-fergusonite structure, and
empty circles: Cmca structure. The inset shows the calculated pressure dependence of
the volume (symbols) and the obtained equation of state (line) for the wolframite phase.
Figure 5: Theoretically-calculated pressure dependence of the lattice parameters and
the monoclinic β angle of the wolframite structure of ZnWO4.
Figure 6: Theoretically-calculated pressure evolution of the Zn-O and W-O interatomic
distances in the low-pressure phase of ZnWO4.

33
Figure 1

34
Figure 2

35
Figure 3

36
Figure 4
90 100 110 120 130 140Volume (Å3)
-92
-90
-88
-86
-84
-82
-80
En
erg
y (e
V)
0 20 40P(GPa)
110
120
130
140
V(Å
3 )

37
Figure 5
0 5 10 15 20 25 30 35 40 45P (GPa)
4.4
4.6
4.8
5
5.2
5.4
5.6
5.8
Latti
ce p
aram
eter
s (Å
)
abc
89.6
90
90.4
90.8
Bet
a(º)

38
Figure 6