Embed Size (px)
Citation preview
RSC Advances
REVIEW
Ope
n A
cces
s A
rtic
le. P
ublis
hed
on 2
0 Ju
ly 2
018.
Dow
nloa
ded
on 1
0/22
/202
1 2:
04:1
7 A
M.
Thi
s ar
ticle
is li
cens
ed u
nder
a C
reat
ive
Com
mon
s A
ttrib
utio
n-N
onC
omm
erci
al 3
.0 U
npor
ted
Lic
ence
.
View Article OnlineView Journal | View Issue
Challenges in ap
NFDPldbpHRaiu
Cite this: RSC Adv., 2018, 8, 25888
Received 25th May 2018Accepted 9th July 2018
DOI: 10.1039/c8ra04491k
rsc.li/rsc-advances
aDepartment of Inorganic & Physical Ch
Bangalore, India-560012. E-mail: umapathybDefence Bioengineering & Electromedical L
Bangalore, India-560093cCentre for Biosystems Science and Engi
Bangalore, India-560012
25888 | RSC Adv., 2018, 8, 25888–259
plication of Raman spectroscopyto biology and materials
Nikki Kuhar,†a Sanchita Sil,†b Taru Verma†c and Siva Umapathy *ad
Raman spectroscopy has become an essential tool for chemists, physicists, biologists and materials
scientists. In this article, we present the challenges in unravelling the molecule-specific Raman
spectral signatures of different biomolecules like proteins, nucleic acids, lipids and carbohydrates
based on the review of our work and the current trends in these areas. We also show how Raman
spectroscopy can be used to probe the secondary and tertiary structural changes occurring
during thermal denaturation of protein and lysozyme as well as more complex biological systems
like bacteria. Complex biological systems like tissues, cells, blood serum etc. are also made up of
such biomolecules. Using mice liver and blood serum, it is shown that different tissues yield their
unique signature Raman spectra, owing to a difference in the relative composition of the
biomolecules. Additionally, recent progress in Raman spectroscopy for diagnosing a multitude of
diseases ranging from cancer to infection is also presented. The second part of this article
focuses on applications of Raman spectroscopy to materials. As a first example, Raman
spectroscopy of a melt cast explosives formulation was carried out to monitor the changes in the
peaks which indicates the potential of this technique for remote process monitoring. The second
example presents various modern methods of Raman spectroscopy such as spatially offset Raman
spectroscopy (SORS), reflection, transmission and universal multiple angle Raman spectroscopy
(UMARS) to study layered materials. Studies on chemicals/layered materials hidden in non-
metallic containers using the above variants are presented. Using suitable examples, it is shown
ikki Kuhar is a Senior Researchellow, pursuing her PhD fromepartment of Inorganic andhysical Chemistry, IISc Banga-ore. She received her master'segree from IIT Bombay andachelor's degree from St Ste-hen's College, Delhi University.er research interest includesaman and Raman opticalctivity studies of protein, FTIR-maging of tissues and Molec-lar Dynamic Simulations.
Dr Sanchita Sil is a Scientist atDEBEL-DRDO. She received herPhD in Chemistry in the area ofRaman spectroscopy from theIndian Institute of Science,India. Prior to joining DefenceBioengineering & ElectromedicalLaboratory (DEBEL), she wasa Scientist at High EnergyMaterials Research Laboratory(HEMRL), India. She has morethan 13 years of research expe-rience. Her research interests
include Raman spectroscopy, SERS, development of novel Ramanbased instrumentation towards detection of materials, air qualitymanagement, catalysis, carbon based materials, adsorption andnanoparticles.
emistry, Indian Institute of Science,
@iisc.ac.in
aboratory, DRDO, C V Raman Nagar,
neering, Indian Institute of Science,
dDepartment of Instrumentation & Applied Physics, Indian Institute of Science,
Bangalore, India-560012
† All the authors have contributed equally and the names have been provided inalphabetical order.
08 This journal is © The Royal Society of Chemistry 2018
ToNCiSaSrsdm
This journal is © The Royal Society of C
Review RSC Advances
Ope
n A
cces
s A
rtic
le. P
ublis
hed
on 2
0 Ju
ly 2
018.
Dow
nloa
ded
on 1
0/22
/202
1 2:
04:1
7 A
M.
Thi
s ar
ticle
is li
cens
ed u
nder
a C
reat
ive
Com
mon
s A
ttrib
utio
n-N
onC
omm
erci
al 3
.0 U
npor
ted
Lic
ence
.View Article Online
how a specific excitation or collection geometry can yield different information about the location of
materials. Additionally, it is shown that UMARS imaging can also be used as an effective tool to obtain
layer specific information of materials located at depths beyond a few centimeters.
Introduction
‘VidyaViniyogaVikasah’ (a Sanskrit phrase) means progresscomes from proper application of knowledge. This statement istrue for the research and development in the eld of Ramanspectroscopy, which is considered as an evolving technologytowards a direct impact to society. Although the discoveryhappened in 1928, the number of publications remained lowuntil the 1960s; the web of science data indicates that there wasan upsurge in the number of publications in the decadefollowing the invention of lasers followed by a steady growth inthe number of publications. The 90's saw a revival in Ramanresearch both in theory as well as on instrumentation. Itspotential applications were understood immediately as this isa straightforward technique without much need for samplepreparation and almost any material, in any state underextreme conditions, can be probed. In addition, due to its non-destructive nature, it can be used as a technique for in situmeasurements. Moreover, Raman microscopy has made itpossible to probe very small quantity of materials with highspatial resolution. With the advent of techniques like ScanningNear-Field Microscopy (SNOM) and Tip-Enhanced RamanSpectroscopy (TERS), resolution of the order of few nanometrescan also be achieved. This advantage makes it an essential andunique technique in the eld of biology andmaterials science toexplore the molecular basis of structure and function.1–4
Progress in the eld of Raman spectroscopy can be largelyattributed to the recent advances made in the areas of instru-mentation.5 Historically, analytical applications involvingRaman spectroscopy was thought to be difficult, however,developments in the sources such as diode lasers, charge-coupled devices (CCDs), small spectrometers, optics along
aru Verma received her Masterf Science in Biotechnology fromagpur University, India.urrently, she is a PhD studentn the Centre for BioSystemscience and Engineering (BSSE)t the Indian Institute ofcience, Bangalore, India. Heresearch work mainly involvestudying bacteria and infectiousiseases using vibrationalicrospectroscopy.
hemistry 2018
with interfacing optical bres with Raman have made it a novelmethod for analytical applications. Conuence of nanotech-nology and Raman spectroscopy which led to the discovery ofSurface Enhanced Raman Spectroscopy (SERS) has opened newvistas for detection of analytes at very low concentrations. It ispossible to obtain Raman signals of biomolecules, chemicals,explosives, drugs etc. at parts per billion (even at single mole-cule level) with great sensitivity and specicity6–17
Raman spectroscopy owing to its molecular specicity can bea boon, however, in the case of biological samples, it compli-cates the analyses. Firstly, all biological systems are composedof biochemicals such as lipids, proteins, nucleic acids, carbo-hydrates etc. Therefore, vibrations from all the modescomprising the chemicals shall be manifested in the Ramanspectra. To an untrained eye, spectra of a cell, tissue anda bacterium may appear very similar. Therefore, analyses ofsuch convoluted complex spectra and assignments can bea challenging endeavour. Despite this, these complex spectracan yield a treasure of information pertaining to the structureand dynamics of the sample under evaluation. Once theassignments are made, the whole world of biochemicalprocesses, such as metabolic pathways or dynamics can beunearthed. The second challenge towards obtaining Ramanspectra of biomolecules is the occurrence of peaks from thematrix. For instance, paraffin xed tissue may show a similarpeak to a C–H stretch.18,19 Differentiating the actual spectrafrom the matrix therefore, becomes an equally important partbefore analyses. Thirdly, understanding the system under studyand making an informed judgement based on the experimentsand correlating it with the available data is crucial. Finally,signal processing of a large number of data set can bea contributing factor towards understanding of the system.
Siva Umapathy is a professor inthe Department of Inorganic &Physical Chemistry and Instru-mentation & Applied Physics,Indian Institute of Science,Bangalore, India and anHonorary Professor at theDepartment of Chemistry,University of Nottingham,United Kingdom. He secured hisPhD from the University ofOtago, New Zealand. His majorResearch interests are Ultrafast
Raman Spectroscopy, Resonance Raman Spectroscopy, under-standing Molecular Dynamics, and Raman & Infrared microscopyapplication to biology, medicine and materials research & thedevelopment of novel instrumentation for detection anddiagnostics.
RSC Adv., 2018, 8, 25888–25908 | 25889
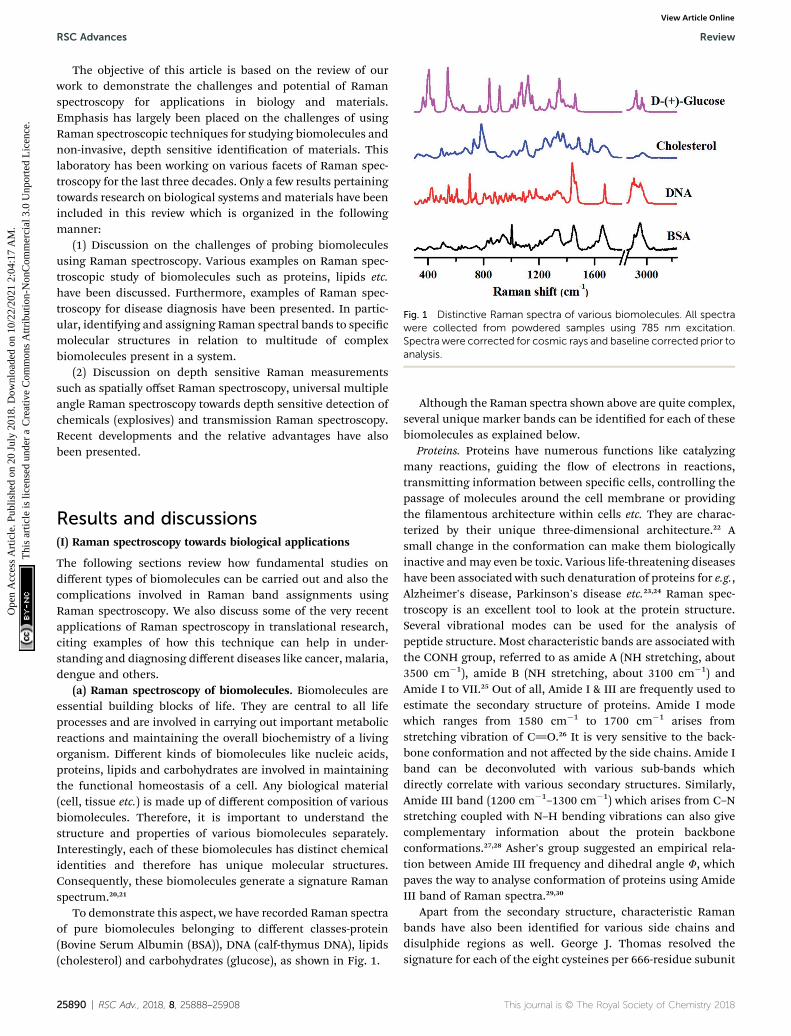
Fig. 1 Distinctive Raman spectra of various biomolecules. All spectrawere collected from powdered samples using 785 nm excitation.Spectra were corrected for cosmic rays and baseline corrected prior toanalysis.
RSC Advances Review
Ope
n A
cces
s A
rtic
le. P
ublis
hed
on 2
0 Ju
ly 2
018.
Dow
nloa
ded
on 1
0/22
/202
1 2:
04:1
7 A
M.
Thi
s ar
ticle
is li
cens
ed u
nder
a C
reat
ive
Com
mon
s A
ttrib
utio
n-N
onC
omm
erci
al 3
.0 U
npor
ted
Lic
ence
.View Article Online
The objective of this article is based on the review of ourwork to demonstrate the challenges and potential of Ramanspectroscopy for applications in biology and materials.Emphasis has largely been placed on the challenges of usingRaman spectroscopic techniques for studying biomolecules andnon-invasive, depth sensitive identication of materials. Thislaboratory has been working on various facets of Raman spec-troscopy for the last three decades. Only a few results pertainingtowards research on biological systems andmaterials have beenincluded in this review which is organized in the followingmanner:
(1) Discussion on the challenges of probing biomoleculesusing Raman spectroscopy. Various examples on Raman spec-troscopic study of biomolecules such as proteins, lipids etc.have been discussed. Furthermore, examples of Raman spec-troscopy for disease diagnosis have been presented. In partic-ular, identifying and assigning Raman spectral bands to specicmolecular structures in relation to multitude of complexbiomolecules present in a system.
(2) Discussion on depth sensitive Raman measurementssuch as spatially offset Raman spectroscopy, universal multipleangle Raman spectroscopy towards depth sensitive detection ofchemicals (explosives) and transmission Raman spectroscopy.Recent developments and the relative advantages have alsobeen presented.
Results and discussions(I) Raman spectroscopy towards biological applications
The following sections review how fundamental studies ondifferent types of biomolecules can be carried out and also thecomplications involved in Raman band assignments usingRaman spectroscopy. We also discuss some of the very recentapplications of Raman spectroscopy in translational research,citing examples of how this technique can help in under-standing and diagnosing different diseases like cancer, malaria,dengue and others.
(a) Raman spectroscopy of biomolecules. Biomolecules areessential building blocks of life. They are central to all lifeprocesses and are involved in carrying out important metabolicreactions and maintaining the overall biochemistry of a livingorganism. Different kinds of biomolecules like nucleic acids,proteins, lipids and carbohydrates are involved in maintainingthe functional homeostasis of a cell. Any biological material(cell, tissue etc.) is made up of different composition of variousbiomolecules. Therefore, it is important to understand thestructure and properties of various biomolecules separately.Interestingly, each of these biomolecules has distinct chemicalidentities and therefore has unique molecular structures.Consequently, these biomolecules generate a signature Ramanspectrum.20,21
To demonstrate this aspect, we have recorded Raman spectraof pure biomolecules belonging to different classes-protein(Bovine Serum Albumin (BSA)), DNA (calf-thymus DNA), lipids(cholesterol) and carbohydrates (glucose), as shown in Fig. 1.
25890 | RSC Adv., 2018, 8, 25888–25908
Although the Raman spectra shown above are quite complex,several unique marker bands can be identied for each of thesebiomolecules as explained below.
Proteins. Proteins have numerous functions like catalyzingmany reactions, guiding the ow of electrons in reactions,transmitting information between specic cells, controlling thepassage of molecules around the cell membrane or providingthe lamentous architecture within cells etc. They are charac-terized by their unique three-dimensional architecture.22 Asmall change in the conformation can make them biologicallyinactive andmay even be toxic. Various life-threatening diseaseshave been associated with such denaturation of proteins for e.g.,Alzheimer's disease, Parkinson's disease etc.23,24 Raman spec-troscopy is an excellent tool to look at the protein structure.Several vibrational modes can be used for the analysis ofpeptide structure. Most characteristic bands are associated withthe CONH group, referred to as amide A (NH stretching, about3500 cm�1), amide B (NH stretching, about 3100 cm�1) andAmide I to VII.25 Out of all, Amide I & III are frequently used toestimate the secondary structure of proteins. Amide I modewhich ranges from 1580 cm�1 to 1700 cm�1 arises fromstretching vibration of C]O.26 It is very sensitive to the back-bone conformation and not affected by the side chains. Amide Iband can be deconvoluted with various sub-bands whichdirectly correlate with various secondary structures. Similarly,Amide III band (1200 cm�1–1300 cm�1) which arises from C–Nstretching coupled with N–H bending vibrations can also givecomplementary information about the protein backboneconformations.27,28 Asher's group suggested an empirical rela-tion between Amide III frequency and dihedral angle F, whichpaves the way to analyse conformation of proteins using AmideIII band of Raman spectra.29,30
Apart from the secondary structure, characteristic Ramanbands have also been identied for various side chains anddisulphide regions as well. George J. Thomas resolved thesignature for each of the eight cysteines per 666-residue subunit
This journal is © The Royal Society of Chemistry 2018
Review RSC Advances
Ope
n A
cces
s A
rtic
le. P
ublis
hed
on 2
0 Ju
ly 2
018.
Dow
nloa
ded
on 1
0/22
/202
1 2:
04:1
7 A
M.
Thi
s ar
ticle
is li
cens
ed u
nder
a C
reat
ive
Com
mon
s A
ttrib
utio
n-N
onC
omm
erci
al 3
.0 U
npor
ted
Lic
ence
.View Article Online
in the trimeric tall spike of an icosahedral bacteriophage P22.31
They demonstrated that a broad range of S–H/X interactions isaccessible to the protein. The integration of microscope inRaman spectrometer has enabled studying of protein crystals,which led to genesis of a new technique termed as Ramancrystallography.32 Raman crystallography can identify andfollow the conformations of reaction intermediates in singlecrystals. Helfand et al. monitored the reactions between threeclinically relevant inhibitors, tazobactam, sulbactam, and clav-ulanic acid, and SHV beta-lactamase (EC 3.5.2.6) in singlecrystals using a Raman microscope and observed acyl-enzymeformed between Ser70 and the lactam ring's C]O group asa key intermediate in the reaction pathway.33 Various charac-teristic Raman bands for proteins are summarized in Table 1.
Nucleic acids. Richard C. Lord and co-workers recorded theRaman spectra of various nucleic acid constituents for the rsttime in 1960.47 Further improvements in the instrumentationhave enabled studying of various problems concerning thestructure and interaction in nucleic acids, nucleic acid hydra-tion, interaction with metal ions, DNA melting, DNA damageetc.48–51 Raman spectra of nucleic acids contain a large numberof bands originating from various moieties like sugar, phos-phate, bases etc. which provide very useful information aboutbackbone conformation, base pairing etc.
Very strong Raman peaks are observed by ring breathingmodes of various bases in the region of 600 cm�1 to 800 cm�1.20
Therefore, this region can be used to differentiate various bases.Out of all the bases, thymine has a very distinctive peak ataround 1671 cm�1 originating from C]O stretching whichmakes it easily distinguishable from rest of the bases.20
Different conformations of backbone (A-DNA, B-DNA and Z-DNA) can be identied using Raman spectra. J. M. Benevidesand co-workers have studied different backbone conformationat various salt conformations. They could qualitatively identifythe A, B and Z-DNA using phosphodiester Raman band lying inthe region of 750 to 800 cm�1.52 Apart from the above, many
Table 1 Peak assignments for proteinsa
Contributing group Frequency (cm�1)
Backbone 1670–16801660–16701650–16551630–163515501270–13001240–12501230–1240
Disulphide 505–515520–530540–545
Side chain 1615, 830, 643850/8301550, 1010, 750880/13611360/13401609, 1205, 1003
a a: alpha helices, b: beta sheets, GGG: gauche–gauche–gauche, GGT: gauch
This journal is © The Royal Society of Chemistry 2018
important group vibrations have also been assigned for nucleicacids in vibrational spectra, for example, region from 1800–1500 cm�1 has been assigned for nucleobase vibrations appearwhich are extremely sensitive to base pairing interactions and1500–1250 cm�1 region have been assigned for vibrationalcoupling between the base–sugar entities, stacking ligationetc.53 Okotrub et al. (2014) quantied DNA in the cell the nucleususing intensity of phosphate mode at 1096 cm�1 withoutextraction or dye labelling using Raman spectroscopy.54 Wood'sgroup (2013) probed DNA double-strand breaks (DSBs) withTERS coupled with Atomic Force Microscopy (AFM) and sug-gested that the O–C bond in the DNA backbone is most sensitiveto UVC radiation and its cleavage causes DSBs most of thetime.55 Deckert's group recorded the TERS spectra from anarticial DNA single strand with alternating blocks of adenineand cytosine. They could resolve adenine and cytosine basesplaced at a distance of 2.1 nm by unique Raman spectralfeatures proving that TERS can offer resolutions upto singlenucleobase level.56,57 Various characteristic Raman bands fornucleic acid are summarized in Table 2.
Lipids. Lipids, also called fats, are one of the importantclasses of biomolecules. They have important role in energystorage, cellular signalling, digestion and absorption of food,building of cellular membranes and various tissues, maintain-ing body temperature etc. Raman spectroscopy provides aninvaluable tool to estimate various structural properties oflipids like the degree of unsaturation, level of E, Z unsaturationetc.60 The stretching vibrations from C]O in lipids are observedat around 1749 cm�1 which are quite distinct and far from thatof proteins. Similarly, many other markers bands for lipids likeRaman bands at 1430 cm�1 (CH2 scissoring), 1443 cm�1 (CH2
and CH3 deformation of lipids and triglycerides), 1453 cm�1 (C–H bending of lipids) have been used to quantify lipids in oralcancer tissues.61 Nieva et al. (2012) characterized the lipidphenotype of breast cancer cells using Raman spectroscopy.62
Raman spectra analysed in the range of 2820–3030 cm�1, where
Assignment
b turn, random structure, Amide I26
b sheet, Amide I34
a helices, Amide I35
b sheet, Amide I36,37
Amide II25
a helices, Amide III38
Random structure, Amide III39
b sheet, Amide III39
GGG conformation40,41
GGT, GTG conformation40,41
TGT conformation40,41
Tyrosine42
Hydrogen bonding state of tyrosine;43
Tryptophan44
Ring environment of indole ring of tryptophan45
Hydrophobicity marker for tryptophan44
Phenylalanine46
e–gauche–trans, GTG: gauche–trans–gauche, TGT: trans–gauche–trans.
RSC Adv., 2018, 8, 25888–25908 | 25891
Table 2 Peak assignments for nucleic acidsa
Contributing group Frequency (cm�1) Assignment
Base 726 Ring breathing of A58
668, 746, 785 Ring breathing of T58
668 Ring breathing of G58
781, 785 Ring breathing of C58
785 Ring breathing of U58
1257 Ring mode (C, T)58
1336 Ring mode (A, G); A form of DNA59
1485 Ring stretching (G, A) A form of DNA59
1576 Ring stretching (A, G); A form of DNA59
Backbone 807 nas(O–P–O), ns(O–P–O); A-DNA52
1099 ns(PO2�); A-DNA52
1415 df(CH2); A-DNA52
784 ns(O–P–O); B-DNA52
830 nas(O–P–O); B-DNA52
1090 ns(PO2�); B-DNA52
1420 df(CH2); B-DNA52
748 ns(O–P–O); Z-DNA792 nas(O–P–O); Z-DNA810 nas(O–P–O); Z-DNA1095 ns(PO2
�); Z-DNA1425 df(CH2); Z-DNA
a n: stretching (s: symmetric, as: asymmetric), b: bending, t: twisting, df: deformation, A: adenine, T: thymine, C: cytosine, G: guanine, U: uracil, A-DNA: A-form of DNA, B-DNA: B form of DNA, Z-DNA: Z form of DNA.
RSC Advances Review
Ope
n A
cces
s A
rtic
le. P
ublis
hed
on 2
0 Ju
ly 2
018.
Dow
nloa
ded
on 1
0/22
/202
1 2:
04:1
7 A
M.
Thi
s ar
ticle
is li
cens
ed u
nder
a C
reat
ive
Com
mon
s A
ttrib
utio
n-N
onC
omm
erci
al 3
.0 U
npor
ted
Lic
ence
.View Article Online
total fatty acid content (TFA) and total unsaturated fatty acids(TUFA) (3015 cm�1) bands were quantied using bands at2845 cm�1 and 3015 cm�1 respectively. Popp's group (2015)analysed fungal lipids inside living hyphae using Raman spec-troscopy.63 Raman spectra from single vesicles were collectedand analysed for peak intensity ratio I (1270 cm�1)/I (1445 cm�1)from the signals of ]CH and –CH2/–CH3 groups, respectively.This ratio is linked to the iodine values of lipids. Raman spectrafrom lipids can be characterized in seven regions as explainedin Table 3 (all assignments have been taken from Czamaraet al.60).
Carbohydrates. Carbohydrates are naturally occurringcompounds and are essential constituents for living organisms.They have signicant functions, like, main source of energy,major constituent of cell wall of plants and microorganisms,molecular agents in cellular recognition etc. Carbohydrates canbe classied as monosaccharides, oligosaccharides and poly-saccharides. Nonetheless, structural investigations on differentcarbohydrates are difficult as the basic monomeric unit in the
Table 3 Peak assignments for lipidsa
Frequency (cm�1)
Region I 2800–3100Region II 1600–1800Region III 1400–1500Region IV 1200–1300Region V 1050–1200Region VI 800–1050Region VII 500–700
a n: stretching (s: symmetric, as: asymmetric), b: bending, sc: scissoring, t
25892 | RSC Adv., 2018, 8, 25888–25908
polymeric chains is very similar. Despite this, different nature ofH-bonding or the ring conguration gives rise to several markerpeaks for carbohydrates. Wiercigroch et al. (2017) havecompiled Raman and IR features of 14 carbohydrates in thesolid state.64 Arboleda et al. recorded Raman spectra of nineanomerically stable monosaccharides in solutions withconcentrations as low as 10 mM and volumes as small as 15 mL.It is observed that Raman spectra are sensitive to the congu-ration of the carbon centres and unique spectra are obtained ofall nine monosaccharides.65 Stuart et al. (2006) demonstrated invivo quantication of glucose in animal model for the rst timeusing Surface-Enhanced Raman Spectroscopy (SERS).66 Ramanspectra of carbohydrates can be categorised in ve main regionsas given in Table 4. All assignments have been taken fromWiercigroch et al.64
The above work provides extensive evidence that differentbiomolecules yield distinct Raman spectra. While under-standing the absolute structure of any biomolecule can bea confounding task, monitoring changes in the chemical
Assignment
n(CH), nas(CH3), ns(CH3), nas(CH2), ns(CH2)n(C]C), n(C]O)b(CH2/CH3), sc(CH2/CH3), b(CH2)t(CH2), df(CH)n(C–C), n(P–O)b(CH), skeletal(C–O–O), nasN
+(CH3)3nsN
+(CH3)3, cholesterol ring df, df(C]O–O), b(CH2) ring
: twisting, df: deformation, skel: skeletal.
This journal is © The Royal Society of Chemistry 2018
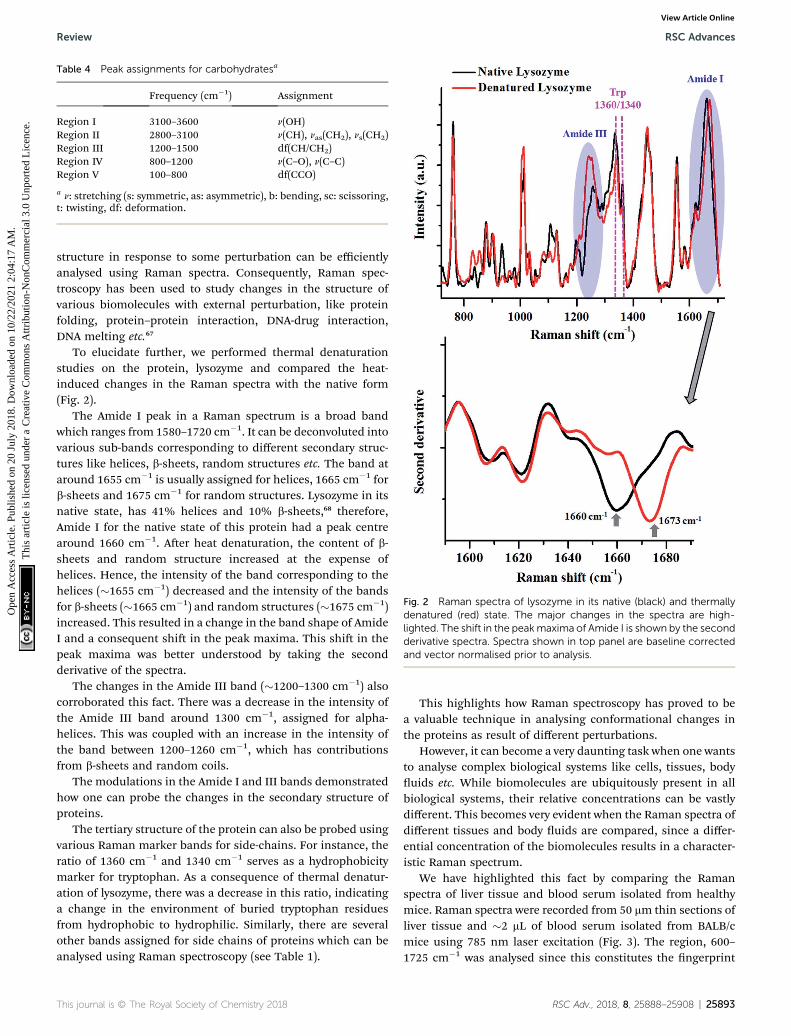
Table 4 Peak assignments for carbohydratesa
Frequency (cm�1) Assignment
Region I 3100–3600 n(OH)Region II 2800–3100 n(CH), nas(CH2), ns(CH2)Region III 1200–1500 df(CH/CH2)Region IV 800–1200 n(C–O), n(C–C)Region V 100–800 df(CCO)
a n: stretching (s: symmetric, as: asymmetric), b: bending, sc: scissoring,t: twisting, df: deformation.
Fig. 2 Raman spectra of lysozyme in its native (black) and thermallydenatured (red) state. The major changes in the spectra are high-lighted. The shift in the peakmaxima of Amide I is shown by the secondderivative spectra. Spectra shown in top panel are baseline correctedand vector normalised prior to analysis.
Review RSC Advances
Ope
n A
cces
s A
rtic
le. P
ublis
hed
on 2
0 Ju
ly 2
018.
Dow
nloa
ded
on 1
0/22
/202
1 2:
04:1
7 A
M.
Thi
s ar
ticle
is li
cens
ed u
nder
a C
reat
ive
Com
mon
s A
ttrib
utio
n-N
onC
omm
erci
al 3
.0 U
npor
ted
Lic
ence
.View Article Online
structure in response to some perturbation can be efficientlyanalysed using Raman spectra. Consequently, Raman spec-troscopy has been used to study changes in the structure ofvarious biomolecules with external perturbation, like proteinfolding, protein–protein interaction, DNA-drug interaction,DNA melting etc.67
To elucidate further, we performed thermal denaturationstudies on the protein, lysozyme and compared the heat-induced changes in the Raman spectra with the native form(Fig. 2).
The Amide I peak in a Raman spectrum is a broad bandwhich ranges from 1580–1720 cm�1. It can be deconvoluted intovarious sub-bands corresponding to different secondary struc-tures like helices, b-sheets, random structures etc. The band ataround 1655 cm�1 is usually assigned for helices, 1665 cm�1 forb-sheets and 1675 cm�1 for random structures. Lysozyme in itsnative state, has 41% helices and 10% b-sheets,68 therefore,Amide I for the native state of this protein had a peak centrearound 1660 cm�1. Aer heat denaturation, the content of b-sheets and random structure increased at the expense ofhelices. Hence, the intensity of the band corresponding to thehelices (�1655 cm�1) decreased and the intensity of the bandsfor b-sheets (�1665 cm�1) and random structures (�1675 cm�1)increased. This resulted in a change in the band shape of AmideI and a consequent shi in the peak maxima. This shi in thepeak maxima was better understood by taking the secondderivative of the spectra.
The changes in the Amide III band (�1200–1300 cm�1) alsocorroborated this fact. There was a decrease in the intensity ofthe Amide III band around 1300 cm�1, assigned for alpha-helices. This was coupled with an increase in the intensity ofthe band between 1200–1260 cm�1, which has contributionsfrom b-sheets and random coils.
The modulations in the Amide I and III bands demonstratedhow one can probe the changes in the secondary structure ofproteins.
The tertiary structure of the protein can also be probed usingvarious Raman marker bands for side-chains. For instance, theratio of 1360 cm�1 and 1340 cm�1 serves as a hydrophobicitymarker for tryptophan. As a consequence of thermal denatur-ation of lysozyme, there was a decrease in this ratio, indicatinga change in the environment of buried tryptophan residuesfrom hydrophobic to hydrophilic. Similarly, there are severalother bands assigned for side chains of proteins which can beanalysed using Raman spectroscopy (see Table 1).
This journal is © The Royal Society of Chemistry 2018
This highlights how Raman spectroscopy has proved to bea valuable technique in analysing conformational changes inthe proteins as result of different perturbations.
However, it can become a very daunting task when one wantsto analyse complex biological systems like cells, tissues, bodyuids etc. While biomolecules are ubiquitously present in allbiological systems, their relative concentrations can be vastlydifferent. This becomes very evident when the Raman spectra ofdifferent tissues and body uids are compared, since a differ-ential concentration of the biomolecules results in a character-istic Raman spectrum.
We have highlighted this fact by comparing the Ramanspectra of liver tissue and blood serum isolated from healthymice. Raman spectra were recorded from 50 mm thin sections ofliver tissue and �2 mL of blood serum isolated from BALB/cmice using 785 nm laser excitation (Fig. 3). The region, 600–1725 cm�1 was analysed since this constitutes the ngerprint
RSC Adv., 2018, 8, 25888–25908 | 25893
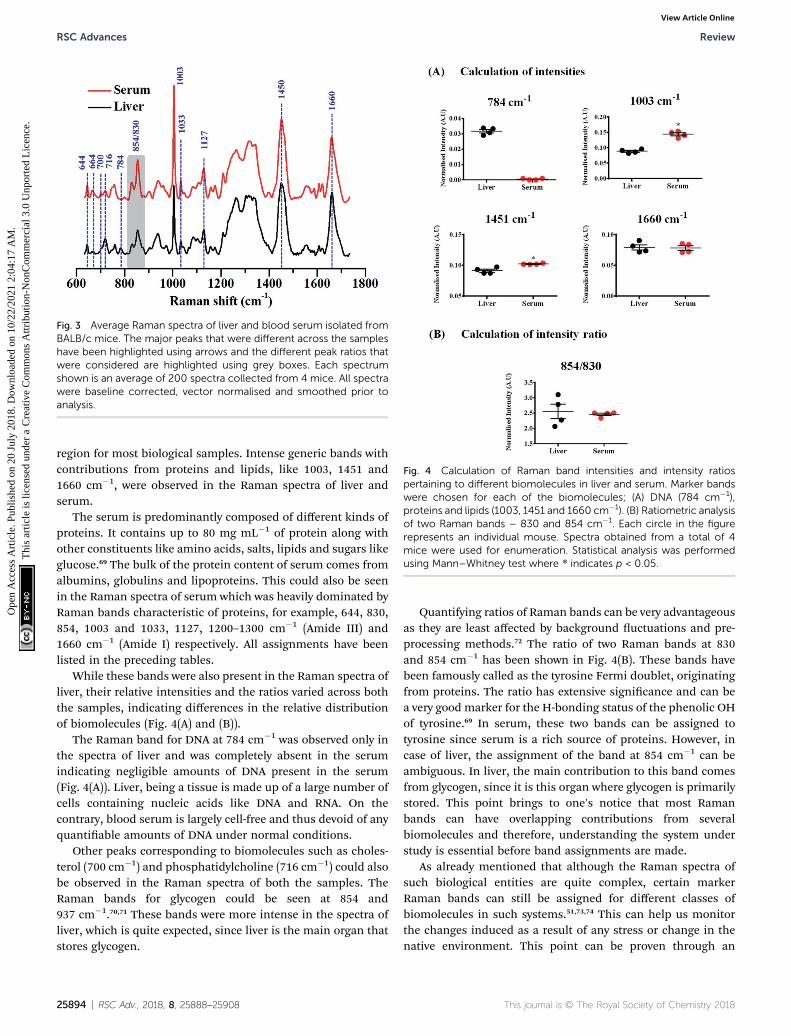
Fig. 4 Calculation of Raman band intensities and intensity ratiospertaining to different biomolecules in liver and serum. Marker bandswere chosen for each of the biomolecules; (A) DNA (784 cm�1),proteins and lipids (1003, 1451 and 1660 cm�1). (B) Ratiometric analysisof two Raman bands – 830 and 854 cm�1. Each circle in the figurerepresents an individual mouse. Spectra obtained from a total of 4mice were used for enumeration. Statistical analysis was performedusing Mann–Whitney test where * indicates p < 0.05.
Fig. 3 Average Raman spectra of liver and blood serum isolated fromBALB/c mice. The major peaks that were different across the sampleshave been highlighted using arrows and the different peak ratios thatwere considered are highlighted using grey boxes. Each spectrumshown is an average of 200 spectra collected from 4 mice. All spectrawere baseline corrected, vector normalised and smoothed prior toanalysis.
RSC Advances Review
Ope
n A
cces
s A
rtic
le. P
ublis
hed
on 2
0 Ju
ly 2
018.
Dow
nloa
ded
on 1
0/22
/202
1 2:
04:1
7 A
M.
Thi
s ar
ticle
is li
cens
ed u
nder
a C
reat
ive
Com
mon
s A
ttrib
utio
n-N
onC
omm
erci
al 3
.0 U
npor
ted
Lic
ence
.View Article Online
region for most biological samples. Intense generic bands withcontributions from proteins and lipids, like 1003, 1451 and1660 cm�1, were observed in the Raman spectra of liver andserum.
The serum is predominantly composed of different kinds ofproteins. It contains up to 80 mg mL�1 of protein along withother constituents like amino acids, salts, lipids and sugars likeglucose.69 The bulk of the protein content of serum comes fromalbumins, globulins and lipoproteins. This could also be seenin the Raman spectra of serum which was heavily dominated byRaman bands characteristic of proteins, for example, 644, 830,854, 1003 and 1033, 1127, 1200–1300 cm�1 (Amide III) and1660 cm�1 (Amide I) respectively. All assignments have beenlisted in the preceding tables.
While these bands were also present in the Raman spectra ofliver, their relative intensities and the ratios varied across boththe samples, indicating differences in the relative distributionof biomolecules (Fig. 4(A) and (B)).
The Raman band for DNA at 784 cm�1 was observed only inthe spectra of liver and was completely absent in the serumindicating negligible amounts of DNA present in the serum(Fig. 4(A)). Liver, being a tissue is made up of a large number ofcells containing nucleic acids like DNA and RNA. On thecontrary, blood serum is largely cell-free and thus devoid of anyquantiable amounts of DNA under normal conditions.
Other peaks corresponding to biomolecules such as choles-terol (700 cm�1) and phosphatidylcholine (716 cm�1) could alsobe observed in the Raman spectra of both the samples. TheRaman bands for glycogen could be seen at 854 and937 cm�1.70,71 These bands were more intense in the spectra ofliver, which is quite expected, since liver is the main organ thatstores glycogen.
25894 | RSC Adv., 2018, 8, 25888–25908
Quantifying ratios of Raman bands can be very advantageousas they are least affected by background uctuations and pre-processing methods.72 The ratio of two Raman bands at 830and 854 cm�1 has been shown in Fig. 4(B). These bands havebeen famously called as the tyrosine Fermi doublet, originatingfrom proteins. The ratio has extensive signicance and can bea very good marker for the H-bonding status of the phenolic OHof tyrosine.69 In serum, these two bands can be assigned totyrosine since serum is a rich source of proteins. However, incase of liver, the assignment of the band at 854 cm�1 can beambiguous. In liver, the main contribution to this band comesfrom glycogen, since it is this organ where glycogen is primarilystored. This point brings to one's notice that most Ramanbands can have overlapping contributions from severalbiomolecules and therefore, understanding the system understudy is essential before band assignments are made.
As already mentioned that although the Raman spectra ofsuch biological entities are quite complex, certain markerRaman bands can still be assigned for different classes ofbiomolecules in such systems.51,73,74 This can help us monitorthe changes induced as a result of any stress or change in thenative environment. This point can be proven through an
This journal is © The Royal Society of Chemistry 2018

Fig. 5 Raman spectra of bacterial cells before (black) and after (red)heat treatment. E. coli WT cells were grown for 8 h in shakingcondition at 37 �C and 160 rpm. Bacteria were heat treated at 85 �C for15 minutes. The shift in the peak maxima of Amide I is shown by thesecond derivative spectra. All spectra in the top panel were correctedfor cosmic rays, background subtracted and vector normalised prior toanalysis.
Review RSC Advances
Ope
n A
cces
s A
rtic
le. P
ublis
hed
on 2
0 Ju
ly 2
018.
Dow
nloa
ded
on 1
0/22
/202
1 2:
04:1
7 A
M.
Thi
s ar
ticle
is li
cens
ed u
nder
a C
reat
ive
Com
mon
s A
ttrib
utio
n-N
onC
omm
erci
al 3
.0 U
npor
ted
Lic
ence
.View Article Online
example by monitoring the biomolecular changes induced inbacteria as a consequence of heat treatment.
Heat treatment of the bacterial cells induced several changesin the Raman spectra (Fig. 5), as highlighted in the gure above.The major changes observed were in the Amide I and III bands,similar to what was noted in the lysozyme-denaturation exper-iment shown in Fig. 2. This emphasises that these Ramanbands can be unambiguously assigned to proteins, even incomplex systems like bacteria.
Aer heat treatment, a prominent increase in the intensity ofthe Raman band at 1674 cm�1 was observed, which indicatedthe increase in the content of b-sheets/random coils. This wasalso highlighted by the second derivative spectra. Comple-mentary information was obtained from the analysis of theAmide III band. Accumulation of b-sheet/random coils ishighlighted by the increase in intensity of Raman bands in therange of 1200–1260 cm�1 at the expense of helical structure(1300 cm�1). Another biomolecule which showed changes asa result of heat treatment was DNA. All the major Raman bandsfor DNA (726, 785, 1487 cm�1) showed a marginal decrease inthe heat treated bacterial cells.
These changes showcase how complex systems can also bestudied using Raman spectroscopy by analysing the uniquefeatures assigned for different biomolecules. In the eld of
This journal is © The Royal Society of Chemistry 2018
microbiology such information is deemed useful for classica-tion of different bacterial species or understanding biochemicalchanges in bacteria due to external perturbations in the envi-ronment.73,75 This paves the way for monitoring other pertur-bations like diseases in more complex living systems likehuman beings.76–78 Any disease can also be considered asa perturbation to the native composition of these biomoleculesin different tissues and body uids.
Every disease is associated with a change in biochemistry.This principle is the central doctrine for modern medicine. Thebiochemical changes can either be a cause for disease mani-festation or may be a consequence of the disease itself. SinceRaman spectroscopy probes bond vibrations, the spectragenerated are very molecule-specic. Any change in theconcentration or the conformation of these biomolecules asa result of a disease, however subtle, is reected in a Ramanspectrum. This principle has formed the basis for a Raman-based diagnostic tool. Though Raman scattering is a weakphenomenon, technological advancements over the past fewdecades have led to shorter acquisition times and improvedsignal-to noise ratio, making the use of Raman spectrometers ina clinical setting easier. The clinical practicality has also beenenhanced by the advent of bre-optic probes for delivery of lightas well as collection of Raman scattered photons. The use ofadvanced chemometric methods for handling Raman data setshas also made the diagnosis and classication process user-friendly.79
Different methods are available that help the user in derivingmeaningful information from a complex spectral dataset.Principal component analysis (PCA) is one such technique thatreduces the spectra into a dened number of principalcomponents (PCs) that account for spectral variance. A detailedanalysis of cluster analysis and PCA in spectral data analysis isdemonstrated by Bonnier and Byrne.80 PCA is an unsupervisedmethod and hence cannot be used for classication andprediction purposes. Hence, supervised methods like SupportVector Machines, Articial Neural Network, Linear Discrimi-nant Analysis etc. are employed. A concise description ofdifferent chemometric methods used for Raman spectral dataanalysis has been given in the review by Butler et al.81
In the following sections, we discuss examples of howRaman spectroscopy has been used to understand some path-ological conditions of the human body like cancer, infectionand inammation.
Cancer. Of the several diseases and pathological conditionsthat have been studied using Raman spectroscopy, cancer topsthe list. In 2015, around 8.8 million deaths were due to cancer.As is true for any disease, early and rapid diagnosis of cancer isof utmost need. Traditionally, cancer diagnosis occurs throughhistopathology which requires a biopsy to be taken from thesuspected area. This method of detection is highly subjectiveand requires the availability of a trained pathologist. Othermethods of diagnosis include imaging based modalities likePositron Emission Tomography (PET) scan, Magnetic Reso-nance Imaging (MRI), Computed Tomography (CT) etc.However, these methods are difficult to be included in intra-operative procedures as most of these techniques require
RSC Adv., 2018, 8, 25888–25908 | 25895
RSC Advances Review
Ope
n A
cces
s A
rtic
le. P
ublis
hed
on 2
0 Ju
ly 2
018.
Dow
nloa
ded
on 1
0/22
/202
1 2:
04:1
7 A
M.
Thi
s ar
ticle
is li
cens
ed u
nder
a C
reat
ive
Com
mon
s A
ttrib
utio
n-N
onC
omm
erci
al 3
.0 U
npor
ted
Lic
ence
.View Article Online
extensive labelling. Cancer, like most other diseases, isaccompanied by distinct modulations in biochemistry whichare expected to be reected in the Raman spectrum. Conse-quently, Raman spectroscopy has been used for the detection ofvarious types of cancers. Kopec et al. used a combination ofRaman and AFM imaging to determine the biochemicalcomposition as well as the mechanical properties of bloodvessels in a tumour mass of human breast tissue. They found anincrease in glycogen and lactic acid in breast cancer patientscoupled with an increase in the collagen–broblast–glycocalyxnetwork.82 An insight into how Raman spectroscopy can func-tion as a tool for personalised radiation therapy was given byVan Nest et al. They used human breast adenocarcinomaxenogras aer radiation therapy and found spectral changeslinked to different biomolecules like proteins, lipids andnucleic acids on a temporal scale, highlighting the potential ofRaman spectroscopy for assessing radiation-responses oftumours.83 The use of cancerous cell lines as a platform todifferentiate invasive vs. non-invasive breast cancer on the basisof Raman spectral markers was done by Chaturvedi et al. TheRaman bands at 1447 cm�1 (CH2 bending from lipids),1003 cm�1 (phenylalanine) and 876 cm�1 (tryptophan) werefound to be higher in invasive cell lines vis-a-vis the non-invasive ones. Their work is in agreement with other reportsthat have correlated increased lipid levels to more aggressiveand metastatic cancers and, therefore, a poor prognosis.84 Thework of Kim S. et al., shows how cancer detection can beimproved by coupling Raman spectroscopy to other methodslike pH sensing. It is known that pH levels in cancerous tissuesare much lower than that of normal tissues. They exploited thechemical information revealed by Raman spectroscopy as wellas the metabolic information obtained by the pH sensor forimproving the specicity of cancer diagnosis. Their study wasdone on human breast tissue samples and both the Raman andpH sensors were bre-optic probes.85 A recent study undertakenby Winnard et al., has beautifully captured the potential ofRaman spectroscopy to characterise organ-specic metastaticlesions at a molecular level, to give insights into metastaticprogression. A combinatorial approach of Raman spectroscopyand metabolomics was employed in their study.86 In anotherstudy, stromal adaptations occurring in pre-metastatic lungsthat were primed by breast cancer were analysed using Ramanspectroscopy. This work was done in mouse models where themice were xenograed with human breast cancer cells ofvarying metastatic potentials. Changes in the extra-cellularmatrix of pre-metastatic lungs, such as increase in collagen(859 cm�1) and proteoglycan (1061 cm�1) were identied andthis was a direct correlation of the metastatic potential of thebreast cancer cells used.74
Desroches et al., utilized the higher wavenumber Ramansignatures for designing, developing and testing of an in situintraoperative system for brain cancer detection. They engi-neered this Raman-based system into a commercially availablebiopsy system for analysis before the tissue was extracted. Usingthis approach, they could achieve sensitivity and specicity ofbrain cancer detection in a swine model system, upto 80 and90% respectively.87 The reprogramming of lipid biosynthesis
25896 | RSC Adv., 2018, 8, 25888–25908
and proteins in high-grade medulloblastoma was demonstratedby Abramczyk and Imiela very recently. Medulloblastoma isa term given to high grade cancers of the central nervoussystem. Such samples showed a higher content of b-sheets andlower levels of a-helix when compared to normal tissues. Theratio of the Raman intensities at 2930 and 2845 cm�1 was alsoindicative of cancer progression. For all the cancerous samples,this ratio had a value of 1.99 in comparison to the value of 1.45for healthy tissue.88
Murali Krishna's group demonstrated the use of Ramanspectroscopy for identication of sites in the oral cavity thathave a higher propensity to become cancerous even before themanifestation of clinical symptoms of oral cancer recurrence.This study was performed on 99 patients of oral cancer andspectra were recorded from the cancerous sites as well ascontralateral normal mucosa.89 Nasopharyngeal cancer has alsobeen diagnosed using Raman spectroscopy by Ming et al. in2017. They demonstrated the use of a bre-optic Raman probefor in vivo surveillance of patients suffering from nasopharyn-geal cancer. This form of cancer is oen very difficult to diag-nose owing to the deep anatomical location. This study hadgrouped patients under three categories – normal, cancerousand post-radiation. All experiments were performed usinga 1.8 mm probe, which is currently the smallest probe used forRaman-based diagnosis. A specicity of �96% was observed indistinguishing normal, cancerous and post-radiation patients.90
Almond et al. utilised Raman spectroscopy and translated itinto an endoscopic tool for the early detection of dysplasia inpatients suffering from Barret's oesophagus. A high-gradedysplasia (HGD) oen results into oesophageal malignancy.Tissues from a cohort of 62 patients were taken for the analysisand sensitivity and specicity of 86 and 88% respectively wereobtained for detecting HGD and adenocarcinoma.91
Another useful application of Raman spectroscopy in cancerresearch was highlighted by the work of Moradi et al., wherethey tested the potential of this method to discriminate betweenhuman ovarian cancer cells that were sensitive or resistant tocisplatin. An increase in the relative concentration of proteinsand glutathione was observed in the resistant cells compared tothe sensitive ones.92 The ability of Raman spectroscopy-basedtool to serve an intra-operative device for detecting distantinvasive grade 2–4 gliomas was shown by Jermyn et al. in 2016.They found that Raman spectroscopy could detect as few as 6cancer cells per 0.0625 mm2, which was much better thantraditionally used methods like MRI. All the Raman measure-ments were performed during brain tumour resections.93 Adetailed review on intra-operative Raman spectroscopy has beengiven by Brusatori et al.94
The use of body uids like blood plasma/serum, urine, tearsetc. can pave way for a diagnostic method that is minimallyinvasive. Body uids can be obtained easily and thereforerepeated samplings can be done. Unlike tissues and cells, bio-uids can be used for routine monitoring as well as under intra-operative conditions. They contain several biomolecules andtherefore can be very good indicators of the health status ofa person or the underlying disease. The major limitation inusing bio uids for Raman spectroscopy is the relatively low
This journal is © The Royal Society of Chemistry 2018
Review RSC Advances
Ope
n A
cces
s A
rtic
le. P
ublis
hed
on 2
0 Ju
ly 2
018.
Dow
nloa
ded
on 1
0/22
/202
1 2:
04:1
7 A
M.
Thi
s ar
ticle
is li
cens
ed u
nder
a C
reat
ive
Com
mon
s A
ttrib
utio
n-N
onC
omm
erci
al 3
.0 U
npor
ted
Lic
ence
.View Article Online
concentrations of biomolecules when compared to tissues andcells. This problem can be easily circumvented by the use ofDrop Coated Deposition Raman Spectroscopy (DCDRS) wherethe biomolecules are concentrated.95–97 Harvey et al. in 2008demonstrated the use of urine for the detection of prostatecancer where increased proteins and nucleic acids were asso-ciated with the cancerous cells.98 The work of Corsetti et al.demonstrated the efficacy of Raman spectroscopy in dis-tinguishing hormone (androgen)-resistant prostate cancer cells.Bands specic to amino acids like arginine were found to bediminished in the cancerous cells whereas those with contri-butions from phenylalanine and tyrosine were found to beincreased. The androgen-resistant cancer cells also hadincreased DNA and Amide III bands when compared to thesensitive cells.99 O'Malley et al., in their study, have highlightedRaman-based lipid quantication to be of diagnostic value forprostate cancer. Increased lipid amounts are directly correlatedto the tumour stage.100
The use for serum-based cancer diagnosis has also beenexplored for different types of cancers. Ovarian cancer wasstudied using a combined approach of ATR-FTIR and Ramanspectroscopy on human ovarian cancer patients by Owens et al.in 2014.101 The basis for differentiation using Raman spectros-copy was the spectral shis in the Raman bands at 711 cm�1
(DNA) and 913 cm�1 (sphingolipids).Infectious, inammatory and other diseases. While a plethora
of information can be found for Raman-based cancer diagnosis,infectious and inammatory diseases also require signicantattention since they constitute a large percentage of the globalburden on the health care system.
Infection with the dengue virus claims several lives especiallyin the developing countries. Current methods for diagnosisinclude measuring serum IgG and IgM levels and the Ns1antigen. Mahmood et al., demonstrated the use of Ramanspectroscopy for proling dengue-associated biochemicalchanges occurring in the blood plasma of 17 infected patients.Changes were seen mostly in the Raman bands associated withlipids (608 cm�1, 875 cm�1, 1297 cm�1, 1719 cm�1 and1736 cm�1) which increased with infection. The peak intensityof the Amide III band at 1239 cm�1 was also higher in theinfected samples. An increase in the Raman band at 1409 cm�1
was also observed which can be assigned to IgG. The methodshowed specicity and sensitivity of 95 and 98% respectively.102
Dengue-associated spectral changes were also studied by Bilalet al. and they found the peaks for lactate at 750, 830 and1450 cm�1 to be higher in intensity in all 50 dengue patientswhen compared to 20 healthy controls. They also spiked theserum of healthy controls with lactate in a controlled mannerand found that indeed the abovementioned peaks were due tolactate.103 Ahmed's group from Pakistan has tried to developa Raman-based diagnostic method for dengue using severalmultivariate approaches like Support Vector Machines (SVM),random forest method, etc.104
The same group has also conducted Raman studies onhuman malarial samples and found 10 distinct spectral signa-tures that could differentiate malarial samples from healthycontrols as well as dengue samples and patients suffering from
This journal is © The Royal Society of Chemistry 2018
non-malarial fever. A multivariate model based on partial leastsquare (PLS) regression was used and the accuracy of detectionwas 86%.105
Malaria-induced changes in the spleen of mice were evalu-ated using Raman spectroscopy by Frame et al. and they foundan increase in the heme-associated Raman bands. This directlycorrelated to the hemozoin detection with peaks at �1370,1529, 1588, and 1628 cm�1 which matched closely with thereference spectra.106 A comprehensive review on the potential ofvibrational spectroscopy to diagnose and study malaria and themalarial parasite was written very recently by Perez-Guaitaet al.107
One of the major causes of death in developing countries istuberculosis (TB). In India alone, around 400 000 people dieannually because of TB infections. While tuberculosis is mainlypulmonary in origin, extra-pulmonary TB also exists and is moredifficult to diagnose. Tuberculous meningitis is one of theforms of extra-pulmonary TB and requires culturing of Myco-bacterium for a precise diagnosis. Satyavathi et al., used Ramanspectroscopy on cerebrospinal uid of patients suffering fromtuberculous meningitis and found that the silicate Ramansignature fromM. tb positive cases was a very useful indicator ofthe underlying infection.108
Another leading cause of mortality in the Intensive CareUnits of hospitals is sepsis. Sepsis can be triggered by infectionof any kind and results in an uncontrolled immune responseknown as the Systemic Inammatory Response Syndrome(SIRS). SIRS, however, can be a manifestation of other condi-tions like burns, trauma etc. Presently, no reliable marker existsthat can efficiently distinguish SIRS from sepsis. In order toachieve this, Raman spectroscopy combined with multivariateapproaches was used by Popp's group and they found that SIRScould be distinguished from sepsis with a predictive accuracy of80%.109
Different inammatory conditions like ulcerative colitis havealso been studied using Raman spectroscopy. Ding et al.investigated the colon mucosal composition in vivo using anendoscope-coupled Raman probe in patients suffering fromulcerative colitis and age and BMI-matched healthy controls. Adecrease in the phosphatidylcholine (720 cm�1) and total lipids(1303 cm�1) was observed in the inamed colon tissue. Thedegree of lipid unsaturation, determined by calculating theratio between Raman bands at 1657 and 1447 cm�1, was foundto be high in the patient group. These differences were also seenwhen active colitis patients were compared with the quiescentones.110 Their results were corroborated by the work of Addiset al., which also showed reduction in phospholipids to be ofdiagnostic value for ulcerative colitis.111
Inammatory bowel disease (IBD) was also diagnosed byMahadevan-Jansen's group where a colonoscopy-coupled breoptic Raman probe was used. IBD includes ulcerative colitis(UC) and Crohn's disease (CD) and the motive in this study wasto determine the spectral signatures of both UC and CD.112
Inammation in the oral cavity as a result of periodontaldisease was also assessed using Raman spectroscopy byCamerlingo et al. They used gingival crevicular uid frompatients with periodontal disease and found an increase in the
RSC Adv., 2018, 8, 25888–25908 | 25897
RSC Advances Review
Ope
n A
cces
s A
rtic
le. P
ublis
hed
on 2
0 Ju
ly 2
018.
Dow
nloa
ded
on 1
0/22
/202
1 2:
04:1
7 A
M.
Thi
s ar
ticle
is li
cens
ed u
nder
a C
reat
ive
Com
mon
s A
ttrib
utio
n-N
onC
omm
erci
al 3
.0 U
npor
ted
Lic
ence
.View Article Online
carotene content to be diagnostic of the condition (1537 cm�1).They also studied the chemical and structural changes occur-ring in the periodontal ligament aer orthodontic force wasapplied and found changes in the secondary structures ofproteins (Amide I band) to change with application of theforce.113
In addition to the above mentioned inammatory diseases,Raman spectroscopy has been extensively used to study anddiagnose neurodegenerative diseases like Alzheimer's disease(AD). Till date, there is no cure for such diseases primarily dueto their delayed diagnosis which occurs when the extent of braindamage is already quite pronounced. In fact, a denitive diag-nosis can only be established post-mortem. It is now known thatchanges in the brain of such individuals begin much earlierthan the appearance of the rst symptoms. This can pave wayfor an early diagnosis which may make therapeutic interven-tions more successful. Protein misfolding and aggregation arecentral to most neurodegenerative diseases. Raman spectros-copy is an excellent tool to study protein conformation andtherefore, has signicant potential in diagnosing such diseases.This has been efficiently shown in the work of Paraskevaidiet al., where blood plasma was used to successfully discriminateAlzheimer's disease from healthy controls as well as frompatients suffering from Dementia with Lewy Bodies (DLB). It isimportant to highlight that patients suffering from DLB areoen misdiagnosed as AD and hence the choice of the patientcohorts is well justied. The same study also showed thatpatients suffering from early and late stages of AD could bedifferentiated from healthy controls with a sensitivity of 84%.114
In another study, Ryzhikova et al., demonstrated the use ofRaman microspectroscopy on blood serum for diagnosis of ADusing a cohort of 20 AD patients, 18 from other neurodegener-ative diseases and 10 healthy controls with specicity andsensitivity of �95%.115
(II) Raman spectroscopic studies on materials
Preceding discussions revolved around the use of Ramanspectroscopy in the eld of biology. It should be emphasizedthat biomolecules have a low Raman cross-section and asa consequence show weak Raman signals. Probing such weakscatterers has been made possible due to the introduction ofRaman microscope in the early 70s.7–9 The other advantageswhich Raman spectroscopy offers over other analytical tools areits non-invasive and non-destructive nature. This has resultedin its prolic use in the eld of materials such as studies oncarbon allotropes, explosives, semiconductors, pharmaceuti-cals, art, painting and archaeology. Raman spectroscopy hasbeen an indispensable tool for characterization of differentallotropes of carbon. Ranging from 3D diamond or graphite to2D materials such as graphene or 1D materials like carbonnanotubes (CNT), Raman spectroscopy provides informationpertaining to lattice vibrations, defects, orientations etc.116,117
For instance, single walled and multi walled CNTs can bedistinguished using this technique. The radial breathing modeswhich are unique to single walled CNT are absent in multiwalled CNT.118 Additionally, various sp2 carbon can also be
25898 | RSC Adv., 2018, 8, 25888–25908
differentiated.119 One of the more recent interests on carbonallotropes has been in graphene research. Here, Raman spec-troscopy has proved to be an integral tool to determine numberof layers of graphene along with orientational information,edges, strains, defects etc.120,121 Enhancement of Raman signalsof analytes using carbon materials has also been explored.122–125
In the eld of explosives detection, surface enhanced Ramanspectroscopy has been employed for trace level detection.126,127
Furthermore, studies on feasibility of Raman spectroscopy forstand-off detection have also been explored.128,129 The subse-quent sections provide a different aspect of this technique todemonstrate the usefulness of Raman spectroscopy towardsstudies on explosives. The rst example shows how Ramanspectroscopy can be used to monitor melt cast explosivesformulations. In the second case, detection of concealedmaterials in non-metallic containers using depth sensitiveRaman spectroscopy such as spatially offset Raman spectros-copy (SORS), transmission Raman and universal multiple angleRaman spectroscopy (UMARS) has been demonstrated.
(a) Raman spectroscopy as an effective tool in processmonitoring of explosives formulation. The rst use of explosivedates back as early as 220 B.C. when some Chinese alchemistswere trying to separate gold from silver and met with accident.The material was ‘black powder’, which is a mixture of charcoal,sulphur and potassium nitrate.130,131 An explosive in the litera-ture is dened as ‘a substance which when suitably triggered,releases a large amount of heat and pressure by way of a veryrapid self-sustaining exothermic decomposition reaction.130
The temperature of such a reaction is approximately equal tothe temperature at the Sun's surface �5000 �C. Secondaryexplosives are a class of explosives which are comparativelyinsensitive to heat, friction and impact. They require moreenergy to initiate the detonation process. Typical secondaryexplosives are 2,4,6-trinitro toluene (TNT), pentaerythritol tet-ranitrate (PETN), cyclotrimethylenetrinitramine (RDX), tetra-hexaminetetranitramine (HMX) and more recently2,4,6,8,10,12-hexanitro-2,4,6,8,10,12-hexaazaisowurtzitane(HNIW or CL-20), and mixtures of these explosives in differentproportions. Explosives in a nutshell, have been described asa ‘devil ’ during war and considered as an ‘evil’ during pro-cessing, handling, transportation and storage, have proved tobe an ‘angel’ due to their tremendous impact on economy andindustries and their innumerable applications in all walks oflife.130 Most of the explosives formulations are composed ofbinders, oxidizers and explosives. For instance, stabilizers areadded to ester based rocket-propellants for the formation ofa stable product.132 Raman spectroscopy technique can be usedas an effective tool for non-destructive and rapid evaluation andmonitoring of the individual components of the formulation.Additionally, the depletion of the components over time can bemonitored during ageing studies of stabilizers. Similarly,different polymorphic forms of explosives can also be deter-mined using Raman spectroscopy.133,134 Recent trends in thedevelopment of high explosives molecules have shied towardsengineering co-crystals of explosives molecules to distinctproperties such as greater detonation velocities withoutcompromising with impact or friction sensitivities.135–137 Raman
This journal is © The Royal Society of Chemistry 2018
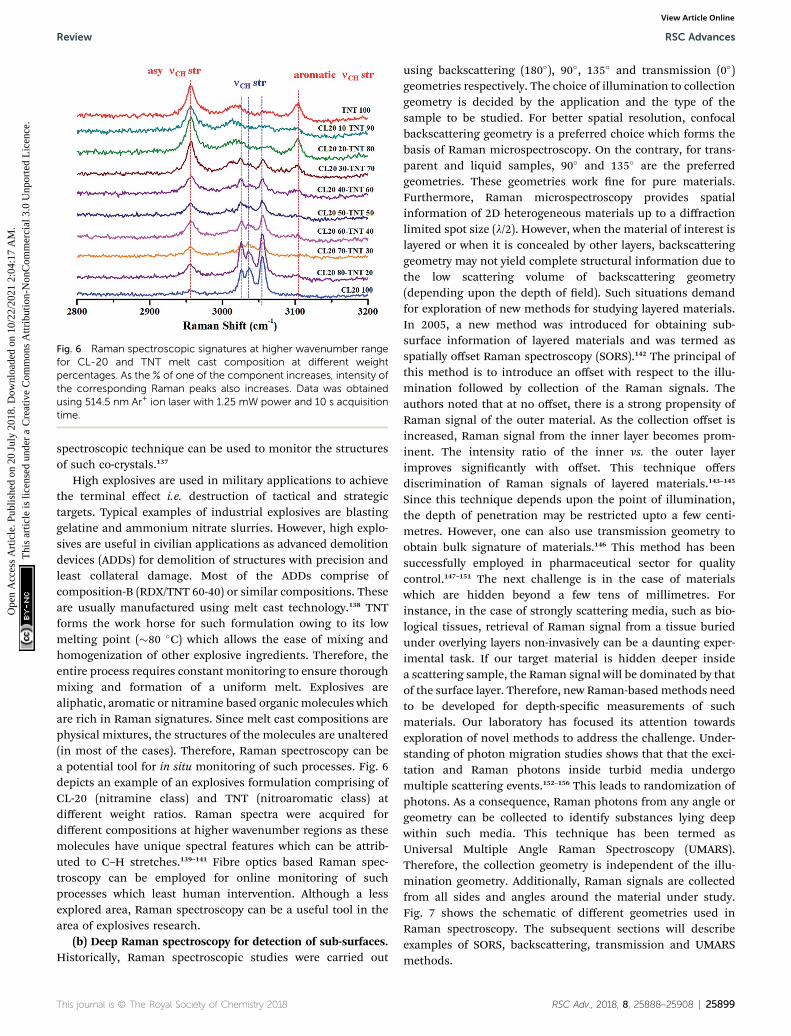
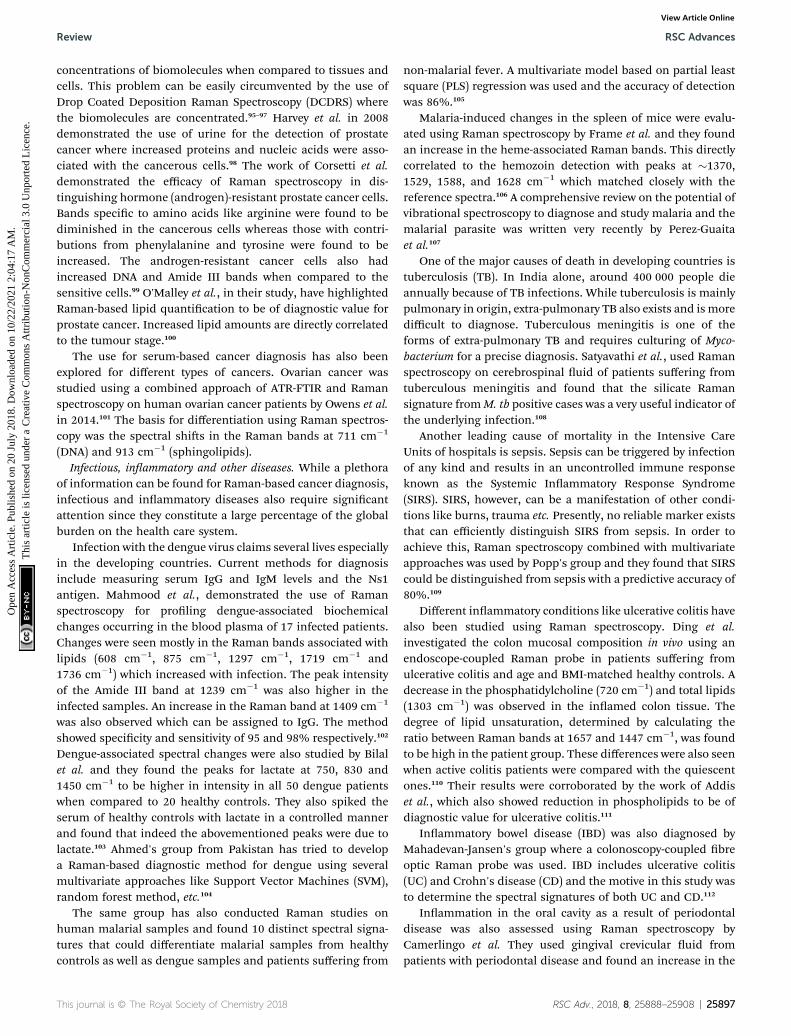
Fig. 6 Raman spectroscopic signatures at higher wavenumber rangefor CL-20 and TNT melt cast composition at different weightpercentages. As the % of one of the component increases, intensity ofthe corresponding Raman peaks also increases. Data was obtainedusing 514.5 nm Ar+ ion laser with 1.25 mW power and 10 s acquisitiontime.
Review RSC Advances
Ope
n A
cces
s A
rtic
le. P
ublis
hed
on 2
0 Ju
ly 2
018.
Dow
nloa
ded
on 1
0/22
/202
1 2:
04:1
7 A
M.
Thi
s ar
ticle
is li
cens
ed u
nder
a C
reat
ive
Com
mon
s A
ttrib
utio
n-N
onC
omm
erci
al 3
.0 U
npor
ted
Lic
ence
.View Article Online
spectroscopic technique can be used to monitor the structuresof such co-crystals.137
High explosives are used in military applications to achievethe terminal effect i.e. destruction of tactical and strategictargets. Typical examples of industrial explosives are blastinggelatine and ammonium nitrate slurries. However, high explo-sives are useful in civilian applications as advanced demolitiondevices (ADDs) for demolition of structures with precision andleast collateral damage. Most of the ADDs comprise ofcomposition-B (RDX/TNT 60-40) or similar compositions. Theseare usually manufactured using melt cast technology.138 TNTforms the work horse for such formulation owing to its lowmelting point (�80 �C) which allows the ease of mixing andhomogenization of other explosive ingredients. Therefore, theentire process requires constant monitoring to ensure thoroughmixing and formation of a uniform melt. Explosives arealiphatic, aromatic or nitramine based organic molecules whichare rich in Raman signatures. Since melt cast compositions arephysical mixtures, the structures of the molecules are unaltered(in most of the cases). Therefore, Raman spectroscopy can bea potential tool for in situ monitoring of such processes. Fig. 6depicts an example of an explosives formulation comprising ofCL-20 (nitramine class) and TNT (nitroaromatic class) atdifferent weight ratios. Raman spectra were acquired fordifferent compositions at higher wavenumber regions as thesemolecules have unique spectral features which can be attrib-uted to C–H stretches.139–141 Fibre optics based Raman spec-troscopy can be employed for online monitoring of suchprocesses which least human intervention. Although a lessexplored area, Raman spectroscopy can be a useful tool in thearea of explosives research.
(b) Deep Raman spectroscopy for detection of sub-surfaces.Historically, Raman spectroscopic studies were carried out
This journal is © The Royal Society of Chemistry 2018
using backscattering (180�), 90�, 135� and transmission (0�)geometries respectively. The choice of illumination to collectiongeometry is decided by the application and the type of thesample to be studied. For better spatial resolution, confocalbackscattering geometry is a preferred choice which forms thebasis of Raman microspectroscopy. On the contrary, for trans-parent and liquid samples, 90� and 135� are the preferredgeometries. These geometries work ne for pure materials.Furthermore, Raman microspectroscopy provides spatialinformation of 2D heterogeneous materials up to a diffractionlimited spot size (l/2). However, when the material of interest islayered or when it is concealed by other layers, backscatteringgeometry may not yield complete structural information due tothe low scattering volume of backscattering geometry(depending upon the depth of eld). Such situations demandfor exploration of new methods for studying layered materials.In 2005, a new method was introduced for obtaining sub-surface information of layered materials and was termed asspatially offset Raman spectroscopy (SORS).142 The principal ofthis method is to introduce an offset with respect to the illu-mination followed by collection of the Raman signals. Theauthors noted that at no offset, there is a strong propensity ofRaman signal of the outer material. As the collection offset isincreased, Raman signal from the inner layer becomes prom-inent. The intensity ratio of the inner vs. the outer layerimproves signicantly with offset. This technique offersdiscrimination of Raman signals of layered materials.143–145
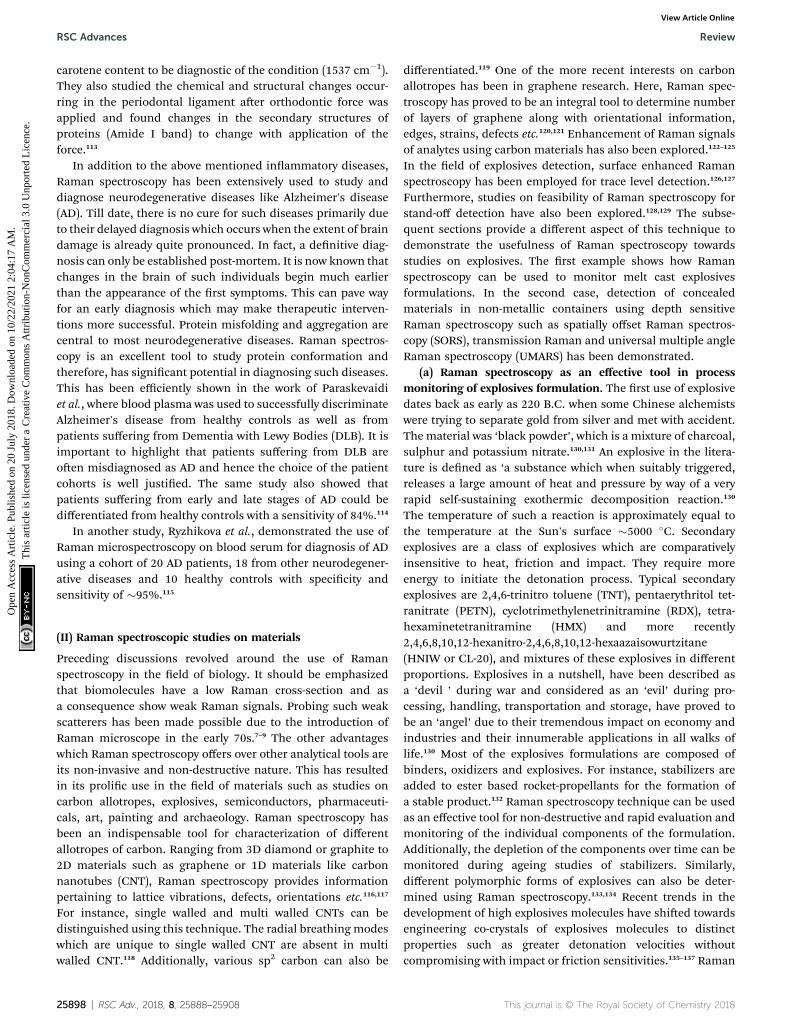
Since this technique depends upon the point of illumination,the depth of penetration may be restricted upto a few centi-metres. However, one can also use transmission geometry toobtain bulk signature of materials.146 This method has beensuccessfully employed in pharmaceutical sector for qualitycontrol.147–151 The next challenge is in the case of materialswhich are hidden beyond a few tens of millimetres. Forinstance, in the case of strongly scattering media, such as bio-logical tissues, retrieval of Raman signal from a tissue buriedunder overlying layers non-invasively can be a daunting exper-imental task. If our target material is hidden deeper insidea scattering sample, the Raman signal will be dominated by thatof the surface layer. Therefore, new Raman-basedmethods needto be developed for depth-specic measurements of suchmaterials. Our laboratory has focused its attention towardsexploration of novel methods to address the challenge. Under-standing of photon migration studies shows that that the exci-tation and Raman photons inside turbid media undergomultiple scattering events.152–156 This leads to randomization ofphotons. As a consequence, Raman photons from any angle orgeometry can be collected to identify substances lying deepwithin such media. This technique has been termed asUniversal Multiple Angle Raman Spectroscopy (UMARS).Therefore, the collection geometry is independent of the illu-mination geometry. Additionally, Raman signals are collectedfrom all sides and angles around the material under study.Fig. 7 shows the schematic of different geometries used inRaman spectroscopy. The subsequent sections will describeexamples of SORS, backscattering, transmission and UMARSmethods.
RSC Adv., 2018, 8, 25888–25908 | 25899
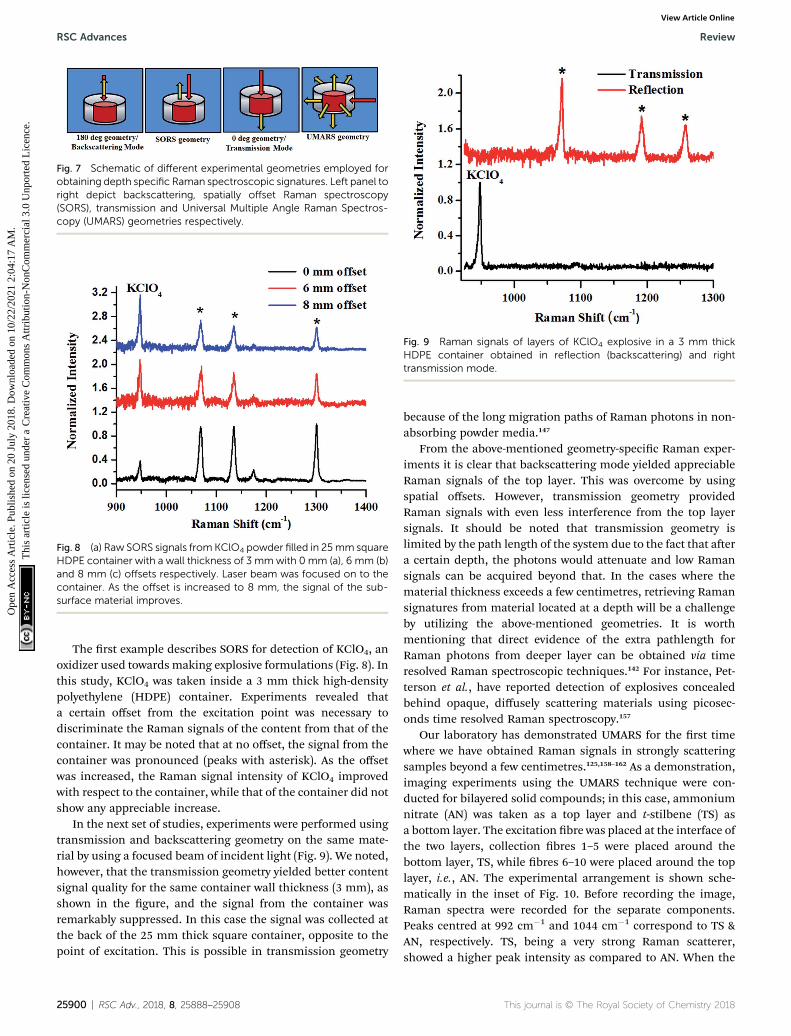
Fig. 7 Schematic of different experimental geometries employed forobtaining depth specific Raman spectroscopic signatures. Left panel toright depict backscattering, spatially offset Raman spectroscopy(SORS), transmission and Universal Multiple Angle Raman Spectros-copy (UMARS) geometries respectively.
Fig. 8 (a) Raw SORS signals from KClO4 powder filled in 25mm squareHDPE container with a wall thickness of 3 mmwith 0 mm (a), 6 mm (b)and 8 mm (c) offsets respectively. Laser beam was focused on to thecontainer. As the offset is increased to 8 mm, the signal of the sub-surface material improves.
Fig. 9 Raman signals of layers of KClO4 explosive in a 3 mm thickHDPE container obtained in reflection (backscattering) and righttransmission mode.
RSC Advances Review
Ope
n A
cces
s A
rtic
le. P
ublis
hed
on 2
0 Ju
ly 2
018.
Dow
nloa
ded
on 1
0/22
/202
1 2:
04:1
7 A
M.
Thi
s ar
ticle
is li
cens
ed u
nder
a C
reat
ive
Com
mon
s A
ttrib
utio
n-N
onC
omm
erci
al 3
.0 U
npor
ted
Lic
ence
.View Article Online
The rst example describes SORS for detection of KClO4, anoxidizer used towards making explosive formulations (Fig. 8). Inthis study, KClO4 was taken inside a 3 mm thick high-densitypolyethylene (HDPE) container. Experiments revealed thata certain offset from the excitation point was necessary todiscriminate the Raman signals of the content from that of thecontainer. It may be noted that at no offset, the signal from thecontainer was pronounced (peaks with asterisk). As the offsetwas increased, the Raman signal intensity of KClO4 improvedwith respect to the container, while that of the container did notshow any appreciable increase.
In the next set of studies, experiments were performed usingtransmission and backscattering geometry on the same mate-rial by using a focused beam of incident light (Fig. 9). We noted,however, that the transmission geometry yielded better contentsignal quality for the same container wall thickness (3 mm), asshown in the gure, and the signal from the container wasremarkably suppressed. In this case the signal was collected atthe back of the 25 mm thick square container, opposite to thepoint of excitation. This is possible in transmission geometry
25900 | RSC Adv., 2018, 8, 25888–25908
because of the long migration paths of Raman photons in non-absorbing powder media.147
From the above-mentioned geometry-specic Raman exper-iments it is clear that backscattering mode yielded appreciableRaman signals of the top layer. This was overcome by usingspatial offsets. However, transmission geometry providedRaman signals with even less interference from the top layersignals. It should be noted that transmission geometry islimited by the path length of the system due to the fact that aera certain depth, the photons would attenuate and low Ramansignals can be acquired beyond that. In the cases where thematerial thickness exceeds a few centimetres, retrieving Ramansignatures from material located at a depth will be a challengeby utilizing the above-mentioned geometries. It is worthmentioning that direct evidence of the extra pathlength forRaman photons from deeper layer can be obtained via timeresolved Raman spectroscopic techniques.142 For instance, Pet-terson et al., have reported detection of explosives concealedbehind opaque, diffusely scattering materials using picosec-onds time resolved Raman spectroscopy.157
Our laboratory has demonstrated UMARS for the rst timewhere we have obtained Raman signals in strongly scatteringsamples beyond a few centimetres.125,158–162 As a demonstration,imaging experiments using the UMARS technique were con-ducted for bilayered solid compounds; in this case, ammoniumnitrate (AN) was taken as a top layer and t-stilbene (TS) asa bottom layer. The excitation bre was placed at the interface ofthe two layers, collection bres 1–5 were placed around thebottom layer, TS, while bres 6–10 were placed around the toplayer, i.e., AN. The experimental arrangement is shown sche-matically in the inset of Fig. 10. Before recording the image,Raman spectra were recorded for the separate components.Peaks centred at 992 cm�1 and 1044 cm�1 correspond to TS &AN, respectively. TS, being a very strong Raman scatterer,showed a higher peak intensity as compared to AN. When the
This journal is © The Royal Society of Chemistry 2018
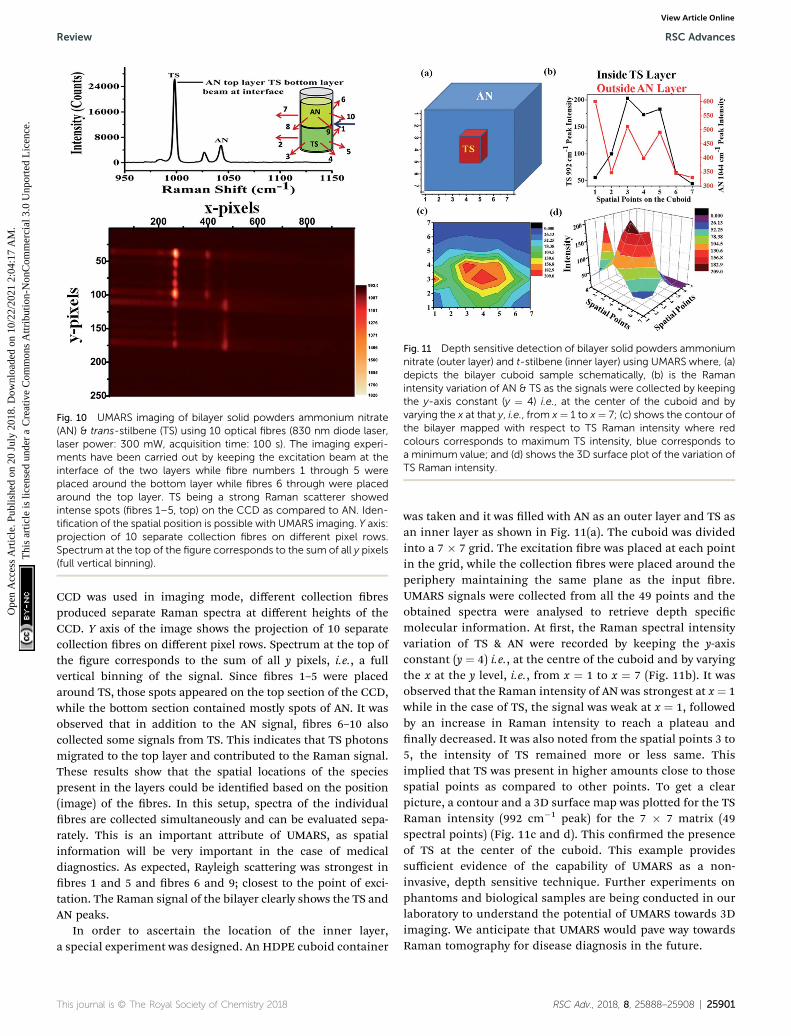
Fig. 10 UMARS imaging of bilayer solid powders ammonium nitrate(AN) & trans-stilbene (TS) using 10 optical fibres (830 nm diode laser,laser power: 300 mW, acquisition time: 100 s). The imaging experi-ments have been carried out by keeping the excitation beam at theinterface of the two layers while fibre numbers 1 through 5 wereplaced around the bottom layer while fibres 6 through were placedaround the top layer. TS being a strong Raman scatterer showedintense spots (fibres 1–5, top) on the CCD as compared to AN. Iden-tification of the spatial position is possible with UMARS imaging. Y axis:projection of 10 separate collection fibres on different pixel rows.Spectrum at the top of the figure corresponds to the sum of all y pixels(full vertical binning).
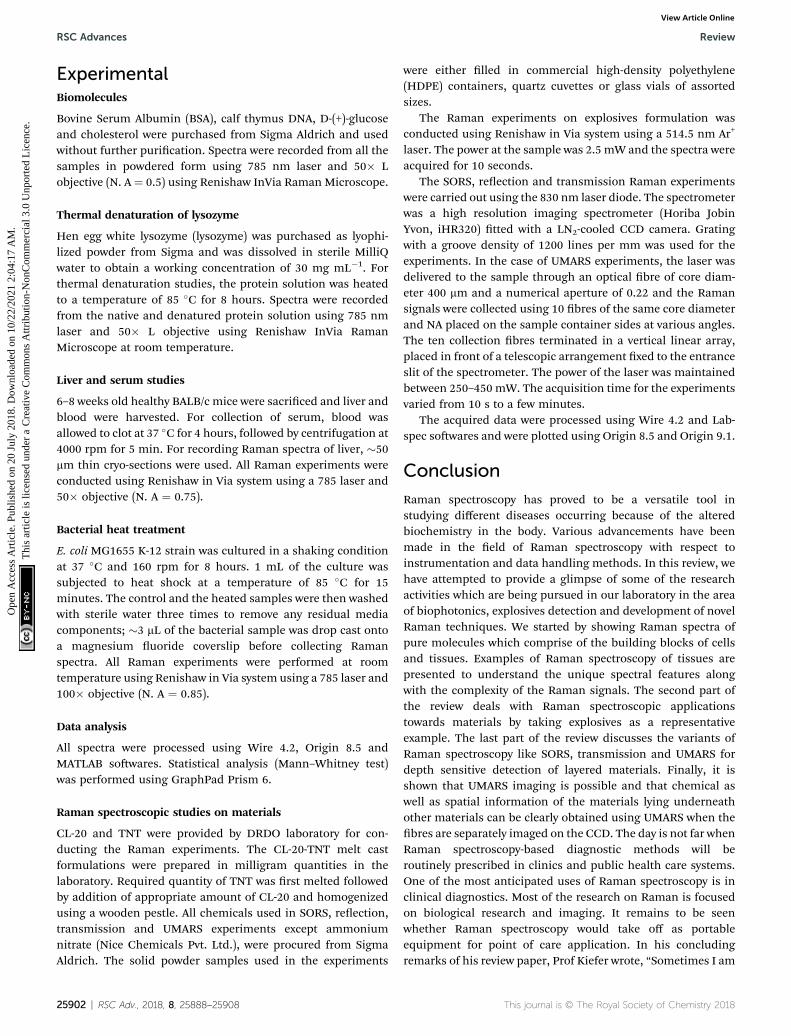
Fig. 11 Depth sensitive detection of bilayer solid powders ammoniumnitrate (outer layer) and t-stilbene (inner layer) using UMARS where, (a)depicts the bilayer cuboid sample schematically, (b) is the Ramanintensity variation of AN & TS as the signals were collected by keepingthe y-axis constant (y ¼ 4) i.e., at the center of the cuboid and byvarying the x at that y, i.e., from x ¼ 1 to x ¼ 7; (c) shows the contour ofthe bilayer mapped with respect to TS Raman intensity where redcolours corresponds to maximum TS intensity, blue corresponds toa minimum value; and (d) shows the 3D surface plot of the variation ofTS Raman intensity.
Review RSC Advances
Ope
n A
cces
s A
rtic
le. P
ublis
hed
on 2
0 Ju
ly 2
018.
Dow
nloa
ded
on 1
0/22
/202
1 2:
04:1
7 A
M.
Thi
s ar
ticle
is li
cens
ed u
nder
a C
reat
ive
Com
mon
s A
ttrib
utio
n-N
onC
omm
erci
al 3
.0 U
npor
ted
Lic
ence
.View Article Online
CCD was used in imaging mode, different collection bresproduced separate Raman spectra at different heights of theCCD. Y axis of the image shows the projection of 10 separatecollection bres on different pixel rows. Spectrum at the top ofthe gure corresponds to the sum of all y pixels, i.e., a fullvertical binning of the signal. Since bres 1–5 were placedaround TS, those spots appeared on the top section of the CCD,while the bottom section contained mostly spots of AN. It wasobserved that in addition to the AN signal, bres 6–10 alsocollected some signals from TS. This indicates that TS photonsmigrated to the top layer and contributed to the Raman signal.These results show that the spatial locations of the speciespresent in the layers could be identied based on the position(image) of the bres. In this setup, spectra of the individualbres are collected simultaneously and can be evaluated sepa-rately. This is an important attribute of UMARS, as spatialinformation will be very important in the case of medicaldiagnostics. As expected, Rayleigh scattering was strongest inbres 1 and 5 and bres 6 and 9; closest to the point of exci-tation. The Raman signal of the bilayer clearly shows the TS andAN peaks.
In order to ascertain the location of the inner layer,a special experiment was designed. An HDPE cuboid container
This journal is © The Royal Society of Chemistry 2018
was taken and it was lled with AN as an outer layer and TS asan inner layer as shown in Fig. 11(a). The cuboid was dividedinto a 7 � 7 grid. The excitation bre was placed at each pointin the grid, while the collection bres were placed around theperiphery maintaining the same plane as the input bre.UMARS signals were collected from all the 49 points and theobtained spectra were analysed to retrieve depth specicmolecular information. At rst, the Raman spectral intensityvariation of TS & AN were recorded by keeping the y-axisconstant (y ¼ 4) i.e., at the centre of the cuboid and by varyingthe x at the y level, i.e., from x ¼ 1 to x ¼ 7 (Fig. 11b). It wasobserved that the Raman intensity of AN was strongest at x ¼ 1while in the case of TS, the signal was weak at x ¼ 1, followedby an increase in Raman intensity to reach a plateau andnally decreased. It was also noted from the spatial points 3 to5, the intensity of TS remained more or less same. Thisimplied that TS was present in higher amounts close to thosespatial points as compared to other points. To get a clearpicture, a contour and a 3D surface map was plotted for the TSRaman intensity (992 cm�1 peak) for the 7 � 7 matrix (49spectral points) (Fig. 11c and d). This conrmed the presenceof TS at the center of the cuboid. This example providessufficient evidence of the capability of UMARS as a non-invasive, depth sensitive technique. Further experiments onphantoms and biological samples are being conducted in ourlaboratory to understand the potential of UMARS towards 3Dimaging. We anticipate that UMARS would pave way towardsRaman tomography for disease diagnosis in the future.
RSC Adv., 2018, 8, 25888–25908 | 25901
RSC Advances Review
Ope
n A
cces
s A
rtic
le. P
ublis
hed
on 2
0 Ju
ly 2
018.
Dow
nloa
ded
on 1
0/22
/202
1 2:
04:1
7 A
M.
Thi
s ar
ticle
is li
cens
ed u
nder
a C
reat
ive
Com
mon
s A
ttrib
utio
n-N
onC
omm
erci
al 3
.0 U
npor
ted
Lic
ence
.View Article Online
ExperimentalBiomolecules
Bovine Serum Albumin (BSA), calf thymus DNA, D-(+)-glucoseand cholesterol were purchased from Sigma Aldrich and usedwithout further purication. Spectra were recorded from all thesamples in powdered form using 785 nm laser and 50� Lobjective (N. A¼ 0.5) using Renishaw InVia Raman Microscope.
Thermal denaturation of lysozyme
Hen egg white lysozyme (lysozyme) was purchased as lyophi-lized powder from Sigma and was dissolved in sterile MilliQwater to obtain a working concentration of 30 mg mL�1. Forthermal denaturation studies, the protein solution was heatedto a temperature of 85 �C for 8 hours. Spectra were recordedfrom the native and denatured protein solution using 785 nmlaser and 50� L objective using Renishaw InVia RamanMicroscope at room temperature.
Liver and serum studies
6–8 weeks old healthy BALB/c mice were sacriced and liver andblood were harvested. For collection of serum, blood wasallowed to clot at 37 �C for 4 hours, followed by centrifugation at4000 rpm for 5 min. For recording Raman spectra of liver, �50mm thin cryo-sections were used. All Raman experiments wereconducted using Renishaw in Via system using a 785 laser and50� objective (N. A ¼ 0.75).
Bacterial heat treatment
E. coli MG1655 K-12 strain was cultured in a shaking conditionat 37 �C and 160 rpm for 8 hours. 1 mL of the culture wassubjected to heat shock at a temperature of 85 �C for 15minutes. The control and the heated samples were then washedwith sterile water three times to remove any residual mediacomponents; �3 mL of the bacterial sample was drop cast ontoa magnesium uoride coverslip before collecting Ramanspectra. All Raman experiments were performed at roomtemperature using Renishaw in Via system using a 785 laser and100� objective (N. A ¼ 0.85).
Data analysis
All spectra were processed using Wire 4.2, Origin 8.5 andMATLAB sowares. Statistical analysis (Mann–Whitney test)was performed using GraphPad Prism 6.
Raman spectroscopic studies on materials
CL-20 and TNT were provided by DRDO laboratory for con-ducting the Raman experiments. The CL-20-TNT melt castformulations were prepared in milligram quantities in thelaboratory. Required quantity of TNT was rst melted followedby addition of appropriate amount of CL-20 and homogenizedusing a wooden pestle. All chemicals used in SORS, reection,transmission and UMARS experiments except ammoniumnitrate (Nice Chemicals Pvt. Ltd.), were procured from SigmaAldrich. The solid powder samples used in the experiments
25902 | RSC Adv., 2018, 8, 25888–25908
were either lled in commercial high-density polyethylene(HDPE) containers, quartz cuvettes or glass vials of assortedsizes.
The Raman experiments on explosives formulation wasconducted using Renishaw in Via system using a 514.5 nm Ar+
laser. The power at the sample was 2.5 mW and the spectra wereacquired for 10 seconds.
The SORS, reection and transmission Raman experimentswere carried out using the 830 nm laser diode. The spectrometerwas a high resolution imaging spectrometer (Horiba JobinYvon, iHR320) tted with a LN2-cooled CCD camera. Gratingwith a groove density of 1200 lines per mm was used for theexperiments. In the case of UMARS experiments, the laser wasdelivered to the sample through an optical bre of core diam-eter 400 mm and a numerical aperture of 0.22 and the Ramansignals were collected using 10 bres of the same core diameterand NA placed on the sample container sides at various angles.The ten collection bres terminated in a vertical linear array,placed in front of a telescopic arrangement xed to the entranceslit of the spectrometer. The power of the laser was maintainedbetween 250–450 mW. The acquisition time for the experimentsvaried from 10 s to a few minutes.
The acquired data were processed using Wire 4.2 and Lab-spec sowares and were plotted using Origin 8.5 and Origin 9.1.
Conclusion
Raman spectroscopy has proved to be a versatile tool instudying different diseases occurring because of the alteredbiochemistry in the body. Various advancements have beenmade in the eld of Raman spectroscopy with respect toinstrumentation and data handling methods. In this review, wehave attempted to provide a glimpse of some of the researchactivities which are being pursued in our laboratory in the areaof biophotonics, explosives detection and development of novelRaman techniques. We started by showing Raman spectra ofpure molecules which comprise of the building blocks of cellsand tissues. Examples of Raman spectroscopy of tissues arepresented to understand the unique spectral features alongwith the complexity of the Raman signals. The second part ofthe review deals with Raman spectroscopic applicationstowards materials by taking explosives as a representativeexample. The last part of the review discusses the variants ofRaman spectroscopy like SORS, transmission and UMARS fordepth sensitive detection of layered materials. Finally, it isshown that UMARS imaging is possible and that chemical aswell as spatial information of the materials lying underneathother materials can be clearly obtained using UMARS when thebres are separately imaged on the CCD. The day is not far whenRaman spectroscopy-based diagnostic methods will beroutinely prescribed in clinics and public health care systems.One of the most anticipated uses of Raman spectroscopy is inclinical diagnostics. Most of the research on Raman is focusedon biological research and imaging. It remains to be seenwhether Raman spectroscopy would take off as portableequipment for point of care application. In his concludingremarks of his review paper, Prof Kiefer wrote, “Sometimes I am
This journal is © The Royal Society of Chemistry 2018
Review RSC Advances
Ope
n A
cces
s A
rtic
le. P
ublis
hed
on 2
0 Ju
ly 2
018.
Dow
nloa
ded
on 1
0/22
/202
1 2:
04:1
7 A
M.
Thi
s ar
ticle
is li
cens
ed u
nder
a C
reat
ive
Com
mon
s A
ttrib
utio
n-N
onC
omm
erci
al 3
.0 U
npor
ted
Lic
ence
.View Article Online
asking myself what cannot be done with Raman spectroscopy –a wonderful analytical tool for science and technology whichwas discovered by Sir Chandrashekhar Venkata Raman andKrishnan already eight decades ago at the Indian Associationfor the Cultivation of Science in Calcutta, India. I am lookingforward for many more years of signicant advancements inthis research eld.163”
Conflicts of interest
There are no conicts to declare.
Acknowledgements
The authors gratefully acknowledge Department of Science &Technology, Defence Research & Development Organization,Council of Scientic & Industrial Research, Indian Institute ofScience, Bangalore for their nancial support. S. U. acknowl-edges the J. C. Bose fellowship from DST.
References
1 R. L. McCreery, Raman Spectroscopy for Chemical Analysis,Wiley, 2005.
2 R. S. Das and Y. K. Agrawal, Raman spectroscopy: Recentadvancements, techniques and applications, Vib.Spectrosc., 2011, 57, 163–176.
3 D. A. Long, Raman Spectroscopy, New York, McGraw-Hill,1977.
4 L. A. Lyon, C. D. Keating, A. P. Fox, B. E. Baker, L. He,S. R. Nicewarner, et al., Raman spectroscopy, Anal. Chem.,1998, 70, 341R–61R.
5 P. Vandenabeele, H. G. M. Edwards and L. Moens, A decadeof Raman spectroscopy in art and archaeology, Chem. Rev.,2007, 107, 675–686.
6 H. J. Butler, S. W. Fogarty, J. G. Kerns, P. L. Martin-Hirsch,N. J. Fullwood and F. L. Martin, Gold nanoparticles asa substrate in bio-analytical near-infrared surface-enhanced Raman spectroscopy, Analyst, 2015, 140, 3090–3097.
7 J. Barbillat, P. Dhamelincourt, M. Delhaye and E. Dasilva,Raman Confocal Microprobing, Imaging and FiberopticRemote-Sensing – a Further Step in Molecular Analysis, J.Raman Spectrosc., 1994, 25, 3–11.
8 M. Delhaye and P. Dhamelincourt, Raman Microprobe andMicroscope with Laser Excitation, J. Raman Spectrosc., 1975,3, 33–43.
9 R. L. Mccreery, M. Fleischmann and P. Hendra, Fiber OpticProbe for Remote Raman Spectrometry, Anal. Chem., 1983,55, 146–148.
10 M. G. Albrecht and J. A. Creighton, Anomalously IntenseRaman-Spectra of Pyridine at a Silver Electrode, J. Am.Chem. Soc., 1977, 99, 5215–5217.
11 A. Campion and P. Kambhampati, Surface-enhancedRaman scattering, Chem. Soc. Rev., 1998, 27, 241–250.
This journal is © The Royal Society of Chemistry 2018
12 M. Fleischmann, P. J. Hendra and A. J. Mcquillan, Raman-Spectra of Pyridine Adsorbed at a Silver Electrode, Chem.Phys. Lett., 1974, 26, 163–166.
13 D. L. Jeanmaire and R. P. Vanduyne, Surface RamanSpectroelectrochemistry 1 Heterocyclic, Aromatic, andAliphatic-Amines Adsorbed on Anodized Silver Electrode,J. Electroanal. Chem., 1977, 84, 1–20.
14 K. Kneipp, Y. Wang, H. Kneipp, L. T. Perelman, I. Itzkan,R. Dasari, et al., Single molecule detection using surface-enhanced Raman scattering (SERS), Phys. Rev. Lett., 1997,78, 1667–1670.
15 E. C. Le Ru and P. G. Etchegoin, Single-Molecule Surface-Enhanced Raman Spectroscopy, Annu. Rev. Phys. Chem.,2012, 63, 65–87.
16 S. M. Nie and S. R. Emery, Probing single molecules andsingle nanoparticles by surface-enhanced Ramanscattering, Science, 1997, 275, 1102–1106.
17 W. Xie and S. Schlucker, Medical applications of surface-enhanced Raman scattering, Phys. Chem. Chem. Phys.,2013, 15, 5329–5344.
18 O. Ibrahim, A. Maguire, A. D. Meade, S. Flint, M. Toner,H. J. Byrne, et al., Improved protocols for pre-processingRaman spectra of formalin xed paraffin preserved tissuesections, Anal. Methods, 2017, 9, 4709–4717.
19 F. Downey, N. Cade, R. Cook, R. Springall, C. Gillet andD. Richards, et al., Use of Raman Spectroscopy inCharacterizing Formalin-Fixed, Paraffin-Embedded BreastTumor Samples (abstract), AIP Conf. Proc., 2009, 1119, p.211.
20 J. De Gelder, K. De Gussem, P. Vandenabeele and L. Moens,Reference database of Raman spectra of biologicalmolecules, J. Raman Spectrosc., 2007, 38, 1133–1147.
21 P. R. Carey, Biochemical applications of Raman and resonanceRaman spectroscopies, New York, Academic Press, 1982.
22 R. H. Schirmer and G. E. Sa, Principles of Protein Structure,Berlin-Heidelberg-New York, Springer-Verlag, 1979.
23 T. K. Chaudhuri and S. Paul, Protein-misfolding diseasesand chaperone-based therapeutic approaches, FEBS J.,2006, 273, 1331–1349.
24 F. U. Hartl, Protein Misfolding Diseases, Annu. Rev.Biochem., 2017, 86, 21–26.
25 A. Rygula, K. Majzner, K. M. Marzec, A. Kaczor, M. Pilarczykand M. Baranska, Raman spectroscopy of proteins:a review, J. Raman Spectrosc., 2013, 44, 1061–1076.
26 N. C. Maiti, M. M. Apetri, M. G. Zagorski, P. R. Carey andV. E. Anderson, Raman spectroscopic characterization ofsecondary structure in natively unfolded proteins: alpha-synuclein, J. Am. Chem. Soc., 2004, 126, 2399–2408.
27 J. L. Lippert, D. Tyminski and P. J. Desmeules,Determination of the secondary structure of proteins bylaser Raman spectroscopy, J. Am. Chem. Soc., 1976, 98,7075–7080.
28 R. W. Williams, Protein Secondary Structure-Analysis UsingRaman Amide-I and Amide-III Spectra, Methods Enzymol.,1986, 130, 311–331.
RSC Adv., 2018, 8, 25888–25908 | 25903
RSC Advances Review
Ope
n A
cces
s A
rtic
le. P
ublis
hed
on 2
0 Ju
ly 2
018.
Dow
nloa
ded
on 1
0/22
/202
1 2:
04:1
7 A
M.
Thi
s ar
ticle
is li
cens
ed u
nder
a C
reat
ive
Com
mon
s A
ttrib
utio
n-N
onC
omm
erci
al 3
.0 U
npor
ted
Lic
ence
.View Article Online
29 A. Ianoul, M. N. Boyden and S. A. Asher, Dependence of thepeptide Amide III vibration on the phi dihedral angle, J. Am.Chem. Soc., 2001, 123, 7433–7434.
30 A. V. Mikhonin, S. V. Bykov, N. S. Myshakina andS. A. Asher, Peptide secondary structure folding reactioncoordinate: correlation between uv raman Amide IIIfrequency, Psi Ramachandran angle, and hydrogenbonding, J. Phys. Chem. B, 2006, 110, 1928–1943.
31 G. J. Thomas, New structural insights from RamanSpectroscopy of proteins and their assemblies,Biopolymers, 2002, 67, 214–225.
32 P. R. Carey, Raman crystallography and other biochemicalapplications of Raman microscopy, Annu. Rev. Phys.Chem., 2006, 57, 527–554.
33 M. S. Helfand, M. A. Totir, M. P. Carey, A. M. Hujer,R. A. Bonomo and P. R. Carey, Following the reactions ofmechanism-based inhibitors with beta-lactamase byRaman crystallography, Biochemistry, 2003, 42, 13386–13392.
34 S. J. Hamodrakas, S. A. Asher, G. D. Mazur, J. C. Regier andF. C. Kafatos, Laser Raman studies of protein conformationin the silkmoth chorion, Biochim. Biophys. Acta, 1982, 703,216–222.
35 S. Mangialardo, F. Piccirilli, A. Perucchi, P. Dore andP. Postorino, Raman analysis of insulin denaturationinduced by high-pressure and thermal treatments, J.Raman Spectrosc., 2012, 43, 692–700.
36 R. W. Williams and A. K. Dunker, Determination of thesecondary structure of proteins from the Amide I band ofthe laser Raman spectrum, J. Mol. Biol., 1981, 152, 783–813.
37 R. Tuma, Raman spectroscopy of proteins: from peptides tolarge assemblies, J. Raman Spectrosc., 2005, 36, 307–319.
38 J. Bandekar, Amide Modes and Protein Conformation,Biochim. Biophys. Acta, 1992, 1120, 123–143.
39 S. Cai and B. R. Singh, Identication of beta-turn andrandom coil Amide III infrared bands for secondarystructure estimation of proteins, Biophys. Chem., 1999, 80,7–20.
40 K. Nakamura, S. Era, Y. Ozaki, M. Sogami, T. Hayashi andM. Murakami, Conformational changes in seventeencystine disulde bridges of bovine serum albumin provedby Raman spectroscopy, FEBS Lett., 1997, 417, 375–378.
41 A. Dong, P. Huang and W. S. Caughey, Protein secondarystructures in water from second-derivative Amide Iinfrared spectra, Biochemistry, 1990, 29, 3303–3308.
42 B. Hernandez, Y. M. Coic, F. Puger, S. G. Kruglik andM. Ghomi, All characteristic Raman markers of tyrosineand tyrosinate originate from phenol ring fundamentalvibrations, J. Raman Spectrosc., 2016, 47, 210–220.
43 M. N. Siamwiza, R. C. Lord, M. C. Chen, T. Takamatsu,I. Harada, H. Matsuura, et al., Interpretation of thedoublet at 850 and 830 cm�1 in the Raman spectra oftyrosyl residues in proteins and certain modelcompounds, Biochemistry, 1975, 14, 4870–4876.
44 H. Takeuchi, Raman structural markers of tryptophan andhistidine side chains in proteins, Biopolymers, 2003, 72,305–317.
25904 | RSC Adv., 2018, 8, 25888–25908
45 T. Miura, H. Takeuchi and I. Harada, Characterization ofIndividual Tryptophan Side-Chains in Proteins UsingRaman-Spectroscopy and Hydrogen-Deuterium ExchangeKinetics, Biochemistry, 1988, 27, 88–94.
46 B. Hernandez, F. Puger, S. G. Kruglik and M. Ghomi,Characteristic Raman lines of phenylalanine analyzed bya multiconformational approach, J. Raman Spectrosc.,2013, 44, 827–833.
47 R. C. Lord and G. J. Thomas Jr, Raman studies of nucleicacids II Aqueous purine and pyrimidine mixtures,Biochim. Biophys. Acta, 1967, 142, 1–11.
48 P. Piredda, M. Berning, P. Boukamp and A. Volkmer,Subcellular Raman Microspectroscopy Imaging of NucleicAcids and Tryptophan for Distinction of Normal HumanSkin Cells and Tumorigenic Keratinocytes, Anal. Chem.,2015, 87, 6778–6785.
49 A. C. S. Talari, C. A. Evans, I. Holen, R. E. Coleman andI. U. Rehman, Raman spectroscopic analysis differentiatesbetween breast cancer cell lines, J. Raman Spectrosc., 2015,46, 421–427.
50 J. L. Denbigh, D. Perez-Guaita, R. R. Vernooij, M. J. Tobin,K. R. Bambery, Y. Xu, et al., Probing the action of a novelanti-leukaemic drug therapy at the single cell level usingmodern vibrational spectroscopy techniques, Sci. Rep.,2017, 7, 2649.
51 A. Dutta, R. Gautam, S. Chatterjee, F. Ariese, S. K. Sikdarand S. Umapathy, Ascorbate protects neurons againstoxidative stress: a Raman microspectroscopic study, ACSChem. Neurosci., 2015, 6, 1794–1801.
52 J. M. Benevides and G. J. Thomas, Characterization of DNAStructures by Raman-Spectroscopy –High-Salt and Low-SaltForms of Double Helical Poly(Dg-Dc) in H2O and D2OSolutions and Application to B-DNA, Z-DNA and A-DNA,Nucleic Acids Res., 1983, 11, 5747–5761.
53 J. Duguid, V. A. Bloomeld, J. Benevides and G. J. Thomas,Raman-Spectroscopy of DNA-Metal Complexes .1.Interactions and Conformational Effects of the Divalent-Cations – Mg, Ca, Sr, Ba, Mn, Co, Ni, Cu, Pd, and Cd,Biophys. J., 1993, 65, 1916–1928.
54 K. A. Okotrub, N. V. Surovtsev, V. F. Semeshin andL. V. Omelyanchuk, Raman Spectroscopy for DNAQuantication in Cell Nucleus, Cytometry, Part A, 2015,87A, 68–73.
55 E. Lipiec, R. Sekine, J. Bielecki, W. M. Kwiatek andB. R. Wood, Molecular Characterization of DNA DoubleStrand Breaks with Tip-Enhanced Raman Scattering,Angew. Chem., Int. Ed., 2014, 53, 169–172.
56 E. Bailo and V. Deckert, Tip-enhanced Raman spectroscopyof single RNA strands: Towards a novel direct-sequencingmethod, Angew. Chem., Int. Ed., 2008, 47, 1658–1661.
57 R. Treffer, R. Bohme, T. Deckert-Gaudig, K. Lau, S. Tiede,X. Lin, et al., Advances in TERS (tip-enhanced Ramanscattering) for biochemical applications, Biochem. Soc.Trans., 2012, 40, 609–614.
58 M. M. Hlaing, B. Wood, D. McNaughton, D. Y. Ying andM. A. Augustin, Raman spectroscopic analysis ofLactobacillus rhamnosus GG in response to dehydration
This journal is © The Royal Society of Chemistry 2018
Review RSC Advances
Ope
n A
cces
s A
rtic
le. P
ublis
hed
on 2
0 Ju
ly 2
018.
Dow
nloa
ded
on 1
0/22
/202
1 2:
04:1
7 A
M.
Thi
s ar
ticle
is li
cens
ed u
nder
a C
reat
ive
Com
mon
s A
ttrib
utio
n-N
onC
omm
erci
al 3
.0 U
npor
ted
Lic
ence
.View Article Online
reveals DNA conformation changes, J. Biophotonics, 2017,10, 589–597.
59 J. M. Benevides, S. A. Overman and G. J. Thomas, Raman,polarized Raman and ultraviolet resonance Ramanspectroscopy of nucleic acids and their complexes, J.Raman Spectrosc., 2005, 36, 279–299.
60 K. Czamara, K. Majzner, M. Z. Pacia, K. Kochan, A. Kaczorand M. Baranska, Raman spectroscopy of lipids: a review,J. Raman Spectrosc., 2015, 46, 4–20.
61 S. P. Singh and C. M. Krishna, Raman spectroscopic studiesof oral cancers: correlation of spectral and biochemicalmarkers, Anal. Methods, 2014, 6, 8613–8620.
62 C. Nieva, M. Marro, N. Santana-Codina, S. Rao, D. Petrovand A. Sierra, The lipid phenotype of breast cancer cellscharacterized by Raman microspectroscopy: towardsa stratication of malignancy, PloS one, 2012, 7, e46456.
63 U. Munchberg, L. Wagner, C. Rohrer, K. Voigt, P. Rosch,G. Jahreis, et al., Quantitative assessment of the degree oflipid unsaturation in intact Mortierella by Ramanmicrospectroscopy, Anal. Bioanal. Chem., 2015, 407, 3303–3311.
64 E. Wiercigroch, E. Szafraniec, K. Czamara, M. Z. Pacia,K. Majzner, K. Kochan, et al., Raman and infraredspectroscopy of carbohydrates: A review, Spectrochim. Acta,Part A, 2017, 185, 317–335.
65 P. H. Arboleda and G. R. Loppnow, Raman spectroscopy asa discovery tool in carbohydrate chemistry, Anal. Chem.,2000, 72, 2093–2098.
66 D. A. Stuart, J. M. Yuen, N. Shah, O. Lyandres, C. R. Yonzon,M. R. Glucksberg, et al., In vivo glucose measurement bysurface-enhanced Raman spectroscopy, Anal. Chem., 2006,78, 7211–7215.
67 R. S. Jakubek, J. Handen, S. E. White, S. A. Asher andI. K. Lednev, TrAC, Trends Anal. Chem., 2018, 103, 223–229.
68 P. J. Artymiuk, C. C. F. Blake, D. W. Rice and K. S. Wilson,The structures of the monoclinic and orthorhombic formsof hen egg-white lysozyme at 6 A resolution, ActaCrystallogr., Sect. B: Struct. Crystallogr. Cryst. Chem., 1982,38, 778–783.
69 J. A. Jaros, P. C. Guest, S. Bahn and D. Martins-de-Souza,Affinity depletion of plasma and serum for massspectrometry-based proteome analysis, Methods Mol. Biol.,2013, 1002, 1–11.
70 R. Gautam, S. Vanga, A. Madan, N. Gayathri,U. Nongthomba and S. Umapathy, Raman spectroscopicstudies on screening of myopathies, Anal. Chem., 2015,87, 2187–2194.
71 Z. Movasaghi, S. Rehman and I. U. Rehman, Ramanspectroscopy of biological tissues, Appl. Spectrosc. Rev.,2007, 42, 493–541.
72 S. Kumar, T. Verma, R. Mukherjee, F. Ariese,K. Somasundaram and S. Umapathy, Raman and infra-redmicrospectroscopy: towards quantitative evaluation forclinical research by ratiometric analysis, Chem. Soc. Rev.,2016, 45, 1879–1900.
73 S. Kumar, N. Matange, S. Umapathy and S. S. Visweswariah,Linking carbon metabolism to carotenoid production in
This journal is © The Royal Society of Chemistry 2018
mycobacteria using Raman spectroscopy, FEMS Microbiol.Lett., 2015, 362, 1–6.
74 S. K. Paidi, A. Rizwan, C. Zheng, M. Cheng, K. Glunde andI. Barman, Label-Free Raman Spectroscopy Detects StromalAdaptations in Premetastatic Lungs Primed by BreastCancer, Cancer Res., 2017, 77, 247–256.
75 S. Sil, R. Mukherjee, N. S. Kumar, S. Aravind, J. K. Kingston.and U. Singh, Detection and classication of Bacteria usingRaman Spectroscopy Combined with Multivariate Analysis,Def. Life Sci. J., 2017, 2, 435–441.
76 S. Sil, R. Gautam and S. Umapathy. Applications of Ramanand Infrared Microscopy to Materials and Biology,Molecular and Laser Spectroscopy, Gupta V. P., Elsevier,2018, chp. 6, pp. 117–46.
77 B. Singh, R. Gautam, S. Kumar, B. N. V. Kumar,U. Nongthomba, D. Nandi, et al., Application ofvibrational microspectroscopy to biology and medicine,Curr. Sci., 2012, 102, 232–244.
78 R. Gautam, A. Samuel, S. Sil, D. Chaturvedi, A. Dutta,F. Ariese, et al., Raman and mid-infrared spectroscopicimaging: applications and advancements, Curr. Sci., 2015,108, 341–356.
79 R. Gautam, S. Vanga, F. Ariese and S. Umapathy, Review ofmultidimensional data processing approaches for Ramanand infrared spectroscopy, EPJ Techniques andInstrumentation, 2015, 2, 8.
80 F. Bonnier and H. J. Byrne, Understanding the molecularinformation contained in principal component analysis ofvibrational spectra of biological systems, Analyst, 2012,137, 322–332.
81 H. J. Butler, L. Ashton, B. Bird, G. Cinque, K. Curtis,J. Dorney, et al., Using Raman spectroscopy tocharacterize biological materials, Nat. Protoc., 2016, 11,664–687.
82 M. Kopec and H. Abramczyk, Angiogenesis – a crucial stepin breast cancer growth, progression and dissemination byRaman imaging, Spectrochim. Acta, Part A, 2018, 198, 338–345.
83 S. J. Van Nest, L. M. Nicholson, L. DeVorkin, A. G. Brolo,J. J. Lum and A. Jirasek, Raman Spectroscopic SignaturesReveal Distinct Biochemical and Temporal Changes inIrradiated Human Breast Adenocarcinoma Xenogras,Radiat. Res., 2018, 189, 497–504.
84 D. Chaturvedi, S. A. Balaji, V. K. Bn, F. Ariese, S. Umapathyand A. Rangarajan, Different Phases of Breast Cancer Cells:Raman Study of Immortalized, Transformed, and InvasiveCells, Biosensors, 2016, 6, 57.
85 S. Kim, S. H. Lee, S. Y. Min, K. M. Byun and S. Y. Lee, Dual-modal cancer detection based on optical pH sensing andRaman spectroscopy, J. Biomed. Opt., 2017, 22, 1–6.
86 P. T. Winnard Jr, C. Zhang, F. Vesuna, J. W. Kang, J. Garry,R. R. Dasari, et al., Organ-specic isogenic metastatic breastcancer cell lines exhibit distinct Raman spectral signaturesand metabolomes, Oncotarget, 2017, 8, 20266–20287.
87 J. Desroches, M. Jermyn, M. Pinto, F. Picot, M. A. Tremblay,S. Obaid, et al., A new method using Raman spectroscopy
RSC Adv., 2018, 8, 25888–25908 | 25905
RSC Advances Review
Ope
n A
cces
s A
rtic
le. P
ublis
hed
on 2
0 Ju
ly 2
018.
Dow
nloa
ded
on 1
0/22
/202
1 2:
04:1
7 A
M.
Thi
s ar
ticle
is li
cens
ed u
nder
a C
reat
ive
Com
mon
s A
ttrib
utio
n-N
onC
omm
erci
al 3
.0 U
npor
ted
Lic
ence
.View Article Online
for in vivo targeted brain cancer tissue biopsy, Sci. Rep.,2018, 8, 1792.
88 H. Abramczyk and A. Imiela, The biochemical,nanomechanical and chemometric signatures of braincancer, Spectrochim. Acta, Part A, 2018, 188, 8–19.
89 A. Malik, A. Sahu, S. P. Singh, A. Deshmukh, P. Chaturvedi,D. Nair, et al., In vivo Raman spectroscopy-assisted earlyidentication of potential second primary/recurrences inoral cancers: An exploratory study, Head Neck, 2017, 39,2216–2223.
90 L. C. Ming, N. R. Gangodu, T. Loh, W. Zheng, J. Wang,K. Lin, et al., Real time near-infrared Raman spectroscopyfor the diagnosis of nasopharyngeal cancer, Oncotarget,2017, 8, 49443–49450.
91 L. M. Almond, J. Hutchings, G. Lloyd, H. Barr, N. Shepherd,J. Day, et al., Endoscopic Raman spectroscopy enablesobjective diagnosis of dysplasia in Barrett's esophagus,Gastrointest. Endosc., 2014, 79, 37–45.
92 H. Moradi, A. Ahmad, D. Shepherdson, N. H. Vuong,G. Niedbala, L. Eapen, et al., Raman micro-spectroscopyapplied to treatment resistant and sensitive humanovarian cancer cells, J. Biophotonics, 2017, 10, 1327–1334.
93 M. Jermyn, J. Desroches, J. Mercier, K. St-Arnaud,M. C. Guiot, F. Leblond, et al., Raman spectroscopydetects distant invasive brain cancer cells centimetersbeyond MRI capability in humans, Biomed. Opt. Express,2016, 7, 5129–5137.
94 M. Brusatori, G. Auner, T. Noh, L. Scarpace, B. Broadbentand S. N. Kalkanis, Intraoperative Raman Spectroscopy,Neurosurg. Clin. N. Am., 2017, 28, 633–652.
95 J. Klener, K. Hoauerova, A. Bartos, J. Ricny, D. Ripova andV. Kopecky, Instability of cerebrospinal uid aer delayedstorage and repeated freezing: a holistic study by dropcoating deposition Raman spectroscopy, Clin. Chem. Lab.Med., 2014, 52, 657–664.
96 E. Kocisova, A. Antalik and M. Prochazka, Drop coatingdeposition Raman spectroscopy of liposomes: role ofcholesterol, Chem. Phys. Lipids, 2013, 172–173, 1–5.
97 E. Kocisova, M. Prochazka and L. Vaculciakova, Drop-Coating Deposition Raman (DCDR) Spectroscopy asa Tool for Membrane Interaction Studies: Liposome-Porphyrin Complex, Appl. Spectrosc., 2015, 69, 939–945.
98 T. J. Harvey, E. C. Faria, A. Henderson, E. Gazi, A. D. Ward,N. W. Clarke, et al., Spectral discrimination of live prostateand bladder cancer cell lines using Raman optical tweezers,J. Biomed. Opt., 2008, 13, 064004.
99 S. Corsetti, T. Rabl, D. McGloin and G. Nabi, Ramanspectroscopy for accurately characterizing biomolecularchanges in androgen-independent prostate cancer cells, J.Biophotonics, 2018, 11, e201700166.
100 J. O'Malley, R. Kumar, A. N. Kuzmin, A. Pliss, N. Yadav,S. Balachandar, et al., Lipid quantication by Ramanmicrospectroscopy as a potential biomarker in prostatecancer, Cancer Lett., 2017, 397, 52–60.
101 G. L. Owens, K. Gajjar, J. Trevisan, S. W. Fogarty,S. E. Taylor, B. Da Gama-Rose, et al., Vibrationalbiospectroscopy coupled with multivariate analysis
25906 | RSC Adv., 2018, 8, 25888–25908
extracts potentially diagnostic features in blood plasma/serum of ovarian cancer patients, J. Biophotonics, 2014, 7,200–209.
102 T. Mahmood, H. Nawaz, A. Ditta, M. I. Majeed, M. A. Hanif,N. Rashid, et al., Raman spectral analysis for rapidscreening of dengue infection, Spectrochim. Acta, Part A,2018, 200, 136–142.
103 M. Bilal, R. Ullah, S. Khan, H. Ali, M. Saleem andM. Ahmed, Lactate based optical screening of denguevirus infection in human sera using Raman spectroscopy,Biomed. Opt. Express, 2017, 8, 1250–1256.
104 S. Khan, R. Ullah, A. Khan, A. Sohail, N. Wahab, M. Bilal,et al., Random Forest-Based Evaluation of RamanSpectroscopy for Dengue Fever Analysis, Appl. Spectrosc.,2017, 71, 2111–2117.
105 M. Bilal, M. Saleem, S. T. Amanat, H. A. Shakoor, R. Rashid,A. Mahmood, et al., Optical diagnosis of malaria infectionin human plasma using Raman spectroscopy, J. Biomed.Opt., 2015, 20, 017002.
106 L. Frame, J. Brewer, R. Lee, K. Faulds and D. Graham,Development of a label-free Raman imaging technique fordifferentiation of malaria parasite infected from non-infected tissue, Analyst, 2017, 143, 157–163.
107 D. Perez-Guaita, K. M. Marzec, A. Hudson, C. Evans,T. Chernenko, C. Matthaus, et al., Parasites under theSpotlight: Applications of Vibrational Spectroscopy toMalaria Research, Chem. Rev., 2018, 118, 5330–5358.
108 R. Sathyavathi, N. C. Dingari, I. Barman, P. S. Prasad,S. Prabhakar, D. Narayana Rao, et al., Ramanspectroscopy provides a powerful, rapid diagnostic toolfor the detection of tuberculous meningitis in ex vivocerebrospinal uid samples, J. Biophotonics, 2013, 6, 567–572.
109 U. Neugebauer, S. Trenkmann, T. Bocklitz, D. Schmerler,M. Kiehntopf and J. Popp, Fast differentiation of SIRSand sepsis from blood plasma of ICU patients usingRaman spectroscopy, J. Biophotonics, 2014, 7, 232–240.
110 H. Ding, A. W. Dupont, S. Singhal, L. D. Scott, S. Guha,M. Younes, et al., In vivo analysis of mucosal lipidsreveals histological disease activity in ulcerative colitisusing endoscope-coupled Raman spectroscopy, Biomed.Opt. Express, 2017, 8, 3426–3439.
111 J. Addis, N. Mohammed, O. Rotimi, D. Magee, A. Jha andV. Subramanian, Raman spectroscopy of endoscopiccolonic biopsies from patients with ulcerative colitis toidentify mucosal inammation and healing, Biomed. Opt.Express, 2016, 7, 2022–2035.
112 I. J. Pence, D. B. Beaulieu, S. N. Horst, X. Bi, A. J. Herline,D. A. Schwartz, et al., Clinical characterization of in vivoinammatory bowel disease with Raman spectroscopy,Biomed. Opt. Express, 2017, 8, 524–535.
113 C. Camerlingo, F. d'Apuzzo, V. Grassia, L. Perillo andM. Lepore, Micro-Raman spectroscopy for monitoringchanges in periodontal ligaments and gingival crevicularuid, Sensors, 2014, 14, 22552–22563.
114 M. Paraskevaidi, C. L. M. Morais, D. E. Halliwell,D. M. A. Mann, D. Allsop, P. L. Martin-Hirsch, et al.,
This journal is © The Royal Society of Chemistry 2018
Review RSC Advances
Ope
n A
cces
s A
rtic
le. P
ublis
hed
on 2
0 Ju
ly 2
018.
Dow
nloa
ded
on 1
0/22
/202
1 2:
04:1
7 A
M.
Thi
s ar
ticle
is li
cens
ed u
nder
a C
reat
ive
Com
mon
s A
ttrib
utio
n-N
onC
omm
erci
al 3
.0 U
npor
ted
Lic
ence
.View Article Online
Raman Spectroscopy to Diagnose Alzheimer's Disease andDementia with Lewy Bodies in Blood, ACS Chem.Neurosci., 2018, DOI: 10.1021/acschemneuro.8b00198.
115 E. Ryzhikova, O. Kazakov, L. Halamkova, D. Celmins,P. Malone, E. Molho, et al., Raman spectroscopy of bloodserum for Alzheimer's disease diagnostics: specicityrelative to other types of dementia, J. Biophotonics, 2015,8, 584–596.
116 L. Bokobza, J.-L. Bruneel and M. Couzi, Ramanspectroscopy as a tool for the analysis of carbon-basedmaterials (highly oriented pyrolitic graphite, multilayergraphene and multiwall carbon nanotubes) and of someof their elastomeric composites, Vib. Spectrosc., 2014, 74,57–63.
117 Y. Wang, D. C. Alsmeyer and R. L. McCreery, Ramanspectroscopy of carbon materials: structural basis ofobserved spectra, Chem. Mater., 1990, 2, 557–563.
118 M. S. Dresselhaus, G. Dresselhaus, R. Saito and A. Jorio,Raman spectroscopy of carbon nanotubes, Phys. Rep.,2005, 409, 47–99.
119 M. S. Dresselhaus, A. Jorio, M. Hofmann, G. Dresselhausand R. Saito, Perspectives on Carbon Nanotubes andGraphene Raman Spectroscopy, Nano Lett., 2010, 10, 751–758.
120 A. C. Ferrari, J. C. Meyer, V. Scardaci, C. Casiraghi,M. Lazzeri, F. Mauri, et al., Raman Spectrum of Grapheneand Graphene Layers, Phys. Rev. Lett., 2006, 97, 187401.
121 A. C. Ferrari and D. M. Basko, Raman spectroscopy asa versatile tool for studying the properties of graphene,Nat. Nanotechnol., 2013, 8, 235.
122 M. R. Kagan and R. L. Mccreery, Reduction of FluorescenceInterference in Raman-Spectroscopy Via AnalyteAdsorption on Graphitic Carbon, Anal. Chem., 1994, 66,4159–4165.
123 X. Ling, L. M. Xie, Y. Fang, H. Xu, H. L. Zhang, J. Kong,et al., Can Graphene be used as a Substrate for RamanEnhancement?, Nano Lett., 2010, 10, 553–561.
124 L. Xie, X. Ling, Y. Fang, J. Zhang and Z. Liu, Graphene asa Substrate To Suppress Fluorescence in ResonanceRaman Spectroscopy, J. Am. Chem. Soc., 2009, 131, 9890–9891.
125 S. Sil, N. Kuhar, S. Acharya and S. Umapathy, Is ChemicallySynthesized Graphene 'Really' a Unique Substrate for SERSand Fluorescence Quenching?, Sci. Rep., 2013, 3, 3336.
126 M. Lopez-Lopez, V. Merk, C. Garcia-Ruiz and J. Kneipp,Surface-enhanced Raman spectroscopy for the analysis ofsmokeless gunpowders and macroscopic gunshotresidues, Anal. Bioanal. Chem., 2016, 408, 4965–4973.
127 S. Sil, D. Chaturvedi, K. B. Krishnappa, S. Kumar,S. N. Asthana and S. Umapathy, Density functionaltheoretical modeling, electrostatic surface potential andsurface enhanced Raman spectroscopic studies onbiosynthesized silver nanoparticles: observation of 400PM sensitivity to explosives, J. Phys. Chem. A, 2014, 118,2904–2914.
128 National Research Council, Committee on the Review ofExisting and Potential Standoff Explosives Detection
This journal is © The Royal Society of Chemistry 2018
Techniques, Washington, DC, The National AcademiesPress, 2004.
129 T. Hirschfeld, E. R. Schildkraut, H. Tannenbaum andD. Tannenbaum, Remote Spectroscopic Analysis of Ppm-Level Air Pollutants by Raman Spectroscopy, Appl. Phys.Lett., 1973, 22, 38–40.
130 J. P. Agrawal, High Energy Materials: Propellants, Explosivesand Pyrotechnics, 2010.
131 J. Akhavan, The Chemistry of Explosives, 3rd edn, 2011.132 J. Mills, C. Farley, A. Kassu, M. Curley, A. Sharma, P. Ruffin,
et al., Raman monitoring and evaluation of the agingeffects of rocket propellant stabilizers, Proc. SPIE, 2017,10382.
133 M. Ghosh, V. Venkatesan, N. Sikder and A. K. Sikder,Quantitative Analysis of alpha-CL-20 PolymorphicImpurity in epsilon-CL-20 using Dispersive RamanSpectroscopy, Cent. Eur. J. Energ. Mater., 2013, 10, 419–438.
134 Z. A. Dreger and Y. M. Gupta, Raman Spectroscopy of High-Pressure-High-Temperature Polymorph of Hexahydro-1,3,5-trinitro-1,3,5-triazine (epsilon-RDX), J. Phys. Chem. A,2010, 114, 7038–7047.
135 V. Thottempudi and J. M. Shreeve, Synthesis and promisingproperties of a new family of high-density energetic salts of5-nitro-3-trinitromethyl-1H-1,2,4-triazole and 5,50-bis(trinitromethyl)-3,30-azo-1H-1,2,4-triazole, J. Am. Chem.Soc., 2011, 133, 19982–19992.
136 K. B. Landenberger and A. J. Matzger, CocrystalEngineering of a Prototype Energetic MaterialSupramolecular Chemistry of 2,4,6-Trinitrotoluene, Cryst.Growth Des., 2010, 10, 5341–5347.
137 R. V. Kent, R. A. Wiscons, P. Sharon, D. Grinstein,A. A. Frimer and A. J. Matzger, Cocrystal Engineering ofa High Nitrogen Energetic Material, Cryst. Growth Des.,2018, 18, 219–224.
138 P. Ravi, D. M. Badgujar, G. M. Gore, S. P. Tewari andA. K. Sikder, Review on Melt Cast Explosives, Propellants,Explos., Pyrotech., 2011, 36, 393–403.
139 Y. Kholod, S. Okovytyy, G. Kuramshina, M. Qasim, L. Gorband J. Leszczynski, An analysis of stable forms of CL-20: ADFT study of conformational transitions, infrared andRaman spectra, J. Mol. Struct., 2007, 843, 14–25.
140 P. Goede, N. V. Latypov and H. Ostmark, Fourier transformRaman Spectroscopy of the four crystallographic phases ofalpha, beta, gamma and epsilon 2,4,6,8,10,12-hexanitro-2,4,6,8,10,12-hexaazatetracyclo[5.5.0.0(5,9).0(3,11)]dodecane (HNIW, CL-20), Propellants, Explos., Pyrotech.,2004, 29, 205–208.
141 A. H. Farhadian, M. K. Tehrani, M. H. Keshavarz andS. M. R. Darbani, Raman spectroscopy combined withprinciple component analysis to investigate the aging ofhigh energy materials, Laser Phys., 2017, 27, 075701(7pp).
142 P. Matousek, I. P. Clark, E. R. C. Draper, M. D. Morris,A. E. Goodship, N. Everall, et al., Subsurface probing indiffusely scattering media using spatially offset Ramanspectroscopy, Appl. Spectrosc., 2005, 59, 393–400.
RSC Adv., 2018, 8, 25888–25908 | 25907
RSC Advances Review
Ope
n A
cces
s A
rtic
le. P
ublis
hed
on 2
0 Ju
ly 2
018.
Dow
nloa
ded
on 1
0/22
/202
1 2:
04:1
7 A
M.
Thi
s ar
ticle
is li
cens
ed u
nder
a C
reat
ive
Com
mon
s A
ttrib
utio
n-N
onC
omm
erci
al 3
.0 U
npor
ted
Lic
ence
.View Article Online
143 O. Stevens, I. E. I. Petterson, J. C. C. Day and N. Stone,Developing bre optic Raman probes for applications inclinical spectroscopy, Chem. Soc. Rev., 2016, 45, 1919–1934.
144 R. J. Stokes, M. Bailey, S. Bonthron, T. Stone, G. Maskalland O. Presly, et al., New capability for hazardousmaterials ID within sealed containers using a portablespatially offset Raman spectroscopy (SORS) device, Opticsand Photonics for Counterterrorism, Crime Fighting, andDefence Xii, 2016, vol. 9995.
145 P. Matousek, C. Conti, M. Realini and C. Colombo, Micro-scale spatially offset Raman spectroscopy for non-invasivesubsurface analysis of turbid materials, Analyst, 2016,141, 731–739.
146 B. Schrader and G. Bergmann, Die Intensitat desRamanspektrums polykristalliner Substanzen, Fresenius' J.Anal. Chem., 1967, 225, 230–247.
147 P. Matousek and A. W. Parker, Bulk Raman analysis ofpharmaceutical tablets, Appl. Spectrosc., 2006, 60, 1353–1357.
148 C. Eliasson, N. A. Macleod, L. C. Jayes, F. C. Clarke,S. V. Hammond, M. R. Smith, et al., Non-invasivequantitative assessment of the content of pharmaceuticalcapsules using transmission Raman spectroscopy, J.Pharm. Biomed. Anal., 2008, 47, 221–229.
149 J. Johansson, A. Sparen, O. Svensson, S. Folestad andM. Claybourn, Quantitative transmission Ramanspectroscopy of pharmaceutical tablets and capsules,Appl. Spectrosc., 2007, 61, 1211–1218.
150 M. Edinger, M. M. Knopp, H. Kerdoncuff, J. Rantanen,T. Rades and K. Lobmann, Quantication of microwave-induced amorphization of celecoxib in PVP tablets usingtransmission Raman spectroscopy, Eur. J. Pharm. Sci.,2018, 117, 62–67.
151 D. Andrews, K. Geentjens, B. Igne, G. McGeorge, A. Owen,N. Pedge, et al., Analytical Method Development UsingTransmission Raman Spectroscopy for PharmaceuticalAssays and Compliance with Regulatory Guidelines—PartI: Transmission Raman Spectroscopy and MethodDevelopment, J. Pharm. Innov., 2018, 13, 121–132.
25908 | RSC Adv., 2018, 8, 25888–25908
152 M. Hartmann, Light scattering by small particles. By H. C.van de Hulst. New York (John Wiley and Sons), London(Chapman and Hall), 1957. Pp. xiii, 470; 103 Figs.; 46Tables. 96s, Q. J. R. Metereol. Soc., 1958, 84, 198–199.
153 C. F. Bohren and D. R. Huffman. Absorption and Scatteringof Light by Small Particles: Wiley 1998.
154 A. Ishimaru. Wave Propagation and Scattering in RandomMedia-Multiple Scattering, Turbulence, Rough Surfaces,and Remote Sensing: Academic Press; 28th May 1978.
155 S. Sasic and Y. Ozaki, Raman, Infrared, and Near-InfraredChemical ImagingSep, 2010.
156 D. J. Pine, D. A. Weitz, P. M. Chaikin and E. Herbolzheimer,Diffusing-Wave Spectroscopy, Phys. Rev. Lett., 1988, 60,1134–1137.
157 I. E. Petterson, M. Lopez-Lopez, C. Garcia-Ruiz, C. Gooijer,J. B. Buijs and F. Ariese, Noninvasive detection of concealedexplosives: depth proling through opaque plastics bytime-resolved Raman spectroscopy, Anal. Chem., 2011, 83,8517–8523.
158 S. Umapathy, S. Sil, J. Kiran. Method and a system fordetection of hazardous chemicals in a non-metalliccontainer. Ind. Pat., IN2311CH2013, 2013, US Pat.9,606,062B2, 2017.
159 S. Umapathy, S. Sil, G. Dhal, F. Ariese. Chemical signatureresolved detection of concealed objects. Ind. Pat., IN6626/CHE/2014, 2014, US Pat. App. 15/122,170, 2016.
160 S. Umapathy, S. Sil, J. Kiran. Method and an apparatus forobtaining sample specic signatures. Ind. Pat.,IN2312CH2013, 2013, US Pat., US9983136B2, 2018.
161 V. Periyasamy, S. Sil, G. Dhal, F. Ariese, S. Umapathy andM. Pramanik, Experimentally validated Raman MonteCarlo simulation for a cuboid object to obtain Ramanspectroscopic signatures for hidden material, J. RamanSpectrosc., 2015, 46, 669–676.
162 S. Sil and S. Umapathy, Raman spectroscopy exploresmolecular structural signatures of hidden materials indepth: Universal Multiple Angle Raman Spectroscopy, Sci.Rep., 2014, 4, 5308.
163 W. Keifer, Recent advances in linear and nonlinear Ramanspectroscopy II, J. Raman Spectrosc., 2008, 39, 1710–1725.
This journal is © The Royal Society of Chemistry 2018