Embed Size (px)
Citation preview
An Interactive Table for SupportingParticipation Balance in Face-to-Face
Collaborative LearningKhaled Bachour, Frederic Kaplan, and Pierre Dillenbourg
Abstract—We describe an interactive table designed for supporting face-to-face collaborative learning. The table, Reflect, addresses
the issue of unbalanced participation during group discussions. By displaying on its surface, a shared visualization of member
participation, Reflect, is meant to encourage participants to avoid the extremes of over and underparticipation. We report on a user
study that validates some of our hypotheses on the effect the table would have on its users. Namely, we show that Reflect leads to
more balanced collaboration, but only under certain conditions. We also show different effects the table has on over and
underparticipators.
Index Terms—Computer-supported collaborative learning, interactive furniture, ubiquitous computing.
Ç
1 INTRODUCTION
IN situations of face-to-face collaborative learning, unba-lanced participation can lead to undesirable results.
Lower learning outcomes are observed for members of agroup that do not participate in the group process, as wellas loss of motivation for the other participating members[1], [2], [3]. One way to overcome this effect is byencouraging members of a group to participate in a morebalanced manner. We attempt to achieve this by indicatingto individual members their level of participation on ashared display. We embed this display in an interactivetable, as shown in Fig. 1, that allows users to interact witheach other in as natural a manner as possible while givingthem feedback on their behavior. This semiambient displayhas the properties of both being in the background of thecollaboration process while at the same time remainingvisible in a central position of the shared workspace. Theimplemented system does not attempt to directly influencelearning outcomes, but rather to promote intermediateprocesses or interactions that are shown to be predictive ofpositive learning gains.
The remainder of this paper is divided as follows: Wefirst position our work with respect to past research bymotivating the current work with established notions fromComputer-Supported Collaborative Learning (CSCL) re-search (Section 2), then by comparing it to similar existingsystems (Section 3). In Section 4, we describe the systemobjectives and design, followed by a detailed account of theuser study conducted to evaluate the system (Section 5) andthe results obtained (Section 6). We conclude with discus-sions and future work in Sections 7 and 8, respectively.
2 MOTIVATION
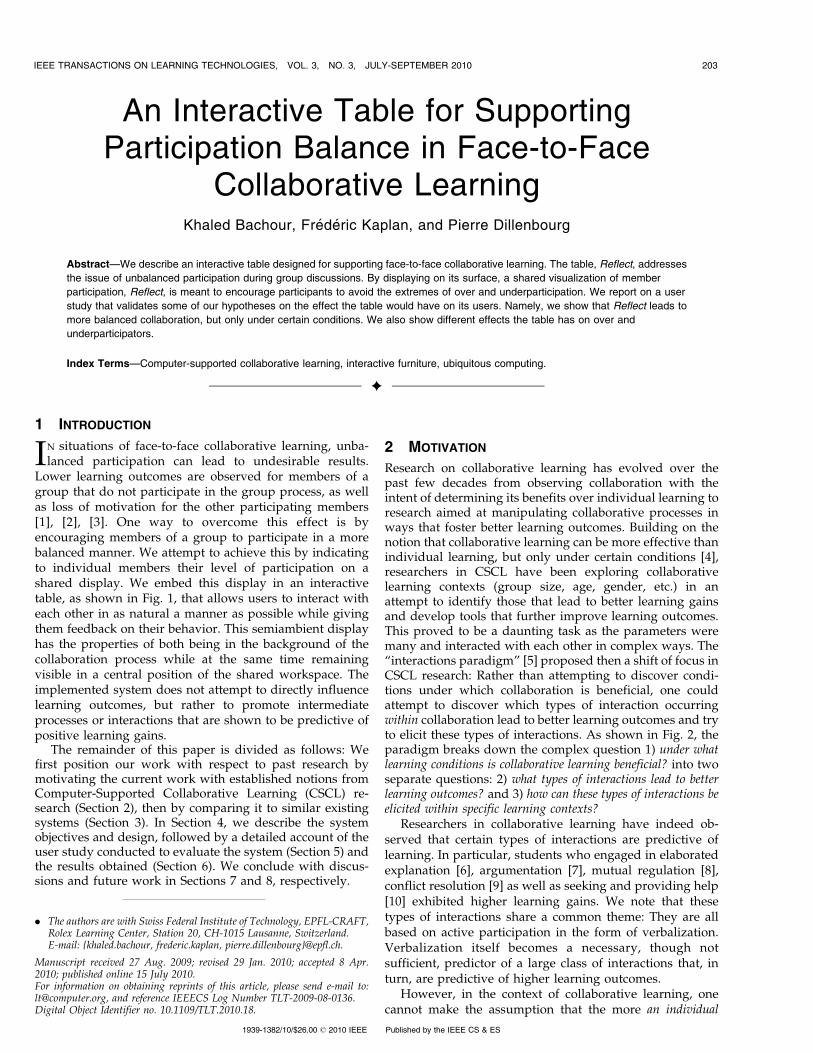
Research on collaborative learning has evolved over thepast few decades from observing collaboration with theintent of determining its benefits over individual learning toresearch aimed at manipulating collaborative processes inways that foster better learning outcomes. Building on thenotion that collaborative learning can be more effective thanindividual learning, but only under certain conditions [4],researchers in CSCL have been exploring collaborativelearning contexts (group size, age, gender, etc.) in anattempt to identify those that lead to better learning gainsand develop tools that further improve learning outcomes.This proved to be a daunting task as the parameters weremany and interacted with each other in complex ways. The“interactions paradigm” [5] proposed then a shift of focus inCSCL research: Rather than attempting to discover condi-tions under which collaboration is beneficial, one couldattempt to discover which types of interaction occurringwithin collaboration lead to better learning outcomes and tryto elicit these types of interactions. As shown in Fig. 2, theparadigm breaks down the complex question 1) under whatlearning conditions is collaborative learning beneficial? into twoseparate questions: 2) what types of interactions lead to betterlearning outcomes? and 3) how can these types of interactions beelicited within specific learning contexts?
Researchers in collaborative learning have indeed ob-served that certain types of interactions are predictive oflearning. In particular, students who engaged in elaboratedexplanation [6], argumentation [7], mutual regulation [8],conflict resolution [9] as well as seeking and providing help[10] exhibited higher learning gains. We note that thesetypes of interactions share a common theme: They are allbased on active participation in the form of verbalization.Verbalization itself becomes a necessary, though notsufficient, predictor of a large class of interactions that, inturn, are predictive of higher learning outcomes.
However, in the context of collaborative learning, onecannot make the assumption that the more an individual
IEEE TRANSACTIONS ON LEARNING TECHNOLOGIES, VOL. 3, NO. 3, JULY-SEPTEMBER 2010 203
. The authors are with Swiss Federal Institute of Technology, EPFL-CRAFT,Rolex Learning Center, Station 20, CH-1015 Lausanne, Switzerland.E-mail: {khaled.bachour, frederic.kaplan, pierre.dillenbourg}@epfl.ch.
Manuscript received 27 Aug. 2009; revised 29 Jan. 2010; accepted 8 Apr.2010; published online 15 July 2010.For information on obtaining reprints of this article, please send e-mail to:[email protected], and reference IEEECS Log Number TLT-2009-08-0136.Digital Object Identifier no. 10.1109/TLT.2010.18.
1939-1382/10/$26.00 � 2010 IEEE Published by the IEEE CS & ES
speaks, the more the group learns. After all, given thegenerally exclusive nature of conversational turn-taking[11], the more one member of a group speaks, the less theothers will. Therefore, when looking at learning gains forthe group, one must look beyond the notion that moreverbalization leads to better learning.
Cohen [1] describes some criteria for group productivity,without which group learners might benefit less thanindividual learners. Among these, lack of equity in participa-tion is presented as an obstacle to effective learning in agroup. Salomon and Globerson also describe the debilitat-ing effects of unbalanced participation [3]. They describetwo types of effects: the “free-rider” effect in which anoverparticipating member could cause other members toexpend less effort on the common task, and the “sucker”effect in which underparticipating members could lead themore active members to lose motivation in the task, andthus, avoid being taken advantage of. In either case, groupproductivity decreases.
Cohen also suggests that the difference in participation isnot necessarily related to participants’ abilities or theirexpertise, but rather to their perceived status which cancome from any number of stimuli including age, gender,social status, or race of the participant. In some cases,perceived popularity or attractiveness of individuals canlead to more active participation on their part [1], [12].Moreover, it was shown that the amount of one groupmember’s participation in itself can lead to that memberbeing perceived as having a higher status, thereby leadingto even more unbalanced participation [13].
Unbalanced participation in group learning can thus beseen as a deterrent for effective learning. There is a needthen to encourage members to participate in a morebalanced manner.
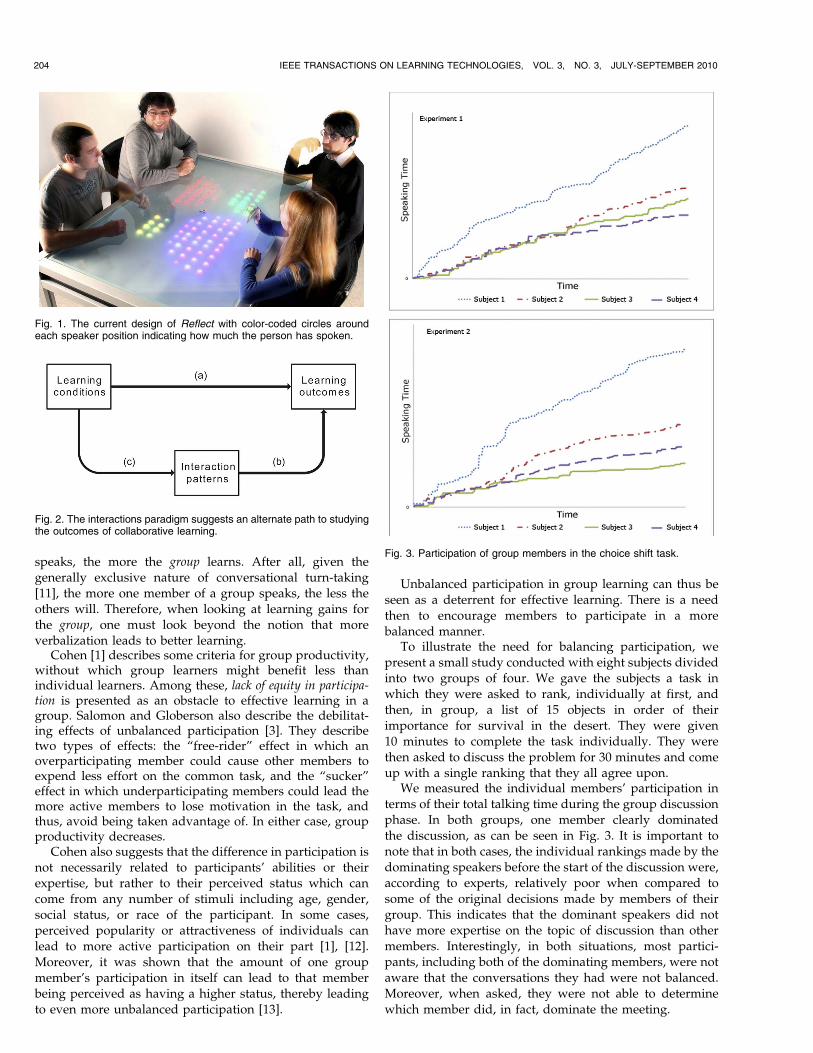
To illustrate the need for balancing participation, wepresent a small study conducted with eight subjects dividedinto two groups of four. We gave the subjects a task inwhich they were asked to rank, individually at first, andthen, in group, a list of 15 objects in order of theirimportance for survival in the desert. They were given10 minutes to complete the task individually. They werethen asked to discuss the problem for 30 minutes and comeup with a single ranking that they all agree upon.
We measured the individual members’ participation interms of their total talking time during the group discussionphase. In both groups, one member clearly dominatedthe discussion, as can be seen in Fig. 3. It is important tonote that in both cases, the individual rankings made by thedominating speakers before the start of the discussion were,according to experts, relatively poor when compared tosome of the original decisions made by members of theirgroup. This indicates that the dominant speakers did nothave more expertise on the topic of discussion than othermembers. Interestingly, in both situations, most partici-pants, including both of the dominating members, were notaware that the conversations they had were not balanced.Moreover, when asked, they were not able to determinewhich member did, in fact, dominate the meeting.
204 IEEE TRANSACTIONS ON LEARNING TECHNOLOGIES, VOL. 3, NO. 3, JULY-SEPTEMBER 2010
Fig. 2. The interactions paradigm suggests an alternate path to studyingthe outcomes of collaborative learning.
Fig. 3. Participation of group members in the choice shift task.
Fig. 1. The current design of Reflect with color-coded circles aroundeach speaker position indicating how much the person has spoken.
We drew two conclusions from the study. The first is aconfirmation that difference in participation is not necessa-rily attributed to difference in level of expertise in which themore expert peer would participate more. The second,surprisingly, is that it is not always obvious for members ofa group who it was that spoke more than the others, evenwhen one speaker dominated the conversation significantly.
In conclusion, the technology we present here aims atbalancing group participation in terms of verbalization.Although the ultimate aim of the system is to improvelearning outcomes of collaboration, its direct aim is tobalance participation, and thus, its design, evaluation, andanalysis are made with that direct aim in mind.
3 RELATED WORK
Jermann et al. [14] describe three types of computer supportfor collaborative learning. These vary depending on theirlevel of active involvement in the regulation process.Coaching systems observe and interpret the collaborativesetting and provide advice to the learners. Less active aremetacognitive tools that summarize to the users, via a set ofkey indicators, the state of the interactions taking placewithout giving advice on how to interpret or act on theseindicators. Finally, mirroring tools simply reflect to the userstheir basic actions by informing them what each member ofthe group has done. By increasing their awareness of whatthey are doing, mirroring tools help members maintain acommon representation of what is taking place in thecollaborative process. The system we propose here is of themirroring type. It displays to the users a basic representa-tions of the actions they have taken, namely, the amount ofspeech they have produced, without offering advice orinterpretation on the state of the interaction.
Researchers in the field of Human-Computer Interactionhave already done some work on influencing groupconversation with mirroring displays. Most prominently,DiMicco et al. have explored the effect of such visualiza-tions on speaker behavior [15], [16]. They have studied boththe effects of having this information displayed in real timeas the conversation takes place and of having thisinformation displayed between meetings as a replay tool.Their system, Second Messenger, showed promising resultsfor mirroring displays. The replay tool had a significanteffect on speaker behavior after it was displayed. Over-participators spoke less and underparticipators spoke more.This desired effect was not completely achieved when onlythe real-time tool was used. By displaying information inreal time, Second Messenger pushed overparticipators toreduce their levels of participation but the effect was not asstrong for underparticipators.
Other researchers have also studied the effects of thesevisualizations. Bergstrom and Karahalios implemented twosystems, the Conversation Clock [17], [18] and ConversationVotes [19]. In both systems, a visualization representing thecurrent conversation is projected onto some shared surface.The Clock shows which member of the group spoke at eachtime and allows the users to get a snapshot of theconversation history every time they look at the surface.Conversation Votes goes further and allows members ofthe group to anonymously “vote” indicating to the table
whether or not they agree with what is being said. Thisinformation is visualized onto the table along with thespeaking patterns of the users. The authors reported varyingreactions to the visualizations especially in terms of reactionsto long-term and short-term history, as well as changes inbehavior among above and below average speakers.
Our work follows a similar approach of displayinginformation about speaker participation to group members.Our originality comes from achieving similar benefits interms of balanced speakers while retaining as much of thenatural behavior of group members as possible. The displaybecomes embedded into everyday furniture, and with theuse of directional microphone arrays, we eliminate the needfor lapel microphones or headsets. The result is a regulartable augmented with a semiambient real-time feedback ofa conversation taking place around it.
This notion of embedding computing functionality inreal-world objects is developing as a research trend on itsown. The name “roomware” has been given to this type ofdevice and has been described as an “umbrella” frameworkfor four fields: ubiquitous computing, computer-supportedcollaborative work, augmented reality, and architecture[20]. Countless devices have been developed that satisfy thecriterion of roomware: real-world objects with embeddedcomputing. Lamps, clocks, tables, walls, and floors havebeen augmented with computational functionality rangingfrom simple single-purpose devices such as a clock toimprove location awareness for family members [21] toelaborate multipurpose table surfaces for supportingcollaboration [22].
The purpose of our work, namely, influencing groupbehavior in order to foster interactions that improvelearning outcomes, falls within the scope of CSCL. Ourmethod, however, falls within the realm of roomware withthe specific purpose of augmenting collaborative spaces byembedding within the physical table a tool that helpsincrease awareness of member participation.
4 DESCRIPTION OF THE SYSTEM
Reflect is an interactive table designed to address the issueof unbalanced participation. We describe first the concep-tual design in relation to its objective. We then detail thephysical design which we will motivate with someconstraints that we imposed on the system.
4.1 Design Objectives
The aim of Reflect is to function as a mirroring tool forcollaborative groups. The term mirroring tool refers to theinformative, rather than normative, nature of the system[14]. Mirrors do not tell their users what they are doingright and what they are doing wrong, in the same way thata bathroom mirror does not tell a user if their hair looksgood or not. It simply shows them a reflection of theircurrent state and leaves it for the users themselves to decidewhat, if anything, needs to be changed. In the same manner,Reflect is not meant to judge the quality of the interaction,nor is it meant to actively pursue a more balancedcollaboration on the part of its users. Its role in that respectis to inform the users of the current state of the conversa-tion, and it is up to the users to decide what needs to be
BACHOUR ET AL.: AN INTERACTIVE TABLE FOR SUPPORTING PARTICIPATION BALANCE IN FACE-TO-FACE COLLABORATIVE LEARNING 205
done. There are instances where one speaker is expected oreven required to participate more than the others, forexample, if that speaker is the expert on the subject ofdiscussion. Our system will thus remain neutral in terms ofits judgment of the situation and its role will be strictlyinformative rather than normative. We cannot deny,however, that by making available information on partici-pation levels, we are potentially inducing an implicit normamong at least some members of the group that participa-tion levels need to be monitored, and therefore, controlled.
4.2 Design Requirements
We required our interactive table to abide by certainprinciples that we found important for a system meant tofollow the disappearing computer paradigm of ubiquitouscomputing.
Regardless of its embedded functionality, the table wasrequired to retain its initial purpose, namely, serving as atable before being a display. Having a conversation or awork meeting around the table should involve minimalbehavioral change from the natural use of a regular table. Inother words, users should be able to use the table in thesame way they would use a regular table, without having toworry about attaching peripherals or other accessories totheir bodies. In addition, the surface of the table shouldremain a working surface. Users should be able to placetheir notes, laptops, and their coffee mugs on the table.
The table should remain unobtrusive and should not taketoo much attention away from the task the users areperforming. The information it provides to its users ismeant to be minimal and require very little cognitive effortto understand. It is thus important that the table not draw alot of attention to itself and away from the real task at hand.
Despite the unobtrusive criterion, the table must none-theless be visible and should not be so discreet that it isignored completely. The information should be promi-nently displayed in a shared location and should be withinthe peripheral vision of the users, i.e., the part of the users’field of vision that is not the focus of their attention, but ofwhich they have at least a minimal awareness.
A balanced trade-off between the unobtrusive and visiblecriteria forms what we refer to as the semiambient nature ofthe table.
4.3 Physical Design
With the requirements above in mind, Reflect was designedas an interactive table for four people. In its center, threemicrophones, forming what is referred to as a microphonearray, allow the system to detect which participant isspeaking at each point. This is done by selectively filteringthe sounds coming from different directions around thearray and converting them into separate channels that can belistened to individually. This process, performed by a specialpurpose system developed by Illusonic [23], is calledbeamforming. It permits the table to determine the directionthe sound is coming from, and hence, the current speaker,reliably and without requiring the users to carry anywearable artifacts such as microphones or other sensors.When overlap in speech occurs, the system registers only theloudest of the overlapping speakers. Users can thus simplysit at the table and begin their collaboration without the need
to log in or to use equipment not generally required around anormal table. A sturdy glass surface permits the table top tobe used as a regular working surface.
The display of the table is a matrix of 8� 16 multicolorLight-Emitting Diodes (LEDs) that lay beneath a frostedglass surface. The LEDs are individually addressable andform a very low-resolution screen. This choice of display ismainly motivated by the unobtrusive criterion. The informa-tion displayed on the surface of the table should not be socomplex that it requires significant attention from the users.Having the display at the center of the table and coveringmost of its surface, would make the information difficult tomiss. The bright light of the LEDs also helps the informationretain its visibility even in well-lit rooms.
Though it is easy to see why this design satisfies theserving as a table criterion, it is less obvious that the resultingtable would be unobtrusive and visible. We will refer to thisquestion later in this paper when we describe the results ofthe user study.
4.4 Visualization
Given the input of the beamforming microphone array andwith the LED matrix as output, we were free to design awide range of visualizations. Notably, the territorial dis-play, as shown in Fig. 1, visualizes the conversation withfour “territories” of lit LEDs, one around each speaker. Theterritories have different colors for different speakers, andthey grow in size according to the speakers’ levels ofparticipation up to the point where one speaker’s territorymay begin to expand into the others’ territories.
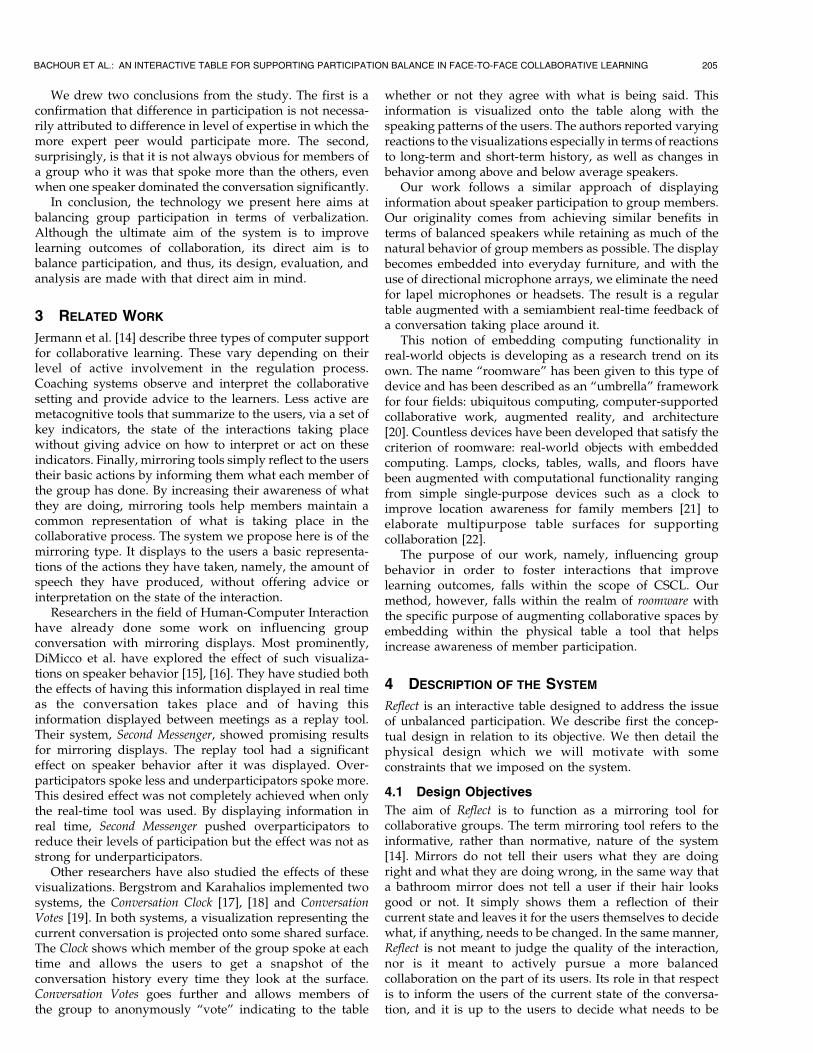
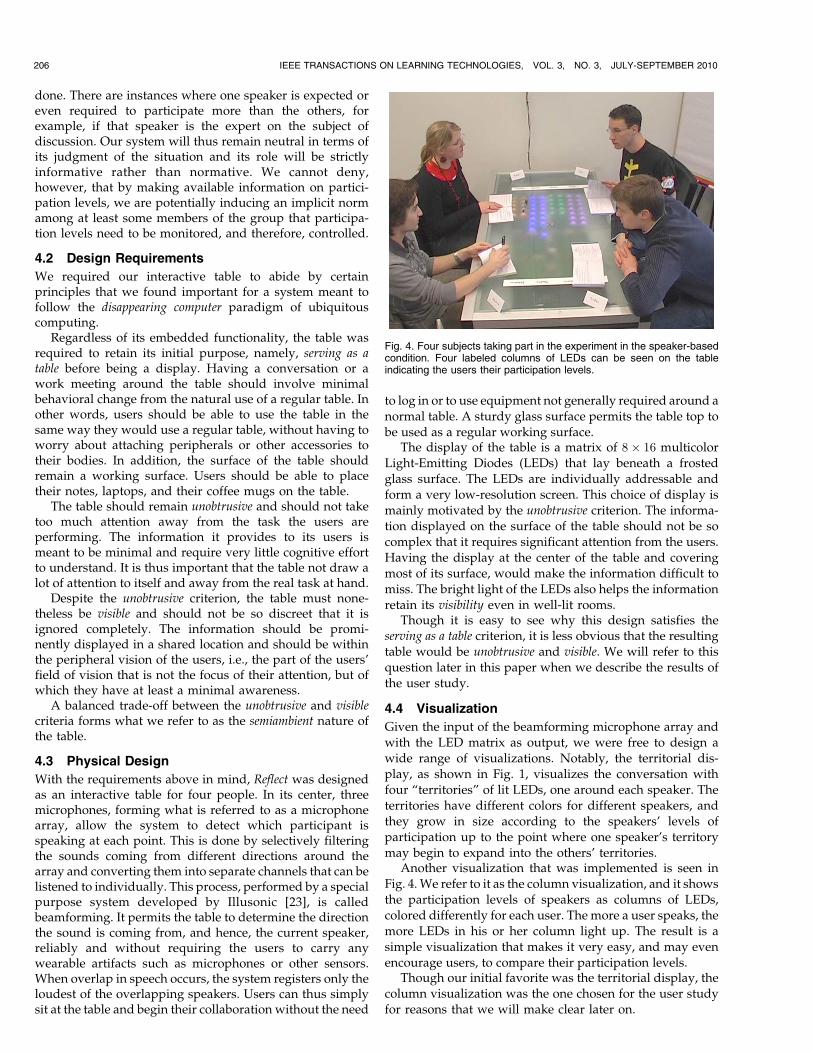
Another visualization that was implemented is seen inFig. 4. We refer to it as the column visualization, and it showsthe participation levels of speakers as columns of LEDs,colored differently for each user. The more a user speaks, themore LEDs in his or her column light up. The result is asimple visualization that makes it very easy, and may evenencourage users, to compare their participation levels.
Though our initial favorite was the territorial display, thecolumn visualization was the one chosen for the user studyfor reasons that we will make clear later on.
206 IEEE TRANSACTIONS ON LEARNING TECHNOLOGIES, VOL. 3, NO. 3, JULY-SEPTEMBER 2010
Fig. 4. Four subjects taking part in the experiment in the speaker-basedcondition. Four labeled columns of LEDs can be seen on the tableindicating the users their participation levels.
5 USER STUDY
In order to evaluate the effect Reflect has on collaborativework, we conducted a user study with the aim of validatingtwo hypotheses:
. H1. Individuals are more aware of their own andtheir partners’ levels of participation when usingReflect. By validating this hypothesis, we would beable to conclude that the information displayed onthe table is seen and assimilated into the user’smental model of the conversation taking place.
. H2. Groups that are shown their levels of partici-pation on Reflect are more balanced than those thatare not. By validating this hypothesis, we wouldconclude that the information displayed on the tableis used by the participants as a tool to reduce over orunderparticipation.
5.1 Description of the Experiment
Groups of four students were randomly selected from a poolof bachelor students that had volunteered for the experi-ments. The study included 18 groups (72 subjects—44 maleand 28 female). All-male, all-female, and mixed groups wereused. Subjects were paid 50 Swiss francs (around 45 USdollars) for their two hour involvement in the experiment.The groups were asked to solve a murder mystery taskoffered to us by Stasser and Stewart [24]. The task materialswere translated into French and adapted for groups of four.In this task, each subject was given a copy of investigationlogs that included maps, interviews, and a snippet of a newsarticle. They were asked to accuse one of three suspects ofhaving committed the murder. Each individual versionof the investigation logs contained certain important piecesof information that were not available in others. Thisensured that all subjects were required to participate inthe discussion in order to gather all the necessary informa-tion. This type of task, referred to as a hidden profile task, isoften used in experiments involving group decision-makingand information pooling [24].
5.2 Experimental Conditions
We used two experimental conditions that were identicalexcept for the content of the information displayed on thesurface of the table. In the first condition, the students wereshown their levels of participation, i.e., how much time eachstudent talked. This condition will be referred to as speaker-based condition. In the second, they were shown the focus ofthe discussion, i.e., how much time was spent discussing thecase of each of the three suspects in the murder mystery. Thiscondition will be referred to as the topic-based condition.
We note here that we are not particularly interested inobserving the effect of a topic-based visualization on thebehavior of groups. Displaying information about topicbalance serves the purpose of having a situation againstwhich we can compare the effect of the speaker-basedvisualization. To that effect, the topic-based condition couldhave been replaced with a condition whereby no visualiza-tion is displayed at all. However, we introduced the topic-based visualization rather than no visualization in order tocounter the effects of novelty and potential distraction, thespeaker-based visualization would have had compared to acondition where no visualization at all is presented.
In both conditions, the columns visualization was used.In fact, the choice of visualization was motivated by theneed for a single visualization that can be used for bothconditions. Although the territorial display may have beenmore suitable for displaying speaker levels, it is not at allsuited for displaying the time spent on each topic since,unlike the speakers, the different topics do not have ameaningful spatial position that would justify the locationof their corresponding territories. This was not a problemfor the column visualization as columns were spatiallyneutral. By labeling the columns, with white stickers postedon both ends of the table, we were able to attribute any kindof information to what each column represents. Bothconditions were thus made as similar as possible to oneanother, with the exception of what information is dis-played on the surface of the table.
Participation levels were detected automatically by thetable. The subject of discussion was determined using the“Wizard of Oz” technique, i.e., with a human listening tothe conversation as it took place and remotely signaling thetopic of discussion to the table system.
A third neutral condition, in which no information isdisplayed on the table, was not included in the design of thestudy as it would have been quite costly and the benefits ofhaving such a condition were not compelling enough.
5.3 Experimental Procedure
The students were first asked to read the investigation logsindividually for 30 minutes, during which the table wasused as a simple timer that kept the students informed ofthe time remaining. The students were allowed to annotatetheir copies of the logs and were told that they wouldkeep the copies with them during the discussion. At thatpoint, the students were not yet informed that their copiesof the investigation logs contained information that was notavailable to others.
The students were then given 60 minutes to reachconsensus on a suspect. In order to start the discussion, thestudents were asked to come up with possible means,motive, and opportunity for committing the crime for eachsuspect. They were informed that, in order to accuse asuspect, they must be convinced that he had all of these threeelements against him and the other two suspects weremissing at least one of the elements. The students were thenmade aware that they may possess unique information thatis not available to others. In addition, they were told thatthey were not permitted to give their copy of the investiga-tion logs to another participant and each participant wasonly allowed to read from his or her own copy. Finally, thevisualizations were explained to the students, but nomention was made of the theoretical benefit of a balanceddiscussion either in terms of participation or subject focus.
5.4 Data Collection
During their discussion, the students were filmed and theirvoices were recorded using the built-in microphones of thetable. Logs of participation levels and the time spentdiscussing each suspect were generated and saved. At theend of each experiment, the subjects were asked to fill in apostexperiment questionnaire that contained 19 questionsmostly about the experience they had during the experiment
BACHOUR ET AL.: AN INTERACTIVE TABLE FOR SUPPORTING PARTICIPATION BALANCE IN FACE-TO-FACE COLLABORATIVE LEARNING 207
and included four open questions. The questionnaire alsoasked the users to estimate the amount of time each groupmember spoke as well as the amount of time they spentdiscussing each suspect.
6 RESULTS
One group was excluded from the analysis of logsbecause of an unintentional error that led to loss ofrecordings and logs for that group, but not the ques-tionnaires, which were included in analysis related purelyto questionnaire responses.
6.1 The Visible and Unobtrusive Criteria
Recall from the description of the design of the table thatcompliance with two of its design requirements, the visibleand unobtrusive criteria, remained to be verified. We addressthis issue here.
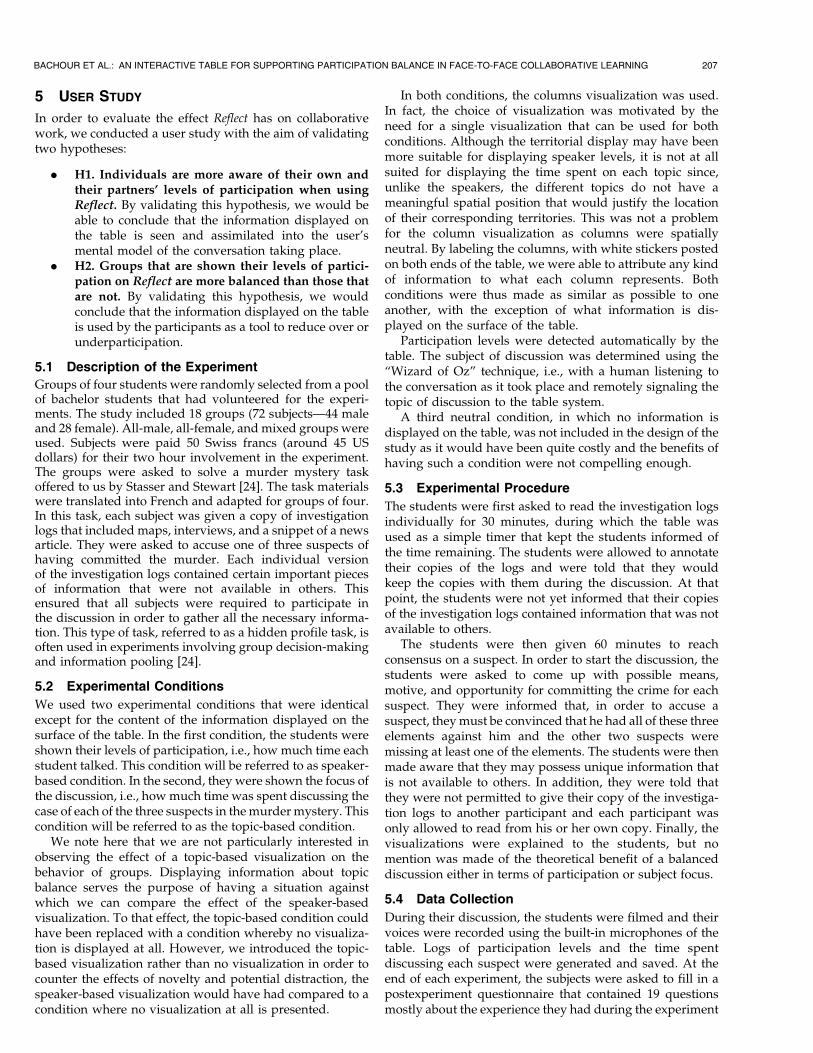
The postexperiment questionnaire included some ques-tions meant to get a sense of how subjects perceived thetable. Some of the questions and their answers will shedsome light on this issue. When asked “Did you look at thetable?” the vast majority of the subjects in both conditionssaid they looked at the table either “sometimes” or “often,”as shown in Fig. 5.
In terms of the intrusiveness of the table, 86 percent ofparticipants said they were not bothered by the table and60 percent said they were not distracted by it. Theseresponses vary across conditions, as shown in Fig. 6. Notethat in the speaker-based condition, which is the conditionof primary interest to the study, only 25 percent reportedbeing distracted by the display.
A minority of 15 percent reported feeling “uncomfor-table with seeing their participation levels displayed for allto see.” Finally, when asked if they would like to use such atable for other meetings, 66 percent answered “yes” in thespeaker-based condition, whereas only 25 percent answered“yes” in the topic-based condition.
We can thus conclude that the table design seemed tosatisfy its visibility criterion, in that its visualization waslooked at most of the time. The subjects also seemedcomfortable with the table showing their levels of participa-tion, enough to want to use it in the future. Few reportedbeing bothered by it, but a quarter of the users weredistracted. These results indicate that the table satisfies itsunobtrusive criteria to a large extent, but there is nonethelessroom for improvement.
6.2 General Effect on Balancing Participation
For measuring the effect of the table on balancingparticipation levels, we compared how balanced groupswere in the speaker-based condition versus the topic-basedcondition. We measured balance as the difference betweenperfectly balanced participation (i.e., taking up 25 percent ofthe total speaking time of the group) and each user’sparticipation level.
We started by comparing means of individual user balanceacross conditions using an independent samples t-test.We found no significant effect between how balanced userswere in the speaker-based conditions and the topic-basedcondition (ms ¼ 7:29;mt ¼ 8:1; t½62� ¼ �0:59; p > 0:1).
We then took a closer look at the result and made thefollowing observation. In the postexperiment questionnaire,the subjects were asked the question: “Do you think it isimportant for members of the group to participate in amore-or-less balanced manner?” We looked again at theeffect of the table on the group members’ ability to balancetheir participation, excluding participants in both condi-tions that answered “no” to this question (36 percent of theparticipants in the study). As we mentioned earlier, Reflectis not designed as a tool for enforcing group balance, butrather for supporting it by improving participant aware-ness. The intention to participate in a balanced mannermust thus come from the users themselves, and when this
208 IEEE TRANSACTIONS ON LEARNING TECHNOLOGIES, VOL. 3, NO. 3, JULY-SEPTEMBER 2010
Fig. 5. Responses to the question “Did you look at the table?” bycondition. Fig. 6. Percentage of subjects who answered “yes” to the questions “Did
the display on the table bother you?” and “Did the display on the tabledistract you?” across conditions.
intention is absent, any balancing behavior the user exhibitswould likely be coincidental.
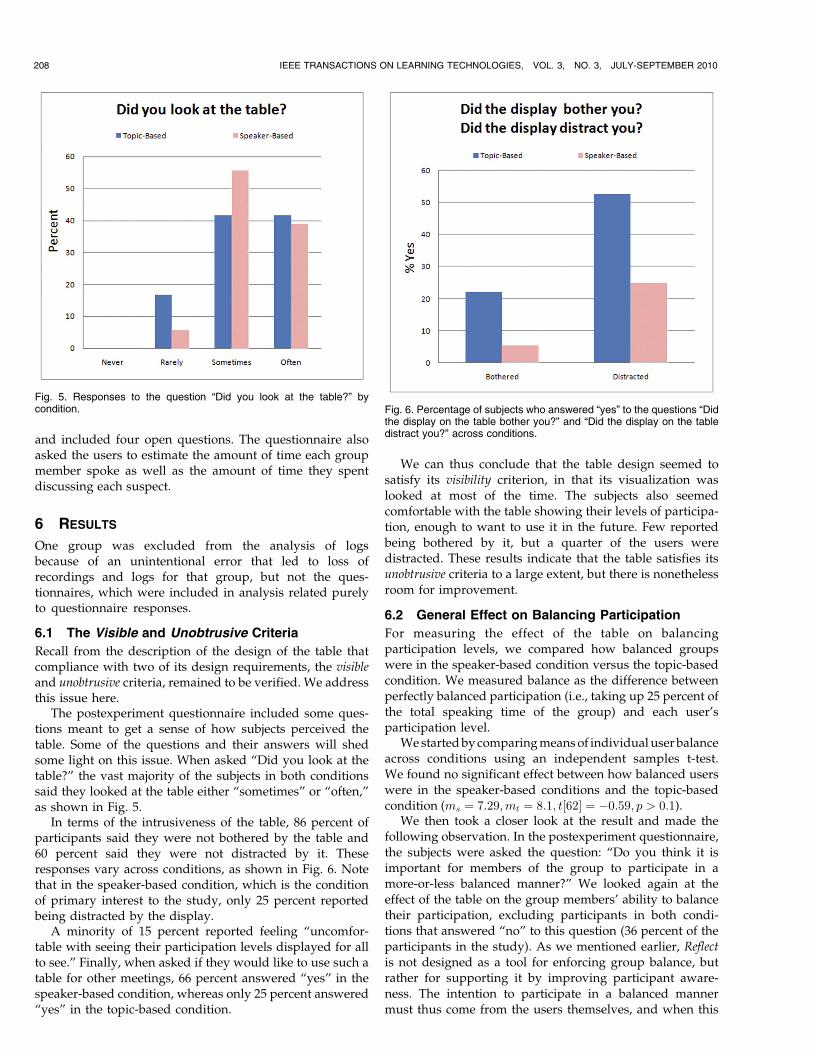
With the remaining participants (46 subjects), i.e., thosewho claim that balance in participation is important, wecompared the means of their participation levels across twoconditions and obtained a statistically significant difference(ms ¼ 5:0;mt ¼ 8:5; t½38� ¼ 2:18; p < 0:05). In other words,participants who had their participation levels shown tothem during the task were statistically more balanced thanthose who had information about topic focus displayed.This result can be seen in Fig. 7.
6.3 Effect on Over and Underparticipators
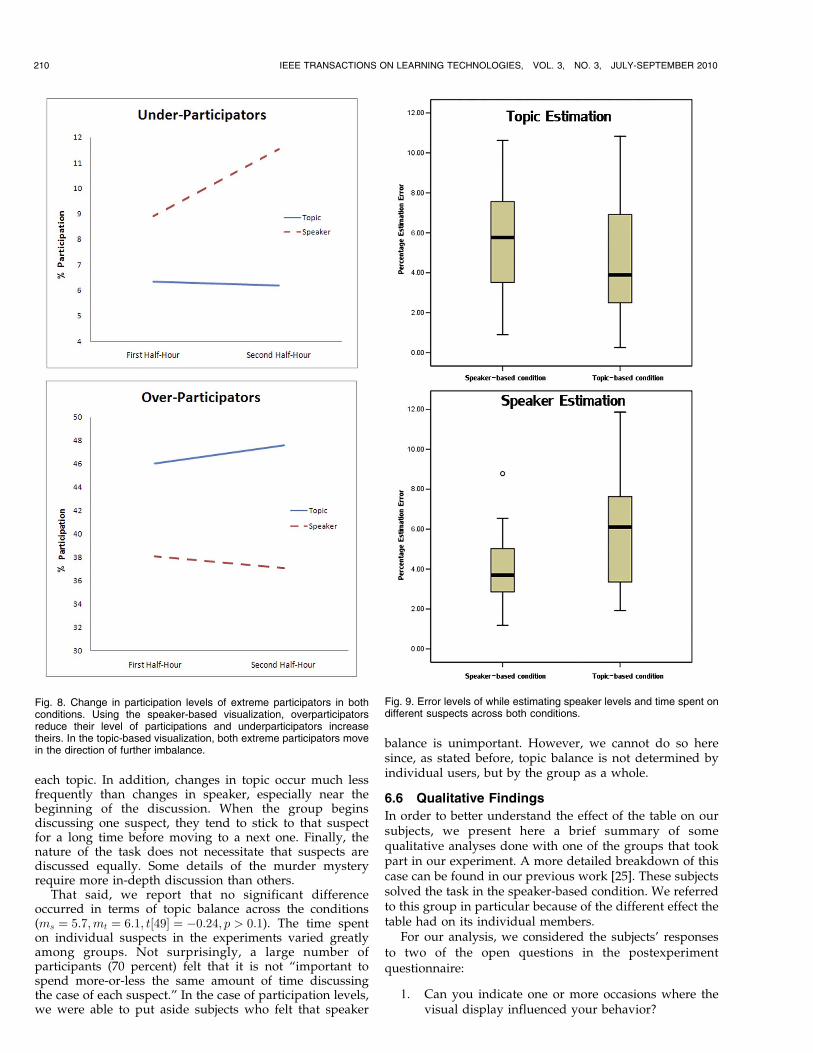
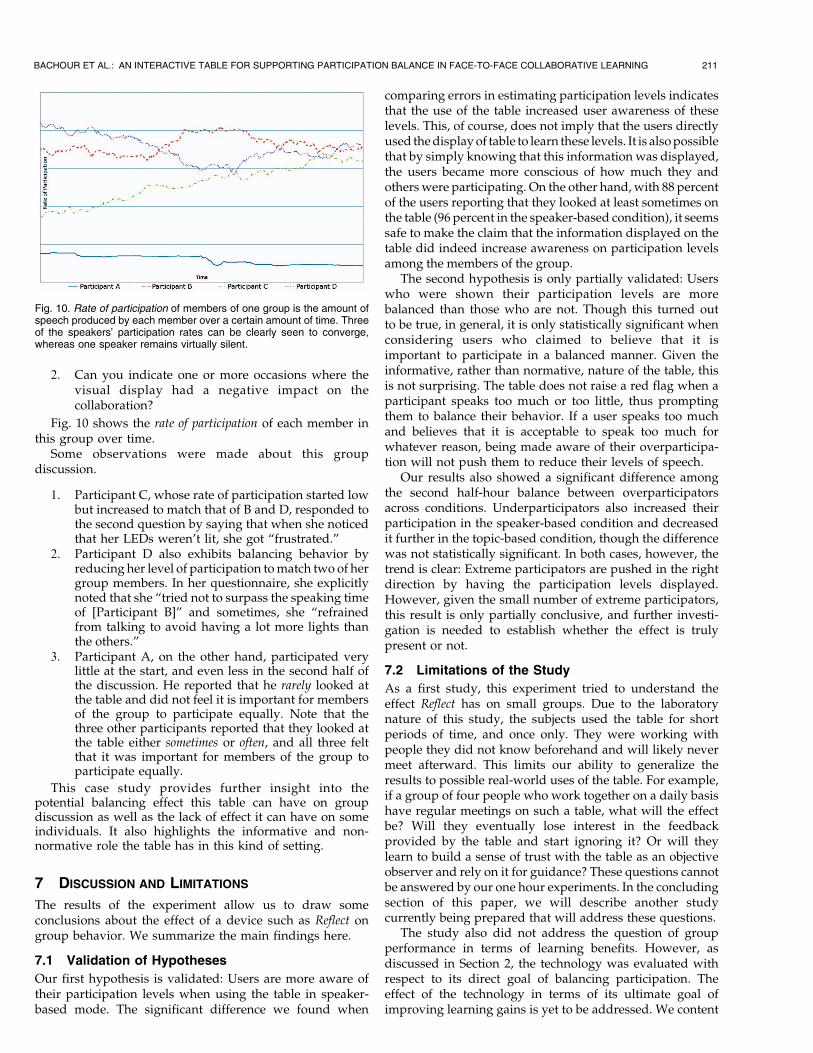
We studied the effect of the different visualizations on aspecific subgroup of participants, namely, the extremeparticipators: those who overparticipated and those whounderparticipated. We were interested in seeing how, overtime, these extreme participators modify their behavior.The objective here is to see if spending time around thetable would eventually lead to change in behavior. For that,we divided the 60 minute logs into two equal parts of30 minutes each. We computed the relative participation ofeach participant during each of the 30 minutes. We thendetermined those participants who were extreme partici-pators during the first half hour, and examined how theirparticipation level changes during the second half hour.
In line with the method used by DiMicco et al. todetermine extreme participators [15], we defined over-participators as those who spoke more than the meanparticipation level (25 percent) plus the standard deviationof participation levels among all participants. A similardefinition was used for underparticipators. We endedup with 10 overparticipators and 10 underparticipators,divided equally across the conditions.
We observed that, on average, during the first half-houroverparticipators in the speaker-based condition spoke less
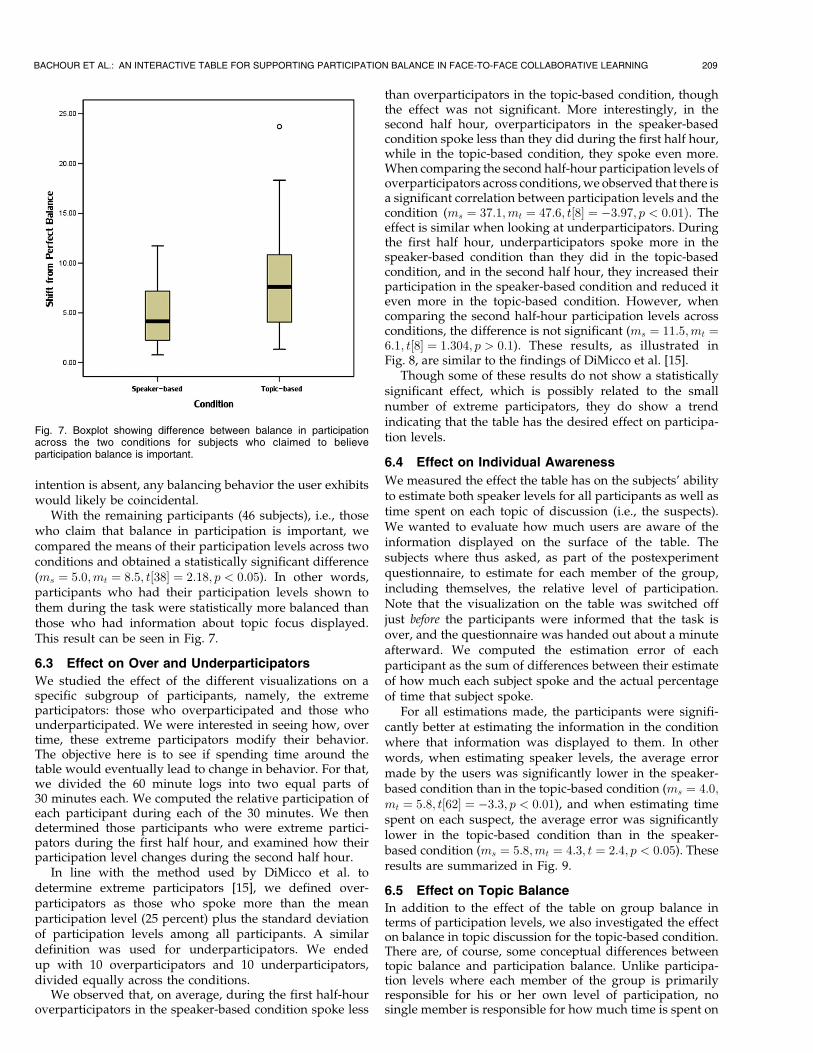
than overparticipators in the topic-based condition, thoughthe effect was not significant. More interestingly, in thesecond half hour, overparticipators in the speaker-basedcondition spoke less than they did during the first half hour,while in the topic-based condition, they spoke even more.When comparing the second half-hour participation levels ofoverparticipators across conditions, we observed that there isa significant correlation between participation levels and thecondition (ms ¼ 37:1;mt ¼ 47:6; t½8� ¼ �3:97; p < 0:01Þ. Theeffect is similar when looking at underparticipators. Duringthe first half hour, underparticipators spoke more in thespeaker-based condition than they did in the topic-basedcondition, and in the second half hour, they increased theirparticipation in the speaker-based condition and reduced iteven more in the topic-based condition. However, whencomparing the second half-hour participation levels acrossconditions, the difference is not significant (ms ¼ 11:5;mt ¼6:1; t½8� ¼ 1:304; p > 0:1). These results, as illustrated inFig. 8, are similar to the findings of DiMicco et al. [15].
Though some of these results do not show a statisticallysignificant effect, which is possibly related to the smallnumber of extreme participators, they do show a trendindicating that the table has the desired effect on participa-tion levels.
6.4 Effect on Individual Awareness
We measured the effect the table has on the subjects’ abilityto estimate both speaker levels for all participants as well astime spent on each topic of discussion (i.e., the suspects).We wanted to evaluate how much users are aware of theinformation displayed on the surface of the table. Thesubjects where thus asked, as part of the postexperimentquestionnaire, to estimate for each member of the group,including themselves, the relative level of participation.Note that the visualization on the table was switched offjust before the participants were informed that the task isover, and the questionnaire was handed out about a minuteafterward. We computed the estimation error of eachparticipant as the sum of differences between their estimateof how much each subject spoke and the actual percentageof time that subject spoke.
For all estimations made, the participants were signifi-cantly better at estimating the information in the conditionwhere that information was displayed to them. In otherwords, when estimating speaker levels, the average errormade by the users was significantly lower in the speaker-based condition than in the topic-based condition (ms ¼ 4:0;mt ¼ 5:8; t½62� ¼ �3:3; p < 0:01), and when estimating timespent on each suspect, the average error was significantlylower in the topic-based condition than in the speaker-based condition (ms ¼ 5:8;mt ¼ 4:3; t ¼ 2:4; p < 0:05). Theseresults are summarized in Fig. 9.
6.5 Effect on Topic Balance
In addition to the effect of the table on group balance interms of participation levels, we also investigated the effecton balance in topic discussion for the topic-based condition.There are, of course, some conceptual differences betweentopic balance and participation balance. Unlike participa-tion levels where each member of the group is primarilyresponsible for his or her own level of participation, nosingle member is responsible for how much time is spent on
BACHOUR ET AL.: AN INTERACTIVE TABLE FOR SUPPORTING PARTICIPATION BALANCE IN FACE-TO-FACE COLLABORATIVE LEARNING 209
Fig. 7. Boxplot showing difference between balance in participationacross the two conditions for subjects who claimed to believeparticipation balance is important.
each topic. In addition, changes in topic occur much lessfrequently than changes in speaker, especially near thebeginning of the discussion. When the group beginsdiscussing one suspect, they tend to stick to that suspectfor a long time before moving to a next one. Finally, thenature of the task does not necessitate that suspects arediscussed equally. Some details of the murder mysteryrequire more in-depth discussion than others.
That said, we report that no significant differenceoccurred in terms of topic balance across the conditions(ms ¼ 5:7;mt ¼ 6:1; t½49� ¼ �0:24; p > 0:1). The time spenton individual suspects in the experiments varied greatlyamong groups. Not surprisingly, a large number ofparticipants (70 percent) felt that it is not “important tospend more-or-less the same amount of time discussingthe case of each suspect.” In the case of participation levels,we were able to put aside subjects who felt that speaker
balance is unimportant. However, we cannot do so heresince, as stated before, topic balance is not determined byindividual users, but by the group as a whole.
6.6 Qualitative Findings
In order to better understand the effect of the table on oursubjects, we present here a brief summary of somequalitative analyses done with one of the groups that tookpart in our experiment. A more detailed breakdown of thiscase can be found in our previous work [25]. These subjectssolved the task in the speaker-based condition. We referredto this group in particular because of the different effect thetable had on its individual members.
For our analysis, we considered the subjects’ responsesto two of the open questions in the postexperimentquestionnaire:
1. Can you indicate one or more occasions where thevisual display influenced your behavior?
210 IEEE TRANSACTIONS ON LEARNING TECHNOLOGIES, VOL. 3, NO. 3, JULY-SEPTEMBER 2010
Fig. 9. Error levels of while estimating speaker levels and time spent ondifferent suspects across both conditions.
Fig. 8. Change in participation levels of extreme participators in bothconditions. Using the speaker-based visualization, overparticipatorsreduce their level of participations and underparticipators increasetheirs. In the topic-based visualization, both extreme participators movein the direction of further imbalance.
2. Can you indicate one or more occasions where thevisual display had a negative impact on thecollaboration?
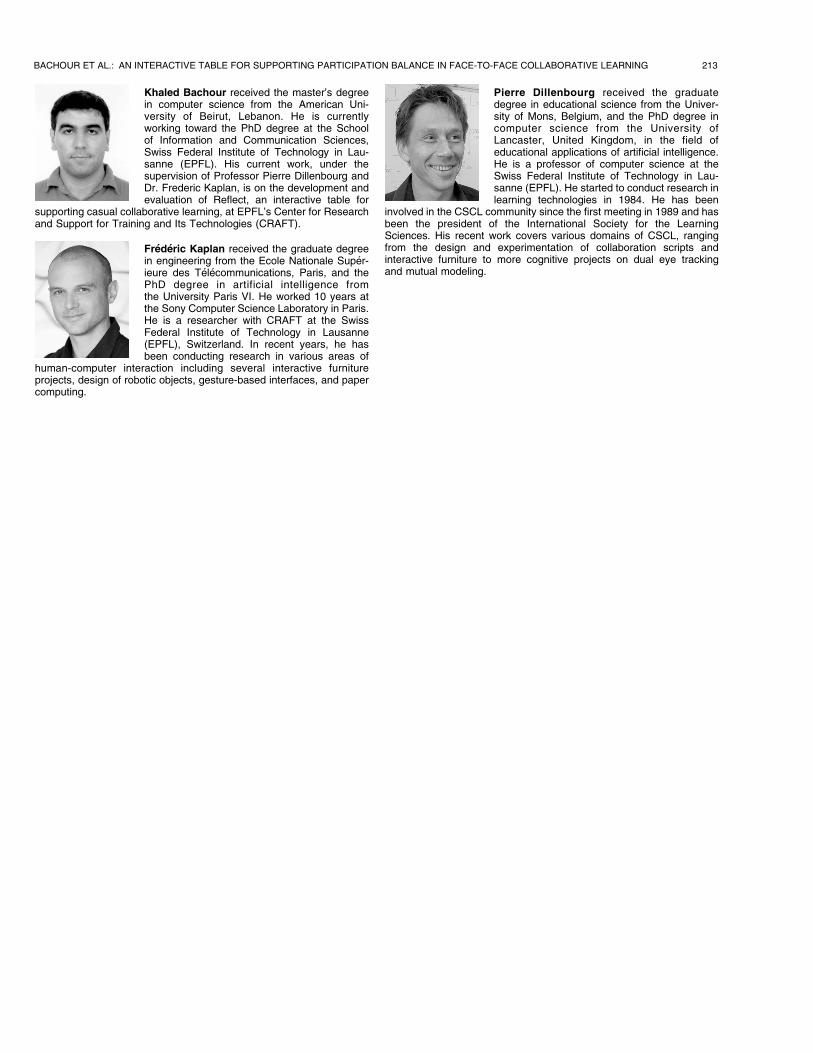
Fig. 10 shows the rate of participation of each member inthis group over time.
Some observations were made about this groupdiscussion.
1. Participant C, whose rate of participation started lowbut increased to match that of B and D, responded tothe second question by saying that when she noticedthat her LEDs weren’t lit, she got “frustrated.”
2. Participant D also exhibits balancing behavior byreducing her level of participation to match two of hergroup members. In her questionnaire, she explicitlynoted that she “tried not to surpass the speaking timeof [Participant B]” and sometimes, she “refrainedfrom talking to avoid having a lot more lights thanthe others.”
3. Participant A, on the other hand, participated verylittle at the start, and even less in the second half ofthe discussion. He reported that he rarely looked atthe table and did not feel it is important for membersof the group to participate equally. Note that thethree other participants reported that they looked atthe table either sometimes or often, and all three feltthat it was important for members of the group toparticipate equally.
This case study provides further insight into thepotential balancing effect this table can have on groupdiscussion as well as the lack of effect it can have on someindividuals. It also highlights the informative and non-normative role the table has in this kind of setting.
7 DISCUSSION AND LIMITATIONS
The results of the experiment allow us to draw someconclusions about the effect of a device such as Reflect ongroup behavior. We summarize the main findings here.
7.1 Validation of Hypotheses
Our first hypothesis is validated: Users are more aware oftheir participation levels when using the table in speaker-based mode. The significant difference we found when
comparing errors in estimating participation levels indicatesthat the use of the table increased user awareness of theselevels. This, of course, does not imply that the users directlyused the display of table to learn these levels. It is also possiblethat by simply knowing that this information was displayed,the users became more conscious of how much they andothers were participating. On the other hand, with 88 percentof the users reporting that they looked at least sometimes onthe table (96 percent in the speaker-based condition), it seemssafe to make the claim that the information displayed on thetable did indeed increase awareness on participation levelsamong the members of the group.
The second hypothesis is only partially validated: Userswho were shown their participation levels are morebalanced than those who are not. Though this turned outto be true, in general, it is only statistically significant whenconsidering users who claimed to believe that it isimportant to participate in a balanced manner. Given theinformative, rather than normative, nature of the table, thisis not surprising. The table does not raise a red flag when aparticipant speaks too much or too little, thus promptingthem to balance their behavior. If a user speaks too muchand believes that it is acceptable to speak too much forwhatever reason, being made aware of their overparticipa-tion will not push them to reduce their levels of speech.
Our results also showed a significant difference amongthe second half-hour balance between overparticipatorsacross conditions. Underparticipators also increased theirparticipation in the speaker-based condition and decreasedit further in the topic-based condition, though the differencewas not statistically significant. In both cases, however, thetrend is clear: Extreme participators are pushed in the rightdirection by having the participation levels displayed.However, given the small number of extreme participators,this result is only partially conclusive, and further investi-gation is needed to establish whether the effect is trulypresent or not.
7.2 Limitations of the Study
As a first study, this experiment tried to understand theeffect Reflect has on small groups. Due to the laboratorynature of this study, the subjects used the table for shortperiods of time, and once only. They were working withpeople they did not know beforehand and will likely nevermeet afterward. This limits our ability to generalize theresults to possible real-world uses of the table. For example,if a group of four people who work together on a daily basishave regular meetings on such a table, what will the effectbe? Will they eventually lose interest in the feedbackprovided by the table and start ignoring it? Or will theylearn to build a sense of trust with the table as an objectiveobserver and rely on it for guidance? These questions cannotbe answered by our one hour experiments. In the concludingsection of this paper, we will describe another studycurrently being prepared that will address these questions.
The study also did not address the question of groupperformance in terms of learning benefits. However, asdiscussed in Section 2, the technology was evaluated withrespect to its direct goal of balancing participation. Theeffect of the technology in terms of its ultimate goal ofimproving learning gains is yet to be addressed. We content
BACHOUR ET AL.: AN INTERACTIVE TABLE FOR SUPPORTING PARTICIPATION BALANCE IN FACE-TO-FACE COLLABORATIVE LEARNING 211
Fig. 10. Rate of participation of members of one group is the amount ofspeech produced by each member over a certain amount of time. Threeof the speakers’ participation rates can be clearly seen to converge,whereas one speaker remains virtually silent.
in this paper with expected theoretical benefit on learninggains given the observed effect on group balance.
8 CONCLUSIONS AND FUTURE WORK
We presented an interactive table, Reflect, that is designed to
support collaboration between small groups. Reflect listensto the conversation taking place around it and displaysinformation on its surface about the levels of participationof the speakers. We conducted a study that shows that the
table does indeed increase awareness of group membersabout their participation levels. It also, under certainconditions, leads group members to participate in a more
balanced manner. We observed a stronger effect of over-participators reducing their participation than underparti-cipators increasing theirs.
To further understand the effect of the table, we willsoon conduct a real-world study where four prototypes of
the table will be placed in four different workplaces for aperiod of several months. We will observe the effect thetable has on groups of people after long-term regular use.
Our ultimate goal will be to address the question of how
group members are participating, instead of simply how
much. Recall from Section 2 that verbalization in and of itselfis not a predictor of learning gains; it is rather a manifestationof certain types of interaction that are predictors of better
learning outcomes. We are thus currently exploring the useof pitch and other prosodic features of the voice in order toattribute to each speaker not only a participation level, butalso a manner of participation and possibly even a role. By
knowing which members of the group are engaging ininteractions that foster learning (rather than which groupmembers are simply speaking) the table might be able toprovide more meaningful feedback to the group. Current
state of the art indicates that a lot can be told about theoutcome of an interaction by simply observing basic vocalfeatures [26]. We aim to incorporate this type of vocalanalysis in future versions of Reflect.
ACKNOWLEDGMENTS
The authors would like to thank the Swiss Federal Institute
of Technology, Lausanne, for funding the work presentedhere. In addition, they would like to thank Christof Faller,Rene Beuchat, and Martino D’�Esposito as well as QuentinBonnard and Asheesh Gulati for their help in developing
the table. They also thank Jean-Baptiste Haue andGuillaume Raymondon, who were involved in the devel-opment of initial prototypes based upon which Reflect wasbuilt. Finally, they would like to extend their gratitude to
Garold Stasser who generously provided them with themurder mystery task used in their experiments.
REFERENCES
[1] E.G. Cohen, “Restructuring the Classroom: Conditions forProductive Small Groups,” Rev. of Educational Research, vol. 64,no. 1, pp. 1-35, Spring 1994.
[2] J.M. DiMicco, A. Pandolfo, and W. Bender, “Influencing GroupParticipation with a Shared Display,” Proc. ACM Conf. ComputerSupported Cooperative Work (CSCW ’04), pp. 614-623, 2004.
[3] G. Salomon and T. Globerson, “When Teams Do Not Function theWay They Ought to,” Int’l J. Educational Research, vol. 13, pp. 89-99,1989.
[4] R.E. Slavin, Cooperative Learning. Longman, 1983.[5] P. Dillenbourg, M. Baker, A. Blaye, and C. O’Malley, “The
Evolution of Research on Collaborative Learning,” Learning inHumans and Machine: Towards an Interdisciplinary Learning Science,pp. 189-211, Elsevier, 1996.
[6] N.M. Webb, “Task-Related Verbal Interaction and MathematicsLearning in Small Groups,” J. Research in Math. Education, vol. 22,no. 5, pp. 366-389, 1991.
[7] M.J. Baker, “Argumentation and Constructive Interaction,” Studiesin Writing: Foundations of Argumentative Text Processing, P. Coirierand J. Andriessen, eds., vol. 5, pp. 179-202, Univ. of AmsterdamPress, 1999.
[8] A. Blaye, “Confrontation Socio-Cognitive et Resolution DeProblemes,” PhD dissertation, Centre de Recherce en PsychologieCognitive, Univ. de Provence, 1988.
[9] A.-N.P.-C.W. Doise and G. Mugny, “Social Interaction andCognitive Development: Further Evidence,” European J. SocialPsychology, vol. 6, no. 2, pp. 245-247, 1976.
[10] N.M. Webb and L.K. Cullian, “Group Interaction and Achieve-ment in Small Groups: Stability over Time,” Am. EducationalResearch J., vol. 20, no. 3, pp. 411-423, http://www.jstor.org/stable/1162608, 1983.
[11] H. Sacks, Lectures on Conversation, G. Jefferson, ed. BlackwellPublishing, 1995.
[12] M. Webster Jr., and J.E. Driskel Jr., “Beauty as Status,” The Am. J.Sociology, vol. 89, no. 1, pp. 140-165, July 1983.
[13] M. Dembo and T. McAuliffe, “Effects of Perceived Ability andGrade Status on Social Interaction and Influence in CooperativeGroups,” J. Educational Psychology, vol. 79, pp. 415-423, 1987.
[14] P. Jermann, A. Soller, and M. Mhlenbrock, “From Mirroring toGuiding: A Review of the State of Art Technology for SupportingCollaborative Learning,” Proc. Second European Conf. Computer-Supported Collaborative Learning, pp. 324-331, http://www.ll.unimaas.nl/euro-cscl, 2001.
[15] J.M. DiMicco, K.J. Hollenbach, A. Pandolfo, and W. Bender, “TheImpact of increased Awareness While Face-to-Face,” Human-Computer Interactions, vol. 22, no. 1, pp. 47-96, 2007.
[16] J.M. DiMicco and W. Bender, “Group Reactions to Visual FeedbackTools,” Proc. Int’l Conf. Persuasive Technology (PERSUASIVE),pp. 132-143, 2007.
[17] T. Bergstrom and K. Karahalios, “Conversation Clock: VisualizingAudio Patterns in Co-Located Groups,” Proc. Ann. Hawaii Int’lConf. System Sciences (HICSS ’07), p. 78, 2007.
[18] T. Bergstrom and K. Karahalios, “Seeing More: Visualizing AudioCues,” Proc. Int’l Conf. Human-Computer Interaction, 2007.
[19] T. Bergstrom and K. Karahalios, “Conversation Votes: EnablingAnonymous Cues,” Proc. Extended Abstracts on Human Factors inComputing Systems (CHI ’07), pp. 2279-2284, 2007.
[20] N.A. Streitz, P. Tandler, and C. Muller-tomfelde, Roomware:Towards the Next Generation of Human-Computer Interaction Basedon an Integrated Design of Real and Virtual Worlds, pp. 553-578,Addison Wesley, 2001.
[21] B.A.T. Brown, A.S. Taylor, S. Izadi, A. Sellen, J. Kaye, and R.Eardley, “Locating Family Values: A Field Trial of the Where-abouts Clock,” Ubicomp, J. Krumm, G.D. Abowd, A. Seneviratne,and T. Strang, eds., pp. 354-371, Springer, 2007.
[22] P. Dietz and D. Leigh, “Diamondtouch: A Multi-User TouchTechnology,” Proc. 14th Ann. ACM Symp. User Interface Softwareand Technology (UIST ’01), pp. 219-226, 2001.
[23] http://www.illusonic.com, 2010.[24] G. Stasser and D. Stewart, “Discovery of Hidden Profiles by
Decision-Making Groups: Solving a Problem versus Making aJudgment,” J. Personality and Social Psychology, vol. 63, no. 3,pp. 426-434, http://www.sciencedirect.com/science/article/B6X01-46V080H-W/2/dee8915278e09aca92220b452821026e, Sept.1992.
[25] K. Bachour, F. Kaplan, and P. Dillenbourg, Reflect: An InteractiveTable for Regulating Face-to-Face Collaborative Learning. Springer,http://www.springerlink.com/content/q85518635660432n, 2008.
[26] A.S. Pentland, Honest Signals: How They Shape Our World. The MITPress, 2008.
212 IEEE TRANSACTIONS ON LEARNING TECHNOLOGIES, VOL. 3, NO. 3, JULY-SEPTEMBER 2010
Khaled Bachour received the master’s degreein computer science from the American Uni-versity of Beirut, Lebanon. He is currentlyworking toward the PhD degree at the Schoolof Information and Communication Sciences,Swiss Federal Institute of Technology in Lau-sanne (EPFL). His current work, under thesupervision of Professor Pierre Dillenbourg andDr. Frederic Kaplan, is on the development andevaluation of Reflect, an interactive table for
supporting casual collaborative learning, at EPFL’s Center for Researchand Support for Training and Its Technologies (CRAFT).
Frederic Kaplan received the graduate degreein engineering from the Ecole Nationale Super-ieure des Telecommunications, Paris, and thePhD degree in artificial intelligence fromthe University Paris VI. He worked 10 years atthe Sony Computer Science Laboratory in Paris.He is a researcher with CRAFT at the SwissFederal Institute of Technology in Lausanne(EPFL), Switzerland. In recent years, he hasbeen conducting research in various areas of
human-computer interaction including several interactive furnitureprojects, design of robotic objects, gesture-based interfaces, and papercomputing.
Pierre Dillenbourg received the graduatedegree in educational science from the Univer-sity of Mons, Belgium, and the PhD degree incomputer science from the University ofLancaster, United Kingdom, in the field ofeducational applications of artificial intelligence.He is a professor of computer science at theSwiss Federal Institute of Technology in Lau-sanne (EPFL). He started to conduct research inlearning technologies in 1984. He has been
involved in the CSCL community since the first meeting in 1989 and hasbeen the president of the International Society for the LearningSciences. His recent work covers various domains of CSCL, rangingfrom the design and experimentation of collaboration scripts andinteractive furniture to more cognitive projects on dual eye trackingand mutual modeling.
BACHOUR ET AL.: AN INTERACTIVE TABLE FOR SUPPORTING PARTICIPATION BALANCE IN FACE-TO-FACE COLLABORATIVE LEARNING 213