Embed Size (px)
Citation preview
1
AN INTEGRATED MONITORING SYSTEM FOR THE MONUMENTAL WALLS OF AMELIA
Donatella DOMINICI1, Guido FASTELLINI2 , Fabio RADICIONI2 and Aurelio STOPPINI2 1DAU, University of L’Aquila, Italy 2DICA, University of Perugia, Italy
Abstract: The ancient city of Amelia (Umbria, central Italy) is surrounded by monumental walls built by Italic civilization between VI and IV century BC. The walls of Amelia have an exceptional historical and architectonic interest due to their particular construction made of very large limestone blocks cut in polygonal shape, assembled with no cement. Recently, a part of the walls has been interested by serious structural problems culminating in a local collapse. Consequently, a series of restoration actions have been undertaken by the regional authorities, and the walls have been put under careful control. In this frame, the Department of Civil and Environmental Engineering of the Perugia University (DICA) has designed and set up an integrated monitoring system for the Amelia walls involving various techniques (GPS, high accuracy total stations, close-range photogrammetry, laser scanning, deformation sensors), which is now starting to operate. The system is designed to employ such different techniques and sensors in synergy, taking advantage by the different features of each one. The work analyses the design of the multi-sensor system, the selection criteria of instruments and sensors, the setting up of the system and the expected results.
1. BRIEF HISTORICAL INFORMATION ON THE CITY AND ITS WALLS
Following historical writings by Pliny the Elder and Cato, the city of Ameria (now called Amelia) was founded in the XII century BC by a native civilization whose legendary king seems to have been called Amiro or Ameroe. In the following centuries the area was dominated by ancient Italic cultures like the Pelasgians, the Umbrians and later the Etruscans, until the Romans defeated the Latin League in the Latin war (about 340 BC); since then Ameria became a roman municipium.
During the roman domination, Ameria knew a period of prosperity, due to its geographic position about 100 km north of Rome along the Via Vejetana (also called Via Amerina) connecting Rome with Tuder (Todi) and the territory of Perusia (Perugia). Important remains of the Roman period are still visible inside the town walls, including a large water reservoir divided into chambers.
Nowadays, Amelia still retains considerable remains of the monumental city wall (see figs. 1 to 4).
2
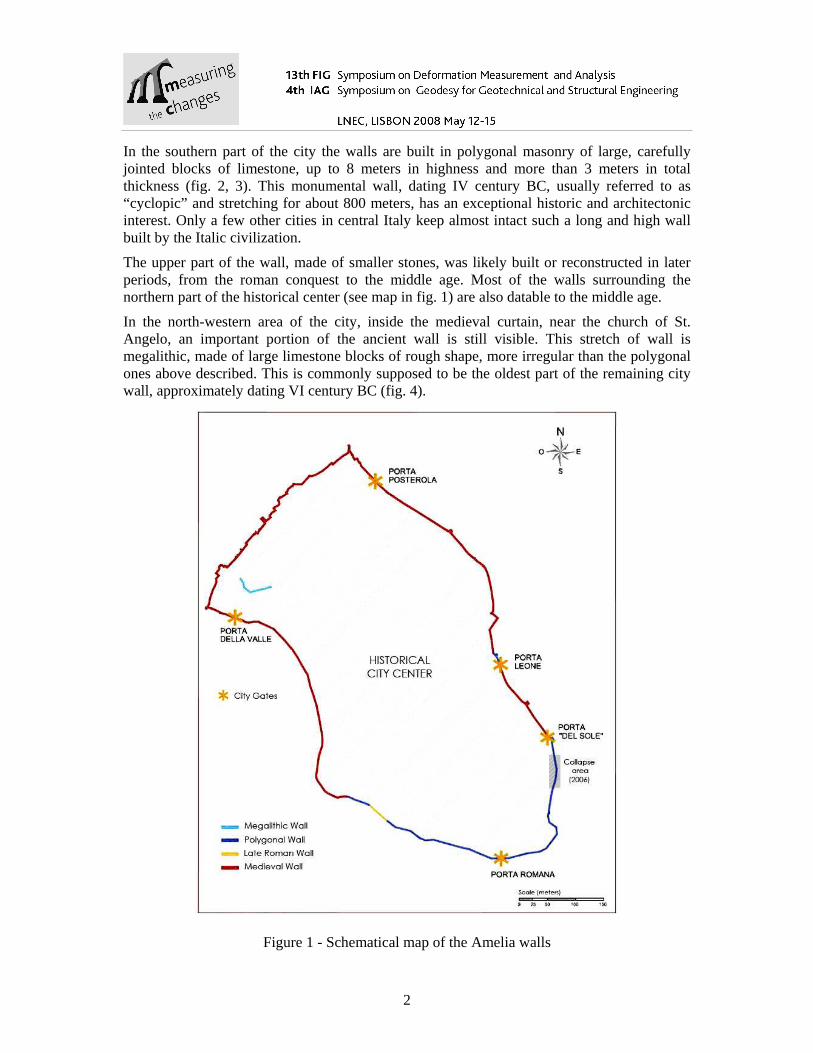
In the southern part of the city the walls are built in polygonal masonry of large, carefully jointed blocks of limestone, up to 8 meters in highness and more than 3 meters in total thickness (fig. 2, 3). This monumental wall, dating IV century BC, usually referred to as “cyclopic” and stretching for about 800 meters, has an exceptional historic and architectonic interest. Only a few other cities in central Italy keep almost intact such a long and high wall built by the Italic civilization.
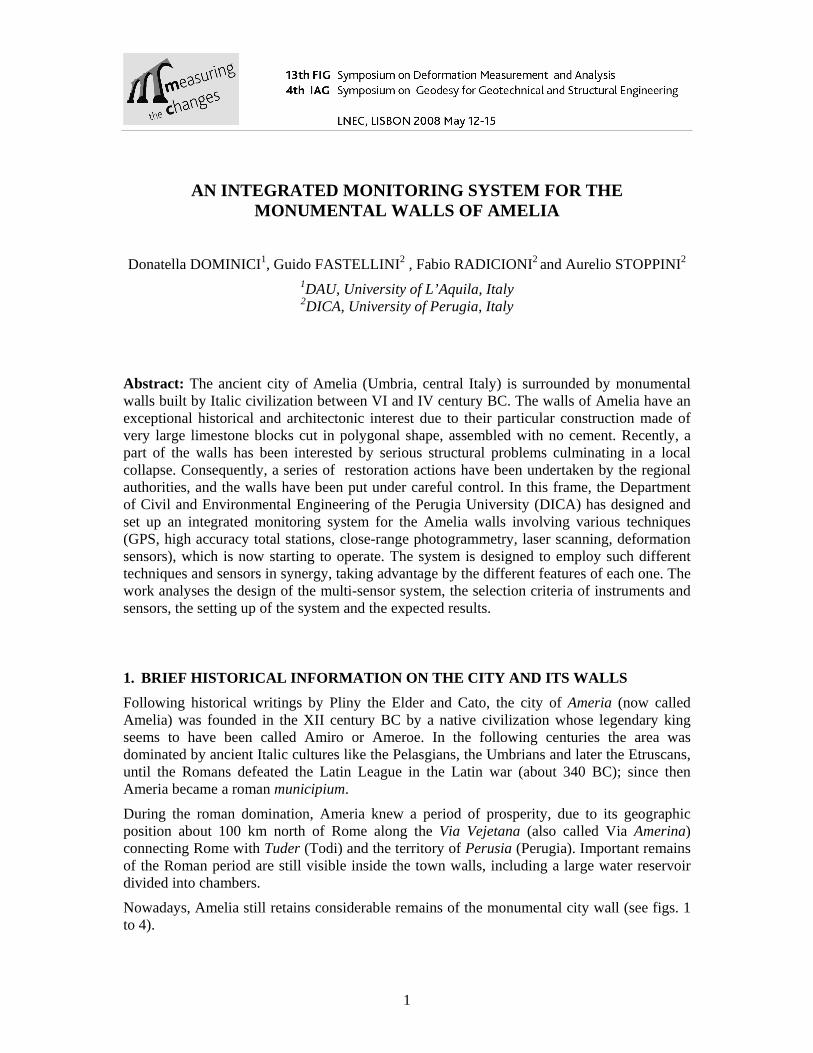
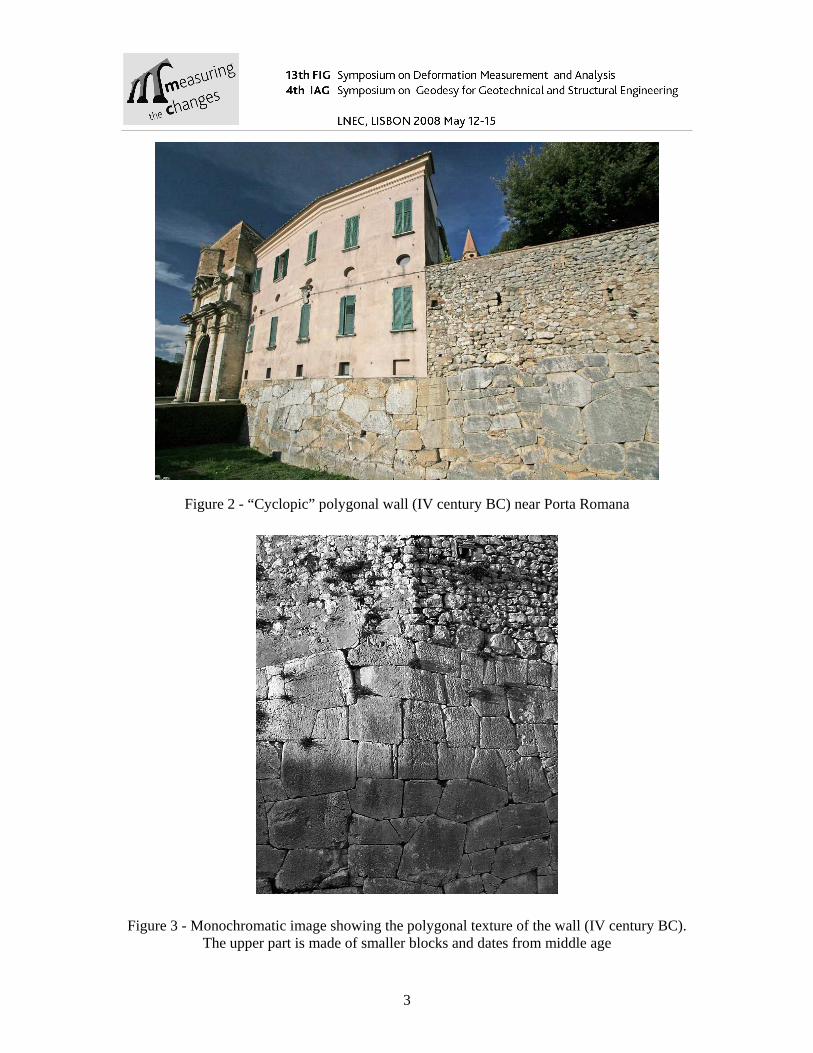
The upper part of the wall, made of smaller stones, was likely built or reconstructed in later periods, from the roman conquest to the middle age. Most of the walls surrounding the northern part of the historical center (see map in fig. 1) are also datable to the middle age.
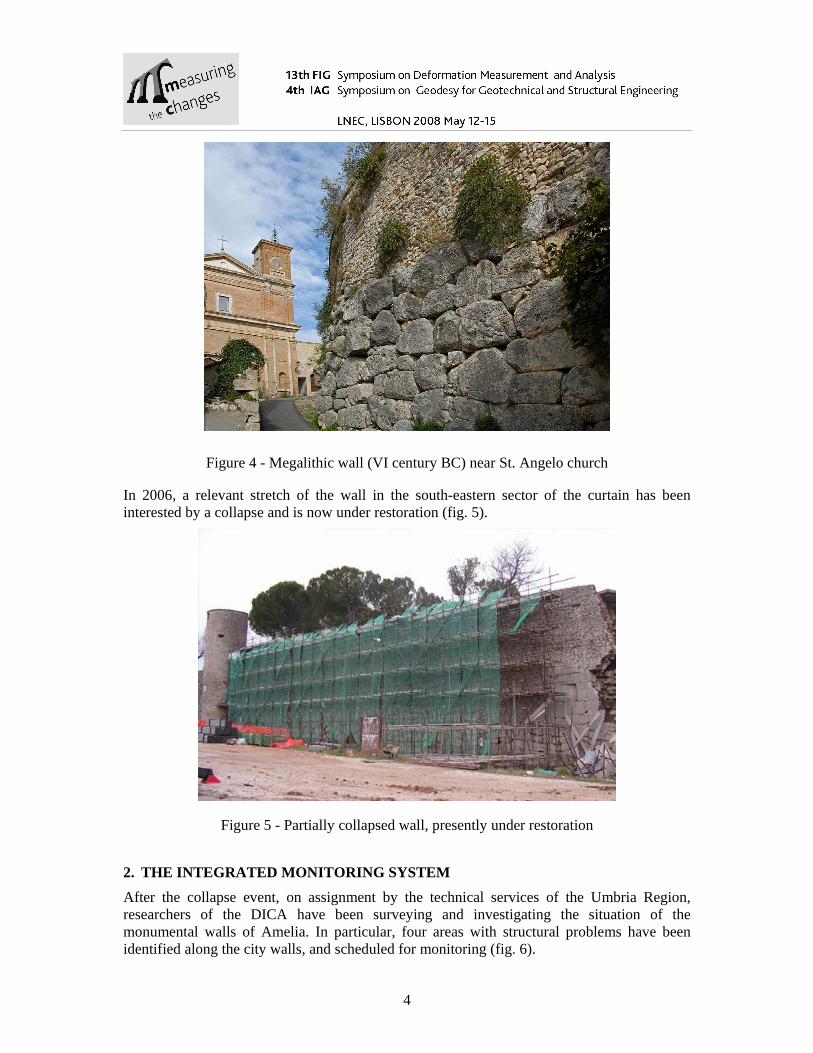
In the north-western area of the city, inside the medieval curtain, near the church of St. Angelo, an important portion of the ancient wall is still visible. This stretch of wall is megalithic, made of large limestone blocks of rough shape, more irregular than the polygonal ones above described. This is commonly supposed to be the oldest part of the remaining city wall, approximately dating VI century BC (fig. 4).
Figure 1 - Schematical map of the Amelia walls
3
Figure 2 - “Cyclopic” polygonal wall (IV century BC) near Porta Romana
Figure 3 - Monochromatic image showing the polygonal texture of the wall (IV century BC). The upper part is made of smaller blocks and dates from middle age
4
Figure 4 - Megalithic wall (VI century BC) near St. Angelo church
In 2006, a relevant stretch of the wall in the south-eastern sector of the curtain has been interested by a collapse and is now under restoration (fig. 5).
Figure 5 - Partially collapsed wall, presently under restoration
2. THE INTEGRATED MONITORING SYSTEM
After the collapse event, on assignment by the technical services of the Umbria Region, researchers of the DICA have been surveying and investigating the situation of the monumental walls of Amelia. In particular, four areas with structural problems have been identified along the city walls, and scheduled for monitoring (fig. 6).

5
Figure 6 - Location of the four areas to be controlled (A, B, C, D)
The designed monitoring system is based on more Geomatics technologies, utilised in synergy to take benefit from the peculiar advantages of each one:
- A general GNSS Network for a georeferencing of the different areas in an unique datum, thus revealing any relative displacement between areas;
- Four 3D Local Networks (one for each area to monitor local deformation of selected points at a millimeter accuracy level;
- Terrestrial Laser Scanning local captures for a continuous survey and deformation control of the wall surfaces;
- Digital Terrestrial Photogrammetry for a metric documentation of the actual state of the walls and its variation in time.
The project has suffered some delay due to administrative reasons. The monumentation (survey stations on pillars, centering devices, signals) is currently under construction, and the measurements will start as soon the installation phase will be finished (spring 2008).
In the following part of the paper, more details are given on the way each technique is integrated in the designed monitoring system.
3. GNSS NETWORK
A GNSS network connects the four areas to be monitored, in order to georeference them all in a same datum, practically coinciding with ETRS89 (a certain number of baselines link the
6
Amelia network to the GNSS permanent station network GPSUMBRIA of the Umbria Region).
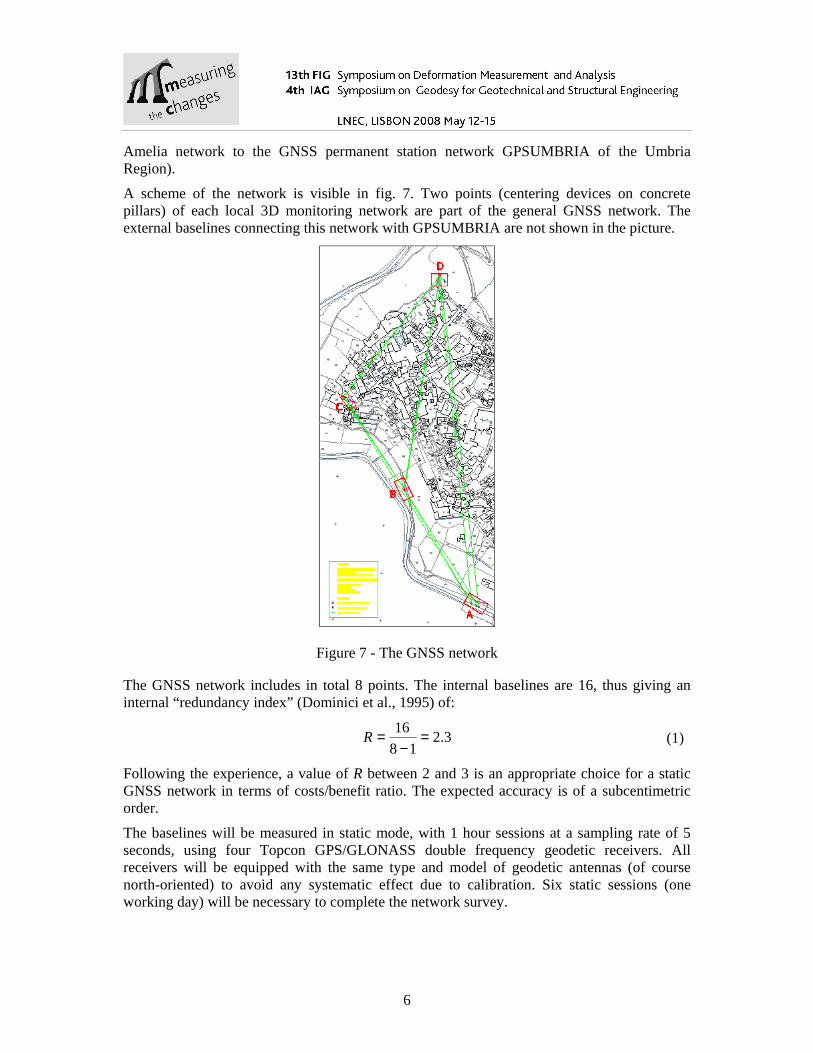
A scheme of the network is visible in fig. 7. Two points (centering devices on concrete pillars) of each local 3D monitoring network are part of the general GNSS network. The external baselines connecting this network with GPSUMBRIA are not shown in the picture.
Figure 7 - The GNSS network
The GNSS network includes in total 8 points. The internal baselines are 16, thus giving an internal “redundancy index” (Dominici et al., 1995) of:
3.2
18
16 =−
=R (1)
Following the experience, a value of R between 2 and 3 is an appropriate choice for a static GNSS network in terms of costs/benefit ratio. The expected accuracy is of a subcentimetric order.
The baselines will be measured in static mode, with 1 hour sessions at a sampling rate of 5 seconds, using four Topcon GPS/GLONASS double frequency geodetic receivers. All receivers will be equipped with the same type and model of geodetic antennas (of course north-oriented) to avoid any systematic effect due to calibration. Six static sessions (one working day) will be necessary to complete the network survey.
7
The monumentation of the GNSS network is described in the following paragraph, because the GNSS antennas will be mounted on the same pillars and centering devices used for the 3D local monitoring survey.
4. LOCAL 3D NETWORKS
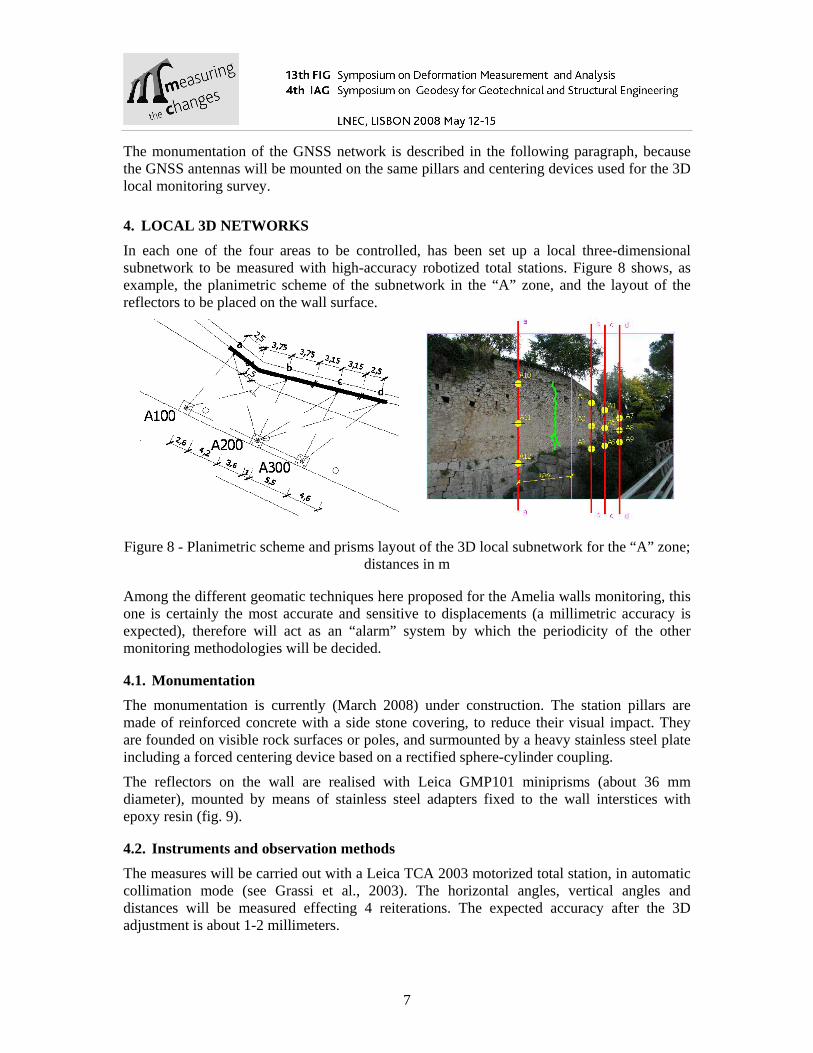
In each one of the four areas to be controlled, has been set up a local three-dimensional subnetwork to be measured with high-accuracy robotized total stations. Figure 8 shows, as example, the planimetric scheme of the subnetwork in the “A” zone, and the layout of the reflectors to be placed on the wall surface.
Figure 8 - Planimetric scheme and prisms layout of the 3D local subnetwork for the “A” zone; distances in m
Among the different geomatic techniques here proposed for the Amelia walls monitoring, this one is certainly the most accurate and sensitive to displacements (a millimetric accuracy is expected), therefore will act as an “alarm” system by which the periodicity of the other monitoring methodologies will be decided.
4.1. Monumentation
The monumentation is currently (March 2008) under construction. The station pillars are made of reinforced concrete with a side stone covering, to reduce their visual impact. They are founded on visible rock surfaces or poles, and surmounted by a heavy stainless steel plate including a forced centering device based on a rectified sphere-cylinder coupling.
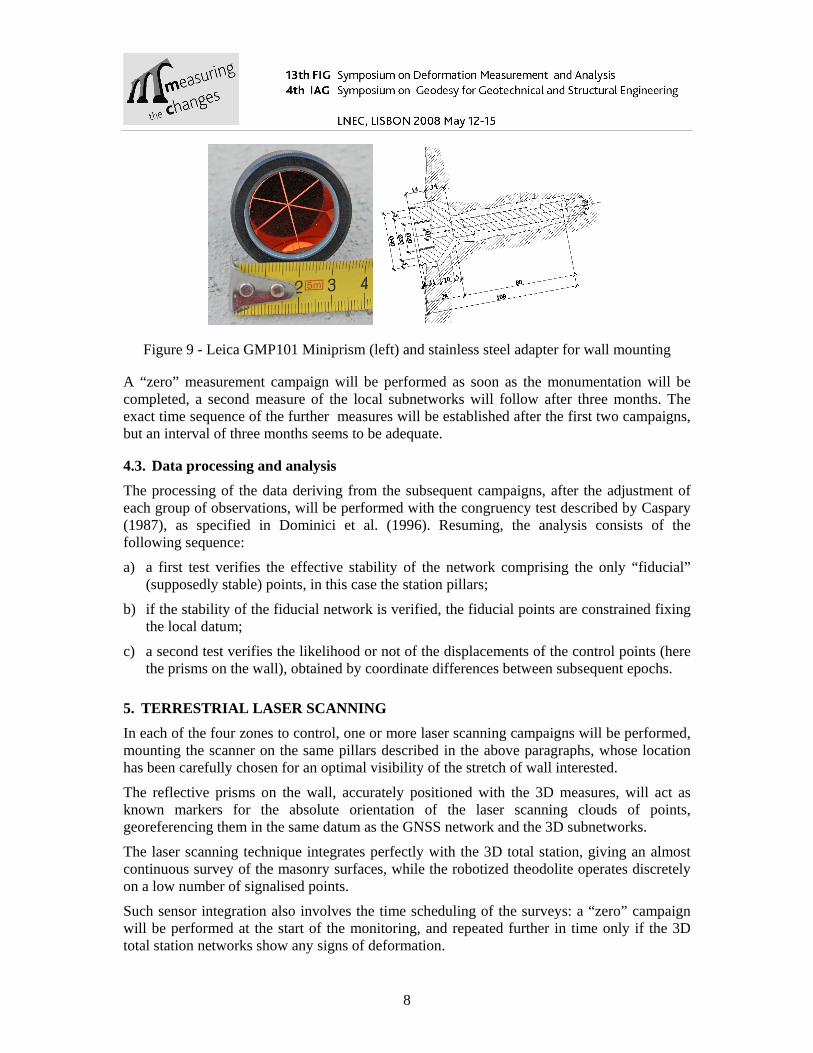
The reflectors on the wall are realised with Leica GMP101 miniprisms (about 36 mm diameter), mounted by means of stainless steel adapters fixed to the wall interstices with epoxy resin (fig. 9).
4.2. Instruments and observation methods
The measures will be carried out with a Leica TCA 2003 motorized total station, in automatic collimation mode (see Grassi et al., 2003). The horizontal angles, vertical angles and distances will be measured effecting 4 reiterations. The expected accuracy after the 3D adjustment is about 1-2 millimeters.
8
Figure 9 - Leica GMP101 Miniprism (left) and stainless steel adapter for wall mounting
A “zero” measurement campaign will be performed as soon as the monumentation will be completed, a second measure of the local subnetworks will follow after three months. The exact time sequence of the further measures will be established after the first two campaigns, but an interval of three months seems to be adequate.
4.3. Data processing and analysis
The processing of the data deriving from the subsequent campaigns, after the adjustment of each group of observations, will be performed with the congruency test described by Caspary (1987), as specified in Dominici et al. (1996). Resuming, the analysis consists of the following sequence:
a) a first test verifies the effective stability of the network comprising the only “fiducial” (supposedly stable) points, in this case the station pillars;
b) if the stability of the fiducial network is verified, the fiducial points are constrained fixing the local datum;
c) a second test verifies the likelihood or not of the displacements of the control points (here the prisms on the wall), obtained by coordinate differences between subsequent epochs.
5. TERRESTRIAL LASER SCANNING
In each of the four zones to control, one or more laser scanning campaigns will be performed, mounting the scanner on the same pillars described in the above paragraphs, whose location has been carefully chosen for an optimal visibility of the stretch of wall interested.
The reflective prisms on the wall, accurately positioned with the 3D measures, will act as known markers for the absolute orientation of the laser scanning clouds of points, georeferencing them in the same datum as the GNSS network and the 3D subnetworks.
The laser scanning technique integrates perfectly with the 3D total station, giving an almost continuous survey of the masonry surfaces, while the robotized theodolite operates discretely on a low number of signalised points.
Such sensor integration also involves the time scheduling of the surveys: a “zero” campaign will be performed at the start of the monitoring, and repeated further in time only if the 3D total station networks show any signs of deformation.

9
The instrument for the terrestrial laser scanning will be rented, choosing among scanners having the following characteristics:
- short range use (less than 50 meters);
- high accuracy (centimetric or subcentimetric);
- high spatial data frequency (less than 20” horizontal and vertical, corresponding to a subcentimetric points spacing at 50 m)
6. DIGITAL TERRESTRIAL PHOTOGRAMMETRY
In each of the four zones, one or more terrestrial photogrammetric campaigns will be performed.
The reflective prisms on the wall, accurately positioned with the 3D measures, will act as known markers for the absolute orientation, together with a number of supplementary control points, permitting to georeference the photogrammetric models in the same datum as the GNSS network and the 3D subnetworks. The orientation will be strengthened by means of a digital aerial triangulation procedure.
Similarly to the laser scanning, the photogrammetric technique also integrates very well with the 3D total station survey, giving a continuous description of the surfaces. Moreover, the sensor integration will optimize the time scheduling of the subsequent campaigns: a “zeroing” one will be performed initially, and repeated only if any signs of deformations show from the 3D subnetworks results.
Two cameras will be utilised:
- a Nikon D200 digital reflex camera, whose sensor and optics have been calibrated at the Laboratory of Surveying and Photogrammetry of the DICA; sensor size 23.6 x 15.8 mm; angles of field with a 14 mm lens: 58° (short side) – 80° (long side);
- a wide angle Fuji GSW 690 III “semi-metric” film camera (negative size 56.0 x 82.6 mm, 8 shots on a 120 film; 65 mm fixed lens) calibrated and equipped with a glass reseau (35 crosses) on the focal plane; angles of field: 46° (short side) – 66° (long side).
The negatives from the Fuji GSW camera will be scanned with a photogrammetric scanner; a calibration for each photogram is made possible by the presence of the 35-crosses reseau.
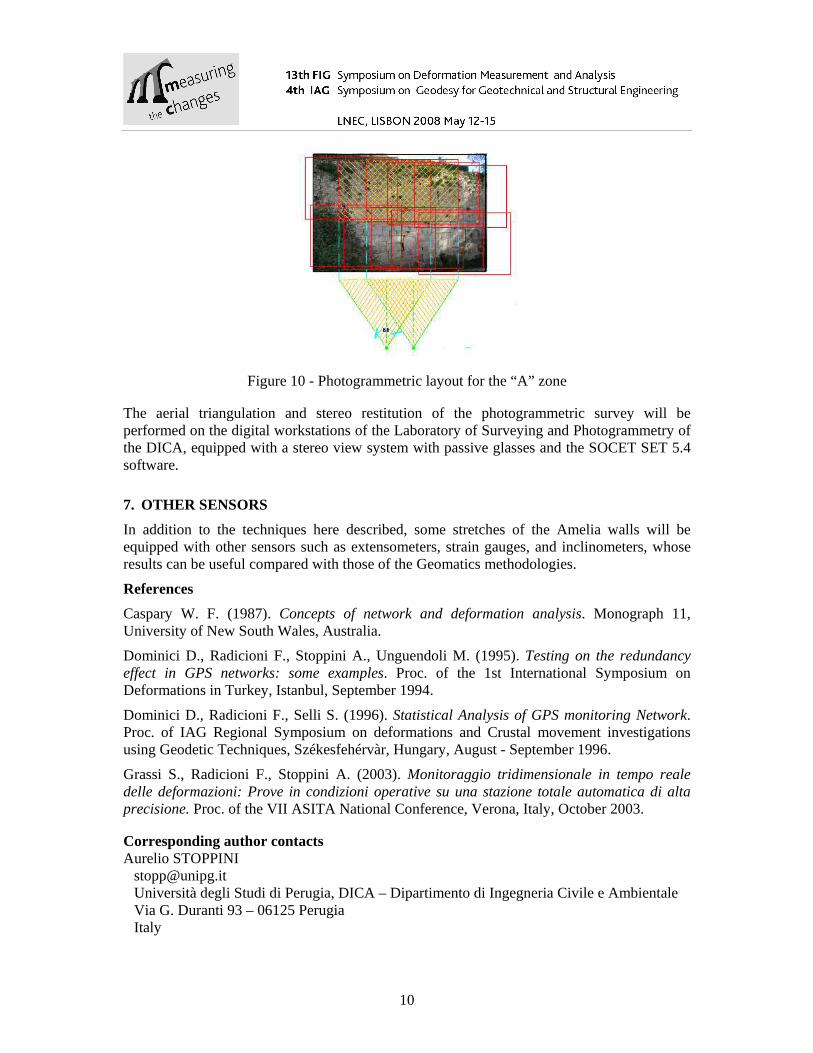
Fig. 10 shows, as example, the photograms layout designed for the “A” zone, assuming to use the GSW 690 camera. Two strips are necessary, with a 70% longitudinal and 25% transversal overlapping, for a total of 12 photograms which give a complete stereoscopical coverage of the interested area.
The average scale of the photograms is 1:200 or more. Considering a scanner resolution of 1200 dpi, a pixel size of about 21 micron will be obtained, corresponding to about 4 mm on the wall. Such size is compatible with a subcentimetric accuracy, similar to the other monitoring techniques adopted for this project.
10
Figure 10 - Photogrammetric layout for the “A” zone
The aerial triangulation and stereo restitution of the photogrammetric survey will be performed on the digital workstations of the Laboratory of Surveying and Photogrammetry of the DICA, equipped with a stereo view system with passive glasses and the SOCET SET 5.4 software.
7. OTHER SENSORS
In addition to the techniques here described, some stretches of the Amelia walls will be equipped with other sensors such as extensometers, strain gauges, and inclinometers, whose results can be useful compared with those of the Geomatics methodologies.
References
Caspary W. F. (1987). Concepts of network and deformation analysis. Monograph 11, University of New South Wales, Australia.
Dominici D., Radicioni F., Stoppini A., Unguendoli M. (1995). Testing on the redundancy effect in GPS networks: some examples. Proc. of the 1st International Symposium on Deformations in Turkey, Istanbul, September 1994.
Dominici D., Radicioni F., Selli S. (1996). Statistical Analysis of GPS monitoring Network. Proc. of IAG Regional Symposium on deformations and Crustal movement investigations using Geodetic Techniques, Székesfehérvàr, Hungary, August - September 1996.
Grassi S., Radicioni F., Stoppini A. (2003). Monitoraggio tridimensionale in tempo reale delle deformazioni: Prove in condizioni operative su una stazione totale automatica di alta precisione. Proc. of the VII ASITA National Conference, Verona, Italy, October 2003.
Corresponding author contacts Aurelio STOPPINI
[email protected] Università degli Studi di Perugia, DICA – Dipartimento di Ingegneria Civile e Ambientale Via G. Duranti 93 – 06125 Perugia Italy