Embed Size (px)
Citation preview

AN INNOVATIVE DATA TOOLKIT FOR CITY MANAGEMENT

© Cities Alliance, 2017
Rue Royale 94 1000 Brussels Belgium
http://www.citiesalliance.org
[email protected] The material in this publication is copyrighted. Requests for permission to reproduce whole or portions of it should be directed to the Cities Alliance Secretariat at the email address above. Cities Alliance encourages active dissemination of its work. Permission to reproduce will normally be given and - when the reproduction is for non-commercial purposes – without requesting a fee.
Cover photos clockwise from top right:
Jeremy Bean / Slum Dwellers International Cities Alliance Jeremy Bean / Slum Dwellers International Susanna Henderson / Cities Alliance
Technical Coordination and Supervision: Erika Puspa, Cities Alliance Secretariat
Authors: Developed by Development Gateway Inc. and Athena Infonomics
Contributing authors: Athena Infonomics and the International Solutions Group team; and Ed Frank and Bob Buckley
Communication Coordination: Priscilla Ofori-Amanfo, Cities Alliance Secretariat
Layout and Design: Creatrix Design Group

Foreword
In September 2014, the Cities Alliance and the UK’s Department for International Development launched Future Cities Africa, an examination of how African cities and governments could be assisted in responding to the many challenges of rapid urban growth. Over nearly two years, the Cities Alliance undertook an extensive work programme in four countries (Ethiopia, Ghana, Mozambique and Uganda) and twenty-one cities. Collectively, this body of work provides our members and partners with a timely and comprehensive understanding of the scale and essential features of contemporary urbanisation in Africa.
This body of work also provides a very strong spine and focus for the Cities Alliance’s Africa Strategy, which is predicated on the belief that empowered cities - and citizens - can transform Africa.
In all of our work, in all regions, the absence of data in general, and of disaggregated data at the local level has been a constant theme, and concern. This is particularly the case in those cities where urban growth is most rapid, the backlogs are the largest, and the resources are weakest: typically, small and medium cities, which do not receive invitations to smart city conferences, or attract the attention of development partners. In reality, the Mayors
of such cities are driving blind, with little or no useful data to inform their understanding of the city and citizens, nor guide their policies and investments.
Against this background, there was a clear case for sustained and innovative attention to the issue of data. I am delighted that the Cities Alliance is now able to make available this Toolkit for Innovative Data Management, developed by Development Gateway Inc. and Athena Infonomics. We hope it will make a valuable and practical contribution to the larger challenge of helping Mayors and citizens alike to Know Your City, the campaign that has been jointly spearheaded by Slum Dwellers International (SDI) and United Cities and Local Governments of Africa (UCLGA), both Cities Alliance members.
William Cobbett Director, Cities Alliance

ContentsForeword 3
List of key abbreviations and terms 6
Executive summary 7
Getting Started: Background and Overview 8
0.1 Why was this toolkit developed? . . . . . . . . . . .90.2 Overview of the toolkit. . . . . . . . . . . . . . . . .90.3 Understanding urban indicators . . . . . . . . . . 10
Step 1: Assessing Data Maturity 12
1.1 Understanding the requirements to create a functional data ecosystem. . . . . . . . . . . . . . 13
1.2 Components of the framework – a layered approach . . . . . . . . . . . . . . . . . . . . . . . 13
1.3 Working with the toolkit: using the self- assessment tool to score data readiness . . . . . 22
1.4 Understanding the toolkit scores. . . . . . . . . . 27
Step 2: Identifying Data 28
2.1 Building a data structuring framework. . . . . . . 292.2 Understanding the importance
of crosscutting themes. . . . . . . . . . . . . . . . 312.3 Data for integrated urban planning . . . . . . . . 312.4 Mainstreaming gender perspectives
in statistics . . . . . . . . . . . . . . . . . . . . . . . 312.5 A look inside: basic and advanced indicators
for city management . . . . . . . . . . . . . . . . . 322.6 Basic indicators used in this toolkit . . . . . . . . . 33
Step 3: Managing Data 34
3.1 What are the enabling environment considerations? . . . . . . . . . . . . 35
3.2 Best practices and norms for data governance by each city typology . . . . . . . . . 39
3.3 Learning more: how city typologies might differ in their data management . . . . . . . . . . 40
3.4 Effective data governance for different city typologies . . . . . . . . . . . . . . . . . . . . 40
Step 4: An In-Depth Look at Key Enablers for Data Management 44
4.1 Role of information and communication technology (ICT) in data management. . . . . . . 45
4.2 Leveraging the cloud for better data management . . . . . . . . . . . . . . . . . . 49
4.3 A look inside: use cases of ict strategies and deployments by typology . . . . . . . . . . . 51
4.4 Role of process standardization in data management . . . . . . . . . . . . . . . . . . . . . 54
4.5 Role of human capacity in data management . . 574.6 Implications of alternative data governance
models on enablers . . . . . . . . . . . . . . . . . 61
Step 5: Incorporating New and Different Data Types in the Data Ecosystem 62
5.1 Geographic information system (GIS) . . . . . . . 635.2 Crowdsourced Data . . . . . . . . . . . . . . . . . 645.3 How to use decision support tools to analyse
and use data . . . . . . . . . . . . . . . . . . . . . 67
Step 6: How To Use This Toolkit 70
6.1 Implementing the toolkit in your city to bolster the city’s data ecosystem . . . . . . . . 71
6.3 Typology-wise challenges and considerations . . 726.2 Typology-wise considerations. . . . . . . . . . . . 726.4 Suggested implementation timelines . . . . . . . 746.5 Monitoring and evaluation . . . . . . . . . . . . . 746.6 Monitoring system operations . . . . . . . . . . . 756.7 Data collection . . . . . . . . . . . . . . . . . . . . 766.8 Toolkit implementation . . . . . . . . . . . . . . . 776.9 Analysis, use and dissemination . . . . . . . . . . 806.10 Quality control. . . . . . . . . . . . . . . . . . . . 816.11 Planning for rollout . . . . . . . . . . . . . . . . . 82
Annexure 84
Annex 1: Indicator sets . . . . . . . . . . . . . . . . . . 84Annex 2: Key concerns in leveraging the cloud. . . 100Annex 3: Models and resources on standards
for planning . . . . . . . . . . . . . . . . . 103Annex 4: Resources and models for training
and development of human capacity . . . 103Annex 5: Information technology infrastructure
library (ITIL) . . . . . . . . . . . . . . . . . . 104

FiguresFigure 1: Illustration of Data pyramid . . . . . . . . . 10
Figure 2: Schematic of Data Maturity Assessment . . 13
Figure 3: Architecture of Data Maturity Assessment Exercise . . . . . . . . . . . . . 14
Figure 4: Understanding the Data Production Value Chain . . . . . . . . . . . . . . . . . . 19
Figure 5: Schematic of Data Enabler Assessment Exercise . . . . . . . . . . . . . 19
Figure 6: Screenshot of Home Screen . . . . . . . . . 23
Figure 7: Schematic of Data Entry in Input Questionnaire Section . . . . . . . 24
Figure 8: Schematic of Data Quality and Availability Assessment Exercise . . . . . . . . . . . . . 24
Figure 9: Screenshot of Data Quality and Availability Assessment Questionnaire. . . . . . . . . . 24
Figure 10: Screenshot of Data Enabler Assessment Questionnaire. . . . . . . . . . 25
Figure 11: Schematic of Data Enabler Assessment Exercise . . . . . . . . . . . . . 25
Figure 12: Schematic of Structural Assessment Exercise . . . . . . . . . . . . . 25
Figure 13: Screenshot of Structural Assessment Questionnaire . . . . . . . . . . . . . . . . . 26
Figure 14: Components of Dashboard View . . . . . . 26
Figure 15: Screenshot of Dashboard View . . . . . . . 27
Figure 16: Illustration – Approach to Indicator Identification . . . . . . . . . . . . . . . . . . 33
Figure17: Overview of Actions to be Taken Depending on Data Availability . . . . . . . 35
Figure 18: Arriving at Hybrid Data Governance Models . . . . . . . . . . . . . 37
Figure 19: The Path to Data Management Maturity across the four City Typologies . . . . . . . 38
Figure 20: Framework for ICT Pillars for Cities . . . . . 45
Figure 21: Four Components of ICT Architecture . . . 46
Figure 22: Framework to illustrate the Maturity Pathway from Enablers to Decisions . . . . 75
Figure 23: Data Flow across the Monitoring Cycle . . 76
Figure 24: Layers of Analysis Possible with the Monitoring and Evaluation Data. . . . . . . 81
Illustration 1: Mapping of Government Needs to Potential Decision Support Systems . . . 67
TablesTable 1: Criteria for Indicators . . . . . . . . . . . . . . 11
Table 2: Advantages and Disadvantages of each Data Governance Models . . . . . . . . . . . 41
Table 3: Effective Data Governance for Different City Typologies. . . . . . . . . . . . . . . . . . 42
Table 4: The Ideal Data Maturity State for each City Typology Type . . . . . . . . . . . . . . . 43

6
List of key abbreviations and terms ADB Asian Development Bank
AfDB African Development Bank
CSO Civil Society Organization
FCA Future Cities Africa
GCIF Global City Indicators Facility
GIS Geographical Information System
HRM Human Resource Management
ICT Information and Communication Technology
IUWM Integrated Urban Water Management
KPI Key Performance Indicator
MIS Management Information System
NGO Non-Governmental Organization
SDG Sustainable Development Goals
SLA Service Level Agreement

71 African Development Bank. http://www.afdb.org/en/blogs/afdb-championing-inclusive-growth-across-africa/post/urbanization-in- africa-10143/
Executive summarySub-Saharan Africa’s urbanization challenge is complex, all the while changing rapidly. Estimates suggest that at its current rate, sub-Saharan Africa will cease to be predominantly rural by 20301. This rapid urbanization takes place in front of the backdrop of devolution to local government, rapid population growth and increasing threats of shocks to the natural ecosystem in the form of hazards, droughts and slow-onset effects of climate change. These stressors threaten to stretch the capacity and resources of urban governments to provide adequate services, plan growth or even manage their cities.
A well-maintained, expansive and streamlined data ecosystem is of great importance when facing significant, systematic constraints on financial resources and the capacity to address these challenges. It can offset challenges and help anchor governmental policy to data and evidence. Integrated monitoring mechanisms built on indicators tied to strategic goals can help city managers steer policy in the direction that demands attention. A portfolio of evidence-based decision support tools can complement the capacity demands of the policymakers and provide critical support in urban planning and governance. In this context, the Future Cities Africa (FCA) initiative aims to create a data ecosystem spanning the five FCA pillars – economy, environment, citizenship, governance and service delivery – to provide valuable insights for medium and long-term strategic investments, planning, and development, alongside immediate and short-term improvements in operations and management. Furthermore, the FCA initiative seeks to improve cities’ resilience to unfavourable external shocks by helping the cities depend less on external resources and support. This practical and innovative data toolkit is a part of this programme: it was developed to empower local governments to identify, collect, manage, analyse and utilize data so that any local government can understand its city and govern and plan it better.
This data toolkit contributes to the development of data sets through which well-argued and evidenced decisions can be taken regarding urban development planning and decision-making. The availability of proper data at the local level helps city officials contextualize local priorities, costs of different investment strategies and the expected benefits of different investment options. To achieve this, the toolkit first establishes two sets of indicators – basic and advanced – that draw from several existing indicator sets, such as the Global City Indicators Facility, indicators from UN Habitat’s Urban Data and Global Urban Observatory, and the Sustainable Development Goals.
Next step is the presentation of a succinct methodology to evaluate the data maturity of any city ecosystem based on the five FCA themes. This maturity assessment, which is the first of its kind, integrates aspects of data availability, quality and robustness to present a score that cities can track both over time and with relation to their peers based on the strength of their data ecosystems. More specifically, the key enabling blocks for such data are captured so that cities can act on high priority gap areas to improve data maturity. Importantly, these enabling environment gap assessments are customized to the city context, via a structural assessment at the city level based on the level of effective decentralization.
The toolkit leads cities to identify specific action points to improve data maturity, and then it guides cities on the most optimal governance approaches that they can adopt for such transformations. The toolkit explores several approaches (top-down, bottom-up, silo-in and centre-out), along with succinctly explaining the advantages and prerequisites for each of these approaches.
At a more tactical level, the toolkit covers the supporting ecosystem for such data maturity improvements, comprising of technology (information and communication technology), processes (standardization) and people (human resource management) with recommendations for cities, based from typology, to enhance these ecosystem components. To demystify the implementation process and provide relevant working context, each of these sections is accompanied by a number of case studies with references to more detailed material on success stories of similar jurisdictions. In particular, recent innovations in the data management space, such as usage of GIS data, crowdsourced data and cloud-based computing are covered, as well as use cases and key checklists that effectively deploy and use these tools.
The toolkit seeks to incorporate a clear rationale for cities to improve their data ecosystem in order to justify expending resources in an environment of weak capacity and competition for resources. It does this by presenting a portfolio of decision-support tools sourced from FCA’s ongoing initiatives, as well as existing open tools available via various multilateral and bilateral agencies and foundations. Given that the initiation and proof of concept of such data reforms is a critical step, it sets out a sequence of dependencies and good practices for the implementation of the toolkit as broad guidance to city managers. To further illustrate the potential use case of such a toolkit, it presents an Excel-based demonstration platform, which stakeholders can use as a starting point to design and customize front-end and back-end systems for deployment. A comprehensive guide for using this demonstration tool is also provided.
It is important to note that the toolkit does not presuppose any specific ‘theory of change’ – that is, increases in data availability or quality will automatically lead to improvement in service levels or outcomes. Rather, it looks at data as a necessary (if not sufficient) ingredient in tracking progress and seeks to identify the most efficient mechanisms for collecting and managing such data across city typologies and need categories. To the maximum extent possible, the toolkit stays away from advocating any specific platform or standard, focusing instead on the required functionalities from data management platforms and decision tools.
Several aspects of this toolkit – including the indicator sets, evaluation rubric for the assessment of data maturity, parameters for structural assessment, and options for transformation of the data ecosystem – are based on the rapidly changing landscape of data governance models and tools. Because of such, the toolkit is intended to be dynamic. The authors of this publication encourage city governments to deploy the toolkit and share their experiences through commonly used platforms to continuously integrate the collective wisdom generated for better iterations moving forward.

8 An Innovative Data Toolkit for City Management | Step 1: Assessing Data Maturity
GETTING STARTED: BACKGROUND AND OVERVIEW

9
0.1 Why was this toolkit developed?The toolkit was developed as part of the Future Cities Africa (FCA) project, which the U.K. Department for International Development (DfID) and Cities Alliance initiated. The project addresses the complexity and challenges faced by more than 20 African cities in four African countries (Ethiopia, Ghana, Mozambique and Uganda) by developing and creating tools these cities can use to ‘future-proof’ themselves, while building up their resiliency.
The toolkit serves as a practical and innovative guide book for cities to better understand the process of identifying, collecting, managing, analysing and utilizing data, in its various forms to better govern and plan their cities. It is essentially a manual for cities to understand the various facets of effective data-driven planning and as a reference for cities to better recognize how to deal with various challenges with implementing such an approach.
0.2 Overview of the toolkit
0.2.1 What is a data toolkit?A data toolkit is a reference guide for local government officials that compiles together basic data, system, infrastructure, resource and security needs that will help city officials better utilize existing resources, as well work on developing necessary resources to effectively use data-based evidence in city governance and planning. Generally, it contains information on the key data sets, standards and requirements a city needs to address various issues, as well as a process outline for the systems and tools necessary to collect this data.
0.2.2 Who are the target users of the toolkit? Local government officials and policy makers involved in local governance, planning or management are all possible users of the toolkit
0.2.3 What does the toolkit cover?The toolkit covers the full spectrum of knowledge needed to both accurately assess and develop a city’s data system. This includes the following:
• How to assess a city’s data maturity• How to identify data resources and build a data
structuring framework
• How to manage data and assess the enabling environment for a city
• How to understand the role of information and communication technology (ICT) in data management
• How to incorporate innovative data types into a city’s data ecosystem
• How a city can use the toolkit to bolster a city’s data ecosystem
• What a successful toolkit looks like.
0.2.4 How is the toolkit intended to be used?The toolkit is a step-by-step procedural manual, as well as a modular resource for cities, regardless of how developed a city’s data and information and communication technologies systems are. Step 6 discusses in particular the toolkit’s roll-out and implementation process in a city.
0.2.5 What indicators are utilized in the toolkit?The indicators used for city assessment have been compiled from existing sources and customized to the contexts of cities across the Cities Alliance typologies (metropolitan regions, regional capitals, corridor cities and secondary cities). The indicators have been defined based on two principles – minimality (the minimum number of indicators required to assess the performance and health of each of the themes) and ease of comprehension (ability of city governments to understand what is being assessed, how and why). The indicators are split into two groups – basic indicators (about 100) and advanced indicators (about 330). The basic indicators are used for this toolkit, with advanced toolkit presented as an aspirational set that the best performing cities could move towards in the mid- to long-term.
Further, the basic indicators are grouped into five categories – general indicators (21), citizenship and governance (15), economy (17), service delivery (30) and environment (21). Crosscutting aspects, such as gender, have been integrated across indicators to ensure that they are sufficiently granular. The details are presented in the Identifying Data section, with the indicator sets themselves in the Annexure.

10 An Innovative Data Toolkit for City Management | Getting Started: Background and Overview
0.3 Understanding urban indicators
0.3.1 Data for city-level planning and management – An indicator approachIndicators, as presented in the diagram below, create the link between data collection and policy.
0.3.2 Characteristics of an indicatorAn indicator is information that helps to monitor progress and to report on policy objectives. Indicators can be quantitative or qualitative. They should do the following:
• Be easy to monitor and allow credible reporting.• Be reliable enough to trigger more detailed
evaluation and decisions on follow-up when indicating that objectives cannot be met.
• Highlight the most essential aspects of the changes that the programme is aiming to achieve.
• Help to focus monitoring on those aspects of resource consumption, implementation, outputs and results that are most important to follow up.
0.3.3 Identification of indicators – Linked to policy objectivesObjectives should reflect the desired change from the baseline situation. The baseline must be known at the outset and the objectives must be precise enough to allow verification of their achievement. In the case of expenditure programmes, objectives are ideally expressed in terms of expected effect of the programme on the situation it is meant to influence – that is, as a change from the baseline position. This way of expressing objectives helps to link them to the problems to be solved or the needs of the target population.
Various purposes require different levels of precision and specification of objectives. Three types of objectives and indicators can be distinguished2:
• Outcome or impact indicators (general objectives): These are the policy goals of a programme or activity, expressed in terms of its outcome or ultimate impact, and usually measured by global indicators, such as rates of economic growth, unemployment or competitiveness. Defining clear objectives for the outcome or ultimate impact is, therefore, vital for evaluating a programme or activity.
Have normative and policy implications
Indexes
Indicators
Statistics
Data
Combinations of indicators designed to measure the overall health or progress
Raw Data or Information
Organized Data frameworks
2 Adapted from Ex Ante Evaluation: A Practical Guide for Preparing Proposals for Expenditure Programmes, EU, 2001.
FIGURE 1: ILLUSTRATION OF DATA PYRAMID

11
• Results indicators (specific objectives): These are the more immediate or intermediate objectives of a programme or activity, that is, the targets that first need to be reached for the general objectives to be achieved. Specific objectives are expressed in terms of results, that is, the direct and short-term effects of the programme or policy.
• Output indicators (operational objectives): Operational objectives refer to the actual deliverables that the programme or activity is expected to produce for its beneficiaries. Operational objectives are expressed in terms of outputs, that is, products or services generated by the programme.
0.3.4 Determining relevance of indicatorsIndicators should reflect the central aspects of the results or outcomes that are being sought. However, defining the relevant indicators is not enough; mechanisms for collecting data on their values are also needed. Ideally these mechanisms should be in place when implementation starts. One factor in the choice of indicators is the ease with which relevant data can be collected: collecting data on an indicator should not be costlier than the use-value of the information it provides.
TABLE 1: CRITERIA FOR INDICATORS
CRITERIA DESCRIPTION
Relevant Clear link between the indicator and the objective
Easy Low cost of data collection and easy to monitor
Credible Unambiguous + easy interpreted + credible for those reported to
Accepted Endorsed by key stakeholders
Robust Resistant against manipulation by those responsible
Cost-efficient Benefit for monitoring and credibility of reporting outweigh cost of data gathering

12 An Innovative Data Toolkit for City Management | Step 1: Assessing Data Maturity
STEP 1: ASSESSING DATA MATURITY

13
The framework to assess the data ecosystem is intended to provide a mechanism to track and evaluate the data ecosystem of a city government. It is built on the rationale that data quality is an outcome of several dynamic elements. Because of such, understanding the underlying levers is critical importance. The assessment framework looks at elements that influence data quality and availability, as well as the components that form enablers of the data ecosystem.
These available elements and enablers become more important as levers of influence, whose enhancement can provide manifold levels of improvement in data maturity across sectors. An extensive approach is provided in this toolkit with input questionnaires and a scoring schema.
The assessment tools provided here should help a city government track and analyse its maturity in the data ecosystem. This assessment will be complemented by a suite of data management and governance guides to facilitate faster attainment of maturity.
1.1 Understanding the requirements to create a functional data ecosystemOfficial statistics provide an indispensable element in the information system of a democratic society, serving the government and the public with data about the economic, demographic, social and environmental situation. To this end, high-quality data and statistical information are critical in analysis and informed policy decision-making in support of sustainable development, city management, trade and other stated objectives of governance.
1.2 Components of the framework – a layered approachFigure 2 illustrates that the proposed approach for the assessment framework consists of three layers: a Data Quality Assessment layer and an Enabler Assessment
layer, both supported by a Structural Assessment layer. This approach is structured around an evaluation of the present state of the data ecosystem via the Quality Assessment exercise. The Enabler Assessment exercise looks at the systemic characteristics of the ecosystem to provide an explanation for the current state, while the Structural Assessment customizes scores based on prevailing structural factors (nature of government, level of devolution, institutional structure and so on) in the city or country context.
The Data Quality Assessment layer provides one way of developing an objective or at least a transparent view of the quality and availability of data, with questions centred around various parameters of data availability (at what levels, in what formats and so on) and robustness (collection protocols, validation mechanisms and so on inter linkages). The indicator-level assessment can be achieved partly through a review of the existing metadata of indicators and data points collected across the value chain. Specifically, this metadata covers aspects of quality, such as mode of collection, frequency, gender disaggregation, third party validation, openness of availability and formats of availability. Importantly, it also assigns weights to the importance of the various indicators. For comparability across cities, these weights must be identical. However, the weights can be changed to suit the specifics of a situation, when and if the schema is used as a standard against which to measure improvement.
The Enabler Assessment Framework intends to provide an assessment at the system level for the data ecosystem, but it also allows for a granular assessment of urban governance and specific indicators. Theme-level assessments will be carried out with the respective departments or nodal agencies responsible for the respective indicators. The questionnaires are elaborated on in the Scoring Methodology section. Perhaps the central advantage of a market-based economy is that it spontaneously provides the information needed to make decisions about how individuals, firms and governments should allocate resources to improve welfare and take advantage of opportunities. When local governments do not provide information about circumstances and conditions in their specific location, this important dimension of spatial information about a significant share of economic activity is lacking. As a result, it is difficult for firms to decide where to locate or which kinds of infrastructure investments to make in which places.
1 DATA QUALITY ASSESSMENT LAYER (INDICATOR LEVEL)
Input - Responses to each indicator from the indicator set, on the questionnaire template
Output - Theme wise overall data robustness and availability score
2 STRUCTURAL CLASSIFICATION LAYER (CITY LEVEL)
Input - Responses to set of questions to identify the appropriate decentralization cohort
Output - Customized set of questions and weights for the enable layer
3 ENABLER ASSESSMENT LAYER (THEMATIC LEVEL)
Input - Theme level inputs on questions across categories of enablers
Output - Theme wise enabler score, and identification of focus areas customized to context
FIGURE 2: SCHEMATIC OF DATA MATURITY ASSESSMENT

14 An Innovative Data Toolkit for City Management | Step 1: Assessing Data Maturity
FIGURE 3: ARCHITECTURE OF DATA MATURITY ASSESSMENT EXERCISE
Data Quality and Availability Assessment
Structural AssessmentThematic scores of data quality and availability Classification of city
based on level of decentralization Data enabler scores
of city, disaggregated by FCA theme
Data Maturity Assessment
Data Enabler Assessment
1.2.1 Layer 1: Data quality and availability assessment – Overview and scoring schemaObjective: To provide an objective view of the quality and availability of data regarding globally accepted benchmarks.
Application of Framework: The toolkit assumes the basic indicator set (found in the Annexure) for this purpose, but the approach can be easily extended to different indicator sets. This assessment is ‘indicator set’, which keeps the assessment framework flexible and extensible to other indicator sets that the city might choose to adopt in the future (such as Sustainable Development Goals [SDGs]). Alternatively, if the framework is to be used for a type of government – for example, secondary cities – it might be implemented with a different weighting scheme than that used for primary cities or megacities.
Intended Outcomes: This assessment is expected to support resource allocation decisions of both governments and donor agencies. For instance, if an agency is planning an outlay for a particular thematic area, where the data quality and availability have been demonstrated to be limited, this assessment can support decisions to expend more energies on the data improvement process for better value for money and impact assessment of investments. Over the longer term, this can also emerge as an intercity or inter-country comparative assessment on other indicator sets as well (for instance, the SDGs).
A critical first step in understanding the data ecosystem is to form an idea of the current status and quality of the data available. Data quality is explored along these metrics:
1. Mode of Collection
2. Frequency of Collection
3. Granularity and Disaggregation
4. Validation
5. Availability
6. User Satisfaction
7. Accuracy
The questions in the data quality and availability assessment layer are centred on various parameters of data availability (at what levels, in what formats and so on) and robustness (collection protocols, validation mechanisms, inter linkages and so on). The full question set is presented in the Scoring Methodology section.
Mode of Collection
For every indicator, understanding the collection module and its coverage presents valuable information on the comprehensiveness for usage.
Frequency of Collection
Statistics must be collected and disseminated in a timely and punctual manner. The periodicity of collection and release should consider user requirements as much as possible. The periodicity also varies with the kind of indicators under consideration. Ideally, any divergence from the dissemination time schedule should be publicized and explained in advance, as well as indicated with a new release date set.
Granularity and Disaggregation
While aggregated data are the minimum expected standard for several indicators, the availability of disaggregated data – especially along critical variables of age, gender and location – are extremely valuable for public policy discourse, analysis, and city planning. This is an issue of importance to cities in cases where central agencies carry out data collection, but the microdata published cannot be disaggregated into specific cohorts of interest. As is evident, the variables under consideration (age, gender and so) need to also be decided upon in consultation with users, for greater use and relevance.
Validation
Third-party validation exercises for data across the value chain are particularly helpful for statistical units for several reasons. These exercises provide an independent validation of the data assimilated, which increases the confidence of users and policymakers at hand and enhances the reputation of the department. This independent validation also helps benchmark the data collection, management, utilization processes and policies to international or even national norms, enabling coherence and compatibility.

15
Availability
A hallmark of a well-managed and highly useful data management system is to have data that are presented in a clear and understandable form, disseminated in a suitable and convenient manner, and available and accessible on an impartial basis with supporting metadata and guidance. Dissemination services should use modern information and communication technology and, if appropriate, traditional hard copy. Interoperable application programme interfaces (APIs) that can call upon servers directly may secure data access, facilitate data sharing, and simplify complex analysis and search functions. As a good practice, access to microdata can be allowed for research purposes. However, this access should be subject to strict access and usage protocols. Metadata should be documented according to standardized metadata systems.
User Satisfaction
User satisfaction is a critical indicator to estimate the quality, efficacy and reliability of data. Statistics generated must meet the needs of users. Processes must be in place to consult users (different stakeholders), monitor the relevance and practical utility of existing statistics in meeting their needs, and advise on their emerging needs and priorities. Priority needs should be identified and reflected in the work programme. Undertaking user satisfaction surveys periodically and organizing outreach programmes with users can be of great help to streamline systems, especially to identify ways to improve the use-case of non-governmental data.
Accuracy
Statistics must accurately and reliably portray reality. Studies and analyses of revisions should be carried out routinely and used internally to inform statistical processes.
No Question Options Score
1 Are these data available? Yes 1*
No 0*
2 Are these data part of statutory reporting? Yes 10
No 0
3 Are these data part of administrative reporting (part of result framework)?
Yes 5
No 0
4 What is the coverage of collection? 100% 2
Sample 1
5 In case of sample, how is the sampling done? Formula available for sampling 5
Ad hoc 0
6 What is the mode of collection? Automation at supply point 5
Automation at demand point 3
Physical 1
7 What is the frequency of collection? As frequent as benchmark 5
One level lower than benchmark grade 3
Two or more levels lower 1
8 What is the lag between collection and reporting? Under one quarter 5
One quarter – one year 3
Over one year 1
9 Are the data gender disaggregated? Yes/ Not applicable to the data in question 5
No 0
10 Are the data geo-tagged? Yes/ Not applicable to the data in question 2
No 0
SCORING SCHEMA FOR THE DATA QUALITY AND AVAILABILITY ASSESSMENT
For each theme under identified indicators, collect inputs and score them on the following rubric.

16 An Innovative Data Toolkit for City Management | Step 1: Assessing Data Maturity
No Question Options Score
11 Is there any third-party validation of the data generated?
Yes 2
No 0
Sometimes (e.g., by NGOs) 1
12 Are there independent process audits? Yes 2
No 0
13 Is there public access to the results of such audits? Yes 2
No 1
14 What format is the data available in? Editable soft files, online 5
Non-editable (e.g., PDF) soft files, online 4
Editable soft files, CD/DVD 3
Non-editable soft files, CD/DVD 2
Paper 1
15 Who are potential users of these data? Global pull 5
Global on request 3
Local govt. agencies (on portal) 2
Local govt. agencies (on request) 1
Not shared 0
16 Is there a mechanism to capture user satisfaction and impact on target? Population?
Yes 2
No 1
17 Does government make any budgetary allocations on the basis of these data?
Yes 5
No 0
Overall score (Score for Q1 sum of scores for Q2 to Q17)
The above indicator scores will be aggregated by Cities Alliance theme to provide the thematic scores. Cities Alliance will be able to compare their scores on various themes with regional benchmarks (which need to be identified and developed over course of the rollout).
Objective: To customize the scoring schema of the Enabler Assessment for the prevailing structural factors (such as nature of government, level of devolution, institutional structure and so on) in the city and country context. Since structure significantly affects mandate, resourcing, incentives and coordination, it is important that the boundary conditions are considered while evaluating the ecosystem to better capture significant variations in enablers.
Intended Outcomes: Evaluate the relative relevance of stakeholders in view of control of specific enablers, so that the questions and weightages in the enabler assessment layer are accordingly determined.
The structural classification layer focuses on the level of devolution or decentralization, captured through questions around statutory independence, decision-making powers and resource allocation and spending powers at the city level. It is important to note that the structural classification layer is not specific to themes, but more generally applicable at a city level.
The structural assessment classifies a city into one of three levels of decentralization: highly decentralized (Type 1), moderately decentralized (Type 2) and low level of decentralization (Type 3). This gradation into three levels is based on a combined score on multiple factors linked to decentralization (legislative backing, powers and resources available to local government, and ability to veto, among others).
• High Decentralization (Type 1) cities are those where there is a combination of a legislative framework for enhanced devolution, supported by decentralization of resources and decisions to the city level. These cities typically also have incentives aligned locally with the city managers being elected.
• Moderate Decentralization (Type 2) cities have a framework for decentralization and devolution, but typically have limits within which they can exercise these powers. The central government has powers to provide directives to cities when they exceed these limits.
• Low Decentralization (Type 3) cities lack frameworks and legislative sanction for effective decentralization. While certain functions might be devolved, along with resources, they are typically more involved in operations and maintenance, with very limited flexibility to take decisions outside of business as usual.

17
No Theme Question Response Score
1 Government structure Does the country have a federal constitution?
Yes 2
No 0
2 Selection of local executive Are local executives elected locally? Yes 2
No 0
3 Override authority Does the central government have the legal right to override decisions and policies of city government without due process?
No 2
Yes 0
4 Revenue raising authority Does the city have the authority to determine its property taxes and user charges for services (rate, base)?
Yes, fully independent 2
Yes, subject to veto 1
No 0
Is there regional variation in usage of this authority?
Yes 2
No 1
5 Revenue sharing Are the central government revenues regularly and unconditionally devolved?
Yes 2
Conditionally (no flexibility on spending) but regularly
1
Irregularly 0
6 Service delivery – Core infrastructure
What is the level of authority the city government has on provision of core infrastructure (city roads, water, solid and liquid waste management)?
Full authority and autonomy (hiring, pay scales, service model and user charges)
2
Partial authority and autonomy (subject to central approval)
1
Limited authority 0
7 Service delivery – Social infrastructure
What is the level of authority the city government has regarding provision of core infrastructure (education, healthcare and livelihoods)?
Full authority and autonomy (hiring, pay scales, service model and user charges)
2
Partial authority and autonomy (subject to central approval)
1
Limited authority 0
Total Score:Above 12 – High decentralization (Type 1)6 – 12 – Moderate decentralization (Type 2)Below 6 – Low decentralization (Type 3)
SCORING SCHEMA FOR THE STRUCTURAL ASSESSMENT
The rubric for classification of the city by devolution or decentralization type is highlighted below:

18 An Innovative Data Toolkit for City Management | Step 1: Assessing Data Maturity
1.2.3 Layer 3: Ecosystem enabler assessment – Overview and scoring schemaObjective: To provide an explanatory assessment of the key enablers whose absence and lack of maturity explain a deficiency in the overall data quality score. The Enabler Assessment seeks to provide evidence on the systemic factors of the data ecosystem to explain scores on data quality and availability.
Application of Framework: Each enabler group is probed via a set of questions, the responses to which are awarded scores in line with the type of the city (identified through the structural assessment layer). The enabler assessment is done at a thematic level. ‘Government’ systems include a combination of national, provincial and city governments, as is clarified in the scoring rubric provided.
Intended Outcomes: The Enabler Assessment Layer provides a tool to track and analyse the data ecosystem at the local-government level. While the data quality and availability assessment will provide an indication of the robustness of data, it does not explain potential reasons for the low score. At the end of the Enabler Assessment, the city government will be presented with a summary of its key gap areas by theme (across enablers), along with a portfolio of resources that could be used to address these gaps if such a portfolio exists. This is intended to help city governments identify areas for prioritization of resources, which will create the maximum impact on their data ecosystems maturity.
An explanation for gaps on data quality and availability could arise from many sources. Data quality and availability is an outcome that is a function of several dependencies, with the combination function varying across contexts. These dependencies or enablers are categorized into five groups3,4,5,6:
1. Mandate – Covering aspects of legislation, institutional structure and ownership.
2. Resources – Covering technological, financial and human resource allocation, as well as resource availability (including revenue collection).
3. Incentives – Covering alignment of motivations of various actors for timely and accurate dataCoordination and governance – Covering protocols for data and agency management.
4. Non-governmental ecosystem – Covering maturity of the civil society organization (CSO), private and research groups (‘government’ systems include a combination of national, provincial, and city governments).
The Enabler Assessment Layer provides a tool to track and analyse the data ecosystem at the local-government level. It provides a city-level score of the data ecosystem, which is a sum of the scores for each theme of urban governance and city management under consideration. The themes under consideration for this exercise are centred around the FCA pillars of governance, environment, economy, service delivery and citizenship but the framework is agnostic of them. Altogether, the practitioner can select the themes of interest as per their requirement.
The rationale underlying the thematic approach stems from the understanding that data collection exercises, as well as data management and utilization within the government, are the primary responsibilities of individual line ministries. Therefore, departmental practices, norms and dependencies will apply to a large set of variables of interest within the framework. Additionally, certain statistical and data collection exercises may be carried out in coordination with relevant central agencies, particularly the respective national statistical organization or the central arm of the line ministry. In such cases, information for questions on inter-departmental and inter-jurisdictional concerns and coordination are asked and validated separately, via inputs from stakeholder agencies.
The identification of the enablers and their supporting components is built on mapping out dependencies, practices and norms across the value chain: from identification and collection, through management and dissemination, right up to analysis and utilization.
3 Literature reviewed was primarily from UNECE documents on institutional levers for European Statistics, while the normative guidelines were adapted from the UN Statistical Principles document. For data quality management, the EU’s Generic Statistical Business Process Model was a guiding source in identifying quality dependencies in the ecosystem and adapting them for a city and local government context.4 UNECE documents on institutional levers for European Statistics:”How Should a Modern National System of Official Statistics Look?”, Statistical Division of UNECE, 2008. [http://www.unece.org/fileadmin/DAM/stats/documents/applyprinciples.e.pdf]5 Fundamental Principles of Official Statistics (A/RES/68/261 from 29 January 2014)’ [http://unstats.un.org/unsd/dnss/gp/fundprinciples.aspx]6 The Generic Statistical Business Process Model, UNECE. [http://www1.unece.org/stat/platform/display/metis/The+Generic+Statistical+Business+Process+Model]
19
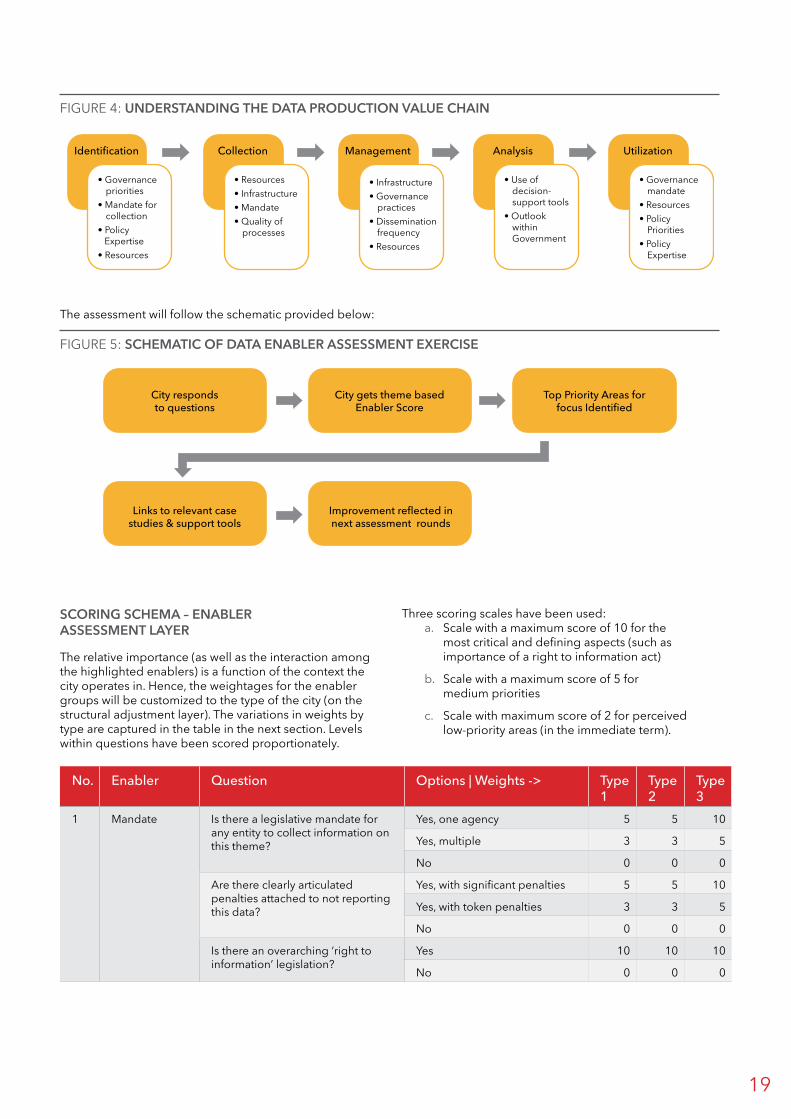
The assessment will follow the schematic provided below:
FIGURE 4: UNDERSTANDING THE DATA PRODUCTION VALUE CHAIN
FIGURE 5: SCHEMATIC OF DATA ENABLER ASSESSMENT EXERCISE
City responds to questions
City gets theme basedEnabler Score
Links to relevant casestudies & support tools
Improvement reflected in next assessment rounds
Top Priority Areas forfocus Identified
• Governance priorities
•�Mandate for collection
• Policy Expertise
• Resources
Identification
• Resources• Infrastructure• Mandate• Quality of
processes
Collection
• Infrastructure• Governance
practices• Dissemination
frequency• Resources
Management
• Use of decision- support tools
• Outlook within Government
Analysis
• Governance mandate
• Resources• Policy
Priorities• Policy
Expertise
Utilization
No Enabler Question Options | Weights -> Type 1
Type 2
Type 3
1 Mandate Is there a legislative mandate for any entity to collect information on this theme?
Yes, one agency 5 5 10
Yes, multiple 3 3 5
No 0 0 0
Are there clearly articulated penalties attached to not reporting this data?
Yes, with significant penalties 5 5 10
Yes, with token penalties 3 3 5
No 0 0 0
Is there an overarching ‘right to information’ legislation?
Yes 10 10 10
No 0 0 0
SCORING SCHEMA – ENABLER ASSESSMENT LAYER
The relative importance (as well as the interaction among the highlighted enablers) is a function of the context the city operates in. Hence, the weightages for the enabler groups will be customized to the type of the city (on the structural adjustment layer). The variations in weights by type are captured in the table in the next section. Levels within questions have been scored proportionately.
Three scoring scales have been used: a. Scale with a maximum score of 10 for the
most critical and defining aspects (such as importance of a right to information act)
b. Scale with a maximum score of 5 for medium priorities
c. Scale with maximum score of 2 for perceived low-priority areas (in the immediate term).

20 An Innovative Data Toolkit for City Management | Step 1: Assessing Data Maturity
No Enabler Question Options | Weights -> Type 1
Type 2
Type 3
2 Resourcing What is the level of digitization of data collection?
Largely digital (more than 50% of indicators in theme)
5 5 5
Largely non-digital (under 50%) 3 3 3
Non-digital (100%) 1 1 1
What is the level of digitization of data storage?
Largely digital (more than 50% of indicators in theme)
5 5 5
Largely non-digital (under 50%) 3 3 3
Non-digital (100%) 1 1 1
What fraction has the overall expenditure on information technology been of total budget (past three-year average)?
More than 10% 5 5 5
5% to 10% 4 4 4
2% to 5% 3 3 3
Under 2% 2 2 2
What is the fraction of data staff available as a % of total positions filled?
More than 10% 5 5 5
5% to 10% 3 3 3
Under 5% 1 1 1
What fraction of responsible staff has undergone specific data relevant training?
Over two-thirds 10 10 10
One-third to two-third 5 5 5
Under one-third 1 1 1
Is a funding stream available in terms of staffing and resources for data management and application systems (statistical analysis, digital mapping, Geographical Information System [GIS] and so on)?
Yes, with funding of ~ 10% or more of city budget
5 5 5
Yes, with funding of 5% - 10% of city budget
3 3 3
Yes, with funding of <5% of city budget
2 2 2
No 0 0 0
3 Incentives and Accountability
Is the reporting agency also responsible for performance on the indicator?
No 10 5 5
Yes 1 1 1
Does data availability and quality figure in the top three priorities of the national leadership?
Yes 5 5 10
No 0 0 0
Does data availability and quality figure in the top three priorities of the city elected representative?
Yes 10 5 5
No 0 0 0
Does data availability and quality figure in the top three priorities of the city manager (responsible for the theme)?
Yes 10 5 5
No 0 0 0
For similar seniority, what is the pay difference between statistical staff and operational staff?
Differential of less than 20% 10 10 10
Differential of 20% to 50% 5 5 5
Differential of over 50% 1 1 1
Is there a regular and structured budget allocation linked to data?
Yes 5 5 5
No 0 0 0
Is the data collected under the theme used to monitor costs?
Yes 10 10 5
No 0 0 0
Is the data collected under the theme used to monitor revenues?
Yes 10 10 5
No 0 0 0
21
No Enabler Question Options | Weights -> Type 1
Type 2
Type 3
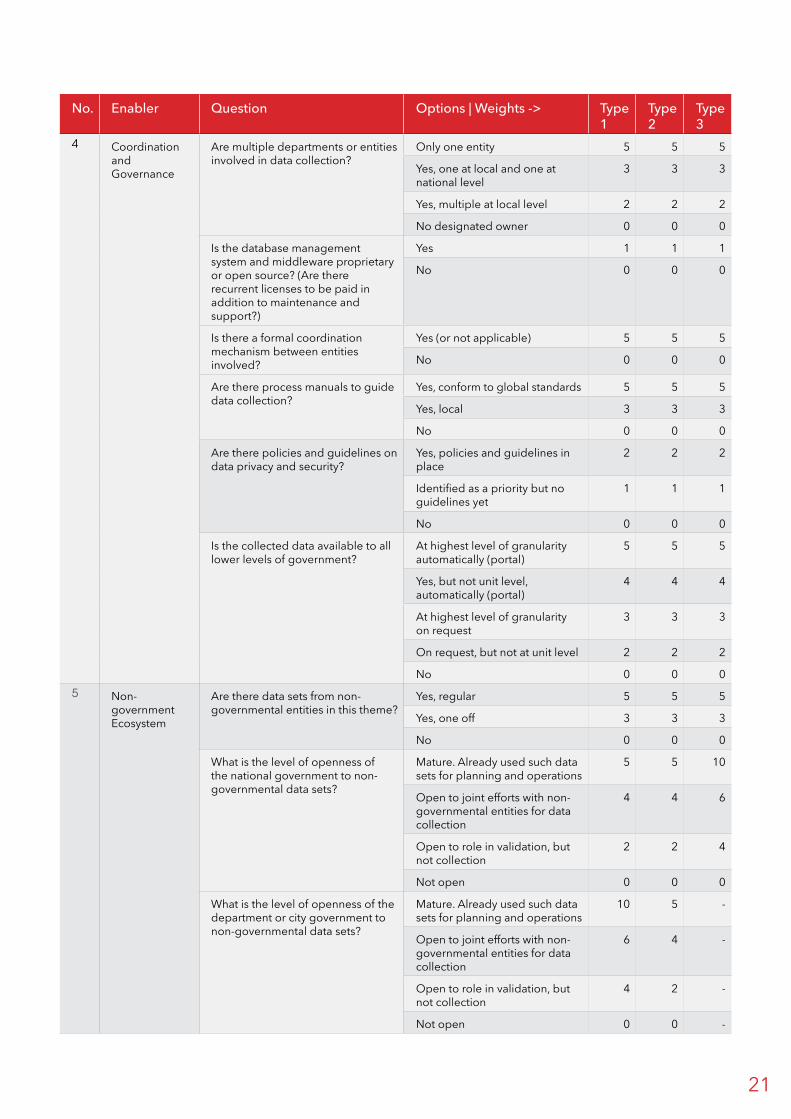
4 Coordination and Governance
Are multiple departments or entities involved in data collection?
Only one entity 5 5 5
Yes, one at local and one at national level
3 3 3
Yes, multiple at local level 2 2 2
No designated owner 0 0 0
Is the database management system and middleware proprietary or open source? (Are there recurrent licenses to be paid in addition to maintenance and support?)
Yes 1 1 1
No 0 0 0
Is there a formal coordination mechanism between entities involved?
Yes (or not applicable) 5 5 5
No 0 0 0
Are there process manuals to guide data collection?
Yes, conform to global standards 5 5 5
Yes, local 3 3 3
No 0 0 0
Are there policies and guidelines on data privacy and security?
Yes, policies and guidelines in place
2 2 2
Identified as a priority but no guidelines yet
1 1 1
No 0 0 0
Is the collected data available to all lower levels of government?
At highest level of granularity automatically (portal)
5 5 5
Yes, but not unit level, automatically (portal)
4 4 4
At highest level of granularity on request
3 3 3
On request, but not at unit level 2 2 2
No 0 0 05 Non-
government Ecosystem
Are there data sets from non-governmental entities in this theme?
Yes, regular 5 5 5
Yes, one off 3 3 3
No 0 0 0
What is the level of openness of the national government to non-governmental data sets?
Mature. Already used such data sets for planning and operations
5 5 10
Open to joint efforts with non-governmental entities for data collection
4 4 6
Open to role in validation, but not collection
2 2 4
Not open 0 0 0
What is the level of openness of the department or city government to non-governmental data sets?
Mature. Already used such data sets for planning and operations
10 5 -
Open to joint efforts with non-governmental entities for data collection
6 4 -
Open to role in validation, but not collection
4 2 -
Not open 0 0 -
22 An Innovative Data Toolkit for City Management | Step 1: Assessing Data Maturity
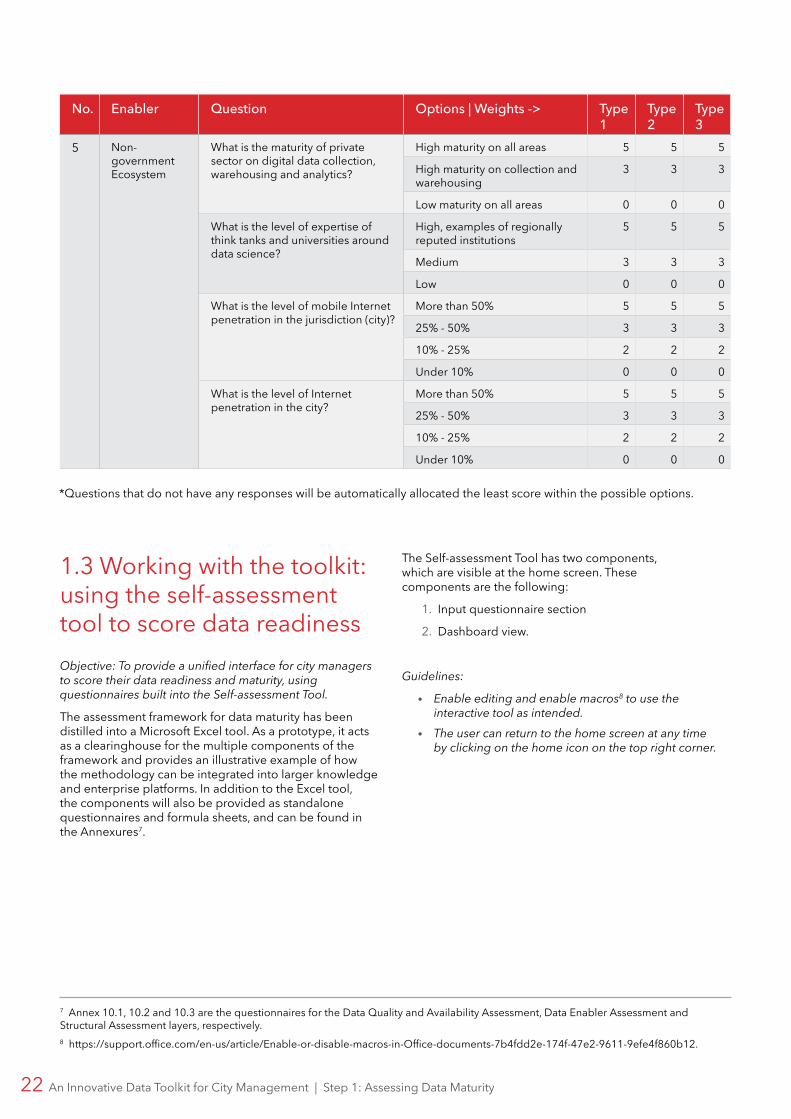
*Questions that do not have any responses will be automatically allocated the least score within the possible options.
1.3 Working with the toolkit: using the self-assessment tool to score data readinessObjective: To provide a unified interface for city managers to score their data readiness and maturity, using questionnaires built into the Self-assessment Tool.
The assessment framework for data maturity has been distilled into a Microsoft Excel tool. As a prototype, it acts as a clearinghouse for the multiple components of the framework and provides an illustrative example of how the methodology can be integrated into larger knowledge and enterprise platforms. In addition to the Excel tool, the components will also be provided as standalone questionnaires and formula sheets, and can be found in the Annexures7.
The Self-assessment Tool has two components, which are visible at the home screen. These components are the following:
1. Input questionnaire section
2. Dashboard view.
Guidelines:
• Enable editing and enable macros8 to use the interactive tool as intended.
• The user can return to the home screen at any time by clicking on the home icon on the top right corner.
7 Annex 10.1, 10.2 and 10.3 are the questionnaires for the Data Quality and Availability Assessment, Data Enabler Assessment and Structural Assessment layers, respectively.8 https://support.office.com/en-us/article/Enable-or-disable-macros-in-Office-documents-7b4fdd2e-174f-47e2-9611-9efe4f860b12.
No Enabler Question Options | Weights -> Type 1
Type 2
Type 3
5 Non-government Ecosystem
What is the maturity of private sector on digital data collection, warehousing and analytics?
High maturity on all areas 5 5 5
High maturity on collection and warehousing
3 3 3
Low maturity on all areas 0 0 0
What is the level of expertise of think tanks and universities around data science?
High, examples of regionally reputed institutions
5 5 5
Medium 3 3 3
Low 0 0 0
What is the level of mobile Internet penetration in the jurisdiction (city)?
More than 50% 5 5 5
25% - 50% 3 3 3
10% - 25% 2 2 2
Under 10% 0 0 0
What is the level of Internet penetration in the city?
More than 50% 5 5 5
25% - 50% 3 3 3
10% - 25% 2 2 2
Under 10% 0 0 0

23
FIGURE 6: SCREENSHOT OF HOME SCREEN
1.3.1 Input QuestionnaireThe Input Questionnaire section has three individual components, each for a different layer of the assessment frame. Boxes in red highlight which tab is currently being viewed.
Guidelines:
• Boxes in red highlight which tab is currently being viewed.
• Responses are saved and catalogued the moment a question is answered. They can be edited at any point in time.
• It is possible to answer questions only for a certain theme to generate a thematic score.
• Scores will be presented in the dashboard view, and can be disaggregated by theme or enabler, if applicable.
• The user can either move to any of the other questionnaires by clicking on the relevant tabs.
• The user can go to the home screen by clicking on the home button on the top-right corner.
1.3.2 Data Quality and Availability Assessment QuestionnaireActivity: Data entry, by theme
Recommended user for entry: To be filled by line departments for appropriate themes
Validation of data: To be validated by city manager’s office.
As the schematic below suggests, responses in the Data Quality Assessment Layer are catalogued by FCA theme. In the toolkit, the basic set of indicators is used, and they have been classified by theme. Indicators are listed on the left-hand side, and questions for each of those indicators are listed from left to right, starting with ‘Is this data available?’. Questions should be answered for each indicator, with the options for each encoded in a dropdown box.

24 An Innovative Data Toolkit for City Management | Step 1: Assessing Data Maturity
FIGURE 7: SCHEMATIC OF DATA ENTRY IN INPUT QUESTIONNAIRE SECTION
FIGURE 9: SCREENSHOT OF DATA QUALITY AND AVAILABILITY ASSESSMENT QUESTIONNAIRE
FIGURE 8: SCHEMATIC OF DATA QUALITY AND AVAILABILITY ASSESSMENT EXERCISE
• Answer questions by FCA theme for each indicator
• Number of Questions: 17• Scores: Numeric• Scores disaggregated by:
Theme
Data Quality and Availability Assessment
Data EnablerAssessment
StructuralAssessment
• Answer questions by FCA theme
• Number of Questions: 29• Scores: Numeric• Scores disaggregated by:
Theme, Enabler
• Single questionnaire unrelated to themes
• Decides weights of DEA scoring schema
• Number of questions: 7 • Scores: High, Medium, Low
Click on ‘Data Quality Assessment’
Select one of five Themes
Answer questions by each indicator
(dropdown boxes)
Find Quality Scores by Theme in
Dashboard view

25
1.3.3 Data Enabler Assessment QuestionnaireActivity: Data entry, by theme
Recommended user for entry: To be filled by line departments for appropriate themes
Validation of data: To be validated by city manager’s office.
The questions in the Data Enabler Assessment Layer are spread across five enablers: Mandate, Resourcing, Incentives & Accountability, Coordination & Data Governance, and Non-Governmental Data Ecosystem. These questions need to be answered for each FCA theme. Questions are listed as multiple-choice questions, with only a single answer possible. The options are listed as radio buttons that need to be clicked.
FIGURE 10: SCREENSHOT OF DATA ENABLER ASSESSMENT QUESTIONNAIRE
FIGURE 11: SCHEMATIC OF DATA ENABLER ASSESSMENT EXERCISE
Click on ‘Data Enabler Assessment’
Select one of five Themes
Answer questions (Radio Buttons)
Find Enabler Scores by Theme in
Dashboard view
FIGURE 12: SCHEMATIC OF STRUCTURAL ASSESSMENT EXERCISE
Click on ‘Structurald Assessment’
Answer questions(radio buttons)
Score determines scoring schema of Data
Enabler Assessment
Result provided in Dashboard View

26 An Innovative Data Toolkit for City Management | Step 1: Assessing Data Maturity
FIGURE 14: COMPONENTS OF DASHBOARD VIEW
FIGURE 13: SCREENSHOT OF STRUCTURAL ASSESSMENT QUESTIONNAIRE
• Basic Information about city• Structural Assement Result
City Profile
• Overall Score• Thematic Score• Interactive
Data Quality & Availability
Assessment Score
• Overall Enabler Scores• Theme-based Enabler Scores• Interactive
Data Enabler Assessment Score
• Curated list of Case Studies highlighted based on selection of theme and enabler
Best Practices, Case Studies
1.3.4 Structural Assessment QuestionnaireActivity: Data entry
Recommended user for entry: To be filled by city manager’s office
Validation of data: To be validated by city manager’s office.
The Structural Assessment Layer is unrelated to themes and determines the scoring schema of the Data Enabler Assessment Layer. It is a single questionnaire, with the questions listed as multiple-choice questions, with only a single answer possible. The options are listed as radio buttons that need to be clicked.
1.3.5 Dashboard ViewAs stated above, the results from the scoring is presented in the dashboard view. The dashboard view section has four individual components, two of which are interactive.
Activity: Data visualization, analysis
Recommended user for access: City manager’s office and heads of line departments
Validation of data: To be validated by city manager’s office
City Profile This section contains basic information on the city. It also presents the result of the Structural Assessment Layer, with cities being classified as ‘high’, ‘medium’ or ‘low,’ based on the level of decentralization.
Data Quality and Availability Assessment ScoreScores of the Data Quality and Availability Assessment are provided here, disaggregated by FCA theme. The scores are averaged by the number of indicators classified under each theme in the questionnaire. The Overall City Score is the sum of the individual thematic scores here.
Interactive feature: Clicking on any tab in this section illustrates the enabler score for selected theme. Clicking on a combination of theme and enabler under the enabler assessment score presents case studies relevant to that combination.
Data Enabler Assessment ScoreScores of the Data Enabler Assessment are provided here, disaggregated by enabler. The scores are summed over individual themes. Selecting an individual theme presents theme-specific enabler scores.
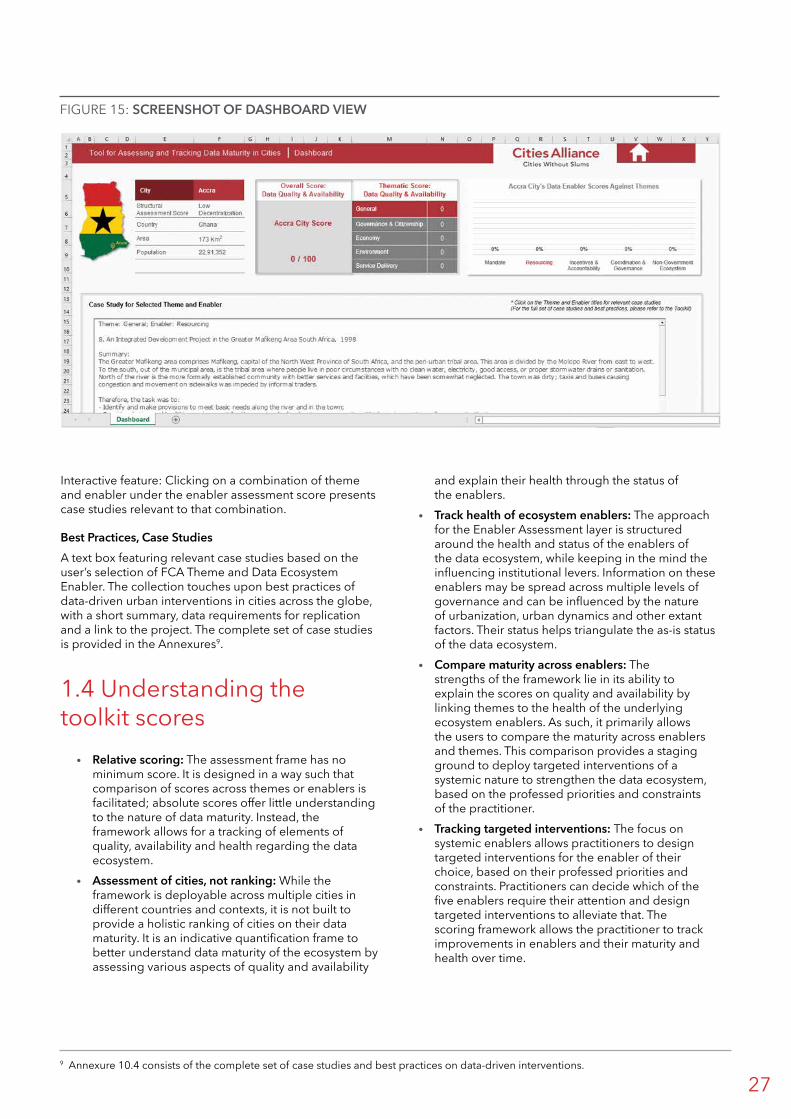
27
FIGURE 15: SCREENSHOT OF DASHBOARD VIEW
Interactive feature: Clicking on a combination of theme and enabler under the enabler assessment score presents case studies relevant to that combination.
Best Practices, Case StudiesA text box featuring relevant case studies based on the user’s selection of FCA Theme and Data Ecosystem Enabler. The collection touches upon best practices of data-driven urban interventions in cities across the globe, with a short summary, data requirements for replication and a link to the project. The complete set of case studies is provided in the Annexures9.
1.4 Understanding the toolkit scores
• Relative scoring: The assessment frame has no minimum score. It is designed in a way such that comparison of scores across themes or enablers is facilitated; absolute scores offer little understanding to the nature of data maturity. Instead, the framework allows for a tracking of elements of quality, availability and health regarding the data ecosystem.
• Assessment of cities, not ranking: While the framework is deployable across multiple cities in different countries and contexts, it is not built to provide a holistic ranking of cities on their data maturity. It is an indicative quantification frame to better understand data maturity of the ecosystem by assessing various aspects of quality and availability
and explain their health through the status of the enablers.
• Track health of ecosystem enablers: The approach for the Enabler Assessment layer is structured around the health and status of the enablers of the data ecosystem, while keeping in the mind the influencing institutional levers. Information on these enablers may be spread across multiple levels of governance and can be influenced by the nature of urbanization, urban dynamics and other extant factors. Their status helps triangulate the as-is status of the data ecosystem.
• Compare maturity across enablers: The strengths of the framework lie in its ability to explain the scores on quality and availability by linking themes to the health of the underlying ecosystem enablers. As such, it primarily allows the users to compare the maturity across enablers and themes. This comparison provides a staging ground to deploy targeted interventions of a systemic nature to strengthen the data ecosystem, based on the professed priorities and constraints of the practitioner.
• Tracking targeted interventions: The focus on systemic enablers allows practitioners to design targeted interventions for the enabler of their choice, based on their professed priorities and constraints. Practitioners can decide which of the five enablers require their attention and design targeted interventions to alleviate that. The scoring framework allows the practitioner to track improvements in enablers and their maturity and health over time.
9 Annexure 10.4 consists of the complete set of case studies and best practices on data-driven interventions.

28 An Innovative Data Toolkit for City Management | Step 2: Identifying Data
STEP 2: IDENTIFYING DATA

29
2.1 Building a data structuring frameworkThe architecture for collection and management of indicators identified in this toolkit is envisaged to revolve around specific decision-support tools that the government may use to assist in the collection, utilization and analysis of the data points required for these tools. The focus on a needs-based approach for the creation of the data ecosystem is primarily to ensure buy-in from local stakeholders about the use and importance of data-driven decision-making. Within the context of urbanization and decentralization, the need for improved capacity at the local level (coupled with improved systems of urban data and indicators) has become essential. As management and control moves to lower levels, it is increasingly more important to monitor performance to ensure directions follow national planning goals and sufficient information is available for local and central planning decisions.
Keeping these elements in mind, the toolkit proposes a framework for structuring data based on key aspects of city management. The framework on data structuring is built around the five FCA Themes, which provide the basis for a theme and index-driven approach. Indicators are categorized around these themes, with an integrated focus on crosscutting issues, including natural resources, vulnerability, hazards and risks, and gender mainstreaming. These city management themes are elaborated below, with a minimal use-case arguing for the benefits of collecting such data. This approach allows for an incremental scale-up in terms of coverage of more advanced indicators, while setting in place standards and protocols for each new indicator added.
City management theme #1: city profilingThe theme of city profiling covers aspects of population, poverty, health, education, safety and other key data categories related to demographics. These indicators cover the citizens’ well-being and quality of life – important aspects to set the city’s governance objectives.
What development is facilitated by collecting such data?
• Priority setting: Having ready access to data on demographic indicators and challenges provides city managers with key inputs on stressed livelihoods and the citizens’ general quality of life. This allows city managers to zone in on key issues and set governance priorities.
• Improved urban planning: Demographic data enable city managers to identify areas of socio-economic distress and activity, and map out the different nodes of activity in the urban environment. The identification of zones of potential and improvement is key to improved urban planning to create plans and blueprints that simultaneously build on the city’s thriving ecosystem and work to improve distressed areas.
• Performance benchmarking: Tracking indicators on these key aspects of demographics helps
benchmark the liveability and quality of life of one city against another. This enables cities to benchmark their performance on stated objectives and goals, and helps managers source interventions and best practices from cities performing better.
• Information on Spatial Dimensions of the Economy: Knowing how population growth, land development, density, growth rate of a city’s footprint, the share of surface area dedicated to road surfaces, wage rates, housing prices and rents, and the shares of informality provide both policy makers and the private sector with essential information about the locations of economic opportunities and problems.
City management theme #2: governance and citizenshipThe FCA Governance and Citizenship theme includes indicators that profile the operations of the local government body as well as the participation of citizens in governance and planning activities. These indicators help managers understand and evaluate the fiscal health and expanse of operations of the city and get a grasp of citizen engagement and participation. In rapidly urbanizing economies, they also send signals to private-sector firms and those seeking better opportunities as to the costs and benefits of various locations.
What development is facilitated by collecting such data?
• Cost-recovery and sustainable provision of services: Understanding the operating expenses for the functioning of the city is vital to preserve its fiscal health and provide critical services. While this is information most city governments usually possess, their importance in determining the credit-worthiness of the city and plans for future expenditure is vital. In the cities of many middle-income countries and virtually all developed countries, this information is key to the city’s ability to borrow to finance many long-term fixed capital investments involved in city growth. In sub-Saharan Africa, where few cities (outside of those in South Africa) have access to finance, basic information is needed about the level and types of government expenditures, the share of local government expenditures allocated to salaries and administrative costs and the share of the population with access to local government services.
• Participatory planning: Actively tracking data on citizen engagement initiatives and participation is key to designing practices and policies and consultation exercises that allow citizens to fully exercise their rights as part of the system. Participatory planning is critical to infrastructure investments designed to meet the needs of the people.
• Transparency and accountability in local decision-making: Availability of information on governance practices and decision-making is vital to ensuring accountability of elected officials and the execution of government duties.

30 An Innovative Data Toolkit for City Management | Step 2: Identifying Data
City management theme #3: economyThe FCA Economy theme includes indicators that capture economic activity and well-being in the city, both in terms of income and investment. The rationale for collecting this data at a city level stems from the idea that cities are primarily potent hubs of economic activity and commerce, as well as the fact that understanding the nature of economic activity in the city is critical to designing policies and plans to ensure healthy activity and investment.
What development is facilitated by collecting such data?
• Poverty alleviation strategies: Mapping out the economic health of the city enables managers to understand stressed areas and demographic groups. These data are critical to creating targeted and evidence-based interventions to alleviate poverty and stimulate socioeconomic development.
• Employment provision: Regular access to unemployment figures can help capture income distress in the city, which in turn has manifold implications on crime, consumption, welfare programmes and so on. Setting up an employment exchange would provide granular data on the skill-set of the populace and help orient the city managers towards attracting investment and well-suited companies into the city. The difference in wages across cities and rural area, difference in living costs (such as rents, transport and education costs) and proxies for diseconomies (such as lack of water and sanitation) are important information to help guide government policies and priorities.
• Pro-poor and gender-sensitive urban planning: City-scale economic vulnerabilities affect the poor, persons with disabilities, youths and women the most. Urban planners and the designers of targeted local welfare programmes need to be aware of these situations. Planning sensitive to varying exposure to vulnerabilities requires specific, targeted data on key economic variables. More generally, urban planning policies have been shown to cause the cost of urban living to increase sharply. Thus, it is important to understand how land-use restrictions – such as setbacks, height restrictions and minimum plot sizes – affect living costs, particularly for the poor who often pay much higher rents because of many of these restrictions.
City management theme #4: environmentThe environment as a theme of city management is critical in times of increasing urbanization and climate change, especially considering the impact the environment has on livelihoods and assumptions of economic growth. This FCA theme includes indicators that capture the health and profile of environmental variables and resources.
What development is facilitated by collecting such data?
• Greening of cities: Balancing the green cover of a city with industrial skyrises is a key aspect to the design and management of sustainable, livable cities. Capturing data that classify the topographic
and ecologically sensitive areas, and designing the city around natural ecosystems, is critical to maintaining a healthy environment for the populace.
• Air and water pollution abatement: With growing urbanization, the stress on water sources increases, and the quality of air suffers. Tracking the quality of key environmental resources, such as water and air, is important in maintaining a livable standard.
• Sustainable energy provision: Meeting the energy requirements of an urbanizing city can be a significant challenge, and insecurity on this front has multiplier effects on every other activity within the city. With the increased push away from fossil fuels, mapping out opportunities for sustainable, renewable sources can simultaneously address the energy needs of the city and act as a revenue source for the local government.
City management theme #5: service deliveryThe FCA theme of Service Delivery is wide-ranging and amorphous, depending on the responsibilities of the city government, but it primarily speaks to critical services and infrastructure needed in the city, including but not restricted to water supply, sanitation, mobility and electricity. Since the nature of these services lend themselves to a natural monopoly – usually carried out by the state – granular information can be obtained on this theme.
What development is facilitated by collecting such data?
• Affordable water and sanitation provision: Mapping out the daily requirements of water and sanitation services across the city is critical for the functioning of the city, and relevant data is key to driving down costs of these services. Information on consumption and waste generation habits of the populace also allows for planners to design systems that optimize the delivery of services.
• Cost recovery of services provision: The natural monopoly that exists in service delivery translates into the state providing these services, primarily without a pr ofit motive. Operating under lean circumstances, while providing a high level of consumer satisfaction, is key for these critical services. A data-driven platform and decision-making calculus are vital to achieving these goals, as is attention to the appropriate level of investment.
• Integrated solid waste management: As cities grow and expand, and the waste generated each day grows by exponential numbers, waste management needs to move past classical landfill options to waste treatment and recovery, as land and energy become defining constraints. An integrated solid waste management plan needs granular, localized information on the demand for such services to better treat the waste generated, while keeping costs low and environmental concerns in place.

31
2.2 Understanding the importance of crosscutting themesThe theme and index driven approach to data structuring adopted here visualizes indicators categorized in individual governance themes. This approach enables a clear delineation of responsibility when it comes to data management and utilization, but it is blind to the challenges posed by crosscutting issues. For example, issues of solid waste management have implications for both service delivery and the environment. Additionally, concepts revolving around the vulnerability of cities and their exposure to hazards and risks are not covered sufficiently in a rigid theme-based approach.
The approach used in the toolkit is to integrate elements into pre-existing indicators listed by theme, which is done to better understand the manifestation of these concepts on each of the indicators and associated issues. This approach ensures that both the analysis and the conclusions or policy recommendations will inevitably contain a crosscutting dimension to it.
2.3 Data for integrated urban planningThe planning of urban settlements means designing multiple systems that make up a city. Integrated urban planning revolves around the idea that a city can be seen and measured in terms of its flows – that is, the flows of energy, water, data and, most important of all, the flows of people. Each of these flows is impacted by urban development: how much of which land uses are placed where, and how they are then connected to each other. Flows impact on other flows; sometimes these impacts are positive, sometimes negative. They have enormous social and economic implications.
Integrated urban planning seeks to leverage advanced tools and data to bestow the ability to better predict the nature of these impacts. This is especially important to avoid the unwanted effects of urban development: congestion, air pollution, social isolation and unsustainable stresses on natural resources. Integrated urban models link the data generated by the multiple flows and reveal the interactions that help architects and urban planners create sustainable plans.
2.4 Mainstreaming gender perspectives in statisticsMainstreaming gender perspectives in statistics implies that all statistics are produced taking in consideration gender roles and gender differences and inequalities in society. All data – both those related to individuals, as well as those not directly related to individuals – should be collected, compiled and analysed taking into account the following:
• Gender-based factors that influence women and men’s roles
• Women and men’s access to resources• The way women and men benefit from access
to resources, facilities and services.
However, sex-disaggregated data are inadequate; it is simply data collected and tabulated separately for women and men. Having data by sex does not guarantee that concepts, definitions and methods used in data production are conceived to reflect gender roles and relations in society. It is, therefore, important to consider whether the types of data collected are adequate in responding to the basic questions that need to be asked about sectors and issues from a gender equality perspective.
Gender mainstreaming in statistics can involve collecting new types of data or expanding data collection in some areas to fill existing knowledge gaps. In addition, gender mainstreaming requires attention to the basic concepts utilized and methods of collection and analysis to ensure that gender-equality issues are being covered adequately. However, all the above changes require greater collaboration between the producers and users of statistics.
Some steps towards gender mainstreaming in this area are outlined below, as recommended by UN Women10:
• Ensure that statistics document women and men’s participation in and contributions to all social and economic areas.
• Consider how the experiences of women and men may vary in different social or economic groups and how these differences might be relevant to statistical analysis. For example, energy statistics often focus on the percentage of households with access to electricity. Given that women often have different energy needs than men, it would be useful to look at energy users by sex and type of use.
• Ensure that the ‘unit of analysis’ adequately represents gender-based differences. For example, agricultural statistics often focus on agricultural machines in use. Given that women farmers often have less access to productive resources than men farmers, it is important to look at holdings by sex of holder, as well as differences and inequalities in access to agricultural machines.
10 Developing Gender Statistics: A Practical Tool’, United Nations Economic Commission for Europe, 2010. http://www.unece.org/fileadmin/DAM/stats/publications/Developing_Gender_Statistics.pdf

32 An Innovative Data Toolkit for City Management | Step 2: Identifying Data
• Ensure that existing concepts, definitions and methods – such as questionnaires and units of operation – used in data collection represent gender-based differences and inequalities.
• Consider and examine underlying causes and consequences in the framework for analysis. Once gender differences and inequalities are documented, it may be useful to attempt a deeper analysis that looks at causes and implications of these differences and inequalities.
• Identify all the information needed to examine gender-based differences.
• Ensure that the results of the analysis are disseminated to all interested users with a clear language that highlights gender-based causes and consequences and their policy implications.
2.5 A look inside: basic and advanced indicators for city managementA layered approach has been adopted for identifying and finalizing indicator frameworks11. A thematic and index driven framework is employed, incorporating FCA’s five themes of citizenship, economy, environment, governance and service delivery. Governance and citizenship have been grouped together under one heading to facilitate ease of data entry and management. Additionally, a group of general indicators have been added to provide for city profiling on main indicators. Together this provides for a set of indicators needed for basic profiling of the city and for purposes of minimal city management.
The basic set of indicators (listed at the end of this section) has been identified, keeping in mind the Sustainable Development Goals (SDG) indicators. Given that SDGs are expected to be rolled out and achieved over the next 15 years (2016 – 2030), this will enable FCA methodologies and toolkits to be compliant with larger global themes and initiatives, while remaining rooted in the cities’ context.
2.5.1 Understanding basic indicatorsThe basic set of indicators will consist of a minimal set, drawn from established sources (for example, World Bank indicators, Asian Development Bank [ADB] city indicators and Global City Indicators Facility [GCIF] indicators). This set will be restricted to around 100 indicators (across the five FCA themes) and will be arrived at through an iterative process of consultations with the country FCA teams, and other FCA partners. This is the set of indicators
needed for basic profiling of the city and for purposes of minimal city management. Ideally, this set will be driven by national legislation and will be common across city typologies.
The indicators highlighted here should provide a base for city governments to build their data ecosystem and infrastructure from; they are a minimal, no-frills set of data points that can be easily captured via data already collected by various state entities operating in the city, or data aggregated by the national statistical organization. This minimal set takes on significance in the context of secondary cities and newly urbanizing towns, helping officials track purely indicative, but important, localized trends in their jurisdiction. The underlying idea is that the collection of these indicators help city officials profile their city from a statistical perspective, appreciate trends and resource requirements of the citizens they serve, and take an active interest in collating these indicators regularly and with great attention.
2.5.2 Understanding advanced indicatorsAdvanced indicators will be the data set needed for main infrastructure investment decisions and planning purposes across a broader portfolio of sectors and services. These targeted decisions and planning activities vary across cities and typologies, depending on local context, national strategy and other external factors. Thus, the advanced indicator set as employed by cities will be need-driven, specific to the typology and its challenges and priorities. The extensibility allows city governments to focus on indicators and architecture of importance to them, allowing for targeted resource expenditure instead of following a standardized set of indicators. Rather than create a new set of standard indicators, the toolkit is a synthesis of existing indicators harnessed for the FCA goal of making cities resilient through evidence-driven improvements.
The decision-making calculus for advanced planning activities and investment decisions requires specific operational data, indicators that are highly time-sensitive to accurately capture trends and generate insights, and greater expertise and resources to collect and analyse. These advanced indicators will also have a greater level of complexity in collection and management (such as system based, sensor collected or GIS data). The proposed framework and the different systems and protocols for the same are explained in later sections.
11 The set of indicators consists of a minimal set, drawn from established sources (for example, World Bank indicators, ADB city indicators and GCIF indicators).
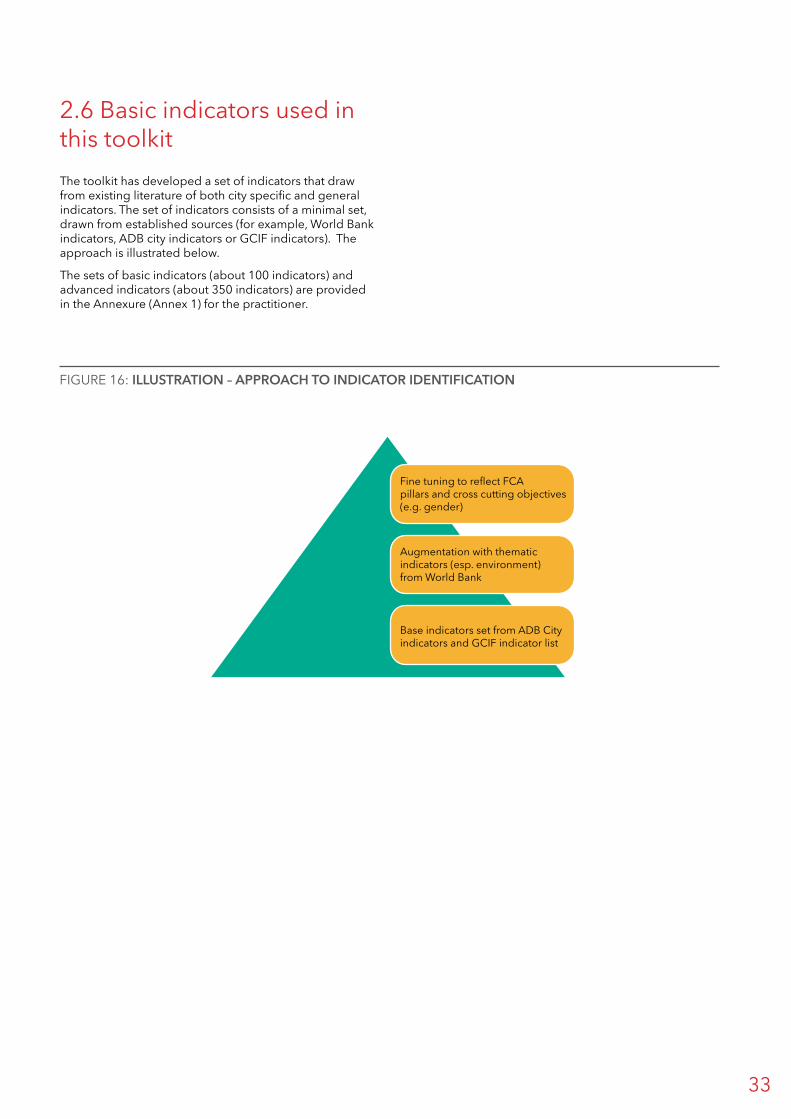
33
2.6 Basic indicators used in this toolkitThe toolkit has developed a set of indicators that draw from existing literature of both city specific and general indicators. The set of indicators consists of a minimal set, drawn from established sources (for example, World Bank indicators, ADB city indicators or GCIF indicators). The approach is illustrated below.
The sets of basic indicators (about 100 indicators) and advanced indicators (about 350 indicators) are provided in the Annexure (Annex 1) for the practitioner.
Fine tuning to reflect FCA pillars and cross cutting objectives (e.g. gender)
Augmentation with thematic indicators (esp. environment) from World Bank
Base indicators set from ADB Cityindicators and GCIF indicator list
FIGURE 16: ILLUSTRATION – APPROACH TO INDICATOR IDENTIFICATION

34 An Innovative Data Toolkit for City Management | Step 3: Managing Data
STEP 3: MANAGING DATA
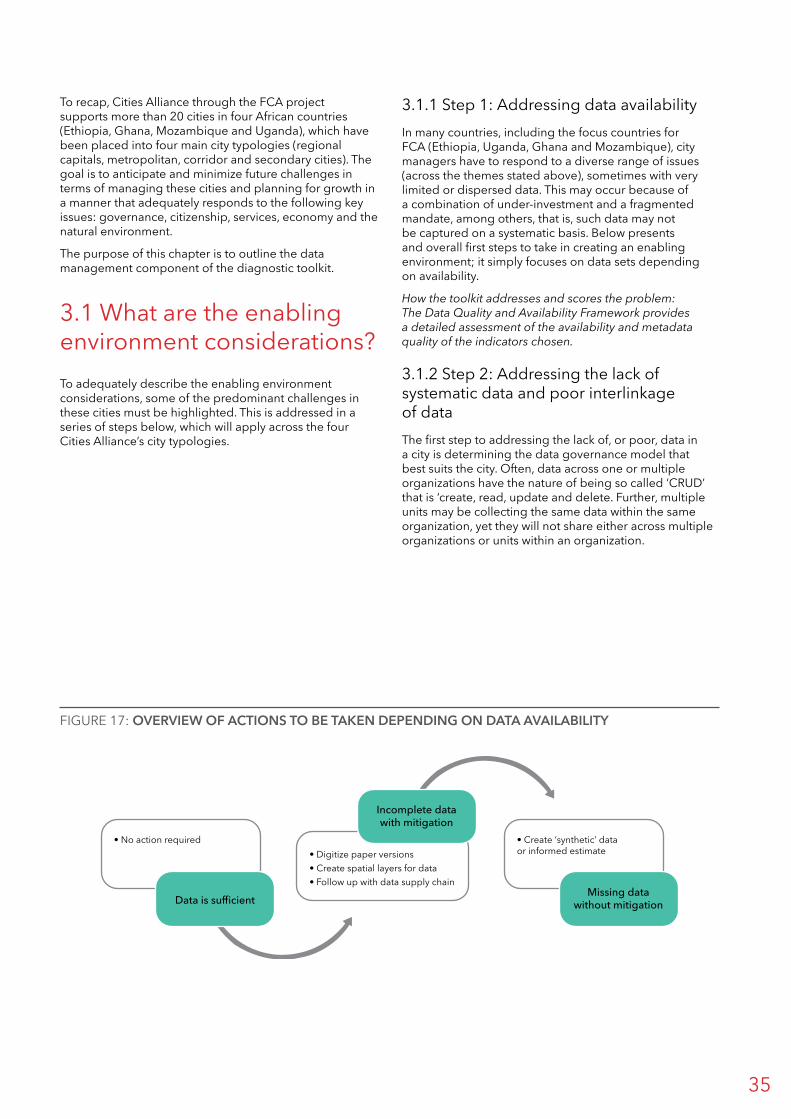
35
To recap, Cities Alliance through the FCA project supports more than 20 cities in four African countries (Ethiopia, Ghana, Mozambique and Uganda), which have been placed into four main city typologies (regional capitals, metropolitan, corridor and secondary cities). The goal is to anticipate and minimize future challenges in terms of managing these cities and planning for growth in a manner that adequately responds to the following key issues: governance, citizenship, services, economy and the natural environment.
The purpose of this chapter is to outline the data management component of the diagnostic toolkit.
3.1 What are the enabling environment considerations?To adequately describe the enabling environment considerations, some of the predominant challenges in these cities must be highlighted. This is addressed in a series of steps below, which will apply across the four Cities Alliance’s city typologies.
3.1.1 Step 1: Addressing data availabilityIn many countries, including the focus countries for FCA (Ethiopia, Uganda, Ghana and Mozambique), city managers have to respond to a diverse range of issues (across the themes stated above), sometimes with very limited or dispersed data. This may occur because of a combination of under-investment and a fragmented mandate, among others, that is, such data may not be captured on a systematic basis. Below presents and overall first steps to take in creating an enabling environment; it simply focuses on data sets depending on availability.
How the toolkit addresses and scores the problem: The Data Quality and Availability Framework provides a detailed assessment of the availability and metadata quality of the indicators chosen.
3.1.2 Step 2: Addressing the lack of systematic data and poor interlinkage of dataThe first step to addressing the lack of, or poor, data in a city is determining the data governance model that best suits the city. Often, data across one or multiple organizations have the nature of being so called ‘CRUD’ that is ‘create, read, update and delete. Further, multiple units may be collecting the same data within the same organization, yet they will not share either across multiple organizations or units within an organization.
• No action required• Digitize paper versions• Create spatial layers for data• Follow up with data supply chain
• Create ‘synthetic’ data or informed estimate
Data is sufficient
Incomplete data with mitigation
Missing data without mitigation
FIGURE 17: OVERVIEW OF ACTIONS TO BE TAKEN DEPENDING ON DATA AVAILABILITY

36 An Innovative Data Toolkit for City Management | Step 3: Managing Data
In this instance, data governance12 is much needed to engage the heads of organization or organization units to overcome these data ‘silos’. It may be tempting to prescribe general mainstream data governance frameworks, such as COBIT513, ISO 9001:201514, DAMA DMBOK15 for master data management, ITIL516 for change and Information Technology services management and operations, Prince217 for project management, SCRUM18 for agile software development, or even more vendor-specific systems such as Oracle Fast track19 for data warehousing development. Nevertheless, in the short to medium term, prescribing such nuanced approaches to data governance in these city typologies may not work since there are multiple stakeholders with complex relationships extending from data generation and ownership. For example, more licensing (data security management) or more hardware (data warehousing and business intelligence management) may be required, but funding may be allocated differently across departments or organizations. Therefore, data governance is the overarching approach that will shape the enterprise-wide philosophy of data acquisition, management and archiving. Thus, a governance programme tries to bring the business and information technology sides of organizations together to define data elements and the rules that govern the data across applications.
The purpose of the governance models outlined is to address the root-cause of challenges and problems (as opposed to the symptoms) of issues. To achieve this, the toolkit has adopted four, higher-level, basic models, which if used effectively (singly or in combination) can address quality and availability of data and its impact on how data management occurs in an organization. These are summarized20:
1. Top-down: The approach is based upon authority patterns. Once decisions are made, they are generally not open to debate, and compliance is not optional – people will do as they are told.
Consequently, if a policy exists, the top leadership must be seen to adhere to the policies set, else the middle management and lower ranks will also disregard laid policies.
2. Bottom-up: This is where employees on a daily basis will be engaged and will make decisions that will filter upward. This is a good way in which certain good practices could become normative because they are iteratively tested and tried over time.
3. Centre-out: This is where some hired experts or centralized resources who will act in the best interest of the activities based on their skills and experience with some degree of independence. The top management may later issue a mandate (that is, make a top-down decision), but before that happens it is the centralized resources that drives the options and considers their impact on stakeholders.
4. Silo-in: This brings together representatives from multiple groups who can craft a common path for action. Thus, multiple perspectives will be explored with an assessment of the impact to various stakeholders. Although the decisions from such a process can take longer to gain credibility, they will often stick because the stakeholders are part of the process.
Each model has its own set of advantages and disadvantages (as discussed in Section 3.2). Of note, however, is that for data management to succeed, a governance approach must be adopted that fits the city typology, and the city management’s. The figure below outlines how the data models relate to each other.
12 Data governance is the exercise of authority, control and shared decision making (planning, monitoring and enforcement) over the management of data assets (Stiglich, P. 2012). Data governance vs data management. (see: http://blogs.perficient.com/healthcare/blog/2012/06/12/data-governance-vs-data-management/) 13 Control Objectives for Information and Related Technology (COBIT) is a framework created by Information Systems Audit and Control Association (ISACA) for information technology (IT) management and IT governance as a broad set of resources, tools and guidance for managers to managers to bridge the gap between control requirements, technical issues and business risks for the entire enterprise. (see: http://www.isaca.org/cobit/pages/default.aspx )14 This is one of the standards in the ISO 9000 family that sets out the requirements of a quality management system; All the requirements of ISO 9001:2015 are generic and are intended to be applicable to any organization, regardless of its type or size, or the products and services it provides. (see: http://www.iso.org/iso/catalogue_detail?csnumber=62085 )15 Ibid.16 Information Technology Infrastructure Library (or ITIL) was commissioned by the Central Computing and Telecommunications Agency (CCTA) in Great Britain due to the lack of quality of the IT services procured by the British Government. The objective is to improve the quality of IT services but decrease the associated costs by using efficient and effective best practices that permeate the entire information technology organization.17 PRINCE2 (PRojects IN Controlled Environments) is a non-proprietary process-based method for effective project management which includes best practices such as: business justification for decisions; clear project governance structures; product based planning and managing projects through controlled phases.18 Scrum is an agile frame work to manage processes in a project, usually software development.19 http://www.oracle.com/us/solutions/045784.pdf 20 Thomas, G. Choosing Governance Models. http://www.datagovernance.com/choosinggovernancemodels/ [Link doesn’t work.]

37
The following are some descriptive notes of Figure 18:
1. Depending on if the data governance rules are important across multiple organizations or organizational units, then it makes sense for them to be mandated from the top-down. When the rules apply primarily to one organizational unit, then a bottom-up model may suffice21. This means that top-down and bottom-up have an ‘either-or’ relationship.
2. When centralized resources from an organization unit or hired consultants drive the options, then a centre-out approach makes most sense. It’s opposed to a silo-in approach that will build consensus around the key issues with all stakeholders before implementation. This means that centre-out and silo-in have an ‘either-or’ relationship.
3. Sometimes a hybrid of these models would work best based on the culture, organization structure and existing decision-making processes, especially when data management decisions occur at multiple hierarchical levels (of power and politics) and across the different public sectors involved in the running of the city. From Figure 18:
a. silo-in and bottom-up: This makes sense if the city seeks implementation to build consensus for a project only applicable to one (or few uncomplicated) organization(s) or organization unit(s), which later makes project implementation smooth.
b. silo-in and top-down: This makes sense if the city seeks implementation to build consensus for a project applicable to multiple organizations or organizational units within a large and complex organization. The top management can decide to support the scaling up of the project across board, for example.
c. centre-out and bottom-up: After the experts have demonstrated capability and capacity to implement through a pilot or proof of concept, the methods are easily assimilated, especially if it is within one organizational unit or for a simple organization structure.
d. centre-out and top-down: After the experts have demonstrated capability and capacity to implement across multiple organizations or organizational units, top management may decide to back the team by providing the mandate to scale.
3.1.3 Step 3: Addressing future poor data updating mechanisms through roles and responsibilitiesThis occurs when little information is systematically captured or there is a prevalent lack of updates due to lack of supporting policies, strategies or plans.
On one hand, one of the key tenets in data governance is that no one individual should claim ownership over data22; rather it is owned by the enterprise’ and not even the silos within the organization(s). On the other hand, ownership must be appropriated to individuals within the organization(s) in order to have accountability – and so some level of authority is normally placed on data owners, who will often be picked from the core business teams (as opposed to from the information technology teams who provide a support role). The data owners will have clearly outlined roles that determine who can access what data, in accordance with security protocols, privacy requirements, compliance management and any other risks to the business.
Moreover, in different city typologies, an ‘enterprise’ data management plan is envisaged and complex data arrangements are inevitable because of the intricacies of multiple agencies integrating their data systems. In these arrangements, it is important to identify champions (called ‘data stewards’) who will be responsible to coordinate the accountability, but the final ownership should attributed to the data source (that is the person or departments collecting the data). The Figure 19 provides a guide on the path to data management.
Silo In
Centre Out
Bottom Up Top Down
A B
C D
FIGURE 18: ARRIVING AT HYBRID DATA GOVERNANCE MODELS
21 Brunelli, M. (2012). IBM users reveal five data governance best practices to remember. http://searchdatamanagement.techtarget.com/news/2240147577/IBM-users-reveal-five-data-governance-best-practices-to-remember 22 Thomas, G. Assigning Data Ownership. http://www.datagovernance.com/assigning-data-ownership/

38 An Innovative Data Toolkit for City Management | Step 3: Managing Data
3.1.4 Step 4: Unavailability of infrastructure, proper technology and skills to manage dataThe needs of an FCA city are complex – not just from one city typology to the next but also across multiple agencies collecting data in this environment. It is probable that the actual information systems upon which the actual data is stored and processed will take the form of web applications (a relational database, middleware and client access via a web browser) – typically hosted in the cloud (to improve the availability, performance and speed, as well as scalability of the applications). Choosing the right tools and approaches to data gathering is crucial.
Here are some of the most critical issues that will heavily impact the ability to digitize, store data and deliver such services in the different city typologies:
1. The state of Internet connectivity
2. Access to, and stability of, electricity
3. Necessary hardware and physical infrastructure and associated costs to access the Internet (by both individuals and institutions)
a. Security layer for data (encryption, authentication and non-repudiation, among other techniques)
b. Hosting services in the cloud versus use of government and other local data centres
c. Maintenance (both physical and service) costs to maintain infrastructure for the information and communication technology (ICT) service catalogue
5. Requisite skills and expertise to manage the data infrastructure technology stack.
a. Drafting of service level agreements
b. Outsourcing ICT service management
It might be tempting to conclude that a regional capital city typology will score well on most of the above issues, at least better than a secondary city typology, for example. But this is not necessarily true, many FCA project cities do experience challenges in one or more of the above issues, irrespective of typology; these are fundamental to providing an enabling environment for the successful data management.
How the toolkit addresses and scores the problem: Resourcing is a key aspect covered under the Enabler Assessment Layer, and these concerns are reflected in the questionnaire.
3.1.5 Data securityThe nature of data security is very important that it warrants a different section to outline some of the main risks. Security is defined as the ability to protect information against unauthorized access and intentional misuse. It includes characteristics such as authentication, authorization, confidentiality, integrity, privacy, non-repudiation and availability. It is, therefore, very important to establish strong data policies and practices that address security and privacy of data – and increasingly with the advent of open data, anonymizing data about individual citizens.
Four key issues provide a good overall understanding of what to overcome to secure data. They focus on who can access data, how to secure data, where it will be stored and how long it should be stored before archiving or even purging23.
1. Access control: This ensures that only the people who really need it have access to the right information at the right time.
2. Encryption: This uses mathematical algorithms and a unique key to convert ‘clear text’ to ‘Cipher text’. Encryption should extend to not just data being transmitted (which is common using technologies, such as Secure Sockets Layer [SSL]24) but also ‘stored’ data in databases, especially very sensitive data. It is important that such information stays
LEVEL 1 LEVEL 2 LEVEL 3 LEVEL 4
•�No clear data ownership• Adhoc data processes• Silo approach to data management
• Proper definitions including roles and responsibilities (data owners and stewards)• Good practices• Development of strategies, plans and processes
• Data practices are repeated with the same level of results.• Data champions from business emerge• ICT now providing a supporting (not lead) role
• Enterprise data governance model adopted• Performance of data owners/stewards can be measured
FIGURE 19: THE PATH TO DATA MANAGEMENT MATURITY ACROSS THE FOUR CITY TYPOLOGIES
23 Guis, I. (2016) The four most important things to know about data governance. http://readwrite.com/2016/05/03/four-important-data-governance-sl2/

39
encrypted no matter how, when and with whom it is shared, and requires a different decryption key only owned by the individual owner to access.
3. Data residency: With the advent of cloud infrastructures, data residency25 is an important consideration, especially for government institutions on what are the implications of hosting citizens’ data with private organizations offering cloud computing services, particularly when privacy and confidentiality might be violated.
4. Data retention: This ensures that policies are in place that can be used to enforce compliance on how long records should be kept, as well as the procedures for purging, destroying and deleting records, whenever they will be deemed to have fallen out of use.
These are all important concepts, which should inform the security awareness approach. Ideally, these risks should be outlined through educating and training all users26 (which includes stakeholders) about risks to data, especially risks to the confidentiality, integrity or availability of data, and about knowing what to do to protect data.
3.2 Best practices and norms for data governance by each city typologyEffective data governance strategy requires careful planning, the right people and appropriate tools and technologies27. This section discusses a set of best practices around data governance to accompany the approach to tools and technologies, which transform data into information that is comprehensive, consistent, correct and current.
1. Buy-in but not commitment: The business needs to do more to create the data definitions, business rules and key performance indicators for a data governance programme. The reality is that often data governance tasks are not prioritized and business managers are not adequately equipped – and so decision support remains a daily firefight28.
2. Think globally and act locally: It is important to phase the data problems in incremental deliverables.
3. Enterprises need to strike the correct balance between being too high level such that the substantive data issues are never really dealt with and getting bogged down by too much detail by attempting to define every data field in every table across the enterprise.
4. A failure to implement will make organizations return to their old habits and data governance loses momentum.
5. Technology is just an enabler: Vendor hype and high price tags raises the expectations that software will do the hard work, but it is the interaction among people, processes, technology and culture that drive the success or failure of data governance.
6. It is vital to build continuous and sustainable systems that survive the long haul by infusing funds and training to the data initiatives and adopting processes that support continuous improvement.
7. Balancing mandate, incentives and good will: While enforcement works at the initial stages to standardize data governance rules, mandate alone will not work. What is needed is an understanding about the role of goodwill and incentives and striking the delicate balance since neither of these can work alone.
8. It is important to use common tools and technologies as much as is possible to ensure the data quality and catalogue remain consistent across departments (in the same organization) or where possible across multiple agencies. This is one of the main reasons why many governments adopt open standards in implementation of information systems – it aids not only in reducing the total cost of ownership but also encourages use and reuse of data elements.
9. Managing organizational change management: Data governance will initiate changes that cause people to be fearful and anxious about their jobs. Such challenges as people, processes and organizational culture issues, and the internal politics resulting from them, need to be tackled.
For further information and specific examples, see the separate case studies document.
24 Secure Sockets Layer (SSL) is a standard security technology for establishing an encrypted link between a server and a client, for example, a web server (website) and a browser; or an email server and an email client (for example, Outlook).25 Similar to data sovereignty, data residency also refers to the legal or regulatory requirements imposed on data based on the country or region in which it resides.26 All users need to understand that they represent the most important part of the security system. One of the greatest threats to information security could actually come from within the organization. Inside ‘attacks’ have been noted to be some of the most dangerous since these people are already quite familiar with the infrastructure. It is not always disgruntled workers or spies who are a threat. Often, it is the non-malicious, uninformed employee who pose the greatest risk. 27 http://searchdatamanagement.techtarget.com/essentialguide/Building-an-effective-data-governance-framework 28 Sherman, R. A must to avoid: Worst practices in enterprise data governance. http://searchdatamanagement.techtarget.com/feature/A-must-to-avoid-Worst-practices-in-enterprise-data-governance

40 An Innovative Data Toolkit for City Management | Step 3: Managing Data
3.3 Learning more: how city typologies might differ in their data managementThis section outlines how various data governance models can apply to different city typologies.
Data governance models and city typologiesThe previous section of the manual has argued that the enabling environment (of which data governance is one such enabler) is agnostic to the city typology. Each data governance model poses its advantages and disadvantages as depicted below.
3.4 Effective data governance for different city typologiesThis section emphasizes that data governance models seek to solve the root-causes for challenges that arise. This is also the most effective way of proposing a model that would typically help city management know which strategies to utilize.
To put this into perspective, the next section provides guidance on how to consider various governance models for different city typologies.
3.4.1 Important data management aspirations as they relate to city typologiesBased on previous FCA work, the following are important dimensions that characterize a city typology29:
1. Degree of automation: To what degree are the processes fully manual, semi-manual, semi-automated, and fully automated, that is, operated by humans or by machinery? This applies to the different FCA cities, depending on if management information systems and the requisite procedures may exist by which to collect results sector data or other.
2. Technological modernity: This refers to whether the process techniques and information and communication technologies in place is the one commonly in place today, or is significantly older or newer.
3. Turnover of production or consumption: This describes the scale of operations as low, medium and high in volume per unit time, and how this scale relates to a city-region.
4. Spatial intensiveness or extensiveness: These are identified as low, medium, and high resource or energy input or output per unit time, describing the spatial effectiveness and resource use efficacy of the site.
29 Koppelaar, R., Kunz, H., Shah, N., and Keirstead, J. (2015). FCA Resilience.IO Platform/Decision-Making Model: Resource Economic Human Ecosystem Model Prototype. Data Specifications. Institute for Integrated Economic Research (IIER).

41
TABLE 2: ADVANTAGES AND DISADVANTAGES OF EACH DATA GOVERNANCE MODELS
Governance Model Advantages Disadvantages
Top-down Applying a top-down approach on a specific information technology environment can reduce the amount of documentation, which makes it much clear to different parts of the organization.
Often organizations are fragmented with numerous coordination points needed. In the city typologies mentioned (and the public sector especially), centralized decision-making may not be supported by multiple units fully during implementation.
Bottom-up There is a big difference between the theory and praxis of implementing data governance. Actually, implementing a new system (in the confines of data governance) affords the opportunity to evaluate the maturity of processes and whether the processes might work in other areas of the organization. A bottom-up approach is the best way to provide such evidence and garner top management support.
It is possible that the strategy may be driven by necessity, rather than need. This may not be a bad thing, but there are higher chances of failure, especially if the bottom-up approach is driven more by availability of existing infrastructure and resources, as opposed to the actual needs of the city. This lack of focus means the data management interventions will not scale to other areas of the organization; and the misfit might require major (and expensive) changes to the organization structure or how data is acquired and managed.
Centre-out Centre-out decisions are made by one or more centralized resources who will consider options and then decide what is bes t for the enterprise. Because they carry skills and experience in the domain and their relative independence, they have to persuade multiple stakeholders and get their views. This results in better-educated stakeholders and better-quality outcomes at the enterprise level.
Admittedly this will be a very slow process to eventually attaining data governance. In fact, until a small core team of stakeholders first meet and deliberately design a framework that suits the organization, its culture, and existing processes; there should be no cross-functional larger meetings. This is because the lack of clarity, lack of expectations, frustration and mistrust will have fewer and fewer people attending meetings until eventually the data initiative ‘fizzles’ away.
Silo in Silo-in decision flow models are effective at making decisions that will be upheld, because they eliminate the arguments that certain stakeholders have been left out and so they will not abide by a process or decision.Also, inherent in a silo-in approach is an acknowledgement that they exist in the organizations and they are formed because at some point they have been healthy.
Silos pose certain business risks – one important one is not being nimble enough to act quickly in response to a changing environment. Breaking down unhealthy organizational silos that have been entrenched (especially in public sector) over many years can be very challenging to change.
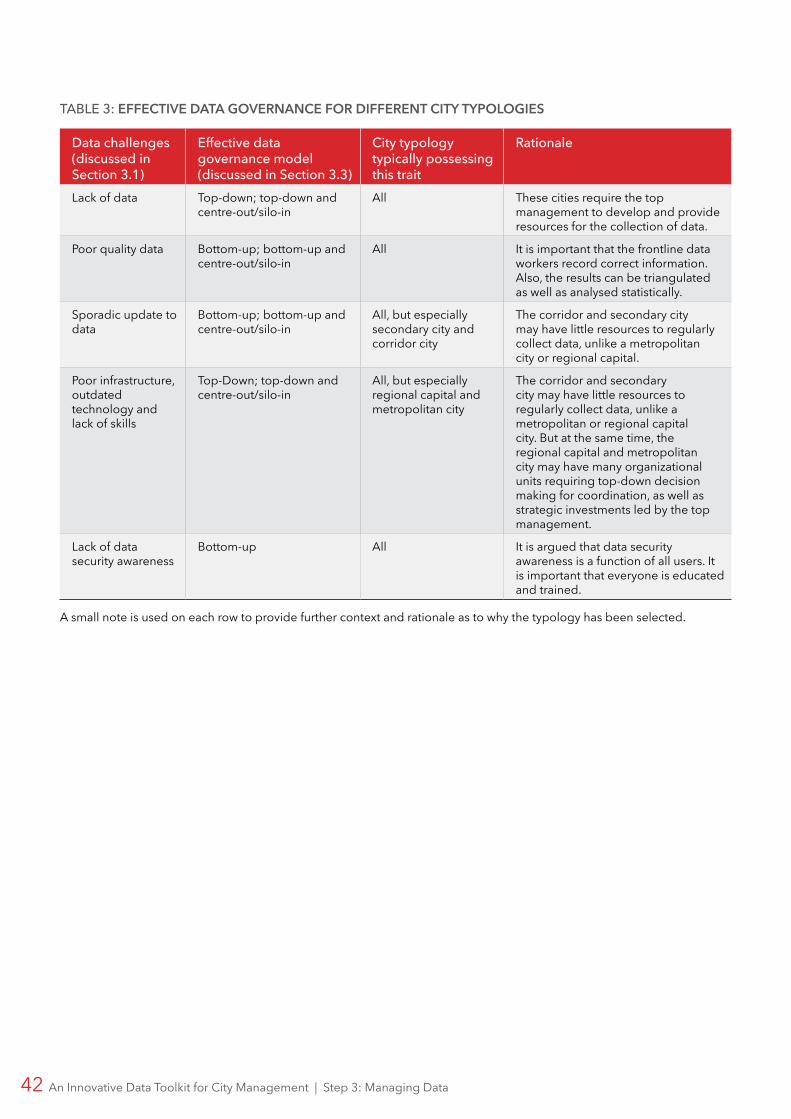
42 An Innovative Data Toolkit for City Management | Step 3: Managing Data
TABLE 3: EFFECTIVE DATA GOVERNANCE FOR DIFFERENT CITY TYPOLOGIES
Data challenges (discussed in Section 3 1)
Effective data governance model (discussed in Section 3 3)
City typology typically possessing this trait
Rationale
Lack of data Top-down; top-down and centre-out/silo-in
All These cities require the top management to develop and provide resources for the collection of data.
Poor quality data Bottom-up; bottom-up and centre-out/silo-in
All It is important that the frontline data workers record correct information. Also, the results can be triangulated as well as analysed statistically.
Sporadic update to data
Bottom-up; bottom-up and centre-out/silo-in
All, but especially secondary city and corridor city
The corridor and secondary city may have little resources to regularly collect data, unlike a metropolitan city or regional capital.
Poor infrastructure, outdated technology and lack of skills
Top-Down; top-down and centre-out/silo-in
All, but especially regional capital and metropolitan city
The corridor and secondary city may have little resources to regularly collect data, unlike a metropolitan or regional capital city. But at the same time, the regional capital and metropolitan city may have many organizational units requiring top-down decision making for coordination, as well as strategic investments led by the top management.
Lack of data security awareness
Bottom-up All It is argued that data security awareness is a function of all users. It is important that everyone is educated and trained.
A small note is used on each row to provide further context and rationale as to why the typology has been selected.

43
At the start of the data maturity process, the city management can use the quadrants above based on typology to define where the city is at in terms of data management and where it would eventually like to be. But there is an important consideration to be made – the high and low sections are not distinct buckets – but rather a continuum where the city begins the path from a baseline to score highly on all the dimensions above (the highlighted cells). Overall, the city management for a regional capital and metropolitan city typologies needs to always strive towards scoring highly on all the four dimensions.
Often because of inadequate resources issues in corridor or secondary cities, it may not be possible to score highly on the degree of automation or technological maturity. However, it is important that these cities improve the level of spatial intensiveness or extensiveness, as well as improving the volume (such as increasing frequency or consistency of data collection) and consumption of data so that there is better data to support decisions.
TABLE 4: THE IDEAL DATA MATURITY STATE FOR EACH CITY TYPOLOGY TYPE
DEGREE OF AUTOMATION TECHNOLOGICAL MATURITY
HIGH LOW HIGH LOW
HIGH Regional CapitalMetropolitan
SecondaryCorridor
Regional CapitalMetropolitan
SecondaryCorridor
LOW
HIGH Regional CapitalMetropolitan
SecondaryCorridor
Regional CapitalMetropolitan
SecondaryCorridor
LOW

44 An Innovative Data Toolkit for City Management | Step 4: An In-Depth Look at Key Enablers for Data Management
STEP 4: AN IN-DEPTH LOOK AT KEY ENABLERS FOR DATA MANAGEMENT

45
4.1 Role of information and communication technology (ICT) in data managementUrban management approaches are becoming more strategic, integrated and participatory. In this context, ICT tools are increasingly being mobilized to better coordinate urbanization, housing, transportation and environmental policies. For example, three-dimensional images help people imagine, design, discuss and manage urban projects that are more in line with sustainable development. Digital tools, such as GIS, are actually becoming information sharing and negotiation tools for development proposals, budgetary allocations and work plans. These tools provide efficient support for new approaches to managing cities that reduce public spending (energy expenditures), optimize the use of transit networks (sustainable mobility) and improve the efficiency of public services for citizens and businesses (through information portals and shifting from paper to digital procedures). Networks of smart sensors and mobile devices (such as cell phones or personal digital assistants [PDAs]) become tools for collecting data on the city30. Once they have been processed using algorithms by a centralized hub, the data are distributed to connected inhabitants.
4.1.1 Overview of options for ICT planning for citiesICT plays a crucial role in each of these. Specifically, in the African context, while some of these aspects might not be immediately applicable (for example, end to end automation of the city, intensive penetration of sensors and other automatic data collection devices), there are many avenues for implementation of low-cost ICT technologies and tools to better collect and analyse data.
Figure 20 presents an aspirational view of the role of ICT in end-to-end city management.
Hence, ICT occupies a central role in the entire data value chain, starting from collection of data across thematic areas, to warehousing, dissemination and analysis for decision making. Setting up and implementing such systems requires careful considerations of the architecture and technological options available, which is summarized in the next few sections.
4.1.2 Key architectural prerequisites for functional information and communications technology systems31
The information system architecture of an organization is a framework for structuring and coordinating the following:
• Subsystems and components of the individual information system applications
• Interaction between different information system applications
• Subsystems and components of the information system infrastructure
• Interaction between the applications and the infrastructure.
For example, information system architecture may define:
• A standard functional structure for the subsystems and components of a certain application type, for example, a statistical survey application
• Standard interfaces for interactions and data exchange between different types of subsystems or components
• Standard interfaces for human interactions with information systems (such as digitization of physical data entry)
30 http://www.libelium.com/libeliumworld/case-studies/ 31 Adapted from UN Statistical Commission and Economic Commission for Europe – Information Systems Architecture for National and International Statistical Offices – Guidelines and Recommendations.32 Adapted from ICT Deployment and strategies for Smart Cities – Ministry of Urban Development, Govt. of India.
Decision Making and Managment
Visualizations, dashboards, integrated
operatons and command & control centre for
tactical decisions
Urban design, planning, simulation
and modeling for strategic decisions
Physical, Social, Economic
and Institutional Infrastructure
Economy, Environment, Service Delivery, Citizenship
and Governance
Sourced from surveys, devices, sensors, modules,
GIS, crowdsource
Hosted in data centres, cloud etc. with layer
of archiving and analytics
Data Capture and Warehousing
Core Services and Infrastructure
FIGURE 20: FRAMEWORK FOR ICT PILLARS FOR CITIES32

46 An Innovative Data Toolkit for City Management | Step 4: An In-Depth Look at Key Enablers for Data Management
• Standard interfaces for interactions and data exchange with external information systems (for instance, interactions with other management information systems or statistical systems)
• Services to be provided by the information system infrastructure
• Standard hardware, software and data components to be used.
Figure 21 shows the four components into the ICT architecture, as illustrated below:
From across the themes (economy, environment, service delivery, citizenship and governance), data from indicators (defined earlier) come into the ICT system. These data are through a combination of primary and secondary sources. For instance, consumption and income data (from national survey rounds or census rounds) could come in as primary data. Data on the same theme from tax payments and city income could be automatic push data from registers. Thus, an ICT platform can be able to receive both push and pull data, across primary and secondary categories. Metadata are clearly identified through the indicators.
ICT ArchitectureComponents
Data Input: From variety of providers (Secondary and primary, push and pull)
Raw Data, Global Metadata including
Registers & Data Warehouse
Final Statistics through survey processing and analytical processing systems
Electronic Documents of various formats
(dashboards, reports etc.) for various users
FIGURE 21: FOUR COMPONENTS OF ICT ARCHITECTURE
TAKEAWAY BOX: POINTERS TO OPERATIONALIZE INFORMATION AND COMMUNICATIONS TECHNOLOGY SYSTEMS FOR DATA MANAGEMENT
No Pointers
1 Data and metadata goes directly into the raw data compartment of the data warehouse.
2 If not already standardized, standardize incoming data and metadata. It is important to note that a standard format must include standards for both data and metadata.
3 Incoming data and metadata are transformed from raw data to final observation registers. During the transformation process, the data and metadata are checked by means of computer-aided and manual procedures; sometimes staff members must contact the data providers.
4 After this, the data and metadata are ‘frozen’, which means that no further updates will be made to this version of the data.
5 The final observation register is created and stored in the final observation compartment of the data warehouse; accompanying metadata are stored together with the observation register, and the global meta database of the data warehouse is updated.
6 From this point on, the observation register is available to the whole organization. Any survey processing system or analytical processing system that needs the data and its accompanying metadata can retrieve them in standard formats from the data warehouse.
7 The final observation register will be processed into final multi-dimensional statistics, which will be made available to users through a variety of dissemination services (printed publications, CD-ROMs, and on-line services, such as the Internet).
8 A final observation register should never be updated. If errors are detected, or if there are some other grounds for changing the contents of a final observation register, a new post-final version of the observation register should be created without deleting the original one.
9 Similarly, if some internal user, for example, an analytical processing system, needs to process data and metadata from a survey before the final observation register is ready, a separate pre-final version of the observation register should be created and stored in the data warehouse.
10 Analytical processing systems may also use some final statistics that have already been produced and stored in the final multi-dimensional statistics compartment, and that is where it will store its own final results, once they have been produced.
11 The analytical processing system will update the global metadata compartment and will produce various end-user outputs, some of which will be stored in the electronic documents compartment of the data warehouse.

47
4.1.3 Key challenges and implementation considerationsWhile the benefits of ICT platforms for both data management and city management are clear, there are many constraints that cities are likely to face. The
following box summarizes typical constraints to effective ICT strategy implementation that African cities are likely to face across the different city typologies. This challenge and mitigation mechanism summary is oriented along the lines of the enablers identified in the framework. The challenges highlighted here are only those which are under the scope of city governments.33
33 For instance, the lack of right to information regulations leads to actual and perceived barriers in information collection and availability, particularly around service delivery and the environment. However, the solution to this challenge is legislative at a national level and can be only minimally influenced by the city itself. The authors of this publication have tried to keep out such challenges, which are to be dealt with separately through advocacy with national governments.
TAKEAWAY BOX: CHALLENGES AND MITIGATION MECHANISMS
No Enabler Category
Applicable City Typologies
Challenge Potential Mitigation Mechanisms
1 Mandate Secondary cities, corridor cities
Despite several agencies in Africa having embarked upon the process of decentralization, clear legislative and regulatory environments, which are key for decentralization, are still being framed in many African countries. This can significantly impede decision making at the city level, resulting in protracted procedures for ICT system procurement and upgrading.
Cloud-based ICT systems present significant advantages in terms of shortening the decision-making cycle, as the enabling framework for ICT procurement is made in the initial contract itself. Renewal and extension of service offerings is streamlined and can be decided at a city level. However, this might require one-time support for initiation from the national government.
2 Mandate All Certain themes (particularly environment) typically fall under the purview of national ministries or departments, which do not have representation at the city level. Hence, ICT platforms for data management and decision making have not existed at city levels. This creates an ‘orphan’ situation where city level ICT is not owned up by either the city government or the national government.
Municipalities and citizens can use decentralized ICT tools, such as mobile phones and digital cameras, to help construct up-to-date databases and city maps depicting all kinds of geographic features, particularly in areas (for example, metropolitan cities) where such mobile penetration is high and there is significant presence of CSOs. There is increasing support for the environment from multilateral and aid agencies, which can be leveraged by city governments actively for both financial and technical assistance.
3 Resources Secondary cities, corridor cities
City governments perceive ICT as a secondary requirement, behind service provision. Given that most city governments have constrained resources for service provision, ICT sometimes takes the back seat.
Use cases of ICT, which demonstrate either a revenue augmentation effect or a cost reduction effect, need to first be targeted to create buy-in from city managers. Typically, GIS and cadastre implementation for property tax augmentation is a strong starting point with significant demonstration potential.

48 An Innovative Data Toolkit for City Management | Step 4: An In-Depth Look at Key Enablers for Data Management
No Enabler Category
Applicable City Typologies
Challenge Potential Mitigation Mechanisms
4 Resources Secondary cities, corridor cities
Poor ICT infrastructure, low ICT penetration levels, diverse demographic and geographic conditions lead to unequal and inadequate access to affordable telephones, computers, Internet and so on required to enable data capture and citizen participation in governance. Also, imported ICT solutions often result in local requirement mismatches or incompatibility with technical systems already in place.
In view of high installation costs and expenses associated with the use of broadband, satellite dishes and so on more affordable alternative technologies (for example, mobile technology, social accountability on mobile phones and so on) could be considered to ensure public access to urban governance. To bridge language, culture and technology divides, local-based development of ICT contents and applications can play a big role. Having a local think tank or academic institution to interface with global service providers can mitigate some localization risks.
5 Incentives All Usually the mandate of data collection is vested with agencies that are responsible for performance on that indicator. This creates misaligned incentives for honest data reporting, and a culture of ‘estimation’ for reporting, rather than reporting actuals. This can also create opposition and push back to transparent ICT driven systems where the scope for data ‘adjustments’ is limited.
ICT interventions in such cases require strong support from the city management, along with a demonstration of how such platforms can make work easier for the staff across departments (for example, time savings). Typically, a set of champions within departments can be identified to advocate such benefits internally.
6 Coordination and Governance
Secondary cities, corridor cities
Most cities do not have strong information technology teams or statistical experts, which results in poor capacity to install as well as operate ICT platforms. Also, given that organization design for statistical agencies is different from that for other departments, this can result in cases where information technology departments are focused more on hardware maintenance than end service levels.
Cloud platforms can potentially provide a replacement for in-house capacity requirements. As these platforms take responsibility for infrastructure (IaaS), platforms (PaaS), and software applications (SaaS), a significant amount of heavy lifting happens outside of the agency. This can be complemented with training for a skeletal set of staff within the city government to interface with the vendor and control the data and analysis.
7 Coordination and Governance
Metropolitan cities, Regional Capitals
Large cities are likely to have already invested in some ICT infrastructure (typically hardware), which could lead to significant legacy issues of coordination and compatibility across various standards and platforms. This can challenge inter-operability, which is a key requirement of effective ICT strategy.
Entry points can be found by identifying individual departments (such as water and sanitation and land records) where ICT gains are significant, to work with legacy systems as appropriate. Success in this can provide use cases for broader transformation of other departments. However, this again requires management support and the presence of champions in the pilot departments.
8 Non-governmental Ecosystem
All While non-governmental players are a valuable addition for data management, city governments typically lack a clear plan to engage with these players productively.
Creation of a clear roadmap for engagement of non-governmental actors across the data management cycle (collection, warehousing, validation, dissemination and analytics).

49
4.2 Leveraging the cloud for better data management
4.2.1 Introduction to cloud computingIn cloud computing, such resources as computing power and infrastructure, application platforms, and business processes are provided through the Internet as general utilities to users in an on-demand fashion. A consumer can access and use these resources and services from anywhere and anytime via an Internet connection. In a cloud computing environment, the traditional role of service provider is divided into three components:
• Infrastructure providers: They manage platforms in the Internet cloud and lease resources according to a usage-based pricing model.
• Service providers who rent resources: The resources come from one or many infrastructure providers to serve the end users.
• Service providers who offer cloud services.
Cloud computing has the advantages of being data intensive, accommodating resource pooling, scalability, rapid elasticity and on demand access.
The three main service models in cloud computing are as follows:
1. Software as a Service (SaaS): A software distribution model through which a consumer can use the provider’s applications (software) running on a cloud infrastructure. The applications are accessible from various client devices, such as a web browser (for example, web-based email).
2. Platform as a Service (PaaS): The service provides the consumer with hardware and software infrastructure to deploy onto the cloud infrastructure using consumer-created or acquired applications and tools supported by the provider.
3. Infrastructure as a Service (IaaS): It provides the consumer with provision processing, storage, networks, and other fundamental computing resources where the consumer can deploy and run one’s own software, which can include operating systems and applications. It provides substantial amount of flexible computing and storage infrastructure through virtualization.
4.2.2 Rationale for cities to adopt cloud computingWhile the private sector has been the larger adopter of cloud-based computing, there is significant scope for the public sector to adopt this technology. In particular, cities across various typologies stand to benefit from ICT-based systems on account of the cost savings (through efficiency enhancement) and the revenue augmentation potential that such data systems provide. However, two key barriers to ICT adoption are cost and technical capacity. However, cloud computing provides an avenue to mitigate both issues.
Cloud computing offers the users economies of scale and efficiency34 that exceed those of a mainframe, coupled with modularity and agility beyond what client and server technology offer. Cloud computing allows core information technology infrastructure to be brought into large data centres that take advantage of significant economies of scale in three areas:
TAKEAWAY BOX: ADVANTAGES AND VALUE PROPOSITION OF CLOUD COMPUTING IN THE PUBLIC SECTOR35
Area of Advantage Comments
Reduction in ICT spending
By adopting cloud computing, government agencies can create a central pool of shared resources – software and infrastructure. The consolidation of resources and the fact that cloud computing is more cost effective, leads to reduction in ICT spending.
Agility Governments operate in strict hierarchies and the process for approvals and purchase orders is a time-consuming activity. Cloud computing provides the capability to eliminate these time-consuming activities and provision resources.
Access to the most up-to-date technology
Cloud computing offers the government the ability to constantly have access to the most updated software and hardware. The onus of upgrading technology is on the service provider.
Elimination of procurement and maintenance
Cloud computing eliminates the need to procure, monitor and maintain IT resources, as this is also the responsibility of the service provider under the delivery model. This reduces the need for IT staff and allows the government to focus on core areas of work.
Universal resource access
Cloud computing is delivered through the Internet, enabling universal access to resources. Further, it helps governments in establishing a common platform for e-Governance initiatives, which can be easily accessed by citizens as well.
34 https://blogs.technet.microsoft.com/microsoft_on_the_issues/2010/11/11/economics-of-the-cloud/35 Frost and Sullivan 2011.

50 An Innovative Data Toolkit for City Management | Step 4: An In-Depth Look at Key Enablers for Data Management
TAKEAWAY BOX: MAPPING OF SERVICE MODELS FROM CLOUD COMPUTING TO CITY TYPOLOGIES
No Model Rationale Metropolitan Regions
Regional Capitals
Secondary Cities
Corridor Cities
1 Software as a Service (SaaS)
Given that metropolitan areas are likely to have already committed infrastructure in place in terms of ICT, specific software for data reporting, dashboards and analytics can be leveraged from the cloud, using the current infrastructure.
High
2 Platform as a Service (PaaS)
In cases where hardware has already been provisioned, but where the platforms are too archaic to run useful analysis (because of software compatibility issues), it might be more useful to adopt a PaaS model.
High
3 Infrastructure as a Service (IaaS)
In cases where there is very little infrastructure in place (such as in secondary and corridor cities which are in the growth phase), as well as where there is also significant challenge in upfront resource mobilization, IaaS services could be a preferred model.
High High
TAKEAWAY BOX: CONCERNS IN CLOUD USAGE AND MITIGATION MEASURES
No Concern Area Notes to City Managers
1 Inter-operability • The city will need to understand how the data can be imported into the service and exported from the service and how the target application environment will be used by the ported application.
• During closure of business, the cloud provider should be obligated to support porting of its customers to another provider.
2 Quality of service • Ensure that availability (down-time), performance (processing power), response time (on demand request response), and charging standards are included explicitly in service level agreements (SLAs).
3 Security • Transactions should follow atomicity, consistency, isolation and durability (ACID) properties to ensure data integrity.
• Setup multi-tier architecture, running on several servers, and increase resilience to hardware and software failures and denial of service attacks, along with setting up an action plan for service continuity and disaster recovery for unplanned emergencies.
• Use of VPN and SSL to secure communications between the client and the server, while using a 3-tier application.
• A privacy steering committee should be created to help make decisions related to data privacy. This is required to address ethical concerns if sensitive or individual citizen data are kept in servers operated by private companies.
• This can be addressed by identifying mission critical subsystems to be hosted internally, as compared to non-critical systems that could be hosted externally.
• Use support services such as the Federal Risk and Authorization Management Program (FEDRAMP)36, that provides a standardized approach to security assessment, authorization, and continuous monitoring for cloud products and services.
36 https://www.fedramp.gov/

51
TAKEAWAY BOX: EXPERIENCES FROM CASE STUDIES IN ICT IMPLEMENTATION
No Reform Aspect Cities Alliance Theme and City Typologies
ICT Advantages Examples
1 Enabling participatory governance
Theme: Citizenship, governance
Typologies: All
• Widespread access to ICT allows citizens to be closer to government by improving citizen engagement and institutional responsiveness.
• -'Connected' citizens provide feedback, register their grievances quicker, improving accountability of government officials as well as service quality
• By maintaining anonymity of users, ICT eliminate entry barriers for all citizens
The city of Tartu, Estonia, has begun an “m-Tartu” programme allowing citizens to simplify and accelerate their interactions with government. For instance, the programme enables people to pay for parking using their mobile phones. A “city phone 1789” service allows citizens to report issues, such as non-working street lamps, broken park benches or pot-holes. Short message service (SMS) alerts are distributed from the police to neighbour-watch teams, bus and taxi drivers.
2 Enhance transparency and reduce corruption
Theme: Citizenship, governance
Typologies: All
• Real-time monitoring of systems and resources makes it easier to expose wrongdoings.
• Simplifies government to citizen and business transactions by eliminating intermediaries.
• Budget monitoring by citizens is critical for enabling citizens hold local governments accountable.
Through the 'BRIS' ICT application implemented in Rajshahi, Bangladesh, the process of granting birth certificates to citizens has been simplified, vastly reducing the scope for corruption and inefficiencies. Also, ICT-enabled incentives motivate citizens to use this service.
37 Drawn from ICT implementation experiences across multiple studies, in particular the World Bank report on Good Governance through ICT – Issues, analysis and strategies (AFTUW).
• Supply-side savings: Large-scale data centres (DCs) offer lower costs per server.
• Demand-side aggregation: Aggregating demand for computing smoothens the overall variability allowing server utilization rates to increase.
• Multi-tenancy efficiency: When changing to a multi-tenant application model, increasing the number of tenants (that is, customers or users) lowers the application management and server cost per tenant.
4.2.3 Key concerns for cities to leverage the cloudWhile cloud technology offers many promises at a city level (in terms of cost savings, lower upfront expenditure and lower requirement of technical capacity), there are specific concerns that cities need to address in their migration to the cloud. The following box summarizes below three classes of such concerns: inter-operability, quality of service, and security. Details are provided in the Annexure.
4.3 A look inside: use cases of ICT strategies and deployments by typology37 Apart from being the overall backbone for data management, ICT has specific applications along each of the Cities Alliance themes of governance and citizenship, economy, environment and service delivery. ICT is a part of an overall thematic strategy, rather than just for data procurement and management. The following box summarize specific examples of ICT implementation, which have created impact in these areas, along with brief examples of implementation experience across the world.

52 An Innovative Data Toolkit for City Management | Step 4: An In-Depth Look at Key Enablers for Data Management
No Reform Aspect Cities Alliance Theme and City Typologies
ICT Advantages Examples
3 Foster local economic development
Theme: Economy
Typologies: Metropolitan regions and regional capitals
• Access to global talent, technology, capital, and knowledge facilitates partnerships between businesses, citizens and municipalities.
• ICT (Broadband connectivity, small and medium enterprises clustering, industry partnerships and so on) helps cities improve competitiveness by increasing overall productivity, supporting trade and making factor markets more efficient.
• Municipality e-services, such as e-Registration, e-Permit and so on, enhance convenience of establishing businesses in cities.
A web-based service provided in London offers city residents a way to receive concise and relevant advertisements for IT, sales and marketing jobs. After a prospective employer enters relevant information at the website, the service broadcasts the advertisement via SMS directly to the mobile phones of subscribers who fit the required profile.
4 Effective revenue collection mechanisms
Themes: Governance, economy
Typologies: All
• Improve and streamline tax collection. Already, Internet-based tax filing systems for both businesses and citizens are widespread.
• Automation makes monitoring of revenue collections easier, improving overall compliance and regulation.
• Registering local businesses and compiling land records using ICT boosts tax and revenue collections, by avoiding avenues for corruption.
The administration of Chandigarh, India, launched project ‘Sampark’ to establish electronic-service providers at various locations. As there are no jurisdiction limitations, the system provided different municipality billing services, such as payment of taxes, payment of water, sewerage, and electricity bills, issue of bus passes and so on under a single roof thereby reducing transaction costs, reducing possibilities for corruption, and saving customer time.
5 Efficient inter-governmental transfers
Theme: Governance
Typologies: Metropolitan regions, regional capitals
• Structured data transmission between organizations by electronic means can reduce turnaround times from bid to allocation, while improving transparency and accountability.
• Intergovernmental transfers done through electronic fund transfer mechanisms improve efficiency and transparency.
In Ulaan Baatar, Mongolia, an e-financials solution connects the Central Treasury with the Central Bank, commercial banks, the capital city treasury and nine districts. A Treasury Single Account (TSA) was created using the system to capture all expenditures and revenues. The Chart of Accounts (COA) was configured to manage 4787 budget entities and 69 multi-funds. This IT solution provides strong budgetary controls at several levels: (1) the budget approved by parliament and allocated to local governments, (2) summary level, (3) item level, and (4) check controls.
6 Extend public and social services
Theme: Governance, service delivery
Typologies: Secondary Cities
• Use of mobile phone-based health applications can improve the access of the urban poor to municipal medical services.
• Access to online and mobile phone banking, registration, municipality permits and so on can help reduce transport costs for the poor.
In Ginnack, Gambia, nurses in municipal clinics for the poor use a digital camera to record patient’s symptoms and then send pictures electronically for diagnosis in a nearby town by more qualified doctors or they send them abroad to get a specialist’s view.

53
No Reform Aspect Cities Alliance Theme and City Typologies
ICT Advantages Examples
7 Below poverty line area development
Themes: Governance, service delivery
Typologies: Metropolitan regions, regional capitals
• Computerized land records can control further mushrooming of slums by classifying city zones.
• ICT can help bring to municipality attention location of leaking pipes, garbage accumulation and so on in slums.
To reclaim land for vitally needed urban infrastructure improvement in Sangli, India, 29 slums were prioritized for relocation. With a view to avoid disruption of employment, health, education and so on access for slum residents, mapping tools recorded current location of slums, analysed city layout and assigned relocation sites, such that new colonies were located only 2 to 3 km from major places of work, hospitals and so on.
8 Disaster management
Themes: Environment
Typologies: High density cities across typologies
• Through constant mapping of natural resources, ICT can be deployed extensively to monitor, predict and respond to environmental disaster.
In the aftermath of the 2010 earthquake in Haiti, NGO ‘Ushahidi’ launched a social accountability-based disaster response system to assist fire, police and medical personnel in coordinating relief efforts. This online tool aggregated information collected from local witnesses, citizens and on-the-spot relief agencies using SMS messages and pinpointed relevant data on interactive maps, saving more than 100 lives.
9 Water and sanitation service management
Themes: Service delivery, environment
Typologies: Metropolitan regions, secondary cities
• ICT can achieve transparent billing and collection procedures that are accurate and thus better accepted by the community. This can also lead to focused cost-recovery strategies for investment purposes.
• Improved water system reliability through ICT-enabled monitoring of safe water supply, illegal connections, enforcement of watershed protection measures and so on can help cities meet the water demands of urban residents.
Madagascar’s Safe Water Project - Care Madagascar - provides analysis of water quality problems and urban community constraints by employing GIS tools to plot bacteriological analysis results (indicating water quality in each location) and the distance between households and sources on a map.
10 Raise awareness level of public hygiene
Themes: Service delivery, environment, governance
Typologies: All
ICT-enabled programmes aimed at changing sanitary and hygiene behaviours, such as hand-washing and proper disposal of waste, can greatly reduce morbidity and mortality rates from hygiene-related diseases, achieving immediate, cost-effective public health impacts.
In 2010, an outbreak of cholera – a water-borne disease – in Haiti triggered fears that the disease will spread to the 1,300 refugee camps in the capital, Port-Au-Prince, where sanitation is poor. To tackle the spread of this epidemic, aid agencies joined forces with mobile-telecom providers to disseminate awareness on clean water and sanitation via text-messaging relevant information and precautionary measures to camp residents.

54 An Innovative Data Toolkit for City Management | Step 4: An In-Depth Look at Key Enablers for Data Management
4.4 Role of process standardization in data management38
Data management covers a range of activities across the data value chain. Given that many of these activities are likely to be repeated on a regular basis, there is scope for standardization of several of these activities through established processes and protocols. Such standardization can improve comparability, reduce dependency on individuals and enhance uniformity. This section summarizes standards and process resources on various aspects of the data management life cycle.
4.4.1 Overview of key components of processes and protocols
Data documentationData documentation explains the following:
• How data were created or digitized• What data mean• What is the content and structure of data • Any data manipulations that may have taken place.
Documenting data should be considered best practice when creating, organizing and managing data and is important for data preservation. Whenever data are used, sufficient contextual information is required to make sense of that data. Good data documentation includes information on the following:
Data formattingThe format and software in which research data are created and digitized usually depend on how research agencies plan to analyse data, the hardware used, the availability of software, or can be determined by discipline-specific standards and customs. All digital information is designed to be interpreted by computer programmes to make it understandable and is – by nature – software dependent. All digital data may be endangered by the obsolescence of the hardware and software environment on which access to data depends.
Despite the backward compatibility of many software packages to import data created in previous software versions and the interoperability between competing popular software programmes, the safest option to guarantee long-term data access is to convert data to standard formats that most software programmes are capable of interpreting and that are suitable for data interchange and transformation. A list of file formats currently recommended by leading organizations for long-term preservation of data is captured below:
38 Adapted from “Managing and Sharing Data – Best Practices for Researchers” – UK Data Archive 2011.
TAKEAWAY BOX: DOCUMENTATION INFORMATION REQUIREMENTS
No Requirements
1 The context of data collection: Project history, aim, objectives and hypotheses for any data capture exercise.
2 Data collection methods: Sampling, data collection process, instruments used, hardware and software used, scale and resolution, temporal and geographic coverage and secondary data sources used.
3 Dataset structure of data files, study cases, and relationships between files.
4 Data validation, checking, proofing, cleaning and quality assurance procedures carried out.
5 Changes made to data over time since their original creation and identification of different versions of data files.
6 Information on access and use conditions or data confidentiality.
TAKEAWAY BOX: DATA AND RECOMMENDED FORMATS
Type of Data Recommended File Formats
Quantitative tabular data with extensive metadata – a dataset with variable labels, code labels and defined missing values, in addition to the matrix of data.
SPSS portable format (.por), delimited text and command (‘setup’) file, (SPSS, Stata, SAS and so on) containing metadata information some structured text or mark-up file containing metadata information, such as DDI XML file.
Quantitative tabular data with minimal metadata –– a matrix of data with or without column headings or variable names, but no other metadata or labelling.
Comma-separated values (CSV) file (.csv), tab-delimited file (.tab), including delimited text of given character set with SQL data definition statements where appropriate.
Geospatial data – vector and raster data
ESRI shapefile (essential: .shp, .shx, .dbf; optional: .prj, .sbx, .sbn), geo-referenced TIFF (.tif, .tfw)CAD data (.dwg), tabular GIS attribute data.
Qualitative data – textual
Extensible Mark-up Language (XML) text according to an appropriate Document Type Definition (DTD) or schema (.xml), Rich Text Format (.rtf), plain text data, ASCII (.txt).
Digital image data TIFF uncompressed (.tif).
Digital audio data Free Lossless Audio Codec (FLAC) (.flac)

55
Well-organized file names and folder structures make it easier to find and keep track of data files. Good file names can provide useful cues to the content and status of a file, can uniquely identify a file and can help in classifying files. File names can contain project acronyms, researchers’ initials, file type information, a version number, file status information and date (for example, WATSAN_WAVE_EF_RawData_V4_Draft_18July2016.xls).
Quality assuranceQuality control of data is an integral part of all research and takes place at various stages: during data collection, data entry or digitization, and data checking. It is important to assign clear roles and responsibilities for data quality assurance at all stages of research and develop suitable procedures.
Version control and authenticityA version is where a file is closely related to another file in terms of its content. It is important to ensure that different versions of files, related files held in different locations and information that is cross-referenced between files are all subject to version control. It can be difficult to locate a correct version or to know how versions differ after some time has elapsed. A suitable version control strategy depends on whether files are used by single or multiple users, are in one or multiple locations and whether versions across users or locations need to be synchronized.
Data storageA data storage strategy is important because digital storage media are inherently unreliable, unless they are stored appropriately, and all file formats and physical storage media will ultimately become obsolete. The accessibility of any data depends on the quality of the storage medium and the availability of the relevant data-reading equipment for that medium. Of course, models, such as cloud based storage and computing, come with data backup and storage elements guaranteed from the vendors’ side. However, given that most city governments currently operate with onsite data management systems, some good practices on data storage are recorded to support them before transitioning to the cloud.
TAKEAWAY BOX: QUALITY ASSURANCE MEASURES
No Quality Assurance Measures
1 Calibrating instruments to check the precision, bias or scale of measurement.
2 Taking multiple measurements, observations or samples.
3 Using standardized methods and protocols for capturing observations, alongside recording forms with clear instructions.
4 Utilizing computer assisted software as appropriate.
5 Setting up validation rules and input masks in data entry software.
6 Using controlled vocabularies, code lists and choice lists to minimize manual data entry.
7 Designing a purpose-built database structure to organize data and data files.
8 Double-checking coding of observations or responses and out-of-range values.
9 Verifying random samples of the digital data against the original data.
10 Doing statistical analyses, such as frequencies, means, ranges or clustering, to detect errors and anomalous values.
TAKEAWAY BOX: BEST PRACTICES ON VERSION CONTROL
No Version Control
1 Identify milestone versions to keep.
2 Uniquely identify files using a systematic naming convention (for example, with dates or version numbers).
3 Record relationships between items where needed, such as relationships between code and the data file it is run against, between data file and related documentation or metadata, or between multiple files.
4 Track the location of files, if they are stored in a variety of locations.
5 Regularly synchronize files in different locations. Alternatively, open real time editing platforms, such as Google Docs could be considered.
6 Maintain single master files in a suitable file format to avoid version control problems associated with multiple working versions of files being developed in parallel.
7 Identify a single location for the storage of milestone and master versions.
TAKEAWAY BOX: DATA AND RECOMMENDED FORMATS
Type of Data Recommended File Formats
Digital video data MPEG-4 (.mp4), motion JPEG 2000 (.jp2)
Documentation Rich Text Format (.rtf), PDF/A or PDF (.pdf), OpenDocument Text (.odt).

56 An Innovative Data Toolkit for City Management | Step 4: An In-Depth Look at Key Enablers for Data Management
Data securityPhysical security, network security and security of computer systems and files all need to be considered to ensure security of data and prevent unauthorized access, changes to data, disclosure or destruction of data. Data security arrangements need to be proportionate to the nature of the data and the risks involved. Attention to security is also needed when data are to be destroyed. Data security may be needed to protect intellectual property rights, commercial interests, or to keep personal or sensitive information safe.
4.4.2 Checklist for data managementTAKEAWAY BOX: BEST PRACTICES ON STORAGE
No Best Practices
1 Create regular back-ups to protect against accidental or malicious data loss.
2 Where data contain personal information, care should be taken to only create the minimal number of copies needed.
3 Evaluate whether to back-up files or the entire computer system (complete image).
4 Organize and clearly label all back-up files and media.
5 Critical data files or frequently used ones may be backed up daily using an automated back-up process and are best stored offline.
6 Master copies of critical files should be in open, as opposed to proprietary, formats for long-term validity.
7 Back-up files should be verified and validated regularly, for example, by checking the MD5 checksum value39 (which serves as a digital fingerprint of any file), and other file attributes.
TAKEAWAY BOX: SUMMARY CHECKLIST FOR DATA MANAGEMENT
No Summary
1 Are you using standard and consistent procedures to collect, process, validate and verify data?
2 Are the data self-explanatory in terms of variable names, codes and abbreviations used?
3 Which descriptions and contextual documentation can explain what your data mean, how they were collected and the methods used to create them?
4 How will you label and organize data, records and files?
5 Will you apply consistency in how data are catalogued, transcribed and organized, e.g. standard templates or input forms?
6 Which data formats will you use? Do formats and software enable sharing and long-term validity of data, such as non-proprietary software and software based on open standards?
7 When converting data across formats, do you check that no data or internal metadata have been lost or changed?
8 Are your digital and non-digital data, and any copies, held in a safe and secure location?
9 If data are collected with mobile devices, how will you transfer and store the data?
10 If data are held in various places, how will you keep track of versions?
11 Are your files backed up sufficiently and regularly and are back-ups stored safely?
12 Do you know what the master version of your data files is?
13 Do your data contain confidential or sensitive information? If so, have you discussed data sharing with the respondents from whom you collected the data?
14 Do you need to anonymize data, for example, to remove identifying information or personal data? During research or in preparation for sharing?
15 Who has access to which data during and after research? Are access regulations needed?
TAKEAWAY BOX: BEST PRACTICES ON VERSION CONTROL
No Best Practices
1 Controlling access to rooms and buildings where data, computers or media are held.
2 Logging the removal of, and access to, media or hardcopy material in store rooms.
3 Transporting sensitive data only under exceptional circumstances.
4 Not storing confidential data, such as those containing personal information on servers or computers connected to an external network, particularly servers that host Internet services.
5 Setting up firewall protection and security-related upgrades and patches to operating systems to avoid viruses and malicious code.
39 https://en.wikipedia.org/wiki/Md5sum

57
4.5 Role of human capacity in data management
4.5.1 Overview of options for data-centred human capacity at the city-levelNational and regional statistical offices are met with many challenges that will directly or indirectly affect the role and priorities of human resource management and training (HRMT). Some of these include meeting future user demands of statistical products and services, responding to increasing competition from other providers of statistics, dealing with budget restrictions and the need to develop a more efficient organization of work processes, modernizing statistical production and services, managing the transition from production to knowledge working and attracting the right candidates.
To respond to these challenges, human resource management (HRM) strategies need to be modified appropriately. From basic HRM, which principally involves recruitment and terms of service definition (which is the case for most city-based human resources functions), cities might need to adopt more proactive and strategic HRM practices, which focus on continuous improvement and engagement with employees.
In the context of city statistical offices, many additional challenges impede HRM maturity, in contrast to national statistical offices. These constraints include the following:
• Nonstandard devolution of statistical functions across countries. There are also cases where the resources at a city level might be recruited by and paid by a higher level of government.40
• Lack of dedicated resources (usually city statistical offices are extensions of national statistical agencies, tasked with a narrow set of survey or census activities, creating a disconnect from city needs).
• Recruitment through siloed processes (resulting in minimal interactions between statistics cell and line departments).
• Narrow training for statistical officers (focused more on sampling, rather than interpretation and analysis).
• Limited career mobility (career paths are not as lucrative as for core personnel, resulting in talent flight).
As a result of these constraints, statistical functions are usually subsumed under the core functions of city officials, with a reduction in intensity and quality, moving from a ‘decision support’ perspective to a ‘reporting’ perspective. This creates several issues, starting from incentive misalignments (the officials who oversee delivery of services, for instance, are also responsible for reporting such performance, creating conflict of interest) to greater failure rate of initiatives because of adopting unscientific practices41.
4.5.2 Key prerequisites for strong human capacity
Competency assessmentData management teams are required to have a wide range of skill sets. In contrast to traditional approaches, which looked only at core statistical knowledge (typically around surveys and data collection methodologies), there is increasing consensus that the skills required are much broader.
In a general city context, it is usually difficult to impose new recruitment and ownership structures for employees on the data side (as such decisions are made at higher levels of government). However, irrespective of the recruiting agency, certain common competencies need to be ensured.
The following table illustrates some of the required competencies, along with methods for assessment.
40 This has both advantages and disadvantages. On the positive side, employment by the central government is usually considered advantageous in many African countries, and hence provides a favoured career path. Additionally, it is also possible to cross-pollinate best practices as these employees move between regions and between departments. However, it could lead to assignment and reporting issues, with very limited control available at the city level. 41 In Ghana, city officials who were trying to keep track of service delivery in WATSAN developed a small questionnaire with key indicators and service perceptions. However, the rollout was stymied by poor sample planning and high scope for gaming by investigators.

58 An Innovative Data Toolkit for City Management | Step 4: An In-Depth Look at Key Enablers for Data Management
No Competency Area Specific Competencies Assessment
1 Quantitative Skills Familiarity with sampling techniques Through case studies involving design of surveys and analysis of raw data.Ability to interpolate, extrapolate
Data cleaning and error spotting
2 Qualitative Skills Development of bias free tools Case studies.
Hypotheses formulation
3 Technology Familiarity with data collection tools Certification/ course completion/ training on such tools and platforms.Familiarity with data warehousing platforms
Familiarity with dashboard tools
4 Subject Knowledge Ability to consult primary and secondary resources to identify key sectoral issues and look at data accordingly
Extended task evaluations involving interface with multiple teams over a longer period (weeks).
5 Communication and Presentation
Executive summary of analysis Elevator pitches with decision makers.Develop and present cost–benefit cases
It is important to map existing competence, skills and where additional training is needed. This establishes a baseline of existing competences, making it useful for identifying and prioritizing courses to be given, in addition to potential trainers. A survey mapping the existing competence in the institution may be implemented as part of a baseline study. A questionnaire developed at the Southern Sudan Centre for Census, Surveys and Evaluation (SSCCSE)42 is mapping competence at the level of the individual, for instance, identifying the formal education of the employees, as well as asking them to evaluate their own skills and needs for further training. Evaluation may also be based on the PARIS21 Statistical Capacity Building Indicators.
However, such competencies may not reside entirely within a single agency. In such cases, as in city data management, hybrid approaches of having statistical teams tightly integrated with departments could help. This can enable closer appreciation of both types of skill sets and constraints (sectoral and statistical). The following aspects need to be addressed for such integration to successfully be implemented.
Alignment of career pathsAfrican cities face the challenge of attracting talent to data-intensive functions because of the divergence in career paths between the traditional city government staff and such specialist functions. Usually career growth in such technical functions is not as transparent or well-established as in traditional functions. This creates a risk aversion among talented employees.
This can be addressed in two ways – either through the creation of a dedicated cadre of data officers, who can be embedded within multiple departments, with guaranteed mobility and career advancement; or through the creation
of dedicated statistical offices within city governments. Usually, the first is a better option as it provides economies of scale (for example, a small team of such officers can be placed on deputation for three to four years across various regions and departments). This also enables significant cross-pollination across both regions and departments, with best practices being organically disseminated. It has been proven that embedding people is a more sustainable mechanism of transferring best practices and ensuring consistent uptake when compared to one-off training sessions. However, creation of such a cadre needs to be decided at a national level, preferably through legislation, with buy-in and support from top leadership.
In case exclusive positions for data roles are not possible (as is currently the case in many African cities), cities should, at the least, ensure that career progression is contingent on evidence of data skills at every level. This can be done by integrating Key Performance Indicators (KPIs) pertaining to data management into the job requirements and evaluation criteria. An example is provided below.
Performance managementEmbedding individuals within departments alone is not sufficient to produce results. As long as the job definitions and functional requirements within a team are not aligned, there is likely to be misalignment, leading to lack of cogent results. This usually calls for revising the Key Performance Indicators of the entire team, to ensure that some component of a data management life cycle (collection, warehousing, validation, dissemination and analytics) is embedded into the Key Performance Indicators and performance appraisal systems of all employees. This ensures that sufficient level of support is provided to the statistical teams embedded, along with joint ownership of such ICT and data governance projects.
42 United Nations Economic Commission for Europe – Human Resource Management and Training – Compilation of Best Practices.

59
No Illustrative Performance Indicators for shared staff in city offices who also have a data responsibility
Weightage (Junior Staff)
Weightage (Mid-level Staff)
Weightage (Senior Staff)
1 Functioning within line department roles and responsibilities.
75% 70% 60%
2 Owns up responsibility for creation and updating of data sets (define data sets).
15% - -
3 Responds to 80% or more of data requests within 4 days of receipt of the same.
- -
4 Ensures that the data sets (define data sets) are compliant with internal audit, with error rates of 5% or less during validation.
5% 5%
5 Ensures digitization of the data sets (define data sets) for the legacy period from 2010 – 2015, during this year.
5% 5% 5%
6 Spends at least 50 hours of training on data methods, with a score of at least 60% in internal assessment.
5% 5% -
7 Anchors and executes at least one interdepartmental project involving data sharing and common standards. Project to be rated at least 4/5 by the audit committee.
- 5% 10%
8 Overall department score of at least 3/5 in stress tests pertaining to data breach and loss.
- 5% 5%
9 Uses data generated to drive decisions on at least one functional aspect. Data to decision linkage needs to be substantiated through a clear logic.
- - 10%
10 Ensures compliance of the reporting staff to data KPIs to the level of at least 80%.
- 5% 5%
43 http://www.paris21.org/library/discussion-papers
Some Key Performance Indicators for staff engaged in data functions could include the following:
Training and knowledge managementOnce competency maps of the cities or departments are created with reference to the master competency list, a training and knowledge management plan needs to be created to address gaps. Three styles of training and knowledge management are possible in this context:
• Live subject focused training, consisting of intensive training modules: These are typically delivered over a few days by experts and are usually in the areas of statistics management, data management tools and IT platform selection and deployment. These sessions can be anchored either by experts from the national statistical department or by external trainers identified for this purpose. Ideally, this training would be best provided to a carefully identified set of employees who have high levels of motivation and orientation.
• Remote subject focused training, consisting of e-learning modules and other guides: These are aimed at reinforcement of concepts and can be
follow-on training sessions post-live sessions, as well as basic familiarity development tools for the rest of the department. The advantage of these training formats is that they are highly scalable, relatively low cost and can draw from significant number of resources that are already in the public domain for this43.
• Application focused, decentralized sessions: These consist of demonstrating use cases and pilots where data management methods have been successfully married into line departments, producing demonstrable results. This is an extremely important part of training, as it provides the motivation for pursuing such integration of data management approaches with business as usual. Such sessions are typically anchored by teams that have implemented such pilots and innovations, as the teams provide significantly greater conviction in comparison to impersonal training modules. Conducting such training can be incentivized through monetary and non-monetary rewards.

60 An Innovative Data Toolkit for City Management | Step 4: An In-Depth Look at Key Enablers for Data Management
Supportive organizational structureThe below table provides a snapshot of potential alternatives to carry out the transition to new statistical system configuration, from an organizational structure perspective.
No Head Option 1 Option 2
1 Alternative type Centralized Decentralized
2 Summary Top management organizes a special project, with special resources, for planning and implementing proposed changes all over the organization.
Specific area is taken and dealt with at a local level (such as property tax data reform in City A), with the support of the city management.
3 Organizational prerequisites
Significant amount of buy in from the top management, along with capacity created to ensure coordination for large-scale rollout (similar to top-down approach).
Strong understanding of local context – opportunities and challenges and presence of project champions to anchor (similar to bottom-up or centre-out models).
4 Advantages Provides a complete transformation of the function, with immediately realizable benefits at scale on account of better data.
Provides a lower-cost proof of concept, which can be scaled up later across other jurisdictions.
5 Recommendation Recommended after a decentralized option has created a proof of concept. Organizational capital needs to be invested more on training and standardization at this level.
Recommended option for most African cities. It is important to identify cities or departments with a solid business case for data, along with competent and committed project champions to maximize success.
The Indian Economic Service (IES) is the administrative civil service of the Central Civil Services of the executive branch of the Government of India. Constituted in 1961, the IES aims to institutionalize a core professional capacity within the government to undertake economic analysis and render advice for designing and formulating development policies, strengthening delivery systems, and monitoring and evaluating the public programmes. With the initiation of large-scale economic reforms in 1991 and the proliferation of the regulatory role of the government, such analysis and advice within the domain of the service has increased manifold.
The IES Board chaired by the Cabinet Secretary periodically reviews the Cadre strength of the IES, while the final Cadre strength is approved by the Cabinet. The sanctioned strength of the IES Cadre at present is 501, consisting of 461 duty posts and 40 leave reserves. The duty posts are spread over 35 ministries and departments of the Government of India.
The role of the service can be broadly categorized in terms of economic advice, economic administration, implementation of development policy and programmes, besides dealing with other areas, such as economic reforms, regulation, price fixation, and monitoring and evaluation. In view of the ongoing reforms pursued by the Government, the role of IES officers has assumed much significance. Apart from the purely economic sectors, IES officers are making crucial contribution towards policymaking in social sectors.
IES officers are exposed to almost all the sectors of government functioning. These officers also provide links and continuity in policy-making, which is essential even for
policy change. It is because of these factors that IES officers have been increasingly playing versatile roles of in-house economists with domain knowledge and experience. They continuously advise concerned ministries and departments on all policy matters, having a bearing on internal and external economic management and facilitating reforms in the fields and sectors concerned.
To ensure that policy pursued by individual ministries or departments is consistent with the overall direction of economic policy contained in the Union budget, Five-Year Plans and so on, the Economic Advisers posted to different ministries or departments interact with the Chief Economic Adviser in the Department of Economic Affairs on a continuous basis. This set up guarantees that economic implications of policy changes are comprehensively analysed and facilitates individual ministries or departments to spearhead reforms in the direction envisaged by the government.
Training to these officers is provided through in-service programmes in collaboration with leading academic institutions – both domestic (such as Indian Statistical Institutes, Indian School of Business and Indian Institutes of Management) and global (such as Duke University or National University of Singapore). This enables aggregation of good practices and dissemination into multiple line departments. Many reforms in various services, including telecom, healthcare, education, urban development and finance, have been actively supported by IES officers over the past decades.
CREATION OF A DEDICATED ECONOMIC ANALYSIS CADRE – THE CASE OF IES IN INDIA44
44 http://www.ies.gov.in/index.php?token=
4.5.3 A look inside – Case study of IES

61
4.6 Implications of alternative data governance models on enablers
As discussed in the earlier section, each of the models for data management (top down, bottom up, centre out and silo in) have their own implications for each of the enablers – technology, processes and people capacity. The following table captures these interactions:
TAKEAWAY BOX: REFLECTION OF DATA GOVERNANCE MODELS ON ENABLERS
Governance Model
Technology (ICT) Implications Process Linked Implications
Human Capacity Implications
Top-down Pre-implementation, this requires a transparent process for assessment of ICT options. During implementation, this require mechanisms to seamlessly integrate reporting and compliance through dashboards for top management review.
Top-down models have the highest process dependencies as there needs to be complete clarity on protocols and processes to go with the top-down implementation push.
With top-down models, the human resource focus is more on standardized training programmes, driven in a hierarchical model. It is usually advantageous to have nodal champions to drive the reform.
Bottom-up Lacking top-down buy in, bottom-up models typically are developed on frugal ICT platforms, usually by augmentation of legacy systems. Usually this is focused on incremental improvements, rather than ground up revamp.
Process standardization is usually the weak link in bottom-up models. While small-scale, localized models might not seem to require process standards, it becomes key in securing management buy in for scale up.
Bottom-up models require the greatest level of collaboration and maturity in human resources. The focus for human resource is more on peer-peer learning and internal management pitches for institutionalization.
Centre-out Centre-out models usually witness a strong level of homework from the key resources who implement such projects, meaning that ICT investments usually are well thought out.
Given that the chances of disillusionment and process failure is high in this model, the champions require significant attention to ‘ease of compliance in processes.
In this model, the focus on human resource must be more on understanding existing culture and barriers, as it is being implemented with neither horizontal nor explicit vertical buy-in.
Silo-in On all three enablers, silo-in models have the highest resilience. This is because of the presence of experts from multiple groups naturally brings in better thinking into selection of ICT, process platforms, training and buy-in methods. In cases where silo-in models are applied, it is usually advisable to focus more on the longer term in all three enablers, setting up sustainable processes that can stand the test of time (post exit of the current champions from multiple groups who are aligned to a common goal). During the implementation stage, silo-in models require the greatest focus on human capacity to enable iterative consensus building and resolution of differences (from multiple groups and interests).

62 An Innovative Data Toolkit for City Management | Step 5: Incorporating New and Different Data Types in the Data Ecosystem
STEP 5: INCORPORATING NEW AND DIFFERENT DATA TYPES IN THE DATA ECOSYSTEM
6362 An Innovative Data Toolkit for City Management | Step 5: Incorporating New and Different Data Types in the Data Ecosystem
5.1 Geographic information system (GIS)
5.1.1 What is GIS data and why is it useful?A geographic information system (GIS) is a computer system for capturing, storing, checking and displaying data related to positions on earth’s surface. GIS can show many kinds of data on one map, which enables people to more easily see, analyse, and understand patterns and relationships.
With GIS technology, people can compare the locations of different things to discover how they relate to each other. For example, using GIS, the same map could include sites that produce pollution, such as gas stations, and sites that are sensitive to pollution, such as wetlands. Such a map would help people determine which wetlands are most at risk.
GIS can use any information that includes location. The location can be expressed in many ways, such as latitude and longitude, address or zip code. Different types of information can be compared using GIS. The system can include data about people, such as population, income or education level. It can include information about the land, such as the location of streams, kinds of vegetation and kinds of soil. It can include information about the sites of factories, farms and schools or storm drains, roads and electric power lines.
5.1.2 Key steps involved in planning and ImplementationA summary of steps that are intended to guide implementation of a GIS Project for municipalities
1. Conduct an initial general needs assessment for the municipality prior to proceeding with a GIS implementation project. The assessment should commence with a review of the municipal business functions.
2. Describe the mapping components (GIS application requirements) that support the business functions and activities of groups within the municipality.
3. Define the data (digital maps and attribute) needed for the GIS to extract information relevant to the functions and activities identified in the business function analysis step.
4. Investigate the availability and currency of existing digital base mapping for the municipality. Prepare an initial estimate of the storage requirements and cost associated with these products.
5. Identify the general configurations of equipment, software and expertise required to provide mapping support to the business functions and make use of the digital mapping.
6. Prepare a request for proposal that sets out the specific functions the GIS implementation requires and the software functionality expected.
5.1.3 What are the success factors to consider?It is important to recognize that GIS implementation within a municipality, whether large or small, represents a significant investment in staff resources and funding as an information technology project. The implementation must, therefore, be managed like any major information technology project to achieve benefits.
Strong Project Management: It is important that the municipality appoints a project manager to oversee the GIS implementation. This individual will assume responsibility for deliverables, develop and monitor the project schedule, and be the primary liaison between staff and management for communicating project results. It is not a requirement that this individual ultimately be responsible for the day-to-day administration of the implemented GIS system.
If the municipality does not have sufficient resources to allocate a full-time project manager internally, an alternative solution is to contract out the project management as part of the consulting involved in system implementation, customizing and testing. However, a municipal staff person must oversee the implementation and report to management on progress.
Active Project Steering Committee: GIS implementation will affect, and be of benefit to, many parts of the organization. A steering committee that represents key stakeholder groups should guide the implementation. This group will establish priorities for the applications and databases that will be created.
Phased Implementation: It is important that the implementation take place according to a phased plan that provides for short-term deliverables that are limited in scope. The plan should provide for the up-front loading of databases and the development of applications that will have immediate benefit to the organization. For example, immediate and significant benefits can be obtained by loading the regional property mapping database and linking municipal information databases, such as land use, permits and municipal facilities to it.
Appropriate Evaluation of Technologies: It is important that the technologies selected for GIS implementation are capable of being tightly integrated within the corporate information technology environment of the municipality. As an example, if the municipality is currently using Oracle as a database management system, the GIS software must be capable of accessing Oracle databases.
Use of Data Standards: Standards for the GIS spatial and attribute databases are important. Municipal information technology staff or consultants should set out relevant data format standards in the early stages of the project. Wherever possible, the municipality should leverage existing provincial or municipal standards, including but not restricted to the following:
• Topographic database for both resource and urban digital mapping
• Digital property mapping and associated attribute database content
• Civic address database.

64 An Innovative Data Toolkit for City Management | Step 5: Incorporating New and Different Data Types in the Data Ecosystem
Standardized manuals on existing geographic database standards for the country and for land-use codes will streamline the standards across regions and improve the interoperability of datasets in the system.
Leverage Provincial Digital Data Sources: Municipalities may already be in possessions of several GIS-ready” digital base map products that can be used to form the foundation for a municipal GIS implementation. It may also be possible to enter into a cost-sharing arrangement with the national remote sensing and mapping entity, if large-scale urban topographic base mapping is considered important for the implementation.
Development of Specific Functional Specifications: This document represents a generic template for Nova Scotia municipalities to use in the preparation of a GIS needs study and the application functional descriptions and data base specifications included represent a high-level set of requirements only. Municipalities that use this document as a starting point for GIS implementation must realize that functional specifications for their applications and databases will need to be developed specific to their needs.
Communication of Progress: The GIS implementation will affect many parts of the municipal organization. Therefore, it may be a high-profile project, and departmental stakeholder expectations could be high. Care must be taken to ensure that proper communication of project results takes place, and visible signs of progress are achieved early in the implementation plan.
5.1.4 Use casesThe relationship between GIS and an automated mapping system (for example, a CAD package) is that a GIS extends the functionality of automated mapping to include the construction of relationships among digital map features (commonly referred to as topology) such that this intelligent map can then be used to perform spatial analysis functions. Examples of spatial analysis include the following:
• Finding an optimum path for routing a vehicle through a road network.
• Determining how many land parcels are contained within a 500-metre radius of a specified location.
• Determining how many buildings are located within 50 metres of a specified road centre line.
A GIS is also capable of linking textual or numeric data (attributes) to the digital map files. It is then possible to use this information to generate both displays and reports about map features that meet certain user specified criteria, for example, the following:
• Click on a property parcel and display its ownership and assessment information.
• Highlight all property parcels that are owned by a municipality.
• Produce a colour-coded map display of properties according to land-use classification.
• Generate a report of property owner names and addresses for all properties within a one kilometre radius of a property that is being considered for rezoning.
For municipalities, this combination of spatial analysis and attribute presentation capabilities makes a GIS package especially attractive to use. For many municipal functions, where attribute databases can be directly related to lot parcels, digital property maps represent a key starting point. Based on the availability of digital property mapping for all land parcels within the country (usually from the central authority), municipalities can implement GIS applications in a phased manner at a reasonable cost by leveraging this data.
5.2 Crowdsourced Data
5.2.1 What is crowdsourced data and why is it useful?Crowdsourcing has been alternately defined as the following: the outsourcing of a job (typically performed by a designated agent) to a large undefined group in the form of an open call; a process that ‘enlists a crowd of humans to help solve a problem defined by the system owners’; or ‘a sourcing model in which organizations use predominantly advanced Internet technologies to harness the efforts of a virtual crowd to perform specific organizational tasks’. Common across these alternate definitions is the notion that crowdsourcing invites all interested people to form an open forum of ideas that can eventually lead solving the assigned problem.
The public participation in the planning process is critical to the successful implementation of any plan. Broad public participation leads to ‘greater legitimization and acceptance of public decisions, greater transparency, and efficiency in public expenditures, and greater citizens’ satisfaction’45. Inclusion of stakeholders with varied interests and backgrounds leads to a plan that is comprehensive, acceptable and more easily implementable. Providing accessible modes of communication, such as project Websites and Web-based meetings and discussions, may be adopted as a means of increasing public participation in the planning process.
An important subset of the general crowdsourcing idea is the concept of citizen science, in which amateurs contribute to research projects in conjunction with professional scientists. Michael Goodchild used the term ‘citizen science’ in describing crowdsourced geomapping, referring to information generated through crowdsourcing as helpful in expanding the reach of science, although the information is not of a professional level.
45 Insua, R. D., E. G. Kersten, J. Rios, and C. Grima. Towards Decision Support for Participatory Democracy, ISeB, Vol. 6, 2008, pp. 161–191.

6564 An Innovative Data Toolkit for City Management | Step 5: Incorporating New and Different Data Types in the Data Ecosystem
The nature of participation in citizen science projects takes different forms, depending on the type of project; it can range from data collection to data analysis and from instrument building to taking part in scientific expeditions. Recent citizen science projects tend to focus on using the ever-increasing reach and availability of electronic gadgets, particularly mobile phones and sensors, for data collection and monitoring purposes.
5.2.2 Key steps involved in planning and implementationCrowdsourcing can only be successful if a platform exists that can provide open access to incorporate, modify and synthesize data. Cities can evaluate which variants of these systems are most appropriate to their contexts and challenges and deploy accordingly. There are four versions of this shared platform.
A. Voting SystemsThree players facilitate the process of crowdsourcing: the requesters of task, a platform and the workers. The requesters of crowdsourcing task share the details of the task on a common aggregator platform. In a voting system, a crowdsourcing worker should select an answer from number of choices. The choices from crowdsourced workers are then collected and results are computed. The answer of the majority workers is considered by the requesters to be correct.
Voting tasks can be performed by crowdsourced workers of any skill set and are not esoteric in nature, which reduces costs of training of workforce. Research has shown that certain tasks that require large processing times, can be accomplished rather easily by human effort. A few such tasks have been enumerated below:46
1. Name association: These are voting tasks that capture the associations of textual references with entities in the world. Organizations find this particularly useful in evaluating the perceptions of their existing products or services in the market. These perceptions can be disaggregated for normative, geographic and temporal variations. Additionally, organizations and governments can derive feedback about the effectiveness of their marketing efforts and measure the impact.
2. Opinions: Gathering subjective preferences of a crowd can be accomplished easily in a crowdsourcing system. These opinions can be factored into the decision-making of organizations and governments.
B. Information sharing systemsInformation sharing systems consist of platforms where users share information by leveraging the Internet’s resources. As opposed to voting systems, these systems comprise of the platform and crowdsourced workers only. Workers are driven to share and update information because of an intrinsic motivation to do so. Examples of such platforms include the following:
• Wikipedia. Users generate this online encyclopaedia, which covers information on any topic. The advent of Wikipedia has established a global norm for researchers around the world by serving as a starting point for research. However, there is scepticism about the authenticity of data. For example, the intrinsic motivations of the users could be politically and culturally driven. As a result, an article could contain erroneous information. However, an indicator of the authenticity of the information is the nature of citations that an article has. If an article has many authentic citations, the article is more likely to be authentic.
• Quora. It is a general question and answer forum, which serves as a public good for the consumption of users. Users pose questions that are answered by multiple users. The answers are ‘up-voted’ or ‘down-voted’ based on the positive and negative popularity they garner. Answers with high number of ‘up-votes’ are credible in the Quora community. A user who consistently poses answers with high ‘up-votes’ gains credibility by having many followers. This ensures that an answer with high ‘up-votes’ and from a user with large number of followers has a high level of authenticity.
C. Domain specific systemsThis system has components similar to that of a voting system, but the users undergo a recruitment process and are selected to address the problems of a particular group or type. The users possess the requisite skills to address such problems and are less likely to commit errors in data generation when compared to a random crowd.
Analysing and deciphering long texts is implemented through a process called ‘text mining’. Users peruse a piece of text and derive insights such as the sentiment of the text, relevance of the text to a question or topic and so on. There is a text-mining software that can carry out the function but its functionality is very preliminary. A lot of users are allocated small pieces of a large text to cull insights on the sentiment or relevance of a piece of text.
Even the most advanced technologies cannot replace human creativity. Researchers, especially psychologists, who are interest in collecting information on the relationship between creativity and cognitive or behavioural process employ methods that entail users to perform such tasks as drawing an image or writing a piece of text when stimulated with a probe. The probe is a word or an idea whose effect the researcher is trying to ascertain. The results obtained are then collated to obtain a deeper understanding of the reactions that the probe invokes.
Domain specific systems reduce the probability of committing errors since significant resources are diverted to the recruitment of an eligible crowd. This comes at the cost of allocation of resources towards training and retention of the eligible crowd.
46 A Survey of Crowdsourcing Systems, Man Ching Yuen et al, IEEE International Conference on Privacy, Security, Risk, and Trust, and IEEE International Conference on Social Computing, 2011.

66 An Innovative Data Toolkit for City Management | Step 5: Incorporating New and Different Data Types in the Data Ecosystem
D. Passive systemsThese systems do not involve the crowdsourced worker to actively perform a task. Data on user behaviour that is exhibited in one context is used to draw insights for the application to a different context.
Digital advertising leverages the information collected from user behaviour. Information on pages browsed, mouse-overs and time spent on a webpage are captured through cookies. These cookies transfer information to the parent website of the organization, which uses this information to improve user experience by showing targeted ads and filtering redundancies, leading to an overall process simplification. The passively generated data can make online bureaucracy more efficient. Important links can be placed at locations where the user is most likely to go on a webpage. The time taken to complete a transaction can be correlated with the average time a user spends on a webpage without getting fatigued.
Establishing the architecture for a passive system would be a significant capital expenditure for the organization. In the initial stages, marketing efforts towards increasing traffic on the website would also be required. Once the system attains scale, the only recurrent expenditure would be the maintenance of the system. However, given that many citizen-based mobile applications are emerging in the African context, this could give valuable insights (such as traffic data).
5.2.3 What are the success factors to consider?As crowdsourcing gets applied to different domains, and as the scale and scope of crowdsourcing systems increases, additional techniques for addressing these system-specific issues need to be developed based on the requirement of the projects. In addition to the unique issues of the systems, operation and maintenance of crowdsourcing systems generally suffer from four major issues:
1. Recruiting and retaining the participant base: The problem of recruiting and retaining participants is a major issue in adopting crowdsourcing for any project. Depending on the purpose of the project, it is often important that feedback be obtained from users with particular skills or expertise. Furthermore, retaining participants is often important for understanding a trend over time, as this allows the crowd’s understanding of the problem to evolve throughout the process. The use of recurring campaigns and marketing strategies at frequent intervals (along with new releases of apps) is suggested where applicable so that people remain curious about the project and the developers can help maintain a participant base over time. Incentives in the form of material benefits (as well as acknowledgement of contribution in the form of gratification announcements at project sites) make people feel encouraged to participate in the project and can help recognize diverse kinds of contributions from the crowd.
2. Assessing user capabilities: Dealing with user capability is an important issue in citizen-science projects and problem-solving projects where participants are required to have some background to appreciate the assigned task. While participatory planning may not generally require special skill sets, in cases in which the planning process targets a special group, it is important that the participants are aware of the specific problems of that group (for example, planning for bicyclists’ needs requires the presence of people who bike in that area so that the relevant problems and issues are brought up and placed on the table). In such cases, the crowdsourcing process may be most successful if it is designed as a domain-specific system — rather than a general purpose one — where specific tools and capabilities are available to develop and maintain relevant user capabilities.
3. Aggregating the information provided by users: Problems with data quality and challenges with data aggregation are two important issues that often undermine the benefits of crowdsourcing systems. A degree of loose hierarchical authority is needed to ensure that the data are useful for their intended purpose. Additionally, aggregation of the data from crowdsourcing is often a complicated task given the volume of responses received from a diverse pool of crowd participants. Coping with data issues is often labour intensive as large data sets need to be manually cleaned, or more cost intensive as complex data management systems and processes need to be put into place to reduce sources of human error.
4. Evaluating the contributions of users: Evaluating the contribution of the user is commonly accomplished by setting up an automatic screening programme to evaluate the validity of user-submitted information based on predefined criteria. The screening programme rejects any input that does not follow the set criteria and thus only valid information is retained. However, this kind of automation is possible only in cases in which the input is sufficiently normalized so that it can be evaluated programmatically. In cases in which the responses are descriptive or subjective, a manual evaluation stage is needed to evaluate each response based on its potential contribution to the project. Such manual processes are labour- and cost-intensive and prone to subjective biases of the evaluator. However, they are needed to ensure data quality for the project.
5.2.4 Additional Use cases
User Feedback–Based Crowdsourcing SystemsSeeClickFix (http://seeclickfix.com), PublicStuff (http://www. publicstuff.com) and FixMyStreet (http://www.fixmystreet.com) all rely on public feedback about neighbourhood issues and have been successful in mobilizing communities to take up these tasks voluntarily. While FixMyStreet is essentially for users to report road maintenance issues, developers have a similar

6766 An Innovative Data Toolkit for City Management | Step 5: Incorporating New and Different Data Types in the Data Ecosystem
transit-based tool called FixMyTransport (http://www.fixmytransport.com). On the other hand, SeeClickFix and PublicStuff can be used to report “any nonemergency issue anywhere in the world that a user wants to be fixed”, be it infrastructural or governance related. In SeeClickFix, users can also set up neighbourhood watches where they monitor and report local community issues that are then taken up by advocacy groups or elected officials, so that solutions are proposed publicly. The users do not need any special expertise. Most reported issues are local and community-oriented in nature, reinforcing the concept that crowdsourcing can be successful in addressing local and regional issues, making it suitable for transportation planning.
Crowdsourcing Systems for Data CollectionCrowdsourcing vehicle traffic is well-established with such applications as Google’s Waze. One recently funded company, Placemeter, pays people to attach an old smartphone to a street-facing window to measure pedestrian traffic via video feeds. Its systems detect and count pedestrians and vehicles in streets, estimate how busy places are, track how long people wait in line and measure the speed of cars. NoiseTube is a crowd sourcing application that enables users to measure their personal exposure to noise in their everyday environment. The users have GPS-equipped mobile phones with noise sensors. The data are geo-tagged and a collection of these data is then used to generate a noise mapping for an area. HealthMap combines citizen-provided information with online sources to map public health threats. Flu Near You uses citizen-contributed information collected on its website to map flu activity. Google’s Flu Trends analyses flu-related searches to estimate influenza occurrence. In response to the Haiti earthquake in 2010, the OpenStreetMap community began gathering data from satellite imagery for damage assessment. The project used the Open Geospatial Consortium (OGC) GeoPackage standard, which was developed and updated in OGC testbeds. Crowdsourcing was also critical for identifying damage and accelerating repairs in the Philippines in response to Typhoon Haiyan in November 2013.
Standalone Crowdsourced Data Quality Auditor System
Along with generating data from underrepresented groups, domain-specific crowdsourcing also helps in data quality management, which is an issue with self-reported data in crowdsourced systems. Most of the systems that use voluntary public participation include some form of expert control over the data. An expert-user group can act as a bridge between general users and the system by filtering required information from general information and then translating the feedback from the system to the general users in a meaningful way. Use of such a group helps maintain a feedback loop that is important in retaining participants and prevents losing the critical mass, which is often the case if the entire process is domain specific. A standalone example in transportation systems is the transit ambassador programme initiated by the OneBusAway programme in Seattle. The transit ambassadors are a super user group, with a solid understanding of the transit network and basic computational and analytical skills. Their role is to filter the incoming general purpose crowdsourced information and channel it to the respective departments within the transit agency for necessary action.
5.3 How to use decision support tools to analyse and use dataCities require a clear rationale for improving their data ecosystems. Given the number of competing priorities for city governments’ resources (financial and bandwidth), data system transformations need to be accompanied by a clear case for themselves. Such a case can be provided through a suite of decision-support systems, which will be an additional layer on the data architecture, and help the governments at various levels draw useful insights that can support them in executing their functions. An overview of typical needs at various levels of government and what kind of decision-support systems could address the same is provided below
Ability to deliver intended changes to
the target group
Cost per unit change delivered in the thematic area
Ability to assess future scenarios and
plan accordingly
Continuous assessment,
benchmarking and course correction
Effectiveness Efficiency Options & Risk Management
Monitoring & Evaluation
ILLUSTRATION 1: MAPPING OF GOVERNMENT NEEDS TO POTENTIAL DECISION SUPPORT SYSTEMS

68 An Innovative Data Toolkit for City Management | Step 5: Incorporating New and Different Data Types in the Data Ecosystem
The set of decision support tools will address one or more of the above aspects to create a case for adoption. While decision-support tools are equally applicable and of value across city typologies, a few adaptations are necessary for specific typologies:
1. Metropolitan Regions: Exclusion and equity are key concerns for metropolitan regions, also given the extent of slums and service inequity. In this context, decision-support tools that help identify and address such inequities are of high value. Similarly, given that risk management is another key concern (due to high loss given event), risk management tools can be useful.
2. Regional Capitals: On account of the strong emphasis on planning and administrative coordination, decision tools linked to long-term planning (for example, city business plans or city development plans) and citizenship (for example, participatory decision making) can be helpful.
3. Corridor Cities: Given that the corridor cities prioritize attracting and retaining investment, service delivery linked dashboards and decision-support tools, along with revenue monetization tools, are typically top priorities.
4. Secondary Cities: Decision tools focused on cost-effectiveness assessment of various investment options are natural first choices to optimize the existing limited financial resources.
5.3.1 A quick snapshot of available decision support toolsThe following table captures some of the existing decision-support tools that city governments can use to extract decisions out of the data they collect. Most of these tools are in public domain and can be configured for city use with little incremental effort.
No CA Theme Brief
1 Citizenship & Governance – Participatory Methods
Participatory Methods Toolkit – A Practitioner’s Manual (viWTA, UNU/CRIS)47
The toolkit contains guides and tools to support cities on decisions pertaining to planning and rolling out participatory methods. It has a comparison of options for participatory methods, along with pre-requisites, advantages and challenges in each. Finally, it provides step by step support on each of these options, with a brief description of methods and techniques.
2 Citizenship & Governance & Service Delivery – Participatory Decision Making
Tools to Support Participatory Decision Making – UNHABITAT48
This toolkit is a contribution to the Global Campaign on Urban Governance, an initiative led by United Nations Human Settlements Programme (UN-Habitat) in collaboration with a whole range of partners whose development goal is to help eradicate poverty through improved urban governance. This toolkit contributes to the wider dialogue, advocacy and capacity-building efforts towards good urban governance.
3 Citizenship & Governance – Transparency in Local Governance
Tools to Promote Transparency in Local Governance – Transparency International49
The product of a partnership between Transparency International and UN-HABITAT, it describes how increased transparency at the local level can help in combating urban poverty and enhancing civic engagement. Promoting transparency, through the application of a range of public education, public participation, e-governance, ethics and institutional reform instruments, can reduce citizen apathy, make service delivery contribute to poverty reduction, increase city revenues and raise ethical standards.
4 Citizenship & Governance & Economy – Competitiveness and Quality of Living Assessments
Quality of Living Assessment - Mercer50 Mastercard African Cities Growth Index51
These assessments provide a comprehensive view of various aspects of citizen satisfaction and quality of living, spanning political, social, economic, environment, health and wellness, education, public services, recreation and housing issues. The Mastercard index focuses on competitiveness, looking at both lead and lag variables. It also has the facility for city managers to create action plans or decision pathways for city improvement.
5 Economy – Competitiveness Assessment
Value Chain Assessment and Development – Competitiveness tools (USAID)52
The repository has detailed dashboard and assessment tools to evaluate competitiveness through value chain approaches. It includes assessment of business environment, value chain ‘strengths-weaknesses-opportunities-threats’ (SWOT), production capacity analysis and impact assessment primers. While its applicability is very broad, it could be used by metropolitan regions and corridor cities in particular to regularly assess and improve their competitiveness.
47 http://social-labs.com/wp-content/uploads/2014/12/PMT.pdf 48 http://unhabitat.org/books/tools-to-support-participatory-urban-decision-making/ 49 https://www.transparency.org/whatwedo/tools/tools_to_support_transparency_in_local_governance/3/50 https://www.imercer.com/content/mobility/quality-of-living-city-rankings.html 51 https://newsroom.mastercard.com/mea/files/2015/12/MasterCard-African-Cities-Growth-Index-2015_ONLINE.pdf 52 https://www.microlinks.org/good-practice-center/value-chain-wiki/specific-tools-and-resources

6968 An Innovative Data Toolkit for City Management | Step 5: Incorporating New and Different Data Types in the Data Ecosystem
53 http://info.worldbank.org/etools/docs/library/166856/UCMP/UCMP/Documents/competitiveness.pdf 54 http://interactive.taxfoundation.org/propertytax/ 55 http://www.citiesalliance.org/sites/citiesalliance.org/files/CA_Docs/resources/led/full-led-guide.pdf 56 http://www.switchurbanwater.eu/outputs/results.php?pubtype_select=19&pt=Manuals%20and%20handbooks 57 http://cstep.in/uploads/default/files/publications/stuff/31604d8e62d7f85380ca1a31da643a0c.pdf 58 http://cstep.in/uploads/default/files/publications/stuff/4aff8c2429919c065cfef3b0c04363cf.pdf 59 http://resilience.io 60 http://careclimatechange.org/wp-content/uploads/2014/12/CVCA_EN.pdf 61 http://www.wsl.ch/fe/wisoz/dienstleistungen/clisp_guidance/index_EN
No CA Theme Brief
6 Economy – Competitiveness Assessment
Urban Competitiveness Assessment in Developing Countries – World Bank53
This tool reviews approaches and techniques to assess the competitiveness of urban regions. In particular, the importance of human resources and institutional and cultural environments is incorporated. The tool provides a mechanism for city governments to evaluate SWOT and options for benchmarking or monitoring approaches.
7 Economy – Tax Revision
Property Tax Benchmarking and Revision – Tax Foundation USA54
This portal presents a template for dashboarding of property tax rates across areas, which can be used by both citizens and local governments to understand the logic behind property tax rates, and identify avenues to increase property tax buoyancy respectively. It also includes calculators and data tools that can provide support to local governments in identifying potential for reforming the tax area (for example, automatic indexation or service indexation.)
8 Economy – Local Economy Development
Toolkit on Local Economy Development56, by Cities AllianceThis toolkit is designed to provide city managers with a clear overview of what needs to be done, what data needs to be collected and analysed to understand their local economy and assess its competitiveness – helping practitioners select the tools and methodologies best suited to their city.
9 Service Delivery – Water
SWITCH toolkit56 for Integrated Urban Water Management (IUWM)SWITCH has mechanisms to enable all stakeholders in the city to view the urban water cycle in an integrated way and allows the development of new strategic directions for urban water management. SWITCH includes a training toolkit with the city learning alliances to maximise the utility and impact of the SWITCH approach.
10 Service Delivery – Sanitation
Decision Support Tools for Sanitation Planning – CSTEP57, 58
CSTEP’s decision support tool provides two things – first, it provides a roundup of existing open models for sanitation planning from across the world, with assessment of advantages and constraints of each. Second, it provides its own decision support framework, incorporating best components of these tools, while addressing specific gaps identified.
11 Service Delivery & Environment – Meta level planning and Resilience
Cities Alliance - resilience.io59
resilience.io is designed as a computer-based platform that provides an integrated-systems view of a city-region. It is an analysis and decision-support tool for collaboration and resilience decision-making. The resilience.io platform combines computer representations of resource flows, human and business activities and infrastructure systems.
12 Environment CARE Climate Vulnerability and Capacity Assessment (CVCA) Handbook60
The CVCA methodology helps to understand local implications of climate change for lives and livelihoods. Combining local knowledge with scientific data, the process builds people’s understanding about climate risks and adaptation strategies. It provides a solid foundation for the identification of practical strategies to facilitate community-based adaptation to climate change.
13 Environment Decision Support Guidance for Climate Change Impacts and Spatial Planning61, by the EUDeveloped for UK planning systems, but applicable in other contexts. Guidance concentrates on climate change adaptation with the following tools to assist planners in carrying out climate change risk assessment and link that to development options: constraint mapping; tipping points (or threshold analysis); a high-level risk assessment/ screening tool; and decision pathways.

70 An Innovative Data Toolkit for City Management | Step 6: How to Use this Toolkit
STEP 6: HOW TO USE THIS TOOLKIT

71
6.1 Implementing the toolkit in your city to bolster the city’s data ecosystemThe toolkit, in summary, presents a set of aids for cities to assess the current maturity of their data ecosystems (by thematic area), identify which specific enablers need improvement and address such enablers through systemic and tactical interventions (around technology, processes and human resources). It also provides a mechanism to track performance and outcomes through periodic assessment of data maturity to provide learnings for cross pollination, both between themes and between jurisdictions, if applied in a coordinated fashion at a multi-city level.
Using this toolkit to improve data maturity requires a sequential process involving four high level steps, as illustrated below:
1. Preparationa. Securing buy-in: Even at a limited scale,
implementation of the toolkit requires buy in at the city management level. City governments or anchor departments should ensure that the city management is bought into the idea of data improvement, even in a specific area.
b. As-is assessment: Cities need to ensure that the data for evaluation of current ecosystem
are correct and reported without biases. Cities must ensure that the data maturity assessment is positioned as a forward-looking improvement plan, rather than as a statement on the current capacity or performance of the data owners.
2. Pilot planninga. Consensus building: Once the results from the as-
is assessment are available, the departments need to get together to identify one high potential area for data improvement (for the pilot).
b. Champion identification: Upon identification of the pilot area, champions need to be identified and given resources to execute the pilot. At this juncture, it is a good idea to look at potential convergence in terms of resources with other government programmes, donor programmes and non-governmental agencies. However, the agenda of such support agencies should match very closely with the planned pilot, or else, it is better for the city to go alone on the pilot.
3. Pilot executiona. Rollout and monitoring: A tight work plan for
rollout of the pilot should be developed, with regular (at least fortnightly) reporting to the city management. Many resources for general project management62 are available in the open domain and can be leveraged.
b. Showcasing a quick win: Demonstration of the impact of the pilot on the city needs to be showcased within a relatively short period (under one year). The impact can be in one or more of three areas: revenue augmentation for the city (for example, property data); cost reduction for the city (for example, leakage arrests by weeding out duplicate beneficiaries from subsidy programmes); and improvement in service delivery at the same cost (for example, greater coverage of drinking water supply at the same budget through timely operations and management).
4. Scale up and stabilizationa. Build case for scale up: The pilot experience
needs to be held as a use case for scale up to other themes and enablers. This will require cost-benefit pitches to be made to the respective departments, as well as the city management. Again, convergence with external support (donors and grants) is a possibility that can be explored.
b. Institutional transition: Finally, it is important to transition the champion-driven pilot model to a more institutional mechanism that can be implemented in the longer run across departments. Here, greater process standardization and overall capacity building will be focus actions.
The stabilization will be followed by ongoing monitoring, evaluation and learning. Such monitoring could happen at two levels: comparison of performance over time within a theme on data ecosystem to identify the effectiveness of the interventions (theory of change); and comparison of performance across themes or jurisdictions to assess
Step 1: Preparation
Securing Buy-In As-is Assessment
Step 2: Pilot Planning
Consensus Building Champion Identification
Step 3: Pilot Execution
Rollout and Monitoring Showcasing a Quick Win
Step 4: Scaling Up and Stabilization
Build Case for Scae Up Institutional Transition
62 http://www.techworld.com/picture-gallery/startups/10-best-free-project-management-software-programs-3625922/

72 An Innovative Data Toolkit for City Management | Step 6: How to Use this Toolkit
transferability of best practices to increase effectiveness and efficiency (model of change). Usually, the second level requires implementation happening across multiple cities or themes, with the former being particularly powerful. Having the national government supports such initiatives can promote rapid cross-pollination of good practices to increase value for money of such transformations. Network effects are magnified, with even greater returns on collaborations across countries.
6.2 Typology-wise considerationsWhile the above sequence of activities is applicable across city typologies, some of these steps have different implications across typologies. City managers should consider specific challenges and requirements at a local level, while preparing for such rollout. The below table summarizes some of the considerations by typology.
No Stage Typology 1 Metropolitan Regions
Typology 2 Regional Capitals
Typology Secondary Cities
Typology 4 Corridor Cities
1 Securing buy-in
Usually these cities have sufficient resources to invest in pilot concepts. The focus should be on identifying high-pain points for the pilot.
Buy in might be complicated by the added nuance of a higher level of government. In such cases, it is better to pick areas that are exclusively within city jurisdiction.
Resource availability is usually a concern for these typologies. Buy – in could be facilitated by linking the programme with revenue generation/ cost-saving aspects. Such potential use cases are outlined in the decision support component of the toolkit.
2 As-is assessment
In these jurisdictions, typically there is already available data and investment into systems. Hence, there is a possibility of the data assessment being a challenge to current data managers. Care is required to position the exercise as a constructive, forward looking one, to enable a realistic assessment. One possibility is to pitch this as a ‘clean up’ exercise, where all deficiencies can be assessed and addressed, with a supportive management.
In these jurisdictions, there is possibility of very little pre-existing data and systems. In such cases, it is best to focus on a subset of themes (within the Cities Alliance themes) for the data toolkit to be applied. Examples could include economy (for corridor cities) and service delivery (for secondary cities).
3 Consensus building
Consensus building is usually a key challenge in this typology. Given the multiplicity of actors involved in any area (such as city government, metropolitan development authorities, parastatal agencies), there should be a clear allocation of roles and responsibilities.
If support from the national government is in place (top-down approach), it is usually best to have them play a key role in the workshops, as the project starts being a larger priority.
Consensus building is usually easier in secondary and corridor cities, on account of relative lack of overlaps and intersections in jurisdiction. The key here will be to build the consensus on next steps centred around tangible themes that result in either cost savings or revenue augmentation.
6.3 Typology-wise challenges and considerations
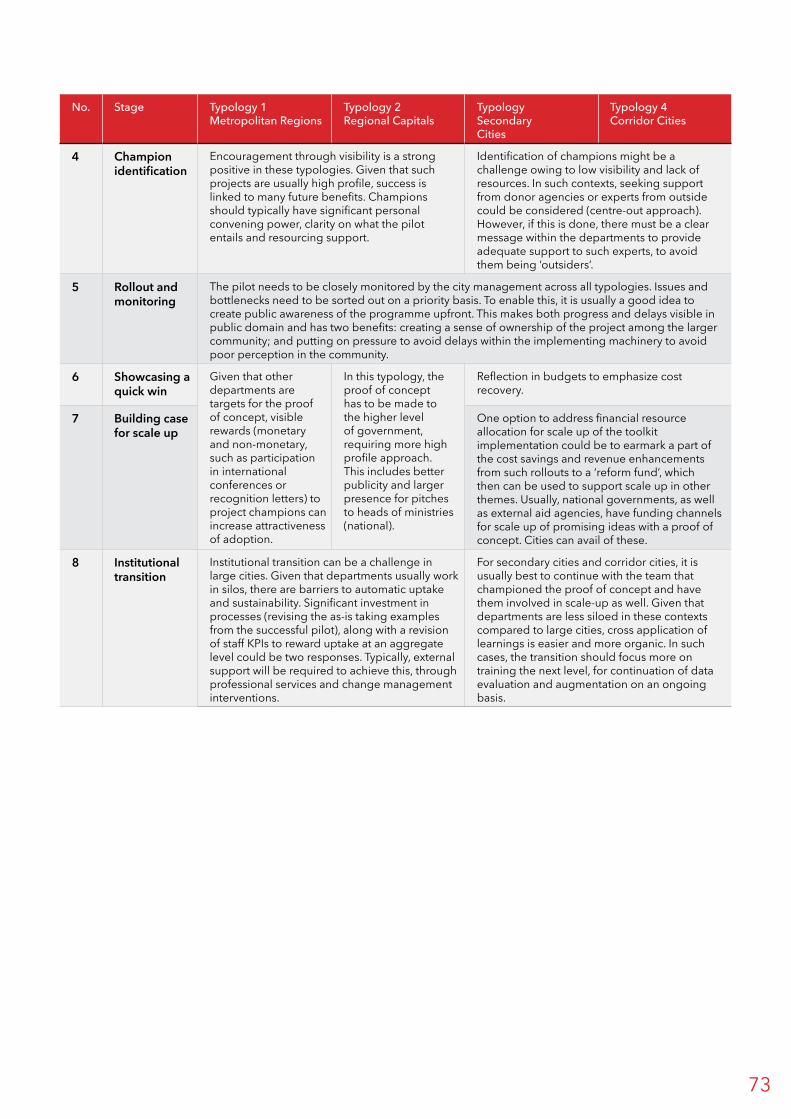
73
No Stage Typology 1 Metropolitan Regions
Typology 2 Regional Capitals
Typology Secondary Cities
Typology 4 Corridor Cities
4 Champion identification
Encouragement through visibility is a strong positive in these typologies. Given that such projects are usually high profile, success is linked to many future benefits. Champions should typically have significant personal convening power, clarity on what the pilot entails and resourcing support.
Identification of champions might be a challenge owing to low visibility and lack of resources. In such contexts, seeking support from donor agencies or experts from outside could be considered (centre-out approach). However, if this is done, there must be a clear message within the departments to provide adequate support to such experts, to avoid them being ‘outsiders’.
5 Rollout and monitoring
The pilot needs to be closely monitored by the city management across all typologies. Issues and bottlenecks need to be sorted out on a priority basis. To enable this, it is usually a good idea to create public awareness of the programme upfront. This makes both progress and delays visible in public domain and has two benefits: creating a sense of ownership of the project among the larger community; and putting on pressure to avoid delays within the implementing machinery to avoid poor perception in the community.
6 Showcasing a quick win
Given that other departments are targets for the proof of concept, visible rewards (monetary and non-monetary, such as participation in international conferences or recognition letters) to project champions can increase attractiveness of adoption.
In this typology, the proof of concept has to be made to the higher level of government, requiring more high profile approach. This includes better publicity and larger presence for pitches to heads of ministries (national).
Reflection in budgets to emphasize cost recovery.
7 Building case for scale up
One option to address financial resource allocation for scale up of the toolkit implementation could be to earmark a part of the cost savings and revenue enhancements from such rollouts to a ‘reform fund’, which then can be used to support scale up in other themes. Usually, national governments, as well as external aid agencies, have funding channels for scale up of promising ideas with a proof of concept. Cities can avail of these.
8 Institutional transition
Institutional transition can be a challenge in large cities. Given that departments usually work in silos, there are barriers to automatic uptake and sustainability. Significant investment in processes (revising the as-is taking examples from the successful pilot), along with a revision of staff KPIs to reward uptake at an aggregate level could be two responses. Typically, external support will be required to achieve this, through professional services and change management interventions.
For secondary cities and corridor cities, it is usually best to continue with the team that championed the proof of concept and have them involved in scale-up as well. Given that departments are less siloed in these contexts compared to large cities, cross application of learnings is easier and more organic. In such cases, the transition should focus more on training the next level, for continuation of data evaluation and augmentation on an ongoing basis.

74 An Innovative Data Toolkit for City Management | Step 6: How to Use this Toolkit
6.4 Suggested implementation timelinesThe below chart suggests tentative timelines for implementation of the toolkit:
No Activity Q1 Q2 Q3 Q4 Q5 Q6 Q7 Q8 Q9 Q10 Q11 Q12
1 Securing buy-in
2 As-is assessment
3 Consensus building
4 Champion identification
5 Rollout and monitoring
6 Showcasing a quick win
7 Building case for scale up
8 Institutional transition
Clearly, the above timelines are indicative, as the actual timelines will depend on the complexity of the pilot, gaps between current state and desired state, and external ecosystem (for example, technology outsourcing). Additionally, response time from government departments (especially at higher levels of government) might be non-standard, leading to delays. However, it is prudent to follow a conservative timeline, as interest in such initiatives requires quick turnaround to sustain and transform into institutional change. A good way of ensuring tight compliance is to synchronize such pilots with larger programmes (such as tying up data reforms with thematic reforms or welfare programmes launched by governments), or at least synchronizing them with budget planning and announcements (for example, five-year plans or sectoral plans in case of corridor cities).
6.5 Monitoring and evaluationMonitoring is the supervision of activities in progress to ensure they are on-course and on-schedule in meeting objectives and performance targets. In the context of this data toolkit, this means that the data objectives and targets that are set out in this toolkit provide the specific information by which participants in the FCA who utilize the toolkit measure achievements.
The FCA Data Toolkit monitoring framework performs two primary functions:
1. Provides a real-time measurement of achievements towards FCA Data Toolkit objectives.
2. Provides a management and learning tool to address unforeseen constraints, which one can quickly adapt and redefine activities as needed to maximize the effectiveness and efficiency of the data toolkit and document and disseminate achievements towards anticipated results.
In addition, the FCA Data Toolkit can do the following:
3. Assess to what extent data provided by staff and stakeholders accurately represents the work done to date.
4. Monitor the status of major risks and threats and their implication(s) to successful implementation of the toolkit.
6.5 Monitoring system conceptual frameworkThe data toolkit proposed here is intended to provide a mechanism to track and evaluate the data ecosystem of a city government. It does this by providing a representative snapshot of a given city’s data infrastructure.
While the toolkit does not presuppose any specific ‘theory of change’, in order to monitor the implementation and

75
effectiveness of the system, a speculative model of how the toolkit will result in positive outcomes for cities across the five FCA themes is proposed. This model suggests that increases in data availability or quality will lead to improvements in city management decisions, thus leading to improved city services and infrastructure across the themes.
Good data are necessary preconditions for well-argued and evidenced decisions regarding urban development planning directions, resource allocation and the enabling environment. The availability of proper data at the local level helps to contextualize local priorities and the costs of different investment strategies, as well as assess the expected benefits of different investment options.
In parallel to the transformation of data into decisions, the toolkit also provides a mechanism (through the data quality and enabler assessment) to track the overall evolution on the ‘data maturity’ trajectory over time and to put in initiatives for improvement. This is particularly important as most cities would start off at low levels of maturity on the data ecosystem, requiring concerted effort across multiple enabler categories to move into a higher maturity trajectory.
A mechanism to assess and interrelate improvements in data maturity, with outcome improvements on decision making, will be required to assess the interrelationship between the proposed critical sub-cause for poor decision making (poor data). Hence, the monitoring and evaluation system will cover the outcomes (better decision making around the Cities Alliance themes), the outputs (data improvement), and the inputs required (initiatives to augment data ecosystem enablers). A baseline on all aspects (outcome, output and input) will be required to evaluate change. Such a baseline is subsumed in the toolkit implementation.
6.6 Monitoring system operationsOpration of the monitoring framework is based around three phases:
1. A preparatory ‘baseline’ phase that collects information on the basic requirements for successful implementation of the data toolkit.
2. A data toolkit implementation phase, that reviews, on an ongoing basis, many of the key parameters detailed in the data toolkit.
3. A data utilization phase that looks at the outcomes of the implementation of the data toolkit in the day-to-day management activities of cities participating in the initiative.
These three phases provide a concise overview of the data toolkit through the preparation, implementation and the ultimate intended outcomes of the initiative as articulated above.
6.6.1 Data flowThe following diagram illustrates the flow of data across the monitoring cycle. The process commences with an initial assessment of baseline or preparatory conditions for rolling out the data toolkit, followed by the actual implementation of the toolkit itself (with selection of the appropriate parameters, indicators, frameworks and themes). It ends with the assessment of the outcomes of applying the data toolkit to the key city management areas that the FCA hopes to address via the toolkit.
The cycle can then be repeated on a periodic basis to review the changes that take place over time within the dynamic environment of a city’s management ecosystem.
Good Urban Development decisions are made
Decisions are made on the basis of strong data
Local priorities are understood
Stakeholders with a mandate
to collect information are in place
Resources are
in place to identify
and collect key data
Collection of accurate and timely data is prioritized by
decisions makers
Key stakeholder
agences cooperate to
ensure complete accurate and timely data
A supportive policy
environment exists
Civil society is an active
stakeholder in city
development
Technological maturity
within the city is high
Key gap areas are
understood
Cost/benefits of different investment strategies understood
Accurate and up-to-date information on key themes
is available
FIGURE 22: FRAMEWORK TO ILLUSTRATE THE MATURITY PATHWAY FROM ENABLERS TO DECISIONS

76 An Innovative Data Toolkit for City Management | Step 6: How to Use this Toolkit
6.7 Data collection
BASELINE DATA:• Stakeholder mandates
• Capacities• Policies & cooperation
• Civil society • Technology
IMPLEMENTATION DATA:• Assessment
• Maturity• Management
• Enablers • Innovations
OUTCOME DATA:• Gap
• Resources• Priorities
• Cost/benefit analysis • Updating & actions
FIGURE 23: DATA FLOW ACROSS THE MONITORING CYCLE
A. Baseline Information
1. Stakeholders with mandate to collect information No stakeholder, no mandate.Stakeholders in place, but no mandate.Stakeholders have mandate.
2. Resources to implement toolkit
a. Human resources (skills, time) Good/Medium/Poor
b. Financial resources Good/Medium/Poor
c. Technical resources Good/Medium/Poor
d. Official statistics or data Good/Medium/Poor
3. Data toolkit institutional buy-in priority assigned by decision makers
Good/Medium/Poor
4. Cooperation between stakeholder agencies (Formal/informal: Memorandum of Understandings, by-laws and so on)
Good/Medium/Poor
5. Supportive policy environment (by-laws, Standard Operating Procedures and so on)
Good/Medium/Poor

77
6.8 Toolkit implementationThe following templates can be applied by users of the FCA Data Toolkit to assess their implementation of the toolkit at various stages. The tools themselves are in a checklist format, with a mix of quantitative (numbers) and
qualitative (yes/no, good/bad) measures. The qualitative measures may be designed in a simple yes/no, good/medium/poor format or a more nuanced Likert-scale type measure may be used. This links back to the data quality and availability assessment module of the toolkit.
6. Civil society
a. Enabling environment (policies, legislation, supports)
Good/Medium/Poor
b. Number of CSOs Number
c. Level of participation or engagement with urban issues or themes
Good/Medium/Poor
7. Technological maturity
a. Internet penetration Good/Medium/Poor
b. Personal computer ownership Good/Medium/Poor
c. Cellular phone ownership Good/Medium/Poor
i. Data Assessment
Number of indicators identified or selected
a. Basic Number
b. Advanced Number
Cross-cutting themes identified
c. Gender Yes/No
d. Data integration strategy or tools Yes/No
ii. Data MaturityData Quality/Availability (DQ&A) Assessment
General
Frequency 2 times/year
1/year
<1/year
Tool Completion
i. Overall rate or percent of completion %
ii. Reasons for non-completion Text
iii. Validation of tool (by appropriate authority) Yes/No

78 An Innovative Data Toolkit for City Management | Step 6: How to Use this Toolkit
ii. Data MaturityData Quality/Availability (DQ&A) Assessment
Governance and citizenship
a. Overall DQ&A Score Number
Economy
b. Overall DQ&A Score Number
Environment
c. Overall DQ&A Score Number
Service Delivery
d. Overall DQ&A Score Number
iii. Enabler Assessment Assessment Scores
Mandate Resourcing Incentives & Accountability
Coordination & Governance
Non-government Ecosystem
Governance & Citizenship
Economy
Environment
Service Delivery
iv. Data Management
1. Data collection
2. Data storage
3. Data analysis
4. Data dissemination
5. Key challenges---

79
vi. Data Innovations
1. GIS Yes/No
2. Crowdsourced data Yes/No
v. Data Enablers
ICT capacity
a. Technical infrastructure Good/Medium/Poor
b. ICT skills Good/Medium/Poor
Key challenges--
Human capacity
d. General skills Good/Medium/Poor
e. Staff retention Good/Medium/Poor
f. Staff progression Good/Medium/Poor
Key challenges--
Process standardization
g. Standards, policies and procedures Good/Medium/Poor
h. Security and privacy Good/Medium/Poor
i. Coordination Good/Medium/Poor
j. Quality control Good/Medium/Poor

80 An Innovative Data Toolkit for City Management | Step 6: How to Use this Toolkit
B. Data Utilization
1. Identification of key gaps Number of gaps identified
2. Resources to address gaps provided Financial (Yes/No)
Human resource (Yes/No)
Technical (Yes/No)
3. Top priority areas for focus identified Yes/No
4. Cost/benefit analyses of different investment strategies Yes/No
5. Frequency or timeliness of data updates > 2 times/year
2 times/year
1/year
<1/year
Never
6. Action taken on basis of data No action taken to date
Some action taken
All actions proposed taken
6.9 Analysis, use and dissemination The Data Toolkit Monitoring and Evaluation Framework is responsible for generating qualitative and quantitative data. Collection of this data is only the first part of the monitoring and evaluation process. Of equal importance is the accurate and timely recording of this data in a suitable format so the data can then be analysed to determine trends, achievements and outcomes.
The Monitoring and Evaluation Framework can be entered into a simple MS Excel-based spreadsheet or other relational database designed in such a way so that information can be recorded electronically easily and rapidly in addition to being analysed for the performance of the entire programme in accordance with the key parameters.
6.9.1 Data entry proceduresThe key consideration for data entry for the Monitoring and Evaluation Framework is that it must be done regularly and accurately. The survey tools and data gathering should take place periodically, and the data immediately entered into the database for safe and secure storage and analysis.
The Data Toolkit Monitoring and Evaluation Tracking Table consists of a single Excel worksheet (see Annexure) that lists all the above parameters with corresponding cells where their score for a reporting period is entered.
The specific achievement under each parameter is entered into the relevant cell of the table, the change from the previous reporting period is noted, and any additional contextual or explanatory information regarding the achievement for the specified period should be provided. When the value for each of these parameters is entered into the database for a given period of time, the worksheet can be copied and pasted or printed into narrative reports for easy reference.
Performance and analysis of individual values over time can be further discussed in the narrative reports.
6.9.2 ReportingThe conclusions from the analysis of the data collected above should be reported to relevant stakeholders using standard reporting formats.
The city management should prepare the reports in consultation with all stakeholders prior to the reporting date. Additional narrative reporting will be necessary for these reports on individual data parameters to discuss challenges to achievement of targets (if applicable) or reasons for surpassing specific targets.

81
Note that additional levels of analysis of the information that may be of interest to stakeholders can also be presented. It may be of value to the city management to perform additional analysis on specific areas to highlight trends between areas or over time. This is particularly relevant with respect to much of the qualitative information related to the examples of challenges or changes that FCA stakeholders provide. Such information, while quantifiable in aggregate, requires further analysis and explanation in narrative reporting to ensure appropriate detail and context is communicated in progress reports.
6.10 Quality control
6.10.1 The importance of ‘good’ dataGood data are needed to inform the design of interventions and to monitor and evaluate progress.
In order for both targets and the measurement of progress towards these to be meaningful and realistic, the quality of the data on which they are based must meet minimum standards of acceptability. Similarly, progress reports will only offer stakeholders a concise and accurate reflection of whether the programme is working, if the supporting data are of high quality.
In its most basic sense, data quality means that the information collected as part of the data toolkit monitoring framework adequately represents the activities being undertaken by stakeholders.
‘Adequately represents’ means that the information is accurate and reliable. Accurate information is interpreted as measuring what one intends to measure (that the information is correct), and reliable information implies that it has been collected and measured in the same way (consistently) by relevant stakeholders during all reporting periods.
More specifically, the Data Toolkit Monitoring Framework adequately represents activities, if the data have qualities of completeness, precision, timeliness, and integrity, along with being accurate and reliable.
To ensure data quality in the application of the data toolkit, stakeholders with responsibility for monitoring need to ensure that the data collected through the monitoring and evaluation system is the following.
Valid To ensure validity of data, the following principles of data collection will be followed:
• Use of accurate measurement tools in collecting data. The above monitoring tools are designed to capture the precise data required to assess implementation of the data toolkit.
• Collection of complete data. The parameters proposed above to report on progress and impact have been designed with specific performance in mind.
• Elimination of bias. To ensure that information collected is objective, stakeholders entering data should provide crosschecks to ensure personal preferences or bias on the part of the responders are eliminated. City management should provide a second level of review of data on a periodic basis.
Camparison over Time
• Comparison of data (quaity and availability) and enabler metrics over time• Intra theme and inter theme applicability
• Comparison of movement in data and enabler scores between similar jurisdictions socres between similar jurisdictions (e.g. of same typology and with similar structural scores)• National or International applicability
• Establishment of likages between specific initiatives (e.g. legislation to improve mandate) and outcomes (data quality decisions)• National or International applicability
Camparison overJurisdictions
Root Cause Assessment of Improvements
FIGURE 24: LAYERS OF ANALYSIS POSSIBLE WITH THE MONITORING AND EVALUATION DATA

82 An Innovative Data Toolkit for City Management | Step 6: How to Use this Toolkit
Reliable
To maximize reliability of conclusions, data collection should be consistent from year to year and from place to place.
• A consistent data collection method should be used.• The same data collection tools and parameters and
procedures should be used.
Timely
This refers to two elements:
• Frequency: data is collected on a frequent enough basis to inform the changes over time.
• Currency: data is sufficiently up to date to reflect the current situation.
The above data collection tools have been designed to provide information on a regular basis to present a timely picture of progress of rollout of the data toolkit and outcomes or impact – this is recommended to be at a minimum of an annual basis, with quarterly or six-monthly updates being an optimum time period.
6.10.2 Mitigation of typical data errorsThe following are some of the typical data errors that monitoring and evaluation systems are prone to and strategies for their prevention.
Measurement Error
This results primarily from the poor design or management of a data collection process. Measurement error can result from the following:
• Sampling error (unrepresentative samples) • Poor design of the data-collection instrument• Poorly trained or partisan data collectors• Incomplete or untruthful answers from respondents.
Managers should crosscheck all data collected for these errors.
Transcription Error
Transcription error can result from poor qualifications, ineffective training of staff or inappropriate tools for data entry (either bad design or overcomplication) such as:
• Errors in copying• Data entry errors• Rounding.
City management should crosscheck data entry by staff and provide periodic oversight and review a sample of data taken from hard-copy records to detect and reduce such errors.
To reduce the chances of measurement or transcription errors, the above data collection and data entry instruments and tools have been designed in as simple a format as possible. All staff members responsible for data collection and entry should be trained in the use of the tools prior to their implementation, and management should be available to provide technical assistance and training to staff on an ongoing basis.
6.10.3 Database securitySecurity of the data contained in the monitoring and evaluation databases is of crucial importance. Security has two dimensions.
I. Security of the data for confidentiality reasons. The data gathered by city management are the property of the city or its stakeholders and they are confidential. It is important that respondents trust that the information they give to staff is done in confidence. Therefore, every effort should be made to ensure that the data are kept on a computer in a secure location and are not available to anyone outside the relevant stakeholder group without management authorization.
II. Safety of data. The data that will be gathered and entered into the databases by responsible staff are crucial to the performance measurement and reporting on achievements to city management and other stakeholders. Therefore, all measures must be taken to ensure that the data held in the databases are kept secure from deletion or loss.
In addition, any hard copies of completed monitoring tools, forms and reports should be filed securely for future reference, in case problems arise with the electronic databases.
6.11 Planning for rollout
6.11.1 Monitoring plan developmentAs discussed above, the implementation of the proposed tools requires key decision on the frequency of application of the tools (for example, quarterly, six-monthly or annually). City management will need to decide what the most appropriate frequency for application is based on available resources and the level of implementation of the data toolkit (that is, the rate of change of performance resulting from implementation that can be detected via the monitoring framework).
Once decisions regarding this have been made, workplans should be completed to note the process for rolling out the monitoring framework. Such plans may include travel schedules to individual stakeholders and specific activities. This enables supervisors and staff to plan for and efficiently complete the following operations:
• Prepare transportation• Plan logistics planning (transport and
accommodation)• Ensure stakeholder staff are available to meet
the monitoring officer• Adjust monitoring targets to ensure all planned
stakeholders will be visited in accordance with plans• Provide staff cover, if there is any vacation planned• Ensure data is analysed and reported on in
a timely manner• Ensure all relevant stakeholders are included for
dissemination of results.

83
There is no one ‘best-fit’ solution to such a planning process – each plan should be prepared on an individual basis by stakeholders to reflect their own resources, capacities, workloads and other criteria.
6.11.2 Management and capacity development To implement the monitoring framework effectively, minimal resource commitments, management and staff capacity are required. The framework, as laid out in this document, is geared towards a minimum level of implementation that requires the following resources.
The city management stakeholder staff member(s) who are responsible for implementation of the monitoring and evaluation framework should have the basic monitoring and evaluation skills required to roll out the strategy.
6.11.3 Resource considerationsOne of the aims in preparing this monitoring framework is to ensure the minimum resource requirements to implement it. As such, very little dedicated resources will be required, other than stakeholder staff time and effort
to roll out the monitoring tools on a periodic basis to conduct the necessary analysis of the data being collected and report on it to the appropriate stakeholders.
At a minimum, successful implementation of the framework will require delegation of responsibility to at least one existing city staff member. If responsibility is delegated in this manner, the framework will rely heavily on data reported from a range of external stakeholders to provide information on the progress of the initiative. The staff member responsible for monitoring will handle receiving, inputting and analysing data and may undertake verification activities with other stakeholders to assess the data being collected.
Although adjustments might be made to work around staff schedules or to accommodate travel to far-off field sites, a typical monitoring schedule may comprise two to three days of work per month. An illustrative objective would be to contact all relevant stakeholders for data collection once over the course of a six-monthly reporting cycle and enter or analyse the data, as well as generate management reports.
The following summarizes the main resources required to implement the framework:
Monitoring & evaluation stakeholders
Resource requirements for effective monitoring & evaluation
Key capacities Potential capacity building activities
City management stakeholders
• Qualitative interviewing of stakeholders from different sectors
• Time for review and quality control of data and analysis
• Qualitative research skills
• Data analysis and review skills
• Training in qualitative research
Stakeholder staff with responsibility for data collection
• Qualitative interviewing of stakeholders from different sectors
• Analysis of Data Toolkit implementation
• Time for facilitation of discussions with stakeholders to elicit examples of change
• Data entry and analysis• Detailed inputs to reports
• Quantitative and qualitative survey/research skills
• Facilitation and interviewing skills
• Basic database skills (MS Excel)
• Report writing skills
• Training in qualitative and quantitative research
• Survey design and implementation
• Participative facilitation and interviewing
• MS Excel/database management skills
• Data analysis and report writing
Item Resource Cost Notes
Human resources – management 1-2 days per month Oversight of data collection/analysis, review of monitoring reports
Human resources – monitoring delegate
2-4 days per month, depending on monitoring/reporting cycle
Collection and entry of data, generation of reports
Human resources – technical staff <1 day per month Technical assistance with data identification, entry or database management
Software MS Excel, MS Word – likely no additional cost required
This software is generally present on all information technology systems.

84 An Innovative Data Toolkit for City Management | Annexure
Basic Indicator Set
# Data point Category
1 General63 Base population split by age group and gender
2 General Net immigrant population
3 General Land area, disaggregated by use
4 General Total number of households
5 General Women headed households
6 General Gross Enrolment Ratio (GER) – Primary, Secondary, Tertiary
7 General Women GER – Primary, Secondary, Tertiary
8 General Economically active population under 15
9 General Total expenditure on poverty reduction programmes
10 General Percentage of citizens with bank account
11 General Percentage of women with bank account
12 General Number of households living in slums
13 General Area covered by slums
14 General Amount of land allotted for government functions
15 General Amount of land allotted for government functions that lies vacant
16 General No. Households without registered legal titles
17 General Deaths from communicable diseases
18 General Infant Mortality Rate
19 General Maternal Mortality Rate
20 General Under-5 Mortality Rate
21 General Crime rate by type and number of crimes
22 Governance & Citizenship City budget
23 Governance & Citizenship Capital budget as % of city budget
ANNEXUREAnnex 1: Indicator sets
63 Includes population, poverty, health, education, safety and other key data categories not covered directly under the FCA themes.
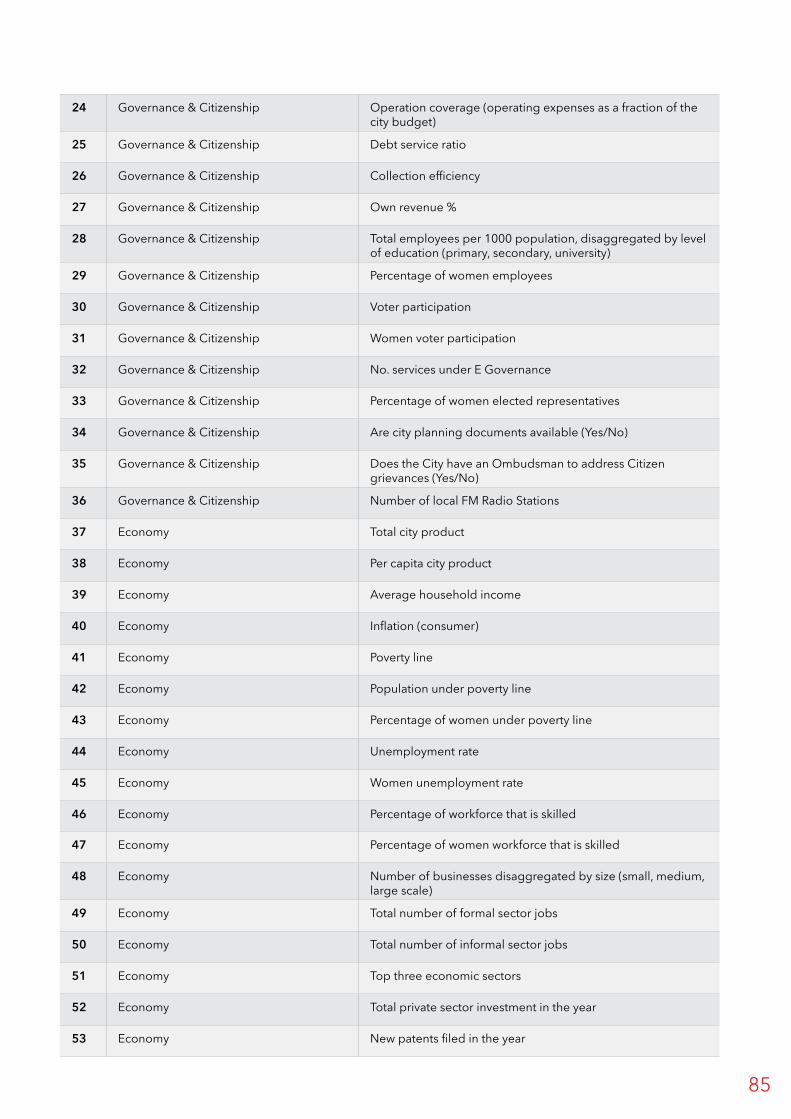
85
24 Governance & Citizenship Operation coverage (operating expenses as a fraction of the city budget)
25 Governance & Citizenship Debt service ratio
26 Governance & Citizenship Collection efficiency
27 Governance & Citizenship Own revenue %
28 Governance & Citizenship Total employees per 1000 population, disaggregated by level of education (primary, secondary, university)
29 Governance & Citizenship Percentage of women employees
30 Governance & Citizenship Voter participation
31 Governance & Citizenship Women voter participation
32 Governance & Citizenship No. services under E Governance
33 Governance & Citizenship Percentage of women elected representatives
34 Governance & Citizenship Are city planning documents available (Yes/No)
35 Governance & Citizenship Does the City have an Ombudsman to address Citizen grievances (Yes/No)
36 Governance & Citizenship Number of local FM Radio Stations
37 Economy Total city product
38 Economy Per capita city product
39 Economy Average household income
40 Economy Inflation (consumer)
41 Economy Poverty line
42 Economy Population under poverty line
43 Economy Percentage of women under poverty line
44 Economy Unemployment rate
45 Economy Women unemployment rate
46 Economy Percentage of workforce that is skilled
47 Economy Percentage of women workforce that is skilled
48 Economy Number of businesses disaggregated by size (small, medium, large scale)
49 Economy Total number of formal sector jobs
50 Economy Total number of informal sector jobs
51 Economy Top three economic sectors
52 Economy Total private sector investment in the year
53 Economy New patents filed in the year

86 An Innovative Data Toolkit for City Management | Annexure
54 Environment Total green cover
55 Environment Public outdoor recreation space
56 Environment Total wetland area
57 Environment Total area of water bodies
58 Environment Total area of agricultural land
59 Environment Total area of barren land
60 Environment Total water source availability
61 Environment Ground water level
62 Environment Ground water quality (index)
63 Environment Percentage of households using solid fuel
64 Environment Total energy consumption
65 Environment Energy share from renewable sources
66 Environment Mean annual rainfall for the city
67 Environment GHG emissions in the year for the city
68 Environment Mean annual temperature for the city
69 Environment Air quality for the city (index)
70 Environment Total vehicle fuel consumption
71 Environment Population living in disaster-prone areas
72 Environment Causalities from natural disasters
73 Environment Direct economic loss from natural disasters
74 Environment Indirect economic loss (opportunity cost) from natural disasters
75 Service Delivery Percentage of households with access to electricity
76 Service Delivery Percentage of households with access to piped water
77 Service Delivery Percentage of households with access to sanitary toilet
78 Service Delivery Water supply in litre per capita per day (LPCD)
79 Service Delivery Price of potable drinking water
80 Service Delivery Water supply budget for the year
81 Service Delivery User charge recovery for water
82 Service Delivery Solid waste generated per year
83 Service Delivery Hazardous waste generated per year

87
84 Service Delivery Hazardous waste treated per year
85 Service Delivery Solid waste collection efficiency
86 Service Delivery Solid waste recycling percentage
87 Service Delivery Solid waste being landfilled scientifically
88 Service Delivery Solid waste incinerated
89 Service Delivery Solid waste management annual budget
90 Service Delivery User charge recovery from solid waste management
91 Service Delivery Number of operational public toilets
92 Service Delivery Number of households connected to septic tanks
93 Service Delivery Total sewerage treated in the year
94 Service Delivery Total storm water drain length
95 Service Delivery Sanitation budget for the year
96 Service Delivery User charge recovery from sanitation services
97 Service Delivery Share of non-motorized transport
98 Service Delivery Share of public transport
99 Service Delivery Total number of commuters in the year
100 Service Delivery Total road length
101 Service Delivery Public transportation total annual budget
102 Service Delivery User charge recovery from transportation services
103 Service Delivery Number of mobile connections
104 Service Delivery Number of Internet connections

88 An Innovative Data Toolkit for City Management | Annexure
The above set of indicators is also aligned to the Sustainable Development Goals (2015 – 2030) and the Africa Agenda 2063. The below table outlines the alignment between these agendas:
No Africa Agenda 2063 themes SDG themes Toolkit Indicators
1 High standard of living, quality of life and well-being for all citizens
Goals 1, 2, 8 and 11 9, 10, 16, 12, 22
2 Well educated citizens and skill revolution underpinned by science, technology and innovation
Goal 4 52, 53, 103, 104,
3 Healthy and well-nourished citizens Go al 3 17, 18, 19, 20,
4 Transformed economies Goal 5 2, 37 to 44, 49 to 52,
5 Modern agriculture for increased productivity and production
Goal 2 Not in scope
6 Blue economy for accelerated economic growth Goal 14 Not in scope
7 Environmentally sustainable and climate resilient economies and communities
Goal 6, 7, 13 and 15 54 to 74
8 A united Africa - Not in scope
9 Continental financial and monetary institutions established and functional
- Not in scope
10 World class infrastructure criss-cross Africa Goal 9 75 to 102
11 Democratic values, practices, universal principles of human rights, justice and the rule of law entrenched
Goal 16 22 to 35
12 Capable institutions and transformative leadership in place
Goal 16
13 Peace, security and stability is preserved Goal 16 21
14 A stable and peaceful Africa - Not in scope
15 A fully functional and operational African Peace and Security Architecture (APSA)
- Not in scope
16 African cultural renaissance is pre-eminent - Not in scope
17 Full gender equality in all spheres of life Goal 5 5, 7, 11, 45, 47
18 Engaged and empowered youth and children Goals 4 and 5 Across
19 Africa as a major partner in global affairs and peaceful co-existence
Goal 17 Not in scope
20 Africa takes full responsibility for financing development goals
Goals 10, 17 Not in scope
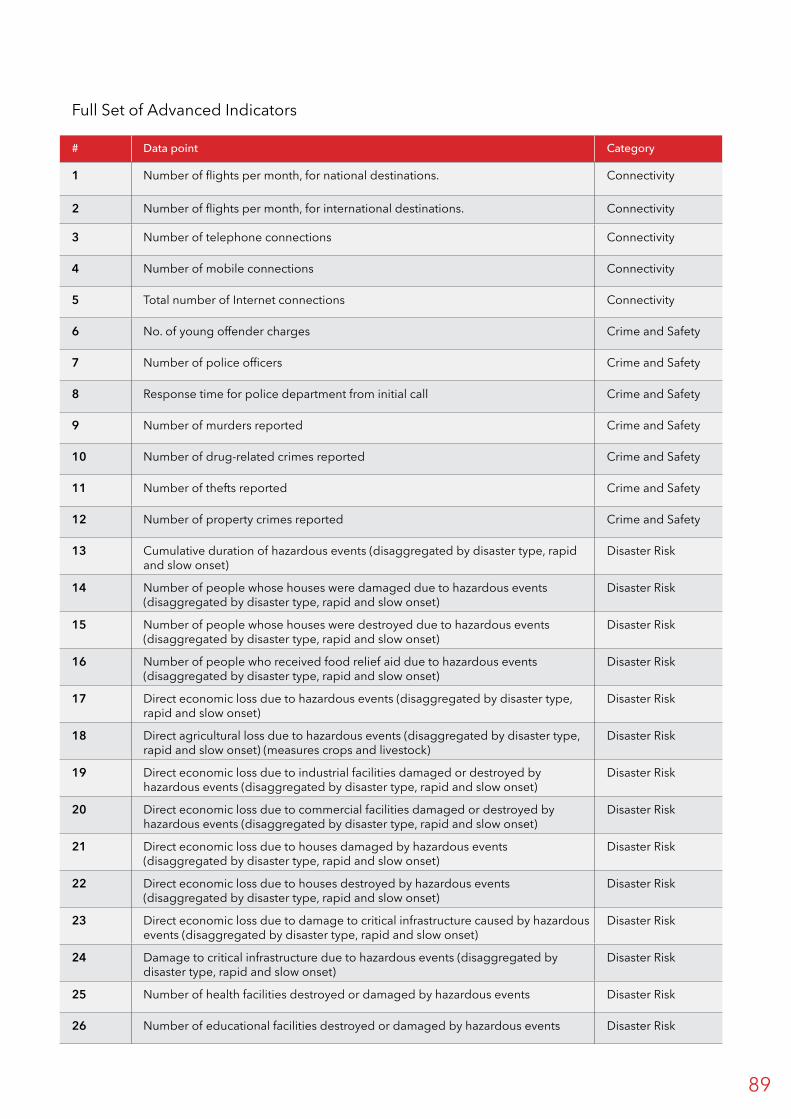
89
Full Set of Advanced Indicators
# Data point Category
1 Number of flights per month, for national destinations. Connectivity
2 Number of flights per month, for international destinations. Connectivity
3 Number of telephone connections Connectivity
4 Number of mobile connections Connectivity
5 Total number of Internet connections Connectivity
6 No. of young offender charges Crime and Safety
7 Number of police officers Crime and Safety
8 Response time for police department from initial call Crime and Safety
9 Number of murders reported Crime and Safety
10 Number of drug-related crimes reported Crime and Safety
11 Number of thefts reported Crime and Safety
12 Number of property crimes reported Crime and Safety
13 Cumulative duration of hazardous events (disaggregated by disaster type, rapid and slow onset)
Disaster Risk
14 Number of people whose houses were damaged due to hazardous events (disaggregated by disaster type, rapid and slow onset)
Disaster Risk
15 Number of people whose houses were destroyed due to hazardous events (disaggregated by disaster type, rapid and slow onset)
Disaster Risk
16 Number of people who received food relief aid due to hazardous events (disaggregated by disaster type, rapid and slow onset)
Disaster Risk
17 Direct economic loss due to hazardous events (disaggregated by disaster type, rapid and slow onset)
Disaster Risk
18 Direct agricultural loss due to hazardous events (disaggregated by disaster type, rapid and slow onset) (measures crops and livestock)
Disaster Risk
19 Direct economic loss due to industrial facilities damaged or destroyed by hazardous events (disaggregated by disaster type, rapid and slow onset)
Disaster Risk
20 Direct economic loss due to commercial facilities damaged or destroyed by hazardous events (disaggregated by disaster type, rapid and slow onset)
Disaster Risk
21 Direct economic loss due to houses damaged by hazardous events (disaggregated by disaster type, rapid and slow onset)
Disaster Risk
22 Direct economic loss due to houses destroyed by hazardous events (disaggregated by disaster type, rapid and slow onset)
Disaster Risk
23 Direct economic loss due to damage to critical infrastructure caused by hazardous events (disaggregated by disaster type, rapid and slow onset)
Disaster Risk
24 Damage to critical infrastructure due to hazardous events (disaggregated by disaster type, rapid and slow onset)
Disaster Risk
25 Number of health facilities destroyed or damaged by hazardous events Disaster Risk
26 Number of educational facilities destroyed or damaged by hazardous events Disaster Risk

90 An Innovative Data Toolkit for City Management | Annexure
27 Kilometres of paved and unpaved road destroyed or damaged by hazardous events
Disaster Risk
28 Kilometres of railways destroyed or damaged by hazardous events Disaster Risk
29 Number of ports destroyed or damaged by hazardous events Disaster Risk
30 Number of airports destroyed or damaged by hazardous events Disaster Risk
31 Amount of time basic services have been disrupted due to hazardous (healthcare, education, transport, ICT, water supply, power/energy system, and emergency response)
Disaster Risk
32 Number of people who are covered by multi-hazard early warning system Disaster Risk
33 Average annual household income Economy
34 No. of individuals whose major income earning activity is part of the informal sector.
Economy
35 No. of unemployed individuals (above 15 “without work, currently available for work and seeking work,”)
Economy
36 Annual city product Economy
37 Total employment in secondary and infrastructure sector Economy
38 Total employment in consumer services sector Economy
39 Total employment in producer services sector Economy
40 Total employment in social services sector Economy
41 Proportion of average household income spent on food Economy
42 Proportion of average household income spent on shelter Economy
43 Proportion of average household income spent on travel Economy
44 Proportion of average household income spent on utilities Economy
45 Proportion of average household income spent on others Economy
46 Investment by sector Economy
47 Annual no. of national visitors in the city Economy
48 Annual no. of international visitors in the city Economy
49 Annual expenditure by national tourists Economy
50 Annual expenditure by international tourists Economy
51 List of ten major construction or engineering projects conducted in or affecting the city, together with the total budget of each
Economy
52 Expected cost per stay per day of executives visiting the city, including normal hotel and living expenses
Economy
53 All outstanding credits in commercial and government financial institutions Economy
54 Number of business permits issued in the past five years Economy
55 Enterprise profits or losses, listed for any major enterprises Economy

91
56 No. of literate adults Education
57 No. of male tertiary graduates in the adult population Education
58 No. of female tertiary graduates in the adult population Education
59 Average number of years spent in full-time education or equivalent by male adults
Education
60 Average number of years spent in full-time education or equivalent by female adults
Education
61 No. of children enrolled in primary schools Education
62 No. of children enrolled in secondary schools Education
63 Total no. of classrooms, primary Education
64 Total no. of classrooms, secondary Education
65 Energy prices, by fuel, wholesale Energy
66 Energy prices, by fuel, retail Energy
67 Percent distribution of solid cooking fuel – Non-slum Energy
68 Percent distribution of solid cooking fuel – Slum Energy
69 Percent distribution of solid cooking fuel – Urban Energy
70 Total energy derived from renewable sources Energy
71 Sunshine hours per day Energy
72 Average wind speed (10 m above ground) Energy
73 Mean indoor temperature Energy
74 Total household energy expenditure Energy
75 Number of households spending >10% of income on fuel Energy
76 Greenhouse gas emissions in million tCO2e (MtCO2e) Energy
77 Mean rainfall, by month Energy
78 Mean temperature Energy
79 Total amount of solid waste generated annually Environment
80 Total volume of wastewater generated annually Environment
81 Total volume of wastewater treated annually Environment
82 Average fraction of Biochemical Dissolved Oxygen (BOD) removed in major wastewater receiving bodies
Environment
83 Number of days per annum that World Health Organization (WHO) standards are exceeded for SO2
Environment
84 Number of days per annum that WHO standards are exceeded for NOx Environment
85 Number of days per annum that WHO standards are exceeded for CO Environment

92 An Innovative Data Toolkit for City Management | Annexure
86 Number of days per annum that WHO standards are exceeded for O3 Environment
87 Number of days per annum that WHO standards are exceeded for suspended particulates
Environment
88 Number of days per annum that WHO standards are exceeded for lead Environment
89 Total energy usage per annum in metric tons of coal equivalent. Environment
90 Number of complaints on domestic, industrial or traffic noise received Environment
91 Total solid waste disposed in a sanitary landfill Environment
92 Total solid waste disposed by dumping or burning in the open Environment
93 Total solid waste recycled Environment
94 Total solid waste disposed in other means Environment
95 City poverty line Equity
96 No. of women-headed households in poverty Equity
97 No. of employed or economically active persons under 15 years of age. Equity
98 No. of individuals below the poverty line Equity
99 Capital expenditure on poverty reduction programmes Equity
100 Recurrent expenditure on poverty reduction programmes Equity
101 Number of households with access to formal financial services Equity
102 Automation of receipts collection Governance
103 Automation of salary payment Governance
104 Automation of general finances Governance
105 Automation of business permits Governance
106 Functions of local government Governance
107 Percent of budgeted expenditure on annual plan delivered Governance
108 Proportion of adult male voters who voted in last municipal elections Governance
109 Proportion of adult female voters who voted in last municipal elections Governance
110 Autonomy in closing down the council or removing councillors from office Governance
111 Autonomy in setting local tax levels Governance
112 Autonomy in setting user charges for services Governance
113 Autonomy in borrowing funds Governance
114 Autonomy in choosing contractors for projects. Governance
115 Percentage of grant funds from higher government known in advance of local budget setting
Governance

93
116 Number of male elected and nominated councillors Governance
117 Number of female elected and nominated councillors Governance
118 Proportion of planning applications refused, by local or higher government Governance
119 Availability of city annual report Governance
120 Availability of city strategy/vision Governance
121 Availability of city economic strategy Governance
122 Availability of city social strategy Governance
123 Annual number of public local government meetings and total attendance Governance
124 Time taken to obtain planning permission for a typical subdivision Governance; Urban Land
125 Automation of land registration Governance; Urban Land
126 No. of hospital beds in the city Health
127 No. of child deaths before the age of 1 Health
128 No. of child deaths before the age of 5 Health
129 No. of deaths from infectious diseases Health
130 No. of females practicing family planning in some form Health
131 No. of single family houses Housing
132 No. of medium-density houses Housing
133 No. of apartments Housing
134 No. of temporary dwellings Housing
135 No. of households where housing tenure is owned or purchased Housing
136 No. Of households where housing tenure is private rental Housing
137 No. of households where housing tenure is social housing Housing
138 No. of households where housing tenures is subtenant housing Housing
139 No. of households where housing tenures is rent-free housing Housing
140 No. of households where housing tenures is squatter - no rent Housing
141 No. of households where housing tenures is squatter - paying rent Housing
142 No. of households where housing tenures is other Housing
143 Median house price Housing
144 Median annual rent Housing
145 Median annual renter household income Housing

94 An Innovative Data Toolkit for City Management | Annexure
146 Median floor area per person in sq.mt. Housing
147 No. of housing stock in compliance with local codes Housing
148 No. of Homeless people Housing
149 Total mortgage credit Housing
150 No. of dwellings that have mortgages Housing
151 Proportion of mortgage loans held by women Housing
152 Number of dwellings produced annually Housing
153 Number of formal dwellings produced annually on new vacant land Housing
154 Number of formal dwellings produced annually as net conversions or infill from other uses (can be negative).
Housing
155 Number of informal dwellings produced annually on new vacant land Housing
156 Number of informal dwellings produced annually as net conversions or infill from other uses (can be negative).
Housing
157 No. of households regularized Housing
158 No. of households resettled Housing
159 Total net housing expenditures by all levels of government on dwelling construction, rent support, etc., per person.
Housing
160 Urban or built-up land Land Use, Land Cover
161 Urban or built-up land - Residential Land Use, Land Cover
162 Urban or built-up land - Commercial and services Land Use, Land Cover
163 Urban or built-up land - Industrial Land Use, Land Cover
164 Urban or built-up land - Transportation, communications, and utilities Land Use, Land Cover
165 Urban or built-up land - Industrial and commercial complexes Land Use, Land Cover
166 Urban or built-up land - Mixed urban or built-up land Land Use, Land Cover
167 Urban or built-up land - Other urban or built-up land Land Use, Land Cover
168 Agricultural land Land Use, Land Cover
169 Agricultural land - Cropland and pasture Land Use, Land Cover
170 Agricultural land - Horticultural areas Land Use, Land Cover
171 Agricultural land - Confined feeding operations Land Use, Land Cover
172 Agricultural land - Other agricultural land Land Use, Land Cover

95
173 Rangeland Land Use, Land Cover
174 Rangeland - Herbaceous rangeland Land Use, Land Cover
175 Rangeland - Shrub and brush rangeland Land Use, Land Cover
176 Rangeland - Mixed rangeland Land Use, Land Cover
177 Forest land Land Use, Land Cover
178 Forest land - Deciduous forest land Land Use, Land Cover
179 Forest land - Evergreen forest land Land Use, Land Cover
180 Forest land - Mixed forest land Land Use, Land Cover
181 Area covered by water bodies Land Use, Land Cover
182 Water - Streams and canals Land Use, Land Cover
183 Water - Lakes Land Use, Land Cover
184 Water - Reservoirs Land Use, Land Cover
185 Water - Bays and estuaries Land Use, Land Cover
186 Wetland Land Use, Land Cover
187 Wetland - Forested wetland Land Use, Land Cover
188 Wetland - Non-forested wetland Land Use, Land Cover
189 Barren land Land Use, Land Cover
190 Barren land - Dry salt flats Land Use, Land Cover
191 Barren land - Beaches Land Use, Land Cover
192 Barren land - Sandy areas other than beaches Land Use, Land Cover
193 Barren land - Bare exposed rock Land Use, Land Cover
194 Barren land - Strip mines quarries, and gravel pits Land Use, Land Cover
195 Barren land - Transitional areas Land Use, Land Cover
196 Barren land - Mixed barren land Land Use, Land Cover
197 Revenue through taxes Local Government Finance
198 Revenue through user charges Local Government Finance

96 An Innovative Data Toolkit for City Management | Annexure
199 Revenue through other own source income, including interest and principal received, sales of capital items
Local Government Finance
200 Revenue through governmental transfers Local Government Finance
201 Revenue through loans and bonds Local Government Finance
202 Revenue through other income including any other income, such as donations or aid
Local Government Finance
203 Annual capital expenditure Local Government Finance
204 Annual recurrent expenditure Local Government Finance
205 Percentage of liabilities actually collected Local Government Finance
206 Costs of collecting property tax as a percentage of receipts passing to the local government
Local Government Finance
207 Total principal and interest repaid, including bond maturations Local Government Finance
208 Total local government employees Local Government Finance
209 Proportion of recurrent expenditure spent on wage costs Local Government Finance
210 Proportion of recurrent expenditure spent on contracted activities Local Government Finance
211 Resident population of municipal area Population
212 City population during daytime working hours Population
213 Annual net migration Population
214 No. of males and females in age categories (5-year) Population
215 No. of households Population
216 No. of men-headed households Population
217 No. of women-headed households Population
218 No. of single-person households Population
219 No of adults-only household Population
220 No. of single-parent families Population
221 No. of households with adults and children Population
222 No. of individuals in informal settlements Population
223 No. of married couples Population
224 Total live births: Male Population
225 Total live births: Female Population
226 Total live births: Others Population

97
227 Adolescent fertility (no. of births per 1,000 women ages 15-19) Population
228 Total fertility rate Population
229 Age of women at birth of first child Population
230 Age at first marriages, by sex Population
231 No. of legal abortions Population
232 Death: All causes Public Health
233 Death: Infectious and parasitic diseases Public Health
234 Death: Infectious and parasitic diseases - Diarrheal diseases Public Health
235 Death: Infectious and parasitic diseases - Malaria Public Health
236 Death: Infectious and parasitic diseases - Dengue Public Health
237 Death: Respiratory infections Public Health
238 Death: Respiratory infections - Lower respiratory infections Public Health
239 Death: Respiratory infections - Upper respiratory infections Public Health
240 Death: Respiratory infections - Otitis media Public Health
241 Death: Respiratory infections - Pneumonia Public Health
242 Death: Perinatal conditions Public Health
243 Death: Perinatal conditions - Prematurity and low birth weight Public Health
244 Death: Perinatal conditions - Birth asphyxia and birth trauma Public Health
245 Death: Perinatal conditions - Neonatal infections and other conditions Public Health
246 Death: Nutritional deficiencies Public Health
247 Death: Injuries and drowning Public Health
248 Household connections (across water, sanitation, solid waste, transport) Services - All
249 Annual investment in each arm of urban infrastructure Services - All
250 Operations and maintenance expenditure on each service Services - All
251 Total revenues Services - All
252 Total expenditure Services - All
253 No of employees Services - All
254 List of providers Services - All
255 Nonrevenue electricity - Line loss for electricity Services - Electricity
256 Total megawatt hours of electricity supplied, disaggregated by consumer type - residential, commercial, industrial, governmental, informal, other
Services - Electricity

98 An Innovative Data Toolkit for City Management | Annexure
257 Total residential electrical energy use Services - Electricity
258 Total commercial electrical energy use Services - Electricity
259 Energy (electricity) consumption of public buildings per year (kWh/m²) Services - Electricity
260 Total electrical energy use (kWh/year) Services - Electricity
261 Average number of electrical interruptions per customer per year Services - Electricity
262 Average length of electrical interruptions (in hours) Services - Electricity
263 No. of households using sewage pipe disposal Services - Sanitation
264 No. of households using septic tank (treated) disposal Services - Sanitation
265 No. of households using underground pit (untreated) disposal Services - Sanitation
266 No. of households using underground communal disposal Services - Sanitation
267 No. of households using pan collection disposal Services - Sanitation
268 No. of households using open defecation disposal Services - Sanitation
269 No. of households using other disposal methods Services - Sanitation
270 Access to composting toilet Services - Sanitation
271 Access to improved flush toilet Services - Sanitation
272 Access to improved pit latrine Services - Sanitation
273 Access to improved toilet Services - Sanitation
274 Access to pit latrine without slab Services - Sanitation
275 Access to slab or covered pit latrine Services - Sanitation
276 Operations and maintenance expenditure on public toilets (owned and leased) Services - Sanitation
277 Total number of operational public toilets (owned and leased) Services - Sanitation
278 Total number of public toilets Services - Sanitation
279 Total solid waste Collected, disaggregated by source - residential, commercial, industrial, governmental, informal, other
Services - SWM
280 Total collected municipal solid waste per capita Services - SWM
281 Percentage of the city's solid waste that is recycled Services - SWM
282 Percentage of the city's solid waste that is disposed of in a sanitary landfill Services - SWM
283 Percentage of the city's solid waste that is disposed of in an incinerator Services - SWM
284 Percentage of the city's solid waste that is burned openly Services - SWM
285 Percentage of the city's solid waste that is disposed of in an open dump Services - SWM
286 Percentage of the city's solid waste that is disposed of by other means Services - SWM
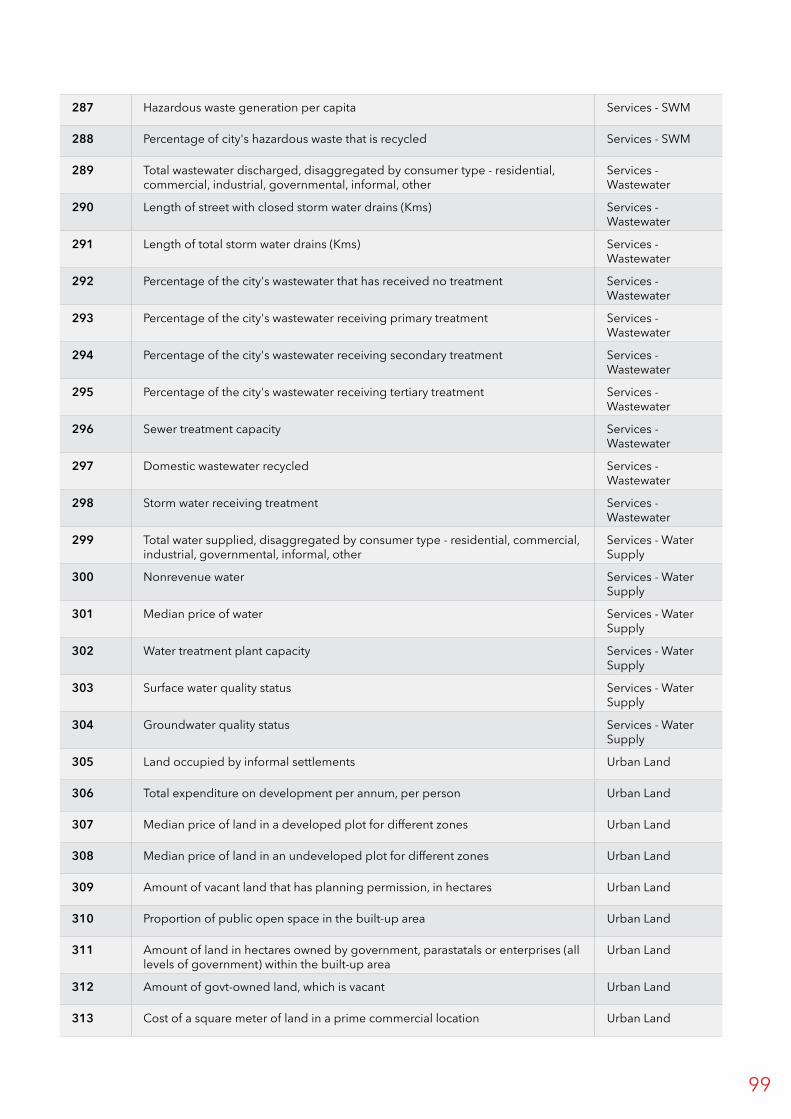
99
287 Hazardous waste generation per capita Services - SWM
288 Percentage of city's hazardous waste that is recycled Services - SWM
289 Total wastewater discharged, disaggregated by consumer type - residential, commercial, industrial, governmental, informal, other
Services - Wastewater
290 Length of street with closed storm water drains (Kms) Services - Wastewater
291 Length of total storm water drains (Kms) Services - Wastewater
292 Percentage of the city's wastewater that has received no treatment Services - Wastewater
293 Percentage of the city's wastewater receiving primary treatment Services - Wastewater
294 Percentage of the city's wastewater receiving secondary treatment Services - Wastewater
295 Percentage of the city's wastewater receiving tertiary treatment Services - Wastewater
296 Sewer treatment capacity Services - Wastewater
297 Domestic wastewater recycled Services - Wastewater
298 Storm water receiving treatment Services - Wastewater
299 Total water supplied, disaggregated by consumer type - residential, commercial, industrial, governmental, informal, other
Services - Water Supply
300 Nonrevenue water Services - Water Supply
301 Median price of water Services - Water Supply
302 Water treatment plant capacity Services - Water Supply
303 Surface water quality status Services - Water Supply
304 Groundwater quality status Services - Water Supply
305 Land occupied by informal settlements Urban Land
306 Total expenditure on development per annum, per person Urban Land
307 Median price of land in a developed plot for different zones Urban Land
308 Median price of land in an undeveloped plot for different zones Urban Land
309 Amount of vacant land that has planning permission, in hectares Urban Land
310 Proportion of public open space in the built-up area Urban Land
311 Amount of land in hectares owned by government, parastatals or enterprises (all levels of government) within the built-up area
Urban Land
312 Amount of govt-owned land, which is vacant Urban Land
313 Cost of a square meter of land in a prime commercial location Urban Land

100 An Innovative Data Toolkit for City Management | Annexure
314 Average prime rental cost per month of occupying prime commercial space per square meter in constant dollars
Urban Land
315 Average operating costs per month of occupying prime commercial space per square meter in constant dollars
Urban Land
316 Average statutory charges per month of occupying prime commercial space per square meter in constant dollars
Urban Land
317 Number of commercial ships leaving port (freight and passenger) Urban Transport
318 Number of commercial flights leaving per month, for national or international destinations
Urban Transport
319 Revenue-tons value of goods per annum carried by commercial carriers leaving the city
Urban Transport
320 No. of transport related deaths per 1,000 population, annually Urban Transport
321 No. of pedestrian deaths per 1,000 population, annually Urban Transport
322 No. of individuals travelling to work by private automobile Urban Transport
323 No. of individuals travelling to work by train, tram, light rail Urban Transport
324 No. of individuals travelling to work by bus/minibus Urban Transport
325 No. of individuals travelling to work by motorcycle Urban Transport
326 No. of individuals travelling to work by bicycle Urban Transport
327 No. of individuals travelling to work by walking Urban Transport
328 No. of individuals travelling to work by other means Urban Transport
329 Average time in minutes for a work trip, over all modes Urban Transport
330 Total expenditure on roads Urban Transport
331 No. of registered automobiles Urban Transport
332 Revenue for all publicly owned or subsidized mass transport organizations operating in the city
Urban Transport
333 Recurrent costs, for all publicly owned or subsidized mass transport organizations operating in the city.
Urban Transport
Annex 2: Key concerns in leveraging the cloud
InteroperabilityGiven that city governments have multiple departments that create and use data, as well as multiple applications within each department, interoperability is a key area of concern. This is a key requirement across the life cycle, including migration from legacy systems into the cloud, to operating in the cloud, closure and back migration (in the future) and so on. The U.S. National Institute of Standards and Technology (NIST) has proposed the following interoperability requirements:
1. Data Portability: This relates to the capability of moving data in and out of the cloud service environment. Typically, it is the cloud-service
data that are the concern for data portability. For cloud-service customer data, data portability is usually of most concern for SaaS cloud services, since for these services, the content, data schema and storage format are under the control of the cloud service provider. Hence, the city will need to understand on how the data can be imported into the service and exported from the service. For IaaS and PaaS services, it is typically the case that the cloud-service customer is in control of the content and schemas for the data, with the service offering basic storage capabilities such as a file system or object store and therefore, data portability might not be a concern.

101
2. System/Application Portability: This relates to the capability of moving specific application codes to or from the cloud service. This typically only applies to IaaS and PaaS services, since in the case of a SaaS service, the application source code belongs to the cloud-service provider. One of the most important factors for application portability is represented by the application environment. To port code from one cloud service to another, the target application environment must be usable by the application being ported.
3. Closure: During closure of business, the cloud provider should be obligated to support porting of its customers to another provider. If the cloud provider is unable to do so, then a regulatory mechanism may be required to port customers to another provider. Similarly, in case the service ceases (that is, the cloud provider is prohibited from providing cloud service because of a legal issue or government decision), a regulatory mechanism is needed to deal with issues that emerge.
Quality of Service Everything in cloud computing is delivered as a service, so it is essential to ensure the quality of cloud service for customer satisfaction. Specifically, to deliver guaranteed services in a cloud computing environment, one needs to explore the relationship among the maximal number of users, the minimal service resources and the optimized level of services needed. In cloud computing solutions, it is possible to specify compute, network, and storage requirements, to be shared by tenants in the same infrastructure. But due to the dynamic nature of virtualization environments and the workloads, performance can be unpredictable, which consequently affects the quality of service (QoS) available to the end customer. Therefore, the balancing act between resource utilization and workload performance in a cloud environment affects both the Cloud Service Provider (CSP) and the stakeholders of a cloud service: the cloud customer and the end user.
The generic quality of service requirements for cloud computing models are given below:
1. Ability of applications to handle varying levels of service accessed by end users
2. Ability to scale up databases and guaranteed access to data with acceptable performance
3. Ability to scale up computation power, network, and storage and support infrastructure based on the needs.
Once quality of service controls are available, cloud providers offer a range of services and price points that provide more choice to customers and back these services with service-level agreements (SLAs) that go beyond uptime and mean time to repair (MTTR) specifications.
The terms and conditions of contract between the service provider and its client are defined in service level agreements, which is a legally binding contract negotiated and agreed between a customer and a service provider.
It contains the quality of service as agreed, including response time, throughput, error rate, availability and so on. It may include other non-functional requirements, such as timeliness, scalability and other terms and conditions as well. Service provider is required to execute service requests from a customer within negotiated quality of service requirements for a given price. The following are key aspects which city governments need to look at incorporating in their service-level agreements.
• Availability: Availability can be defined as a design by which the downtime of systems, network, storage and infrastructure are standardized, thereby assuring uninterrupted services to its stakeholders. A definition of high availability also considers the system down time because of scheduled maintenance. In order to ensure that systems in a cloud are always available, survival against multiple levels of failures should be designed. In case of IaaS, the high availability aspects are driven more from a hardware point of view to keep the systems in a healthy state. In other delivery models, it is viewed from a software point of view, such as unavailability of services is related to downtime of applications deployed on the cloud and unavailability of data is related to the downtime of associated storage infrastructure.
• Performance: Any of the unavailability cases can result in services being available with insufficient processing power to meet acceptable performance levels. High availability without acceptable performance levels would not help the customers using the cloud. Hence, a quality of service definition of a cloud should define availability along with associated performance. The user’s perception of the cloud’s performance also depends on the performance of network links connecting the user to cloud.
• Response time: In a cloud computing environment, typically real-time scalable resource such as files, data, programmes, hardware and third-party services are accessible to users from a Web browser via the Internet. The users pay only for the used computer resources and services with penalties imposed by means of customized service level agreement. The cloud quality of service system must be able to manage several simultaneous services within specific response time limitation for each service. Scalability through dynamic ("on-demand") provisioning of resources on a self-service, near real-time basis, without users having to engineer for peak loads is desirable. In order to keep the response times alike even during peak periods, the cloud should be able to scale-up to the computation power, memory, storage and network resource demands. For example, during the end-of-year operations in departments (annual account reconciliation) or bill payments during end of month cycles, demand for processing power and service availability could increase multi-fold.

102 An Innovative Data Toolkit for City Management | Annexure
• Metering and billing and charging performance: Cloud is a pure utility renting computing model, where the resources can be utilized as per the need of the client. In such a scenario, the accounting of resources used and billed needs to be substantiated by the cloud-service provider by preserving the complete logs and all such other details that are essential for the complete satisfaction of the client. The satisfaction of the client with the billing performance may comprise of timely receipt of the bill, accuracy and completeness of the bill, clarity in bills or presentation of the billing information in terms of transparency and understandability, and a transparent process of resolution of billing complaints.
SecurityMigrating an on-site application to the cloud (off-site) may present the enterprise with a number of security risks and threats, such as the protection of intellectual property, trade secrets and personally identifiable information that could fall into the wrong hands. Making sensitive information available on the Internet requires a considerable investment in security controls and monitoring access to the content.
In the cloud environment, the city may have little or no ability to store or backup processes and, as the data from multiple customers may be stored in a single repository, forensic inspection of the storage media and a proper understanding of file access and deletion becomes a significant challenge. Organized criminals and hackers see this as a new frontier to steal private information, disrupt services and cause harm to the enterprise cloud computing network. This is typically a key barrier for public sector adoption of the cloud. However, there are a number of mitigating processes that can be put in place to address this.
Internet browser is the first stage where security measures should be implemented because vulnerabilities in the browser open the door for many follow-on attacks. Security has, therefore, been indicated as the biggest for public cloud adaptation in surveys of governments. Gartner, Inc. predicts that by 2020, 95 percent of cloud security failures will be due to fault at the customer’s end64. This means the technology will be strong and secure, and the only way data can be compromised is due to lack of understanding at the user side. The following aspects need to be considered when drawing up service-level agreements and agreements with cloud operators.
• Data integrity: Data corruption can happen at any level of storage and with any type of media, So Integrity monitoring is essential in cloud storage, which is critical for any data centre. Data integrity is easily achieved in a standalone system with a single database. Data integrity in such a system is maintained via database constraints and transactions. Transactions should follow ‘atomicity,
consistency, isolation and durability’ (ACID) properties to ensure data integrity. Most databases support ACID transactions and can preserve data integrity. Data generated by cloud computing services are kept in the cloud. Keeping data in the cloud means users may lose control of their data and rely on cloud operators to enforce access control.
• Data availability: Data availability is one of the prime concerns of mission and safety critical organizations. When keeping data at remote systems owned by others, data owners may suffer from system failures of the service provider. If the cloud goes out of operation, data will become unavailable as the data depends on a single-service provider. The cloud application needs to ensure that enterprises are provided with service around the clock. This involves making architectural changes at the application and infrastructural levels to add scalability and high availability. A multi-tier architecture needs to be adopted, supported by a load balanced farm of application instances, running on a variable number of servers. Resiliency to hardware and software failures (as well as to denial of service attacks) needs to be built from the ground up within the application. At the same time, an appropriate action plan for service continuity and disaster recovery needs to be considered for any unplanned emergencies.
• Data location: In general, cloud users are not aware of the exact location of the data centre and do not have any control over the physical access mechanisms to that data. Most well-known cloud service providers have data centres around the globe, which can be an issue in many cases. Because of compliance and data privacy laws in various countries, locality of data is of utmost importance in many enterprise architectures. Resolution of this issue is typically the role of the national governments, in laying out policies governing this aspect.
• Data privacy: Data privacy is a key concern for cloud computing. A privacy steering committee should be created to help make decisions related to data privacy. Data in the cloud are usually globally distributed, which raises concerns about jurisdiction, data exposure and privacy. Organizations stand a risk of not complying with government policies, while the cloud vendors that expose sensitive information risk legal liability. Virtual co-tenancy of sensitive and non-sensitive data on the same host also carries its own potential risks. This is an area where the national governments can provide guidance and set standards for city governments to follow.
64 See: http://www.gartner.com/newsroom/id/3143718.

103
Annex 3: Models and resources on standards for planning
Annex 4: Resources and models for training and development of human capacityThe Southern Africa Development Community (SADC)65 package on statistical training contains training material on most courses relevant for statistical offices. It gives different entry points for trainees at different levels: basic, intermediate and high. The package can be used both for self-training and training courses using teaching material from the package. The training pack mirrors the structure of the harmonized syllabus developed by SADC. It is divided into three levels: basic (statistical systems
and handling data); intermediate (courses on collecting, organizing, analysing data and presenting statistical results); and higher levels (probability, time series analysis, sampling concepts and statistical modelling). Each level contains a number of modules that are courses in specific areas of statistics. Each course is divided into sessions, each containing enough material for roughly three hours of work, excluding assignments or self-study time.
TAKEAWAY BOX: MODELS AND RESOURCES ON PLANNING STANDARDS
No Category Links and Details
1 Metadata Standards DDI - Data Documentation InitiativeAn international standard for describing data from the social, behavioural, and economic sciences. Expressed in XML, the DDI metadata specification supports the entire research data life cycle.
2 Extensions CESSDA MLI - Council of European Social Science Data Archives Minimum Level of InformationA common base profile of DDI for use by the member archives of CESSDA.
3 Tools DDI ToolsThe Data Documentation Initiative website's list of tools to implement the DDI standard.
4 Use Cases CESSDA CatalogueProvides a seamless interface to datasets from social science data archives across Europe using the CESSDA MLI profile of DDI.DDI ProjectsThe Data Documentation Initiative website's list of projects adopting or encouraging DDI as a standard.
5 Resource - DMPonline
DMPonline is a web-based tool to help researchers and research organizations write data management plans (DMPs). DMPonline has been designed and developed by the UK Digital Curation Centre (DCC). The tool is open source freeware, made available under a GNU General Public Licence. There is also room for customization of the tool for requirements of organizations (cities here).
http://www.dcc.ac.uk/dmponline
65 http://www.reading.ac.uk/ssc/resource-packs/sadc-training-pack/index.htm

104 An Innovative Data Toolkit for City Management | Annexure
Annex 5: Information technology infrastructure library (ITIL)66 The ITIL (formerly an acronym for Information Technology Infrastructure Library) is a set of practices for information technology service management (ITSM) that focuses on aligning information technology services with the needs of business. In its current form (known as ITIL 2011 edition), ITIL is published as a series of five core volumes, each of which covers a different ITSM lifecycle stage. Although ITIL underpins ISO/IEC 20000 (previously BS 15000), the International Service Management Standard for information technology service management, there are some differences between the ISO 20000 standard and the ITIL framework. ITIL describes processes, procedures, tasks and checklists that are not organization specific, but can be applied by an organization for establishing integration with the organization's strategy, delivering value and maintaining a minimum level of competency.
It allows the organization to establish a baseline from which it can plan, implement and measure. It is used to demonstrate compliance and measure improvement.
Within its service design volume, ITSM provides guidance on design of information technology services, processes and other aspects of service management. Service design addresses how the service solution interacts with larger business and technical environments to provide a holistic view of the technology within the larger ecosystem. The list of covered processes includes the following: design coordination; service catalogue management; service-level management; availability management; capacity management; information technology service continuity management; security management; and supplier management.
66 https://www.axelos.com/best-practice-solutions/itil