Embed Size (px)
Citation preview

An index of old-growthness for two BEC variants in the Nelson Forest Region
FINAL REPORT
Prepared by:
Rachel F. Holt1, T. F. Braumandl2, and D. J. Mackillop3
1Pandion Ecological Research Ltd. 705 Stanley St., Nelson, V1L 1N6
[email protected] 2Ministry of Forests, Nelson Regional Office, Nelson
3University of British Columbia, Faculty of Forestry, Vancouver, B.C.
Prepared for:
Inter-agency Management Committee, Land Use Coordination Office, Ministry of Environment, Lands and Parks.
March 31, 1999
R.F. Holt et al. 1999. An index of old-growthness for two variants in the ICH.
2
Executive summary Policy on landscape unit planning in British Columbia recommends areal targets for the retention of old-growth forest by designating Old Growth Management Areas (OGMAs) within landscape units. The Ministry of Forests defines old-growth forest using forest cover age class. However, there is increasing awareness that age class alone may miss functional attributes of old-growth forests, and may also be too coarse and inaccurate a scale for evaluating the biological value of older seral forests. In order to optimise the biodiversity value (unique habitat features critical for old-growth associated species) retained in OGMAs, it is important to identify and rank candidate OGMAs based on their distinctive structural features. Here we present a methodology for indexing the ‘old-growthness’ of older seral forest in two variants of the Interior Cedar-Hemlock subzone of the Nelson Forest Region. We sample structural attributes in stands ranging from approximately 100 to greater than 500 years in age from the two variants, and use a statistical methodology (Principal Components Analysis) to group stands based on these data. We define threshold values based on these groupings, and present look-up tables and a scorecard for ranking recruitment and old-growth stands based on their structural attributes.
Acknowledgements We would like to thank the following people who contributed to this project: Jakob Dulisse, Bill Cumming, Grant Walton, Ted Evans, Bob Osmochenko, Stewart Clow, Pamela Dykstra, and Genevieve Lachance helped with locating stands and with field work. Andy Mackinnon, Kim Illes, John Pollack, and Ralph Wells provided useful comments on the methodology and on the issue of stand age. Val Lemay and Gary Bradfield provided statistical advice. Phil Burton, Ralph Wells, André Arsenault, Rob D’Eon, Mike Geisler, Pat Field, Andy Mackinnon, Marlene Machmer, and Chris Steeger made useful comments on the document.

R.F. Holt et al. 1999. An index of old-growthness for two variants in the ICH.
3
Table of contents
Executive summary ............................................................................................................................... 2 Acknowledgements ................................................................................................................................ 2 List of Tables ......................................................................................................................................... 4 List of Figures........................................................................................................................................ 4 List of Appendices ................................................................................................................................. 4 Introduction........................................................................................................................................... 5 Methods ................................................................................................................................................. 6
Study site selection ............................................................................................................................................. 6
Measures............................................................................................................................................................ 6
Data analysis...................................................................................................................................................... 7
Results.................................................................................................................................................... 8 ICHmw2 ................................................................................................................................................ 8
Stand age ........................................................................................................................................................... 8
Principal components analysis............................................................................................................................ 9
Stand structure attributes and stand age............................................................................................................ 13
Site series......................................................................................................................................................... 14
ICHdw ................................................................................................................................................. 16 Stand age ......................................................................................................................................................... 16
sPrincipal components analysis ........................................................................................................................ 16
Stand structure attributes and stand age............................................................................................................ 21
Site series......................................................................................................................................................... 21
An index of old-growthness ................................................................................................................. 22 A sampling methodology for old-growth assessment.......................................................................................... 24
Application....................................................................................................................................................... 25
Discussion ............................................................................................................................................ 26 Alternative Methods of Old-growth Definition................................................................................................... 27
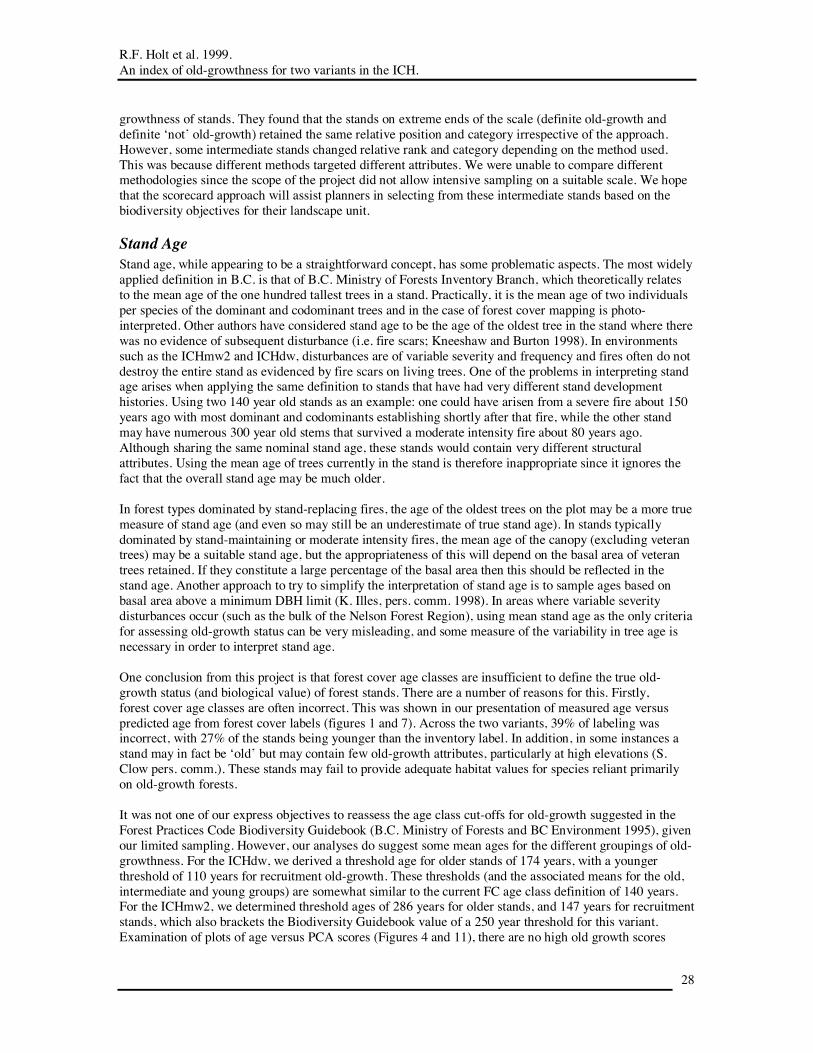
Stand Age......................................................................................................................................................... 28
Comparisons of our results with existing data ................................................................................................... 29
Stand versus landscape level considerations...................................................................................................... 30
Shortcomings of methodology ........................................................................................................................... 30
Future work...................................................................................................................................................... 31
Conclusions and Recommendations.................................................................................................... 32 References............................................................................................................................................ 33
R.F. Holt et al. 1999. An index of old-growthness for two variants in the ICH.
4
List of Tables Table 1. Component matrix for PCA of ICHmw2 data. ......................................................................................... 12 Table 2. Summary statistics for groupings in ICHmw2. Mean value and standard error for each group................... 13 Table 3. Component matrix for PCA of ICHdw data. ............................................................................................ 20 Table 4. Mean attribute values and standard errors for groups determined by the PCA analysis for the ICHdw....... 20 Table 5. Threshold values for attributes in the ICHmw2, per hectare. .................................................................... 23 Table 6. Threshold values for attributes in the ICHdw, per hectare. ....................................................................... 24 Table 7. Summary of available and comparable data for the density of live trees in stands similar to the ICHdw and
ICHmw2....................................................................................................................................................... 30
List of Figures Figure 1. Measured mean and maximum age of stands sampled in the ICHmw2. Predicted forest age classes are
shown as boxes. ............................................................................................................................................ 10 Figure 2. Mean age of stands and species sampled in the ICHmw2. ....................................................................... 11 Figure 3. ICHmw2 plots mapped in factor space. The ‘age-class’ definitions used are based on measured plot ages.
..................................................................................................................................................................... 12 Figure 4. ICHmw2: Scatterplot of PCA-1 score and mean plot age. ....................................................................... 14 Figure 5. Number of large trees (>50cm DBH) (plus/ minus standard error) per hectare by site series in the
ICHmw2....................................................................................................................................................... 15 Figure 6. Ordination of plots in factor space by site series. .................................................................................... 15 Figure 7. Measured mean and maximum age of stands sampled in the ICHdw. Forest cover age classes are shown as
boxes. ........................................................................................................................................................... 17 Figure 8. Measured mean age of stands and species in the ICHdw......................................................................... 18 Figure 9. ICHdw: ordination of plots in factor space.............................................................................................. 19 Figure 10. Relationship between PCA-1 and mean stand age................................................................................. 21 Figure 11 . Number of large trees (>50cm dbh), plus/ minus standard error) per hectare, by site series in the ICHdw.
..................................................................................................................................................................... 22 Figure 12.Ordination of ICHdw plots highlighted by site series. ............................................................................ 22 Figure 13. An example scorecard for a stand in the ICHdw. .................................................................................. 25
List of Appendices Appendix 1. Example scorecards for the ICHmw2 and ICHdw................................................................................. i Appendix 2. Summary data for stands sampled in the ICHmw2 and ICHdw. .........................................................vii

R.F. Holt et al. 1999. An index of old-growthness for two variants in the ICH.
5
Introduction Old forest is recognized as a valuable, and in places, a rare resource that warrants conservation effort because it often contains endemic or rare species as a result of its age (e.g. Goward 1993), and because this stage of forest development exhibits unique structures that are important wildlife habitat. Centuries may be required for these structures to develop, so replacement is not possible in the short term. In order to inventory, manage and conserve old-growth forest, a definition that adequately describes its identifying attributes is necessary. Various terms are used to name forests that have been free from stand level disturbances for a relatively long period of time, including old-growth, old seral, old forest, over-mature, decadent, and climax forest. We use the term old-growth most often in this report since it is most commonly used in literature. Definitions of old-growth range from simplified working definitions, based solely on forest age estimates (BC Ministry of Forests and BC Environment 1995) to definitions based on principles of forest stand development (Oliver and Larson 1990). Several authors have endorsed the use of definitions based on multiple structural attributes, as these structures represent some of the functional aspects of old-growth (Franklin and Spies 1988; Franklin and Spies 1991; Marcot et al. 1991; Wells et al. 1998; Kneeshaw and Burton 1998). Attributes used in some ecological old-growth definitions include: large old trees, a multi-layered canopy, numerous large snags and logs, diverse tree community, great age of some trees, canopy gaps, hummocky microtopography, complex structure, wider tree spacing, and increased understory production (from Kneeshaw and Burton 1998; see also Franklin and Spies 1991; Holt and Steeger 1998). The definition of old-growth currently employed by forest planners in British Columbia is based on stand age taken from forest cover maps. The age criteria vary according to Natural Disturbance Type (grouping of biogeoclimatic subzone /variants with similar disturbance return intervals, B.C. Ministry of Forests and BC Environment 1995), and in some cases, biogeoclimatic ecosystem classification (BEC) zone. This definition allows for utilization of the provincial forest inventory information without having to incur ground sampling costs. However, this simple working definition does not evaluate stand structural attributes. Structural attributes provide the unique habitat values and ecosystem function that confer special importance to old-growth, and can vary considerably among stands in the same age class. Defining old-growth without assessment of structure may therefore fail to identify the most biologically important areas of forest. It is generally accepted that old-growth definitions will always be somewhat arbitrary (Hunter and White 1997). Ecological definitions of old-growth can take the form of minimum criteria or indices. Although minimum criteria may be easier to develop, many authors support the use of continuous indices as they are thought to better account for the inherent variability of old-growth stands, and can provide a relative ranking of stands (Well et al. 1998). Spies and Franklin (1988; Franklin and Spies 1991) use this assumption as the basis for their ‘index of old-growthness’ where the successional status of a stand is ranked on the basis of a number of attributes. Stands are not dismissed because they ‘fail to meet old-growth standards’, but are instead given a relative ranking based on the abundance of a number of attributes. This approach receives much support because it may avoid potential short-sighted errors in old-growth designation (Hunter and White 1997; Wells et al. 1998). We aim to use a similar conceptual approach in this paper, and use the term old-growthness to describe the probability that a stand is actually ‘old-growth forest’. In British Columbia, the retention of old-growth forests within landscape units is recommended in the Forest Practices Code Biodiversity Guidebook ( BC Ministry of Forests and BC Environment 1995) and the Landscape Unit Planning Guidebook (BC Ministries of Forests and Environment Lands, and Parks 1999). The areal targets are to be met by designating Old Growth Management Areas in landscape units as permanent reserves. Current policy dictates that OGMA targets be met outside the timber harvesting landbase (THLB) where possible, and then within the THLB (unless the landscape unit is to be managed under the low biodiversity emphasis option, in which case only one third of the target has to be met). In BEC variants (within landscape units) where the area of old-growth is higher than the recommended target, choices between competing areas must be made. In addition, many areas of the Province have a deficit of old-growth in some BEC variants (i.e. the amount of old-growth available is lower than the recommended target). In these areas, suitable ‘recruitment’ forest must be designated (in intermediate and high biodiversity emphasis option landscape units) and standards for designating recruitment old-growth patches are

R.F. Holt et al. 1999. An index of old-growthness for two variants in the ICH.
6
required. Using age as the sole definer of old-growth may provide insufficient information for planners to make meaningful decisions. Criteria for ranking stands based on multiple stand structural attributes would therefore be useful in making these choices. Previous work on refining old-growth definitions for the Nelson Forest Region consisted of deriving minimum standards for the number of live trees in various size classes by site series (Quesnel 1996) from an existing data set. The need to explore useful old-growth indices in this region was therefore recognised. This pilot study was designed to address some of the issues surrounding old-growth management in two BEC variants of the Nelson Forest Region, British Columbia. The objectives of this pilot study were to: 1. determine what easily-assessed structural features are consistently associated with old forests in these variants;
and 2. devise an objective index of “old-growthness” for field assessments. The two biogeoclimatic variants studied were the ICHmw2 and ICHdw (Braumandl and Curran 1992). We focussed on these variants because they are widespread, relatively productive and have significant deficits of older forests in some areas. The attributes we chose to measure were some of those most commonly cited as being important structural features associated with old-growth forest while still being relatively quick to assess consistently. Other studies that have investigated old growth definitions (Kneeshaw and Burton 1998, Franklin and Spies 1991) have involved sampling efforts many times greater than those possible in this study. Hence the results of this study should be interpreted as exploratory in nature.
Methods
Study site selection Thirty six stands were selected from non-TFL lands of the Arrow and Kootenay Lake Forest Districts within the ICHdw (18 stands) and the ICHmw2 (18 stands). Stands were generally selected from areas that had been delineated as candidate old growth management areas by the Arrow Forest District. Zonal site series (ICHdw/01 CwFd - Falsebox and ICHmw2/01 HwCw - Falsebox - Feathermoss) were predominantly sampled, however, it was necessary to expand to a wider range of site series for both variants since insufficient zonal sites were available. Other site series sampled were: ICHdw/02 FdPy - Oregon-grape - Parsley fern; ICHmw2/03 FdCw - Falsebox - Prince’s pine; ICHmw2/04 CwFd - Falsebox; and ICHmw2/05 CwHw - Oak fern - Foamflower. Stands were selected to sample a range of stand ages from 100 to greater than 250 years (forest cover age classes 6, 7, 8, and 9), and were a minimum size of 10 ha. Three circular 0.1 ha (17.8 m radius) plots were sampled per stand. Plots were placed a minimum of 30m from the stand edge and spaced between 75 and 200 m apart along a transect. The transect was located to try to span a significant portion of the stand being sampled. Plots that fell on old roads or heavily selectively harvested portions of a stand were moved a minimum of 50 m along the transect. Some plots were established in areas that had some selective harvest, in which case stumps were counted as live trees and their stump diameter was treated as dbh.
Measures The following variables were assessed: • number of trees >50cm dbh • largest tree diameter • number of snags in 12.5-25, 25-50, >50cm dbh classes • largest diameter snag • % of trees >50cm dbh with pathological indicator • % of trees >50cm dbh with dead or broken tops • arboreal lichen presence (none, low, moderate, high; based on Armleder et al. 1992) • number of tree species • cover and modal height of total shrubs and herbs • multiple canopy layer presence

R.F. Holt et al. 1999. An index of old-growthness for two variants in the ICH.
7
• mean and modal LFH thickness (measured at 6 points) • relative abundance and size of canopy gaps • small trees (<1.3m tall) were counted in one quadrant of the plot (0.025ha) • density of trees in the following dbh classes <12.5cm dbh; 12.5-40cm dbh; 40-50cm (assessed in one half of the
plot (0.05ha)). Four transects radiating out from plot centre to the edge of the plot on cardinal bearings were laid out and intersections were tallied for number of pieces of >30 cm diameter downed logs. Diameter of the largest piece was also noted. Age at breast height was measured on dominant or codominant trees and the largest trees in the stand. Generally a minimum of two trees per species per plot were cored. For trees with rotten centres, tree age was estimated if countable rings constituted more than one-third of the radius of the tree. The ages for rotten trees were estimated by multiplying the age count for the intact segment by radius of the tree divided by the intact core length. This is likely an under-estimate of the age of any trees which had experienced suppression early in life and now have a rotten centre. This approach is reasonable, however, in the absence of more detailed dendrochronological data which would have required extensive coring in the same stand (P. Burton, pers. comm. 1999).
Data analysis Principal component analysis (PCA) was used to ordinate data collected from plots within stands. Ordination is the collective term for a group of multivariate techniques that arrange sites along multiple axes (ter Braak 1995). Our objectives were to (i) determine whether plots are grouped based on similarities among structural attributes and (ii) find a set of structural attributes that best describe the main relationships between plots. PCA uses a correlation matrix of multiple variables to find a number of indices (principal components) that each capture variation in a different dimension of the data. Each PCA axis is orthogonal (uncorrelated) with the others. PCA-1 describes the maximum variation in the data and therefore describes the major patterns in the data. PCA-2 is orthogonal to PCA-1 and captures the next largest amount of variation in the data, and so on (Tabachnik and Fidell 1996). A multivariate approach is most appropriate for our data because we are interested in the compounded effects of multiple variables. We use PCA to explore patterns in the data set, and our results are therefore hypotheses which require testing. This is in contrast with direct hypothesis testing approach. We used plot rather than stand data, since pseudo-replication is not an issue with exploratory data analysis (V. Lemay and G. Bradfield pers. comm. 1999). PCA was performed separately for each BEC variant. Slight variation in data collection methodology and in snow conditions on some plots resulted in missing data for some attributes. Missing data for any variable results in that plot being removed from the analysis, and can considerably reduce the number of plots included. We therefore tried to optimise both the number of variables and the number of plots included in the analysis. PCA was conducted on plot data from the ICHmw2 using the following structural variables: • number of large trees (>50cm dbh), • maximum dbh sampled in the plot, • number of large pieces of CWD in plot (>30cm DBH), • percent of large trees (>50cm dbh) with broken or dead tops • percent of large trees with evidence of pathogens • percent cover by herbs • modal height of the herb layer • percent cover by shrubs • modal height of shrub layer • estimated LFH thickness • numbers of snags by size classes (12.5-25 cm dbh; 25-40cm dbh, 40-50cm dbh) • lichen abundance • number of tree species present PCA was conducted on plot data from the ICHdw using the following structural variables: • number of large trees (>50cm dbh), • maximum dbh sampled in the plot,

R.F. Holt et al. 1999. An index of old-growthness for two variants in the ICH.
8
• number of large pieces of CWD in plot (>30cm DBH), • percent of large trees (>50cm dbh) with broken or dead tops • % of large trees with evidence of pathogens • percent cover of shrub layer • estimated LFH thickness • numbers of snags by size classes (10-25 cm dbh; 25-40cm dbh, 40-50cm dbh) • numbers of smaller trees (12.5-40cm dbh) • total density of trees (all size classes) • lichen abundance Percent data were arcsine square root transformed to approximate their distributions to normal and to compensate for upper and lower limits due to the percent scale (Sokal and Rohlf 1981). The remaining data were not transformed since normality and linearity assumptions are not in force as long as PCA is used for descriptive analyses (Tabachnik and Fidell 1996). Values were standardised as part of the PCA analysis in SPSS Factor. For each BEC variant, PCA was used to explore whether any natural groupings occurred among the plots sampled (for example, see Fig. 3 and 9). Where groupings occurred, observation of the variables most strongly correlated with the axis (PCA-1) was used to assess whether the patterns were related to the ‘old-growthness’ of the plot (based on assumptions of attributes associated with old-growth forest). In order to explore the distribution of plots, individual plots were graphed in factor space with the primary axis (PCA-1) as the x-axis and PCA-2 as the y-axis. Output from the PCA was used to group similar plots. The mean age of each plot was graphed against the primary old-growth axis to assess how age related to PCA ordination (Fig. 4 and Fig. 10). Summary statistics of attribute values for each group are presented in their original units and are given on a per hectare basis. These values are then compared to summary statistics for old-growth reported in other studies. Other authors have used this type of technique (PCA) to similarly explore multivariate data (e.g. Kneeshaw and Burton 1998). In some cases, (e.g. Franklin and Spies 1991), stepwise discriminant analysis was first used to reduce the number of variables in the data set. We did this step prior to field work, by focussing on the variables thought by other workers to be important in making these definitions and that could be easily assessed. We therefore used all variables that were complete (or almost complete) in the PCA, and only discarded those with significant numbers of missing values.
Results The results for the two BEC variants will be assessed separately. A summary of all data collected, by variant and by plot, is available in Appendix 2. Data are listed in order of measured mean stand age. Mean values for measured attributes in each stand are presented.
ICHmw2
Stand age Eighteen stands were sampled in the ICHmw2 BEC variant. These ranged in age from approximately 107 to 542 years old (Fig. 1). Based on forest cover (FC) data, stands ranged from age class (AC) 7 to 9 (5% AC7; 66% AC8, 22% AC9, Appendix 2). A minimum of three and a maximum of seven trees were cored on each plot. Mean age rather than maximum age (as in Kneeshaw and Burton 1998) was used in the analyses since numerous stands showed evidence of moderate intensity fires (fire scars) that did not destroy the entire stand. Calculated ages of stands (from tree cores) differed from the FC typed information (Fig 1). Based on mean stand age, 7 of 18 stands were misclassified, with 5 of those younger than typed, and 2 older than typed (Fig. 1). The dominant and co-dominant trees were aged in each plot, as well as the largest tree(s) and the mean age, by species is shown in Fig. 2.

R.F. Holt et al. 1999. An index of old-growthness for two variants in the ICH.
9
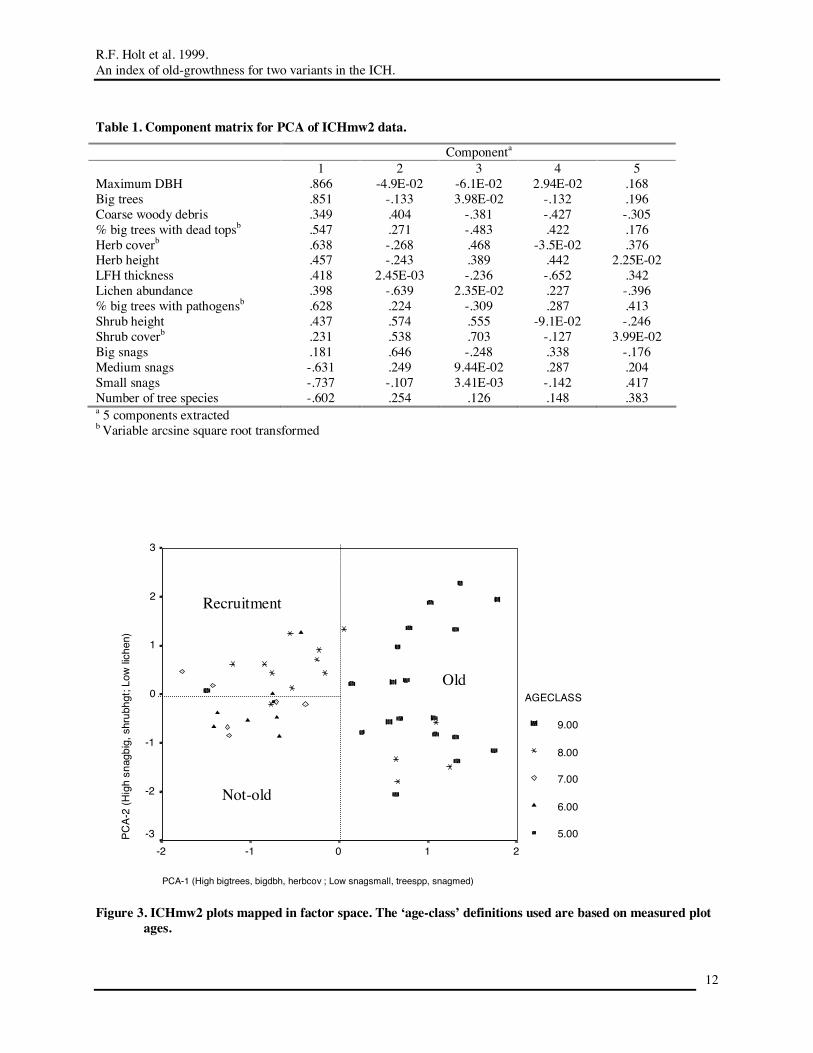
Principal components analysis 47 of 50 possible plots were included in the analysis. The first PCA axis (PCA-1) accounted for 32% of the variation in the data set1. The second axis (PCA-2) accounted for a further 13% of the variation in the data. PCA-3 and subsequent axes accounted for less variation in the data and are not addressed further in the analysis. The following variables were positively associated with PCA-1: number of large trees in the plot, largest live dbh in the plot, percent herb cover and percent of the large trees with evidence of pathogens, while small and medium sized snags were negatively associated with PCA-1 (Table 1). This suggests that PCA-1 is therefore associated with old-growthness of the plot (based on cited structural associations with old forests). PCA-2 is highly associated with large snags and negatively associated with lichen loading (Table 1). Mapping the plots in factor space produces two major plot groups. Firstly, a group of 22 plots with PCA-1 scores >0, which appear to be old-growth plots based on the combination of stand structural attributes (Fig. 3). Secondly, a group of 25 plots with PCA-1 scores <0 which generally lack old-growth attributes (Fig 3). We present summary data for three groups based on splits by PCA-1 and PCA-2. The first group consists of plots with PCA-1 > 0 which have a large number of stand structural attributes associated with old-growth (referred to as ‘old’ in future tables). Although PCA-1 > 0 plots appear to split into two groups (Fig. 3) this represents a split at approximately 400 years which is interesting ecologically, but is not relevant to current management objectives, since both groups would tend to be classified as ‘high quality’ old-growth. The second group consists of plots with PCA-1 < 0 and PCA-2 > 0 (top left hand corner), which appear to be higher quality ‘recruitment’ old-growth (termed ‘recruitment’ in future tables). The third group is characterized by PCA-1 < 0 and PCA-2 < 0 (bottom left-hand corner), which almost entirely lack old-growth attributes (termed ‘not-old’ in future tables). These categories are shown on Fig. 3 by the dotted breaks in the factor space.
1 A good result for ecological data (Gary Bradfield 1999 pers. comm.)

R.F. Holt et al. 1999. An index of old-growthness for two variants in the ICH.
10
50
150
250
350
450
550
650
750
850
950
1050
MacDon
aldB
Shields
WilsonB
New Den
verA
New Den
verB
Tiger
Scalpin
g
Six mile
Lake
College
B
Silverto
n
WilsonA
College
A
Bound
ary
Kuska
nax
MacDon
aldA
Pedro
Bremne
r
Glenmerr
y
Stan
d Ag
e (y
ears
)
standagemax age
Figure 1. Measured mean and maximum age of stands sampled in the ICHmw2. Predicted forest age classes are shown as boxes.
.

R.F. Holt et al. 1999. An index of old-growthness for two variants in the ICH.
11
Figure 2. Mean age of stands and species sampled in the ICHmw2.
0
1 0 0
2 0 0
3 0 0
4 0 0
5 0 0
6 0 0
7 0 0
8 0 0
Glenmerr
y
Bremne
rPedr
o
MacDon
aldA
Kuskan
ax
Bound
ary
College
A
Wilso
nA
Silvert
on
Colleg
eB
Six m
ile Lake
Scalpin
gTige
r
New D
enverB
Wilson
B
New D
enver
AShie
lds
MacDon
aldB
F o r e s t s ta n d s
Stan
d ag
e (ye
ars) s ta n d a g e
C w _ a g eH w _ a g eF d _ a g eL w _ a g eS x _ a g e
R.F. Holt et al. 1999. An index of old-growthness for two variants in the ICH.
12
Table 1. Component matrix for PCA of ICHmw2 data.
Componenta 1 2 3 4 5
Maximum DBH .866 -4.9E-02 -6.1E-02 2.94E-02 .168 Big trees .851 -.133 3.98E-02 -.132 .196 Coarse woody debris .349 .404 -.381 -.427 -.305 % big trees with dead topsb .547 .271 -.483 .422 .176 Herb coverb .638 -.268 .468 -3.5E-02 .376 Herb height .457 -.243 .389 .442 2.25E-02 LFH thickness .418 2.45E-03 -.236 -.652 .342 Lichen abundance .398 -.639 2.35E-02 .227 -.396 % big trees with pathogensb .628 .224 -.309 .287 .413 Shrub height .437 .574 .555 -9.1E-02 -.246 Shrub coverb .231 .538 .703 -.127 3.99E-02 Big snags .181 .646 -.248 .338 -.176 Medium snags -.631 .249 9.44E-02 .287 .204 Small snags -.737 -.107 3.41E-03 -.142 .417 Number of tree species -.602 .254 .126 .148 .383 a 5 components extracted b Variable arcsine square root transformed
PCA-1 (High bigtrees, bigdbh, herbcov ; Low snagsmall, treespp, snagmed)
210-1-2
PCA-
2 (H
igh
snag
big,
shr
ubhg
t; Lo
w li
chen
)
3
2
1
0
-1
-2
-3
AGECLASS
9.00
8.00
7.00
6.00
5.00
Old
Not-old
Recruitment
Figure 3. ICHmw2 plots mapped in factor space. The ‘age-class’ definitions used are based on measured plot
ages.

R.F. Holt et al. 1999. An index of old-growthness for two variants in the ICH.
13
We present the summary statistics for these groups in Table 2. Note that for some of the attributes the expected patterns are not apparent, and in some cases there is overlap between groups for some attributes. This results because the technique ordinates plots on the basis of all the attributes, rather than single attributes.
Table 2. Summary statistics for groupings in ICHmw2. Mean value and standard error for each group. Variable Not-old Standard
error Recruit-
ment Standard
error Old Standard
error
Mean age 126.0 (6.6) 169.4 (13.3) 402.7 (31.8) Mean max age 151.9 (15.1) 257.9 (28.8) 564.7 (48.6) Big tree density (#/ha) 22.0 (6.0) 29.0 (6.0) 140.0 (12.0) CWD (# of pieces on 72 m transect 38.0 (5.0) 29.0 (5.0) 53.0 (7.0) Max live dbh (cm) 54.1 (2.6) 60.9 (3.0) 87.7 (2.8) Deadtop (% of >50cm DBH) 4.5 (3.2) 22.3 (9.0) 35.4 (5.5) Herbcover (%) 2.5 (0.9) 3.2 (1.4) 11.4 (2.1) Herb height (cm) 9.1 (0.9) 10.0 (0.0) 13.5 (1.6) LFH depth (cm) 3.5 (0.4) 2.8 (0.3) 4.7 (0.5) Lichen Abundance1 1.1 (0.1) 0.9 (0.1) 1.4 (0.1) Pathogen (% of >50cm DBH) 6.0 (3.4) 30.0 (10.9) 43.6 (4.0) Shrub cover (%) 2.5 (0.9) 5.2 (1.7) 5.8 (1.6) Shrub height (dm) 2.5 (0.7) 4.7 (1.3) 7.2 (1.5) Snags big (#/ha) 2.0 (1.0) 20.0 (4.0) 17.0 (4.0) Snags medium (#/ha) 30.9 (6.8) 72.3 (10.0) 12.2 (3.0) Snags small (#/ha) 87.3 (11.0) 70 (15.5) 19.6 (3.8) Number tree species 4.7 (0.2) 5.5 (0.4) 3.2 (0.2) 1:Lichen abundance classes: <1 = low; 1-2 medium; >3 high (based on Armleder et al. 1992)
Stand structure attributes and stand age In order to investigate the relationship between plot age and the PCA-1 score ( a surrogate for old-growthness), a scatterplot of mean plot age versus PCA-1 is shown (Fig. 4). If plot age and PCA-1 both exactly described ‘old-growthness’ you would expect to see a tight linear relationship between these two variables. However, it is apparent that, although there is a strong relationship between ‘old-growthness’ and stand age (Spearman correlation of 0.755), there is also further variation captured in the multivariate approach not captured solely by age. There is an especially wide range of PCA-1 scores found for stands between about 170 and 250 years from Figure 4. This suggests that using stand structural attributes in addition to age would add to the ability to define the old-growthness of a stand.

R.F. Holt et al. 1999. An index of old-growthness for two variants in the ICH.
14
PCA-1 (High bigtrees, bigdbh, herbcov; Low small & medsnags, treespp)
210-1-2
Site
800
700
600
500
400
300
200
100
0
WilsonB
WilsonA
Tiger
Six mile Lake
Silverton
Shields
Pedro
New DenverB
New DenverA
MacDonaldB
MacDonaldA
Kuskanax
Glenmerry
CollegeB
CollegeA
Bremner
Boundary
Mea
n Age
(yea
rs)
Figure 4. ICHmw2: Scatterplot of PCA-1 score and mean plot age. It is also clear from Fig. 4 that plots with high values for PCA-1 include stands of a wide range of ages greater than approximately 200 years. This lends support to the current policy decision for an interim working definition for old-growth of 250 years in this variant.
Site series Stands and plots sampled were from a range of site series. In our principal components analysis, we grouped data from different site series to increase our sample size, and because we were interested in broad patterns applicable to current old-growth policy. However, some of the variation in stand structural attributes among plots may be a result of differences in site series. We did not include site series in the PCA because it is not a ‘structural attribute’ of the stand, and because we had insufficient sampling ability to analyse individual site series. To examine the potential influence of site series, the number of big trees (>50cm dbh) per plot (square-root transformed to approximate a normal distribution) was used as an index of the productivity of a site. The mean age of plots (log transformed to approximate a normal distribution) was included as a covariate to account for differences in big tree density caused by plot age. In an analysis of covariance (ANCOVA), site series did impact the number of big trees observed in the plot, after correcting for differences caused by mean plot age (ANCOVA: log age F1,4= 85.5, p < 0.001; site series:

R.F. Holt et al. 1999. An index of old-growthness for two variants in the ICH.
15
F1,4 = 5.3, p <0.0012). Site series means show a higher density of big trees in wetter 05 site series plots (Fig. 5; see discussion).
01020304050
01 03 04 05
Site series
Num
ber o
f tre
es >
50cm
dbh
per h
ecta
re
Figure 5. Number of large trees (>50cm DBH) (plus/ minus standard error) per hectare by site series in the
ICHmw2. Figure 6 shows the relationship between site series and position of the plot with PCA-1. It is difficult to see patterns in the data, because of the uneven sample size of the different site series. However, most plots with site series 05 have a PCA-1 > 0 and may be more often classified as old-growth because of the high density of large trees in these plots (Fig. 6).
Figure 6. Ordination of plots in factor space by site series.
PCA-1 (High bigtree, bigdbh, herbcov; Low small & med snag,treespp)
210-1-2
PCA-
2 (H
igh
bigs
nag;
Low
lich
en)
3
2
1
0
-1
-2
-3
SITESERIES
5.00
4.00
3.00
1.00

R.F. Holt et al. 1999. An index of old-growthness for two variants in the ICH.
16
ICHdw
Stand age Eighteen stands were sampled in the ICHdw BEC variant. An equal distribution of stands from age classes 6 – 9 were sought, but it was difficult to find examples of older stands which were (i) accessible, (ii) of sufficient size or (iii) had not been extensively high-graded. The stands were typed on forest cover maps as age classes 6 – 9 (22% age class 6, 11% age class 7, 44% age class 8, 11% age class 9). In terms of measured mean ages (totals for all species), there was a relatively even distribution of stands of different ages, ranging from 86 to 231 years , then a break to two stands with mean ages of 274 and 390 (Fig. 7). A comparison of observed versus FC age class information is shown (Fig 7). Of 18 stands, using mean stand age, 7 of 18 stands were misclassified. Of these seven, five were younger than typed on forest cover maps and two were older than mapped.
sPrincipal components analysis 42 of 56 possible plots were included in the analysis1. The first PCA axis (PCA-1) accounted for 26% of the variance in the data set. The second axis (PCA-2) accounted for a further 20% of the variation in the data. Axes 3 and 4 both accounted for a further 10% of the variation in the data set, however their contribution is not reported since the first two axes represent the main interpretable differences in the data. The number of axes used to explain ordinations in the data is a matter of judgement and will depend on the intended use of the analysis (Manly 1986). The following variables were most positively associated with PCA-1: number of large trees in the plot, and percent shrub cover. Total tree density, density of small trees, and small snags, were most negatively associated with PCA-1 (Table 3). PCA-1 therefore appears to be associated with old-growthness (as determined from the literature). PCA-2 is highly associated with coarse woody debris, percent dead tops, LFH, number of large snags, and total density of trees (Table 3).
1 Note that the inclusion of variables in the PCA can change which variables factor highly with each PCA axis. For example, a second PCA removing percent shrub cover from the analysis was conducted. The overall layout of plots in factor space remained very similar to the PCA with shrub cover, but the contribution of variables to each PCA differed. For this reason, we do not use the correlation matrix scores to ‘weight’ attribute values in the index of old-growthness (see discussion).

R.F. Holt et al. 1999. An index of old-growthness for two variants in the ICH.
17
Figure 7. Measured mean and maximum age of stands sampled in the ICHdw. Forest cover age classes are shown as boxes.
060
120180240300360420480540600660720780840900
Church
Ainswort
hFa
lls
Sitkum
Proctor
Kokan
ee CICWADF
Eco Res
Big She
ep
Syring
a
Redfis
hPDO
Power
Lemon
Hidden Flat
sErie
Maximum age measuredMean age (+) s.eWidth of forest cover age class

R.F. Holt et al. 1999. An index of old-growthness for two variants in the ICH.
18
Figure 8. Measured mean age of stands and species in the ICHdw
0
100
200
300
400
500
600
Erie
ND Flats
Hidden
Ck.
Lemon
Power
P d’O
Redfish
Syring
a BS
EcoRes
WADF
CIC
Kokane
e
Procto
r
Sitkum
Falls C
reek
Ainswort
h
Church
TotalFdLwPyCwHwBgPw

R.F. Holt et al. 1999. An index of old-growthness for two variants in the ICH.
19
Mapping the plots in factor space produces no obviously distinct grouping of plots (as in the ICHmw2). However there are gradients of plots in the factor space (Fig. 9). As with the ICHmw2, PCA-1 was used as the main dividing axis because it explains the most variation in the data. However, because there was not a clean split at PCA-1 = 0, we decided to present an intermediate group with PCA-1 between -0.5 and +0.5. The three groups are therefore (i) ‘old’ with PCA-1 > +0.5, (ii) ‘recruitment’ with PCA-1 > -0.5< +0.5, and (iii) ‘not-old’ with PCA-1 < -0.5. Because the partitioning of variation between PCA-1 and PCA-2 is fairly similar (26% versus 20% respectively), we tried to produce groupings based on both axes. However, the summary statistics derived from this more complex approach resulted in too many groups and were not readily useable, so we resorted to using this more simple grouping technique. Summary statistics for attributes in each of these groups (old, recruitment, and not-old) are given (Table 4).
PCA-1 (High Bigtrees, Shrubcover; Low Small trees and snags, density)
210-1-2-3
PCA-
2 (H
igh
LFH
, Dea
dtop
s, C
WD)
3
2
1
0
-1
-2
AGECLASS
9.00
8.00
7.00
6.00
5.00
4.00
3.00
Not-old Recruitment Old
Figure 9. ICHdw: ordination of plots in factor space.

R.F. Holt et al. 1999. An index of old-growthness for two variants in the ICH.
20
Table 3. Component matrix for PCA of ICHdw data. Component Matrixa
Component
1 2 3 4 5 Maximum DBH .866 -4.9E-02 -6.1E-02 2.94E-02 .168 Big trees .851 -.133 3.98E-02 -.132 .196 Coarse woody debris .349 .404 -.381 -.427 -.305 % big trees with dead topsb .547 .271 -.483 .422 .176 Herb coverb .638 -.268 .468 -3.5E-02 .376 Herb height .457 -.243 .389 .442 2.25E-02 LFH thickness .418 2.45E-03 -.236 -.652 .342 Lichen abundance .398 -.639 2.35E-02 .227 -.396 % big trees with pathogensb .628 .224 -.309 .287 .413 Shrub height .437 .574 .555 -9.1E-02 -.246 Shrub coverb .231 .538 .703 -.127 3.99E-02 Big snags .181 .646 -.248 .338 -.176 Medium snags -.631 .249 9.44E-02 .287 .204 Small snags -.737 -.107 3.41E-03 -.142 .417 Number of tree species -.602 .254 .126 .148 .383 a 5 components extracted b Variables arcsine square root tranformed
Table 4. Mean attribute values and standard errors for groups determined by the PCA analysis for the ICHdw.
Variable Not-old Standard error
Recruitment Standard error
Old Standard error
Mean age 101 4 119 9 228 28.7 Mean max age 170 20.6 184 21 377 68.2 Big tree density (#/ha) 16.5 6.5 53 9 74.5 6.5 Density live >12.5 cm DBH
(#/ha) 293 74 255 51.4 251 31.2
Density medium trees (#/ha) 26 8 27 6.5 31 7 Density small trees (#/ha) 262 22.5 181 34 110 25.5 Largest live dbh (#/ha) 51 8.1 67 7.7 75 4.9 Deadtop (% of big trees) 0.05 0.05 0.25 0.05 0.5 0.1 Pathogens (% of big trees) 0.15 0.1 0.65 0.15 0.65 0.1 Density of all live trees (/ha) 785 120 483 78.5 412 64 CWD (#pieces on 34 m
transect) 9.5 4 11.5 3 18 5
LFH (cm) 4.3 0.55 4.3 0.55 5.4 0.55 Lichen1 0.6 0.3 1.3 0.5 2.3 0.3 Shrub cover (%) 0.1 0.05 0.3 0.1 0.45 0.1 Snags >50 cm dbh (#/ha) 4.5 4 10.5 5 12 4 Snags 25-50 cm dbh (#/ha) 134 59.6 94 44.8 43 14.6 Snags 12.5-25 cm dbh (#/ha) 120 38 38 13.7 32 7.0 # Tree species 4.4 0.6 4.3 0.4 2.5 0.25 1:Lichen abundance classes: <1 = low; 1-2 medium; >3 high (based on Armleder et al. 1992)

R.F. Holt et al. 1999. An index of old-growthness for two variants in the ICH.
21
Stand structure attributes and stand age In order to investigate the relationship between plot age and the ‘old-growthness’ of the plot as defined by the PCA-1, a scatterplot of mean plot age versus PCA-1 is shown (Fig. 10). If plot age and PCA-1 exactly described ‘old-growthness’ you would expect to see a tight linear relationship between these two variables. However, it is apparent that, although there is a strong relationship between PCA-1 and stand age, there is also further variation captured in the multivariate approach not captured solely by age. Examination of the figure shows that in general, stands with many old-growth associated variables appear in stands greater than approximately 150 years of age. However, it is also clear that there are some stands younger than 150 years, which have old-growth attributes. We suggest this is a result of the different patterns of disturbance in this variant, which results in some younger stands having a considerable veteran tree component which survived low intensity fires (see discussion).
PCA-1 (High bigtrees, shrubcover; Low small trees and snags)
210-1-2-3
MEA
N A
GE
500
400
300
200
100
0
SITE
WADF
Syringa
Sitkum
Redfish
Proctor
Power
PDO
Kokanee
God
Flats
Falls Cr
Erie
Eco Res
CIC
Ainsworth
Figure 10. Relationship between PCA-1 and mean stand age.
Site series Stands and plots sampled were from a range of site series. We grouped data from different site series to increase our sample size, and because we were interested in broad patterns at a BEC variant level, applicable to current old-growth policy. However, some of the variation in stand structural attributes among plots may be a result of differences in site series. In order to investigate this effect, the number of big trees (>50cm dbh) per plot (arcsine square-root transformed to approximate a normal distribution) was used as an index of the productivity of a site. The mean age of plots (log transformed to approximate a normal distribution) was included as a covariate to account for differences in big tree density caused by plot age. In an ANCOVA, site series did not impact the number of big trees observed in the plot, after correcting for differences in numbers of big trees by mean plot age (ANCOVA: log age F1,2= 15, p < 0.003; site series: F1,2 = 0.7, p = 0.49). Mean numbers of large trees per hectare, by site series are shown (Fig. 11).

R.F. Holt et al. 1999. An index of old-growthness for two variants in the ICH.
22
0
10
20
30
02 01a 01b
Site series
Num
ber o
f tre
es>5
0cm
dbh
per
hec
tare
Figure 11 . Number of large trees (>50cm dbh), plus/ minus standard error) per hectare, by site series
in the ICHdw. In addition, we show the ordination of plots by site series (Fig. 12) to determine whether particular site series tend to result in higher ‘old-growthness scores’. There are no obvious patterns in these data, except that the dry ICHdw - 02 sites are somewhat grouped on the PCA-1 axis.
Figure 12.Ordination of ICHdw plots highlighted by site series.
An index of old-growthness In order to provide an index for old-growthness from our limited pilot study data we decided to use an approach which does not attempt to weight attributes in order to produce an ‘old-growthness’ score. We considered using the correlation coefficients from the correlation matrix in the PCA however these changed quite considerably when different attributes were included or excluded from the analysis (although the general positions of plots in the factor space stayed quite constant). For this reason we felt it was inappropriate to use the correlation coefficients to weight attributes. As an alternative, we provide a ‘transparent’ process for ranking candidate patches which we feel would allow the practitioner to weight attributes themselves if they felt that was necessary or appropriate (see below for discussion).
Ordination of ICHdw Plots marked by Site Series
PCA-1
210-1-2-3
PCA-
2
3
2
1
0
-1
-2
SITESERIES
1b
02
1a

R.F. Holt et al. 1999. An index of old-growthness for two variants in the ICH.
23
Our approach is to use the groups of plots generated by the PCA for each BEC variant to produce a table of look-up threshold values for each attribute. The attributes in Tables 2 and 3 were examined to produce a subset of attributes which met the following criteria: (i) they did not overlap between groups (ii) their pattern makes ecological sense based on the literature, (iii) they did not have a U-shaped distribution (such as coarse woody debris and medium sized snags) caused by retention of attributes in younger stands from previous disturbance1. For attributes which met these criteria, threshold values were produced from the midpoints between adjacent plot groups (e.g. between ‘not-old’ and ‘recruitment’, and between ‘recruitment’ and ‘old’). These threshold values are presented in Tables 5 and 6. We chose to produce two thresholds for each variant, because current landscape unit planning for old-growth in British Columbia requires planners to identify not only true old-growth forest, but also recruitment forest in areas that are currently in deficit for old-growth (as defined in: Province of British Columbia 1999). It is our experience that areas in deficit are the most controversial and will likely require the most field assessment in order to adequately protect suitable forest to meet landscape unit planning objectives. Although we did not include age in the multivariate analysis we include it as an attribute to evaluate because we suggest age provides further discriminatory power for choosing among stands (e.g. Goward 1993), however, note that we are not attempting to revise the current age criteria for old-growth in these variants.
Table 5. Threshold values for attributes in the ICHmw2, per hectare.
Attribute
Threshold Threshold
SCORE 1 2 3 Mean age 147 286 Mean Maximum age 204 411 Density trees >50cm dbh 25 84 Largest dbh 57 74 Percent big trees with broken/
deadtops 13 28
Percent big trees with pathogens 18 36 Snags >50cm dbh 11 18 Snags 10-25cm dbh 78 44
1 Using attributes that have single directional trends simplifies the scoring process.
Recruitment Not-old Old

R.F. Holt et al. 1999. An index of old-growthness for two variants in the ICH.
24
Table 6. Threshold values for attributes in the ICHdw, per hectare.
Attribute
Threshold Threshold
SCORE 1 2 3 Mean age 110 173 Mean Maximum age 177 281 Density trees >50cm dbh 34 64 # of CWD >30cm dbh on 34m
transect 10 15
Largest dbh on plot 58 71 Percent big trees with dead/
broken tops 20 49
Lichen abundance1 Low Medium Percent big trees with pathogens 40 70 Density of trees >12.5 < 40cm 222 145 Density of snags >50cm dbh 7 11 Density snags 12.5 – 25 79 35 1:Based on Armleder et al. 1992
A sampling methodology for old-growth assessment The procedure for ranking a stand would work as follows: (i) Determine (from existing cruise data, or from new field data) the values for as many attributes
shown in Tables 4 or 5 for that variant, as possible. The more variables measured the better. If cruise data are available, additional ages should be measured in the field as ages are not a priority for cruising in stands over 120 years of age. Where the stand is field sampled (either when cruise data are unavailable, or where data on additional attributes is required2) we would recommend using a minimum of three plots per stand in order to gain a reasonable ‘average’ view of the stand.
(ii) For each stand, review the look-up threshold values and award a score based on the position within the table. For example, in the ICHmw2 if the density of big trees is 90/ha (Table 5), then a stand would get a score of 3 for that attribute. It would also get a check mark in the ‘old’ column for that variable.
(iii) Repeat for a number of attributes, multiply number of checks by appropriate value (1,2 or 3 for not-old, recruitment and old columns respectively), and sum to obtain a total score.
(iv) Stands with a higher score are more likely to be old-growth, or are potentially more suitable as recruitment stands. A review of the stand structure categories, i.e. not-old, recruitment, old, given for each attribute gives the user a relative idea of the value for each attribute in that stand. This approach is useful because it allows the planner to consider multiple objectives for a stand. For example, a suitable old-growth management area may be required within a caribou special management zone. In this case, preference would be given to stands which scored high (good old-growth) values for the density of big trees, lichen density and evidence of pathogens (Stevenson 1994). Note that any comparison among stands must involve assessment of the same set of attributes in each stand.
2 Present cruise data can provide most of the information required for the score card assessment. However there are a few attributes that are not available from the cruise (for example lichen abundance, cover and height of understory, and depth of LFH). Having these additional data gathered on the cruise is important since they were important in determining plot distribution in factor space, and so provide better data to evaluate the old-growth status as well as habitat suitability of stands.
Old Not-old Recruitment

R.F. Holt et al. 1999. An index of old-growthness for two variants in the ICH.
25
Application The procedure described in this paper offers practitioner a methodology for assessing the structural attributes present in a forest stand, and ranking competing stands based on structural attributes. We suggest that the methodology will be useful for practitioners faced with choosing between competing stands with fairly similar attributes. We do not envision that all candidate OGMAs would be tested using this ranking procedure (given current fiscal constraints), however, potential recruitment and ‘younger old’ stands could be ranked using this procedure. Some will be ‘obviously old’ or obviously not-old and not require assessment. Note that the methodology only assesses stand level factors, and that designating OGMAs must also include an assessment of landscape level factors (position within the landscape, forest matrix context, size of patch etc – see Holt and Steeger 1998 for further details). The procedure for laying out OGMAs is detailed in the Landscape Unit Planning Guide (Ministry of Forests and Ministry of Environment Lands and Parks, 1999). In many cases, opportunities will exist for choosing combinations of OGMAs which provide higher biological benefit within the policy constraints outlined. Determining the stand level attribute value present in a stand should be the first step in this assessment procedure. Stand ___________ Variant: ICHdw Size _____________
Slope ___________ Site series ________________ FC age ___________
Attribute Measured Value
Score Thresholds
Not-old
Recruit-ment Old
Recruit-ment Old
Mean age 110 173 Mean Maximum age 177 281 Density trees >50cm dbh 34 64 Largest dbh on plot 58 71 Density trees 12.5 -40cm 222 145 # CWD >30cm, on 34m1 10 15 % trees >50 w deadtops2 20 49 % trees >50 w pathogens3 40 70 Lichen abundance4 Low Medium Density of snags >50cm 7 11 Density snags 12.5 – 25cm 79 35 sum
(*1) sum (*2)
sum (*3)
+ + = Total Score Comments and Landscape Considerations: 1: # pieces of CWD with dbh > 30cm, on 34m transect through plot 2: % of large trees (>50cm dbh) with dead or broken tops 3: % of large trees (>50cm dbh) with evidence of pathogens 4: based on Armleder et al. 1992.
Figure 13. An example scorecard for a stand in the ICHdw.

R.F. Holt et al. 1999. An index of old-growthness for two variants in the ICH.
26
Discussion Defining what is an old-growth forest has received much recent attention. Definitions based solely on age are used since they are simple to employ, however, it is widely acknowledged that definitions based on stand structural attributes are more useful for describing ecological processes and habitat values (Franklin and Spies 1991, B.C. Ministry of Forests 1992, Kneeshaw and Burton 1998, Wells et al. 1998). It is generally accepted that old-growth forest is at the end of a continuum from stand initiation3, and a review of existing literature has demonstrated the lack of functional ecological thresholds marking the development of old-growth from younger forest stands (Hunter and White 1997). Spies and Franklin (1988), working in coastal Douglas-fir forests, suggest two attribute development curves: a U-shaped function which describes attributes which are initially plentiful after a disturbance event (often remnants of the previous old stand) which then decrease through the mid-seral and then increase into the old-growth stage (e.g. volume of coarse woody debris); and an S-shaped curve which describes attributes that increase in abundance after a disturbance event and eventually taper off, or reach a plateau (e.g. biomass). Although, the rate of change of attributes over a short period of time can be quite rapid in some ecosystems (e.g. Tyrell and Crow 1994), it is generally thought that the rate of change of attributes does not follow a step function, and so cannot readily be considered useful for defining thresholds. It must be accepted then that any old-growth definition will be somewhat arbitrary (Hunter and White 1997). Spies and Franklin (1988; Franklin and Spies 1991) use this assumption as the basis for their ‘index of old-growthness’ where the successional status of a stand is ranked on the basis of a number of attributes. Stands are not dismissed because they ‘fail to meet old-growth standards’, but are instead given a relative ranking based on the abundance of a number of attributes. This approach receives much support because it may avoid potential short-sighted errors in old-growth designation (Hunter and White 1997; Wells et al. 1998). In this report, we use a multivariate technique to identify groupings of mid- and old-seral plots based on stand structural attribute data, and use these groups to identify threshold values for ranking the old-growthness of older seral stands of the ICHmw2 and ICHdw BEC variants. In general, we feel that this approach was successful in objectively grouping plots, and in producing meaningful threshold values for some attributes which can be used to rank candidate old-growth management areas (OGMAs) as ‘old-growth’, ‘recruitment’, or ‘not-old’ forest. In our principal components analysis, the data for the ICHmw2 variant split into natural groupings more easily than did that for the ICHdw. This is perhaps due to the greater abundance of old stands sampled in the ICHmw2 which are then more easily discriminated from younger stands. Finding sufficient old ICHdw stands whose structures have not been altered by previous logging or which were not severely impacted by other developments proved to be a severe limitation to this study. The lack of ‘natural’ old stands (due to the combination of human development and fire suppression) may also result in lower values than natural old-growth for some of the attribute thresholds, and is a considerable problem for any study attempting to assess ‘natural’ old-growth in this variant. Another factor in the lack of groupings in the ICHdw may be the wider range of types and intensities of disturbance naturally occurring in the ICHdw. The ICHdw includes areas which naturally undergo light-intensity stand-maintaining fires (e.g. Beck (1984) calculated a fire return of just over 11 years for an ICHdw/ 01a stand), as well as severe stand-destroying fires and intermediate-intensity fires, in which portions of the stand survive. We had hoped not to include the drier sites in sampling the ICHdw, however, it was very hard to find sites of a suitable age class which were not dry or rocky, or alternatively, were not riparian. We decided to avoid riparian areas since these appeared to be quite different, and instead used drier sites. Although we do not see obvious patterns of increased productivity (density of big trees used as a surrogate) with site series, an effect would be expected, and our negative result could be due to a lack of power to detect an effect on a single variable.
3 Some authors recognize antique or ancient forests as distinct from old growth. These climax forests have been free of stand level disturbances for longer than the maximum life span of the climax trees.

R.F. Holt et al. 1999. An index of old-growthness for two variants in the ICH.
27
In future work to develop thresholds, we suggest that it may improve the ability of the PCA to explain variation in the data if a number of extra variables were sampled. These might include measures of vertical or horizontal heterogeneity (see Kneeshaw and Burton 1998 for examples). We originally noted the presence and distance from the plot of gaps in our stands. However, we observed almost no variation in the data, with almost all stands (except the very youngest) having gaps present. An improvement may be to count the number of gaps within 30 m of plot centre. In addition, it would be useful to include a specific diameter measure for coarse woody debris to allow measures of volume / hectare to be included in the analysis. Our initial intention was to focus on attributes which are both easily and repeatably measured, however, we feel that in some s these additional attributes may be worth the effort to sample. More extensive attribute sampling will provide additional information to discriminate between the old-growthness of stands.
Alternative Methods of Old-growth Definition Defining whether a stand is old-growth can be achieved using a variety of techniques. Age-class structure is one approach to determining whether an individual stand has attained the functional stand development stage of old-growth (Oliver and Larson 1990; Kneeshaw and Burton 1998). This definition is based on the point at which the replacement cohort becomes dominant over the immediate post-disturbance cohort. The advantage of this approach is that it does not rely on threshold values based on other stands, however, it requires intensive sampling of ages within the stand, does not allow relative ranking between stands, and does not directly evaluate structural attributes important to habitat. These attributes may be present long before the replacement cohort dominates the stand, especially where the post-disturbance trees are long-lived. Alternatively, Quesnel (1996) summarised statistics from an existing data set (biogeoclimatic classification system data) for stands assumed a priori to be old-growth (in this case greater than 140 years). A threshold value for each attribute was determined, based on one standard error lower than the mean value for each attribute. Any stand that reaches this lower threshold for any attribute is then considered to be old-growth (Quesnel 1996). Potential problems with this approach include: (i) assuming that all stands measured are actually old-growth; (ii) assuming that the attributes used for thresholds are positively correlated with old-growthness (e.g. trees with a DBH 30 – 50 cm are not correlated with old-growth (as defined by PCA-1 scores) in our data: PCA-1 component matrix score of 0.036 in the ICHdw), (iii) that meeting the threshold for one attribute is sufficient to make the stand old-growth, (iv) that all attributes have equal weight in defining old-growthness. However, it does provide a conservative approach for defining old-growth stands. More complex indices have also been developed. For instance, Kneeshaw and Burton (1998) used threshold values for attributes positively associated with old-growth development based on the mean values between the maximum level found in mature stands and the minimum level found in old stands. These threshold values were then weighted by the correlation with PCA-1. We investigated the use of an approach similar to that of Kneeshaw and Burton and examined the potential to use correlation coefficients from the PCA as weighting factors. However, we noticed that, although the position of plots in factor space was relatively stable with changes in attributes, the correlation matrix score was quite significantly affected by the attributes used in the analysis. We therefore decided that it was inappropriate to use the PCA correlation scores as weighting factors. Instead, we used PCA to determine natural splits in the data, and then provide threshold values for different levels of old-growth based on these splits. We feel this is the most useful approach since it not only provides a ranking approach for stands, but also allows direct evaluation for each attribute. It can then easily be adapted to identifying OGMAs which overlap with other biodiversity values. For instance, Mountain Caribou Special Management Zones often overlap with OGMAs (R.F. Holt unpubl. obs), but have additional specific stand structure requirements (Stevenson et al. 1994). Using any single approach to define old-growth is inherently circular since there is only hypothesis generation, and no independent way to test the hypothesis. Kneeshaw and Burton (1998) overcame this problem by intensive field sampling and comparing the results of multiple approaches to rank the old-
R.F. Holt et al. 1999. An index of old-growthness for two variants in the ICH.
28
growthness of stands. They found that the stands on extreme ends of the scale (definite old-growth and definite ‘not’ old-growth) retained the same relative position and category irrespective of the approach. However, some intermediate stands changed relative rank and category depending on the method used. This was because different methods targeted different attributes. We were unable to compare different methodologies since the scope of the project did not allow intensive sampling on a suitable scale. We hope that the scorecard approach will assist planners in selecting from these intermediate stands based on the biodiversity objectives for their landscape unit.
Stand Age Stand age, while appearing to be a straightforward concept, has some problematic aspects. The most widely applied definition in B.C. is that of B.C. Ministry of Forests Inventory Branch, which theoretically relates to the mean age of the one hundred tallest trees in a stand. Practically, it is the mean age of two individuals per species of the dominant and codominant trees and in the case of forest cover mapping is photo-interpreted. Other authors have considered stand age to be the age of the oldest tree in the stand where there was no evidence of subsequent disturbance (i.e. fire scars; Kneeshaw and Burton 1998). In environments such as the ICHmw2 and ICHdw, disturbances are of variable severity and frequency and fires often do not destroy the entire stand as evidenced by fire scars on living trees. One of the problems in interpreting stand age arises when applying the same definition to stands that have had very different stand development histories. Using two 140 year old stands as an example: one could have arisen from a severe fire about 150 years ago with most dominant and codominants establishing shortly after that fire, while the other stand may have numerous 300 year old stems that survived a moderate intensity fire about 80 years ago. Although sharing the same nominal stand age, these stands would contain very different structural attributes. Using the mean age of trees currently in the stand is therefore inappropriate since it ignores the fact that the overall stand age may be much older. In forest types dominated by stand-replacing fires, the age of the oldest trees on the plot may be a more true measure of stand age (and even so may still be an underestimate of true stand age). In stands typically dominated by stand-maintaining or moderate intensity fires, the mean age of the canopy (excluding veteran trees) may be a suitable stand age, but the appropriateness of this will depend on the basal area of veteran trees retained. If they constitute a large percentage of the basal area then this should be reflected in the stand age. Another approach to try to simplify the interpretation of stand age is to sample ages based on basal area above a minimum DBH limit (K. Illes, pers. comm. 1998). In areas where variable severity disturbances occur (such as the bulk of the Nelson Forest Region), using mean stand age as the only criteria for assessing old-growth status can be very misleading, and some measure of the variability in tree age is necessary in order to interpret stand age. One conclusion from this project is that forest cover age classes are insufficient to define the true old-growth status (and biological value) of forest stands. There are a number of reasons for this. Firstly, forest cover age classes are often incorrect. This was shown in our presentation of measured age versus predicted age from forest cover labels (figures 1 and 7). Across the two variants, 39% of labeling was incorrect, with 27% of the stands being younger than the inventory label. In addition, in some instances a stand may in fact be ‘old’ but may contain few old-growth attributes, particularly at high elevations (S. Clow pers. comm.). These stands may fail to provide adequate habitat values for species reliant primarily on old-growth forests. It was not one of our express objectives to reassess the age class cut-offs for old-growth suggested in the Forest Practices Code Biodiversity Guidebook (B.C. Ministry of Forests and BC Environment 1995), given our limited sampling. However, our analyses do suggest some mean ages for the different groupings of old-growthness. For the ICHdw, we derived a threshold age for older stands of 174 years, with a younger threshold of 110 years for recruitment old-growth. These thresholds (and the associated means for the old, intermediate and young groups) are somewhat similar to the current FC age class definition of 140 years. For the ICHmw2, we determined threshold ages of 286 years for older stands, and 147 years for recruitment stands, which also brackets the Biodiversity Guidebook value of a 250 year threshold for this variant. Examination of plots of age versus PCA scores (Figures 4 and 11), there are no high old growth scores

R.F. Holt et al. 1999. An index of old-growthness for two variants in the ICH.
29
below about 200 years and by 270 years all stands rank high in the ICHmw2. In the ICHdw the break to high scores is not so well defined but by age 140 scores are uniformly high, which again is in general agreement with current age-class definitions. Our approach, however, allows stands at different places along this continuum to be ranked and classified irrespective of age. This will increase flexibility in landscape unit planning while maintaining biodiversity values as a priority in OGMA selection.
Comparisons of our results with existing data Three other authors (see below) have examined structural attributes of stands in the Nelson Forest Region and in ecologically similar area. Quesnel (1996) used data collected by the BEC program, and compiled live tree and snag data by site series for stands greater than 140 years (considerably younger than the present definition of 250 years for old growth in the ICHmw2; B.C. Ministry of Forests and BC Environment 1995). Quesnel did not subdivide snags into size classes, and since trends in distribution of snags in different size classes will differ with stand age, these snag data do not provide useful comparisons. For the ICHdw, our attribute values fall within the range reported by Quesnel (Table 7), even in the case where our stand age is considerably older. We also found considerably more large trees in our ‘old’ category in the ICHmw2 than in Quesnel’s most productive site series (though our stands were also considerably older than Quesnel’s). The US Forest Service generated definitions based on minimum standards for old-growth in areas immediately south of the Nelson Forest Region (Green et al. 1992). The process used to derive minimum standards is unclear, but it appears to have involved subjective assessment of inventory plot data for stands above a specific (unstated) age. The definitions are based on the number of large trees, large tree age, and basal area. Their definitions are presented for groups of similar habitat types (equivalent to site associations) and geographic area. Their North Idaho, Douglas-fir, grand fir, western larch, Engelmann/subalpine fir, western hemlock, white pine types in cool, moist environments are most equivalent to the sites sampled in the ICHdw. The North Idaho western red cedar type in moist environments is most equivalent to the ICHmw2 site series sampled. Their minimum standards for both forest types are considerably lower than those from other studies (Table 7). These relatively low numbers and young age particularly for the ICHmw2, may be due to having minimum standards based on only three criteria or to having a limited selection of very old stands for purposes of comparison. Having stringent minimum criteria based on a number of features may lead to rejecting stands with other old-growth attributes (Franklin and Spies 1991). In our analysis, when a subset of attributes were input into PCA, a split between old and not-old was still very evident on the PCA-1 axis, however several younger stands were ranked as ‘old’ (Holt et al. unpubl. data). This suggests that using fewer variables in the assessment of thresholds for old-growth results in a reduction in accuracy, particular in differentiating between old and not-old stands. Gulyas and Elm (1998) used MLSIS (Major Licensee Silviculture Information System) and ISIS (Integrated Silviculture Information System)4 data to produce summaries of live and dead trees for 50 stand types (leading species / site class) in 21 biogeoclimatic variants throughout the province. In their report they present data for four size classes (<20cm. 20.1-50.0 cm, 50.1 - 100 cm, and >100 cm dbh), and we present the data for trees > 50.1 cm dbh in Table 7. They present no data for the ICHdw and use only two old-growth (250 years or greater) stands in the ICHmw2. In addition, their two plots had only one size class of snags represented (neither plot had any small snags), in contrast to our data in which all plots had small snags, the vast majority had medium sized snags, and most old plots had >50cm snags.
4 MLSIS and ISIS are information management systems that capture, organize and processe land-based information required for silviculture management for major licensees and Forest Service respectively. Documentation on ISIS is contained on the following web site: http://www.for.gov.bc.ca/isb/isis/index.htm

R.F. Holt et al. 1999. An index of old-growthness for two variants in the ICH.
30
Table 7. Summary of available and comparable data for the density of live trees in stands similar to the ICHdw and ICHmw2.
Site series or variant/old growth category
number of plots / stands sampled1
mean stand age Big tree density2 / hectare
ICHdw, or similar: Old - our data 18a 228 75a
Recruitment – our data 13a 120 53a ICHdw/01a – Quesnel 3b 189 39a ICHdw/01b – Quesnel 3 b 152 104a ICHdw/03 – Quesnel 2 b 157 70a
Similar Idaho stands – Green et al. - 150 25b ICHmw2 or similar
Old – our data 13a 402 140a Recruitment – our data 22a 179 29a ICHmw2/01 – Quesnel 14 b 198 77a ICHmw2/03 – Quesnel 1b 221 105a ICHmw2/04 – Quesnel 6b 184 100a ICHmw2/05 – Quesnel 12b 185 121a
Similar Idaho stands – Green et al. - 150 25c Gulyas and Elm 1998 2 - 93a
1: Scale of analysis unit: (a) plots, (b) stands. 2: a: > 50cm dbh; b: >53cm dbh; c: >63cm dbh.
Stand versus landscape level considerations The procedure we present to index ‘old-growthness’ is a stand level structural attribute ranking procedure only. It does not include other stand and landscape level variables which should (ecologically) be considered when delineating old-growth management areas. At the stand level these include: size of the patch (for interior habitat conditions), human-initiated disturbance within or adjacent to the patch (e.g. old roads, old high-grading, location of housing, powerlines, etc.), and other rare features within the patch. At the landscape level, additional considerations include: position in relation to other OGMAs within the landscape unit and with adjacent landscape units, connectivity potential of the patch, state of the surrounding forest cover matrix (an OGMA buffered by surrounding forest may have higher short term value than one surrounded by clearcuts), other special management zone or biodiversity values in the landscape. Note that many of these stand and landscape level attributes are not included in the current guidelines for landscape unit planning and old-growth management area designation. Current policy is that these features may not be managed for unless it is known that this will not significantly impact timber supply over other choices of old-growth management area (BC Ministries of Forests and Environment, Lands, and Parks 1999). However, there will be many scenarios either when there is an excess of old-growth outside the timber harvesting landbase, or where OGMAs must be designated within the THLB, when it will be possible to consider the variables outlined above without having any further impact on timber supply. In is the authors opinion that designation of old-growth management areas without consideration of both stand and landscape level parameters will result in an inefficient use of the ‘timber budget’ allocated to biodiversity management in British Columbia.
Shortcomings of methodology There were a number of areas where our methods could have been improved. If future work of this type is undertaken, these deficiencies should be addressed. It should be remembered that this was a low budget project and inevitable shortcomings stem from this constraint.

R.F. Holt et al. 1999. An index of old-growthness for two variants in the ICH.
31
1. The number of samples within a site series should be increased so that site series effects, such as that seen in the ICHmw2, can be accounted for. Subhygric sites should be treated separately from drier site series.
2. Although our method of assessing CWD was very quick and allows for a relative assessment of abundance, it does not allow for calculation of volume. This would be very useful when comparing to other sites since many published reports quote volumes of CWD. Measuring dbh of pieces encountered on line transects would alleviate this shortcoming (Marshall and Bugnot 1997).
3. Large-sized snags and live trees are often present at very low densities and our plot size was too small for an accurate assessment of large snag density. The threshold for the not-old group in the ICHdw would equate to finding less than one snag per plot. A larger plot size for these variables would likely increase the efficacy of this measure.
4. We did not consistently evaluate the presence of fire scars or veteran trees and so do not have a good assessment of how many stands were subject to moderate intensity fires during their development.
5. Vertical structure was not directly assessed. Diameter distribution of smaller diameter trees was assessed, which should reflect vertical structure. In our search of the literature we did not find a quick means of assessing canopy structure.
6. We did not assess the presence of gaps with sufficient resolution to identify variation among plots. A count of the number of gaps above a certain minimum size within sight of plot centre might yield useful information. Otherwise methods to quantify gaps are very time consuming. The use of simple measures of gap structure are unlikely to distinguish mature from old-growth stands (R. Wells, pers. comm. 1999).
7. We did not characterize age class structure, which is important in assessing old-growth status from a stand development viewpoint. This, however, would again be extremely time-consuming.
8. Our method of ranking stands does not include a weighting of factors. Some factors are more strongly correlated than others with old-growth status. The fact that our correlation coefficients were unstable may be a result of our small sample size.
Future work The field card method presented in this paper should be field-tested. A number of stands should be selected to sample a range of stand ages and structural attributes. These stands would then be subjectively evaluated with regards to their old-growthness and these subjective rankings would be compared to rankings using the scorecard. This is especially relevant given the relatively low sample size of this pilot project. This field test is currently in progress by the authors. The process of OGMA delineation is underway throughout the province. Candidate areas need to be evaluated by a quick, reproducible, objective method. We propose that this method be extended to other variants, especially in areas where (i) there are significant deficits of old forest (compared to guidelines for old-growth retention) and (ii) where there are multiple choices available to planners (e.g. in high elevation areas with large areas of old-growth).

R.F. Holt et al. 1999. An index of old-growthness for two variants in the ICH.
32
Conclusions and Recommendations 1. Age provides a basis for defining old-growth, but there is considerable additional variation in old-
growth quality unaccounted for by broad age-class definitions. Stand structural attributes should be used to refine definitions and ranking procedures.
2. Stand age descriptions on forest cover maps are inadequate for designating OGMAs. Many were
incorrect based on mean age, and no indication of variation in age class structure is given. Maximum age may be a more suitable measure in stands where no disturbances have occurred since stand initiation. In addition, some ‘old’ stands contain poor representation of old-growth habitat attributes and may therefore be less desirable for conservation purposes than old stands with higher structural attributes diversity. Forest cover mapping is still the most easily available and useful tool for initial identification of candidate OGMA’s, however, additional information gained by aerial surveys and final ground checking for attributes is necessary to evaluate attributes quality.
3. The methodology for sampling and indexing old-growth patches proved quite effective. A single stand
could be assessed in about four to eight hours (including age core examination under binocular microscope). We suggest that this will provide a suitable way to resolve questions about old-growth quality in the field.
4. The ICHdw has an extreme deficit of old-growth forest (compared to guidelines for old-growth
retention). The low availability of natural old-growth is a result of the combination of historical fire-setting (for mineral exploration), high urban and industrial development, creation of travel corridors, harvesting (past and present), and fire suppression (allowing ingrowth in some of the drier site series). Regardless of the cause, the lack of a representative natural old forest in this variant is a severe obstacle in the attempt to manage forests by mimicking natural disturbance patterns (B.C. Ministry of Forests and B.C. Environment 1995), since it is difficult to even gather baseline data. Protection of the remaining old-growth and suitable recruitment old-growth in this variant must be a priority.
5. Disturbance intensity is variable in both the ICHdw and ICHmw2. This is evidenced by the widespread
occurrence of veteran trees and fire scars in both old and younger stands. Stand structural attributes retained after disturbance provide important habitat (Steeger et al. 1998) and should be conserved across the landscape in stands of all ages.
6. Although the sample design was not intended to test for differences in attributes by site series, there is
significant variation in at least one variable (density of large trees) in ICHmw2 with site series. Current policy in British Columbia is to designate OGMAs at the level of the variant, and not at any finer scale. Representation of old-growth at the variant level, in concert with policy to preferentially locate all OGMAs outside the timber harvesting landbase will result in the majority of OGMAs located on steep slopes and in riparian areas in some areas of the Province. More research is required to evaluate whether, and to what extent, important ecological variation will be lost as a result of this policy. A limited analysis of the potential risk to biodiversity as a result of this policy is underway (M. Eng. pers. comm.), however the scope of the analysis should be expanded to allow a thorough evaluation of potential risks (R.F. Holt, pers. obs).

R.F. Holt et al. 1999. An index of old-growthness for two variants in the ICH.
33
References Armleder, H.M., S.K. Stevenson and S.D. Walker. 1992. Estimating abundance of arboreal forage lichens.
Land Management Handbook Field Guide Insert 7. Ministry of Forests Research Program, B.C. Beck, J. 1984. Fire history and range enhancement study for the Cayuse Creek Area. Unpublished report.
Selkirk College Library, Castlegar, BC. Braumandl, T.F. and M.P. Curran. 1992. A field guide for site identification and interpretation for the
Nelson Forest Region. BC Min. For. Research Branch, Victoria, B.C., Land Manage. Handb. No 20.
B.C. Ministry of Forests. 1992. An old-growth strategy for British Columbia. Victoria, BC. B.C. Ministry of Forests and BC Environment. 1995. Biodiversity Guidebook. Forest Practices Code of
British Columbia, Victoria, BC. BC Ministries of Forests and Environment, Lands, and Parks. 1999. Landscape unit planning guidebook.
Forest Practices Code of British Columbia. Victoria, B.C. Franklin, J.F. and T.A. Spies. 1991. Ecological definitions of old-growth Douglas-fir forests. in L.F.
Ruggiero, K.B. Aubry, A.B. Carey, and M.H. Huff, tech. coordrs. Wildlife and vegetation of unmanaged Douglas-fir forests. General Technical Report PNW-285, USDA, Forest Service, Portland, OR.
Goward, T. 1993. Crown of the ICH: epiphytic macrolichens of old growth forests in the interior cedar-
hemlock zone. Bioline, Vol. 11, No. 2, Fall/winter 1993. Pages 15-17. Green, P., J. Joy, D. Sirucek, W. Hann, A. Zack, and B. Naumann. 1992. Old-growth forest types of the
Northern Region. R-1 SES 4/92. USDA Forest Service. Northern Region, Missoula, MT. Gulyas, G. and T. Elm. 1998 Structural Attributes of Forest Stands. Contract report for B.C. Ministry of
Forests, Forest Practices Branch. Victoria, B.C. Holt, R.F and C. Steeger 1998. An ecological methodology for old seral identification, assessment and
ranking at a landscape scale, in the Nelson Forest Region. Final report of phase II. Prepared for Kootenay Boundary Land Use Implementation Task Force, Nelson Forest Region. 36 pp.
Hunter M.L. and P. White. 1997. Ecological thresholds and the definition of old-growth forest stands.
Natural Areas Journal 17: 292-296. Kneeshaw D.D. and P.J. Burton. 1998. Assessment of functional old-growth status: a case study in the Sub-
boreal Spruce Zone of British Columbia, Canada. Natural Areas Journal 18:293-308 Manly, B.F.J. 1986. Multivariate Statistical Methods: A Primer. Chapman and Hall, New York. Marcot, B.G., R.S. Holthausen, J. Teply, and W.D. Carrier. 1991 in L.F. Ruggiero, K.B. Aubry, A.B.
Carey, and M.H. Huff, tech. coordrs. Wildlife and vegetation of unmanaged Douglas-fir forests. General Technical Report PNW-285, USDA, Forest Service, Portland, OR.
Marshall, P.L. and J.L. Bugnot. 1997. Review of some designs for sampling coarse woody debris. Research
Report prepared for the BC Ministry of Forests, Vancouver Region, 55 pp. Oliver, C.D. and B.C. Larson. 1990. Forest stand dynamics. McGraw-Hill, Inc. New York, NY.

R.F. Holt et al. 1999. An index of old-growthness for two variants in the ICH.
34
Quesnel, H.J. 1996. Assessment and characterization of old-growth stands in the Nelson Forest Region.
Technical Report TR -013. B.C. Ministry of Forests, Forest Sciences Section, Nelson, B.C. Sokal, R.R. and F.J. Rohlf. 1981. Biometry. The Principle and Practice of Statistics in Biological Research.
2nd Edition. W.H. Freeman and Co. New York, NY. Spies, T.A. and J.F. Franklin. 1988. Old-growth and forest dynamics in the Douglas-fir region of western
Oregon and Washington. Natural Areas Journal 8: 190-201. Steeger, C., R.F. Holt, H. Quesnel and M-A. Beaucher. 1998. Post-disturbance residual stand structure: its
value as wildlife habitat. Report prepared for BC Environment, Nelson, B.C. 56pp. Stevenson, S.K., H.M. Armleder, M.J. Jull, D.G. King, E.L. Terry, G.S. Watts, B.N.McLellan, and K.N.
Child,. 1994. Mountain caribou in managed forests. Research Branch, B.C. Ministry of Forests. Tabachnik, B.G. and L.S. Fidell. 1996. Using Multivariate Statistics, 3rd Ed. HarperCollins College
Publishers. 880 pages. ter Braak, C.J.F. 1995. Ordination. Pages 91-173 in: Data analysis in community and landscape ecology.
(Jongman, R.H.G; ter Braak, C.J.F; Van Tongeren, O.F.R Eds.) Cambridge University Press. Tyrell L.E. and T.R. Crow 1994. Structural characteristics of old-growth hemlock hard-wood forests in
relation to age. Ecology 75: 370-386. Wells, R., K.P. Lertzman, and S.C. Saunders. 1998. Old-growth definitions for the forests of British
Columbia, Canada. Natural Areas Journal 18:279-292

Appendices 1-2
Appendix 1: Example scorecards completed for three stands in each of the ICHmw2 and ICHdw, and
photorerepresentation of plots. Appendix 2: Summary data for stands sampled in the ICHmw2 and ICHdw.

R.F. Holt et al. 1999. An index of old-growthness for two variants in the ICH.
Appendix 1. Example scorecards for the ICHmw2 and ICHdw. Below, we present three examples of using the scorecard and the threshold tables from data we collected. Our intent is not to ‘test’ our thresholds, but to demonstrate the utilisation of the methodology. The examples chosen are to illustrate a very high quality old-growth stand (example A), a recruitment stand (Example B) which has some old-growth attributes, and a “not-old” (example C) stand, which has almost no old-growth attributes. ICHmw2: Example A (old-growth). Stand: Glenmerry Variant: ICHmw2 Size 60 ha.
Slope 20% Site series 01 FC age 140 - 250
Attribute Measured Value
Score Thresholds
Not-old
Recruit-ment Old
Recruit-ment Old
Mean age 542 b 147 286 Mean Maximum age 1014 b 204 411 Density trees >50cm dbh 223 b 25 84 Largest dbh on plot 115 b 57 74 % trees >50 w dead tops1 45 b 13 29 % trees >50 w pathogens2 45 b 18 37 Density of snags >50cm 13 b 11 18 Density snags 10 – 25cm 50 b 77 45 sum
(*1) sum (*2)
sum (*3)
0 + 4 + 18 = 22 Total Score Comments and Landscape Considerations: 1: % of large trees (>50cm dbh) with dead or broken tops 2: % of large trees (>50cm dbh) with evidence of pathogens
Glenmerry – old-growth stand.

Holt et al. 1999 An index of old-growthness for two variants in the ICH
ii
Example B (Recruitment). Stand: Six Mile Lake Variant: ICHmw2 Size 60 ha.
Slope 60% Site series 01 FC age 140 - 250
Attribute Measured Value
Score Thresholds
Not-old
Recruit-ment Old
Recruit-ment Old
Mean age 197 b 147 286 Mean Maximum age 327 b 204 411 Density trees >50cm dbh 67 b 25 84 Largest dbh on plot 78 b 57 74 % trees >50 w dead tops1 35 b 13 29 % trees >50 w pathogens2 27 b 18 37 Density of snags >50cm 13 b 11 18 Density snags 10 – 25cm 10 b 77 45 sum
(*1) sum (*2)
sum (*3)
0 + 10 + 9 = 19 Total Score Comments and Landscape Considerations: 1: % of large trees (>50cm dbh) with dead or broken tops 2: % of large trees (>50cm dbh) with evidence of pathogens Six Mile Lake – recruitment site

Holt et al. 1999 An index of old-growthness for two variants in the ICH
iii
Example C (Not-old). Stand: MacDonald B Variant: ICHmw2 Size 60 ha.
Slope 15% Site series 01 FC age 120 - 140
Attribute Measured Value
Score Thresholds
Not-old
Recruit-ment Old
Recruit-ment Old
Mean age 107 b 147 286 Mean Maximum age 139 b 204 411 Density trees >50cm dbh 17 b 25 84 Largest dbh on plot 61 b 57 74 % trees >50 w dead tops1 11 b 13 29 % trees >50 w pathogens2 11 b 18 37 Density of snags >50cm 0 b 11 18 Density snags 10 – 25cm 61 b 77 45 sum
(*1) sum (*2)
sum (*3)
6 + 4 + 0 = 10 Total Score
Comments and Landscape Considerations: 1: % of large trees (>50cm dbh) with dead or broken tops 2: % of large trees (>50cm dbh) with evidence of pathogens MacDonald B – ‘not-old’ stand.

Holt et al. 1999 An index of old-growthness for two variants in the ICH
iv
ICHdw: Example A (old-growth). Stand: Erie Variant: ICHdw Size 25 ha
Slope 20% Site series 01b FC age 9
Attribute Measured Value
Score Thresholds
Not-old
Recruit-ment Old
Recruit-ment Old
Mean age 390 b 110 173 Mean Maximum age 826 b 177 281 Density trees >50cm dbh 90 b 34 64 Largest dbh on plot 88.5 b 58 71 Density trees 12.5 -40cm 57 b 222 145 # CWD >30cm, on 34m1 40 b 10 15 % trees >50 w deadtops2 55 b 20 49 % trees >50 w pathogens3 39 b 40 70 Lichen abundance4 - Low Medium Density of snags >50cm 33 b 7 11 Density snags 12.5 – 25cm 17 b 79 35 sum
(*1) sum (*2)
sum (*3)
1 + 0 + 27 = 28 Total Score Comments and Landscape Considerations: 1: # pieces of CWD with dbh > 30cm, on 34m transect through plot 2: % of large trees (>50cm dbh) with dead or broken tops 3: % of large trees (>50cm dbh) with evidence of pathogens 4: based on Armleder et al. 1992. Erie Creek – old-growth site

Holt et al. 1999 An index of old-growthness for two variants in the ICH
v
Example B. Recruitment. Stand : Kokanee Variant: ICHdw Size : 20ha
Slope 45 % Site series 01a FC age : 7
Attribute Measured Value
Score Thresholds
Not-old
Recruit-ment Old
Recruit-ment Old
Mean age 128 b 110 173 Mean Maximum age 187 b 177 281 Density trees >50cm dbh 47 b 34 64 Largest dbh on plot 67 b 58 71 Density trees 12.5 -40cm 157 b 222 145 # CWD >30cm, on 34m1 17 b 10 15 % trees >50 w deadtops2 6 b 20 49 % trees >50 w pathogens3 61 b 40 70 Lichen abundance4 0 – low b Low Medium Density of snags >50cm 7 b 7 11 Density snags 12.5 – 25cm 33 b 79 35 sum
(*1) sum (*2)
sum (*3)
2 + 14 + 6 = 22 Total Score Comments and Landscape Considerations: 1: # pieces of CWD with dbh > 30cm, on 34m transect through plot 2: % of large trees (>50cm dbh) with dead or broken tops 3: % of large trees (>50cm dbh) with evidence of pathogens 4: based on Armleder et al. 1992. Kokanee Creek : Recruitment stand

Holt et al. 1999 An index of old-growthness for two variants in the ICH
vi
Example C. “Not-old” forest. Stand : Falls Creek Variant: ICHdw Size: 30ha
Slope 40 % Site series FC age: 8
Attribute Measured Value
Score Thresholds
Not-old
Recruit-ment Old
Recruit-ment Old
Mean age 103 b 110 173 Mean Maximum age 154 b 177 281 Density trees >50cm dbh 30 b 34 64 Largest dbh on plot 81.4 b 58 71 Density trees 12.5 -40cm 270 b 222 145 # CWD >30cm, on 34m1 13 b 10 15 % trees >50 w deadtops2 0 b 20 49 % trees >50 w pathogens3 12.5 b 40 70 Lichen abundance4 0 – low b Low Medium Density of snags >50cm 0 b 7 11 Density snags 12.5 – 25cm 57 b 79 35 sum
(*1) sum (*2)
sum (*3)
8 + 4 + 3 = 15 Total Score Comments and Landscape Considerations: 1: # pieces of CWD with dbh > 30cm, on 34m transect through plot 2: % of large trees (>50cm dbh) with dead or broken tops 3: % of large trees (>50cm dbh) with evidence of pathogens 4: based on Armleder et al. 1992.
Proctor: “not-old” stand.

Holt et al. 1999 An index of old-growthness for two variants in the ICH
vii
Appendix 2. Summary data for stands sampled in the ICHmw2 and ICHdw. Summary table of data for ICHmw2
Site Site series FC age class
Mean age measured
SE age Maximum age
mean # of live trees >50cm
dbh
SE #/ha >50cm
live trees
max stand DBH (cm)
MacDonaldB ICHmw2/04 8 107 9 139 17 9 61 Shields ICHmw2/01 8 126 34 289 13 3 53
WilsonB ICHmw2/01 8 127 7 152 33 13 63 New DenverA ICHmw2/01 7 128 11 188 10 6 58 New DenverB ICHmw2/04 8 134 21 238 10 10 57
Tiger ICHmw2/01 8 134 18 219 17 9 53 Scalping ICHmw2/01 8 144 71 348 70 40 114
Six mile Lake ICHmw2/01 8 197 43 327 66 19 78 CollegeB ICHmw2/04 8 202 48 361 50 6 84 Silverton ICHmw2/05 8 222 55 404 133 37 110 WilsonA ICHmw2/01 8 247 59 475 53 24 70 CollegeA ICHmw2/05 9 322 94 726 193 29 102 Boundary ICHmw2/01 8 389 80 503 105 15 90 Kuskanax ICHmw2/04 9 402 40 519 137 17 97
MacDonaldA ICHmw2/01 9 434 154 1051 100 21 87 Pedro ICHmw2/01 9 468 167 1000 87 12 85
Bremner ICHmw2/01 9 474 142 942 117 38 106 Glenmerry ICHmw2/01 8 542 140 1014 223 22 115
Site seedlings/
ha SE
seedlings/ha
average live
trees<12.5/ha
SE live trees<12.5
/ha
average live trees
12.5-40/ha
SE live trees 12.5-
40/ha
average live trees 40-50/ha
SE live trees 40-
50/ha
MacDonaldB Shields 1000 0 753 346 224 97 10 6
WilsonB 917 83 454 168 201 89 7 3 New DenverA New DenverB
Tiger 600 32 331 143 152 75 30 6 Scalping 75 65 328 249 238 328 15 5
Six mile Lake 293 189 181 88 69 31 23 7 CollegeB Silverton 480 130 172 62 77 47 20 6 WilsonA 873 85 193 121 204 92 17 17 CollegeA Boundary 290 20 193 94 43 56 5 5 Kuskanax
MacDonaldA Pedro
Bremner 430 310 30 12 48 26 10 8 Glenmerry
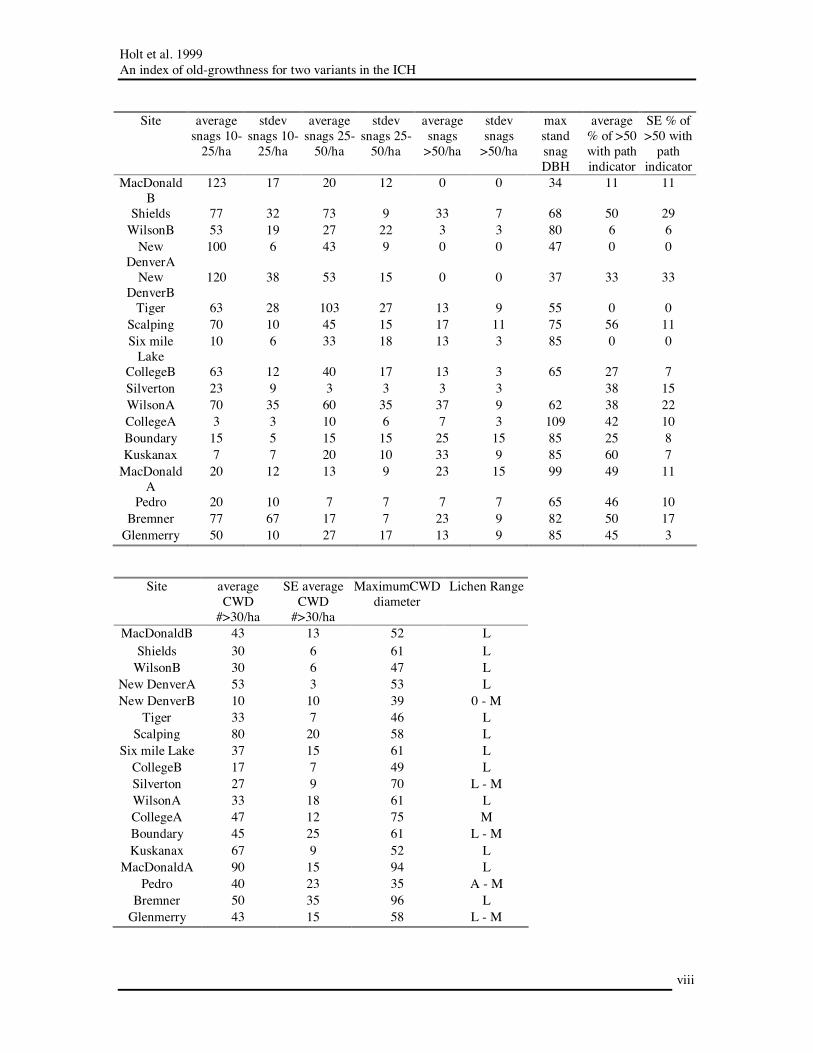
Holt et al. 1999 An index of old-growthness for two variants in the ICH
viii
Site average snags 10-
25/ha
stdev snags 10-
25/ha
average snags 25-
50/ha
stdev snags 25-
50/ha
average snags
>50/ha
stdev snags
>50/ha
max stand snag DBH
average % of >50 with path indicator
SE % of >50 with
path indicator
MacDonaldB
123 17 20 12 0 0 34 11 11
Shields 77 32 73 9 33 7 68 50 29 WilsonB 53 19 27 22 3 3 80 6 6
New DenverA
100 6 43 9 0 0 47 0 0
New DenverB
120 38 53 15 0 0 37 33 33
Tiger 63 28 103 27 13 9 55 0 0 Scalping 70 10 45 15 17 11 75 56 11 Six mile
Lake 10 6 33 18 13 3 85 0 0
CollegeB 63 12 40 17 13 3 65 27 7 Silverton 23 9 3 3 3 3 38 15 WilsonA 70 35 60 35 37 9 62 38 22 CollegeA 3 3 10 6 7 3 109 42 10 Boundary 15 5 15 15 25 15 85 25 8 Kuskanax 7 7 20 10 33 9 85 60 7
MacDonaldA
20 12 13 9 23 15 99 49 11
Pedro 20 10 7 7 7 7 65 46 10 Bremner 77 67 17 7 23 9 82 50 17
Glenmerry 50 10 27 17 13 9 85 45 3
Site average CWD
#>30/ha
SE average CWD
#>30/ha
MaximumCWD diameter
Lichen Range
MacDonaldB 43 13 52 L Shields 30 6 61 L
WilsonB 30 6 47 L New DenverA 53 3 53 L New DenverB 10 10 39 0 - M
Tiger 33 7 46 L Scalping 80 20 58 L
Six mile Lake 37 15 61 L CollegeB 17 7 49 L Silverton 27 9 70 L - M WilsonA 33 18 61 L CollegeA 47 12 75 M Boundary 45 25 61 L - M Kuskanax 67 9 52 L
MacDonaldA 90 15 94 L Pedro 40 23 35 A - M
Bremner 50 35 96 L Glenmerry 43 15 58 L - M

Holt et al. 1999 An index of old-growthness for two variants in the ICH
ix
ICHmw2: Total mean age for the stand, plus mean age and standard error by species. Mean age
measured Cw_age Cw_age
SE Hw_age Hw_age
SE Fd_age Fd_age
SE Lw_age Lw_age
SE Sx_age Sx_age
SE MacDonaldB 107 480 86 7 108 5 114 7
Shields 126 173 36 96 6 122 . 113 7 WilsonB 127 117 9 124 2 109 139 3
New DenverA
128 114 1 140 17 132 4
New DenverB
134 112 9 107 10 155 21 146 32
Tiger 134 136 10 136 14 152 28 118 Scalping 144 236 49 98 21 76 7 79 Six mile
Lake 197 171 26 159 18 298 19
CollegeB 202 145 7 295 15 Silverton 222 250 18 253 77 393 WilsonA 247 296 73 182 25 316 39 122 CollegeA 322 343 103 306 43 Boundary 389 489 7 363 45 Kuskanax 402 398 22 450
MacDonaldA 434 753 165 327 55 Pedro 468 454 230 474 106 439
Bremner 474 783 159 386 67 Glenmerry 542 711 122 414 74 66 5 631 38 408

Holt et al. 1999 An index of old-growthness for two variants in the ICH
x
Summary table of data for ICHdw Data are given per hectare where appropriate.
Site Site series FC age Mean age measured
SE age Max age Mean # live trees>50cm
dbh
SE live trees>50cm
dbh
Largest dbh > 50cm dbh
Erie 01b 9 390 52 826 90 6 89 Flats 01a, 01b 9 274 24 600 77 12 84
Hidden Cr 01b 8 231 20 345 77 105 Lemon 01a, 01b 8 196 28 383 33 20 82 Power 2 8 191 17 441 60 15 85 PDO 01a 8 174 9 196 77 12 91
Redfish 01b 9 169 16 355 83 18 80 Syringa 01a, 02 8 155 26 392 53 12 102
Big Sheep 02, 01a 8 149 18 222 50 21 65 Eco Res 02, 01a 8 142 18 338 50 26 88 WADF 01a 7 140 17 284 77 17 91
CIC 01b 8 135 8 258 60 6 86 Kokanee 01a 7 128 5 187 47 13 67 Proctor 01a 6 123 11 321 10 0 72 Sitkum 01a, 01b 6 115 5 245 23 9 63 Falls Cr 01a/01b 8 103 8 154 30 10 81
Ainsworth 01b 6 87 3 103 60 10 76 Church 01a 6 86 6 127 0 0
Site Mean #
live trees
<12.5cm dbh
SE live trees
<12.5cm dbh
Mean live trees 12.5-40cm dbh
SE live trees 12.5-40cm dbh
Mean # live
trees 40-50cm dbh
SE live trees 40-
50cm dbh
Mean # snags
10-25cm dbh
SE snags
10-25cm dbh
Mean # snags
25-50cm dbh
SE snags
25-50cm dbh
Erie 483 180 57 23 53 9 17 3 20 12 Flats 237 57 183 48 33 3 20 6 37 12
Hidden Cr 200 75 153 24 30 0 23 9 57 9 Lemon 67 42 87 12 40 10 33 15 13 9 Power 63 27 73 17 37 15 23 7 17 12 PDO 420 287 33 15 13 3 0 0 100 95
Redfish 133 27 190 55 30 10 30 10 33 3 Syringa 160 53 197 77 23 7 3 3 20 10
Big Sheep 90 71 87 32 10 10 20 6 20 10 Eco Res 57 12 147 35 13 3 7 3 27 15 WADF 43 19 110 6 27 18 17 9 10 6
CIC 397 53 220 15 33 20 23 7 27 7 Kokanee 23 19 157 7 23 12 33 9 33 12 Proctor 790 244 297 43 23 9 97 30 143 32 Sitkum 530 241 253 45 33 12 53 28 103 44 Falls Cr 315 143 270 33 30 24 57 43 13 3
Ainsworth 33 15 90 32 17 3 7 3 30 6 Church 170 52 227 15 13 9 13 3 0 0

Holt et al. 1999 An index of old-growthness for two variants in the ICH
xi
Site Mean #
snags >50cm
dbh
SE snags >50cm
dbh
Max snag dbh
Mean % trees
>50cm dbh with
path. indicator
SE % trees
>50cm dbh with
path. indicator
Mean % trees
>50cm with
broken/ dead tops
Mean CWD # >30cm
SE CWD # >30cm
Max CWD
diameter
Lichen range
Erie 33 9 82 39 13 55 40 10 70 L-H Flats 7 3 67 58 22 71 27 7 67 H
Hidden Cr 13 7 72 3 1 27 17 3 45 M Lemon 3 3 81 10 10 11 13 3 42 L-M Power 0 0 46 16 10 0 0 0 H PDO 0 0 23 10 3 13 3 65 H
Redfish 7 7 61 40 25 26 13 3 52 M-H Syringa 3 3 51 53 25 10 3 3 35 0
Big Sheep 3 3 59 0 0 0 17 9 61 L Eco Res 13 7 62.5 36 14 45 17 3 70 M-H WADF 7 3 87 74 5 0 0 0 0 L
CIC 20 12 74 51 5 51 10 6 40 0 Kokanee 7 7 61 11 6 17 7 52 0-L Proctor 13 9 55 0 0 0 17 7 52 0 Sitkum 3 3 52 25 14 12 3 3 35 0-M Falls Cr 0 0 13 13 0 13 3 40 0-L
Ainsworth 3 3 52 4 4 0 17 7 40 M Church 0 0 - - - - 3 3 0 L

Holt et al. 1999 An index of old-growthness for two variants in the ICH
xii
ICHdw: Total mean age, plus mean age and standard error (in parentheses), and sample size, by species. Site Total Fd Lw Py Cw Hw Bg Pw Sx Pl
Erie 390 (214) 17 - - - 553 (298) 5 322 (131) 12 - - - -
ND Flats 274 (117) 19 316 (125) 6 - - 289 (175) 5 233 (54) 8 - - - -
Hidden Ck. 231 (70) 13 330 (-) 1 - - 251 (72) 4 209 (64) 18 - - - -
Lemon 196 (105) 14 221 (105) 6 - 261 (127) 3 115 (7)3 106 (6)2 - - - -
Power 191 (72) 16 171 (26) 12 - 249 (132) 4 - - - - - -
P d’O 174 (39) 13 189 (5) 7 - 172 (31) 3 - - 53 (-) 1 185 (3) 2 - -
Redfish 169 (87) 27 244 (44) 6 109 (-) 1 275 (20) 4 85 (8)6 - 124 (45) 6 245 (155) 2 - 99 (13) 2
Syringa 155 (103) 13 85 (48) 5 159 (46) 4 238 (142) 4 - - - - - -
BS 149 (59) 11 141 (64) 9 170 (-) 1 197 (-) 1 - - - - - -
EcoRes 142 (71) 14 135 (52) 6 107 (-) 1 167 (98) 6 - - - - - 108 (-) 1
WADF 140 (67) 16 129 (58) 8 - 153 (79) 8 - - - - - -
CIC 135 (42) 31 173 (9) 6 134 (44) 5 - 160 (64) 5 115 (9) 4 97 (7) 6 184 (-) 1 143 (-) 1 100 (10) 3
Kokanee 128 (21) 19 130 (12) 6 138 (17) 2 130 (33)6 118 (24) 5 - - - - -
Proctor 123 (54) 20 103 (25) 6 133 (43) 4 - 170 (103) 4 93 (5) 2 - 108 (23) 4 - -
Sitkum 115 (30) 28 114 (10) 6 106 (23) 4 130 (68) 5 85 (7) 2 116 (19) 5 103 (12) 2 107 (7) 4 - -
Falls Creek 102 (37) 13 148 (11) 5 - - 73 (11) 3 83 (11)3 79 (17) 2 - - -
Ainsworth 87 (11) 18 93 (6) 6 92 (8) 6 - 72 (10) 4 - - 85 (2) 2 - -
Church 86 (22) 11 92 (25) 7 - 75 (12) 4 - - - - - -