Embed Size (px)
Citation preview
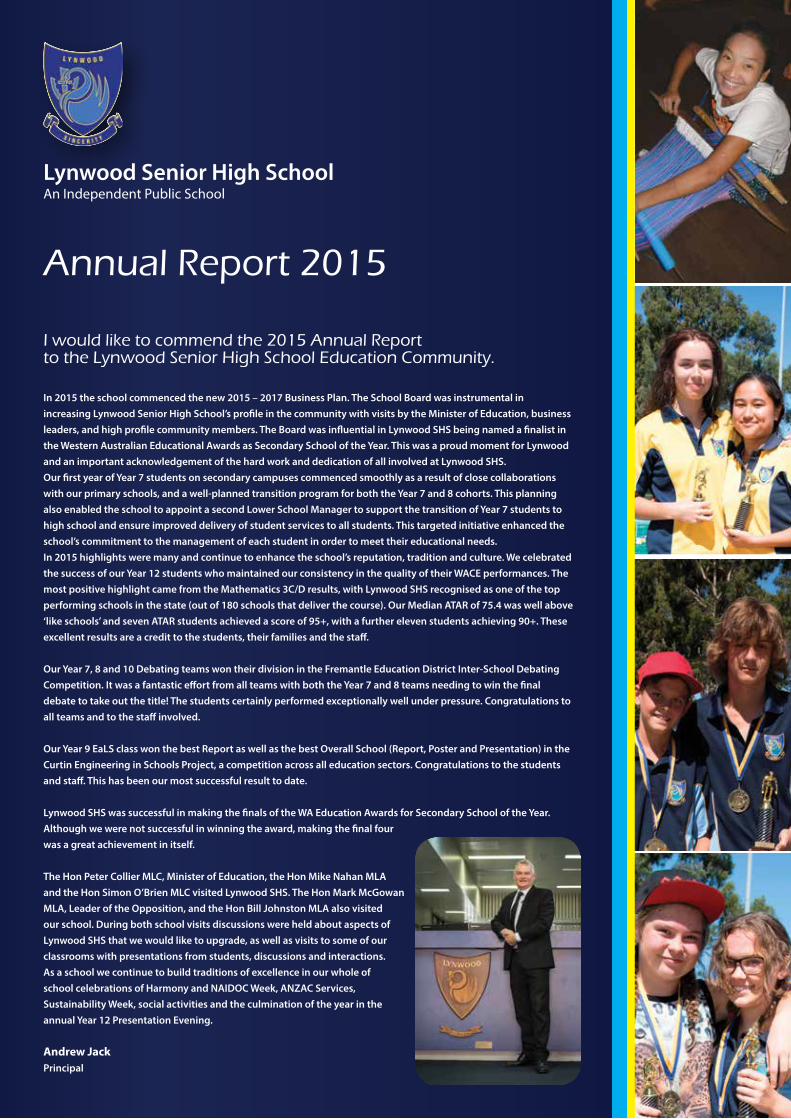
Lynwood Senior High School
Annual Report 2015
An Independent Public School
In 2015 the school commenced the new 2015 – 2017 Business Plan. The School Board was instrumental in increasing Lynwood Senior High School’s profile in the community with visits by the Minister of Education, business leaders, and high profile community members. The Board was influential in Lynwood SHS being named a finalist in the Western Australian Educational Awards as Secondary School of the Year. This was a proud moment for Lynwood and an important acknowledgement of the hard work and dedication of all involved at Lynwood SHS.Our first year of Year 7 students on secondary campuses commenced smoothly as a result of close collaborations with our primary schools, and a well-planned transition program for both the Year 7 and 8 cohorts. This planning also enabled the school to appoint a second Lower School Manager to support the transition of Year 7 students to high school and ensure improved delivery of student services to all students. This targeted initiative enhanced the school’s commitment to the management of each student in order to meet their educational needs.In 2015 highlights were many and continue to enhance the school’s reputation, tradition and culture. We celebrated the success of our Year 12 students who maintained our consistency in the quality of their WACE performances. The most positive highlight came from the Mathematics 3C/D results, with Lynwood SHS recognised as one of the top performing schools in the state (out of 180 schools that deliver the course). Our Median ATAR of 75.4 was well above ‘like schools’ and seven ATAR students achieved a score of 95+, with a further eleven students achieving 90+. These excellent results are a credit to the students, their families and the staff. Our Year 7, 8 and 10 Debating teams won their division in the Fremantle Education District Inter-School Debating Competition. It was a fantastic effort from all teams with both the Year 7 and 8 teams needing to win the final debate to take out the title! The students certainly performed exceptionally well under pressure. Congratulations to all teams and to the staff involved.
Our Year 9 EaLS class won the best Report as well as the best Overall School (Report, Poster and Presentation) in the Curtin Engineering in Schools Project, a competition across all education sectors. Congratulations to the students and staff. This has been our most successful result to date.
Lynwood SHS was successful in making the finals of the WA Education Awards for Secondary School of the Year. Although we were not successful in winning the award, making the final four was a great achievement in itself.
The Hon Peter Collier MLC, Minister of Education, the Hon Mike Nahan MLA and the Hon Simon O’Brien MLC visited Lynwood SHS. The Hon Mark McGowan MLA, Leader of the Opposition, and the Hon Bill Johnston MLA also visited our school. During both school visits discussions were held about aspects of Lynwood SHS that we would like to upgrade, as well as visits to some of our classrooms with presentations from students, discussions and interactions. As a school we continue to build traditions of excellence in our whole of school celebrations of Harmony and NAIDOC Week, ANZAC Services, Sustainability Week, social activities and the culmination of the year in the annual Year 12 Presentation Evening.
Andrew Jack Principal
I would like to commend the 2015 Annual Report to the Lynwood Senior High School Education Community.
Global targets - 2015OLNA 10 and 11
Reading• Trendtodecrease%ofstudentsinCategories1&2. Year10 2014:39%ofstudents
2015:40%ofstudents.Maintained
Year11-comparisonunavailable2015.
• Trendtoincrease%ofstudentsinCategory3. Year10 2014:61% 2015:60%Maintained Year11-comparisonunavailable2015.
Self-Assessment
Readingcomprehensioncontinuestobeafocusin2015/2016.School-basedtestingandanalysisofdataareintegraltotheschool’sprocessesandcomplementtheNAPLAN/OLNAtestingcycles.
The Data
1. School based data collection:
Strategieswerealsoidentifiedtoimprovestudents’readingcomprehension.Schoolbasedtestingandmonitoringprocesseshavebeenapplied:
i. PAT R Online Comprehension Tests -percentageofstudentsimprovingormaintaininggoodscoresonpreviouscomprehensiontests.Thesetestsprovidethestudentswithpracticeinattainingliteral,inferentialandevaluativeunderstandingsandalsopreparethemforstandardisedtestssuchasOLNAandNAPLAN.Improvementswere:
Year7–41%(ImprovementonYear6testinTerm1,2015)Year8-33%(ImprovementonYear7testinTerm1,2015)Year9-48%(ImprovementfromYear8testin2014)Year10-32%(ImprovementonYear9resultsin2014)
ii. The South Australian Spelling Test-measuringtheeffectivenessofliteracystrategiesimplemented,suchasTheSoundWayprogram.StudentsinYears7and8werepreandposttestedforTheSoundWayprogram.
• Year7studentswhosatthetesttwice=115.90%ofthese studentsimprovedby1ormoreand/ormaintained16+ spellingage.• Year8studentswhosatthetesttwice=117.92%ofthese studentsimprovedby1ormoreand/ormaintained16+ spellingage.
Priority 1 Core Skills
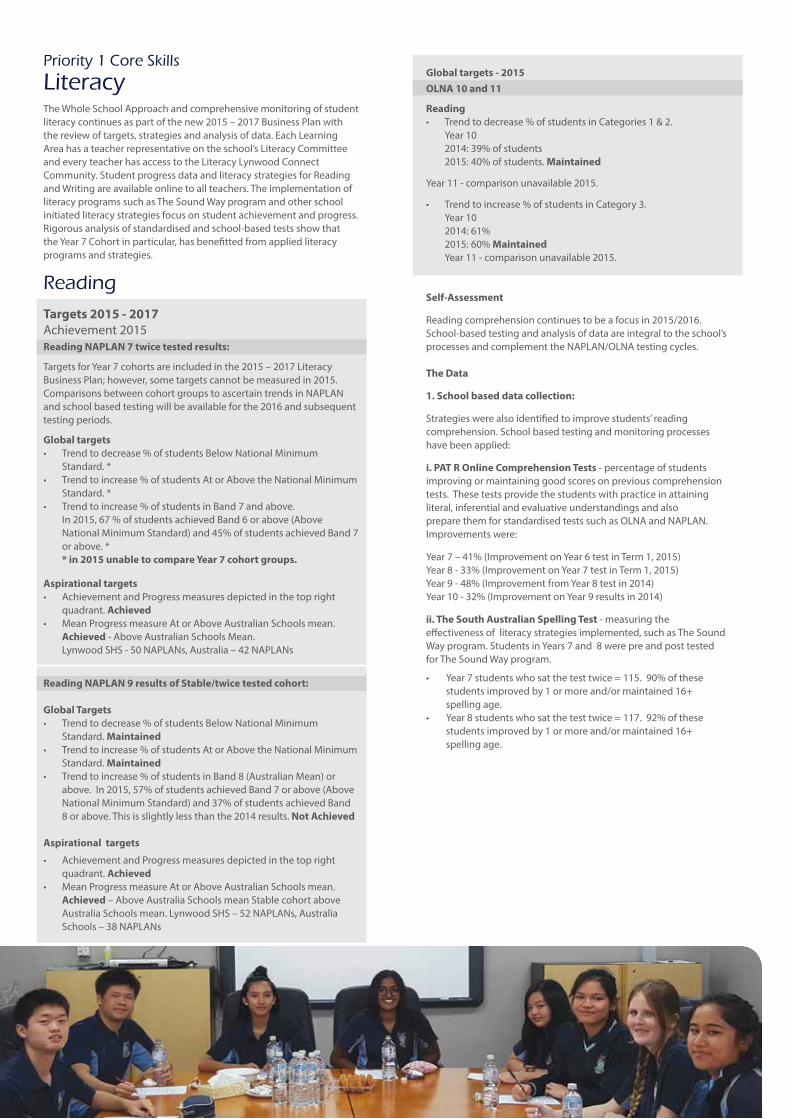
Literacy TheWholeSchoolApproachandcomprehensivemonitoringofstudentliteracycontinuesaspartofthenew2015–2017BusinessPlanwiththereviewoftargets,strategiesandanalysisofdata.EachLearningAreahasateacherrepresentativeontheschool’sLiteracyCommitteeandeveryteacherhasaccesstotheLiteracyLynwoodConnectCommunity.StudentprogressdataandliteracystrategiesforReadingandWritingareavailableonlinetoallteachers.TheimplementationofliteracyprogramssuchasTheSoundWayprogramandotherschoolinitiatedliteracystrategiesfocusonstudentachievementandprogress.Rigorousanalysisofstandardisedandschool-basedtestsshowthattheYear7Cohortinparticular,hasbenefittedfromappliedliteracyprogramsandstrategies.
Reading Targets 2015 - 2017Achievement2015Reading NAPLAN 7 twice tested results:
TargetsforYear7cohortsareincludedinthe2015–2017LiteracyBusinessPlan;however,sometargetscannotbemeasuredin2015.ComparisonsbetweencohortgroupstoascertaintrendsinNAPLANandschoolbasedtestingwillbeavailableforthe2016andsubsequenttestingperiods.
Global targets• Trendtodecrease%ofstudentsBelowNationalMinimum
Standard.*• Trendtoincrease%ofstudentsAtorAbovetheNationalMinimum
Standard.*• Trendtoincrease%ofstudentsinBand7andabove.
In2015,67%ofstudentsachievedBand6orabove(AboveNationalMinimumStandard)and45%ofstudentsachievedBand7orabove.*
* in 2015 unable to compare Year 7 cohort groups.
Aspirational targets• AchievementandProgressmeasuresdepictedinthetopright
quadrant.Achieved • MeanProgressmeasureAtorAboveAustralianSchoolsmean. Achieved-AboveAustralianSchoolsMean.
LynwoodSHS-50NAPLANs,Australia–42NAPLANs
Reading NAPLAN 9 results of Stable/twice tested cohort:
Global Targets• Trendtodecrease%ofstudentsBelowNationalMinimum
Standard.Maintained • Trendtoincrease%ofstudentsAtorAbovetheNationalMinimum
Standard.Maintained • Trendtoincrease%ofstudentsinBand8(AustralianMean)or
above.In2015,57%ofstudentsachievedBand7orabove(AboveNationalMinimumStandard)and37%ofstudentsachievedBand
8orabove.Thisisslightlylessthanthe2014results.Not Achieved
Aspirational targets
• AchievementandProgressmeasuresdepictedinthetoprightquadrant.Achieved
• MeanProgressmeasureAtorAboveAustralianSchoolsmean.Achieved –AboveAustraliaSchoolsmeanStablecohortaboveAustraliaSchoolsmean.LynwoodSHS–52NAPLANs,AustraliaSchools–38NAPLANs
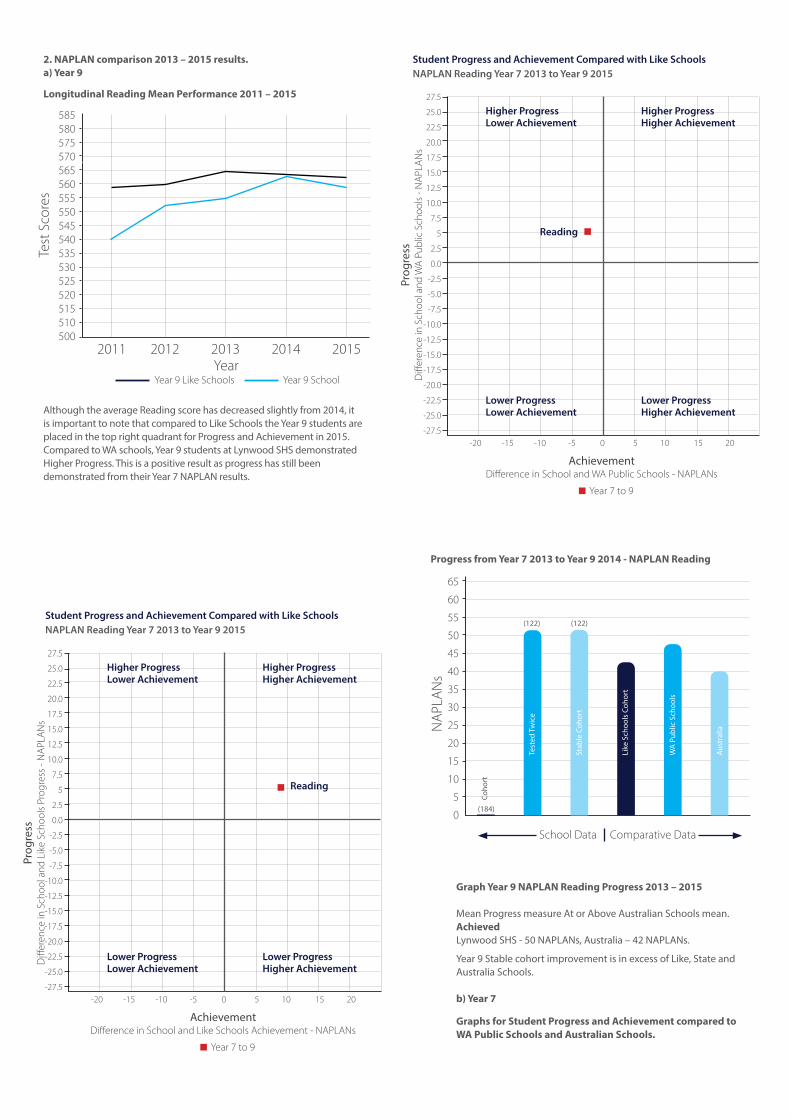
2. NAPLAN comparison 2013 – 2015 results.a) Year 9
Longitudinal Reading Mean Performance 2011 – 2015
2011 2012 2013 2014 2015
585580575570565560555550545540535530525520515510500
Test
Sco
res
YearYear 9 Like Schools Year 9 School
AchievementDifference in School and Like Schools Achievement - NAPLANs
Prog
ress
Diff
eren
ce in
Sch
ool a
nd L
ike
Scho
ols
Prog
ress
- N
APL
AN
s
-20 -15 -10 -5 0 5 10 15 20
27.5
25.0
22.5
20.0
17.5
15.0
12.5
10.0
7.5
5
2.5
0.0
-2.5
-5.0
-7.5
-10.0
-12.5
-15.0
-17.5
-20.0
-22.5
-25.0
-27.5
Higher ProgressLower Achievement
Lower ProgressLower Achievement
Higher ProgressHigher Achievement
Reading
Year 7 to 9
Lower ProgressHigher Achievement
Student Progress and Achievement Compared with Like SchoolsNAPLAN Reading Year 7 2013 to Year 9 2015
AchievementDifference in School and WA Public Schools - NAPLANs
Prog
ress
Diff
eren
ce in
Sch
ool a
nd W
A P
ublic
Sch
ools
- N
APL
AN
s
-20 -15 -10 -5 0 5 10 15 20
27.5
25.0
22.5
20.0
17.5
15.0
12.5
10.0
7.5
5
2.5
0.0
-2.5
-5.0
-7.5
-10.0
-12.5
-15.0
-17.5
-20.0
-22.5
-25.0
-27.5
Higher ProgressLower Achievement
Lower ProgressLower Achievement
Higher ProgressHigher Achievement
Reading
Year 7 to 9
Lower ProgressHigher Achievement
Progress from Year 7 2013 to Year 9 2014 - NAPLAN Reading
65
60
55
50
45
40
35
30
25
20
15
10
5
0
NA
PLA
Ns
School Data Comparative Data
Tested
Twice
Stab
leCoh
ort
LikeSch
oolsCoh
ort
WAPub
licSch
ools
Australia
Coho
rt
(184)
(122) (122)Student Progress and Achievement Compared with Like SchoolsNAPLAN Reading Year 7 2013 to Year 9 2015
Graph Year 9 NAPLAN Reading Progress 2013 – 2015
MeanProgressmeasureAtorAboveAustralianSchoolsmean.Achieved LynwoodSHS-50NAPLANs,Australia–42NAPLANs.
Year9StablecohortimprovementisinexcessofLike,StateandAustraliaSchools.
b) Year 7
Graphs for Student Progress and Achievement compared to WA Public Schools and Australian Schools.
AlthoughtheaverageReadingscorehasdecreasedslightlyfrom2014,itisimportanttonotethatcomparedtoLikeSchoolstheYear9studentsareplacedinthetoprightquadrantforProgressandAchievementin2015.ComparedtoWAschools,Year9studentsatLynwoodSHSdemonstratedHigherProgress.ThisisapositiveresultasprogresshasstillbeendemonstratedfromtheirYear7NAPLANresults.
AchievementDifference in School and WA Public School Achievement - NAPLANs
AchievementDifference in School and Australian Schools Achievement - NAPLANs
Prog
ress
Diff
eren
ce in
Sch
ool a
nd A
ustr
alia
n Sc
hool
s Pr
ogre
ss -
NA
PLA
Ns
-20 -15 -10 -5 0 5 10 15 20 -20 -15 -10 -5 0 5 10 15 20
27.5
25.0
22.5
20.0
17.5
15.0
12.5
10.0
7.5
5
2.5
0.0
-2.5
-5.0
-7.5
-10.0
-12.5
-15.0
-17.5
-20.0
-22.5
-25.0
-27.5
27.5
25.0
22.5
20.0
17.5
15.0
12.5
10.0
7.5
5
2.5
0.0
-2.5
-5.0
-7.5
-10.0
-12.5
-15.0
-17.5
-20.0
-22.5
-25.0
-27.5
Higher ProgressLower Achievement
Higher ProgressLower Achievement
Lower ProgressLower Achievement
Lower ProgressLower Achievement
Higher ProgressHigher Achievement
Higher ProgressHigher Achievement
ReadingReading
Year 5 to 7 Year 5 to 7
Lower ProgressHigher Achievement
Lower ProgressHigher Achievement
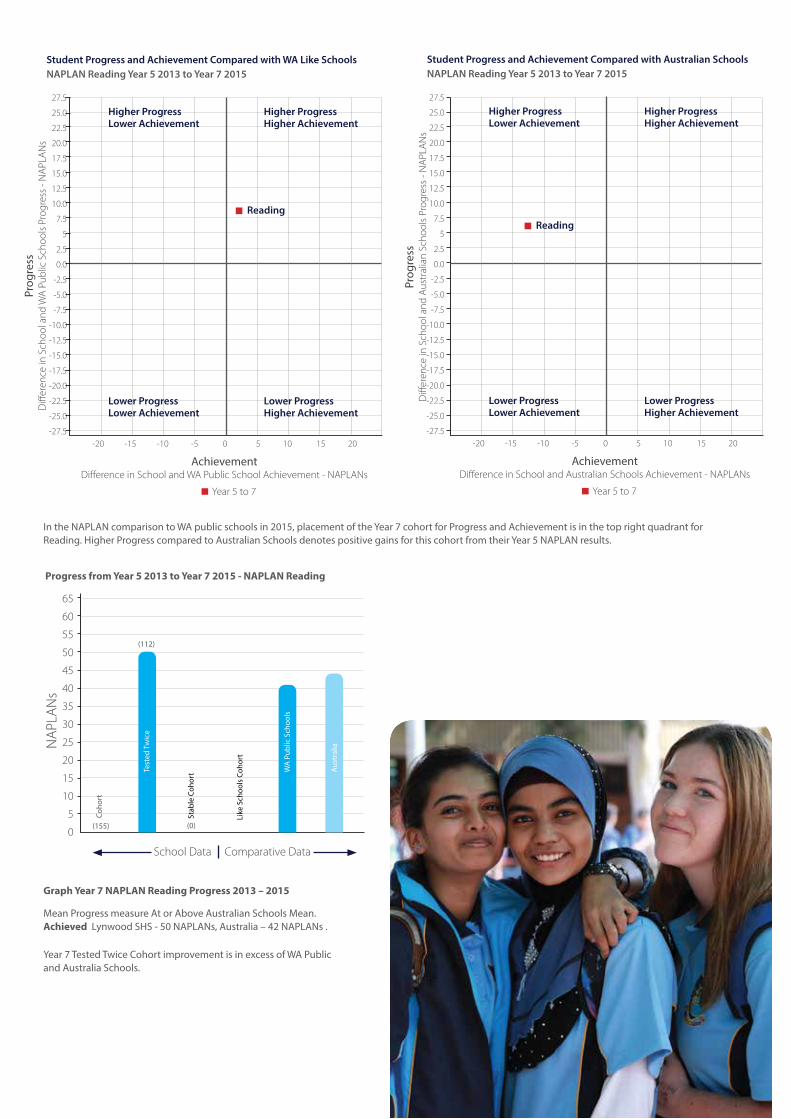
Student Progress and Achievement Compared with WA Like SchoolsNAPLAN Reading Year 5 2013 to Year 7 2015
Student Progress and Achievement Compared with Australian SchoolsNAPLAN Reading Year 5 2013 to Year 7 2015
Graph Year 7 NAPLAN Reading Progress 2013 – 2015
MeanProgressmeasureAtorAboveAustralianSchoolsMean.AchievedLynwoodSHS-50NAPLANs,Australia–42NAPLANs.
Year7TestedTwiceCohortimprovementisinexcessofWAPublic andAustraliaSchools.
IntheNAPLANcomparisontoWApublicschoolsin2015,placementoftheYear7cohortforProgressandAchievementisinthetoprightquadrantforReading.HigherProgresscomparedtoAustralianSchoolsdenotespositivegainsforthiscohortfromtheirYear5NAPLANresults.
Progress from Year 5 2013 to Year 7 2015 - NAPLAN Reading
65
60
55
50
45
40
35
30
25
20
15
10
5
0
NA
PLA
Ns
School Data Comparative Data
Tested
Twice
Stab
leCoh
ort
LikeSch
oolsCoh
ort
WAPub
licSch
ools
Australia
Coho
rt
(155)
(112)
(0)
Prog
ress
Diff
eren
ce in
Sch
ool a
nd W
A P
ublic
Sch
ools
Pro
gres
s - N
APL
AN
s
Writing
Targets 2015 -2017Achievement2015Writing NAPLAN 7 twice tested results:
Global targets• AchievementandProgressmeasuresdepictedinthetopright quadrant.Achieved (LikeSchoolsandWASchools)• MeanprogressmeasureAtorAboveAustralianSchools Mean.Achieved –AboveAustraliaSchoolsMean.LynwoodSHS–43NAPLANs,AustraliaSchools–33NAPLANs
Aspirational targets• AchievementandProgressmeasuresdepictedinthetopright quadrant.Achieved (LikeSchoolsandWASchools)• MeanProgressmeasureAtorAboveAustralianSchoolsmean. Achieved-AboveAustraliaSchoolsmean.LynwoodSHS-50 NAPLANs,Australia–42NAPLANs(Source–SchoolsOnline– columngraph)
Writing NAPLAN 9 results of Stable/twice tested cohort:
Global targets• AchievementandProgressmeasuresdepictedinthetopright quadrant.Achieved(LikeSchoolsandWASchools)• MeanProgressmeasureAtorAboveAustralianSchools Mean.Achieved -AboveAustraliaSchoolsMean. LynwoodSHS-31NAPLANs,AustraliaSchools29-NAPLANs
Aspirational targets • AchievementandProgressmeasuresdepictedinthetopright quadrant.Achieved(LikeSchools)• MeanProgressmeasureAtorAboveAustralianSchoolsmean. Achieved –AboveAustraliaSchoolsmean StablecohortaboveAustraliaSchoolsmean.LynwoodSHS–52 NAPLANs,AustraliaSchools–38NAPLANs
Global targets OLNA10and11
Writing• Trendtodecrease%ofstudentsinCategories1&2 Year10 2014:37.5% 2015:44%Not Achieved Year11-comparisonunavailable2015 • Trendtoincrease%ofstudentsinCategory3. Year10 2014:62.5% 2015:56%Not Achieved Year11-comparisonunavailable2015
Self-AssessmentWritingisafocusareaforthe2015-2017planningandreviewcycle.Aspartofthisprocess,theschoolcontinueswithschool-basedtestinganddatacollectiontocomplementtheNAPLAN/OLNAtestingcycles.StrategiesforPersuasiveWritingandotherwritingformscontinuetobeapplied.SchoolbasedtestingprovidesinformationonstudentprogressexternaltotheNAPLAN/OLNAtestingcycle.Strategiesandtargetsaredetailedbelow:
The Data
1. School Based Programs and data collection:
Writingstrategieswereappliedtoimprovestudents’sentence,paragraphandextendedwritingcapabilitiesthroughexplicitteaching,modellingandtheprovisionofframeworks.Inschoolbasedtesting,thepercentageofstudentsimprovingormaintaininggoodresultscomparedtopreviousschoolbasedtests:
Year 7 (2015)
SynthesisingInformation• Year7studentsintroducedtoinformationskillsandtestedin Term2.• Studentswhoscored7/10orabove–53%.Ofthis53%,34%of studentsreceivedamarkof8/10orabove.• Explicitteachingandtestingofsentencestructureand paragraphingwillbeincludedintheYear7programin2016.
Year 8 (2015)
138studentscompletedasynthesisinginformation/notemakingtest inTerms1and3,withtheTerm3resultsbeingcomparedwiththe Term1resultstoestablishtheimprovementrates.• SynthesisingInformation–25%ofstudentsimprovedor maintainedascoreof8/10orabove.Continuedreinforcement oftheseskillswilloccuracrossallLearningAreasin2016.
Year 9 (2015) - twice tested and compared to Year 8 results
• SynthesisingInformation–37%ofstudentsimprovedor maintainedascoreof8orabove.(Therehasbeenadeclinein theresultsfromthe2014results.TheNAPLANresultsforthis cohortindicatethattheirliteracyskillsareweakerthanthe previouscohort.Neverthelessthereinforcementoftheseskills acrossallLearningAreasisimportant).• Sentences/Paragraphing–39%(Thisresultisadeclineonthe previouscohort’sresults,however,thistaskisalsomorecomplex thantheYear8task.Additionalcontenthasbeenincludedto alignwiththerequirementsoftheWestAustraliancurriculum andin2016willaddresstheAboriginalCulturalFramework‘s performancedescriptors.
Year 10 (2015) - twice tested and compared to Year 9 results.
• SynthesisingInformation–57%(Improvementof12%on 2014results).• Sentences/Paragraphing/ExtendedWriting–37%.Thisisa declineonthepreviouscohort’sresults,howeverconsideration hasbeengiventoaligningtotheHASSgradedescriptorsand thereforeamorestringentanalysisofthemarkshasbeen applied.
Theapplicationofwritingframeworksandstrategieswillcontinuetobeappliedin2016inlinewithNAPLAN,OLNAandTheWestAustralianCurriculumrequirements.
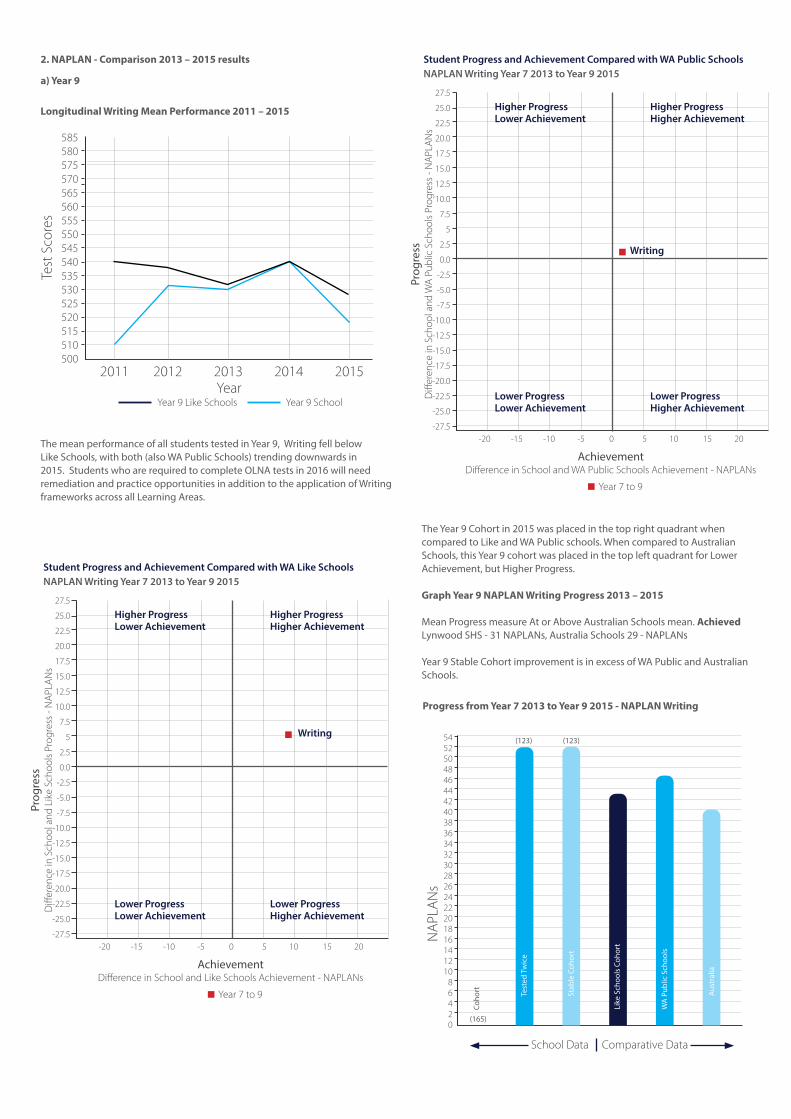
TheYear9Cohortin2015wasplacedinthetoprightquadrantwhencomparedtoLikeandWAPublicschools.WhencomparedtoAustralianSchools,thisYear9cohortwasplacedinthetopleftquadrantforLowerAchievement,butHigherProgress.
Graph Year 9 NAPLAN Writing Progress 2013 – 2015
MeanProgressmeasureAtorAboveAustralianSchoolsmean.Achieved LynwoodSHS-31NAPLANs,AustraliaSchools29-NAPLANs
Year9StableCohortimprovementisinexcessofWAPublicandAustralianSchools.
2. NAPLAN - Comparison 2013 – 2015 results
a) Year 9
Longitudinal Writing Mean Performance 2011 – 2015
ThemeanperformanceofallstudentstestedinYear9,WritingfellbelowLikeSchools,withboth(alsoWAPublicSchools)trendingdownwardsin2015.StudentswhoarerequiredtocompleteOLNAtestsin2016willneedremediationandpracticeopportunitiesinadditiontotheapplicationofWritingframeworksacrossallLearningAreas.
2011 2012 2013 2014 2015
585580575570565560555550545540535530525520515510500
Test
Sco
res
YearYear 9 Like Schools Year 9 School
AchievementDifference in School and Like Schools Achievement - NAPLANs
AchievementDifference in School and WA Public Schools Achievement - NAPLANs
Prog
ress
Diff
eren
ce in
Sch
ool a
nd L
ike
Scho
ols
Prog
ress
- N
APL
AN
s
Prog
ress
Diff
eren
ce in
Sch
ool a
nd W
A P
ublic
Sch
ools
Pro
gres
s - N
APL
AN
s
-20 -15 -10 -5 0 5 10 15 20
-20 -15 -10 -5 0 5 10 15 20
27.5
25.0
22.5
20.0
17.5
15.0
12.5
10.0
7.5
5
2.5
0.0
-2.5
-5.0
-7.5
-10.0
-12.5
-15.0
-17.5
-20.0
-22.5
-25.0
-27.5
27.5
25.0
22.5
20.0
17.5
15.0
12.5
10.0
7.5
5
2.5
0.0
-2.5
-5.0
-7.5
-10.0
-12.5
-15.0
-17.5
-20.0
-22.5
-25.0
-27.5
Higher ProgressLower Achievement
Higher ProgressLower Achievement
Lower ProgressLower Achievement
Lower ProgressLower Achievement
Higher ProgressHigher Achievement
Higher ProgressHigher Achievement
Writing
Writing
Year 7 to 9
Year 7 to 9
Lower ProgressHigher Achievement
Lower ProgressHigher Achievement
Student Progress and Achievement Compared with WA Like SchoolsNAPLAN Writing Year 7 2013 to Year 9 2015
Student Progress and Achievement Compared with WA Public SchoolsNAPLAN Writing Year 7 2013 to Year 9 2015
Progress from Year 7 2013 to Year 9 2015 - NAPLAN Writing
5452504846444240383634323028262422201816141210
86420
NA
PLA
Ns
School Data Comparative Data
Tested
Twice
Stab
leCoh
ort
LikeSch
oolsCoh
ort
WAPub
licSch
ools
Australia
Coho
rt
(165)
(123) (123)
Progress from Year 5 2013 to Year 7 2015 - NAPLAN Writing
5452504846444240383634323028262422201816141210
86420
NA
PLA
Ns
School Data Comparative Data
Tested
Twice
Stab
leCoh
ort
LikeSch
oolsCoh
ort
WAPub
licSch
ools
Australia
Coho
rt
(154)
(112)
(0)
TheYear7Cohortin2015wasplacedinthetoprightquadrantwhencomparedtoLikeSchoolsandevenhigherinthisquadrantwhencomparedtoWAPublicschools.ComparedtoAustralianSchools,thiscohortwasplacedinthetopleftquadrantforProgressmeasuredfromtheirYear5NAPLANWritingresults.
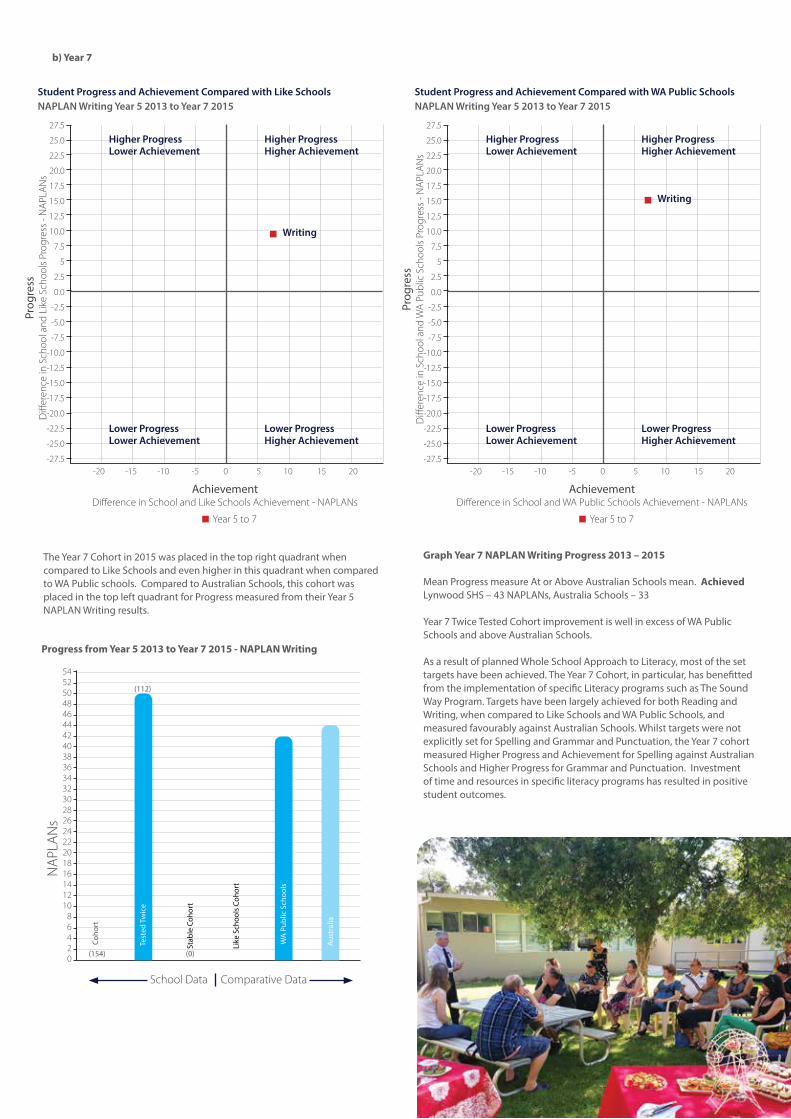
b) Year 7
AchievementDifference in School and Like Schools Achievement - NAPLANs
AchievementDifference in School and WA Public Schools Achievement - NAPLANs
Prog
ress
Diff
eren
ce in
Sch
ool a
nd L
ike
Scho
ols
Prog
ress
- N
APL
AN
s
Prog
ress
Diff
eren
ce in
Sch
ool a
nd W
A P
ublic
Sch
ools
Pro
gres
s - N
APL
AN
s
-20 -15 -10 -5 0 5 10 15 20 -20 -15 -10 -5 0 5 10 15 20
27.5
25.0
22.5
20.0
17.5
15.0
12.5
10.0
7.5
5
2.5
0.0
-2.5
-5.0
-7.5
-10.0
-12.5
-15.0
-17.5
-20.0
-22.5
-25.0
-27.5
27.5
25.0
22.5
20.0
17.5
15.0
12.5
10.0
7.5
5
2.5
0.0
-2.5
-5.0
-7.5
-10.0
-12.5
-15.0
-17.5
-20.0
-22.5
-25.0
-27.5
Higher ProgressLower Achievement
Higher ProgressLower Achievement
Lower ProgressLower Achievement
Lower ProgressLower Achievement
Higher ProgressHigher Achievement
Higher ProgressHigher Achievement
Writing
Writing
Year 5 to 7 Year 5 to 7
Lower ProgressHigher Achievement
Lower ProgressHigher Achievement
Student Progress and Achievement Compared with Like SchoolsNAPLAN Writing Year 5 2013 to Year 7 2015
Student Progress and Achievement Compared with WA Public SchoolsNAPLAN Writing Year 5 2013 to Year 7 2015
Graph Year 7 NAPLAN Writing Progress 2013 – 2015
MeanProgressmeasureAtorAboveAustralianSchoolsmean.Achieved LynwoodSHS–43NAPLANs,AustraliaSchools–33
Year7TwiceTestedCohortimprovementiswellinexcessofWAPublicSchoolsandaboveAustralianSchools.
AsaresultofplannedWholeSchoolApproachtoLiteracy,mostofthesettargetshavebeenachieved.TheYear7Cohort,inparticular,hasbenefittedfromtheimplementationofspecificLiteracyprogramssuchasTheSoundWayProgram.TargetshavebeenlargelyachievedforbothReadingandWriting,whencomparedtoLikeSchoolsandWAPublicSchools,andmeasuredfavourablyagainstAustralianSchools.WhilsttargetswerenotexplicitlysetforSpellingandGrammarandPunctuation,theYear7cohortmeasuredHigherProgressandAchievementforSpellingagainstAustralianSchoolsandHigherProgressforGrammarandPunctuation.Investmentoftimeandresourcesinspecificliteracyprogramshasresultedinpositivestudentoutcomes.
Tested
Twice
Australia
Priority 1 Core Skills
NumeracyGlobal TargetsNumeracy-NAPLAN7resultsofStable/Twicetestedcohort:• Trendtolower%ofstudentsBelowNationalMinimumStandard• Trendtoincrease%ofstudentsAtorAboveNationalMinimum Standard• Trendtoincreasestudent%atBands7orAbove(SourceFirstCut)
TargetsforYear7cohortsareincludedinthe2015-2017BusinessPlan;however,sometargetscannotbemeasuredin2015.ComparisonsbetweencohortgroupstoascertaintrendsinNAPLANwillbeavailableforthe2016andsubsequenttestingperiods.
Numeracy -NAPLAN9resultsofStable/Twicetestedcohort:• Trendtolower%ofstudentsBelowNationalMinimumStandard• Trendtoincrease%ofstudentsAtorAboveNationalMinimum Standard.Achieved • Trendtoincreasestudent%AtBands8orabove(SourceFirstCut) AspirationalTargetsNumeracy-NAPLAN7resultsofStable/Twicetestedcohort:• AchievementandProgressmeasuresdepictedinthetop rightquadrant(Source:SchoolsOnline–AustralianStudents Administration• MeanprogressmeasureatoraboveAustralianSchoolsMean (Source:SchoolsOnline)Numeracy-NAPLAN9resultsofStable/Twicetestedcohort:• AchievementandProgressmeasuresdepictedinthetop rightquadrant(Source:SchoolsOnline–AustralianStudents Administration• MeanprogressmeasureatoraboveAustralianSchoolsMean (Source:SchoolsOnline)
Online Literacy and Numeracy (OLNA) - Years 10 and 11Numeracy: • Trendtodecrease%ofstudentsinLevels1&2• Trendtoincrease%ofstudentsinLevel3
Online Literacy and Numeracy (OLNA) - Years 12Numeracy: • Trendtoincrease%ofstudentsinLevel3
Aspirational TargetsNumeracy-NAPLAN7resultsofStable/Twicetestedcohort:• AchievementandProgressmeasuresdepictedinthetop rightquadrant(Source:SchoolsOnline–AustralianStudents Administration• MeanprogressmeasureAtorAboveAustralianSchoolsMean (Source:SchoolsOnline)Numeracy-NAPLAN9resultsofStable/Twicetestedcohort:• AchievementandProgressmeasuresdepictedinthetop rightquadrant(Source:SchoolsOnline–AustralianStudents Administration• MeanprogressmeasureAtorAboveAustralianSchoolsMean (Source:SchoolsOnline)
OLNA 12:• Trendtoincrease%ofstudentsachievingWACENumeracy (Source–NAPLANandOLNA,studentsachievingBand8NAPLAN andOLNALevel3)
Priority 1 Core Skills
Information Technology
ICTcontinuestobeapriorityforourstudents.
Targets:• Trendtoincreasestudents’accesstotechnologiesacrossthe school-Progressing• Trendtoincreasetheopportunitiesforstudentstobeinstructed onthesafeuseoftechnologies-Progressing• TrendtoincreaseadministrationefficienciesthroughICT- Achieved• TrendtoincreaseparticipationinparentfundedMacBook program(85%BYOD)-Progressing• TrendtoincreaseuseofICTforenhancingteachingandlearning inlinewithICTGeneralCapabilities-Progressing• TrendtoincreaseprofessionallearningwithanITfocus- Progressing• Trendtoincreasecommunication,assessmentandreporting feedbacktostudentsandparents-Achieved• Continuetoresourceongoingsupplyofhardwareandsoftware toservicetheneedsofadministration,staffandstudentsinto theforeseeablefuture–Progressing
Milestones:• Developmentandimplementationofpoliciestopromotethe safeuseoftechnologies.• Resourcesinplacefortheongoingsupplyofhardwareand softwaretoservicetheneedsofadministration,staffand studentsintotheforeseeablefuture.Netboxhasincreased bandwidthandreducedconnectivityissues.• Acultureofprofessionallearningandpracticethatsupports theeffectivegrowthoftechnologyintheclassroomandacross theschoolisevident• ProfessionalLearningPlandevelopedforembeddingITin teachingandlearningprograms.• Significantincreaseintheuseofcontentmanagementsystems- CONNECT
Priority 2
Student AcademicAchievementLower SchoolLowerschoolMESHGradeAlignment
ThealignmentofgradedistributionforSemester2inMathematics,English,ScienceandHumanitiesandSocialSciences(MESH)iscriticalinestablishingvalidationoftheschool’sgradingprocessesagainstschoolswithsimilarcohorts.
WhilstitisjustasimportantfortheNon-MESHLearningAreas,lessrigorcanbeplacedonthecomparisonasdirectcorrespondenceincurriculumcontentspecialitycan’tbemade.LOTEisalsodependentuponacomparisonwithalikeschoolandlikelanguage.
Itisdesirabletohavesomeconsistencybetweentheschoolandlikeschoolprofiles(ifitcanbeverifiedthattheLikeSchoolsareofsimilardemographicandproportionofnon-Englishspeakingbackgroundstudents)withsomelatitudetoenhanceorextendperformanceintheuppergrades,aslongasstandardscanbevalidated.Thislatterconcept isaspirationalandhasrequiredclosemonitoringasatarget.Similarly,thereductionoflowerendperformancehastobejustifiedagainstastandardandatthesametimeprocessesmustbeinplacetogradeallstudentssothattheNotAssessedannotationisallbuteliminated.
Grades
Grades
Grades
Grades
Grades
Grades
Grades
NA E D C B A
NA E D C B A
NA E D C B A
NA E D C B A
NA E D C B A
NA E D C B A
NA E D C B A
%
%
%
%
%
%
%
40
30
20
10
0
40
30
20
10
0
40
30
20
10
0
40
30
20
10
0
40
30
20
10
0
50
40
30
20
10
0
50
40
30
20
10
0
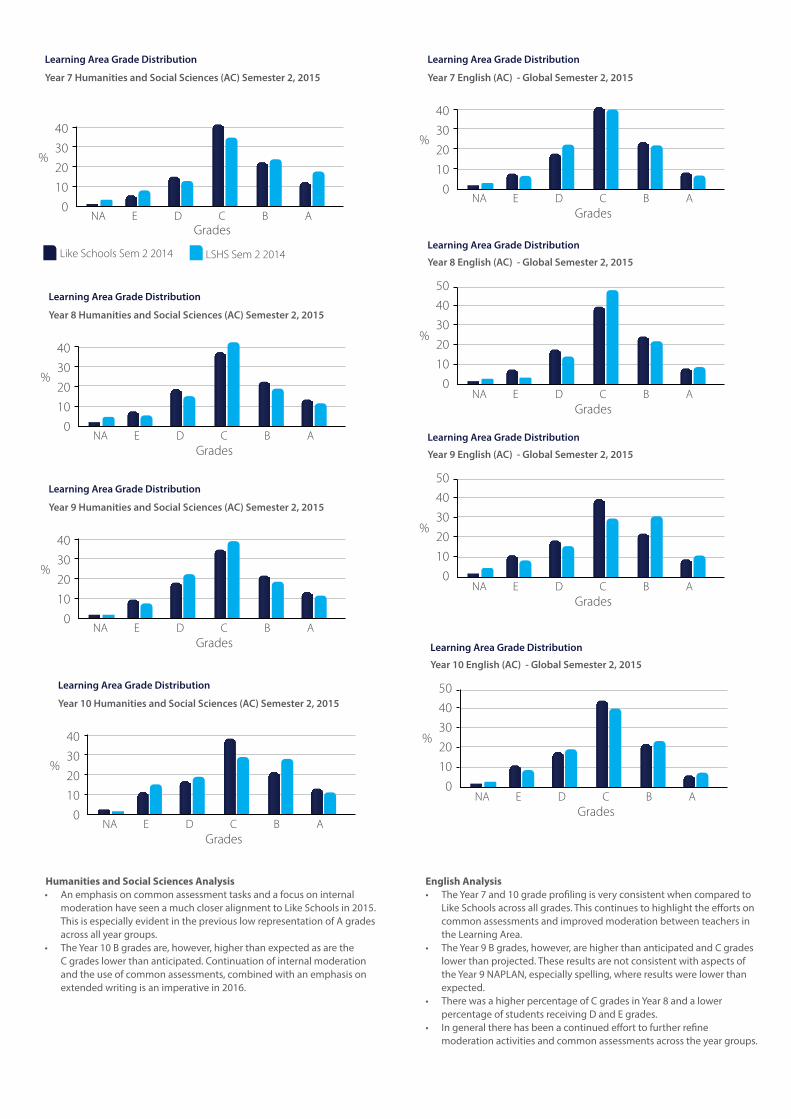
Year 7 Humanities and Social Sciences (AC) Semester 2, 2015
Year 8 Humanities and Social Sciences (AC) Semester 2, 2015
Year 9 Humanities and Social Sciences (AC) Semester 2, 2015
Year 10 Humanities and Social Sciences (AC) Semester 2, 2015
Year 7 English (AC) - Global Semester 2, 2015
Year 8 English (AC) - Global Semester 2, 2015
Year 9 English (AC) - Global Semester 2, 2015
Learning Area Grade Distribution
Learning Area Grade Distribution
Learning Area Grade Distribution
Learning Area Grade Distribution
Learning Area Grade Distribution
Learning Area Grade Distribution
Learning Area Grade Distribution
LSHS Sem 2 2014Like Schools Sem 2 2014
Humanities and Social Sciences Analysis• Anemphasisoncommonassessmenttasksandafocusoninternal
moderationhaveseenamuchcloseralignmenttoLikeSchoolsin2015.ThisisespeciallyevidentinthepreviouslowrepresentationofAgradesacrossallyeargroups.
• TheYear10Bgradesare,however,higherthanexpectedasarethe Cgradeslowerthananticipated.Continuationofinternalmoderationandtheuseofcommonassessments,combinedwithanemphasisonextendedwritingisanimperativein2016.
GradesNA E D C B A
%
50
40
30
20
10
0
Year 10 English (AC) - Global Semester 2, 2015
Learning Area Grade Distribution
English Analysis• TheYear7and10gradeprofilingisveryconsistentwhencomparedto
LikeSchoolsacrossallgrades.ThiscontinuestohighlighttheeffortsoncommonassessmentsandimprovedmoderationbetweenteachersintheLearningArea.
• TheYear9Bgrades,however,arehigherthananticipatedandCgradeslowerthanprojected.TheseresultsarenotconsistentwithaspectsoftheYear9NAPLAN,especiallyspelling,whereresultswerelowerthanexpected.
• TherewasahigherpercentageofCgradesinYear8andalowerpercentageofstudentsreceivingDandEgrades.
• Ingeneraltherehasbeenacontinuedefforttofurtherrefinemoderationactivitiesandcommonassessmentsacrosstheyeargroups.
Grades
Grades
Grades
Grades
Grades
NA E D C B A
NA E D C B A
NA E D C B A
NA E D C B A
NA E D C B A
%
%
%
%
%
50
40
30
20
10
0
50
40
30
20
10
0
50
40
30
20
10
0
50
40
30
20
10
0
50
40
30
20
10
0
Year 7 Science (AC) - Global Semester 2, 2015
Year 8 Science (AC) - Global Semester 2, 2015
Year 9 Science (AC) - Global Semester 2, 2015
Year 7 Mathematics (AC) - Global Semester 2, 2015
Year 10 Science (AC) - Global Semester 2, 2015
Learning Area Grade Distribution
Learning Area Grade Distribution
Learning Area Grade Distribution
Learning Area Grade Distribution
Learning Area Grade Distribution
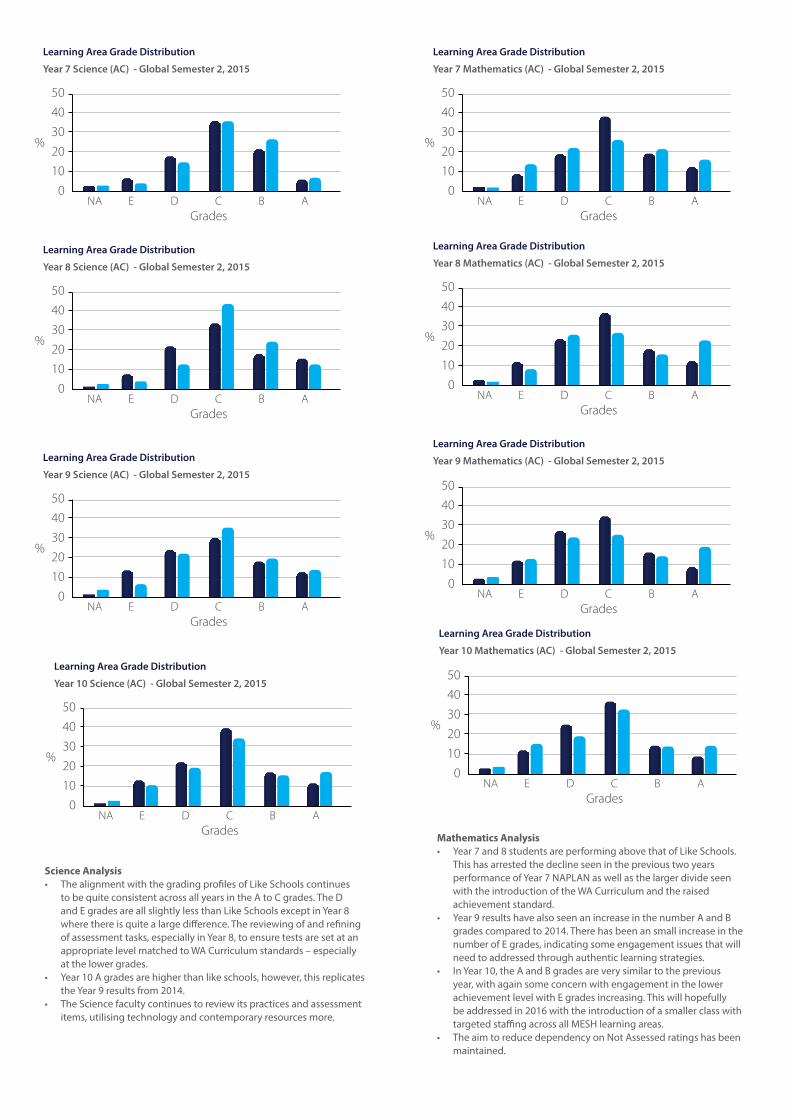
Science Analysis• ThealignmentwiththegradingprofilesofLikeSchoolscontinues
tobequiteconsistentacrossallyearsintheAtoCgrades.TheDandEgradesareallslightlylessthanLikeSchoolsexceptinYear8wherethereisquitealargedifference.Thereviewingofandrefiningofassessmenttasks,especiallyinYear8,toensuretestsaresetatanappropriatelevelmatchedtoWACurriculumstandards–especially atthelowergrades.
• Year10Agradesarehigherthanlikeschools,however,thisreplicatestheYear9resultsfrom2014.
• TheSciencefacultycontinuestoreviewitspracticesandassessmentitems,utilisingtechnologyandcontemporaryresourcesmore.
Grades
Grades
Grades
NA E D C B A
NA E D C B A
NA E D C B A
%
%
%
50
40
30
20
10
0
50
40
30
20
10
0
50
40
30
20
10
0
Year 8 Mathematics (AC) - Global Semester 2, 2015
Year 9 Mathematics (AC) - Global Semester 2, 2015
Year 10 Mathematics (AC) - Global Semester 2, 2015
Learning Area Grade Distribution
Learning Area Grade Distribution
Learning Area Grade Distribution
Mathematics Analysis• Year7and8studentsareperformingabovethatofLikeSchools.
ThishasarrestedthedeclineseenintheprevioustwoyearsperformanceofYear7NAPLANaswellasthelargerdivideseenwiththeintroductionoftheWACurriculumandtheraisedachievementstandard.
• Year9resultshavealsoseenanincreaseinthenumberAandBgradescomparedto2014.TherehasbeenansmallincreaseinthenumberofEgrades,indicatingsomeengagementissuesthatwillneedtoaddressedthroughauthenticlearningstrategies.
• InYear10,theAandBgradesareverysimilartothepreviousyear,withagainsomeconcernwithengagementinthelowerachievementlevelwithEgradesincreasing.Thiswillhopefully beaddressedin2016withtheintroductionofasmallerclasswithtargetedstaffingacrossallMESHlearningareas.
• TheaimtoreducedependencyonNotAssessedratingshasbeenmaintained.
Senior School Global Targets• MaintainWACE2015achievementat98%+ Not Achieved• MaintainahighcorrelationofATARstudentsmatchedwithNAPLAN
Band8+(0.8+)Not Achieved• TrendtoimprovethePercentageofstudentsachievingaWACE2016
to2017.• Trendtomaintainorimprovethepercentageofstudentsachieving
Attainment–ATAR55+orCertificateIIorhigherNot Achieved• Maintainthepercentageofcompletedqualificationsatthecompletion
ofYear12Not Achieved Aspirational• 100%WACEAchievementin2015Not Achieved• ThePercentageofstudentsachievingaWACE2016-17isgreater
than85%.• ThepercentageofstudentsachievingAttainment–ATAR55+or
CertificateIIorhigherisgreaterthan90%.Not Achieved• Trendtoimprovethe%ofATARstudentsoncampusAchieved• TrendtoincreasethenumberofstudentsachievingSCASAawards
from2015–2017
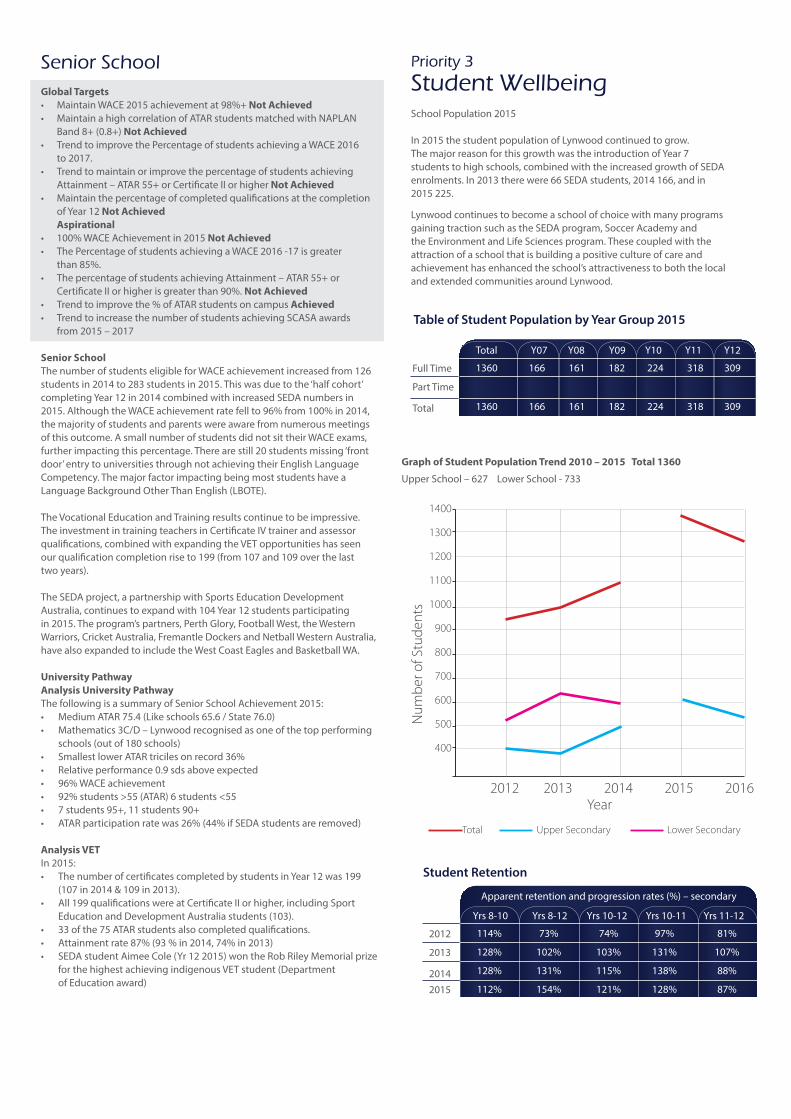
Senior SchoolThenumberofstudentseligibleforWACEachievementincreasedfrom126studentsin2014to283studentsin2015.Thiswasduetothe‘halfcohort’completingYear12in2014combinedwithincreasedSEDAnumbersin2015.AlthoughtheWACEachievementratefellto96%from100%in2014,themajorityofstudentsandparentswereawarefromnumerousmeetingsofthisoutcome.AsmallnumberofstudentsdidnotsittheirWACEexams,furtherimpactingthispercentage.Therearestill20studentsmissing‘frontdoor’entrytouniversitiesthroughnotachievingtheirEnglishLanguageCompetency.ThemajorfactorimpactingbeingmoststudentshaveaLanguageBackgroundOtherThanEnglish(LBOTE).
TheVocationalEducationandTrainingresultscontinuetobeimpressive.TheinvestmentintrainingteachersinCertificateIVtrainerandassessorqualifications,combinedwithexpandingtheVETopportunitieshasseen ourqualificationcompletionriseto199(from107and109overthelast twoyears).
TheSEDAproject,apartnershipwithSportsEducationDevelopmentAustralia,continuestoexpandwith104Year12studentsparticipatingin2015.Theprogram’spartners,PerthGlory,FootballWest,theWesternWarriors,CricketAustralia,FremantleDockersandNetballWesternAustralia,havealsoexpandedtoincludetheWestCoastEaglesandBasketballWA.
University PathwayAnalysis University Pathway ThefollowingisasummaryofSeniorSchoolAchievement2015:• MediumATAR75.4(Likeschools65.6/State76.0)• Mathematics3C/D–Lynwoodrecognisedasoneofthetopperforming
schools(outof180schools)• SmallestlowerATARtricilesonrecord36%• Relativeperformance0.9sdsaboveexpected• 96%WACEachievement• 92%students>55(ATAR)6students<55• 7students95+,11students90+• ATARparticipationratewas26%(44%ifSEDAstudentsareremoved)
Analysis VETIn2015:• ThenumberofcertificatescompletedbystudentsinYear12was199
(107in2014&109in2013).• All199qualificationswereatCertificateIIorhigher,includingSport
EducationandDevelopmentAustraliastudents(103).• 33ofthe75ATARstudentsalsocompletedqualifications.• Attainmentrate87%(93%in2014,74%in2013)• SEDAstudentAimeeCole(Yr122015)wontheRobRileyMemorialprize
forthehighestachievingindigenousVETstudent(Department ofEducationaward)
Priority 3
Student WellbeingSchoolPopulation2015
In2015thestudentpopulationofLynwoodcontinuedtogrow. ThemajorreasonforthisgrowthwastheintroductionofYear7studentstohighschools,combinedwiththeincreasedgrowthofSEDAenrolments.In2013therewere66SEDAstudents,2014166,andin 2015225.
LynwoodcontinuestobecomeaschoolofchoicewithmanyprogramsgainingtractionsuchastheSEDAprogram,SoccerAcademyandtheEnvironmentandLifeSciencesprogram.Thesecoupledwiththeattractionofaschoolthatisbuildingapositivecultureofcareandachievementhasenhancedtheschool’sattractivenesstoboththelocalandextendedcommunitiesaroundLynwood.
Table of Student Population by Year Group 2015
FullTime
PartTime
Total
Total
1360 166 161 182 224 318 309
1360 166 161 182 224 318 309
Y07 Y08 Y09 Y10 Y11 Y12
2012 2013 2014 2015 2016
1400
1300
1200
1100
1000
900
800
700
600
500
400
Num
ber o
f Stu
dent
s
Year
Total Upper Secondary Lower Secondary
Apparentretentionandprogressionrates(%)–secondary
Student Retention
2012
2013
20142015
Yrs8-10 Yrs8-12 Yrs10-12 Yrs10-11 Yrs11-12
114% 73% 74% 97% 81%
128% 102% 103% 131% 107%
128% 131% 115% 138% 88%
112% 154% 121% 128% 87%
Graph of Student Population Trend 2010 – 2015 Total 1360
UpperSchool–627LowerSchool-733
Apparentretentionandprogressionrates(%)–secondary
Apparent Retention and Progression
2013
2014
2015
AtRiskIndicated
Regular
Y07 Y08 Y09 Y10 Y11 Y12
Sch WA
PubSch
WAPubSch
WAPubSch
WAPubSch
WAPubSch
Sch Sch Sch Sch Sch
AtRiskModerateAtRiskSevere
Yrs8-10 Yrs8-12 Yrs10-12 Yrs10-11 Yrs11-12
128% 102% 103% 131% 107%
128% 131% 115% 138% 88%
112% 154% 121% 128% 87%
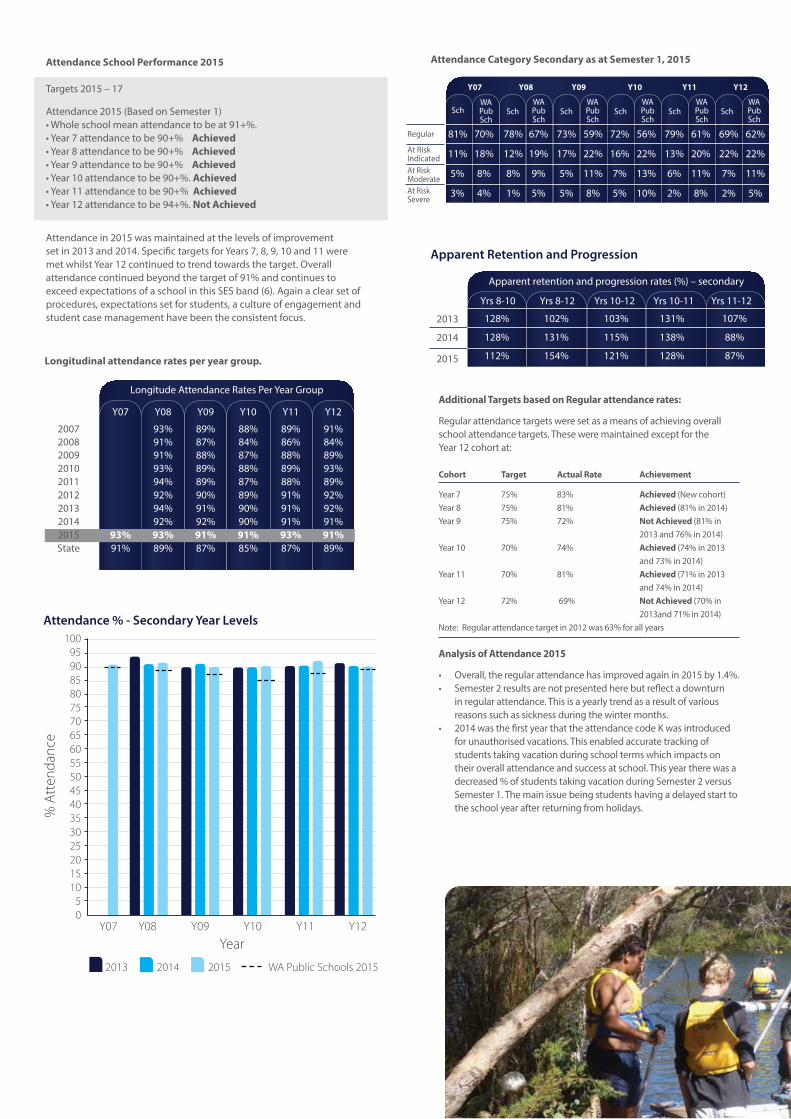
Attendance School Performance 2015
Targets2015–17
Attendance2015(BasedonSemester1) •Wholeschoolmeanattendancetobeat91+%.•Year7attendancetobe90+%Achieved•Year8attendancetobe90+% Achieved•Year9attendancetobe90+%Achieved•Year10attendancetobe90+%.Achieved•Year11attendancetobe90+%Achieved•Year12attendancetobe94+%.Not Achieved
Attendancein2015wasmaintainedatthelevelsofimprovementsetin2013and2014.SpecifictargetsforYears7,8,9,10and11weremetwhilstYear12continuedtotrendtowardsthetarget.Overallattendancecontinuedbeyondthetargetof91%andcontinuestoexceedexpectationsofaschoolinthisSESband(6).Againaclearsetofprocedures,expectationssetforstudents,acultureofengagementandstudentcasemanagementhavebeentheconsistentfocus.
Longitudinal attendance rates per year group.
Additional Targets based on Regular attendance rates:
Regularattendancetargetsweresetasameansofachievingoverallschoolattendancetargets.Theseweremaintainedexceptforthe Year12cohortat:
Cohort Target Actual Rate Achievement
Year7 75% 83% Achieved (Newcohort)Year8 75% 81% Achieved (81%in2014)Year9 75% 72% Not Achieved (81%in 2013and76%in2014)Year10 70% 74% Achieved (74%in2013 and73%in2014)Year11 70% 81% Achieved (71%in2013 and74%in2014)Year12 72% 69% Not Achieved (70%in 2013and71%in2014)Note:Regularattendancetargetin2012was63%forallyears
Analysis of Attendance 2015
• Overall,theregularattendancehasimprovedagainin2015by1.4%.• Semester2resultsarenotpresentedherebutreflectadownturn
inregularattendance.Thisisayearlytrendasaresultofvariousreasonssuchassicknessduringthewintermonths.
• 2014wasthefirstyearthattheattendancecodeKwasintroducedforunauthorisedvacations.Thisenabledaccuratetrackingofstudentstakingvacationduringschooltermswhichimpactsontheiroverallattendanceandsuccessatschool.Thisyeartherewasadecreased%ofstudentstakingvacationduringSemester2versusSemester1.Themainissuebeingstudentshavingadelayedstarttotheschoolyearafterreturningfromholidays.
Attendance Category Secondary as at Semester 1, 2015
Y07 Y08 Y09 Y10 Y11 Y12
100959085807570656055504540353025201510
50
% A
tten
danc
e
Year
Attendance % - Secondary Year Levels
2013 2014 2015 WA Public Schools 2015
81% 70% 78% 67% 73% 59% 72% 56% 79% 61% 69% 62%
11% 18% 12% 19% 17% 22% 16% 22% 13% 20% 22% 22%
5% 8% 8% 9% 5% 11% 7% 13% 6% 11% 7% 11%
3% 4% 1% 5% 5% 8% 5% 10% 2% 8% 2% 5%
LongitudeAttendanceRatesPerYearGroup
Y07 Y08 Y09 Y10 Y11 Y12
2007 93% 89% 88% 89% 91% 2008 91% 87% 84% 86% 84% 2009 91% 88% 87% 88% 89% 2010 93% 89% 88% 89% 93% 2011 94% 89% 87% 88% 89% 2012 92% 90% 89% 91% 92% 2013 94% 91% 90% 91% 92% 2014 92% 92% 90% 91% 91% 2015 93% 93% 91% 91% 93% 91% State 91% 89% 87% 85% 87% 89%
WAPubSch
Behaviour and EngagementTargets 2015 – 17
Achievement 2015
• Trendtoincreasepositivebehaviours.TargetsfortotalpositiveentriesperstudentinSIShavebeenmetforYears7,8and12. Therehasbeenadecreasefortheotheryeargroupsfrom2014.
• PercentageofstudentSuspensionstoremainbelow7%ofstudentpopulationbetween2015and2017.Year7,8and9operationaltargetsnot achieved.Year10,11and12operationaltargetsachieved.
• Increasetrendofstudentengagementintheclassroom,schoolandcommunityactivities.
• GoodStandingtoreflectadecreaseinthenegativeaccumulation ofpoints.2015targetnotmetforYears7to12studentsrenumber ofnegativepointsperstudent.Adecreaseinthenegativeaccumulationofpointsfrom2014to2015forYear11 students.
• Formalreportsreflectattitude,behaviourandeffortasapositive trendbetween2015and2017.OperationaltargetsforYear8,10,11
and12achieved.
Analysis of Behaviour and Engagement
• Behaviourreferralsdidnotdiminishin2015.TheStudentManagementandPastoralCareFlowchartandreferralprocesswerereviewedandupdatedin2014.ThisimprovedcasemanagementprocesseshavemeantthatmoredataisbeingenteredintotheStudentInformationSystem,bothpositiveandnegative.TherewasapositivetrendinreportingofpositivebehavioursforYears7,8and12.However,thereisstillroomforimprovementinfocussingonpositivebehavioursratherthanthenegative.Therewasanincreaseinreportingofnegativebehavioursforallyeargroups.ThisistheresultofanincreasedfocusonacademicrigourforallyeargroupsandtherequirementoftheSeniorSchoolAssessmentPolicyforteacherstocommunicatewithparents/guardianswhenconcernedaboutstudentprogressandachievementinYear11&12.Anupdatedassessmentpolicywasalsodevelopedforlowerschoolfor2015.
• PercentageofstudentSuspensionsremainedbelow7%ofstudentpopulation–theoverallsuspensionratein2015at5.7%.Theyear7,8and9cohortswereabovethistarget,whiletheyear10,11&12groupswereallbelow.
• GoodStandingtoreflectadecreaseinthenegativeaccumulationofpoints(progressingtowardstarget).TheGoodStandingPolicywasupdatedin2014;however,thishasnotseenadecreaseintheaccumulationofnegativepoints.TherewasanincreaseforYears8-12excludingtheYear11sbeingtheonlyyeargrouptohaveadecrease.Moreincentiveswillbedevelopedin2016,includingtheAscentFoundationEverydayLeadersProgrambeingimplementedacrossallyeargroups,DeadlySistasprogram,Access10classimplemented,andUWAAspireProgram.
• Formalreportsreflectattitude,behaviourandeffortasapositivetrendbetween2015and2017.AsstudentstransitionthroughYear10intotheirSeniorSchoolpathway,thereisapositivetrend.InformationaboutpathwayshasbeenintroducedintoYear7-9CurriculumHandbookstoencourageimprovedstudentattitude,behaviourandefforttoachievesuccessinlowerschoolenablingmoreoptions inSeniorSchool
School FocusEnvironmental SustainabilityEnvironmental Global Targets 2015 – 2017• Trendtoincreasethenumberofenvironmentallyrelated
curriculumexperienceswhichareembeddedinLearningAreasProgressing
• Trendtoincreaselearningareasresourceswhichreflectanabilitytoaccesstheexternalenvironmentoftheschoolforlearningactivitiesandexperiences
Progressing• Utilisebaselinedatatomeasuretheschool’ssustainablepractices
inenergy,waterandwaste. Progressing
• Trendtodecreaseenergy,waterandwasteusethroughthedevelopmentofefficiencypractices Progressing
• TrendtoincreasestudentledactivitiesthroughcommitteesProgressing
• ContinuetopromoteEaLSandLEAFprogramsbyshowcasingprojectsstudentsareinvolvedin Progressing
Environmental Aspirational Targets• UtilisedatatoselectaLearningAreablockwithintheschoolto
retrofittobefullysustainable Progressing
Social Global Targets 2015-2017• Trendtoincreasethenumberofresiliencyrelatedcurriculum
experiencesandactivitiesembeddedinLearningAreas Progressing
• TrendtoincreasethenumberofcurriculumactivitiesandexperiencesfortheenhancementofstudentsasfuturecitizensProgressing
• TrendtoincreasethenumberofLearningAreaactivitiesandexperiencesthatcanbesharedacrosstheformalandinformalcurriculumtodevelopawarenessofsocialsustainability Progressing
• TrendtoincreasethenumberofLearningAreaactivitiestosupportwholeschooleventssuchasHarmony/NAIDOCweekProgressing
• Trendtoincreasestudentinvolvementindesigningthesocialenvironmentoftheschool’ssustainablefuturethroughleadershipopportunities Progressing
Milestones• ContinuedgrowthanddevelopmentofLearningArea
involvementinSustainabilityWeekwithanincreaseinarangeofprojectsshowcased
• LESSstudentsdevelopingaverticalgarden• EaLSinvolvementintheWhaleSharkandEISPprogramswith
externalpartners• IECdevelopingasustainablevegetablegardenandwormfarm• ContinuedplantingandmaintenanceoftheWetlandsincreasing
thenumberoflocal,biodiverseplantsintheschool• Expansionofthenumberofrecycledartpiecestobeautifythe
schoolenvironment• ContinuedgrowthoftheMiniEaLSacademicextensionprogram
forlocalyear5primaryschoolstudents
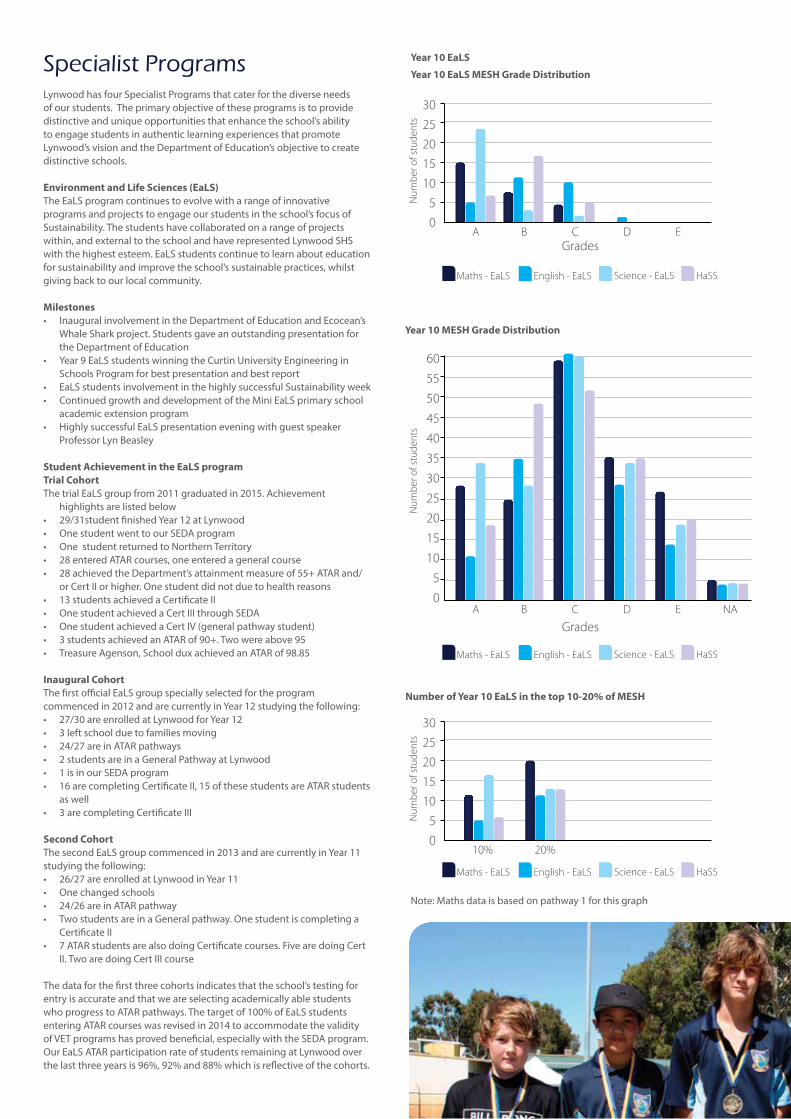
Specialist ProgramsLynwoodhasfourSpecialistProgramsthatcaterforthediverseneedsofourstudents.Theprimaryobjectiveoftheseprogramsistoprovidedistinctiveanduniqueopportunitiesthatenhancetheschool’sabilitytoengagestudentsinauthenticlearningexperiencesthatpromoteLynwood’svisionandtheDepartmentofEducation’sobjectivetocreatedistinctiveschools.
Environment and Life Sciences (EaLS)TheEaLSprogramcontinuestoevolvewitharangeofinnovativeprogramsandprojectstoengageourstudentsintheschool’sfocusofSustainability.Thestudentshavecollaboratedonarangeofprojectswithin,andexternaltotheschoolandhaverepresentedLynwoodSHSwiththehighestesteem.EaLSstudentscontinuetolearnabouteducationforsustainabilityandimprovetheschool’ssustainablepractices,whilstgivingbacktoourlocalcommunity.
Milestones• InauguralinvolvementintheDepartmentofEducationandEcocean’s
WhaleSharkproject.StudentsgaveanoutstandingpresentationfortheDepartmentofEducation
• Year9EaLSstudentswinningtheCurtinUniversityEngineeringinSchoolsProgramforbestpresentationandbestreport
• EaLSstudentsinvolvementinthehighlysuccessfulSustainabilityweek• ContinuedgrowthanddevelopmentoftheMiniEaLSprimaryschool
academicextensionprogram• HighlysuccessfulEaLSpresentationeveningwithguestspeaker
ProfessorLynBeasley
Student Achievement in the EaLS programTrial CohortThetrialEaLSgroupfrom2011graduatedin2015.Achievement
highlightsarelistedbelow• 29/31studentfinishedYear12atLynwood• OnestudentwenttoourSEDAprogram• OnestudentreturnedtoNorthernTerritory• 28enteredATARcourses,oneenteredageneralcourse• 28achievedtheDepartment’sattainmentmeasureof55+ATARand/
orCertIIorhigher.Onestudentdidnotduetohealthreasons• 13studentsachievedaCertificateII• OnestudentachievedaCertIIIthroughSEDA• OnestudentachievedaCertIV(generalpathwaystudent)• 3studentsachievedanATARof90+.Twowereabove95• TreasureAgenson,SchoolduxachievedanATARof98.85
Inaugural CohortThefirstofficialEaLSgroupspeciallyselectedfortheprogramcommencedin2012andarecurrentlyinYear12studyingthefollowing:• 27/30areenrolledatLynwoodforYear12• 3leftschoolduetofamiliesmoving• 24/27areinATARpathways• 2studentsareinaGeneralPathwayatLynwood• 1isinourSEDAprogram• 16arecompletingCertificateII,15ofthesestudentsareATARstudents
aswell• 3arecompletingCertificateIII
Second CohortThesecondEaLSgroupcommencedin2013andarecurrentlyinYear11studyingthefollowing:• 26/27areenrolledatLynwoodinYear11• Onechangedschools• 24/26areinATARpathway• TwostudentsareinaGeneralpathway.Onestudentiscompletinga
CertificateII• 7ATARstudentsarealsodoingCertificatecourses.FivearedoingCert
II.TwoaredoingCertIIIcourse
Thedataforthefirstthreecohortsindicatesthattheschool’stestingforentryisaccurateandthatweareselectingacademicallyablestudentswhoprogresstoATARpathways.Thetargetof100%ofEaLSstudentsenteringATARcourseswasrevisedin2014toaccommodatethevalidityofVETprogramshasprovedbeneficial,especiallywiththeSEDAprogram.OurEaLSATARparticipationrateofstudentsremainingatLynwoodoverthelastthreeyearsis96%,92%and88%whichisreflectiveofthecohorts.
Year 10 EaLS
Year 10 EaLS MESH Grade Distribution
Year 10 MESH Grade Distribution
Number of Year 10 EaLS in the top 10-20% of MESH
Note:Mathsdataisbasedonpathway1forthisgraph
Grades
Grades
Num
ber o
f stu
dent
s N
umbe
r of s
tude
nts
Num
ber o
f stu
dent
s
A B C D E
10% 20%
A B C D E NA
30
25
20
15
10
5
0
30
25
20
15
10
5
0
60
55
50
45
40
35
30
25
20
15
10
5
0
Maths - EaLS
Maths - EaLS
Maths - EaLS
English - EaLS
English - EaLS
English - EaLS
Science - EaLS
Science - EaLS
Science - EaLS
HaSS
HaSS
HaSS
Year 9 EaLS
Year 9 EaLS MESH Grade Distribution
Year 9 Cohort MESH Grade Distribution
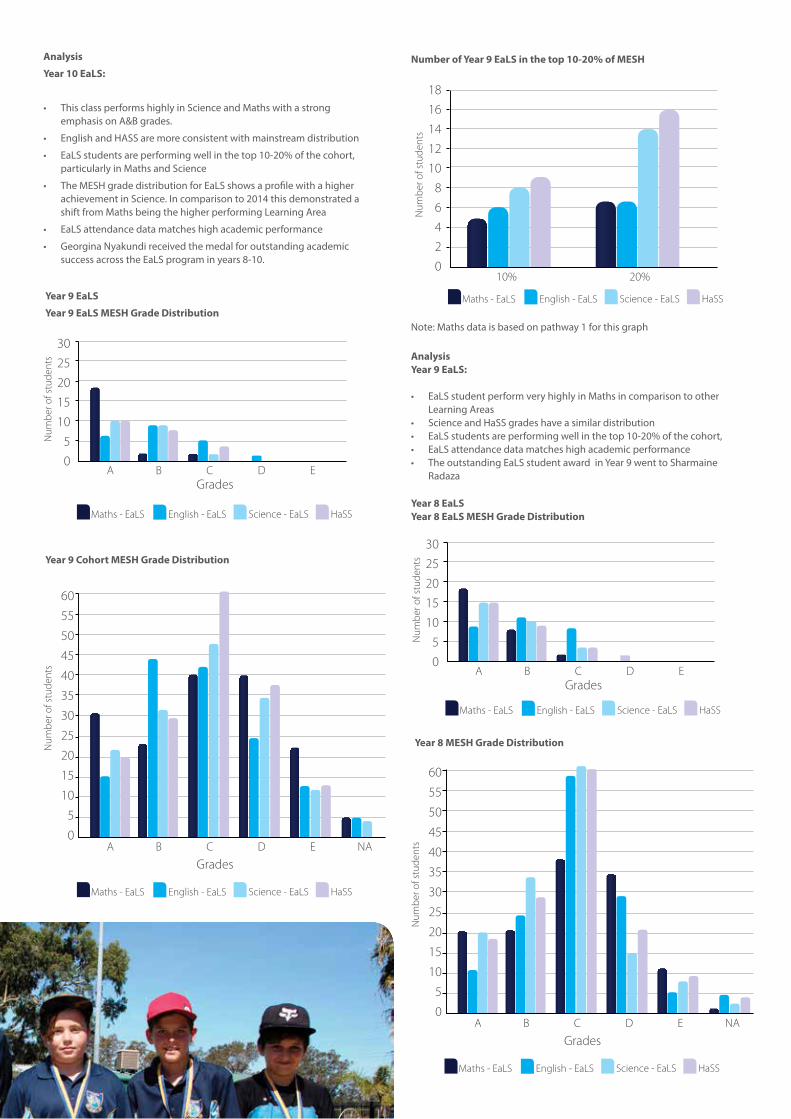
Analysis
Year 10 EaLS:
• ThisclassperformshighlyinScienceandMathswithastrongemphasisonA&Bgrades.
• EnglishandHASSaremoreconsistentwithmainstreamdistribution
• EaLSstudentsareperformingwellinthetop10-20%ofthecohort,particularlyinMathsandScience
• TheMESHgradedistributionforEaLSshowsaprofilewithahigherachievementinScience.Incomparisonto2014thisdemonstratedashiftfromMathsbeingthehigherperformingLearningArea
• EaLSattendancedatamatcheshighacademicperformance
• GeorginaNyakundireceivedthemedalforoutstandingacademicsuccessacrosstheEaLSprograminyears8-10.
Grades
Grades
Num
ber o
f stu
dent
sN
umbe
r of s
tude
nts
A B C D E
A B C D E NA
30
25
20
15
10
5
0
60
55
50
45
40
35
30
25
20
15
10
5
0
Maths - EaLS
Maths - EaLS
English - EaLS
English - EaLS
Science - EaLS
Science - EaLS
HaSS
HaSS
Note:Mathsdataisbasedonpathway1forthisgraph
AnalysisYear 9 EaLS:
• EaLSstudentperformveryhighlyinMathsincomparisontootherLearningAreas
• ScienceandHaSSgradeshaveasimilardistribution• EaLSstudentsareperformingwellinthetop10-20%ofthecohort,• EaLSattendancedatamatcheshighacademicperformance• TheoutstandingEaLSstudentawardinYear9wenttoSharmaine
Radaza
Number of Year 9 EaLS in the top 10-20% of MESH
Num
ber o
f stu
dent
s
10% 20%
18
16
14
12
10
8
6
4
2
0
Maths - EaLS English - EaLS Science - EaLS HaSS
Year 8 EaLSYear 8 EaLS MESH Grade Distribution
Grades
Num
ber o
f stu
dent
s
A B C D E
30
25
20
15
10
5
0
Maths - EaLS English - EaLS Science - EaLS HaSS
Year 8 MESH Grade Distribution
Grades
Num
ber o
f stu
dent
s
A B C D E NA
60
55
50
45
40
35
30
25
20
15
10
5
0
Maths - EaLS English - EaLS Science - EaLS HaSS
Note:Mathsdataisbasedonpathway1forthisgraph
Number of Year 7 EaLS in the top 10-20% of MESHN
umbe
r of s
tude
nts
Num
ber o
f stu
dent
s
10% 20%
10% 20%
26
24
22
20
18
16
14
12
10
8
6
4
2
0
22
20
18
16
14
12
10
8
6
4
2
0
Maths - EaLS
Maths - EaLS
English - EaLS
English - EaLS
Science - EaLS
Science - EaLS
HaSS
HaSS
Year 7 EaLSYear 7 EaLS MESH Grade Distribution
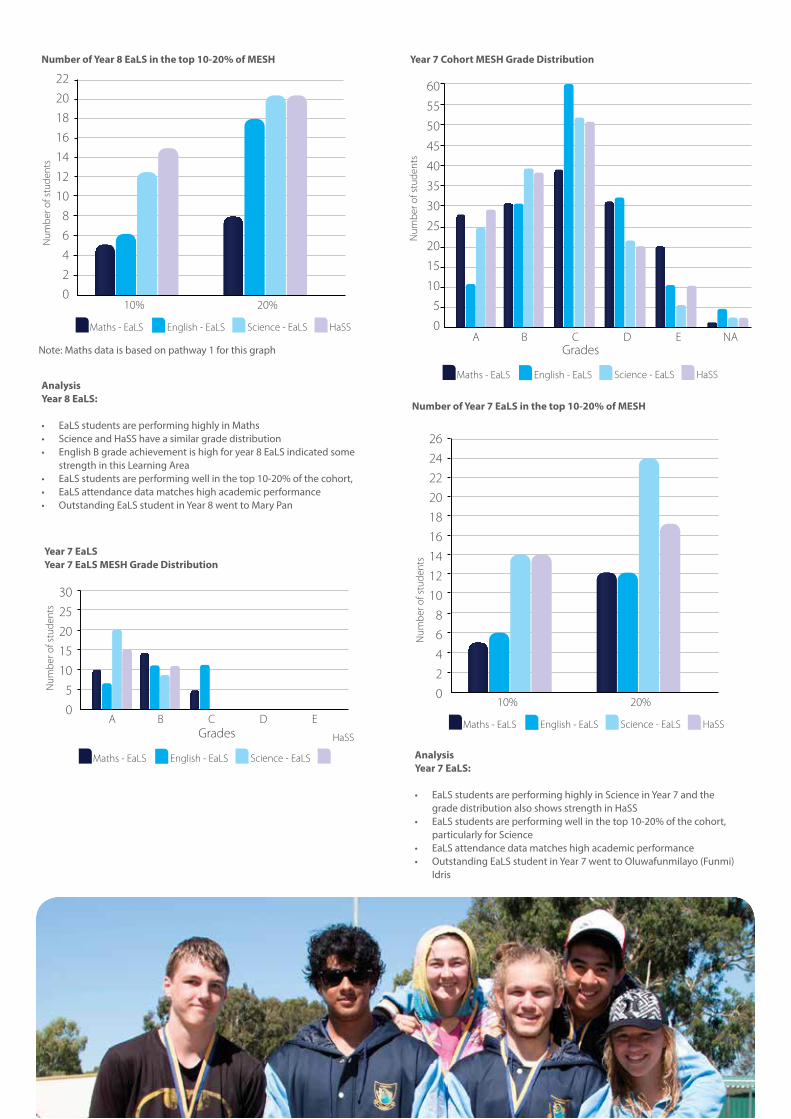
Year 7 Cohort MESH Grade DistributionNumber of Year 8 EaLS in the top 10-20% of MESH
AnalysisYear 8 EaLS:
• EaLSstudentsareperforminghighlyinMaths• ScienceandHaSShaveasimilargradedistribution• EnglishBgradeachievementishighforyear8EaLSindicatedsome
strengthinthisLearningArea• EaLSstudentsareperformingwellinthetop10-20%ofthecohort,• EaLSattendancedatamatcheshighacademicperformance• OutstandingEaLSstudentinYear8wenttoMaryPan
Grades
Num
ber o
f stu
dent
s
A B C D E
30
25
20
15
10
5
0
Maths - EaLS English - EaLS Science - EaLS
HaSS
Grades
Num
ber o
f stu
dent
s
A B C D E NA
60
55
50
45
40
35
30
25
20
15
10
5
0
Maths - EaLS English - EaLS Science - EaLS HaSS
AnalysisYear 7 EaLS:
• EaLSstudentsareperforminghighlyinScienceinYear7andthegradedistributionalsoshowsstrengthinHaSS
• EaLSstudentsareperformingwellinthetop10-20%ofthecohort,particularlyforScience
• EaLSattendancedatamatcheshighacademicperformance• OutstandingEaLSstudentinYear7wenttoOluwafunmilayo(Funmi)
Idris
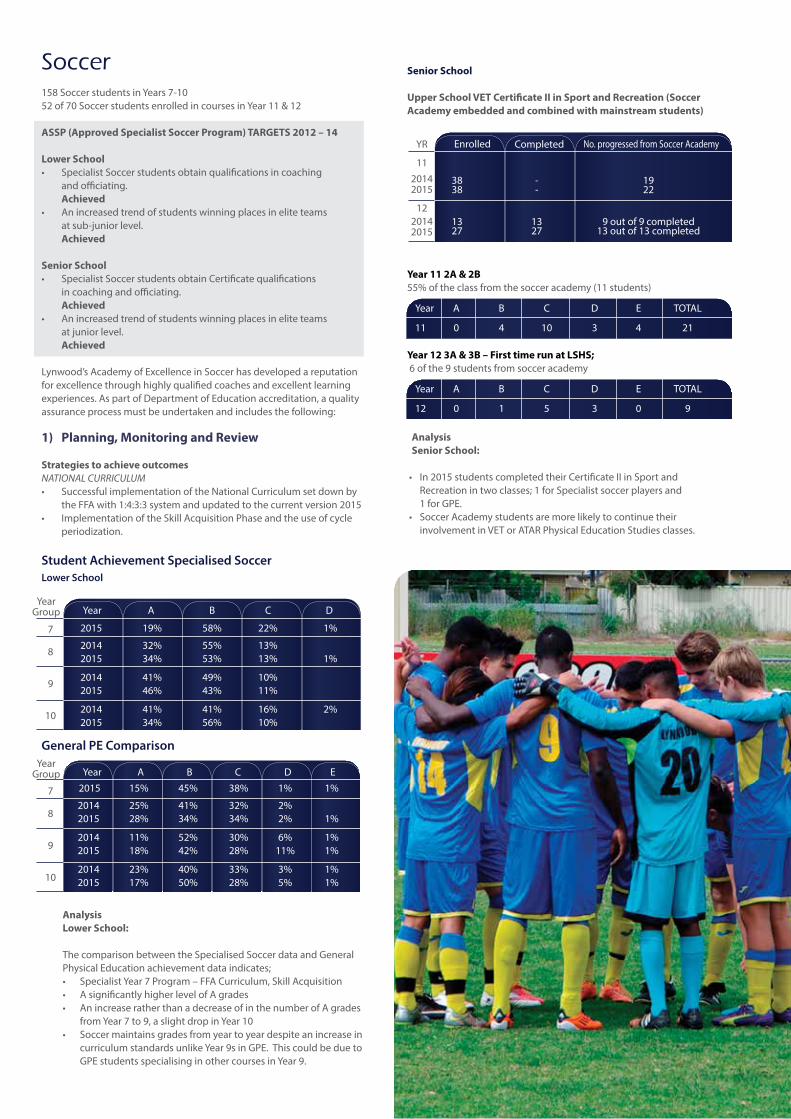
Soccer158SoccerstudentsinYears7-1052of70SoccerstudentsenrolledincoursesinYear11&12
ASSP (Approved Specialist Soccer Program) TARGETS 2012 – 14
Lower School• SpecialistSoccerstudentsobtainqualificationsincoaching
andofficiating. Achieved
• Anincreasedtrendofstudentswinningplacesineliteteams atsub-juniorlevel. Achieved
Senior School• SpecialistSoccerstudentsobtainCertificatequalifications incoachingandofficiating.
Achieved• Anincreasedtrendofstudentswinningplacesineliteteams
atjuniorlevel. Achieved
Lynwood’sAcademyofExcellenceinSoccerhasdevelopedareputationforexcellencethroughhighlyqualifiedcoachesandexcellentlearningexperiences.AspartofDepartmentofEducationaccreditation,aqualityassuranceprocessmustbeundertakenandincludesthefollowing:
1) Planning, Monitoring and Review
Strategies to achieve outcomesNATIONAL CURRICULUM • SuccessfulimplementationoftheNationalCurriculumsetdownby
theFFAwith1:4:3:3systemandupdatedtothecurrentversion2015• ImplementationoftheSkillAcquisitionPhaseandtheuseofcycle
periodization.
AnalysisLower School:
ThecomparisonbetweentheSpecialisedSoccerdataandGeneralPhysicalEducationachievementdataindicates;• SpecialistYear7Program–FFACurriculum,SkillAcquisition• AsignificantlyhigherlevelofAgrades• AnincreaseratherthanadecreaseofinthenumberofAgrades
fromYear7to9,aslightdropinYear10• Soccermaintainsgradesfromyeartoyeardespiteanincreasein
curriculumstandardsunlikeYear9sinGPE.ThiscouldbeduetoGPEstudentsspecialisinginothercoursesinYear9.
Senior School
Upper School VET Certificate II in Sport and Recreation (Soccer Academy embedded and combined with mainstream students)
Year 11 2A & 2B55%oftheclassfromthesocceracademy(11students)
Year 12 3A & 3B – First time run at LSHS;6ofthe9studentsfromsocceracademy
Analysis Senior School:
• In2015studentscompletedtheirCertificateIIinSportandRecreationintwoclasses;1forSpecialistsoccerplayersand 1forGPE.
• SoccerAcademystudentsaremorelikelytocontinuetheirinvolvementinVETorATARPhysicalEducationStudiesclasses.
Student Achievement Specialised SoccerLower School
General PE Comparison
7
8
9
10
Year A B C D
2015 19% 58% 22% 1%
2014 32% 55% 13%2015 34% 53% 13% 1%
2014 41% 49% 10%2015 46% 43% 11%
2014 41% 41% 16% 2%2015 34% 56% 10%
7
8
9
10
Year A B C D E
2015 15% 45% 38% 1% 1%
2014 25% 41% 32% 2%2015 28% 34% 34% 2% 1%
2014 11% 52% 30% 6% 1%2015 18% 42% 28% 11% 1%
2014 23% 40% 33% 3% 1%2015 17% 50% 28% 5% 1%
YR
1120142015
1220142015
Enrolled
Year A B C D E TOTAL
Year A B C D E TOTAL
11 0 4 10 3 4 21
12 0 1 5 3 0 9
Completed No.progressedfromSoccerAcademy
38 - 1938 - 22
13 13 9outof9completed27 27 13outof13completed
YearGroup
YearGroup
2. Capacity for Excellence
Student involvement in community sport COACHINGCOURSES• 28Year8students,22Year9Girlsand44Year9Boyscompletedtheir
FFAGrassrootscoachinglicence• 43Year9and19Year10studentscompletedtheFFASkillsTraining
Certificate
AnnGourley,astaffmemberatLSHS,isqualifiedtoconducttheGrassroots&SkillsTrainingCoachingLicenses.ThisisthelargestnumberofstudentsqualifiedinoneyearandcompletionofaSkillsTrainingCertificate–NicolainTraining.
REFEREELICENCES• 20Year10studentscompletedtheirRefereeLicencewith FootballWest
3. Participation in SSA events
ZONECARNIVALS• Year7Boys RunnersUp• Year7Girls RunnersUp• Year8Boys RunnersUp• Year8Girls Champions• Year9Boys - RunnersUp• Year9Girls Champions• Year10Boys - Champions–2ndPlaceinStateFinals!!!• Year10Girls - Champions–3rdPlaceinStateFinals
CHAMPIONSCHOOLSGLORYCUPEntered8teams;• 1Seniorboysteam •A3rdinSpecialisedgroup,SemiFinals=WINNERSofSOUTHERNSHIELDCUP• 1SeniorGirlsteam •A4thinSpecialisedgroupandmadeSemiFinals,Runners-upof SouthernShieldFinal• 2IntermediateBoysTeam(newcategory) •A2ndingroup,Runners-up,QuarterFinalsoftheCup,Runners- upofSouthernShieldFinal •B2ndinthegroup,1stroundknockout• 2JuniorBoysteams •A2ndinSpecialistgroup,QuarterFinalsoftheCup,Runners-up ofSouthernShieldFinal •B4thingroup• 2JuniorGirlsteams •Afinished2ndinSpecialisedgroupandmadeSemiFinals, Runners-upofSouthernShieldFinal •Bfinished2nd,Quarterfinalsofknockouts
4.StateRepresentatives• U19StateFutsalTeam =SebastianStankovic&DanielChung• U16StateFutsalTeam =EthanHardy• U15FootballWestState Team&NationalTrainingCentre =ZaydFarah
4. Contributions to further Soccer in the Community
SOCCERCAMP–EDITHCOWANUNIVERSITYVISITS• StudentsattendedadaytouratECUJoondalupcampuswherethe
onlySoccerSpecialistDiplomainScienceisavailableatUniversity.Studentsexploredthecampus,werelecturedonsportsscienceandanalysisandprovidedinformationonhowtoqualifyforenrolmentintotheuniversitycourse.
SUPER7sCARNIVAL• Year8-10studentsorganisedandconductedbytheYear6and7
carnivalatLynwoodSHSforallprimaryschoolsduringTerm4–LynwoodSeniorHighSchoolSuper7sSoccerCup.Over250studentsparticipatedonthedayfromthefollowingPrimarySchools;Wilson,Parkwood,Brookman,Beckenham,Rostrata,ForestCrescent,BannisterCreek,PioneerandCanningtonCommunityCollege.
GLORYVISTIS• MembersofPerthGloryconductedavisitinTerm4
SEDA Specialist VET Program
CompletingtheWesternAustralianCertificateofEducation(WACE),isthecornerstoneoftheSEDAprogram.SEDArecognisesthataYear12completionisfundamentaltoayoungperson’slongtermpersonal,socialandcareerdevelopment.AllSEDAstudentsundertakeVETCertificateswhichcontributetotheirWACE,allowingthemtotransitionintoworkorfurtherstudy.Withastrongconnectiontoindustry,studentsdevelopinitiative,communication,leadership,resilienceandcriticalthinkingskills.ThisprovidesSEDAgraduateswiththeopportunitytogainemploymentacrossnumerousindustries.
SEDAiscommittedtoprovidingpathwayopportunitiestostudents.ThishasledtothesigningofmultiplepartnershipandarticulationagreementswithuniversitiesacrossAustraliawhichprovidesstudentopportunityfordirectentrytoMurdochandNotreDameUniversitiesarepartneredwithSEDA,howeveruponcompletingtheprogram,studentscanchoosetoenrolatauniversityoftheirchoice.
LynwoodSHSSEDAstudentsgrewfrom166in2014to2011in2015.
Lynwood Environmental Academic Flexible (LEAF) Learning Program
LEAFcommencedin2010withaclassofYear11studentsandhassincegraduatedinexcessof60students,with33ofthesestudentshavingachievedaCertificateIIinHorticulture.
LEAFisaSeniorSchoolEngagementProgramestablishedtomeetthedemandforstudentswhowishtoachievetheirWACE,howeverhaveaddissuesintheirlowerschoolschooling.Theprogramreliesonsmallclasssizesandalimitednumberofteacherstodevelopastrongrapportwiththestudentsandallowforflexibilityinthedaytodayrunningoftheprogram.Thisrapportandflexibilityprovidesstaffwithopportunitiestosupportstudentswhomayhavehadlowattendance,behaviourissuesand/orlackofacademicsuccessinasafeandnurturingenvironment,withtheaimtohavethesestudentsenterthecommunitywithconfidence,prideandpurpose.
WorkingintheOrganicGardenandAquaponicsCentre,supportstheschool’svisionofbeinga“CentreforEnvironmentandLifeSciences”andprovidesthestudentswithasenseofprideandownership.
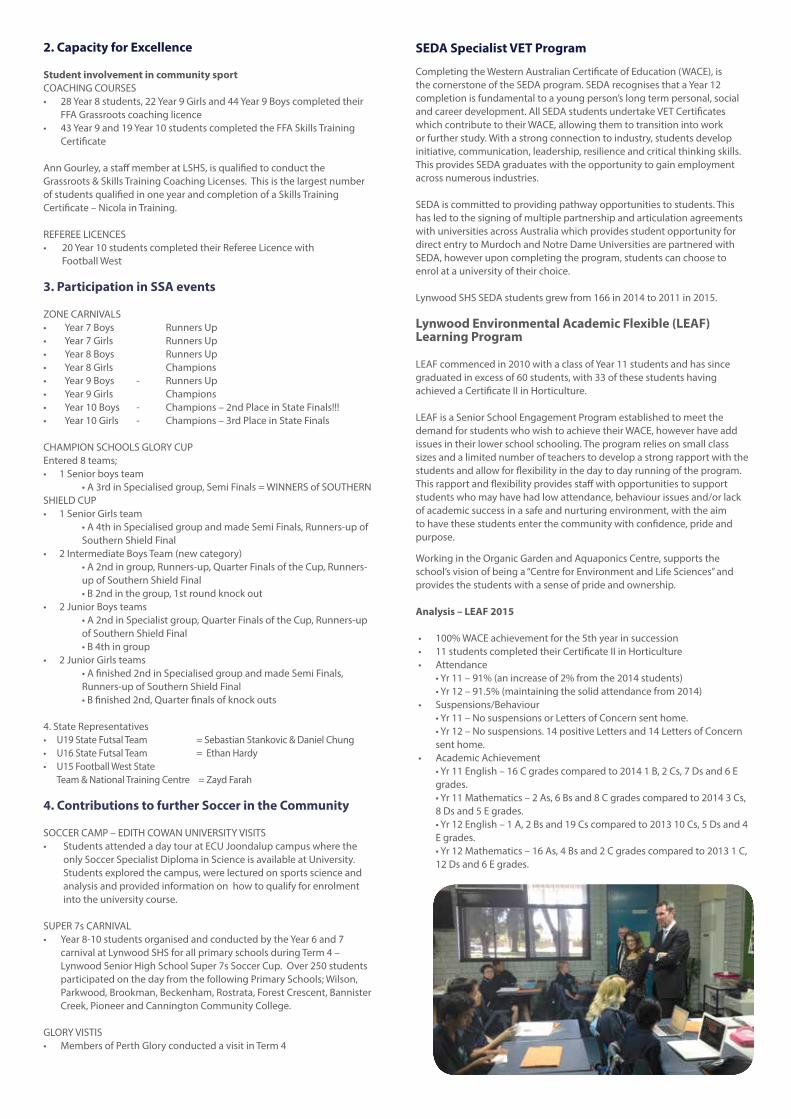
Analysis – LEAF 2015
• 100%WACEachievementforthe5thyearinsuccession• 11studentscompletedtheirCertificateIIinHorticulture• Attendance •Yr11–91%(anincreaseof2%fromthe2014students) •Yr12–91.5%(maintainingthesolidattendancefrom2014)• Suspensions/Behaviour •Yr11–NosuspensionsorLettersofConcernsenthome. •Yr12–Nosuspensions.14positiveLettersand14LettersofConcern
senthome.• AcademicAchievement •Yr11English–16Cgradescomparedto20141B,2Cs,7Dsand6E
grades. •Yr11Mathematics–2As,6Bsand8Cgradescomparedto20143Cs,
8Dsand5Egrades. •Yr12English–1A,2Bsand19Cscomparedto201310Cs,5Dsand4
Egrades. •Yr12Mathematics–16As,4Bsand2Cgradescomparedto20131C,
12Dsand6Egrades.
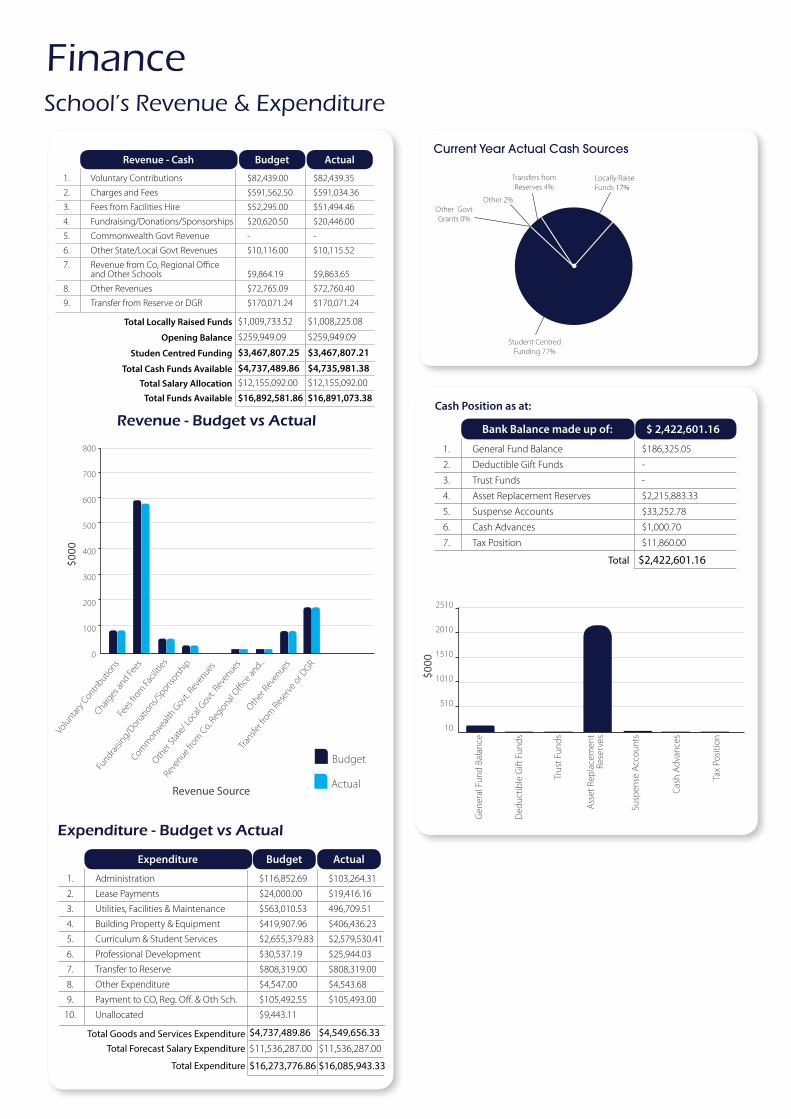
Finance
Revenue - Cash Budget Actual
1. Voluntary Contributions $82,439.00 $82,439.35
2. Charges and Fees $591,562.50 $591,034.36
3. Fees from Facilities Hire $52,295.00 $51,494.46
4. Fundraising/Donations/Sponsorships $20,620.50 $20,446.00
5. Commonwealth Govt Revenue - -
6. Other State/Local Govt Revenues $10,116.00 $10,115.52
7. Revenue from Co, Regional Office and Other Schools $9,864.19 $9,863.65
8. Other Revenues $72,765.09 $72,760.40
9. Transfer from Reserve or DGR $170,071.24 $170,071.24
Total Locally Raised Funds
Opening Balance
Studen Centred Funding
Total Cash Funds AvailableTotal Salary Allocation
Total Funds Available
$1,009,733.52 $1,008,225.08
$259,949.09 $259,949.09
$3,467,807.25 $3,467,807.21
$4,737,489.86 $4,735,981.38$12,155,092.00 $12,155,092.00
$16,892,581.86 $16,891,073.38
Revenue - Budget vs Actual
Volu
ntary
Contri
butions
Fundra
ising/D
onatio
ns/Sponso
rship
Transfe
r fro
m Re
serv
e or D
GR
RevenueSource
Charges
and Fe
es
Reve
nue fro
m C
o, Reg
ional
Office
and...
Comm
onwealth
Govt
. Rev
enues
Fees
from
Facil
ities
Other
Reve
nues
Other
Stat
e/ Lo
cal G
ovt. R
even
ues
800
700
600
500
400
300
200
100
0
Budget
Actual
School’s Revenue & Expenditure
Gen
eral
Fun
d Ba
lanc
e
Ass
et R
epla
cem
ent
Rese
rves
$000
$000
Ded
uctib
le G
ift F
unds
Tax
Posi
tion
Susp
ense
Acc
ount
s
Trus
t Fun
ds
Cash
Adv
ance
s
2510
2010
1510
1010
510
10
Bank Balance made up of:
Cash Position as at:
$ 2,422,601.16
1. General Fund Balance $186,325.05
2. Deductible Gift Funds -
3. Trust Funds -
4. Asset Replacement Reserves $2,215,883.33
5. Suspense Accounts $33,252.78
6. Cash Advances $1,000.70
7. Tax Position $11,860.00
Total $2,422,601.16
Current Year Actual Cash Sources
Student CentredFunding 77%
Other Govt Grants 0%
Other 2%
Transfers fromReserves 4%
Locally Raise Funds 17%
Expenditure - Budget vs Actual
Expenditure Budget Actual
1. Administration $116,852.69 $103,264.31
2. Lease Payments $24,000.00 $19,416.16
3. Utilities, Facilities & Maintenance $563,010.53 496,709.51
4. Building Property & Equipment $419,907.96 $406,436.23
5. Curriculum & Student Services $2,655,379.83 $2,579,530.41
6. Professional Development $30,537.19 $25,944.03
7. Transfer to Reserve $808,319.00 $808,319.00
8. Other Expenditure $4,547.00 $4,543.68
9. Payment to CO, Reg. Off. & Oth Sch. $105,492.55 $105,493.00
10. Unallocated $9,443.11
TotalGoodsandServicesExpenditureTotalForecastSalaryExpenditure
TotalExpenditure
$4,737,489.86 $4,549,656.33$11,536,287.00 $11,536,287.00
$16,273,776.86$16,085,943.33
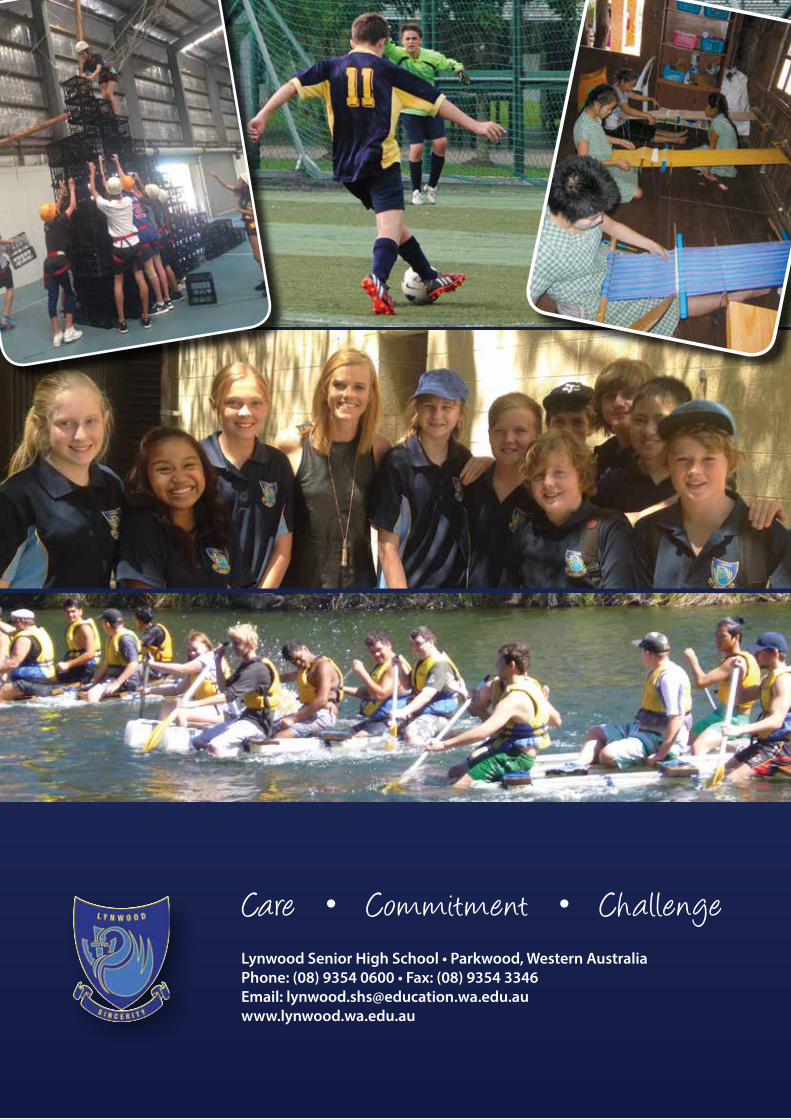
Care • Commitment • Challenge Lynwood Senior High School • Parkwood, Western AustraliaPhone: (08) 9354 0600 • Fax: (08) 9354 3346 Email: [email protected]