Embed Size (px)
Citation preview
Strength. Performance. Passion
Lynwood Quarry
Annual Environmental Review
October 2012

Lynwood Quarry Annual Review 2012
TABLE OF CONTENTS
1.0 Introduction .................................................................................. 4
1.1 Overview of the Project ............................................................................ 4
1.2 Consents and Licences .............................................................................. 4 1.2.1 Development Consent ........................................................................................... 5
1.3 Quarry Contacts ....................................................................................... 6
1.4 Employee Training .................................................................................... 7
2.0 Summary of Operations during the Report Period ............................. 8
2.1 Construction ............................................................................................ 8 2.1.1 Earthworks and Construction Equipment ................................................................ 9
2.2 Quarrying Activities .................................................................................. 9
3.0 Environmental Management, Monitoring and Performance ............ 10
3.1 Review of Management Plans and Monitoring Programs .......................... 10
3.2 Meteorological Monitoring ..................................................................... 11 3.2.1 Rainfall ...............................................................................................................11 3.2.2 Wind ..................................................................................................................12
3.3 Air Quality ............................................................................................. 12 3.3.1 Dust Management Controls .................................................................................12 3.3.2 Dust Deposition Monitoring .................................................................................12 3.3.3 High Volume Air Sampler PM10 Monitoring ...........................................................15
3.4 Erosion and Sediment Control ................................................................. 16
3.5 Water Management ............................................................................... 17 3.5.1 Surface Water Management ................................................................................17 3.5.2 Water Supply and Demand ..................................................................................19 3.5.3 Site Water Balance ..............................................................................................19 3.5.4 Water Monitoring Program ..................................................................................19
3.6 Groundwater ......................................................................................... 26 3.6.1 Groundwater Monitoring Program .......................................................................26 3.6.2 Groundwater Levels and Flows .............................................................................27 3.6.3 Groundwater Quality ...........................................................................................27
3.7 Blasting.................................................................................................. 27
3.8 Operational Noise .................................................................................. 29 3.8.1 Noise Monitoring ................................................................................................29
3.9 Visual .................................................................................................... 29
3.10 Threatened Flora .................................................................................... 30 3.10.1 Hoary Sunray ....................................................................................................30 3.10.2 Box Gum Woodland CEEC ..............................................................................30
3.11 Threatened Fauna .................................................................................. 30
Lynwood Quarry Annual Review 2012
3.12 Aboriginal Heritage................................................................................. 31 3.12.1 Annual Aboriginal Heritage Monitoring .............................................................31 3.12.2 Reportable Incidents .........................................................................................31
3.13 Historical Heritage .................................................................................. 32
3.14 Bushfire ................................................................................................. 32
3.15 Public Safety .......................................................................................... 32
3.16 Waste Management ............................................................................... 33 3.16.1 Sewage Treatment and Disposal ...........................................................................33 3.16.2 Waste Disposal and Recycling ..............................................................................33
3.17 Hazardous Material Management ........................................................... 33 3.18 Feral Animal Control .......................................................................... 34 3.19 Weed Control ...................................................................................... 34
4.0 Community Relations ................................................................... 35
4.1 Community Complaints........................................................................... 35
4.2 Community Donations ............................................................................ 36
5.0 Rehabilitation Activities ................................................................ 37
6.0 Activities Proposed for 2012/13 Annual Review Period ................... 38
6.1 Environmental Performance Initiatives 2011-2012 .................................... 38
7.0 References ................................................................................... 39
FIGURES 1.1 Locality Map ...................................................................................................... 1.1 1.2 Conceptual 30 year Quarry Plan ........................................................................ 1.1 3.1 Environmental Monitoring Locations ................................................................ 1.1
APPENDICES
Appendix 1 – Annual and Seasonal Wind roses for Lynwood Quarry July 2010 to June 2011 Appendix 2 – Results of Groundwater Monitoring for July 2010 to June 2011 Appendix 3 – Noise Monitoring Report

Lynwood Quarry Annual Review 2012

Lynwood Quarry Annual Review 2012
1.0 Introduction Lynwood Quarry is owned and managed by Holcim (Australia) Pty Ltd (Holcim). The quarry is located in the Goulburn Mulwaree Local Government Area, approximately 160 kilometres southwest of Sydney and approximately 27 kilometres north-east of Goulburn (refer to Figure 1.1). Construction of the project commenced in November 2010, with operations anticipated to commence in 2014. Holcim (formerly Readymix) was granted development consent on 21 December 2005 (DA-128-5-2005) by the Minister for Planning for the construction and operation of Lynwood Quarry. Minor modifications to the development consent were approved in May 2009, March 2011 and August 2011, the modifications are further discussed in Section 1.2.1. Lynwood Quarry will provide a long-term supply of high quality construction material into the Sydney, regional and local markets. This Annual Review details the operational and environmental management activities of Lynwood Quarry during the period 1 July 2011 to 30 June 2012. The report has been prepared in accordance with Condition 6 of Schedule 5 of the Development Consent. 1.1 Overview of the Project
The Lynwood Quarry site is bounded to the south by the Hume Highway and bisected in an east-west direction by the Main Southern Railway. It incorporates the headwaters of Joarimin, Lockyersleigh and Marulan Creeks and has historically been used primarily for agriculture, in particular grazing. Lynwood Quarry will provide a long-term supply of high quality construction material into the Sydney, regional and local markets. The supply to the Sydney market will replace supply from existing quarries that are nearing the end of their resources. The project area contains a substantial, high quality, hard rock resource with ready transport access to the Main Southern Railway and Hume Highway. The quarry is approved to produce up to five million tonnes per annum (Mtpa) of saleable quarry product for an initial 30 year quarrying period (refer to Figure 1.2). The target resource has an expected life of in excess of 90 years. 1.2 Consents and Licences
The operation of Lynwood Quarry is regulated by a range of licences and approvals from both state and local authorities. For environmental purposes, these include: • Development Consent (DA 128-5-2005), as modified;
• Environment Protection Licence (EPL) No. 12939;
• A Controlled Activity Approval (CAA No. 10 ERM 2011/0446) under the Water Management Act
2000 (WMA Act) for works within the Joarimin Creek, Lockyersleigh Creek and Marulan Creek riparian zones. The Controlled Activity Approval was modified on 4 May 2012 to include a temporary creek crossing ‘J13’ which was required in order to construct the rail turn out;
• Aboriginal Heritage Impact Permit (AHIP) No. 1100264 which consolidates previous AHIPS for the
site and covers ongoing works to be undertaken at Lynwood Quarry; and
• S65 Approval under the Heritage Act 1977 (2009/S65A/13).

Lynwood Quarry Annual Review 2012
1.2.1 Development Consent
Development consent (DA-128-5-2005) for Lynwood Quarry’s operation and surface facilities was granted on 21 December 2005 by the Minister for Planning. In May 2005, Holcim lodged a development application and accompanying Environmental Impact Statement (EIS) (Umwelt, 2005) with the then Department of Infrastructure, Planning and Natural Resources (DIPNR) (now Department of Planning and Infrastructure (DP&I)) for determination by the then Minister for Infrastructure and Planning. The project was classed as a State Significant Development under Section 76 A(7) of the EP&A Act. Development Consent was granted for the project on 21 December 2005. On 7 May 2009, Holcim received approval to modify the design of the Quarry (Modification 1) in accordance with Section 96(1A) of the EP&A Act. A Statement of Environmental Effects (SEE) was prepared by Umwelt (Umwelt, 2009) on behalf of Holcim to assess the potential environmental impacts of the proposed modifications, which comprised:
• the quarry footprint being reduced in the western extent, which necessitated changes in the
progression of the quarry pit, due to the identification of a fault in this area;
• a revised layout of Quarry site infrastructure including the crushing and screening plant;
• a revised conceptual design of the Hume Highway interchange; and
• approval for delivery of quarry product by road to all markets, due to the potential for staged construction.
On 22 March 2011, approval for Modification 2 to the development consent was granted by the then Department of Planning (now DP&I) to optimise the site infrastructure and site layout. The key modifications included reconfiguration of the rail loop to a rail spur, relocation of the office facilities and other infrastructure components, minor changes to the quarry pit development and crushing equipment and minor changes to the western excess product emplacement area. On 19 August 2011, a minor modification to the Development Consent for Lynwood Quarry (128-5-2005) was approved (MOD 3). The modification related to: • modification of the date in the consent relating to the submission of the first Annual Review to
reflect the date of commencement of construction; and
• modification of the date of the commissioning of first the Independent Environmental Audit to reflect the date of commencement of construction of the project in November 2010.
This Annual Review has been developed in accordance with Condition 6 of Schedule 5 of the Development Consent. Table 1.1 details the consent condition and where the requirements are addressed in this document.

Lynwood Quarry Annual Review 2012
Table 1.1 – Development Consent Condition Relating to the Annual Review
Consent Condition Section Reference
6. By the end of September 2011, and annually thereafter, the applicant shall review the environmental performance of the project to the satisfaction of the Director-General. This review must:
a) describe the development (including any rehabilitation) that was carried out in the past financial year, and the development that is proposed to be carried out over the next financial year;
5.0
b) include a comprehensive review of the monitoring results and complaints records of the project over the past financial year, which includes a comparison of these results against the:
• relevant statutory requirements, limits or performance measures / criteria; • monitoring results of previous financial years; and • relevant predictions in the EIS
3.0
c) identify any non-compliance over the past financial year, and describe what actions were (or are being) taken to ensure compliance 3.0
d) identify any trends in the monitoring data over the life of the project; 3.0
e) identify any discrepancies between the predicted and actual impacts of the project, and analyse the potential cause of any significant discrepancies; and 3.0
f) describe what measures will be implemented over the next financial year to improve the environmental performance of the project 6.0
1.3 Quarry Contacts
The Project Director of Lynwood Quarry is responsible to the regulatory authorities for all aspects of environmental compliance at the site. Details are provided in Table 1.2 below.
Table 1.2 - Personnel Responsible for Environmental Management during the Report Period
Name Position Company Contact
Alan Massoud Lynwood Quarry Project Director Holcim (Australia) Pty Limited 02 9412 6579

Lynwood Quarry Annual Review 2012
1.4 Employee Training During the reporting period Holcim, in conjunction with the primary civil contractor BMD Constructions (BMD), developed a comprehensive environmental training program for all employees, contractors and visitors at Lynwood Quarry. The training package was designed to ensure that personnel gain a sound understanding of relevant environmental issues and management strategies, environmental incident and emergency response procedures, and their role and responsibilities in developing, implementing the requirements of the Environmental Management Strategy. The training program consists of: • Holcim Australia Environmental induction – this is Holcim’s national environmental induction and
covers a range of environmental issues including dust, noise, water, vegetation and traffic;
• Site specific Lynwood Quarry induction – this induction is completed by all personnel entering the site and includes comprehensive information on Aboriginal heritage,
• Environmental awareness training – this competency based training is part of the site induction process to ensure that all personnel have knowledge of the relevant roles and responsibilities that relate to their activities;
• Emergency response training – this covers general safety aspects and also environmental specific issues such as bushfires; and
• Regular toolbox talks – these talks address specific environmental issues, such as findings from incident or complaint investigations, or improvement initiatives.

Lynwood Quarry Annual Review 2012
2.0 Summary of Operations during the Report Period
2.1 Construction
In the 2012 Annual Reporting period the civil earthworks progressed to approximately 90% completion. BMD were the primary contractor for the civil works, including the Hume Highway interchange which was constructed under Roads and Maritime Services (RMS) authority. A summary of construction works for the period is provided below:
Completion of Sedimentation Dams A and E, and Supply Dam 1; Installation of water pipeline infrastructure, linking Sedimentation Dams A, E and F to Supply
Dam 1; Completion of earthworks for the ‘South Pad’ – the area to the south of the Main Southern
Rail where the future processing plant will be located; Completion of blasting and earthworks to create the foundation for the primary crusher; Rail siding construction and commencement of rail turnout, linking the siding to the Main
Southern Rail; 80% completion of the main site access road, from the Hume Highway interchange to the
future quarry infrastructure area; Commencement of topsoiling and revegetation of access road batters and table drains 75% completion of the Hume Highway Interchange; and 80% completion of electrical infrastructure including installation of high voltage and low
voltage conduits, transformers and the switch room.
Hume Highway Interchange Construction

Lynwood Quarry Annual Review 2012
2.1.1 Earthworks and Construction Equipment
Construction earthworks and activities peaked during the reporting period. The equipment fleet involved in the earthworks and construction are listed in Table 2.1.
Table 2.1 – Construction and Earthworks Equipment
Equipment Number Dozer 5
Excavator 5 Loaders 2 Graders 2
Padfoot Rollers 4 Smooth Drum Roller 1
Light Vehicles Approx. 50 Backhoe 1
Water cart 5 Scraper 1 Crusher 1
Compactors 2 Moxies (Haul Trucks) 10
2.2 Quarrying Activities
The foundation for the Primary Crusher was constructed during the reporting period. This was undertaken as part of the civil works contract and involved drilling, blasting and earthworks to construct the face where the Primary Crusher will be located in the future. The excavation, drilling and blasting produced approximately 200kt to 300kt of Primary Raw Feed which has been stockpiled for use in the infrastructure commissioning phase.
Construction of the Primary Crusher Pad

Lynwood Quarry Annual Review 2012
3.0 Environmental Management, Monitoring and Performance
A range of environmental monitoring was undertaken during the reporting period. All environmental monitoring locations are shown on Figure 3.1. The locations are representative of EPL requirements for Lynwood Quarry. There are presently differences with the monitoring locations specified in the EPL (currently the monitoring locations in place) and those outlined in the approved Environmental Monitoring Program prepared in accordance with Condition 3 of Schedule 5 of the development consent (intended long-term monitoring locations). It is noted that DP&I advised in a letter dated 4 April, 2012 that Holcim have the monitoring locations amended to reflect the Environmental Monitoring Plan by the 2011/12 reporting period. This was not completed; however Holcim has a program in place for the 2012/13 reporting period to rectify this situation. A brief summary of environmental management techniques applied during the reporting period are also provided in the sections below. Environmental impact predictions from the initial site EIS and the modifications SEE and EA were based on the site operating at full capacity, thus impacts from site earthworks and construction activities during the reporting period are, in most cases, significantly less than the impacts expected at full operating capacity as assessed through the environmental assessment and planning process. As detailed in the following sections, there have been some issues with the implementation of some aspects of the environmental monitoring program at Lynwood Quarry over the reporting period. In particular, there have been issues with the implementation of the noise monitoring program with only two quarters being monitored in the reporting period. Holcim has identified improvement opportunities for the noise monitoring and has taken steps to engage a specialist noise monitoring consultant for all future noise monitoring works. 3.1 Review of Management Plans and Monitoring Programs
During the annual reporting period the Lynwood Quarry Environmental Management Plans were revised to reflect the 2011 Modification 2 of the Consent. On 4 April, 2012 Department of Planning advised Holcim that the following management plans had been approved: Environmental Management Strategy; Environmental Monitoring Program; Noise Monitoring Program; Blast Monitoring Program; Air Quality Monitoring Program; Construction Traffic Management Plan; and Caring for Country Aboriginal Heritage Management Plan.
The following documents were approved in principal, providing that minor amendments to the plans would be made in accordance with Department of Planning requirements: Water Management Plan; and Rehabilitation and Landscape Management Plan.
Lynwood Quarry Annual Review 2012
Given that the Independent Environmental Audit took place during the reporting period and this triggers a review of Management Plans, the required amendments to the above plans will be incorporated into the management plan reviews, to be submitted to DP&I in January 2013. 3.2 Meteorological Monitoring
A meteorological station is located at Lynwood Quarry as shown in Figure 3.1. This meteorological station location is representative of the meteorological conditions experienced at Lynwood Quarry. During the reporting period in early 2012, it was discovered that the Lynwood Quarry Meteorological Station data had been corrupted. Technicians speculated that this was likely caused by a lightning strike to the station. Despite attempts to retrieve the data, the monitoring results for the reporting period could not be salvaged. In light of this, for the purposes of the reporting period, the meteorological data from the closest Bureau of Meteorology (BoM) weather station has been used – Goulburn Airport, Station No.: 070263. The Lynwood Quarry meteorological station will be repaired during the next reporting period. 3.2.1 Rainfall
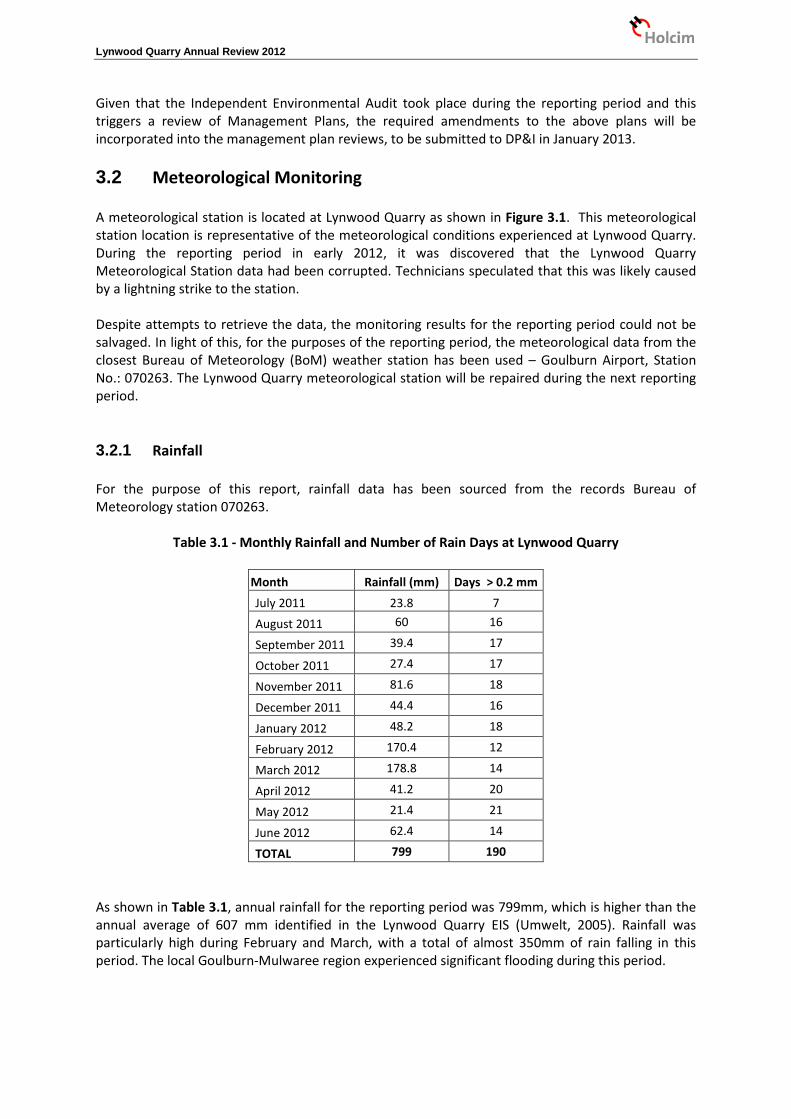
For the purpose of this report, rainfall data has been sourced from the records Bureau of Meteorology station 070263.
Table 3.1 - Monthly Rainfall and Number of Rain Days at Lynwood Quarry
Month Rainfall (mm) Days > 0.2 mm July 2011 23.8 7 August 2011 60 16
September 2011 39.4 17
October 2011 27.4 17
November 2011 81.6 18
December 2011 44.4 16
January 2012 48.2 18
February 2012 170.4 12
March 2012 178.8 14
April 2012 41.2 20
May 2012 21.4 21
June 2012 62.4 14
TOTAL 799 190 As shown in Table 3.1, annual rainfall for the reporting period was 799mm, which is higher than the annual average of 607 mm identified in the Lynwood Quarry EIS (Umwelt, 2005). Rainfall was particularly high during February and March, with a total of almost 350mm of rain falling in this period. The local Goulburn-Mulwaree region experienced significant flooding during this period.

Lynwood Quarry Annual Review 2012
3.2.2 Wind For the purpose of this report, wind rose data has been sourced from the records of BoM station 070263. The results are presented in Appendix 1 as annual wind roses showing the relative proportions of wind velocities from each compass sector for both 9.00am and 3.00pm. Wind direction was predominantly from the west and to a lesser extent the north west during the months of May through to October. Wind speed during this period was also high, particularly during August, September and November with a high proportion of winds over 40km/hr. In the warmer months of the year (i.e. December through to April, the wind direction was more variable, although still predominantly westerly). 3.3 Air Quality
3.3.1 Dust Management Controls
The dust management controls implemented for Lynwood Quarry during earthworks and construction activities included: • use of water sprays on construction access roads;
• confining traffic to identified construction traffic routes;
• keeping exposed areas to a minimum;
• prompt reseeding of areas no longer required for operational use;
• daily assessment of meteorological conditions to identify wind conditions that may be conducive to excessive dust generation – for example, very high winds, so that proactive measures can be taken to modify construction activities to reduce dust impacts; and
• stop works issued during periods of high winds.
Monitoring undertaken during the reporting period has indicated that construction activities at the site are having minimal impact on background dust levels in the region and are primarily within the criteria for the site, as outlined in Sections 3.2.2 and 3.2.3. 3.3.2 Dust Deposition Monitoring
Condition P1.1 of the EPL identifies dust deposition monitoring requirements for Lynwood Quarry at Points 1 to 8 (Depositional Dust Gauges (DG) 1 to 8) for the purposes of monitoring air quality. The location of each of these points is shown on Figure 3.1. The locations of the DGs and the HVAS’s are consistent with the locations in the EPL and the EIS completed for the site. These locations are however inconsistent with the approved Air Quality Monitoring Program. The DG and HVAS locations will be modified during the 2012 - 2013 reporting period to be consistent with the Air Quality Monitoring Program. The Lynwood Quarry EPL will also be varied to reflect the revised monitoring locations.

Lynwood Quarry Annual Review 2012
DG6 was removed from the revised Air Quality Monitoring Program as approved by the DP&I in April 2012. The results at this location within the site boundary were not deemed representative of air quality conditions at any surrounding privately owned residences or property. Dust deposition monitoring is continuous, with samples being obtained monthly. For each dust gauge location, Insoluble Solids must be reported to EPA in accordance with EPL and Development Consent conditions. Depositional dust results obtained during the report period are detailed within Table 3.2 on the following page. The dust gauge results provided in Table 3.2 include an annual average of the monthly DG results. All dust deposition monitoring locations complied with the 4g/m2/month criteria except for DG3, with an annual average of 6.8 g/m2/month. The samples at DG3 contained bird droppings and/or insects on several occasions which may have increased the insoluble solid content. Also, this DG is located near an external road used by heavy vehicles which potentially impacts the air quality at this location. Baseline data showed elevated results at this location.

Lynwood Quarry Annual Review 2012
Table 3.2 - Monthly Insoluble Solids Dust Deposition Values
Month Dust Gauge 1 (g/m2/month)
Dust Gauge 2 (g/m2/month)
Dust Gauge 3 (g/m2/month)
Dust Gauge 4 (g/m2/month)
Dust Gauge 5 (g/m2/month)
Dust Gauge 7 (g/m2/month)
Dust Gauge 8 (g/m2/month)
July 2011 7.3 4 1.3 3.1 1.4 1 1.9 August 2011 1.1 1.4 0.7 0.5 1.3 0.7 0.3 September 2011 3.8 1.6 10.4 1.8 1.5 0.7 0.4 October 2011 1.6 1 12.9 1.7 1.4 0.9 0.4 November 2011 1.3 0.5 15 0.8 1.5 0.6 0.5 December 2011 3.2 0.4 0.8 3.3 1.5 0.8 3.2 January 2012 2 1.3 0.6 0.5 0.8 1.8 0.4 February 2012 2.7 3.6 13.1 0.8 1.7 2 0.3 March 2012 1.5 1.5 0.4 2.9 0.6 0.5 0.2 April 2012 2.9 0.8 20.4 0.5 1.9 0.6 2.6 May 2012 1.5 1.9 5.1 0.4 0.5 0.3 0.9 June 2012 1.4 4.6 1.4 8.7 1.9 0.7 0.9 Average 2.5 1.9 6.8 2.1 1.3 0.9 1.0
Criteria 4 g/m2/month 4 g/m2/month 4 g/m2/month 4 g/m2/month 4 g/m2/month 4 g/m2/month 4 g/m2/month Notes to Table 3.2:
- Results in bold indicate that sample contaminated with bird droppings and/or insects
Lynwood Quarry Annual Review 2012
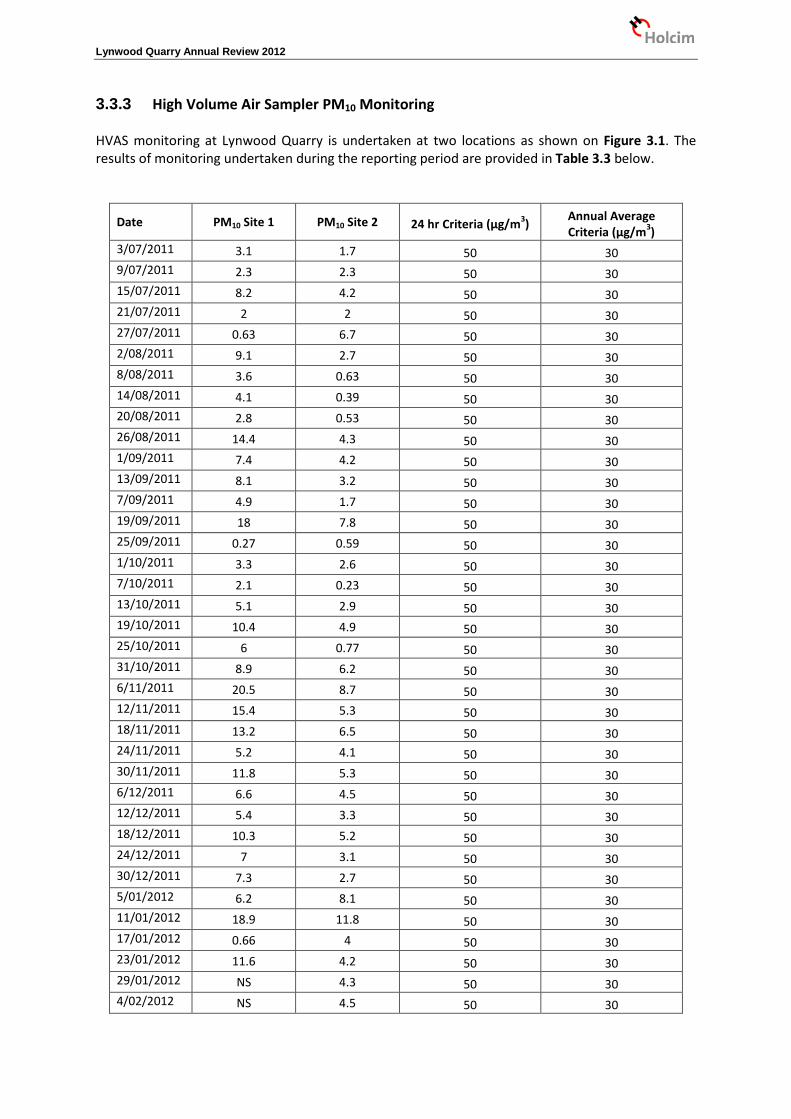
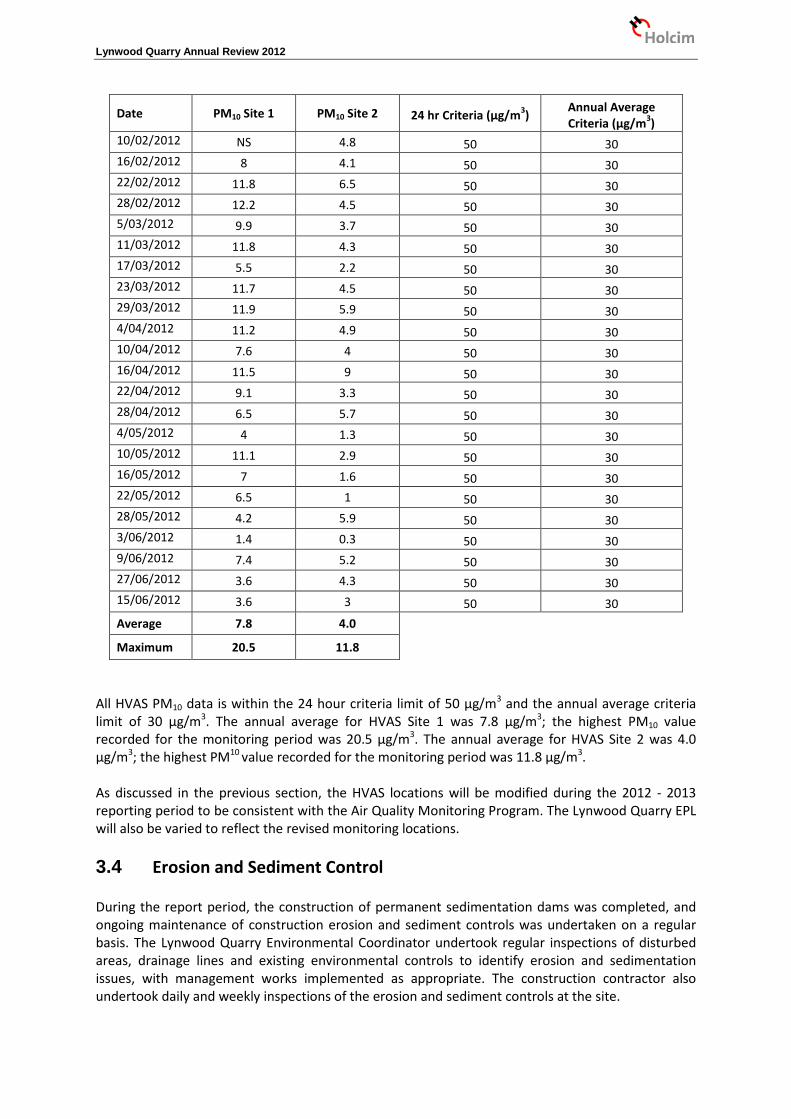
3.3.3 High Volume Air Sampler PM10 Monitoring
HVAS monitoring at Lynwood Quarry is undertaken at two locations as shown on Figure 3.1. The results of monitoring undertaken during the reporting period are provided in Table 3.3 below.
Date PM10 Site 1 PM10 Site 2 24 hr Criteria (µg/m3) Annual Average Criteria (µg/m3)
3/07/2011 3.1 1.7 50 30 9/07/2011 2.3 2.3 50 30 15/07/2011 8.2 4.2 50 30 21/07/2011 2 2 50 30 27/07/2011 0.63 6.7 50 30 2/08/2011 9.1 2.7 50 30 8/08/2011 3.6 0.63 50 30 14/08/2011 4.1 0.39 50 30 20/08/2011 2.8 0.53 50 30 26/08/2011 14.4 4.3 50 30 1/09/2011 7.4 4.2 50 30 13/09/2011 8.1 3.2 50 30 7/09/2011 4.9 1.7 50 30 19/09/2011 18 7.8 50 30 25/09/2011 0.27 0.59 50 30 1/10/2011 3.3 2.6 50 30 7/10/2011 2.1 0.23 50 30 13/10/2011 5.1 2.9 50 30 19/10/2011 10.4 4.9 50 30 25/10/2011 6 0.77 50 30 31/10/2011 8.9 6.2 50 30 6/11/2011 20.5 8.7 50 30 12/11/2011 15.4 5.3 50 30 18/11/2011 13.2 6.5 50 30 24/11/2011 5.2 4.1 50 30 30/11/2011 11.8 5.3 50 30 6/12/2011 6.6 4.5 50 30 12/12/2011 5.4 3.3 50 30 18/12/2011 10.3 5.2 50 30 24/12/2011 7 3.1 50 30 30/12/2011 7.3 2.7 50 30 5/01/2012 6.2 8.1 50 30 11/01/2012 18.9 11.8 50 30 17/01/2012 0.66 4 50 30 23/01/2012 11.6 4.2 50 30 29/01/2012 NS 4.3 50 30 4/02/2012 NS 4.5 50 30
Lynwood Quarry Annual Review 2012
Date PM10 Site 1 PM10 Site 2 24 hr Criteria (µg/m3) Annual Average Criteria (µg/m3)
10/02/2012 NS 4.8 50 30 16/02/2012 8 4.1 50 30 22/02/2012 11.8 6.5 50 30 28/02/2012 12.2 4.5 50 30 5/03/2012 9.9 3.7 50 30 11/03/2012 11.8 4.3 50 30 17/03/2012 5.5 2.2 50 30 23/03/2012 11.7 4.5 50 30 29/03/2012 11.9 5.9 50 30 4/04/2012 11.2 4.9 50 30 10/04/2012 7.6 4 50 30 16/04/2012 11.5 9 50 30 22/04/2012 9.1 3.3 50 30 28/04/2012 6.5 5.7 50 30 4/05/2012 4 1.3 50 30 10/05/2012 11.1 2.9 50 30 16/05/2012 7 1.6 50 30 22/05/2012 6.5 1 50 30 28/05/2012 4.2 5.9 50 30 3/06/2012 1.4 0.3 50 30 9/06/2012 7.4 5.2 50 30 27/06/2012 3.6 4.3 50 30 15/06/2012 3.6 3 50 30 Average 7.8 4.0
Maximum 20.5 11.8
All HVAS PM10 data is within the 24 hour criteria limit of 50 µg/m3 and the annual average criteria limit of 30 µg/m3. The annual average for HVAS Site 1 was 7.8 µg/m3; the highest PM10 value recorded for the monitoring period was 20.5 µg/m3. The annual average for HVAS Site 2 was 4.0 µg/m3; the highest PM10 value recorded for the monitoring period was 11.8 µg/m3. As discussed in the previous section, the HVAS locations will be modified during the 2012 - 2013 reporting period to be consistent with the Air Quality Monitoring Program. The Lynwood Quarry EPL will also be varied to reflect the revised monitoring locations. 3.4 Erosion and Sediment Control
During the report period, the construction of permanent sedimentation dams was completed, and ongoing maintenance of construction erosion and sediment controls was undertaken on a regular basis. The Lynwood Quarry Environmental Coordinator undertook regular inspections of disturbed areas, drainage lines and existing environmental controls to identify erosion and sedimentation issues, with management works implemented as appropriate. The construction contractor also undertook daily and weekly inspections of the erosion and sediment controls at the site.

Lynwood Quarry Annual Review 2012
The erosion and sediment control structures were implemented to minimise the potential for increased sediment load migrating into local water courses during the construction phase of works at Lynwood Quarry and to meet the overall site goal of having a neutral or beneficial effect on water quality. Erosion and Sediment Control works have been undertaken within the disturbed areas identified in Figure 2.1. Examples of erosion and sediment controls implemented at the site include: construction of main sedimentation dams (A, E and F) and smaller sedimentation basins; installation of sedimentation fencing, sand bags and straw bales along drainage lines and
suitable use of rock check dams and grass filter strips where appropriate ; prompt seeding of topsoil stockpiles; reseeding and revegetation of exposed areas not required for future operational or construction
purposes as soon as practicable, including topsoiling and seeding of access road batters and table drains; and
inspection of the site following rain events to ensure adequacy of erosion and sediment controls.
Further details regarding erosion and sediment controls implemented at the site are provided in the Water Management Plan for Lynwood Quarry. 3.5 Water Management
The primary objectives of the Lynwood Quarry water management system are: to minimise off site impacts; to ensure neutral or beneficial impact on water systems, with the site forming part of the Sydney
drinking water catchment; to comply with development consent conditions; to comply with Environment Protection Licence (EPL) conditions; and to maximise water use efficiency. 3.5.1 Surface Water Management Surface water management on the site involves the following: installation and regular maintenance of erosion and sediment controls including sediment
fences, straw bales, sandbags and sediment basins; delineation of areas required to be disturbed, ensuring that disturbance is limited to those areas
required and the minimisation of vegetation disturbance; Appropriate and prompt rehabilitation of disturbed areas no longer required for ongoing
construction or operational purposes; Active management of sediment dam levels via water transfers between dams and drawing
water for use as dust suppression on unsealed surfaces, or irrigation of revegetated areas.
Each of the overburden emplacement areas will be serviced by a sediment dam when construction is completed. Catchment areas, required storage volumes and design criteria for each of these dams are listed in Table 3.4

Lynwood Quarry Annual Review 2012
Table 3.4 - Proposed Sediment Dams and Storage Volumes for Lynwood Quarry in Operations
Dam Catchment Description
Minimum Design Requirements* Selected Design Characteristics
Sediment Storage Zone
(m3)
Settling Zone (m3)
Total Volume
(m3)
Total Design Volume (m3)
Total Design Surface Area
(ha)
A Eastern Tributary Catchment
3370 37250 40620 70000 4.2
B Eastern Overburden Emplacement Area – Southern Region
118 367 485 500 0.05
C Eastern Excess Product Emplacement Area
650 4700 5350 7500 1.0
D Western Excess Product Emplacement Area
700 5100 5800 7800 0.5
E Infrastructure Area 100 5700 5800 6300 0.4
F Lockyersleigh Catchment 925 25,320 26,245 32,000 1.7
Notes to Table 3.4: * In accordance with Blue Book Volume 1 and Volume 2E (Landcom, 2004 & DECC, 2008) requirements Construction of site sedimentation dams A, E and F were completed during the reporting period (refer to Figure 2.1). Construction on Water Supply Dam 1 was also completed during the reporting period. A series of pipelines connecting the sedimentation dams to the supply dam are in the process of being installed. These pipelines will allow transfer of water from sediment basins to the supply dams for future processing water.
Sedimentation Dam A

Lynwood Quarry Annual Review 2012
During the reporting period, Sedimentation Dam F overflowed following the significant rainfall event that saw almost 350mm of rain fall in the months of February and March. In the days leading up to the overflow, site activities at the Lynwood Quarry were significantly disrupted due to wet conditions which culminated in the site being shut down for four days due to safety concerns. EPA issued Holcim with a Notice to provide information regarding the overflow in April. Holcim responded to this Notice in June 2012, and in October 2012 EPA advised that no further regulatory action would be taken. Following the overflow a number of measures have been implemented on site to manage water levels in dams, including: Water transfers between sedimentation and supply dams via pumping; Targeting the dam with highest water level for water cart refilling (for dust suppression and
irrigation activities); Maintaining dam levels at a freeboard of at least 0.5m; and Approval to use flocculent on site has been granted by the EPA to improve water quality.
3.5.2 Water Supply and Demand
Water for site amenities is sourced from rainwater tanks installed in the site compound area. During the reporting period no water had to be sourced from off site due to higher than average rainfall. Potable (drinking) water was provided for site staff using water coolers in the site offices. These are delivered approximately every three weeks. The potable water requirements for the site were calculated during the EIS at 1 ML/year during the initial years of the project, increasing up to approximately 2.25 ML/year at full production. 3.5.3 Site Water Balance
The Water Management Plan for Lynwood Quarry states that the ‘water balance will be reviewed once a year as part of the AEMR for the site’. However, as only the civil phase of construction works have been undertaken and the construction of surface water control structures were not completed until late in the reporting period, it was considered unnecessary to complete a full review of the water balance at this early phase of construction. Reporting of the site water balance will be undertaken in future reporting periods, during the operational phase of works to document water supply and demands. 3.5.4 Water Monitoring Program
3.5.4.1 Review of Surface Water Quality
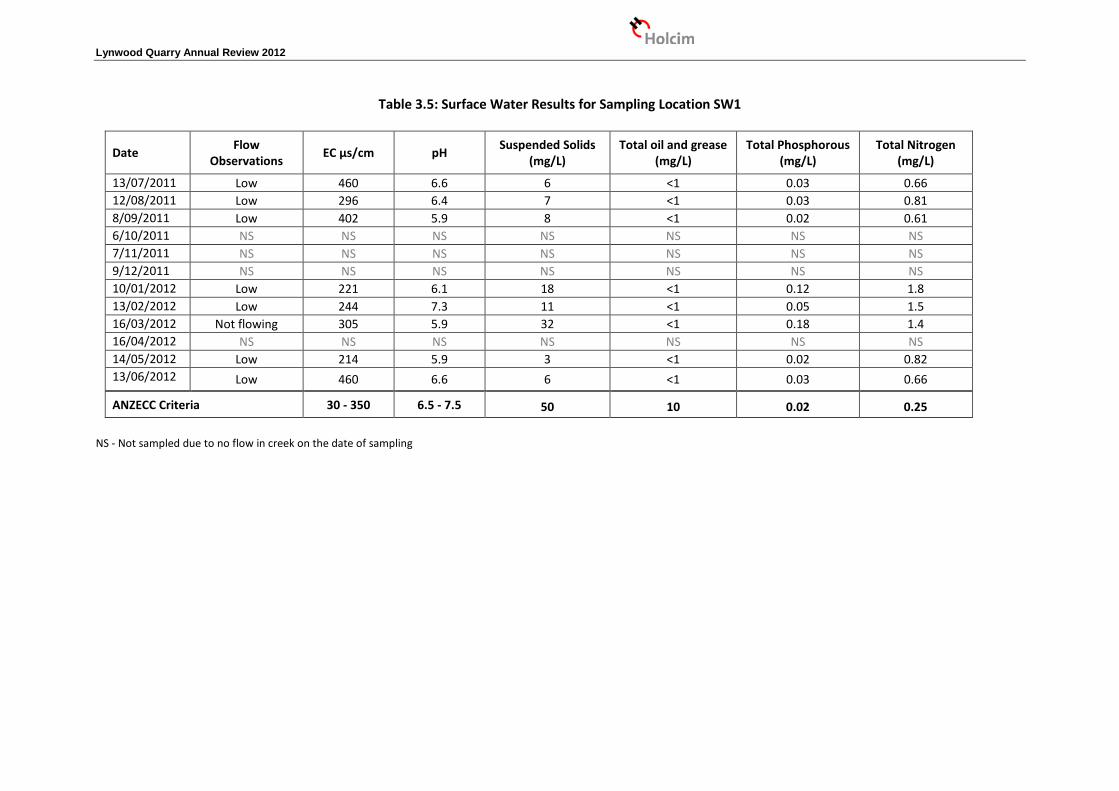
Surface water quality is monitored at four locations on Joarimin Creek (SW3 to SW6) and two locations on Marulan Creek (SW1 and SW2) (refer to Figure 3.1). Other surface water monitoring locations shown on Figure 3.1, SW7 to SW13, are only required to be monitored during periods of active discharge from site sedimentation dams. Surface water sampling was undertaken at six monthly intervals prior to the commencement of construction activities at Lynwood Quarry, however since construction commenced in November 2010 the frequency has increased to monthly. Surface water monitoring results are summarised in Tables 3.5 to 3.10.
Lynwood Quarry Annual Review 2012
Table 3.5: Surface Water Results for Sampling Location SW1
Date Flow Observations EC µs/cm pH Suspended Solids
(mg/L) Total oil and grease
(mg/L) Total Phosphorous
(mg/L) Total Nitrogen
(mg/L)
13/07/2011 Low 460 6.6 6 <1 0.03 0.66 12/08/2011 Low 296 6.4 7 <1 0.03 0.81 8/09/2011 Low 402 5.9 8 <1 0.02 0.61 6/10/2011 NS NS NS NS NS NS NS 7/11/2011 NS NS NS NS NS NS NS 9/12/2011 NS NS NS NS NS NS NS 10/01/2012 Low 221 6.1 18 <1 0.12 1.8 13/02/2012 Low 244 7.3 11 <1 0.05 1.5 16/03/2012 Not flowing 305 5.9 32 <1 0.18 1.4 16/04/2012 NS NS NS NS NS NS NS 14/05/2012 Low 214 5.9 3 <1 0.02 0.82 13/06/2012 Low 460 6.6 6 <1 0.03 0.66
ANZECC Criteria 30 - 350 6.5 - 7.5 50 10 0.02 0.25
NS - Not sampled due to no flow in creek on the date of sampling
Lynwood Quarry Annual Review 2012
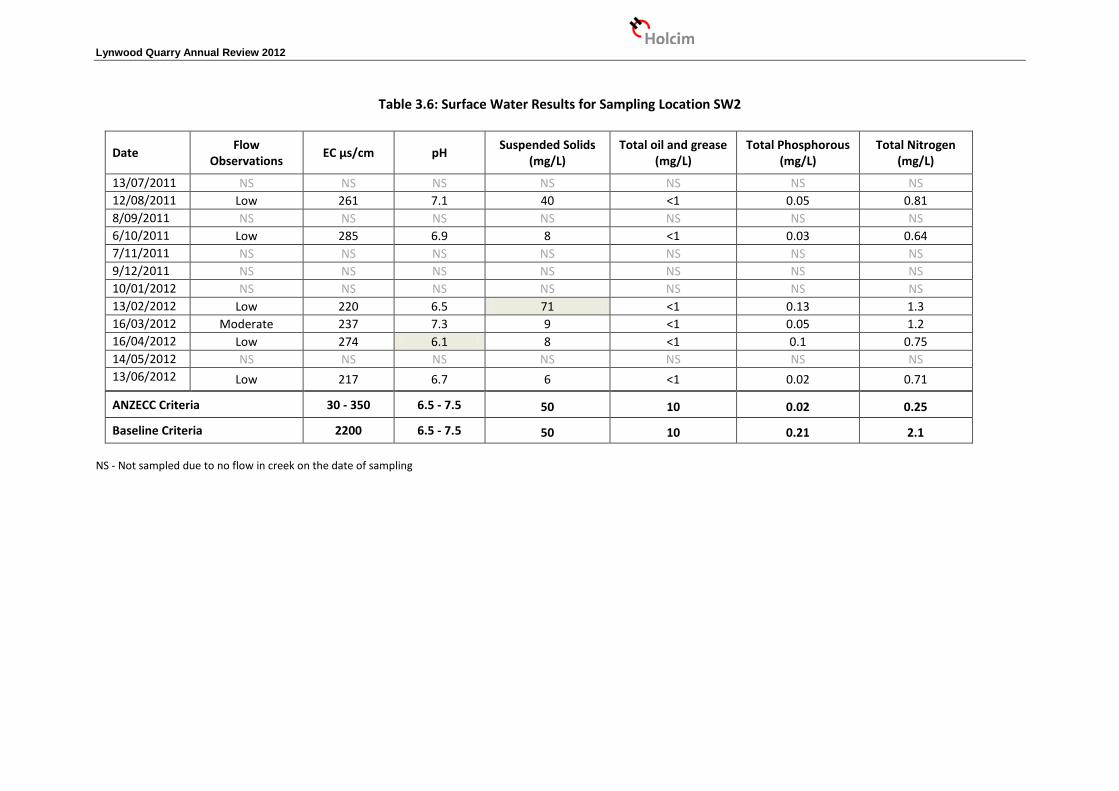
Table 3.6: Surface Water Results for Sampling Location SW2
Date Flow Observations EC µs/cm pH Suspended Solids
(mg/L) Total oil and grease
(mg/L) Total Phosphorous
(mg/L) Total Nitrogen
(mg/L)
13/07/2011 NS NS NS NS NS NS NS 12/08/2011 Low 261 7.1 40 <1 0.05 0.81 8/09/2011 NS NS NS NS NS NS NS 6/10/2011 Low 285 6.9 8 <1 0.03 0.64 7/11/2011 NS NS NS NS NS NS NS 9/12/2011 NS NS NS NS NS NS NS 10/01/2012 NS NS NS NS NS NS NS 13/02/2012 Low 220 6.5 71 <1 0.13 1.3 16/03/2012 Moderate 237 7.3 9 <1 0.05 1.2 16/04/2012 Low 274 6.1 8 <1 0.1 0.75 14/05/2012 NS NS NS NS NS NS NS 13/06/2012 Low 217 6.7 6 <1 0.02 0.71
ANZECC Criteria 30 - 350 6.5 - 7.5 50 10 0.02 0.25
Baseline Criteria 2200 6.5 - 7.5 50 10 0.21 2.1 NS - Not sampled due to no flow in creek on the date of sampling

Lynwood Quarry Annual Review 2012
Table 3.7: Surface Water Results for Sampling Location SW3
Date Flow Observations EC µs/cm pH Suspended Solids
(mg/L) Total oil and grease
(mg/L) Total Phosphorous
(mg/L) Total Nitrogen
(mg/L)
13/07/2011 NS NS NS NS NS NS NS 12/08/2011 Low 875 6.9 120 <1 0.17 2.7 8/09/2011 Low 821 6.9 180 <1 0.22 3.8 6/10/2011 Low 1060 7.3 160 <1 0.2 2.5 7/11/2011 NS NS NS NS NS NS NS 9/12/2011 NS NS NS NS NS NS NS 10/01/2012 NS NS NS NS NS NS NS 13/02/2012 Moderate 272 7 620 <1 0.38 3.6 16/03/2012 Flood 118 7.4 220 <1 0.12 1.4 16/04/2012 Low 133 6.8 460 <1 0.16 1.5 14/05/2012 Low 628 7.3 65 <1 0.09 1.5 13/06/2012 NS NS NS NS NS NS NS
ANZECC Criteria 30 - 350 6.5 - 7.5 50 10 0.02 0.25
NS - Not sampled due to no flow in creek on the date of sampling

Lynwood Quarry Annual Review 2012
Table 3.8: Surface Water Results for Sampling Location SW4
Date Flow Observations EC µs/cm pH Suspended Solids
(mg/L) Total oil and grease
(mg/L) Total Phosphorous
(mg/L) Total Nitrogen
(mg/L)
13/07/2011 NS NS NS NS NS NS NS 12/08/2011 Moderate 1096 6.1 6 <1 0.02 0.51 8/09/2011 Moderate 541 6.7 40 <1 0.08 1.2 6/10/2011 Low 624 6.2 16 <1 0.08 1.1 7/11/2011 Low 1045 6.6 15 <1 0.17 1.1 9/12/2011 Low 622 7.6 40 <1 0.12 1.3 10/01/2012 Low 764 6.7 18 <1 0.05 1 13/02/2012 Low 420 6.7 250 <1 0.22 2.4 16/03/2012 Flood 196 7.5 250 <1 0.11 1.5 16/04/2012 Low 193 5.3 250 <1 0.15 1.5 14/05/2012 Moderate 472 6.7 63 <1 0.06 1.3 13/06/2012 Moderate 342 6.3 19 <1 0.06 1.3
ANZECC Criteria 30 - 350 6.5 - 7.5 50 10 0.02 0.25
Baseline Criteria NA NA NA NA NA NA
NS - Not sampled due to no flow in creek on the date of sampling

Lynwood Quarry Annual Review 2012
Table 3.9: Surface Water Results for Sampling Location SW5
Date Flow Observations EC µs/cm pH Suspended Solids
(mg/L) Total oil and grease
(mg/L) Total Phosphorous
(mg/L) Total Nitrogen
(mg/L)
13/07/2011 Low 865 6.6 7 <1 0.03 0.75 12/08/2011 Moderate 820 6.6 17 <1 0.04 0.79 8/09/2011 Moderate 603 6.6 40 <1 0.07 1.1 6/10/2011 Low 674 6.2 33 <1 0.07 1.1 7/11/2011 Low 725 6.7 9 <1 0.05 0.98 9/12/2011 Moderate 736 7.2 29 <1 0.06 1 10/01/2012 Moderate 766 6.6 25 1 0.07 1.1 13/02/2012 Moderate 448 6.8 810 <1 0.24 2.7 16/03/2012 Flood 208 7.5 140 <1 0.1 1.3 16/04/2012 Moderate 146 6 530 <1 0.13 1.5 14/05/2012 Moderate 335 7.1 97 <1 0.08 1.2 13/06/2012 Moderate 380 6.2 34 <1 0.06 1.3
ANZECC Criteria 30 - 350 6.5 - 7.5 50 10 0.02 0.25
Baseline Criteria 732 6.8 50 10 0.17 2

Lynwood Quarry Annual Review 2012
Table 3.10: Surface Water Results for Sampling Location SW6
Date Flow Observations EC µs/cm pH Suspended Solids
(mg/L) Total oil and grease
(mg/L) Total Phosphorous
(mg/L) Total Nitrogen
(mg/L)
13/07/2011 Low 952 7 2 <1 0.01 0.55 12/08/2011 Moderate 1053 7 4 <1 0.02 0.58 8/09/2011 Moderate 634 7.3 21 <1 0.05 0.91 6/10/2011 Low 1003 6.4 4 <1 0.01 0.58 7/11/2011 Low 1001 7.3 3 <1 0.02 0.76 9/12/2011 Moderate 1102 7.7 6 <1 0.02 0.7 10/01/2012 Low 1146 7.1 3 <1 0.02 0.72 13/02/2012 Moderate 916 7.1 9 <1 0.06 1 16/03/2012 Flood 435 7.2 27 <1 0.07 1.4 16/04/2012 Moderate 2110 6.6 320 <1 0.11 1.3 14/05/2012 Moderate 574 7 28 <1 0.05 1.1 13/06/2012 Moderate 349 6.5 34 <1 0.07 1.2
ANZECC Criteria 30 - 350 6.5 - 7.5 50 10 0.02 0.25
Baseline Criteria 1197 7.1 50 10 0.06 1 NS - Not sampled due to no flow in creek on the date of sampling
Lynwood Quarry Annual Review 2012
Surface water results have been compared against trigger values in the Surface Water Monitoring Program and ANZECC Guidelines criteria. A number of samples were not collected due to minimal or nil flow conditions in Marulan and Joarimin Creeks during the reporting period In general, the monitoring results were within the expected values identified from the analysis of baseline data for the site however, during the period of significant rainfall in February to April there were some elevated results, in particular suspended solids at some locations. The pH levels across all sample locations are typically within the ANZECC criteria values of 6.5 to 7.5, with the exception of some occasions when SW1 and SW4 were slightly below these values. These results are within the expected range through analysis of baseline data and are not considered to be non-compliant results. Electrical Conductivity (EC) at the site is variable across sampling locations and appears to be influenced by low flow conditions in the creeks. The general trend across all monitoring locations was a significant reduction in EC following the large rain event. In the period leading up to this rainfall event in early 2012, the dry conditions potentially caused a build up of salts within the creek beds, which would account for the higher levels. In contrast to all other monitoring locations, EC at SW6 peaked around April when all other locations were at their lowest. SW6 is located off site, downstream of SW5 which did not have an elevated EC. It is possible that there was impact external to site operations that impacted this location. For the first six months of the reporting period, suspended solids results were within baseline and ANZECC criteria limits, with the exception of SW3. The elevated suspended solids levels at SW3 were potentially caused by the high level of vehicle activity in the vicinity of this location and the low flows of the creek. In the second half of the reporting period suspended solids significantly increased at several locations, coinciding with the significant rainfall experienced on site. It is likely that the high volume of rainfall caused the suspended solids to increase due to a ‘flushing’ effect of creek beds being inundated. It is also likely that the intensity of the rainfall caused higher than normal erosion in the overall catchment. Suspended solids levels were back to the baseline range by May when weather conditions had stabilised. Total oil and grease results are well within criteria and often below detection limit – all samples for the reporting period were <1mg/L. There appears to be no distinct trend across all samples in Nitrogen and Phosphorous results for the reporting period. Nitrogen and Phosphorous results appear to be slightly increased during the significant rainfall period, particularly SW3. In all cases, the Nitrogen and Phosphorus levels are higher at the monitoring locations within the site than they are downstream. 3.6 Groundwater
3.6.1 Groundwater Monitoring Program A groundwater monitoring program was established in the Lynwood Quarry project area in 2004 to provide baseline groundwater data, with a network of 11 piezometers installed (refer to Figure 2.1). The piezometers were tested quarterly for standing water level during the reporting period, while water quality parameters were tested in July 2010, January 2011 and April 2011. The groundwater monitoring program requires standing water level to be measured quarterly, while groundwater quality analysis is required to be undertaken every 6 months.

Lynwood Quarry Annual Review 2012
As a result of modifications to the development consent during 2011, the Groundwater Monitoring Program was updated in 2011, and approved by DP&I in April 2012. The groundwater monitoring will be updated to reflect the new plan in the 2012/13 reporting period. Results of groundwater monitoring during 2011/12 are provided in Appendix 2. 3.6.2 Groundwater Levels and Flows Groundwater levels have been monitored in all piezometers on a generally monthly basis since July 2004. Groundwater levels during the Annual Review reporting period were monitored quarterly. The monitoring data has been found to have some anomalies in the data set for bores MP-5, MP-9 and MP-11 which are believed to be a result of monitoring practice. Lynwood Quarry has commenced a process of reviewing the monitoring practice for these bores. The groundwater contours are generally in line with the topography, with the highest water table elevations being recorded in the elevated regions near the northern and southern boundaries of the project area, and the lowest in the central zone close to Joarimin Creek. Groundwater flows southwards or northwards towards Joarimin Creek, then flows eastwards in the same general direction as surface flow. Groundwater level data collected during the reporting period is considered to be baseline data, as no earthworks activities intercepted groundwater during the reporting period. 3.6.3 Groundwater Quality Five different water quality aspects of groundwater have been monitored: electrical conductivity;
pH;
trace elements;
nutrients; and
total petroleum hydrocarbons.
Groundwater quality for the reporting period is detailed in Appendix 2. As no earthworks activities intercepted the groundwater table during the reporting period, the groundwater quality information presented in Appendix 2 is considered to be baseline information. 3.7 Blasting
As part of BMD’s construction program, a series of blasts were carried out from December 2011 to May 2012. BMD contracted Orica to undertake these works which consisted of 20 blasts in total. Prior to undertaking any blasting at the site, the following was implemented, in accordance with DA 128-5-2005: Landowners / occupiers within 2 kilometres of the quarry pit were notified about the blasting
schedule on site; and
Lynwood Quarry Annual Review 2012
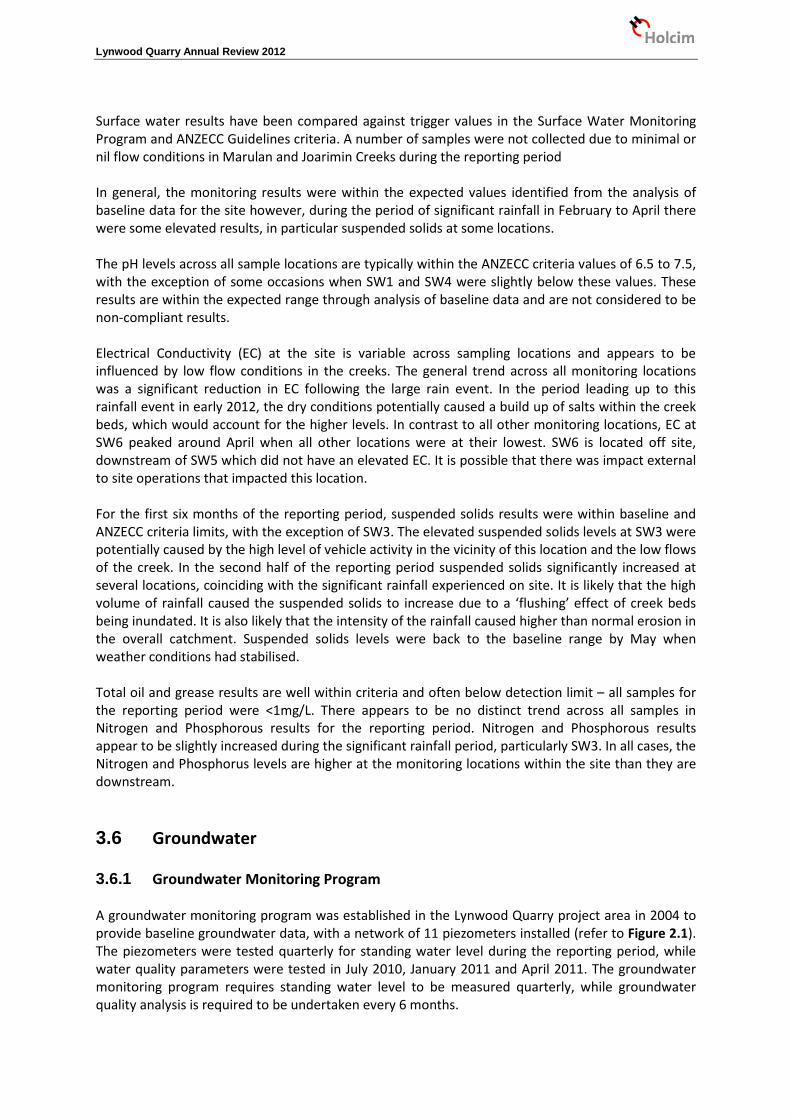
The Lynwood Quarry blasting hotline was in place to enable the public to get up-to-date information on blasting operations at the development.
Table 3.7 – Lynwood Quarry Blast Monitoring
Date Time Monitor B1
(Rail Underpass) Monitor B2
(Gas Pipeline) Monitor B3
(Nearest Resident) mm/s mm/s dB mm/s
13/12/2011 15:40 <0.25 <0.25 <110 <0.25 22/12/2011 10:37 <0.27 <0.27 <110 <0.27 10/01/2012 15:59 <15 <15 <110 <0.5 17/01/2012 15:07 <0.5 <0.5 <110 <0.5 24/01/2012 15:05 0.25 <0.5 No Trigger No Trigger 1/02/2012 15:05 <0.5 <0.5 <110 <0.5 7/02/2012 14:34 0.751 <0.51 <110 <0.51 22/02/2012 15:07 No Trigger Not Accessible <90 <0.2 27/02/2012 15:40 <0.2 <0.2 <110 <0.2 12/03/2012 15:12 <0.51 <0.51 <110 <0.51 24/02/2012 15:10 <0.51 <0.51 <110 <0.27 16/03/2012 15:12 2.04 Not Accessible <70 <2.5 22/03/2012 16:46 <0.5 Not Accessible 98 <0.5 27/03/2012 15:15 <2.5 Not Accessible <105 <2 30/03/2012 15:36 <2.5 Not Accessible <105 <2 10/04/2012 13:58 0.6 <0.8 <105 <0.8 27/04/2012 14:55 <0.8 Not Accessible 101.9 0.2 1/05/2012 14:18 5.77 Not Accessible 108.8 0.18 12/04/1012 14:10 3.43 1.12 < 100 < 0.2 18/05/2012 16:10 < 2 < 2 < 101 < 2 Limits 25 mm/sec 100 mm/sec 115 dB 5 mm/sec The gas pipeline was not monitored during several blasts. BMD made the assessment that the risk of causing ground disturbance due to vehicle bogging outweighed the risk of not monitoring the blasts, and supported this decision by noting that previous peak particle velocity results at this location were well below the 100mm/sec limit. In addition to the gas pipeline not being monitored on several occasions, there was also insufficient blast monitoring information provided for 2 blasts: On 24/01/2012 at the nearest resident (monitoring location B3) the monitoring results were
provided in the form of a “no trigger” statement from Orica, however the statement failed to identify what the trigger level had been set at; and
On 22/02/2012 at the rail underpass, the monitoring results were again provided in the form of a “no trigger” statement from Orica, however the statement failed to identify what the trigger level had been set at.
Excluding the issues outlined above, all monitored blasts undertaken during the reporting period were within the limits specified in the Consent and EPL.

Lynwood Quarry Annual Review 2012
3.8 Operational Noise
3.8.1 Noise Monitoring
Noise monitoring was only undertaken for two quarters during the reporting period, however a program has been put in place to ensure all noise monitoring in undertaken in the following reporting period and thereafter. The monitoring results for the unattended noise monitoring program indicate potential exceedances of the noise affected construction noise criteria for noise monitoring locations N1 to N4. However, it is likely that the Main Southern Railway has some acoustic influence on the noise statistics measured at N1 due to its proximity to the noise monitoring location. Location N3 is potentially affected by noise from the Hume Highway (N3). Locations N1 and N3 are located further from the site than locations N2 and N4. Sites N1 to N4 do not exceed the highly affected noise criteria at any time during the noise monitoring event. As no there were no construction related noise complaints during the time of unattended noise monitoring it is not known if the Project was the cause of the elevated noise levels experienced at the noise monitoring locations. Holcim has committed to implementing best practice work practices outlined in the Interim Construction Noise Guideline (DECCW 2009).Please refer to Appendix 3 for Noise Monitoring Report prepared by Umwelt. 3.9 Visual
Views of the quarry are largely restricted by surrounding topography and vegetation, except for views of the eastern emplacement areas from rural residences to the northeast and filtered views of the quarry and associated works from one residence to the south. The eastern emplacement areas will be constructed during the early years of the project and once established will provide visual screening of the remainder of the project area. Once rehabilitation of these areas is complete, the newly vegetated areas will blend in with the surrounding vegetated topography and will not be significantly visually different. Views of the quarry from major transport corridors will be limited to views from the Main Southern Railway, with these views of short duration, and very limited, distant views from the Hume Highway (as well as views of the new interchange intersection). Potential impacts on night-time scenic quality are not considered to be significant due to the proposed lighting controls and existing light impacted night-time visual character. Selected construction works for the Hume Highway interchange have been undertaken outside of the specified construction hours in accordance with DA 128-5-2005, with written approval from the NSW Roads and Traffic Authority. These works have been undertaken during night-time hours to limit impacts on traffic flow. Therefore there is limited potential for lighting impacts from current activities. Liaison with residents near the relevant work areas was undertaken to address their concerns regarding the hours of construction.

Lynwood Quarry Annual Review 2012
3.10 Threatened Flora
During the reporting period two threatened flora species / communities were identified on site: Hoary Sunray Leucochrysum Albicans var. Tricolor (Hoary Sunray); and White Box, Yellow Box, Blakely’s Red Gum Grassy Woodland and Derived Native Grassland
Critically Endangered Ecological Community (Box Gum Woodland CEEC). Holcim subsequently lodged a referral with the Department of Sustainability, Environment, Water, Populations and Communities in September 2012 under the Environment Protection and Biodiversity Conservation Act 1999 (EPBC Act). 3.10.1 Hoary Sunray The Hoary Sunray is listed as an endangered species under the EPBC Act. Following its identification within the project area including the Hume Highway interchange, works with the potential to impact the species were ceased and Holcim commissioned Umwelt (Australia) Pty Limited (Umwelt) to undertake an inspection and assessment. 3.10.2 Box Gum Woodland CEEC At the time of the original Ecological Assessment (Umwelt 2005), the Box Gum Woodland CEEC was not listed under the EPBC Act. The Box Gum Woodland CEEC was listed under the EPBC Act during May 2006. After a field survey and subsequent analysis, Box Gum Woodland CEEC was identified as being present within the Project Area. 3.11 Threatened Fauna
Five threatened fauna species were recorded during surveys in the Lynwood Quarry project area for the EIS (Umwelt, 2005). The species recorded were the squirrel glider, speckled warbler, eastern bent-wing bat, eastern freetail bat and eastern false pipistrelle. The EIS concluded that the impact of the project on these species in accordance with Section 5A of the EP&A Act would not be significant. One threatened fauna species, the brown treecreeper (listed as vulnerable under the Threatened Species Conservation Act 1995), was recorded within the project area during field surveys for the Environmental Assessment (Umwelt, 2010). No endangered fauna populations were recorded or are expected to occur within the Lynwood Quarry project area. Additional Annual Review reporting requirements are identified in the Rehabilitation and Landscape Management Plan (RLMP) for the site. The following reporting requirements have not yet been triggered but will be triggered prior to the commencement of quarrying operations and reported in future annual reviews: • riparian area vegetation monitoring; and
• nest box monitoring. Lynwood Quarry has programmed the installation of nest boxes and commencement of riparian area vegetation monitoring, along with other ecological monitoring, to occur in the next reporting period.
Lynwood Quarry Annual Review 2012
3.12 Aboriginal Heritage
3.12.1 Annual Aboriginal Heritage Monitoring In November 2011, the Annual Aboriginal Heritage Monitoring was undertaken in accordance with the Lynwood Quarry Aboriginal Heritage Management Plan. The purpose of the monitoring was to ensure compliance with AHIP 1100264 and the AHMP. In general it was found that the majority of the sites being managed in-situ within the Holcim project boundary and outside of its approved disturbance boundary were being managed in compliance with the AHMP and AHIP #1100264. There were some exceptions, however since the November 2011 monitoring these issues have been rectified: The Cultural Heritage Management Zone was not implemented at the time of the monitoring;
however in December 2011 the area was fenced in accordance with the AHMP; During monitoring it was observed that MRN15 (#51-6-0256) and MRN PAD1 (#51-6-0687) had
been impacted by minor vehicle movements and a topsoil stockpile has also been placed in the MRN15 site area. This was notified to OEH in January 2012 and fencing and signage delineating these areas was immediately installed. No impact to Aboriginal objects was observed in either MRN15 or MRN PAD1 and therefore it is assessed that there is not a breach of Section 86 (1) or 86 (2) of the NPW Act (1974).
At the time of the monitoring the Joarimin Creek Riparian Zone (which contains 20 Aboriginal
heritage sites) was not permanently fenced. The area was demarcated by closely spaced star pickets, high visibility flagging and signage. Permanent fencing was installed around this zone in January 2012.
Three additional sites were located during the monitoring – one isolated find and two artefact scatters. Site cards have been prepared for these new sites and they will be monitored again during the next reporting period. 3.12.2 Reportable Incidents During the reporting period there were three separate incidents that were reported to Authorities where conditions of the AHIP #1100264 and AHMP had been breached. The first incident related to the installation of a water pipeline from Dam A during site
construction works. The construction of the largely above ground pipeline involved some vegetation clearing and earthworks (e.g. topsoil removal and placement of fill material). The construction of this pipeline was identified by Holcim as a potential incident as part of the pipeline was found to be located outside of the approved disturbance footprint. All works in this area were immediately ceased and the area was delineated with high visibility flagging and signage;

Lynwood Quarry Annual Review 2012
The second incident involved a temporary access track being near the interchange construction zone. This was identified by Holcim as a potential incident as part of the track was constructed outside the maximum disturbance boundary. All works in this area were immediately ceased and the area was delineated with high visibility flagging and signage. In addition to this all site personnel were re-inducted to enforce site responsibilities;
The most recent of these incidents was the minor impact to MRN15 (#51-6-0256) and MRN
PAD1 (#51-6-0687) which was reported to OEH as a technical breach, as no impact to Aboriginal objects was observed in this area. Following the identification of this issue, the area was fenced off and signage put in place. The completion of the access road and guardrails in this location has since created a permanent barrier to this area.
3.13 Historical Heritage No further historical heritage works have been undertaken during the reporting period. The final excavation activities were completed in June 2011, at the site of the Old Marulan Township on the Hume Highway in accordance with a S65A application under the Heritage Act (2009/S65A/13). The final excavation report is due to be submitted in September 2013, as approved by OEH in September 2012. Further details regarding the Historical Heritage of the site are contained within the EIS, SEE and EA for the Lynwood Quarry. 3.14 Bushfire Lynwood Quarry infrastructure areas are protected from bushfire by the provision of fire hydrants, extinguishers and hose reels in appropriate locations on site and are maintained in accordance with OH&S guidelines. The construction contractor operates at least two water carts, which will be used for fire fighting as required. Firebreaks will be maintained and constructed as required and will not be established within habitat management areas. 3.15 Public Safety
The following measures have been implemented at Lynwood Quarry to minimise the risks to the public and ensure public safety: the site is fenced;
access points to the site are gated, and are locked after hours; access points to the site have security signs and warning signs;
a “gate-keeper” is employed to man the gate during construction hours to direct site visitors and
ensure site personnel are made aware of visitors; all visitors to the site must sign in and out at either the construction contractors’ office or at the
Lynwood Quarry Holcim Office; the site is under video surveillance;

Lynwood Quarry Annual Review 2012
all vehicles entering the site from Wilson Drive entrance are stopped at the gate and are required to call or radio to be escorted onto the site; and
site access roads used by heavy vehicles have restricted access.
3.16 Waste Management
Waste management at Lynwood Quarry during the reporting period was undertaken in accordance with the BMD Lynwood Quarry Construction Waste Management Plan. The Plan outlines the procedures for the monitoring, minimisation, classification and disposal of waste during construction activities. The Waste Management Plan also outlines the actions and responsibilities applicable to all waste management processes conducted onsite. Waste details are also recorded onsite through the implementation of a waste register, which includes:
the classification of waste; how and where the waste is to be reused / recycled, stockpiled and disposed of; the receptacles that will be used for storing the reused, recycled, stockpiled or disposed of
material; and the method of transport, the company, the storage methods and the method of treatment for
all wastes handled on the site.
3.16.1 Sewage Treatment and Disposal
The Lynwood Quarry sewage treatment system consists of onsite sewage storage tanks. The tanks are pumped out weekly by a licensed contractor for disposal at an appropriately licensed waste water treatment facility. 3.16.2 Waste Disposal and Recycling
Waste is placed in general waste bins, the bins are collected on a regular basis by an authorised waste disposal contractor. Waste is recycled and reused where appropriate, in accordance with Conditions 53 and 54 of Schedule 3 of the Lynwood Quarry development consent. Recyclables from the offices are separated and taken to an appropriately licensed waste facility for processing. 3.17 Hazardous Material Management
Hazardous materials utilised during the construction phase at Lynwood Quarry are utilised in accordance with specific environmental management sub-plans developed by the construction contractor. Hydrocarbon materials for construction activities are contained within a Hazardous Materials (HAZMAT) container held onsite by the construction contractor. The container also holds the relevant MSDS for each material. Diesel is stored in a fuel trailer which also contains a spill kit for spillages that may occur. No spills were recorded during the Annual Review period.

Lynwood Quarry Annual Review 2012
Hazardous Materials utilised on site were managed in accordance with the relevant regulatory requirements during the report period. Maintenance on construction vehicles is generally undertaken at the construction contractors’ workshop which is located offsite. 3.18 Feral Animal Control Feral fauna species will be visually monitored during the Lynwood Quarry Environmental Officer’s regular inspections and during fauna surveys undertaken once every three years. Measures to control feral species will be implemented as required and in consultation with the Rural Lands Protection Board, where necessary. No feral animal control works activities were required to be undertaken during the reporting period. 3.19 Weed Control Areas not subject to quarrying activities will be subject to six monthly weed assessments by the Environmental Officer. Outbreaks of weeds, in particular noxious weeds as defined by the Noxious Weeds Act 1993, will be controlled using suitable control measures such as spraying, slashing or manual removal. During the report period, spraying for tussock grass was undertaken.
Lynwood Quarry Annual Review 2012
4.0 Community Relations
Lynwood Quarry has established a Community Consultative Committee (CCC) in accordance with Conditions 9 and 10 of Schedule 5 of DA 128-5-2005. During the reporting period, two CCC meetings were held on 10 October 2011 and 12 March 2012. The main focus of the meetings was: • an update on construction progress;
• a review of environmental performance; and
• an update regarding the ongoing community consultation process for the site.
4.1 Community Complaints
Nine community complaints were received by Lynwood Quarry during the report period. The details of the complaints are provided in Table 4.1, below.
Table 4.1: Community Complaint Details
Date Nature of Complaint Actions Taken
25/07/2011
Resident’s property impacted by Hume Highway interchange construction. The fence had been knocked down along the highway border, and materials had been dumped within the property boundary.
Inspect property to assess damage and contact BMD BMD ordered to clean up any construction rubbish from
property, and RTA contacted to remove waste stockpile BMD put up temporary fencing in interim to ensure no
further disturbance BMD replaced fence
5/09/2011
A plane flew very low over complainant’s property, about 8 times, disturbing breeding parrots. Complainant assumed it was related to Lynwood development
It was confirmed that no aerial photography had taken place at Lynwood property
Resident was advised that plane was not part of Lynwood project
15/09/2011
Resident advised that water in Joarimin creek was turbid and has impacted complainants dam resulting in a fish kill. Complainant’s dog ate one of the dead fish and became sick.
Site supervisor visited resident to investigate It was noted during the visit that the area had recently
been sprayed with pesticides Follow up determined that the residents pond was not
actually within quarry catchment and therefore turbidity was most likely due to run off from rail easement
Resident contacted to advise outcome
10/10/2011
The Mayor raised the issue of damage to Wilson Drive due to the increased construction traffic. Holcim committed to maintaining the road in a suitable condition during construction until the interchange access is complete.
Council was contacted to approve road repairs Council gave permission for repairs to progress on
20/10/2011 BMD were directed to fix potholes and damage to
Wilson Dr. BMD filled in potholes and Council patched with bitumen
10/10/2011
Complaint relating to the entrance to Jerrara and South Marulan Roads from the freeway. He advised that it was confusing for traffic entering and exiting the freeway and requested line markings be painted.
BMD were directed to paint line markings on the section of road,
Works were scheduled the following week - 21/11/2011
9/01/2012
Complaint relating to entrance to Cemetery. Resident advised that the area is untidy and requires a suitable, all weather access for a hearse.
Contacted resident to discuss concerns BMD install numerous "public parking" signs and clear
space in front of cemetery

Lynwood Quarry Annual Review 2012
Date Nature of Complaint Actions Taken
27/02/2012
Follow up complaint relating to BMD impacting Cemetery access. BMD were uncooperative and took weeks to implement mitigation measures directed by Holcim following first complaint.
Attempted to contact resident several times via phone to discuss - no answer
Cemetery access inspected - BMD signage for public parking in place
Letter sent to resident to acknowledge complaint, explain measures that have been put in place, and apologise for the temporary inconvenience
18/04/2012
Vegetation buffer along the western boundary of the quarry is not growing at a sufficient rate. Concerned that buffer will not be high enough to mitigate visual amenity by the time quarry is operational.
Resident was contacted to discuss concerns Commitment made to engage revegetation contractor Request for quotation sent to 6 local revegetation
contractors Successful applicant chosen. Revegetation scheduled to
take place in Autumn 2013
21/05/2012
Resident called to notify that a blast (i.e. vibration and noise) was felt at approximately 11.50am coming from the quarry. No blasting had taken place at the quarry.
BMD confirmed that no blasting took place Resident was advised there was no blasting at the
quarry
4.2 Community Donations The following donations were made to the local community during the reporting period. Contributions from Holcim’s nearby Johnnifelds Quarry have been included in this summary, as the Johnnifelds Quarry is also located in Marulan and therefore targets the same community:
• $500 contribution to PCYC program aimed at preventing youth crime; • $500 donation to Marulan Christmas Family Fun (Johnnifelds) • $1000 donation to the Marulan Football Club (Johnnifelds) • $500 donation to the Goulburn North Family Fun and Fireworks Night (Johnnifelds)
Lynwood Quarry Annual Review 2012
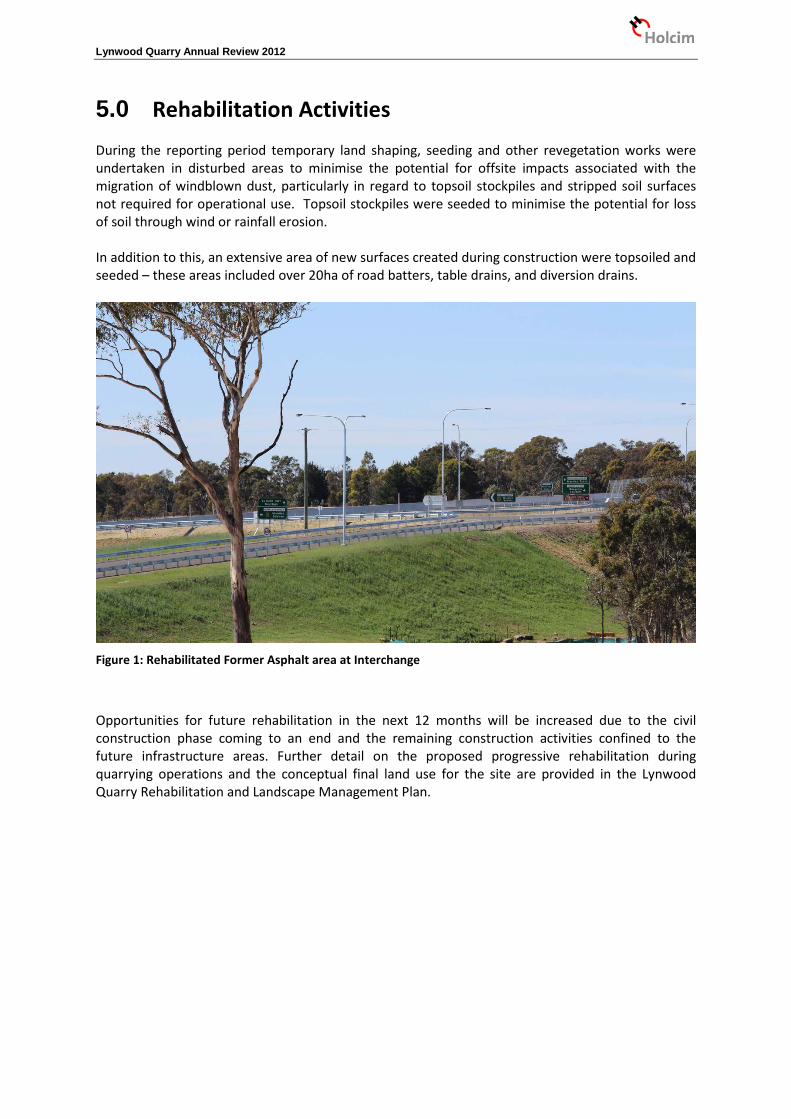
5.0 Rehabilitation Activities During the reporting period temporary land shaping, seeding and other revegetation works were undertaken in disturbed areas to minimise the potential for offsite impacts associated with the migration of windblown dust, particularly in regard to topsoil stockpiles and stripped soil surfaces not required for operational use. Topsoil stockpiles were seeded to minimise the potential for loss of soil through wind or rainfall erosion. In addition to this, an extensive area of new surfaces created during construction were topsoiled and seeded – these areas included over 20ha of road batters, table drains, and diversion drains.
Figure 1: Rehabilitated Former Asphalt area at Interchange
Opportunities for future rehabilitation in the next 12 months will be increased due to the civil construction phase coming to an end and the remaining construction activities confined to the future infrastructure areas. Further detail on the proposed progressive rehabilitation during quarrying operations and the conceptual final land use for the site are provided in the Lynwood Quarry Rehabilitation and Landscape Management Plan.

Lynwood Quarry Annual Review 2012
6.0 Activities Proposed for 2012/13 Annual Review Period The following construction works are programmed for the next Annual Review period: • Completion of all civil works including:
Hume Highway Interchange; Site Access Road; Rail siding; and Electrical infrastructure.
• Commencement of processing plant and associated equipment, including:
Conveyor assemblies; Concrete foundation works; Secondary processing plant; and Installation of primary crusher.
6.1 Environmental Performance Initiatives 2011-2012
Aspect specific environmental performance initiatives for the next Annual Review period are included within the specific aspect sections detailed in Section 3.0. Examples of environmental management actions to be undertaken during the 2011-2012 Annual Review period include: • Further habitat enhancement activities including installation of nesting boxes and fencing of
Habitat Management Area;
• Revegetation activities along the western boundary of the site to improve visual amenity for residences to the west of the boundary;
• Implementation of the revised environmental monitoring program for the site; and
• continued implementation of the requirements and commitments from the Lynwood
Environmental Monitoring Plans and Programs.

Lynwood Quarry Annual Review 2012
7.0 References Umwelt (Australia) Pty Limited (Umwelt) 2005. Environmental Impact Statement Readymix Holdings Pty Limited. Proposed Lynwood Quarry, Marulan, Prepared on behalf of Readymix Holdings Pty Limited. Umwelt 2009. Statement of Environmental Effects. Proposed Minor Modifications to Lynwood Quarry Marulan, Prepared for CEMEX. Umwelt 2010. Environmental Assessment. Proposed Modification to Lynwood Quarry Marulan, Prepared for Holcim (Australia) Pty Limited.

Lynwood Quarry Annual Review 2012
Appendix 1 – Wind Rose

Lynwood Quarry Annual Review 2012
Appendix 2 – Groundwater Monitoring Results
Date Groundwater Monitoring Bore Depth (m) 1 2 4 5 6 7 8 9 10 11
13/07/2011 2.42 17.38 19.42 22.14 16 8 9.84 22.12 6.3 11.89 7/10/2011 2.36 17.45 19.44 22.06 16.08 8.04 NS 21.97 5.96 11.71 10/01/2012 2.41 17.41 19.62 22.5 16.13 8.14 NS 21.35 5.93 11.92 17/04/2012 2.19 17.18 19.05 22.01 15.9 7.89 NS NS 5.55 10.81
Date Bore Bicarbonate
as CaCO3 (mg/L)
Carbonate as CaCO3
(mg/L)
Hydrox (mg/L)
Alkalinity as CaCO3
(mg/L)
Ammonia as N
(mg/L N)
Chloride (mg/L)
7/10/2011 Bore 1 171 <0.1 <0.1 171 <0.1 220 7/10/2011 Bore 2 52.7 <0.1 <0.1 53 <0.1 160 7/10/2011 Bore 4 129 <0.1 <0.1 129 <0.1 78 7/10/2011 Bore 5 249 <0.1 <0.1 249 0.7 220 7/10/2011 Bore 6 245 <0.1 <0.1 245 <0.1 1400 7/10/2011 Bore 7 314 <0.1 <0.1 314 <0.1 1800 7/10/2011 Bore 9 156 <0.1 <0.1 156 0.3 870 7/10/2011 Bore 10 310 <0.1 <0.1 310 <0.1 2300 7/10/2011 Bore 11 304 <0.1 <0.1 304 0.1 36 17/04/2012 Bore 1 173 <0.1 <0.1 173 <0.1 230 17/04/2012 Bore 2 33.2 <0.1 <0.1 33 <0.1 110 17/04/2012 Bore 4 133 <0.1 <0.1 133 <0.1 72 17/04/2012 Bore 5 247 <0.1 <0.1 247 0.4 230 17/04/2012 Bore 6 249 <0.1 <0.1 249 <0.1 1300 17/04/2012 Bore 7 321 <0.1 <0.1 321 <0.1 1800 17/04/2012 Bore 10 322 <0.1 <0.1 322 <0.1 2200 17/04/2012 Bore 11 309 <0.1 <0.1 309 <0.1 34
Date Bore Benzene (μg/L)
Ethylbenzene (μg/L)
M & p xylene (μg/L)
O – Xylene (μg/L)
Toluene (μg/L)
7/10/2011 Bore 1 <1 <1 <2 <1 <1 7/10/2011 Bore 2 <1 <1 <2 <1 <1 7/10/2011 Bore 4 <1 <1 <2 <1 <1 7/10/2011 Bore 5 <1 <1 <2 <1 <1 7/10/2011 Bore 6 <1 <1 <2 <1 <1 7/10/2011 Bore 7 <1 <1 <2 <1 <1 7/10/2011 Bore 9 <1 <1 <2 <1 <1 7/10/2011 Bore 10 <1 <1 <2 <1 <1 7/10/2011 Bore 11 <1 <1 <2 <1 <1 17/04/2012 Bore 1 <1 <1 <2 <1 <1 17/04/2012 Bore 2 <1 <1 <2 <1 <1 17/04/2012 Bore 4 <1 <1 <2 <1 <1 17/04/2012 Bore 5 <1 <1 <2 <1 <1 17/04/2012 Bore 6 <1 <1 <2 <1 <1 17/04/2012 Bore 7 <1 <1 <2 <1 <1 17/04/2012 Bore 10 <1 <1 <2 <1 <1 17/04/2012 Bore 11 <1 <1 <2 <1 <1

Lynwood Quarry Annual Review 2012
Groundwater Monitoring Results
Bore Date Al Sb Ba Be B Cd Ca Cr Co Cu Fe Pb Mg Mn Hg Mo Ni K Se Ag Na Zn
μg/L μg/L μg/L μg/L mg/L μg/L mg/L μg/L μg/L μg/L mg/L μg/L mg/L μg/L μg/L μg/L μg/L mg/L μg/L μg/L mg/L μg/L Bore 1 7/10/2011 <5 <3 160 <0.1 <0.01 0.07 34 <2 <0.2 1 0.61 <0.05 30 570 <0.1 <0.5 1 4.1 <1 <1 110 35 Bore 2 7/10/2011 <5 <3 81 <0.1 0.02 0.15 14 <2 5.9 1.4 4.6 <0.05 17 1800 <0.1 <0.5 4 5.2 <1 <1 62 170 Bore 4 7/10/2011 <5 <3 85 0.5 0.01 0.09 17 <2 0.5 1.1 0.1 <0.05 10 360 <0.1 1.2 1 3.1 <1 <1 60 37 Bore 5 7/10/2011 <5 <3 190 <0.1 0.02 <0.05 88 2 1.9 0.6 1.7 <0.05 17 1100 2.6 4.7 3 11 <1 <1 87 32 Bore 6 7/10/2011 <5 <3 17 <0.1 0.05 0.11 370 2 0.5 2.3 <0.01 <0.05 51 620 0.4 4 10 4.2 <1 <1 380 35 Bore 7 7/10/2011 <5 <3 370 0.1 0.03 0.19 440 3 1 4.6 <0.01 <0.05 150 3100 0.2 0.7 15 7.3 <1 <1 410 41 Bore 9 7/10/2011 <5 <3 120 <0.1 0.02 0.05 86 3 1.2 0.9 1.9 <0.05 100 2600 0.3 16 3 15 <1 <1 280 38 Bore 10 7/10/2011 <5 <3 310 <0.1 0.01 0.09 300 4 2 4.3 <0.01 <0.05 220 1700 <0.1 4.7 12 12 <1 <1 590 31 Bore 11 7/10/2011 <5 <3 480 <0.1 0.01 <0.05 88 3 <0.2 1.5 <0.01 <0.05 6.6 1000 <0.1 3 3 3.2 <1 <1 30 26 Bore 1 17/04/2012 <5 <3 200 0.2 <0.01 <0.05 39 3 0.3 <0.5 1.9 <0.05 36 660 <0.1 <0.5 1 4 <0.01 <1 130 14 Bore 2 17/04/2012 <5 <3 99 0.2 0.02 0.13 9.4 <2 5.2 1.5 0.01 <0.05 13 1200 <0.1 <0.5 4 3.6 <0.01 <1 58 160 Bore 4 17/04/2012 <5 <3 110 0.7 0.01 <0.05 17 <2 0.5 0.7 0.09 <0.05 12 400 <0.1 <0.5 1 2.5 <0.01 <1 76 24 Bore 5 17/04/2012 <5 <3 270 <0.1 0.02 <0.05 100 4 3.2 <0.5 2.5 <0.05 20 1400 1.3 1.5 3 9.7 <0.01 <1 110 20 Bore 6 17/04/2012 <5 <3 20 0.1 0.05 <0.05 410 14 0.8 0.9 1.2 <0.05 58 750 0.3 2.4 9 3.8 <0.01 <1 420 12 Bore 7 17/04/2012 <5 <3 450 0.2 0.02 0.11 490 19 1.3 1.4 0.01 <0.05 170 3600 0.1 <0.5 13 6.5 <0.01 <1 450 43 Bore 10 17/04/2012 <5 <3 400 <0.1 <0.01 0.14 340 <2 3.7 1.8 0.54 <0.05 260 1900 0.2 3.5 12 13 <0.01 <1 700 74 Bore 11 17/04/2012 <5 <3 610 <0.1 <0.01 <0.05 100 5 0.5 0.7 0.04 <0.05 7.8 1000 0.1 2.4 2 2.7 <0.01 <1 39 12
Date Bore Electrical
Conductivity (μS/cm)
pH Sulphate (mg/L)
Total Dissolved Solids (mg/L)
Total Kjeldahl Nitrogen (mg/L N)
Total Oxidised Nitrogen (mg/L N)
Total Phosphorus
(mg/L P) Total Anions Total Cations
(mg/L) Total Cyanide
(mg/L) Total Nitrogen
(mg/L N)
7/10/2011 Bore 1 1110 6.1 23 590 0.2 <0.05 0.22 10.3 9.09 NS 0.29 7/10/2011 Bore 2 678 5.7 12 400 0.1 0.05 0.02 5.86 5.18 NS 0.17 7/10/2011 Bore 4 535 5.9 7.6 320 0.1 <0.05 0.14 4.96 4.37 NS 0.18 7/10/2011 Bore 5 1218 6.0 <0.4 660 1.2 <0.05 0.32 11.0 10.0 NS 1.3 7/10/2011 Bore 6 4640 6.0 22 2700 0.3 <0.05 0.11 44.7 39.3 NS 0.31 7/10/2011 Bore 7 6020 6.1 25 3500 0.2 <0.05 0.16 57.5 52.3 NS 0.29 7/10/2011 Bore 9 3050 6.0 7.0 1700 0.7 0.07 0.16 27.9 25.2 NS 0.74 7/10/2011 Bore 10 7240 6.2 27 4000 0.2 <0.05 0.02 71.6 59.0 NS 0.29 7/10/2011 Bore 11 6780 6.2 11 440 0.3 <0.05 0.15 7.45 6.33 NS 0.37 17/04/2012 Bore 1 1079 6.6 23 640 0.0 <0.05 0.12 NS NS <0.004 0.08 17/04/2012 Bore 2 459 5.9 11 310 0.3 0.07 0.05 NS NS <0.004 0.35 17/04/2012 Bore 4 520 6.5 7.6 310 0.1 <0.05 0.05 NS NS <0.004 0.13 17/04/2012 Bore 5 1169 6.8 0.5 740 0.9 <0.05 0.18 NS NS <0.004 0.98 17/04/2012 Bore 6 4446 7.1 22 2900 0.2 <0.05 0.03 NS NS <0.004 0.29 17/04/2012 Bore 7 5760 6.8 24 4000 0.1 <0.05 0.02 NS NS <0.004 0.15 17/04/2012 Bore 10 6919 6.9 26 4400 0.1 <0.05 0.02 NS NS <0.004 0.16 17/04/2012 Bore 11 666 7.3 8.6 440 0.1 <0.05 0.04 NS NS <0.004 0.16

Lynwood Quarry Annual Review 2012
Appendix 3 – Noise Monitoring Report