Embed Size (px)
Citation preview

An in vitro Feasibility Study of Early Wound
Infection Diagnosis and Bacterial Strain
Differentiation using pH Change
Master Thesis
By
Laura Maria Bücheler
2015

2
This thesis is the result of the author’s original research. It has been composed by the
author and has not been previously submitted for examination which has led to the
award of a degree.
The copyright of this thesis belongs to the author under the terms of the United
Kingdom Copyright Acts as qualified by University of Strathclyde Regulation 3.50. Due
acknowledgement must always be made of the use of any material contained in, or
derived from, this thesis.
Name: Laura Buecheler
Signed:
Date:
3
Abstract
About 25% of all diabetics have foot ulcers at one point in their life and this is also the leading
cause of non-traumatic amputations in developing countries. Bacterial infection of a normally
healing wound is suggested to induce delayed wound healing and development to a chronic
wound. The pH in chronic wounds is alkaline which inhibits the immune response, reduces
the efficiency of antibiotics and antiseptics, and also inhibits tissue enzyme response. This
study investigates if there is a link between pH and bacterial colonisation in vitro. If
successful, this could enable early bacterial infection detection and therefore improve
patient treatment, healing rates and reduce antibiotic misuse. Furthermore, the disposable
sensor technology used in this thesis can be integrated into wound dressings and used by
itself or in a multi-array-sensor for continuous wound parameter monitoring.
25 hour growth curve experiments were conducted in LB media and FBS for S. aureus and S.
epidermidis. Furthermore a long term growth experiment of both bacteria in FBS was
implemented. In all three experiments, a significant 2 pH level drop of the media for S. aureus
inoculated cultures could be identified while the pH drop for S. epidermidis was not that
drastic. For both bacteria, however, the pH increased to higher alkaline values when the
bacteria settles into stationary growth phase. More research will have to be conducted to
verify these results in vivo and with different bacterial strains. It is suggested that S. aureus
uses mild acid stimulation to alter its gene expression after the pH drop, which in turn
changes its metabolism to produce alkaline end products.

4
Acknowledgments
I wanted to thank Stephen Milne and Andrew Ward for their support at every point of my
project. I couldn’t have done everything that I did in this short amount of time without your
help and excellent guidance.
I also wanted to thank the other academic staff in the department that helped me out with
material and advice whenever I didn’t know where to turn to.
I would also like to acknowledge the support of my family and friends and the patients they
had with me while I was writing my final year project thesis.

5
Table of Contents
Table of Figures .........................................................................................................................8
1. Introduction ......................................................................................................................9
2. Background .................................................................................................................... 11
2.1 Clinical Microbiology of Chronic Wounds .............................................................. 11
2.1.a Normal Wound Healing ................................................................................. 11
2.1.b Types and Development of Chronic Wounds ................................................ 13
2.1.c Bacteria in Chronic Wounds ........................................................................... 15
2.1.d Current Bacteria Detection Techniques ......................................................... 18
2.1.e The Burden of Chronic Wounds ..................................................................... 19
2.2 Microbiology Theory .............................................................................................. 21
2.2.a Bacterial Growth ............................................................................................ 21
2.2.b Gram staining ................................................................................................ 23
2.2.d S. aureus and S. epidermidis .......................................................................... 24
2.2.e Biofilms .......................................................................................................... 27
2.2.f Metabolism .................................................................................................... 28
2.3 pH and chronic wounds ......................................................................................... 33
2.3.a pH Fundamentals........................................................................................... 33
2.3.b pH of Intact Skin ............................................................................................. 35

6
2.3.c pH in Normal, Acute and Chronic Wounds .................................................... 35
2.3.d Importance of pH in Wound Healing ............................................................. 38
2.3.f The Need for Innovation ................................................................................ 43
2.3.g The Disposable Sensor and its Working Principle ........................................... 45
2.4 Literature Summary ............................................................................................... 48
3. Methodology .................................................................................................................. 49
3.1 Bacteria .................................................................................................................. 49
3.2 Media ..................................................................................................................... 49
3.2.a LB Media ......................................................................................................... 49
3.2.b Mannitol Salt Agar ......................................................................................... 50
3.2.c Foetal Bovine Serum ...................................................................................... 50
3.3 Calibration Solutions .............................................................................................. 50
3.3.a Acidic Buffer .................................................................................................. 51
3.3.b Alkaline Buffer ................................................................................................ 51
3.3.c Chloride Adjusted Buffer ............................................................................... 51
3.4 pH Indicator ........................................................................................................... 52
3.4.a Phenol Red ..................................................................................................... 52
3.5 Disposable pH Sensor Production .......................................................................... 52
3.4 Colony Counting ..................................................................................................... 55

7
3.7 pH Measurement ................................................................................................... 58
3.8 Bacteria Characterisation ...................................................................................... 59
3.9 pH Sensor Measurement Verification of LB Media ............................................... 60
3.10 pH Measurements in Bacterial Cultures ................................................................ 61
3.10.a Growth Curve Experiment in LB media .......................................................... 61
3.10.b Growth Curve Experiment in FBS ................................................................... 64
3.10.c Long Term Growth Curve Experiment in FBS ................................................. 65
4. Results ............................................................................................................................ 67
4.1 Bacteria Characterisation ....................................................................................... 67
4.2 pH Sensor Measurement Verification of LB Media ............................................... 69
4.3 pH Measurements in Bacterial Cultures ................................................................ 71
4.3.a Growth Experiment in LB Media ..................................................................... 71
4.3.b Growth Curve Experiment in FBS .................................................................... 75
4.3.c Long Term Growth Experiment in FBS ............................................................. 80
5. Discussion ....................................................................................................................... 85
6. Future Directions ........................................................................................................... 92
7. Conclusion ...................................................................................................................... 94
8. Reference ....................................................................................................................... 96
8
Table of Figures
FIGURE 1: THE WOUND HEALING STAGES FROM BLEEDING OVER INFLAMMATION, PROLIFERATION TO MATURATION AND
REMODELLING OF THE WOUND [GOSAIN ET AL. (2004)]. .......................................................................... 12
FIGURE 2: POSSIBLE CAUSES FOR CHRONIC WOUND DEVELOPMENT. .................................................................... 14
FIGURE 3: BACTERIA IDENTIFICATION ALGORITHM FOR STAPHYLOCOCCAL SPECIES.. ................................................ 19
FIGURE 4: GENERAL BACTERIAL GROWTH PROFILE OVER TIME.. .......................................................................... 22
FIGURE 5: ILLUSTRATION OF THE DIFFERENCE OF CELL WALLS OF (A) GRAM POSITIVE AND (B) GRAM NEGATIVE BACTERIA
[ELLIOTT ET AL. (2011)]. .................................................................................................................... 24
FIGURE 6: OVERNIGHT INCUBATION OF S. AUREUS AND S. EPIDERMIDIS ON LB PLATES. .......................................... 25
FIGURE 7: SHOWS A BLOOD AGAR PLATE WITH S. AUREUS COLONIES OF A DIAMETER OF 2-3MM [ELLIOTT ET AL. (2011)].
...................................................................................................................................................... 27
FIGURE 8: DIFFERENT FERMENTATION PATHWAYS FOR PYRUVATE AFTER GLYCOLYSIS [STRELKAUSKAS ET AL. (2010)]. .. 31
FIGURE 9: THE PH SCALE WITH COMMON SUBSTANCES TO CLARIFY THE CONCEPT OF ALKALINITY AND ACIDITY [50]. ..... 34
FIGURE 10: PH CHANGE OF AN ACUTE WOUND DURING THE HEALING PROCESS.. ................................................... 36
FIGURE 11: PH CHANGE OF A CHRONIC WOUND DURING THE HEALING PROCESS.. .................................................. 37
FIGURE 12: CHANGE IN PH IN WOUND FLUID OF INFECTED PIG WOUNDS DURING HEALING.. .................................... 38
FIGURE 13: ENZYME PEAK ACTIVITY USED FOR WOUND DEBRIDEMENT [SCHNEIDER ET AL. (2007)]. .......................... 41
FIGURE 14: THIS SHOWS THE HIGH HETEROGENEOUS BACTERIA DISTRIBUTION WITHIN A WOUND SITE.. ..................... 44
FIGURE 15: SCHEMATIC OF THE DISPOSABLE PH SENSOR;. ................................................................................. 45
FIGURE 16: LINEAR CORRELATION BETWEEN MEASURED VOLTAGE AND PH FOR A PH RANG OF PH 4 TO PH 10 [MILNE ET
AL. (2014)]. .................................................................................................................................... 47
FIGURE 17: SENSOR PRODUCTION EXPLAINED STEP BY STEP. .............................................................................. 53
FIGURE 18: THIS SHOWS A TYPICAL PH MEASUREMENT.. .................................................................................. 54
FIGURE 19: THE LB PLATE ON THE LEFT SHOWS A COLONY COUNT OF S. AUREUS WHILE THE ONE ON THE RIGHT SHOWS
THREE PLATED DILUTIONS OF S. EPIDERMIDIS SOLUTIONS. .......................................................................... 56
FIGURE 20: ILLUSTRATES THE SERIAL DILUTION AND DROPLET PLATING ARRANGEMENT ON THE AGAR PLATE. ............... 57
FIGURE 21: THE PH SENSING PROCESSES ILLUSTRATED IN THIS GRAPHIC.. ............................................................. 58
FIGURE 22: GROWTH CURVE EXPERIMENT IN LB. ........................................................................................... 62
FIGURE 23: 24-WELL-PLATE SETUP OF THE GROWTH CURVE EXPERIMENT IN LB MEDIA........................................... 63
FIGURE 24: GROWTH CURVE EXPERIMENT IN FBS. ......................................................................................... 64
FIGURE 25: GROWTH CURVE EXPERIMENT IN FBS.. ........................................................................................ 65
FIGURE 26: OVERNIGHT GROWTH OF S. AUREUS ON MSA. ............................................................................... 68
FIGURE 27: OVERNIGHT INCUBATION OF S. EPIDERMIDIS ON MSA. .................................................................... 69
FIGURE 28: REFERENCE ELECTRODE BEHAVIOUR FOR LB MEDIA COMPONENTS IN DIFFERENT CONCENTRATIONS.. ........ 70
FIGURE 29: GROWTH CURVE EXPERIMENT IN LB MEDIA WITH S. AUREUS.. ........................................................... 73
FIGURE 30: GROWTH CURVE EXPERIMENT IN LB WITH S. EPIDERMIDIS. ............................................................... 74
FIGURE 31: GROWTH CURVE EXPERIMENT IN FBS WITH S. AUREUS. ................................................................... 77
FIGURE 32: GROWTH CURVE EXPERIMENT IN FBS WITH S. EPIDERMIDIS. ............................................................. 79
FIGURE 33: LONG TERM GROWTH CURVE EXPERIMENT WITH S. AUREUS.. ............................................................ 82
FIGURE 34: LONG TERM GROWTH EXPERIMENT WITH S. EPIDERMIDIS.................................................................. 83
FIGURE 35: GENERAL PH PROFILE OF S. AUREUS DURING GROWTH. .................................................................... 86

9
1. Introduction
One of the biggest burdens to health care systems all over the world, with an annual expense
of US$ 25 billion, are chronic wounds. The three main types of chronic wounds are diabetic
foot ulcers, venous and pressure ulcers [Mustoe et al. (2006)]. About 6.5 million patients are
currently suffering from a chronic wounds and the number is expected to increase with the
rise in obese and diabetic patients and a generally aging population [Chandan et al. (2009),
Sen et al. (2009)].
A major challenge in wound care, and one of the causes of chronic wound development, is
the rapid identification of infections [Mustoe et al. (2006)]. Unpleasant developed bacterial
infections shows symptoms including redness, swelling, pain, spreading erythema, crusting
and purulent discharge [NHS (2015), DaCosta et al. (2015) and Keith et al. (2004)]. However,
infections are difficult to detect in the early stages. Diabetic foot infections (DFI) for example
do not display overt signs including warmth, tenderness and therefore erythema and make
it more difficult to detect infections early on [McArdle et al. (2014)].
Microbiological testing will identify the infection bacteria, give useful information about
antibiotic susceptibility and semi-quantitative bacterial growth rates. This is done by using
selective growth media, staining techniques or other laboratory testing [Stokes et al. (1987),
Spicer et al. (2000)]. The biggest drawback of microbiological testing is the duration of the
tests, which typically take about 3-5 days and the fact, that only the bacterial load of the
wound centre is analysed [DaCosta et al. (2015)]. A new technology is needed to evaluate
chronic wound healing continuously and in real time. This will enable clinicians to detect
bacterial infection before a severe infection becomes established and biofilms can form.

10
Furthermore, it would help to reduce antibiotic misuse by ensuring that antibiotics are only
prescribed when required.
In this thesis a feasibility study is conducted of whether the presence of bacteria will change
the wound pH in a detectable level allowing bacterial differentiation to be carried out as early
as possible. If a unique pH profile for bacteria presence in chronic wounds can be identified,
early bacteria presence can be detected and the infection treated without any delays .The
pH sensor used in this scenario could be integrated in the future to be embedded in bandages
and placed directly on the wound. It is also possible to combine different sensors including
for example a moisture or temperature sensor to collect other relevant information about
the healing process of the wound. Personalised treatment with the help of a miniature, cost
efficient, disposable sensor could shorten healing times and lower the healthcare cost
burden worldwide.

11
2. Background
This section reviews the important literature on wound care, the microbiology of infections
and wound pH. First of all, the general environment of a chronic wound will be discussed and
compared to a normally healing wound. Secondly, the pH environment of wounds, together
with current measurement techniques and the effect of bacterial infections with respect to
wound healing and its pH are described. Thirdly, the bacteria used in this thesis and relevant
microbiological background are presented. Lastly, the choice and working principle of the pH
sensor is discussed in further detail.
2.1 Clinical Microbiology of Chronic Wounds
This section describes in more detail the concepts of normal wound healing and how chronic
wounds develop and in which way they differ from normally healing wounds. Furthermore
the burden of chronic wounds on the society and health care systems is discussed in a bigger
scope. Finally the presence and impact of bacteria in chronic wounds is further presented.
2.1.a Normal Wound Healing
The healing of wounds is a complex process involving various reactions and interactions of
cells and mediators and is not yet completely understood [Broughton et al. (2006)]. However,
there are three main phases of wound healing; inflammation, proliferation and maturation
and remodelling [McArdle et al. (2014), Broughton et al. (2006), Wild et al. (2010) and Gosain
et al. (2004)]. Figure 1 shows a diagram of the different healing stages including homeostasis
which is the immediate response of the wound to bleeding [Gosain et al. (2004)].
Homeostasis is per definition sometimes included in the inflammation stage.

12
Figure 1: The wound healing stages from bleeding over inflammation, proliferation to maturation and
remodelling of the wound [Gosain et al. (2004)].
The inflammation stage lasts about 4-6 days. Initially the Haemostasis and vasoconstriction
sets in. Hereby thrombocytes align onto the injured vessel, a coagulation cascade is activated
and fibrin is produced to form a hemostatic clot. This prevents further blood loss from the
insured tissue. Neutrophils clear the wound of foreign particles and microorganisms. This is
followed by the recruitment of Monocytes and the release of growth factors [Broughton et
al. (2006), Mahon et al. (2015)].
The proliferation stage starts about 4-5 days after injury and typically lasts a few weeks. This
phase is also called the tissue formation phase. Next to new blood vessel formation (i.e.
13
angiogenesis) a new vascular alignment forms which is clinically known as granulation tissue.
This is accompanied by extracellular matrix formation and re-epithelisation starting at the
wound edges. In this phase the wound contraction also takes place in which healthy tissue
moves centripetally to make the scar area as small as possible [Broughton et al. (2006), Shai
et al. (2005)].
The Maturation and remodelling stage can take up to two years after injury. Within the first
few weeks Collagen type III is deposited in the wound. During the remodelling phase,
equilibrium between degradation of old collagen and the synthesis of Collagen I with a higher
stability has to be achieved. This process leads to scar tissue formation. The scar strength will
increase from only 5% of the original skin strength to 80% after the end of the maturation
and remodelling phase [Broughton et al. (2006), Shai et al. (2005)].
2.1.b Types and Development of Chronic Wounds
A chronic wound is defined as a wound that does not heal within an appropriate time frame,
which is mostly defined by clinicians as three to four months [Shai et al. (2005)]. The time is
however determined by the size and cause of the wound and the patient’s health status.
Chronic skin wounds are also called chronic cutaneous ulcer in dermatology [Shai et al.
(2005)].
Chronic ulcer development is a complex process and can also be formed by several
underlying conditions and mechanisms. The most common ulcers are venous ulcers, ulcers
due to peripheral arterial disease, diabetic ulcers, Livedoid vasculitis, pressure ulcers and
ulcers developing in the course of cellulitis. Other causes can be due to mechanical trauma,
drug side effects, nutritional disorders, metabolic disorders including diabetes mellitus,
14
neuropathic ulcers, tumoral diseases, hematologic abnormalities, hypercoagulable states,
Dysproteinemias, connective tissue disease, Vasculitis or Vascular abnormalities [Mustoe et
al. (2006), Shai et al. (2005)].
A chronic wound does not follow normal healing times and remains in a constant
inflammation phase [Shai et al. (2005)]. Mustoe et al. (2006) states that abnormalities in
chronic wound pathogenesis are caused by a combination of local tissue hypoxia, bacterial
colonization of the wound, repetitive ischemia reperfusion injury, and an altered cellular and
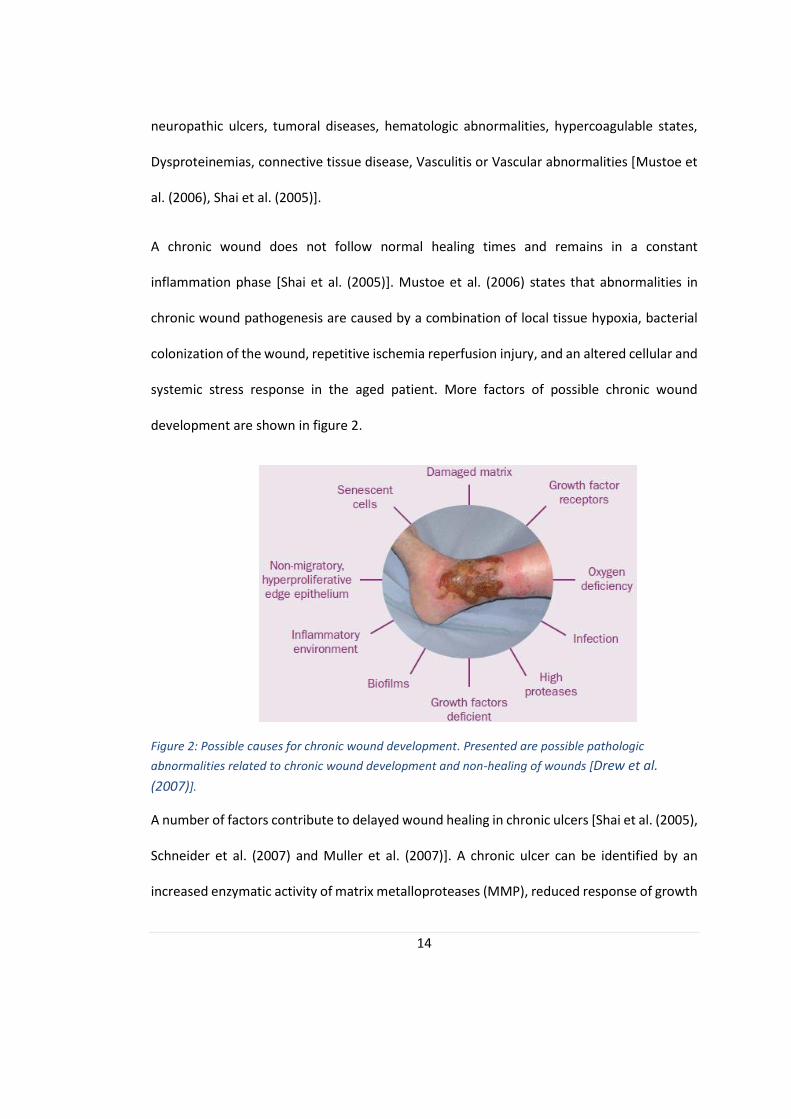
systemic stress response in the aged patient. More factors of possible chronic wound
development are shown in figure 2.
Figure 2: Possible causes for chronic wound development. Presented are possible pathologic
abnormalities related to chronic wound development and non-healing of wounds [Drew et al.
(2007)].
A number of factors contribute to delayed wound healing in chronic ulcers [Shai et al. (2005),
Schneider et al. (2007) and Muller et al. (2007)]. A chronic ulcer can be identified by an
increased enzymatic activity of matrix metalloproteases (MMP), reduced response of growth
15
factors and cell senescence. MMP degrade growth factors and newly formed extracellular
matrix components such as collagen and fibronectin. Moreover, the activity of MMP
inhibitors is reduced in chronic wounds. Additionally to the degradation of growth factors by
MMP’s, it is implied that chronic ulcers also show reduced expression of growth factors.
Finally, cell senescence (i.e. growing old of cells) leads to reduced proliferation capacity and
decreased response to growth factors [Shai et al. (2005), Schneider et al. (2007)].
An ulcer’s appearance can be used to diagnose its cause and therefore to determine the best
treatment. Features used for ulcer classification are the surface area, depth of the ulcer, its
peripheral discoloration and undermining (i.e. its spread and involvement or destruction of
peripheral tissue) [Shai et al. (2005)].
2.1.c Bacteria in Chronic Wounds
Historically, a set of objective and subjective criteria were produced to help clinicians
determine whether a wound is infected or not. They rely on the individual’s sense of smell,
touch and the ability to identify different colouring of the wound. Identification of infection
differs between wound types, which makes it even harder for clinicians to detect bacterial
infections by subjective criteria [Keith et al. (2004), Puchberger-Enengl et al. (2012)]. These
methods are out of date and are mostly only used as a control to the swabs or other microbial
tests [Puchberger-Enengl et al. (2012].
Bacteria are present at the surface and deep tissue of all wounds. It has not yet been
determined if bacteria colonization itself is a delaying wound healing factor [Schneider et al.
(2007)]. However, the number of bacteria present in the wound determines if it’s a bacterially
16
infected wound with delayed healing or if only a small amount of bacteria are present and
wound healing is even accelerated [Jones et al. 2004].
The species of bacteria and the location where the bacteria are found are important factors
in disease pathology. The human body is naturally colonised with different bacterial strains,
the so-called “normal flora”. These live in symbioses with the human host and support it by
the digestion of food, as a bacterial barrier to prevent pathogenic microbes or the production
of vitamins [Murray et al. (2009)]. In contrast, virulent bacteria grow at the expense of the
host and opportunistic bacteria take advantage of pre-existing conditions, for example
immunosuppression of the patient [Murray et al. (2009)].
An analysis of bacteria colonization on intact skin showed that S. epidermidis is the most
common bacteria and was present in 80.65% of the time in all subjects at every time point
[Wysocki et al. (2012)]. Between two and 16 different bacteria species could be identified on
intact skin from all tested patients, with an average of eight per wound. S. aureus has been
detected in 25.8% of all cases [Wysocki et al. (2012)].
In comparison to the bacteria colonization of intact skin, the bacteria presence of chronic
wounds was also assessed by Wysocki et al. (2012). They found that P. aeruginosa was the
predominant species in the total number of chronic wounds tested with 48.4%. S. epidermidis
was found in 21% of all cases and in 37.5% of all measurements, S. aureus and S. epidermidis
were found in the intact skin and the wound. A limitation of this study is that the bacteria
distribution in a chronic wound is highly heterogeneous [Thomsen et al. (2010)]. A swab
taken from deeper tissue, for example, is more likely to contain P. aeruginosa while the
surface layers are more likely to contain S. aureus [Fazli et al. (2009)].
17
It should be noted that bacteria presence in a chronic wound does not necessarily lead to a
bacterial infection with the present microorganisms. The quantity of the bacteria present
should therefore always be assessed and the infection treated for the major pathogenic
bacteria rather than the fastest growing one [Burmølle et al. (2010)].
S. aureus and S. epidermidis are both opportunistic bacteria that are present in the normal
flora of the skin. Once the epidermis is broken, they can easily enter the vulnerable tissue
beneath it and cause an infection. This is a common problem in patients with indwelling
catheters, intravenous lines or chronic wounds [Murray et al. (2009), Wysocki et al. (2012)].
In a study from Hansson et al. (1995) it was found that bacterial numbers in chronic wounds,
including S. aureus and S. epidermidis, remain constant. It was assumed that bacterial
presence in chronic wounds is due to a natural flora within the wound bed. This flora appears
to restrict overgrowth of one bacterial species which causes an infection of the wound
[Hansson et al. (1995)]. Wysocki et al. (2012) confirmed these results by identifying the
bacterial strains present in chronic venous ulcers over time. In contrast, Wolcott et al. (2009)
identified 13 Gram-positive and Gram negative bacteria, including S. aureus and S.
epidermidis, in chronic wounds that are able to degrade extra cellular matrix proteins which
might also contribute to a delayed wound healing . Halbert et al. (1992) showed that S. aureus
does indeed delay wound healing due to several unfavourable processes.
In chronic wounds the risk of infection is greater. Diabetic patients, for example, have an
increased risk of bacterial infection due to the immunosuppressive effect of diabetes and the
hypoxic and necrotic nature of wounds [Jones et al (2004)].

18
At least 60% of all chronic wounds contain a biofilm. These consist of complex bacterial
structures and secrete extracellular polymeric substances which act as a biochemical barrier.
In the biofilm the bacteria are mostly protected against mechanical forces, shear forces, the
host’s immune response and antibiotics. This makes it very difficult to treat chronic wounds
with biofilms. The knowledge of biofilm formation and treatment is therefore important and
should be taken into account when treating chronic wounds [Donelli (2014)].
2.1.d Current Bacteria Detection Techniques
The types of tests conducted will determine the possible findings in the sample and the
current techniques are unlikely to detect all bacteria. Especially difficult to detect are low
concentrations and slowly growing microorganisms. However, the choice of test is not the
only factor influencing the diagnostic results. Open wounds often are contaminated with
pathogenic microbes unrelated to the infection itself. A swab should be taken from deeper
wound layers after cleaning the wound [Murray et al. (2009), Burmølle et al (2010), Fazli et
al (2009) and Mahon et al (2015)].
The best microbiological test for wound sampling is a deep tissue biopsy [Keith et al. (2004),
Murray et al. (2009)]. However, it is an invasive, expensive technique that causes pain to the
patient. A different approach is the semi-qualitative surface swabs. It is less expensive and
causes less pain then the deep tissue biopsy, but no conclusive guideline exists for the most
effective swabbing technique [Keith et al. (2004), Murray et al. (2009) and Ono et al. (2015)].
The Levine swab is the most commonly used technique but is limited to analyse only the
centre of the wound which has the potential to misidentify an important bacterium at the
edges of the wound. Microbiological tests take up to five days to identify a bacterium, but
19
are much more accurate than the subjective analysis of signs and symptoms mentioned
above [DaCosta et al. (2015), Ono et al. (2015)].
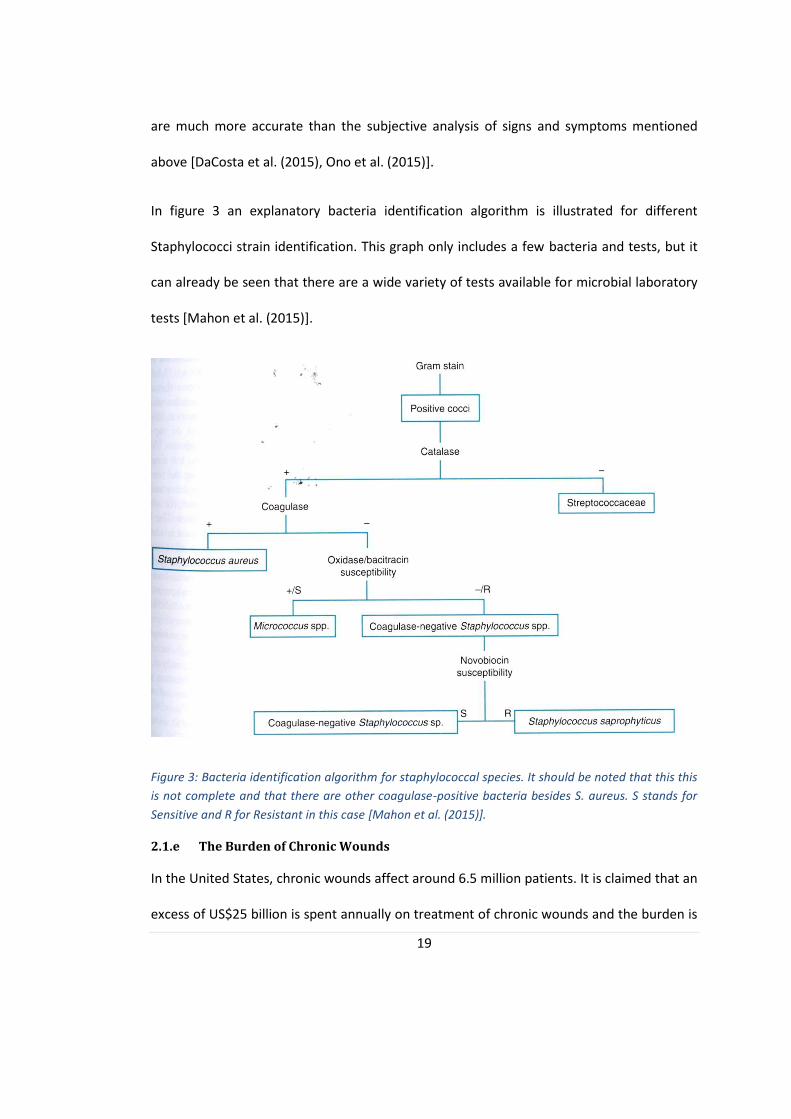
In figure 3 an explanatory bacteria identification algorithm is illustrated for different
Staphylococci strain identification. This graph only includes a few bacteria and tests, but it
can already be seen that there are a wide variety of tests available for microbial laboratory
tests [Mahon et al. (2015)].
Figure 3: Bacteria identification algorithm for staphylococcal species. It should be noted that this this
is not complete and that there are other coagulase-positive bacteria besides S. aureus. S stands for
Sensitive and R for Resistant in this case [Mahon et al. (2015)].
2.1.e The Burden of Chronic Wounds
In the United States, chronic wounds affect around 6.5 million patients. It is claimed that an
excess of US$25 billion is spent annually on treatment of chronic wounds and the burden is

20
growing rapidly due to increasing health care costs, an aging population and a sharp rise in
the incidence of diabetes and obesity worldwide [Chandan et al. (2012), Sen et al. (2009)].
Chronic wounds are defined as wounds that will not heal for several months or even years.
A study in 2007 showed that 24% of all chronic wounds investigated took 6 months or more
to heal with 16% having a chronic wound for more than a year. In the same study 12.6% of
all chronic wounds were infected [Drew et al. (2007)]. More than 90% of all chronic wounds
can be divided into three types of wounds; diabetic ulcers, venous ulcers and pressure ulcers
[Mustoe et al. (2006)]. The International Diabetes Federation states that 382 million people
were living with diabetes worldwide in 2013 and the probability of these patients to suffer
from foot ulcer at one point in their live is 10-25% [Michael et al. (2015), International
Diabetes Federation (2014)]. It is furthermore, the leading non-traumatic cause of lower
extremity amputation in developing countries and the United States [McArdle et al. (2014)].
Diabetic ulcers alone are a big burden to the health care system which is only further stressed
by the additional annual cost of €6.5 billion to treat venous leg ulcers and between €2.2-3.2
billion to treat and prevent pressure ulceration in the UK [Drew et al. (2007)].
Another major burden on society rather than the healthcare systems is antibiotic misuse.
Patients with chronic wounds might get prescribed antibiotics to prevent severe infection
symptoms developing before the test results are returned. One result of this is the evolution
of antibiotic resistance bacteria. Professor Dame Sally Davies claimed in 2013 that antibiotic
resistance is “as big a risk as terrorism” [Bazian (2015)]. What we now define as a minor
infection could easily develop in a serious threat if the bacteria causing the infection are
resistant to all currently known antibiotics. In order to limit the ongoing development of
21
antibiotic resistant bacteria the antibiotic stewardship was introduced in 2001. It is a
sustainable approach of medical institutions to ensure the quality of antibiotics in terms of
type, dose, duration and application [|A|B|S| Initiative Deutschland (2011)].
In this study, pH change in simulated wound fluid has been investigated during bacterial
growth of two Staphylococcus species with a screen printed pH sensor. If a trend in pH
change exists, continuous online monitoring of chronic wounds is possible with the help of
an integrated wearable pH sensor in the wound dressings. This way bacterial infections can
be detected and treated as early as possible to minimise healing times of chronic wounds
and therefore lower the burden on the healthcare systems worldwide. Antibiotic misuse can
also be avoided which will further reduce the threat of antibiotic resistance in bacteria on
the society.
2.2 Microbiology Theory
In this section the important background about bacteria is explained. This general knowledge
is necessary to understand the concepts investigated in the discussion of the thesis.
2.2.a Bacterial Growth
If sufficient nutrients and metabolites are present in the growth media, bacteria can be divide
into two identical cells through a process called binary fission [Murray et al. (2009), Mahon
et al. (2015)]. The bacterial growth is influenced by several environmental factors including
temperature, pH and the gaseous composition of the atmosphere. The metabolic pathways
change according to oxygen presence and vary in energy efficiency and metabolic end
products [Michael et al. (2002), Mahon et al. (2015)].
22
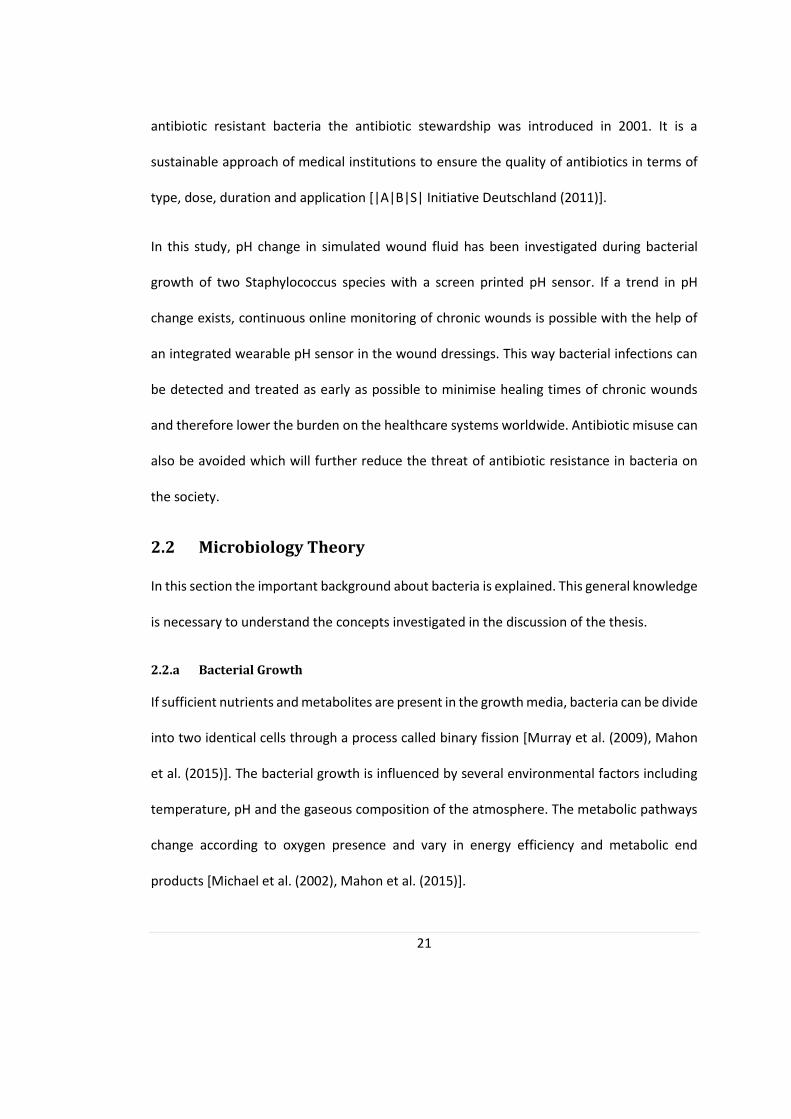
Typical bacterial growth consists of four stages (figure 4). A lag phase can be observed in
which the freshly inoculated bacteria need time to adapted and grow in the new media and
will not yet divide. The next phase is called the log or exponential phase in which the bacterial
cell density increases exponentially. After most of the nutrients are metabolised further
growth is limited, the growth rate declines and stays reasonably stable in the stationary
phase. With increasing nutrients consumption, cell growth or division rates decrease and
more toxic metabolites build up in the media. Consequently, the viability of bacteria in the
media decreases in the death phase [Murray et al. (2009), Mahon et al. (2015)].
Figure 4: General bacterial growth profile over time. The bacterial cell density stays relatively constant
in the lag phase, increases during log phase and at a high constant level in stationary phase. In death
phase the number of viable bacteria declines.
23
2.2.b Gram staining
Originally developed to differentiate between different bacteria strains, Gram straining
evolved and is now the best known and most widely used strain for bacteria classification. It
divides all bacteria in Gram-positive and Gram-negative bacteria depending on their
phenotypic characteristics [Murray et al. (2009)].
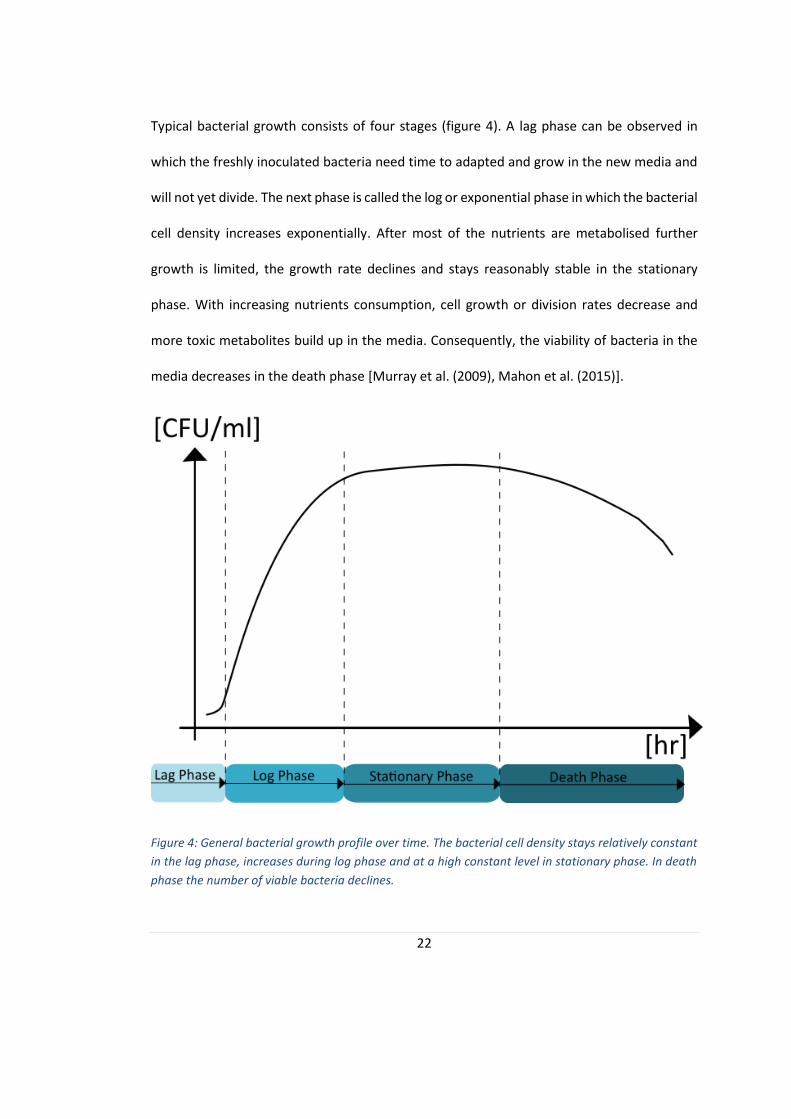
The difference between Gram-positive and Gram-negative bacteria lies in their cell wall as
illustrated in figure 5. While Gram-positive bacteria have a thick peptidoglycan layer with
different included molecules that allows them to survive in media with high salt
concentrations, Gram-negative bacteria have a thinner inner layer of peptidoglycan
surrounded by an outer membrane of lipopolysaccharides, phospholipids and proteins. This
layer makes it hydrophobic which enables Gram-negative bacteria to be antibiotic resistant
in some extent [Stokes et al. (1987), Michael et al. (2002), Spicer et al. (2000), Elliott et al.
(2011) and Murray et al. (2009)].
Gram-negative bacteria are more resistant to lysozyme, acid and bile while Gram-positive
bacteria, for example S. aureus and S. epidermidis, are fairly resistant to high salt
concentrations [Murray et al. (2009)].
Gram staining is the most important test for bacteria characterization because it is a very
quick and reliable test. It helps to determine which identification test would be useful to
continue with. During the test bacteria are fixed with iodine and washed with alcohol which
will stain Gram-positive bacteria the purple of crystal violet while Gram-negative bacteria
lose their colour and will be counterstained with a pink dye [Stokes et al. (1987), Michael et
al. (2002), Spicer et al. (2000) and Elliott et al. (2011)].
24
With the help of other nucleic acid-based tests, direct examination, antigen detection,
selective cultures and antibody detection methods it can be determined what type of
bacteria is present in a sample solution [Murray et al. (2009), Namvar et al. (2014)].
Figure 5: Illustration of the difference of cell walls of (a) gram positive and (b) gram negative
bacteria [Elliott et al. (2011)].
2.2.d S. aureus and S. epidermidis
The two Gram-positive bacteria used in this study are presented in this section and their
pathogenic capabilities discussed.
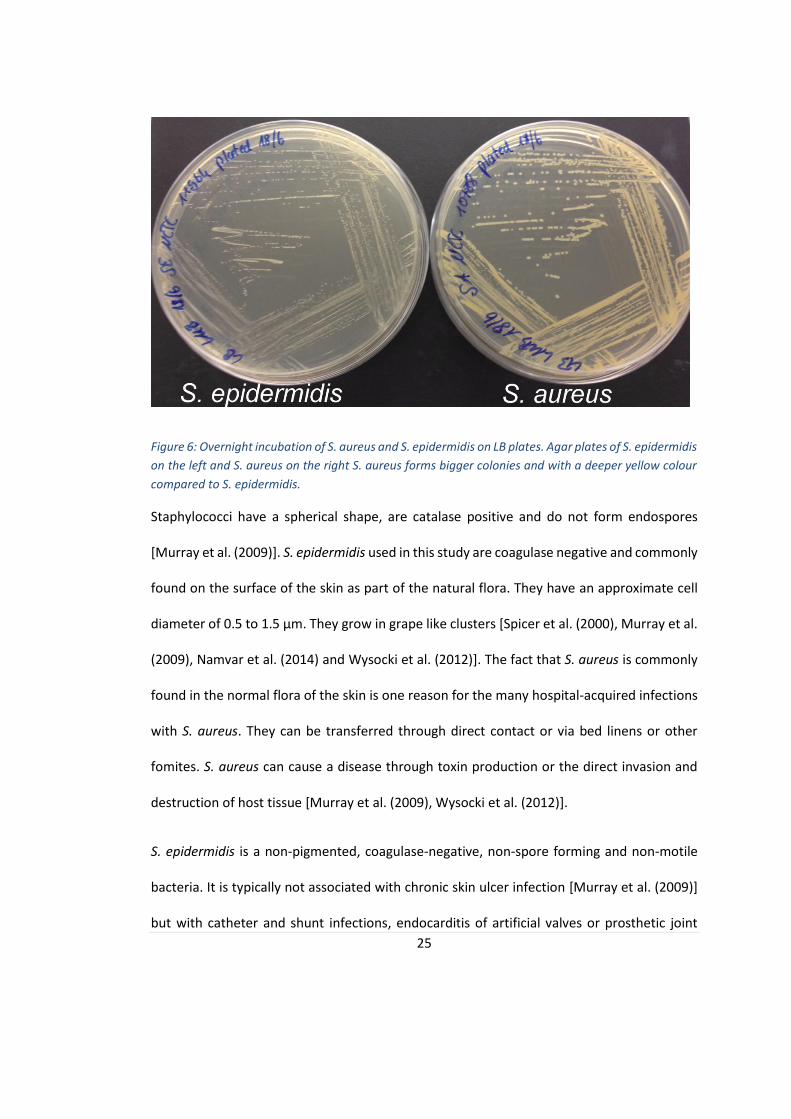
Both bacteria were steaked out on LB agar plates and incubated overnight. The resultant agar
plates are shown in figure 6. It can be seen that S. aureus forms bigger colonies with a yellow
colour, while S. epidermidis grows smaller colonies with a white colouring.
25
Figure 6: Overnight incubation of S. aureus and S. epidermidis on LB plates. Agar plates of S. epidermidis
on the left and S. aureus on the right S. aureus forms bigger colonies and with a deeper yellow colour
compared to S. epidermidis.
Staphylococci have a spherical shape, are catalase positive and do not form endospores
[Murray et al. (2009)]. S. epidermidis used in this study are coagulase negative and commonly
found on the surface of the skin as part of the natural flora. They have an approximate cell
diameter of 0.5 to 1.5 µm. They grow in grape like clusters [Spicer et al. (2000), Murray et al.
(2009), Namvar et al. (2014) and Wysocki et al. (2012)]. The fact that S. aureus is commonly
found in the normal flora of the skin is one reason for the many hospital-acquired infections
with S. aureus. They can be transferred through direct contact or via bed linens or other
fomites. S. aureus can cause a disease through toxin production or the direct invasion and
destruction of host tissue [Murray et al. (2009), Wysocki et al. (2012)].
S. epidermidis is a non-pigmented, coagulase-negative, non-spore forming and non-motile
bacteria. It is typically not associated with chronic skin ulcer infection [Murray et al. (2009)]
but with catheter and shunt infections, endocarditis of artificial valves or prosthetic joint

26
infections [Murray et al. (2009)]. Especially its ability to attach to artificial material and
biofilm production capability increased the number of S. epidermidis caused infections in the
past decades. It is often antibiotic resistant and can confer its resistance to S. aureus by
transduction [Spicer et al. (2000), Namvar et al. (2014) and Mahon et al. (2015)].
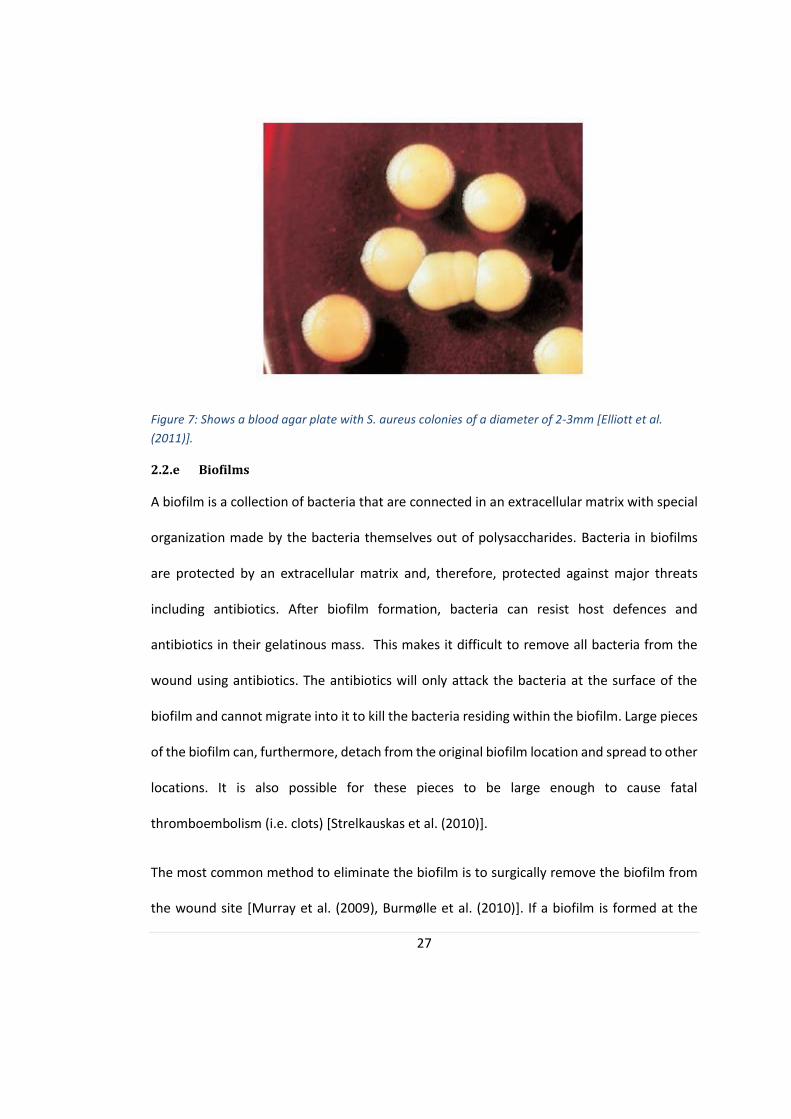
S. aureus (figure 7) can be coagulase-negative or positive and is associated with various
pathological conditions including meningitis and arthritis as well as boils. S. aureus is also the
cause of the so called scaled skin syndrome, toxic shock syndrome, toxic epidermal necrolysis
and food poising [Murray et al. (2009)]. It can be recovered from almost any clinical device
and the increased drug resistance is a growing trend [Michael et al. (2002), Kang et al. (2011)].
According to Mahon et al. (2015) S. aureus is the predominant bacteria causing skin infections
in America with 44.6% of the overall number of isolates [Stokes et al. (1987), Michael et al.
(2002), Spicer et al. (2000), Namvar et al. (2014) and Mahon et al. (2015)]. S. aureus and S.
epidermidis are facultative anaerobes. This means they are able to grow with and without
oxygen presence [Murray et al. (2009)].
27
Figure 7: Shows a blood agar plate with S. aureus colonies of a diameter of 2-3mm [Elliott et al.
(2011)].
2.2.e Biofilms
A biofilm is a collection of bacteria that are connected in an extracellular matrix with special
organization made by the bacteria themselves out of polysaccharides. Bacteria in biofilms
are protected by an extracellular matrix and, therefore, protected against major threats
including antibiotics. After biofilm formation, bacteria can resist host defences and
antibiotics in their gelatinous mass. This makes it difficult to remove all bacteria from the
wound using antibiotics. The antibiotics will only attack the bacteria at the surface of the
biofilm and cannot migrate into it to kill the bacteria residing within the biofilm. Large pieces
of the biofilm can, furthermore, detach from the original biofilm location and spread to other
locations. It is also possible for these pieces to be large enough to cause fatal
thromboembolism (i.e. clots) [Strelkauskas et al. (2010)].
The most common method to eliminate the biofilm is to surgically remove the biofilm from
the wound site [Murray et al. (2009), Burmølle et al. (2010)]. If a biofilm is formed at the
28
surface of an artificial joint replacement, the only sufficient solution is to remove the joint.
Afterwards it can be replaced it with another one a few weeks later after a biofilm in an open
wound can also be treated using immune modulation and antimicrobial agents [Mahon et al.
(2015)].
The importance of biofilms and the additional risk that comes with it was already mentioned
in section 2.1.c Bacteria in Chronic Wounds. Even though S. epidermidis is not known to
commonly produce biofilm in chronic wounds, it is a major problem in artificial joint
replacements and catheters crossing the skin. It is, however, possible for a chronic wound to
exhibit a biofilm produced from S. epidermidis [Foulston et al. (2014), Donelli (2014) and
Mahon et al. (2015)].
2.2.f Metabolism
The metabolism of microorganism describes the biochemical reactions used to break down
organic compounds to gain energy and construct new bacterial parts. This is the only process
for bacteria to gain energy, in form of ATP, since bacteria do not have mitochondria.
Dependent on environmental factors, different metabolic pathways are used to break down
substances. This is mostly influenced by regulating specific enzyme productions or enzyme
activity. Enzymes, like other proteins, are influenced by pH and working temperature and can
change their tertiary structure which in turn inhibits enzyme activity by physically changing
the active binding site of the enzyme. Enzyme activity can also be inhibited by removing
necessary cofactors to catalyse reactions [Mahon et al. (2015)].
29
Bacteria can produce energy by two major mechanisms; fermentation and respiration.
Fermentation and respiration can be carried out by aerobes and facultative anaerobes
[Michael et al. (2002), Mahon et al. (2015) and Strelkauskas et al. (2010)].
Respiration transfers electrons to external electron acceptors including oxygen, nitrate, ferric
ion, sulfate or carbonate. It is a more efficient way to produce energy than fermentation. This
process uses the Krebs cycle and the electron transport chain to produce energy and one
glucose molecule yields a total of 38 ATP. In respiration, oxidative phosphorylation is used to
form the high energy compound ATP from ADP. In oxidative phosphorylation some of the
energy stored in the cytoplasmic membrane by the proton motive force is released and used
to produce ATP [Michael et al. (2002), Mahon et al. (2015) and Strelkauskas et al. (2010)].
The development of the proton motive force is explained in more detail below.
Electron transport carriers are spread in the membrane in a way that protons are separated
from electrons as the electrons are transported through the electron transport chain. In the
end, an electron is transferred to an external electron acceptor, for example oxygen, while
several protons are released into the environment. This leads to a small acidification of the
external environment. Furthermore, a pH gradient and an electrochemical potential is
produced since the membrane is impermeable for H+ and OH-, and H+ are accumulated in the
external media. This potential is about 200 mV and is called the proton motive force and is
continuously feeding the membrane with energy. Part of this energy is stored in ATP as
described above [Michael et al. (2002), Booth (1985)].
S. epidermidis uses carbohydrates like fructose and maltose for aerobic respiration while it
can use glucose for anaerobic conditions. It is, in comparison to S. aureus, not able to ferment

30
mannitol which is a unique diagnostic way to differentiate between the two bacteria [Namvar
et al. (2014)]. During fermentation different end products are produced that will alter the pH
in a different manner than other by-products. This is the basis of the hypothesis discussed in
this study. The pH is used to determine if bacteria are present in the wound and according to
the specific pH profiles, the bacterial species might be determined from the change in pH in
the wound fluid.
During fermentation an organic compound accepts an electron in an anaerobic environment
with the absence of usable external electron acceptors. Fermentation is less efficient than
respiration because the initial substance is not completely reduced before the reaction. The
fermentation of glucose, called glycolysis, only yields 2 ATP. A mixture of end products is
produced including lactate, ethanol, acetoin and butyrate which can be used to determine
the bacterial species [Michael et al. (2002), Mahon et al. (2015)]. Common fermentation
pathways are illustrated in figure 8 [Strelkauskas et al. (2010)]. It should be noted that
fermentation does not rely on the proton motion force to produce energy in the form of ATP
[Michael et al. (2002)].

31
Figure 8: Different fermentation pathways for pyruvate after glycolysis [Strelkauskas et al. (2010)].
Many bacteria produce by-products that can damage the human host for example through
acids, gasses or toxins [Murray et al. (2009)]. The human host is trying to fight the infection
by activating innate- and immune-responses. These, however, can have damaging
consequences to the infected area. The damage caused by both, the bacteria and the
consequences of the host response, produce a disease [Murray et al. (2009)].
In aerobic conditions, S. aureus mainly produces carbon dioxide and acetic acid during
carbohydrate oxidation [Strasters et al. (1963)]. In an anaerobic condition however, the end
products are lactic acid and low levels of CO2 [Strasters et al. (1963)].
Exogenous glucose and free amino acids can be used by S. aureus for endogenous respiration
[Ramsel et al. (1961)]. One end product of endogenous respiration is ammonia which will be
excreted from the bacteria in the environment and therefore, increases the pH level [Ramsel
et al. (1961)].

32
S. aureus and other bacteria can adapted to change in environment with different gene
expression which enables them to grow in environments with a pH range of 5-9 [Rode et al.
(2010), Weinrick et al. (2004)]. A drastic pH change to acidic levels will lead to an acidic stress
situation of the bacteria in which the acid tolerance response (ATR) is activated [Rode et al.
(2010)].
In an acidic stress situation the membrane composition changes, the proton efflux increases
together with the amino acid catabolism, DNA repair enzymes are activated and proteins that
promote survival at low pH values are synthesised [Rode et al. (2010)]. The cytoplasmic pH is
strongly regulated using different pathways to ensure no DNA damage that would arise from
a low internal pH. The buffering capacity of S. aureus is 160-360 nmol H+/pH per mg protein.
Next to a buffering system, the use of active transport systems via an increased synthesis of
ATPase to increase proton efflux is used to regulate internal pH. Furthermore, the production
of acids or bases can be used to regulate the pH. For example, some Gram-positive bacteria
use arginine deiminase which is broken down into ornithine, carbon dioxide and ammonia
which will also alkalinize the cytoplasm [Rode et al. (2010), Booth (1985)].
Several studies talk about the correlation of medium pH and metabolic properties of a
bacterium. It can be noted that fermentation of acidic end products occurs when the bacteria
grow in alkaline pH media and neutral end products are produced when the external pH is
acidic. A growing cell typically has an alkaline pH which drops during growth through
accumulation of acids in the cytoplasm [Booth (1985)].
The adaption of the gene expression to a lower pH change into slightly acidic values of
approximately 5.5 are called Mild Acid Stimulation (MAS) [Weinrick et al. (2004)]. Hereby,

33
the bacterial metabolism is adapted to the new environment without activating the entire
ATR. It is suggested that pH is a factor which is determining the activation and deactivation
of different genes and this will have to be further investigated to identify the exact pathways
[Weinrick et al. (2004)].
2.3 pH and chronic wounds
In order to put the pH level into context of chronic wounds, the pH level and profile of a
chronic wound has been investigated in the literature. In the following subsection the
meaning of pH is explained together with known pH changes in chronic and infected wounds.
2.3.a pH Fundamentals
During a pH measurement, the amount of free hydrogen ions (H+) in a solution is measured.
The pH is the negative logarithm to base 10 of the H+ concentration in mol/l as seen in the
equation below [Murray et al. (2009), Mahon et al. (2015), Strelkauskas et al. (2010) and
Schneider et al. (2007)].
pH = - log(H+)
Figure 9 shows a pH scale with commonly known substances [Strelkauskas et al. (2010)].

34
The pH level can be influenced by compounds in the solution itself. Water will dissociate and
one water molecule will produce one proton and one hydroxyl ion. This reaction happens
continuously and spontaneously in every aqueous solution. Acids and alkalis can also
dissociate and produce protons and hydroxyl ions accordingly. A change in temperature will
change the measurable pH and big temperature changes should always be documented
when doing experimental work [Strelkauskas et al. (2010), Schneider et al. (2007)].
Figure 9: The pH scale with common
substances to clarify the concept of alkalinity
and acidity [50].

35
The typical pH scale includes values between 0-14 which corresponds to a proton
concentration of 100 – 10-14 mol/l in the sample solution. A pH lover than 7 is per definition
acidic, a pH of 7 is neural and all pH values higher than 7 are alkaline [Mahon et al. (2015),
Strelkauskas et al. (2010) and Schneider et al. (2007)].
2.3.b pH of Intact Skin
The skin is the biggest body barrier and protects it against bacterial or fungi infections. It is
often referred to the acid mantle due to its low pH that ranges from pH 4 to pH 6. The skin
pH is influenced by endogenous factors, including skin moisture, sweat, race or anatomic site,
or by exogenous factors including soaps, detergents or other skin irritants [Yosipovitch et al.
(1996), Schneider et al. (2007)]. The internal body pH usually has a value between 7.35 and
7.46 [Yosipovitch et al. (1996)]. The pH of the skin is fairly stable throughout a lifetime. The
pH rises slightly after approximately the age of 80 or with diabetes development. An alkaline
pH is meant to weaken the barrier function of the skin and therefore promotes possible skin
infections [Yosipovitch et al. (1996), Schneider et al. (2007)].
The pH on the skin is believed to be controlled by acid production, including amino acids and
lactic acid, and the consistency of the secreted sweat in which the concentration of
ammonium and hydrogen can vary [Yosipovitch et al. (1996), Schneider et al. (2007)].
2.3.c pH in Normal, Acute and Chronic Wounds
The exact pH change during wound healing is not completely understood yet, but generally
it can be said that normally healing wounds have a pH of 5-9 while chronic non-healing
wounds and bacterial infected wounds have an alkaline pH exhibiting a different pattern
instead of above with at least 7.3 [Schneider et al. (2007), Ono et al. (2015)].
36
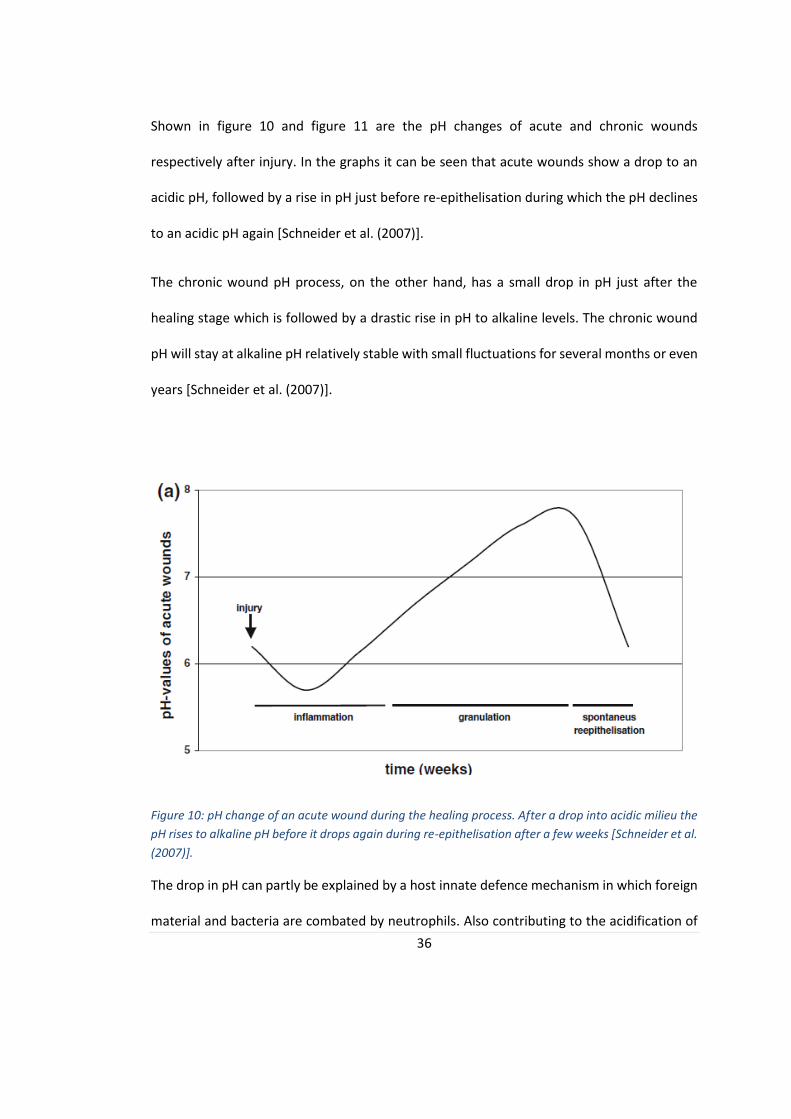
Shown in figure 10 and figure 11 are the pH changes of acute and chronic wounds
respectively after injury. In the graphs it can be seen that acute wounds show a drop to an
acidic pH, followed by a rise in pH just before re-epithelisation during which the pH declines
to an acidic pH again [Schneider et al. (2007)].
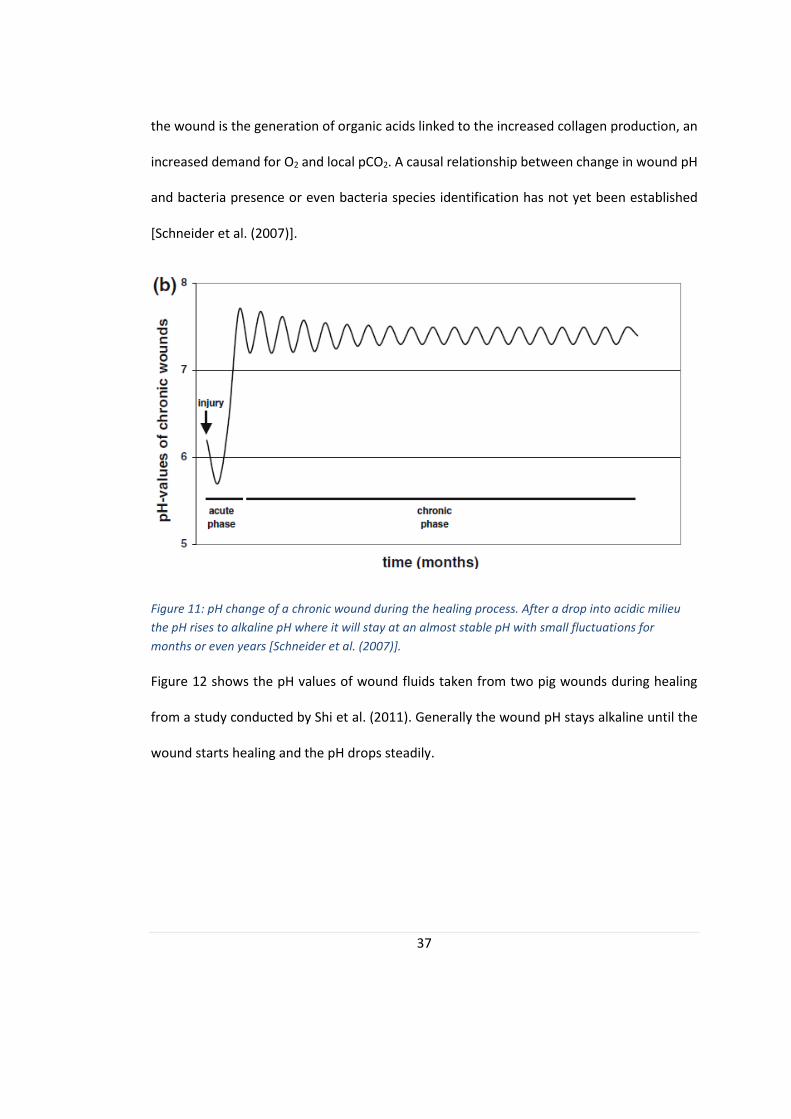
The chronic wound pH process, on the other hand, has a small drop in pH just after the
healing stage which is followed by a drastic rise in pH to alkaline levels. The chronic wound
pH will stay at alkaline pH relatively stable with small fluctuations for several months or even
years [Schneider et al. (2007)].
Figure 10: pH change of an acute wound during the healing process. After a drop into acidic milieu the
pH rises to alkaline pH before it drops again during re-epithelisation after a few weeks [Schneider et al.
(2007)].
The drop in pH can partly be explained by a host innate defence mechanism in which foreign
material and bacteria are combated by neutrophils. Also contributing to the acidification of
37
the wound is the generation of organic acids linked to the increased collagen production, an
increased demand for O2 and local pCO2. A causal relationship between change in wound pH
and bacteria presence or even bacteria species identification has not yet been established
[Schneider et al. (2007)].
Figure 11: pH change of a chronic wound during the healing process. After a drop into acidic milieu
the pH rises to alkaline pH where it will stay at an almost stable pH with small fluctuations for
months or even years [Schneider et al. (2007)].
Figure 12 shows the pH values of wound fluids taken from two pig wounds during healing
from a study conducted by Shi et al. (2011). Generally the wound pH stays alkaline until the
wound starts healing and the pH drops steadily.

38
Figure 12: Change in pH in wound fluid of infected pig wounds during healing. It is noted
that the wound pH was highly alkaline and dropped to a lower alkaline pH during healing
[Shi et al. (2011)].
Wilson et al. (1979) conducted a study in which 50 patients with chronic leg ulcers had a
mean pH of 7.7 (±0.3 SD) with a total range of 7.3-8.9 [Wilson et al. (1979)]. Other studies
confirm these findings and also reveal that a healing chronic wound during re-epithelisation
has a lower pH of 6.0 (±0.5 SD) [Schneider et al. (2007)].
The wound pH is historically neglected and only assumed that an acidic pH is favourable for
all wound healing. It has however, been shown that, even though a low pH is favourable for
certain healing stages, a high pH value is correlated to improved take-rates of skin-grafts. For
chronic wounds with pH values below 7.4, the take-rate for skin-grafts is almost none while
the take-rate for wounds with a pH higher 7.4 is 99% [Schneider et al. (2007)].
2.3.d Importance of pH in Wound Healing
The pH within a wound is a very important factor during wound healing. It is influencing
directly and indirectly all reactions in the wound bed area [Schneider et al. (2007)].
39
Healing wounds have a higher oxygen demand than normal skin to fuel all required reactions
in the wound site. The so-called Bohr-effect is responsible for higher O2 supply to the wound
than normal. The basis of the Bohr-effect is the fact that the binding capability of
haemoglobin to oxygen is decreased for environments with decreased pH (i.e. lower than the
physiological level of 7.4) or for increased CO2 levels in tissue. A healing wound has an acidic
pH and will therefore receive more oxygen than a non-healing chronic wound with an alkaline
pH [Schneider et al. (2007), Trengrove et al. (1999)]. An increased pH in turn will directly limit
the healing capabilities of a wound by limiting oxygen supply.
The effectiveness of antibiotics decreases drastically with decreasing pH [Schneider et al.
(2007)]. This further complicates treating bacterially infected wounds. It has been shown that
the activity for the aminoglycoside gentamycin in an environment with pH of 7.8 has a 90-
fold higher biological activity than in an acidic environment of pH 5.5 [Mehmood et al. (2014),
McArdle et al. (2014) and Schneider et al. (2007)].
Moreover, the performance of antiseptics is also impaired by pH changes. The working
efficacy of silver for example is impaired by increased pH because the solubility of metal ions
is decreased [Percival et al. (2014)]. The use of other antiseptics with a working range in the
alkaline levels is suggested for chronic wounds [Percival et al. (2014)].
Matrix metalloproteinases (MMPs) are enzymes in wounds responsible for the degradation
of dead tissue as a part of wound healing and repair but may cause destruction of key
molecules including growth factors [McArdle et al. (2014), Gethin et al. (2008)]. In chronic
wounds this enzyme has been found to be overrepresented [Muller et al. (2007)]. This will
lead to a faster tissue breakdown than synthesis which keeps the wound in a prolonged
40
inflammatory phase. Furthermore, it has been found that the enzyme inhibitor of matrix
metalloproeases (TIMPs) is underrepresented in chronic wounds, amplifying this effect
[McArdle et al. (2014), Schneider et al. (2007) and Muller et al. (2007)].
All enzymes have an ideal working pH in which its activity reaches a peak. It is however,
possible for the enzyme to work a defined range around that ideal pH. Outside the optimal
pH the enzyme will change its three-dimensional structure and lose its functionality [McArdle
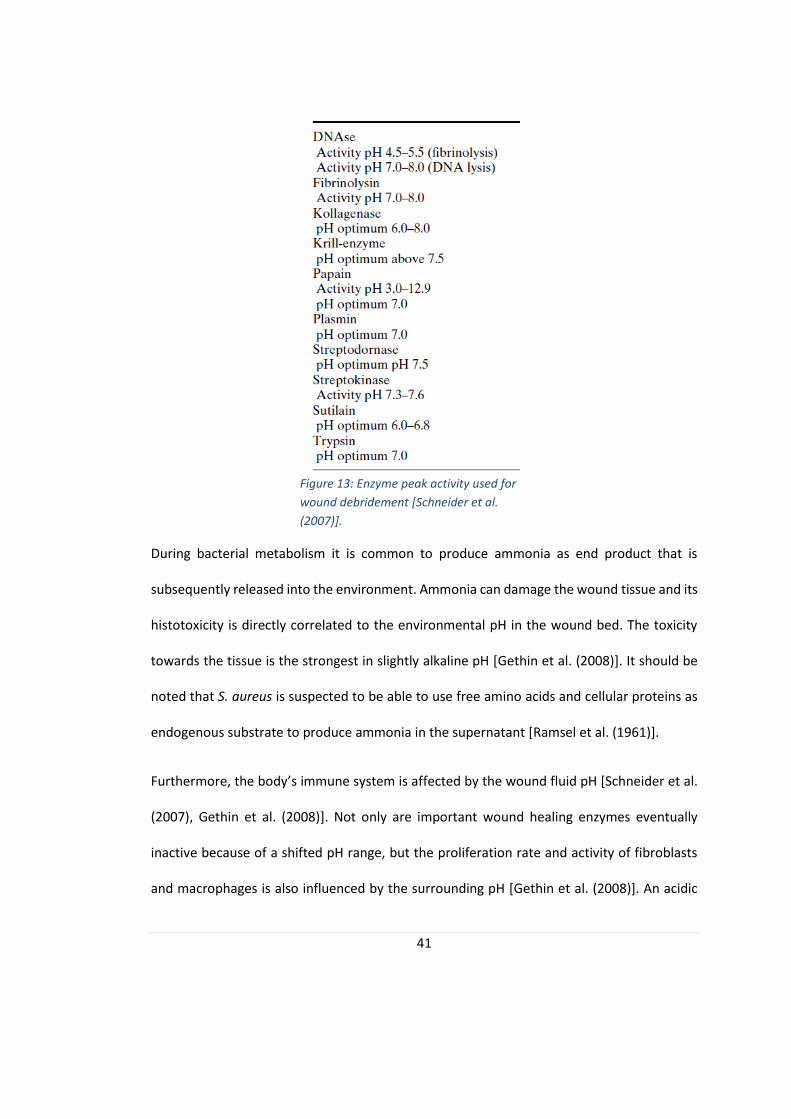
et al. (2014), Schneider et al. (2007) and Trengrove et al. (1999)]. In figure 13, a list of enzymes
used in wound debridement is presented with their pH working range [Schneider et al.
(2007)]. MMPs are inactivated at an acidic pH and reaches their peak activity at higher pH
values [McArdle et al. (2014)]. It should be noted that not only more MMPs are present in
chronic wounds, but that the pH environment also supports their activity which leads to
further degradation of the wound tissue without sufficient tissue reassembly leading to
further delayed healing [Schneider et al. (2007), Muller et al. (2007) and Gethin et al. (2008)].
41
During bacterial metabolism it is common to produce ammonia as end product that is
subsequently released into the environment. Ammonia can damage the wound tissue and its
histotoxicity is directly correlated to the environmental pH in the wound bed. The toxicity
towards the tissue is the strongest in slightly alkaline pH [Gethin et al. (2008)]. It should be
noted that S. aureus is suspected to be able to use free amino acids and cellular proteins as
endogenous substrate to produce ammonia in the supernatant [Ramsel et al. (1961)].
Furthermore, the body’s immune system is affected by the wound fluid pH [Schneider et al.
(2007), Gethin et al. (2008)]. Not only are important wound healing enzymes eventually
inactive because of a shifted pH range, but the proliferation rate and activity of fibroblasts
and macrophages is also influenced by the surrounding pH [Gethin et al. (2008)]. An acidic
Figure 13: Enzyme peak activity used for
wound debridement [Schneider et al.
(2007)].

42
environment is important for macrophage recruitment to the wound bed [Percival et al
(2014)]. Furthermore it was found that macrophages cultured in low pH environments failed
to produce angiogenic factors which will further impact wound healing [Percival et al.
(2014)]. In a study using impermeable wound dressings to lower the pH of the chronic wound
to slightly acidic milieu it was found that the lowered pH promoted fibroblast growth and
had the capability to inhibit bacterial growth [Schneider et al. (2007)]. High pH values in the
alkaline level also increase apoptosis and decrease locomotion of polymorphonuclear
leukocytes (PMNs) and neutrophils [Percival et al. (2014)].
It is generally understood that pathogenic bacteria need pH values above pH 6 to be able to
growth uninhibitedly [Schneider et al. (2007)]. S. aureus is also known to withstand acidic pH
values as low as 5 pH before it is affected by it [Percival et al. (2014)].
2.3.e Current pH measurement techniques and their limitations
Glass electrodes are the gold standard measurement technique to record pH values. They
consist of an H+ sensitive electrode and a reference electrode that is proton concentration
independent. With the help of a potentiometer the pH in the sample solution can be detected
by comparing the data from both electrodes. However, it is not possible to use glass
electrodes reasonably in chronic wounds or any environment that offers opportunity for
bacterial contamination. Furthermore, it is rather difficult to ensure complete sterilisation
and normal working of the glass electrode. Moreover, the sample size suitable for glass pH
meters has to be big enough to cover the sensing part of the device. In chronic wounds
however, the sample that can be drawn is often very small and not enough for a glass
electrode pH measurement. Additionally it is not given that this sensing technology can be
43
miniaturised any further. For a successful implementation of pH sensing wound dressing,
however, it would have to be miniaturised and simplified, which is both not yet possible.
Glass is brittle and doesn’t deform which makes it unsuitable for wearable monitoring in a
wound. For all these reasons a different pH measurement system was used for this thesis
[Mahon et al. (2015)].
As mentioned before in section 2.1.d Current Bacteria Detection Techniques, the most
common way to sample a chronic wound is by a swab. The biosensor used in this thesis is
applicable with the swab technique. Hereby a swab is taken with a cotton bud which is rolled
over the two electrodes on the sensor after calibration. This unproblematic integration in a
clinical setup and, moreover, ease of integration to a wearable pH sensing wound dressing
was crucial for the decision of using this type of sensor [Murray et al. (2009), Burmølle et al.
(2010), Mahon et al. (2015)].
2.3.f The Need for Innovation
Chronic wounds are a great burden to health care systems all over the world. Subjective
analysis of signs and symptoms are not accurate enough to detect bacterial infections early
and microbiological tests take too long and cannot analyse the entire wound site at the same
time [Murray et al. (2009), Burmølle et al. (2010) and Fazli et al. (2009)].
The major limitation of current bacterial detection methods, introduced in section 2.1.d
Current Bacteria Detection Techniques, however, is the highly heterogeneous bacteria
distribution in chronic wounds shown in figure 14 [Burmølle et al. (2010), Fazli et al. (2009)].
The bacteria population varies on the wound surface and depending where in the wound the
samples were taken, the detected bacteria will change. This was shown in several studies,
44
from Fazli et al. (2009) and Wolclott et al. (2009), and underlines the importance of a more
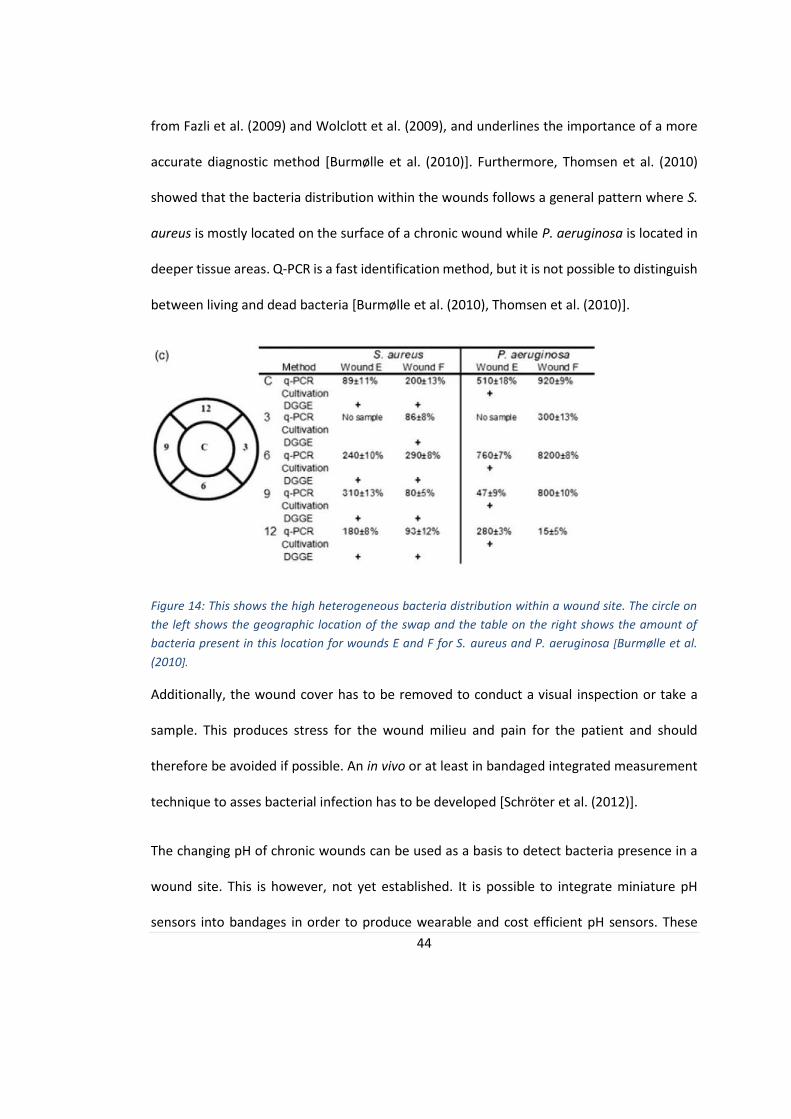
accurate diagnostic method [Burmølle et al. (2010)]. Furthermore, Thomsen et al. (2010)
showed that the bacteria distribution within the wounds follows a general pattern where S.
aureus is mostly located on the surface of a chronic wound while P. aeruginosa is located in
deeper tissue areas. Q-PCR is a fast identification method, but it is not possible to distinguish
between living and dead bacteria [Burmølle et al. (2010), Thomsen et al. (2010)].
Figure 14: This shows the high heterogeneous bacteria distribution within a wound site. The circle on
the left shows the geographic location of the swap and the table on the right shows the amount of
bacteria present in this location for wounds E and F for S. aureus and P. aeruginosa [Burmølle et al.
(2010].
Additionally, the wound cover has to be removed to conduct a visual inspection or take a
sample. This produces stress for the wound milieu and pain for the patient and should
therefore be avoided if possible. An in vivo or at least in bandaged integrated measurement
technique to asses bacterial infection has to be developed [Schröter et al. (2012)].
The changing pH of chronic wounds can be used as a basis to detect bacteria presence in a
wound site. This is however, not yet established. It is possible to integrate miniature pH
sensors into bandages in order to produce wearable and cost efficient pH sensors. These

45
could be read out or record data continuously and would be able to detect bacterial
infections as soon as possible. This has the potential to avoid long wound healing and prevent
antibiotic misuse and reduce overuse. The ideal sensor is cheap, easy to apply, disposable,
flexible, robust, sterilisable and integrated into the bandages [Schröter et al. (2012)].
In the future it is also possible to integrate several sensors into the wound bandaged to assess
several important wound healing parameters. Possible measured parameters are moist of
the wound, temperature, and pH.
2.3.g The Disposable Sensor and its Working Principle
The sensor used in this thesis was developed and produced in the biomedical Engineering
Department of Biomedical Engineering at the University of Strathclyde, Glasgow. Figure 15
illustrates the general setup of the disposable sensing compound.
Figure 15: Schematic of the disposable pH sensor; a) shows the Ag/AgCl reference electrode, b) the
working electrode while c) labels the semi permeable membrane applied to the working electrode
and d) the electrode insulation to protect the sensor from getting wet and therefore change the
output.
46
It is composed of a reference electrode made out of Ag/AgCl and a working electrode out of
carbon. Both electrodes are applied via screen printing. On the working electrode, a layer of
selectively permeable membrane is applied and the connecting electrode pathways are
insulated using self-adherent foil to prevent them to wetting or damage during the working
procedure.
The working principle of the sensor is based on its potentiometric measurement capability.
Per definition it is known that the higher the pH, the lower the H+ concentration in the sample
solution. The permeable membrane on the working electrode is selective to protons and
allows them to migrate into the membrane. The carbon electrode is H+ sensitive and its
measured potential will change with the concentration of protons present. The reference
electrode on the other hand will not change potential with proton presence and using this
the pH can be calculated.
The disposable sensor is connected to a portable measurement device and calibrated as
described in section 3.7 pH Measurement. The voltages for both calibration solutions, pH 4
and pH 7, are recorded and an approximately linear system correlating measured voltages
and pH is developed for this individual sensor. One example of a linear correlation of voltage
and pH for a range of pH 4 to pH 10 can be seen in figure 16.

47
Figure 16: Linear correlation between measured voltage and pH for a pH rang of pH 4 to pH 10 [Milne
et al. (2014)].
Using linear fitting, the slope, 𝑚 and offset, 𝑐 between the pH and potential can be found.
The bases of the calculation are these two equations:
m = ∆V/∆pH
c = V4 – m*pH4
Where m is the calculated slope, ∆V is the difference in voltage between the two
samples ∆pH is the difference in pH of the samples, c is the offset of the fitted curve, V4 is
the recorded voltage for the pH 4 calibration solution and pH4 is the pH of the calibration
solution pH 4 which is 4.00 pH.

48
Every sample will yield a specific voltage. This voltage will be used together with the
previously calculated slope, 𝑚 and offset, 𝑐 of the system to reconstruct the pH of the sample
solution. The formula used to calculate the pH is given below:
pHs = (Vs – c)/m ,
where pHs is the reconstructed pH of the sample and Vs is the recorded voltage of the sample.
2.4 Literature Summary
All in all it can be noted that chronic wounds are a big burden on society and health care
systems all over the world. The exact reasons for chronic wound development and delayed
wound healing are inconclusive and an additional risk are chronic wound infections with
bacteria. Bacterial metabolism is highly complex and can adapt to changing environmental
conditions. While the pH in normally healing wounds is mostly acidic, the pH in chronic
wounds is alkaline which results in decreased antibiotic efficiency, shifted enzyme activity,
decreased fibroblast activity and less oxygen supply to the wound site. Bacteria presence has
been shown to increase the wound pH as well but no study has sufficiently investigated the
pH change of infected chronic wounds.
With the help of a disposable pH sensor that can be integrated into wound dressings in the
future, the pH of S. aureus and S. epidermidis are investigated in vitro in LB media and FBS.
The aim is to determine the feasibility to detect bacteria presence in chronic wounds
according to its pH change. Once this is approved, further studies can be conducted using
multi-parameter arrays to determine bacterial infection in chronic wounds as early as
possible.

49
3. Methodology
Materials and methods used in this thesis are described in this section. The type of bacteria,
media and calibration solutions are stated as well as the procedures of production and
calibration of the disposable sensor and how to conduct a colony count. Finally the precise
experimental setup is described with the processes and measurements made.
3.1 Bacteria
For this thesis the bacteria under investigation were S. aureus, NCTC 10788, and S.
epidermidis, NCTC 11964. From the data sheet of the National Collection of Type Cultures it
is known that the optimal growth conditions for these facultative anaerobes is 37°C in nutrient
broth [Public Health England (2013), Public Health England (2013)].
3.2 Media
Three main media types were used to grow and compare the two bacteria S. aureus and S.
epidermidis; Luria Bertani (LB) media, mannitol salt agar (MSA) and foetal bovine serum
(FBS). LB and MSA were poured into solid agar plates which in turn were used for colony
counting procedures and maintaining stock cultures of the bacteria. Liquid media on the
other hand was used for preparation of serial dilutions, growth curve experiments and
overnight cultures.
3.2.a LB Media
Media was made by mixing 10g of tryptone (order number: 1279-7099, Fisher Scientific), 5g
NaCl (order number: S7653, Sigma-Aldrich) and 5g yeast extract (order number: BP1422-100,
Fisher Scientific) with 1l of deionised H2O. If solid media was required, 5% agar (order

50
number: BP1423-500, Fisher Scientific) had to be added to the solution as well. Afterwards
the media was autoclaved for 20 minutes at 121 C. Media plates were poured in a laminar
flow hood and once the media cooled to approximately 50°C. Plates were left to dry for at
least 20 minutes and were then stored at 7°C prior to use.
3.2.b Mannitol Salt Agar
To make MSA, 111g of already prepared Mannitol Salt Agar (order number: CM0085, Oxoid)
in power form was mixed with deionised H2O to produce 1l of media. After mixing it
thoroughly, the media was autoclaved for 20 Minutes at 121 C. It is important to know that
MSA contains phenol red and can therefore indicate pH changes in the media.
3.2.c Foetal Bovine Serum
In order to simulate chronic wound fluid conditions, Foetal Bovine Serum (order number:
10500-064, Gibco®) was used for a growth curve experiment and long term testing. The FBS
is from an E.U.-approved origin, South America, and was bought heat inactivated. Milne et
al. (2014) used foetal horse serum as an in vitro model of wound fluid which yielded
comparable results to the in vivo samples from wound sites. Foetal horse serum is
physiologically very similar to foetal bovine serum and therefore justifies its use as an in vitro
model for immunosuppressed chronic wounds [Milne et al. (2014)].
3.3 Calibration Solutions
In order to calibrate the disposable pH sensors, calibrations solutions had been produced.
Due to the fact that wound fluid and LB media contains sodium chloride which shifts the
working values of the sensor, the calibration solutions had to be adapted to the salt
concentration contained in the sample probes. The buffer solutions described below were

51
adjusted to have a pH in the range of pH 2-11 with an ionic strength range between 0.007-
0.1.
3.3.a Acidic Buffer
Due to the ingredients needed for this buffer, the entire procedure was performed under a
fume hood. First of all, 900ml deionised water was poured into a 1l glass bottle. Second, the
following ingredients were accurately measured, added to the bottle and ensured that the
content is properly mixed; 2.3ml Acetic acid (order number: 320099, Sigma-Aldrich), 2.74ml
Phosporic acid (order number: 04102, Sigma-Aldrich) and 2.4732g Boric acid (order number:
B6768, Sigma). Finally, enough distilled water was added to fill the content to exactly one
litre of liquid.
3.3.b Alkaline Buffer
A 1 litre bottle was filled with 875ml distilled water and 7g of NaOH (order number: S5881,
Sigma-Aldrich) added and mixed thoroughly to make a 0.2M NaOH solution.
3.3.c Chloride Adjusted Buffer
The disposable printed sensors were calibrated before every use. The calibration solution
had to be chloride adjusted in order for the sensor to measure the correct pH vales.
About 500ml of acidic buffer solution was added to a glass beaker and the amount of sodium
chloride added to mimic probe environmental conditions. A glass electrode was continuously
measuring the pH while small amounts of sodium hydroxide were pipetted into the beaker
until the desired pH is achieved. This was done to produce a chloride adjusted pH 4 and pH 7
calibration solution.

52
3.4 pH Indicator
PH indicators are useful to estimate the approximate pH value of a solution as a control to
the pH electrode.
3.4.a Phenol Red
Useful pH range of phenol red (order number: P0290, Sigma) is between 6.8 and 8.2 in which
it will indicate a red colour. Below 6.8 the colour is bright yellow and above 8.2 the colour is
strongly pink [Mahon et al. (2015)]. In this study it is used as a control to the disposable pH
sensor in the growth curve experiments.
3.5 Disposable pH Sensor Production
The production of the senor is described below. In figure 17, the production process of the
disposable sensor is illustrated. Firstly, the reference electrode was printed on a plastic
substrate using screen printing technology. The reference electrode was made of Ag/AgCl,
which was the reason the produced pH sensor was chloride sensitive and the calibrations
solutions had to be chloride adjusted according to the expected salt levels of the samples.
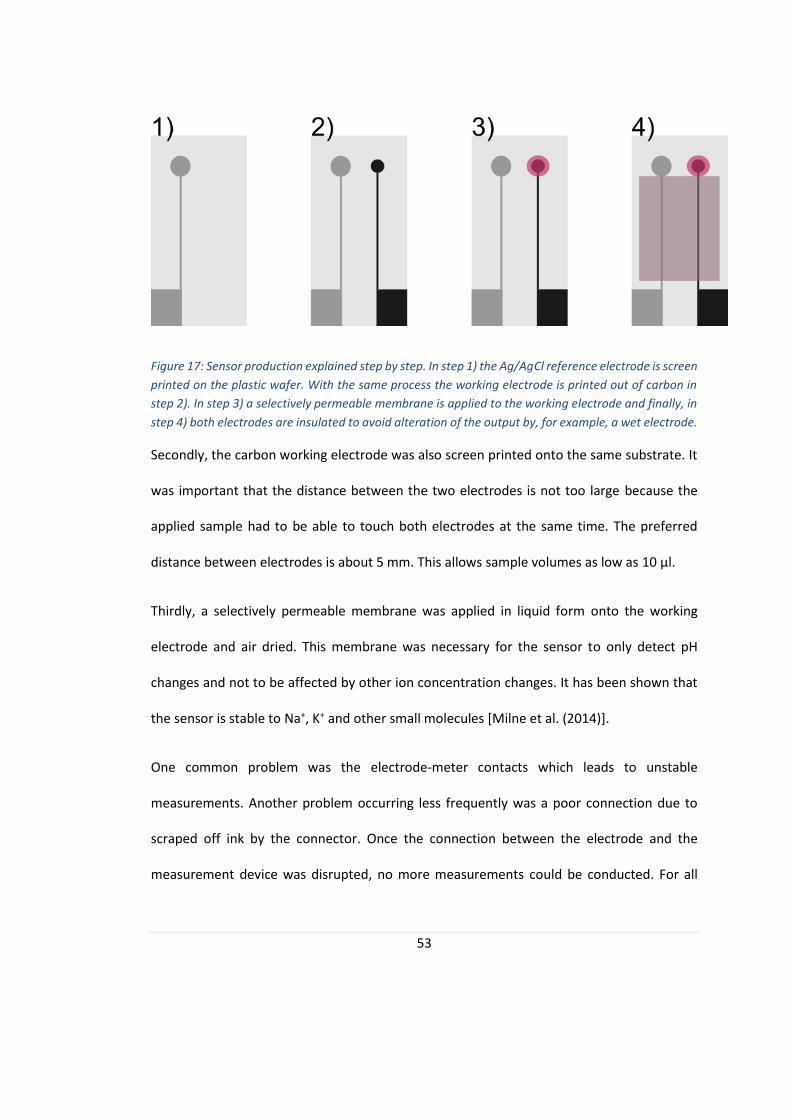
53
Figure 17: Sensor production explained step by step. In step 1) the Ag/AgCl reference electrode is screen
printed on the plastic wafer. With the same process the working electrode is printed out of carbon in
step 2). In step 3) a selectively permeable membrane is applied to the working electrode and finally, in
step 4) both electrodes are insulated to avoid alteration of the output by, for example, a wet electrode.
Secondly, the carbon working electrode was also screen printed onto the same substrate. It
was important that the distance between the two electrodes is not too large because the
applied sample had to be able to touch both electrodes at the same time. The preferred
distance between electrodes is about 5 mm. This allows sample volumes as low as 10 µl.
Thirdly, a selectively permeable membrane was applied in liquid form onto the working
electrode and air dried. This membrane was necessary for the sensor to only detect pH
changes and not to be affected by other ion concentration changes. It has been shown that
the sensor is stable to Na+, K+ and other small molecules [Milne et al. (2014)].
One common problem was the electrode-meter contacts which leads to unstable
measurements. Another problem occurring less frequently was a poor connection due to
scraped off ink by the connector. Once the connection between the electrode and the
measurement device was disrupted, no more measurements could be conducted. For all
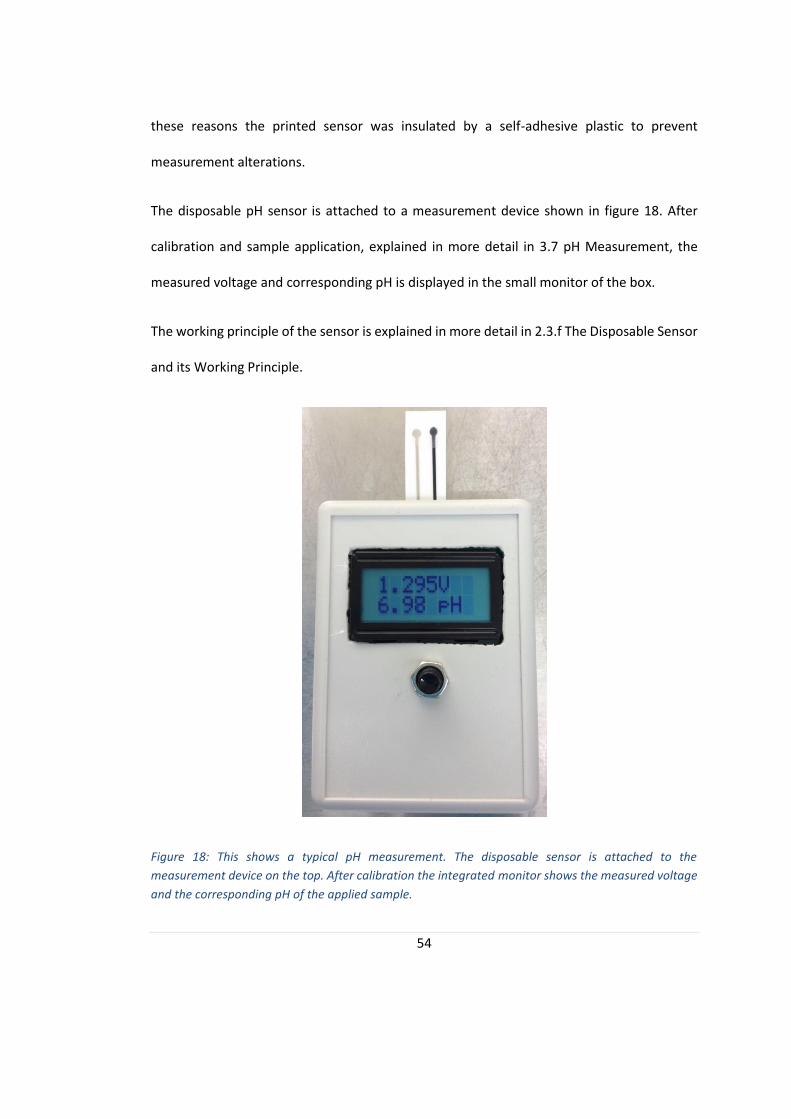
54
these reasons the printed sensor was insulated by a self-adhesive plastic to prevent
measurement alterations.
The disposable pH sensor is attached to a measurement device shown in figure 18. After
calibration and sample application, explained in more detail in 3.7 pH Measurement, the
measured voltage and corresponding pH is displayed in the small monitor of the box.
The working principle of the sensor is explained in more detail in 2.3.f The Disposable Sensor
and its Working Principle.
Figure 18: This shows a typical pH measurement. The disposable sensor is attached to the
measurement device on the top. After calibration the integrated monitor shows the measured voltage
and the corresponding pH of the applied sample.

55
3.4 Colony Counting
To determine the bacteria density in the media at a certain time point, a sample was taken
from each of the replicates incubated with bacteria. The entire process was executed under
a laminar flow hood.
Eight wells were prepared with 180µl LB media in a 96 well plate (order number: 92096, TPP)
using a multichannel pipette. In figure 20 the process is illustrated with fifth dilution. In the
first well 20 µl of the overnight incubated culture media was added and sufficiently mixed
with the help of a pipette. Using a fresh pipet tip, 20 µl of the first well solution was
transferred to the second well. This procedure was repeated until the last well was
inoculated. This serial dilution produces a logarithmic change of concentration between the
dilutions.
The chosen dilutions were then plated on an LB agar using the drop plate method [Herigstad
et al. (2001)]. In this method, ten 10 µl drops were placed onto an agar plate for every dilution
(making a total plated volume of 100 µl). The same was done for two other dilutions until a
total of thirty drops were dispensed on the agar plate.
All agar plates were air dried, incubated overnight for approximately 15 hours. Two typical
colony counting plates of S. aureus on the left and S. epidermidis on the right are shown in
figure 19 and the colonies per drop can be counted. The total of colonies counted of the
chosen dilution should be between 30 and 300, i.e., every drop should contain between 3
and 30.

56
The total colony count of one dilution is called the CFU per 𝜇𝑙. To get the more comparable
CFU/ml, the results will have to be multiplied by 10/Dilution Factor.
Figure 19: The LB plate on the left shows a colony count of S. aureus while the one on the right shows
three plated dilutions of S. epidermidis solutions.

57
Figure 20: Illustrates the serial dilution and droplet plating arrangement on the agar plate. Firstly, 0.02ml of overnight incubated media is inserted in 0.18ml fresh media. Secondly, 0.02ml of the first dilution is inserted in a second container with fresh media. This process is repeated until the desired dilutions are produced. The three desired dilutions are plated in ten 0.01ml drops each on an agar plate, air dried and incubated overnight. The amount of produced colonies can be counted the following day and the CFU/ml calculated. The drops of the third (10−3) dilution exhibits too many colonies to count,
while dilution 10−5 shows only a total number of colonies of 8. Both dilutions don’t qualify to be used to calculate the Colony Forming Unit (CFU) per ml. The dilution of 10−4, however, shows a sufficient number of colonies per drop and is recorded and used for further calculations.
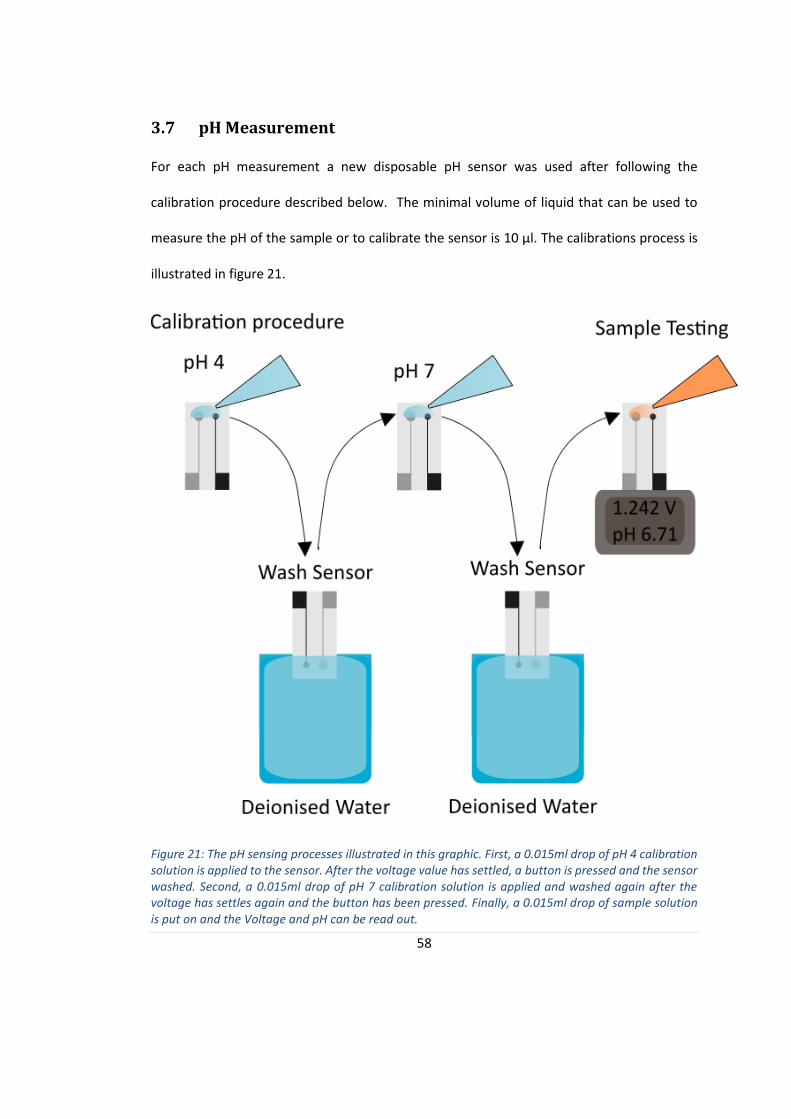
58
3.7 pH Measurement
For each pH measurement a new disposable pH sensor was used after following the
calibration procedure described below. The minimal volume of liquid that can be used to
measure the pH of the sample or to calibrate the sensor is 10 µl. The calibrations process is
illustrated in figure 21.
Figure 21: The pH sensing processes illustrated in this graphic. First, a 0.015ml drop of pH 4 calibration solution is applied to the sensor. After the voltage value has settled, a button is pressed and the sensor washed. Second, a 0.015ml drop of pH 7 calibration solution is applied and washed again after the voltage has settles again and the button has been pressed. Finally, a 0.015ml drop of sample solution is put on and the Voltage and pH can be read out.
59
A drop of chloride adjusted pH 4 calibration solution was applied to the sensor. Once the
measured voltage was stable, a button was pressed to save the value and the sensor was
repeatedly dipped in deionised water to remove the calibration solution. The excess solution
was removed with blue wipe and a drop of chloride adjusted pH 7 calibration solution was
applied to the sensor. The stabile voltage level was saved with a second press on the button
and the sensor was washed repeating the previously described procedure. The sensor was
than fully calibrated and ready for use. A drop of the sample solution was applied to the
sensor and after the measured voltage and pH had settled the values were recorded and the
sensor was washed as described above and used for the next probe measurement. The
sensor was disposed in the autoclave bin after the measurements and the wash solution, i.e.
the deionised water, was disposed the same way within the 25 ml universal container it was
stored in during the experiment.
3.8 Bacteria Characterisation
It was necessary to predict growth rate and roughly estimate bacteria counts to aid
experiment planning and execution. To achieve this, bacteria characterisation experiments
were performed.
Eight wells of a 24-well-plate were filled with 1 𝑚𝑙 of LB media and four were inoculated
with S. aureus and S. epidermidis accordingly. Furthermore, a universal container
(DNN41804, Elkay Laboratory Products (UK) Lt.) with 5 𝑚𝑙 was also inoculated with one of
the two bacteria. The two universals were placed in a shaking incubator overnight for about
15 hours at 37°C while the 24-well-plate was placed in a non-shaking incubator overnight for
about 15 hours also at 37°C. A colony count was done the following day.

60
A colony of S. aureus was streaked out on a MSA plate and placed in a non-shaking incubator
at 37°C overnight. The same was done for S. epidermidis and both plates were compared the
next day.
3.9 pH Sensor Measurement Verification of LB Media
The disposable sensor has been shown to measure the pH of wound swaps in the hospital
successfully using the chloride adapted calibration solutions [Milne et al. (2014)]. In order
for the sensor to be suitable for experiments with LB media, appropriate verification tests
have to be conducted.
Liquid LB media only consists of three ingredients: sodium chloride, tryptone and yeast
extract. Sodium chloride in LB media and wound fluid is known to affect the reference
electrode of the sensor which is why the calibration solutions were adapted accordingly.
An experiment investigating the influence of the other ingredients on the working or
reference electrode was executed. In Part A of the experiment three different concentration
solutions of tryptone and yeast extract were prepared in deionised water. The
concentrations were chosen according to their concentration in the media, half of this
concentration and double this concentration. In Part B sodium chloride was added to the
solutions. The theory is that sodium chloride will dominate the behaviour and therefore
stabilise the sensor’s voltage output. In Part C the output of both electrodes to LB media and
both chloride adjusted electrodes is measured.
All solutions were measured with the working electrode and the reference electrode each
compared to the measurements of a glass electrode. The glass electrode and one part of the
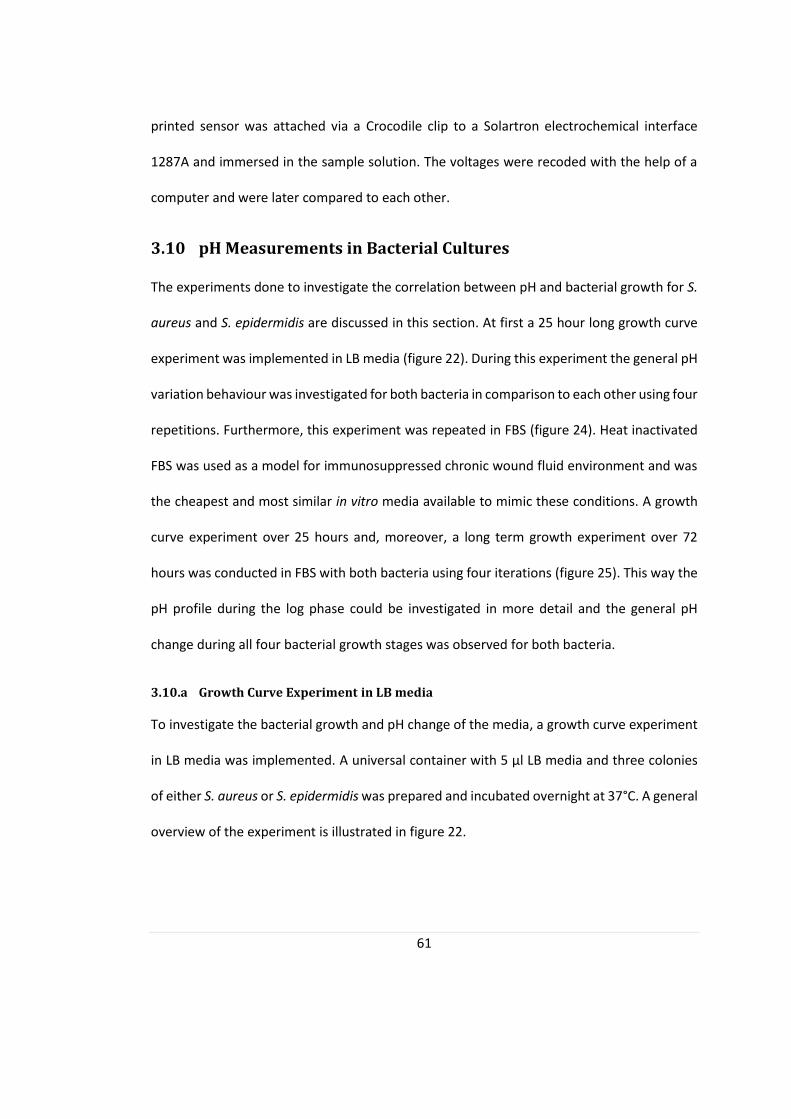
61
printed sensor was attached via a Crocodile clip to a Solartron electrochemical interface
1287A and immersed in the sample solution. The voltages were recoded with the help of a
computer and were later compared to each other.
3.10 pH Measurements in Bacterial Cultures
The experiments done to investigate the correlation between pH and bacterial growth for S.
aureus and S. epidermidis are discussed in this section. At first a 25 hour long growth curve
experiment was implemented in LB media (figure 22). During this experiment the general pH
variation behaviour was investigated for both bacteria in comparison to each other using four
repetitions. Furthermore, this experiment was repeated in FBS (figure 24). Heat inactivated
FBS was used as a model for immunosuppressed chronic wound fluid environment and was
the cheapest and most similar in vitro media available to mimic these conditions. A growth
curve experiment over 25 hours and, moreover, a long term growth experiment over 72
hours was conducted in FBS with both bacteria using four iterations (figure 25). This way the
pH profile during the log phase could be investigated in more detail and the general pH
change during all four bacterial growth stages was observed for both bacteria.
3.10.a Growth Curve Experiment in LB media
To investigate the bacterial growth and pH change of the media, a growth curve experiment
in LB media was implemented. A universal container with 5 µl LB media and three colonies
of either S. aureus or S. epidermidis was prepared and incubated overnight at 37°C. A general
overview of the experiment is illustrated in figure 22.

62
Figure 22: Growth Curve Experiment in LB. This shows the measurements done in LB media over 25
hours. The expected outcome of the bacterial growth during that time is given on the left.
A 24-well-plate (order number: 114642, Delta, Nunclon Surface) was prepared for the
experiment as shown in figure 23. All wells were filled with 1 𝑚𝑙 of liquid. 12 wells were
filled with LB media and 12 wells with phenol red coloured LB media which was used as a
control to check the consistency of the disposable pH sensor as described in 3.4.a Phenol
Red. Four of the wells containing LB media and four of the wells containing phenol red
coloured LB media were inoculated with 10 µl of the overnight bacteria culture of S. aureus
while another four wells of each were inoculated with S. epidermidis. The remaining four
wells with LB media and phenol red coloured LB media served as contamination controls.
63
Figure 23: 24-well-plate setup of the Growth curve experiment in LB media. The three columns on the
left were filled with 1 ml LB media and the three on the right were filled with phenol red coloured LB
media. The two outer most columns were inoculated with S. aureus, while the two middle columns
were inoculated with S. epidermidis. The second and fifth column serve as negative controls. The third
well in this column is filled with bubbles due to accidently pipetting air into the media. This picture was
taken four hours after the start of the experiment which is why a colour change in the S. aureus
inoculated phenol red control is visible.
The first measurement was taken straight after the inoculation of the wells and every hour
after that for the next eight hours. A stationary phase measurement was also taken 25 hours
after inoculation of the 24-well-plate.
During every measurement, a colony count and pH measurement of all four inoculated LB
media samples was executed. The following day the CFU/ml could be determined and the
collected data analysed as described in 3.6 Colony Counting.
64
3.10.b Growth Curve Experiment in FBS
The previously mentioned growth curve experiment was then repeated with FBS instead of
LB media. FBS is used to model wound fluid and the measurements will be better comparable
to the in vivo conditions of a chronic wound. A short overview of the experiment is illustrated
in figure 24.
Figure 24: Growth Curve Experiment in FBS. This shows the measurements done in LB media over 25
hours. The expected outcome of the bacterial growth during that time is given on the left
The setup of the 24-well-plate was similar to the layout of the 3.10.a Growth Curve
Experiment in LB media except FBS was used instead of LB media.
The first measurement was taken at inoculation time and every hour after that for eight
hours and 25 hours after inoculation. One measurement consisted of a colony count for both
bacteria solutions and their pH measurements. The CFU/ml could be calculated and analysed
the following day as described in section 3.6 Colony Counting.

65
3.10.c Long Term Growth Curve Experiment in FBS
A growth curve experiment typically measured the bacteria growth and pH change of about
eight hours and one stationary measurement after 25 hours. In order to see the big picture,
however, a long term growth curve experiment has to be implemented. A general overview
of the experiment is illustrated in figure 25.
Figure 25: Growth Curve Experiment in FBS. This shows the measurements done in FBS media over 72
hours. The expected outcome of the bacterial growth during that time is given on the left.
For this measurement, overnight cultures of S. aureus and one of S. epidermidis were set up
and two identical 24-well-plates were inoculated; one using S. aureus and one using S.
epidermidis. The 24-well-plate layout was designed as follows. Four wells were filled with
1 𝑚𝑙 FBS each and inoculated with either S. aureus or S. epidermidis. Another four wells
were also filled with FBS as a negative control to ensure the media is not contaminated.
Furthermore, eight wells were filled with FBS coloured phenol red with four of them also
inoculated with one of the two bacteria. These wells are being set up as a control to the pH
measurements.

66
The first measurement was taken at t=0 hours and then twice a day after inoculation for a
total of 72 hours. At every measurement, a colony count and pH measurement was carried
out. The colony counting protocol is described in section 3.6 Colony Counting.
67
4. Results
Firstly, the results of the bacterial characterisation are presented in order to get familiar with
the growth and handling of the bacteria. Secondly, the pH sensor validation results for the
use in LB media are described. Thirdly, the results for the growth curve experiment with
corresponding pH measurement in LB media and FBS over 25 hours are illustrated. And
finally, the results of a long term growth experiment in FBS over 72 hours are described to
be able to see the big picture.
4.1 Bacteria Characterisation
Colony morphology and general characteristics of S. aureus and S. epidermidis were explored
to determine relevant growth features and factors.
The results of a colony count for both bacteria strains in LB media overnight in either a
stationary 24 well plate show that S. aureus seems to grow faster than S. epidermidis. The
final colony count of the broth the following day yields the total numbers of 5.81 x 10⁸ CFU/ml
with a SE of 2.80 x 10⁸ CFU/ml for S. aureus and 2.41 x 10⁸ CFU/ml with a SE of 1.45 x 10⁶
CFU/ml for S. epidermidis. Both are expected to have reached the stationary phase.
Therefore, the maximal dilution factor for the following experiments is chosen to not exceed
10-7.
In a second characterisation experiment both bacteria were grown on MSA overnight. Figure
26 shows the MSA plate of S. aureus the following day compared to a plain MSA plate. The
colour changed from light red to yellow which is due to the phenol red content in the MSA.
This means that the pH dropped below 6.8 where the colour is yellow. This is happening
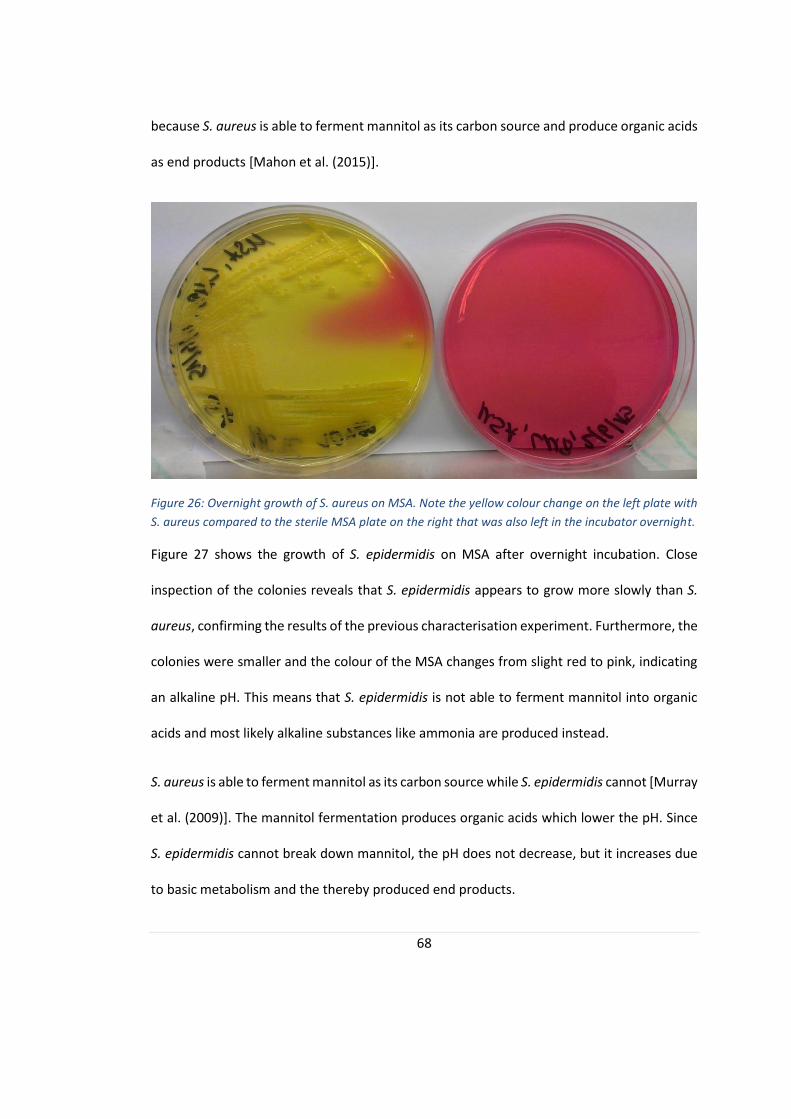
68
because S. aureus is able to ferment mannitol as its carbon source and produce organic acids
as end products [Mahon et al. (2015)].
Figure 26: Overnight growth of S. aureus on MSA. Note the yellow colour change on the left plate with
S. aureus compared to the sterile MSA plate on the right that was also left in the incubator overnight.
Figure 27 shows the growth of S. epidermidis on MSA after overnight incubation. Close
inspection of the colonies reveals that S. epidermidis appears to grow more slowly than S.
aureus, confirming the results of the previous characterisation experiment. Furthermore, the
colonies were smaller and the colour of the MSA changes from slight red to pink, indicating
an alkaline pH. This means that S. epidermidis is not able to ferment mannitol into organic
acids and most likely alkaline substances like ammonia are produced instead.
S. aureus is able to ferment mannitol as its carbon source while S. epidermidis cannot [Murray
et al. (2009)]. The mannitol fermentation produces organic acids which lower the pH. Since
S. epidermidis cannot break down mannitol, the pH does not decrease, but it increases due
to basic metabolism and the thereby produced end products.
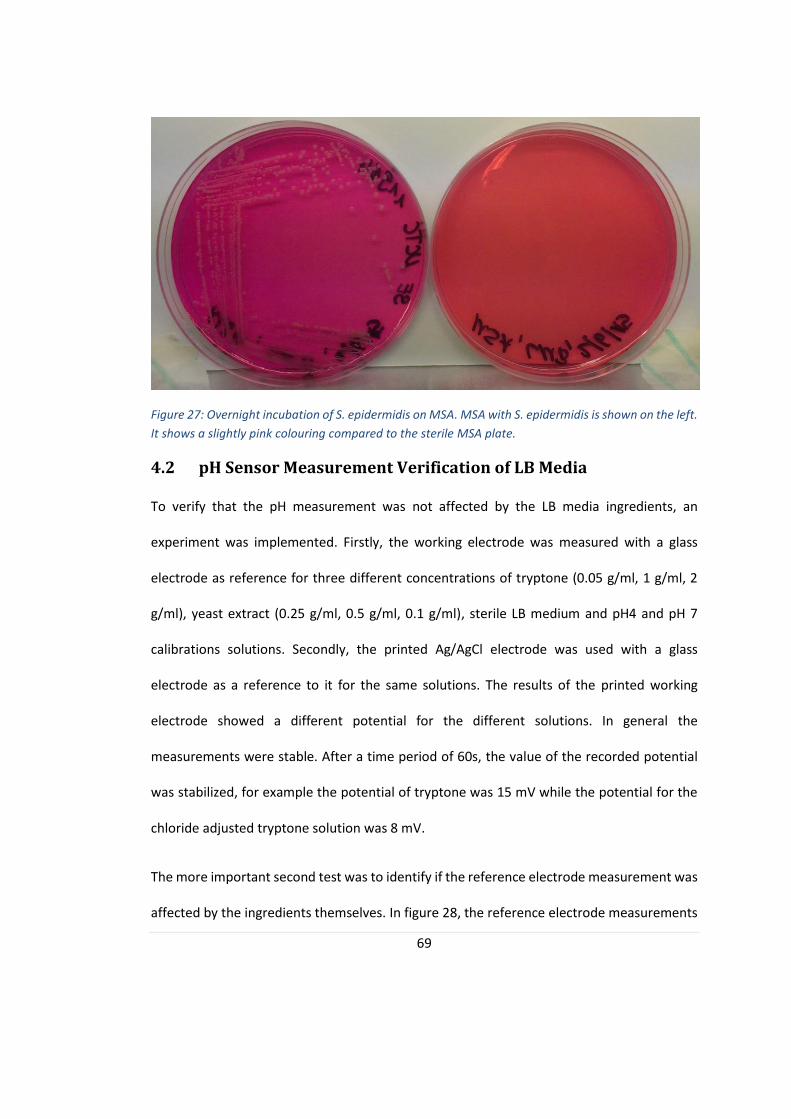
69
Figure 27: Overnight incubation of S. epidermidis on MSA. MSA with S. epidermidis is shown on the left.
It shows a slightly pink colouring compared to the sterile MSA plate.
4.2 pH Sensor Measurement Verification of LB Media
To verify that the pH measurement was not affected by the LB media ingredients, an
experiment was implemented. Firstly, the working electrode was measured with a glass
electrode as reference for three different concentrations of tryptone (0.05 g/ml, 1 g/ml, 2
g/ml), yeast extract (0.25 g/ml, 0.5 g/ml, 0.1 g/ml), sterile LB medium and pH4 and pH 7
calibrations solutions. Secondly, the printed Ag/AgCl electrode was used with a glass
electrode as a reference to it for the same solutions. The results of the printed working
electrode showed a different potential for the different solutions. In general the
measurements were stable. After a time period of 60s, the value of the recorded potential
was stabilized, for example the potential of tryptone was 15 mV while the potential for the
chloride adjusted tryptone solution was 8 mV.
The more important second test was to identify if the reference electrode measurement was
affected by the ingredients themselves. In figure 28, the reference electrode measurements
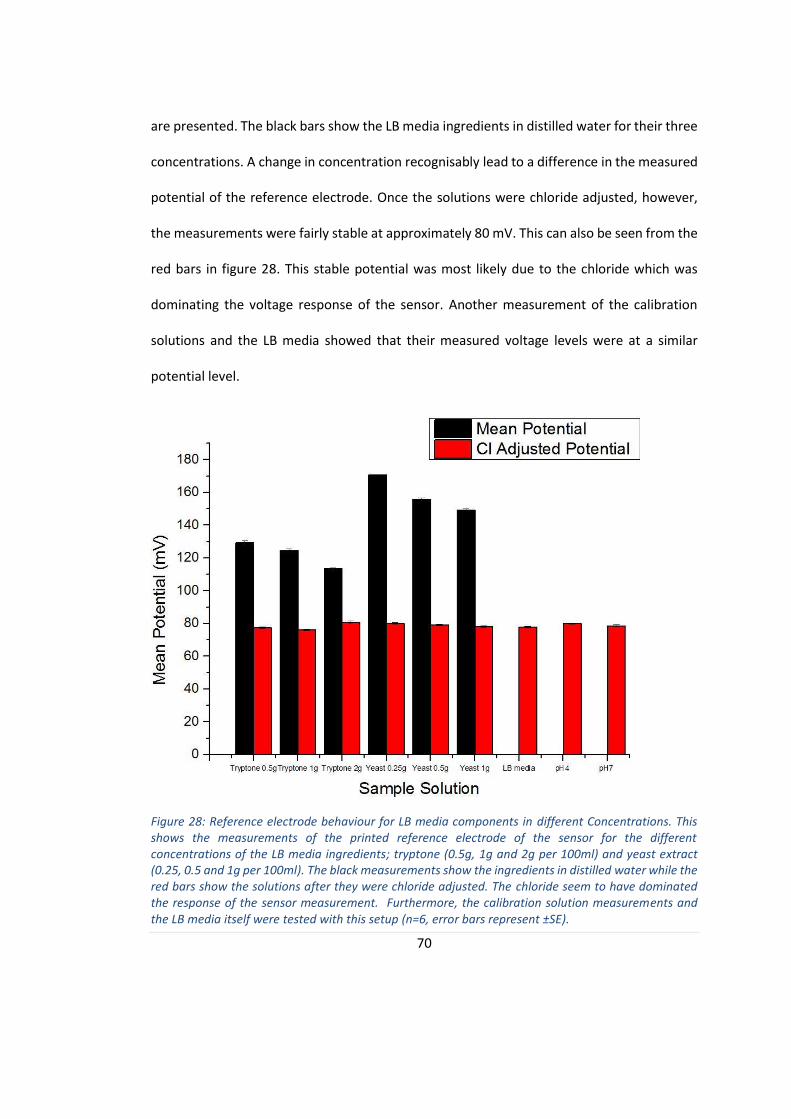
70
are presented. The black bars show the LB media ingredients in distilled water for their three
concentrations. A change in concentration recognisably lead to a difference in the measured
potential of the reference electrode. Once the solutions were chloride adjusted, however,
the measurements were fairly stable at approximately 80 mV. This can also be seen from the
red bars in figure 28. This stable potential was most likely due to the chloride which was
dominating the voltage response of the sensor. Another measurement of the calibration
solutions and the LB media showed that their measured voltage levels were at a similar
potential level.
Figure 28: Reference electrode behaviour for LB media components in different Concentrations. This shows the measurements of the printed reference electrode of the sensor for the different concentrations of the LB media ingredients; tryptone (0.5g, 1g and 2g per 100ml) and yeast extract (0.25, 0.5 and 1g per 100ml). The black measurements show the ingredients in distilled water while the red bars show the solutions after they were chloride adjusted. The chloride seem to have dominated the response of the sensor measurement. Furthermore, the calibration solution measurements and the LB media itself were tested with this setup (n=6, error bars represent ±SE).

71
These results show that the disposable sensor was compatible with LB media and the
calibration solutions did not have to be adjusted further to be used with this setup.
It should, however, be noted that the electrodes should at no point get in contact with water
at uninsulated areas of the sensor. The measurements were not stable and varied with a
range of 50 mV even after 60 seconds. If this happens at any point during an experiment, a
new, dry sensor has to be swapped with the wet one and the measurements have to be
repeated.
The sensors produced for this thesis all had similar measured calibration voltages. The mean
of the measured pH 4 Voltages was VpH4 = 0.97 V (± 0.003 SE) and of pH 7 was VpH7 = 1.27 V
(± 0.004 SE) all derived from ten separate pH calibrations of the sensors.
4.3 pH Measurements in Bacterial Cultures
In the following section, the results of the experiments investigating the pH and bacterial
growth correlation are presented. At first both bacteria were grown in LB media for 25 hours
with an hourly measurement for the first 9 hours. Afterwards the same experiment was
repeated in FBS followed by a long term growth experiment over 72 hours in FBS.
4.3.a Growth Experiment in LB Media
A growth curve and the corresponding pH values of the media were determined for S. aureus
and S. epidermidis over 25 hours. LB media was inoculated with overnight cultures (about 15
hr) of the two bacteria and hourly measurements were taken for the first eight hours of the
experiment followed by a measurement in stationary phase after 25 hours. The
measurements for S. aureus are shown in figure 29 and the ones for S. epidermidis are shown

72
in figure 30. A negative control in form of sterile LB media was included in the experiments.
The sterile LB media was stable for the entire duration of the measurement. There was one
outlaw measurement of sterile LB two hours after start of the experiment where the pH value
was as high as pH of 7.47 while the rest of the pH measurements were in a range of 6.88 and
7.07. The outliner measurement is most likely caused by differences in the sensor production
or measurement uncertainties.
S. aureus was in lag phase for the first hour of the experiment. The following log phase
continues until 25 hours after experiment’s start. In the beginning of the log phase, the
corresponding pH dropped rapidly until it reached an acidic plateau at pH 6.39 (±0.012 SE)
after 4 hours following inoculation of the media. This stands in clear contrast to the fairly
stable pH of the LB media itself. At the end of the log phase, before the bacteria growth
reached stationary phase the pH rose continuously until it reached a neutral pH of 7.04
(±0.012 SE) after 7 hours. The pH continued to rise continuously for the rest of the
experiment and reached its maximum for this experiment at 7.96 (±0.034 SE) after 25 hours.
S. epidermidis generally followed the same trend. However the pH change was less incisive.
The lag phase held on for the first two hours of the experiment until the CFU/ml increased
continuously in the log phase. During the log phase the pH of the solution also dropped to
slightly acidic levels. An acidic level plateau of pH 6.66 (±0.124 SE) forms after three hours
which is different from the pH of sterile LB media which stayed stable. The pH of the
inoculated media started rising at the end of the log phase and continuously rose in the
stationary phase. After 25 hours the maximum pH of this experiment was reached with 7.68
(±0.066 SE).

73
Figure 29: Growth curve experiment in LB media with S. aureus. The mean growth is plotted in black
corresponding to the left y-axis while the pH is plotted in blue with dashed lines corresponding to the
right y-axis. Below the graph the estimated growth phase of the bacteria is labelled and a quantitative
picture of the phenol red control is added for several time steps (n=4, error bars represent ±SE).
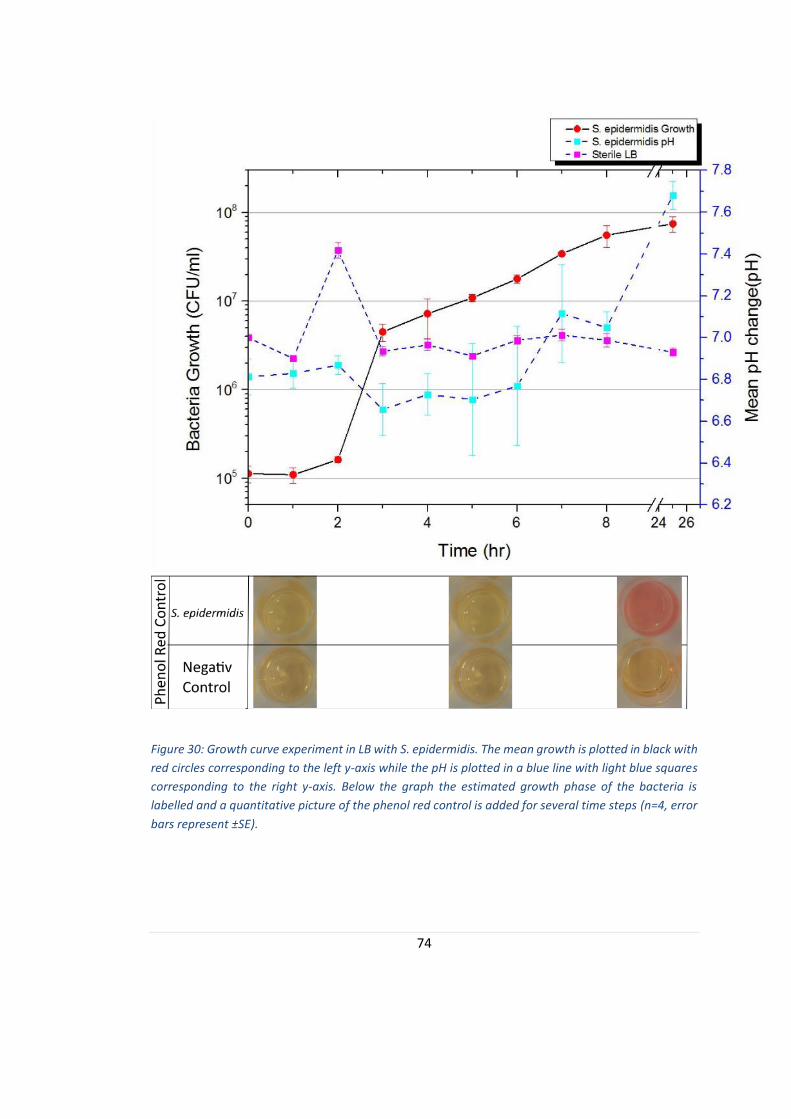
74
Figure 30: Growth curve experiment in LB with S. epidermidis. The mean growth is plotted in black with
red circles corresponding to the left y-axis while the pH is plotted in a blue line with light blue squares
corresponding to the right y-axis. Below the graph the estimated growth phase of the bacteria is
labelled and a quantitative picture of the phenol red control is added for several time steps (n=4, error
bars represent ±SE).
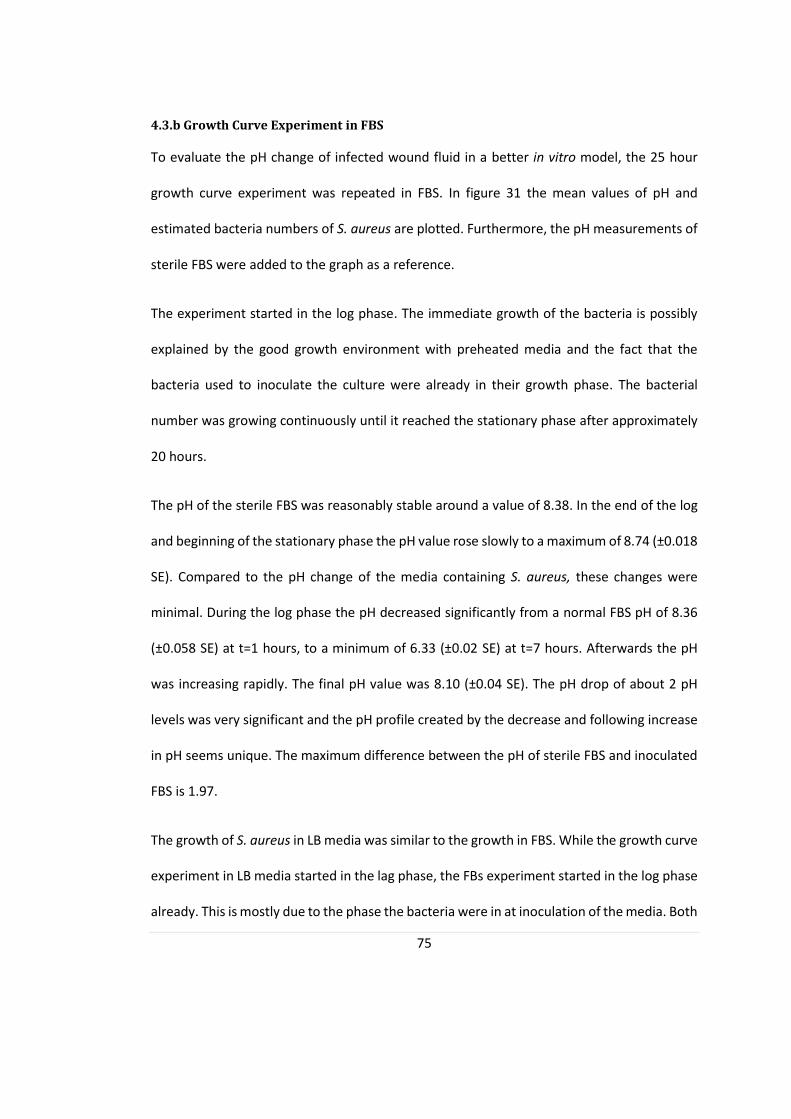
75
4.3.b Growth Curve Experiment in FBS
To evaluate the pH change of infected wound fluid in a better in vitro model, the 25 hour
growth curve experiment was repeated in FBS. In figure 31 the mean values of pH and
estimated bacteria numbers of S. aureus are plotted. Furthermore, the pH measurements of
sterile FBS were added to the graph as a reference.
The experiment started in the log phase. The immediate growth of the bacteria is possibly
explained by the good growth environment with preheated media and the fact that the
bacteria used to inoculate the culture were already in their growth phase. The bacterial
number was growing continuously until it reached the stationary phase after approximately
20 hours.
The pH of the sterile FBS was reasonably stable around a value of 8.38. In the end of the log
and beginning of the stationary phase the pH value rose slowly to a maximum of 8.74 (±0.018
SE). Compared to the pH change of the media containing S. aureus, these changes were
minimal. During the log phase the pH decreased significantly from a normal FBS pH of 8.36
(±0.058 SE) at t=1 hours, to a minimum of 6.33 (±0.02 SE) at t=7 hours. Afterwards the pH
was increasing rapidly. The final pH value was 8.10 (±0.04 SE). The pH drop of about 2 pH
levels was very significant and the pH profile created by the decrease and following increase
in pH seems unique. The maximum difference between the pH of sterile FBS and inoculated
FBS is 1.97.
The growth of S. aureus in LB media was similar to the growth in FBS. While the growth curve
experiment in LB media started in the lag phase, the FBs experiment started in the log phase
already. This is mostly due to the phase the bacteria were in at inoculation of the media. Both

76
bacteria numbers increase logarithmically until they reach their maximum number after 25
hours. The final bacteria counts for LB media were 9.4 x 10⁸ CFU/ml (±5.32 x 10⁷ SE), and
therefore slightly higher than the bacteria numbers in FBS with 2.48 x 10⁸ CFU/ml (±4.84 x
107 SE).

77
Figure 31: Growth Curve Experiment in FBS with S. aureus. The bacterial growth (black) and pH change
(blue) of S. aureus in FBS over 25 hours is measured and plotted here. As a reference the pH change of
sterile FBS (pink) was also included in this graph. Below the graph the estimated growth phase of the
bacteria is labelled and a quantitative picture of the phenol red control is added for several time steps
(n=4, error bars represent ±SE).
In figure 32 the pH of sterile media and inoculated FBS with S. epidermidis is plotted on the
right y-axis while the left y-axis shows the corresponding bacteria growth.

78
The stationary phase lasts for approximately the first two hours of the measurement until
the log phase of the bacterial growth sets in.
The pH of the media inoculated with S. epidermidis follows the pH values of sterile FBS for
the first three hours. During the log phase the pH of the inoculated media decreases slowly.
The biggest difference between the two pH values is 0.58 and it is reached after 25 hours.
The bacterial growth of S. epidermidis during the growth curve experiment in LB media and
FBS appears to be shifted. While the log phase in LB media started approximately two hours
after the experiment’s start, the log phase’s start in FBS is hard to grasp and seems to be
shifted and started only four to six hours after experiment start. The final bacterial numbers
after 25 hours were, however, very similar. For LB media the final bacterial numbers were
7.5 x 10⁷ CFU/ml (±1.52 x 10⁷ SE) and in FBS the bacterial count was 4.78 x 10⁸ CFU/ml (±4.21
x 107 SE). These results are however, not yet sufficiently proven and more studies in this area
have to be conducted.
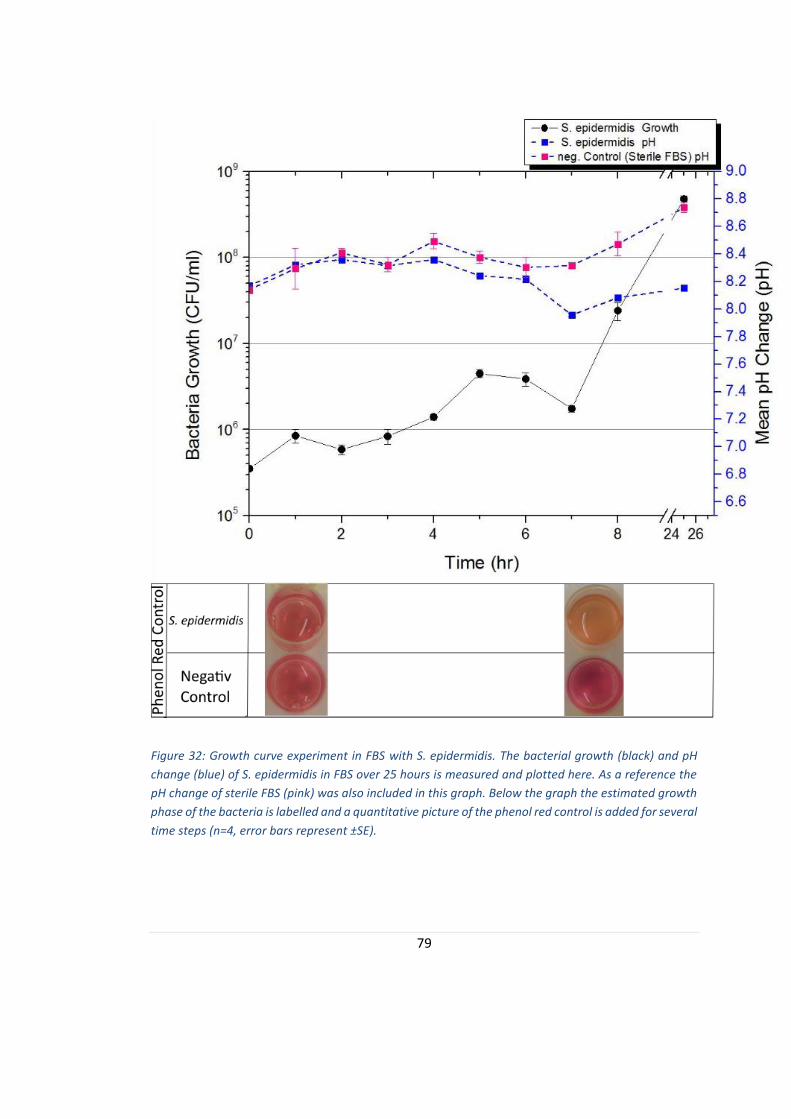
79
Figure 32: Growth curve experiment in FBS with S. epidermidis. The bacterial growth (black) and pH
change (blue) of S. epidermidis in FBS over 25 hours is measured and plotted here. As a reference the
pH change of sterile FBS (pink) was also included in this graph. Below the graph the estimated growth
phase of the bacteria is labelled and a quantitative picture of the phenol red control is added for several
time steps (n=4, error bars represent ±SE).
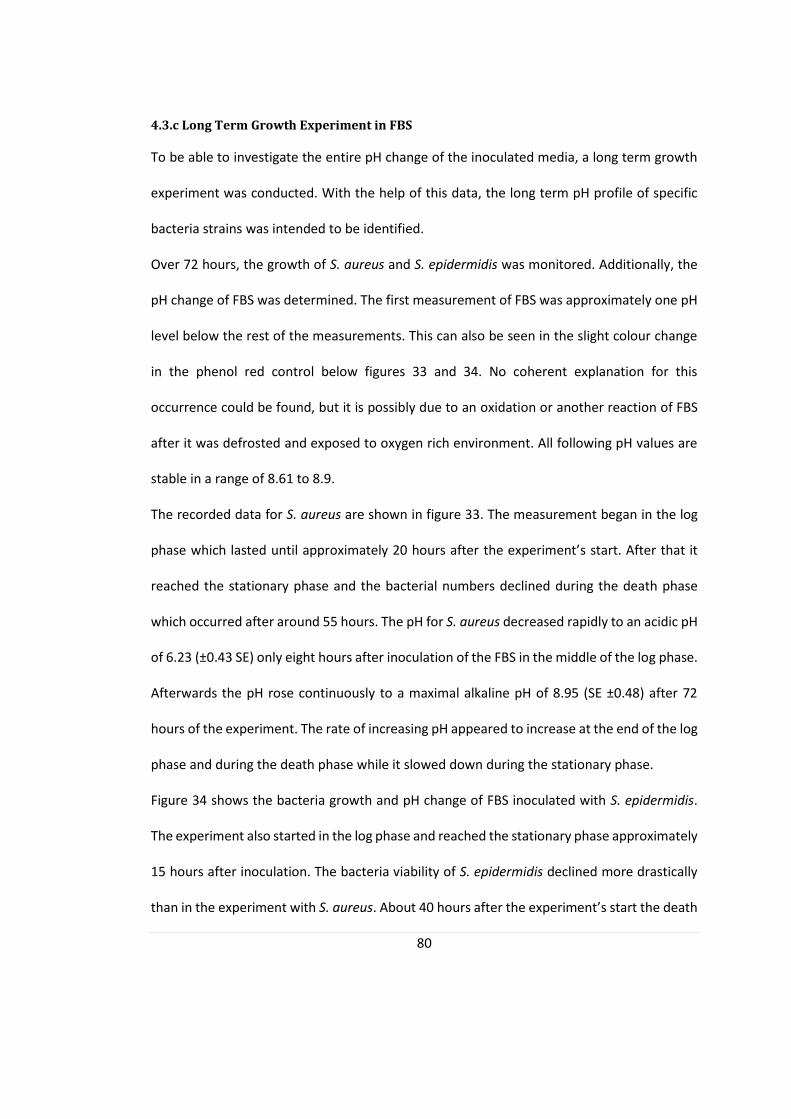
80
4.3.c Long Term Growth Experiment in FBS
To be able to investigate the entire pH change of the inoculated media, a long term growth
experiment was conducted. With the help of this data, the long term pH profile of specific
bacteria strains was intended to be identified.
Over 72 hours, the growth of S. aureus and S. epidermidis was monitored. Additionally, the
pH change of FBS was determined. The first measurement of FBS was approximately one pH
level below the rest of the measurements. This can also be seen in the slight colour change
in the phenol red control below figures 33 and 34. No coherent explanation for this
occurrence could be found, but it is possibly due to an oxidation or another reaction of FBS
after it was defrosted and exposed to oxygen rich environment. All following pH values are
stable in a range of 8.61 to 8.9.
The recorded data for S. aureus are shown in figure 33. The measurement began in the log
phase which lasted until approximately 20 hours after the experiment’s start. After that it
reached the stationary phase and the bacterial numbers declined during the death phase
which occurred after around 55 hours. The pH for S. aureus decreased rapidly to an acidic pH
of 6.23 (±0.43 SE) only eight hours after inoculation of the FBS in the middle of the log phase.
Afterwards the pH rose continuously to a maximal alkaline pH of 8.95 (SE ±0.48) after 72
hours of the experiment. The rate of increasing pH appeared to increase at the end of the log
phase and during the death phase while it slowed down during the stationary phase.
Figure 34 shows the bacteria growth and pH change of FBS inoculated with S. epidermidis.
The experiment also started in the log phase and reached the stationary phase approximately
15 hours after inoculation. The bacteria viability of S. epidermidis declined more drastically
than in the experiment with S. aureus. About 40 hours after the experiment’s start the death

81
phase occurred and the number of viable bacteria dropped almost two entire decades
compared to the bacteria count of the stationary phase.
The pH of the S. epidermidis solution already started at a slightly alkaline pH of 7.77 (SE
±0.015) and stayed mostly alkaline in a range of 7.53 to 8.55. The general trend of the S.
epidermidis pH was towards alkaline and it was mostly stable. Generally the pH change of S.
aureus was more drastic than the change of the wells inoculated with S. epidermidis.
Furthermore, it was noted that the pH profile of both bacteria were clearly different.

82
Figure 33: Long term growth curve experiment with S. aureus. S. aureus was grown in FBS for 72 hours.
One count and pH measurement was done at inoculation t=0, and every 8 and 24 hours after that. This
figure shows the plotted data of the bacterial count on the y-axis of the left in black and the measured
pH values in blue corresponding to the y-axis on the right. Below the graph the estimated growth phase
of the bacteria is labelled and a quantitative picture of the phenol red control is added for several time
steps (n=4, error bars represent ±SE).
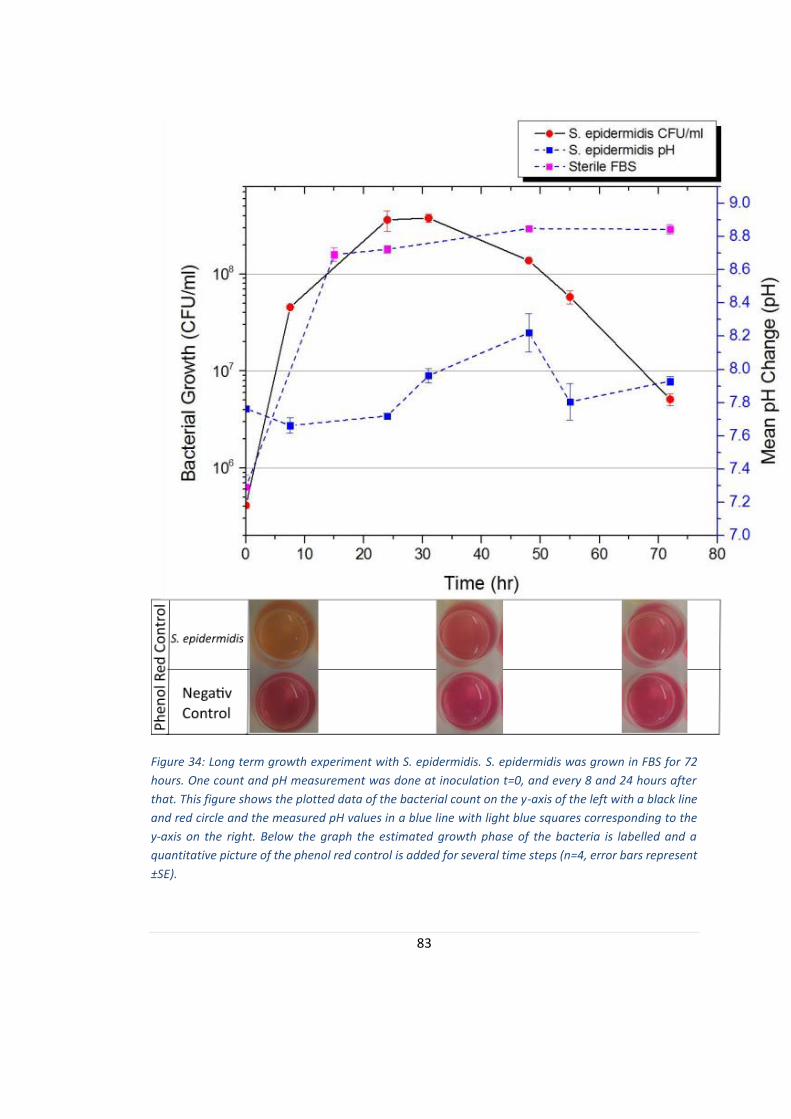
83
Figure 34: Long term growth experiment with S. epidermidis. S. epidermidis was grown in FBS for 72
hours. One count and pH measurement was done at inoculation t=0, and every 8 and 24 hours after
that. This figure shows the plotted data of the bacterial count on the y-axis of the left with a black line
and red circle and the measured pH values in a blue line with light blue squares corresponding to the
y-axis on the right. Below the graph the estimated growth phase of the bacteria is labelled and a
quantitative picture of the phenol red control is added for several time steps (n=4, error bars represent
±SE).

84
In summary, it can be said that a clear difference between the pH changing profiles
correlating with the bacterial growth of S. aureus and S. epidermidis were noted. For S. aureus
a rapid pH drop of two pH levels, followed by a pH rise to alkaline levels could be identified
as the typical pH profile of the bacteria. In contrast, the pH profile of S. epidermidis was less
obvious but follows a similar trend. The pH first also drops approximately 0.2 pH levels
followed by a rise in pH by about 0.8 pH values. Both pH profiles are differentiable which
allows bacterial infection detection and possibly strain differentiation in chronic wounds.

85
5. Discussion
In this feasibility study, the correlation between pH change and bacterial presence in
simulated wound fluid is investigated. If a link between the two can be established, chronic
wound infections can be detected early and will not further delay wound healing.
Furthermore, bacterial strains could possibly be differentiated between each other by
comparing known pH profiles helping to choose appropriate antibiotics and treatment
possibilities. Patients discomfort and antibiotic misuse could be minimised and chronic
wound healing accelerated.
The bacteria and sensor characterisation experiments showed that the serial dilutions for the
measurements will never exceed 10-7 and the disposable pH sensor is compatible with LB
media. The device was validated and can yield plausible results.
From previous studies it is known that the disposable pH sensor used in this thesis is working
accurately with physiological samples and foetal bovine serum [Milne et al. (2014)]. The
accurate working function in LB media was established in this thesis and the sensor was used
for all measurements.
A general pH profile for S. aureus and S. epidermidis has be identified during the experiments
conducted in this study. The pH trend of S. aureus is shown in figure 35. At inoculation with
the bacteria, the measured pH was similar to the media pH at around neural pH level. During
the log phase of S. aureus the pH dropped continuously about two pH levels to acidic values.
Afterwards the pH started to increase and changed from acidic over neutral to alkaline pH
values. The final pH value of the LB media measurement and the long term growth
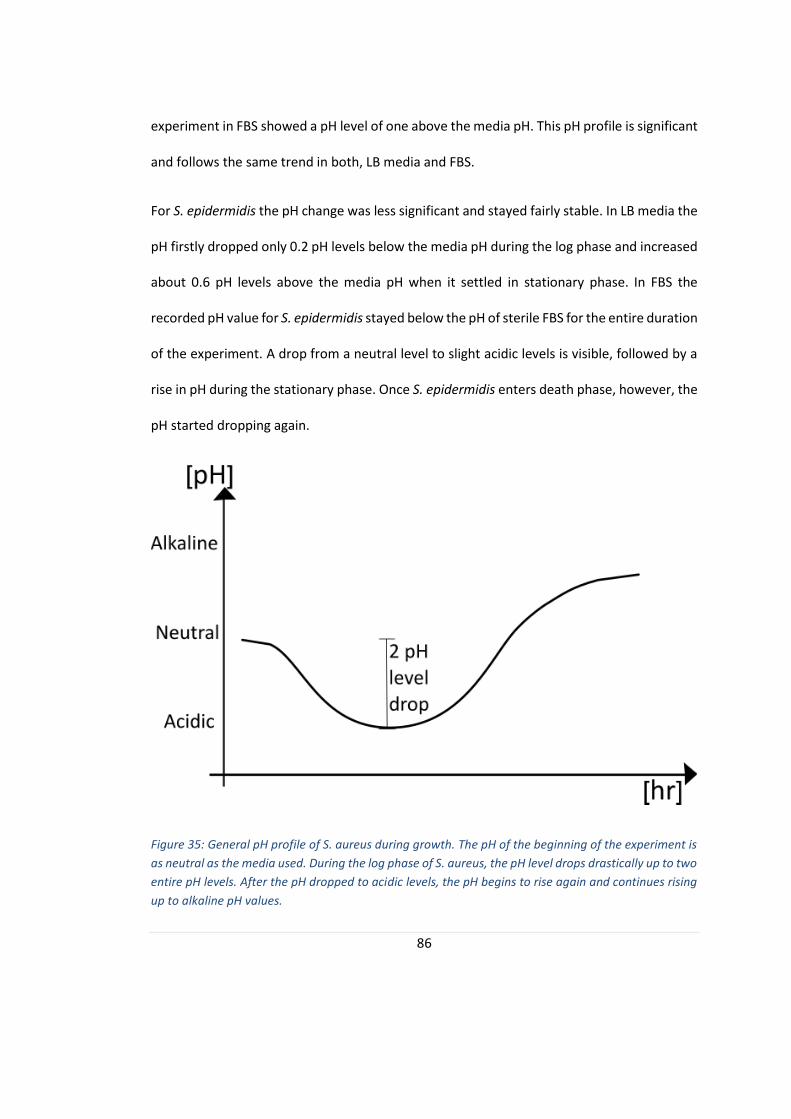
86
experiment in FBS showed a pH level of one above the media pH. This pH profile is significant
and follows the same trend in both, LB media and FBS.
For S. epidermidis the pH change was less significant and stayed fairly stable. In LB media the
pH firstly dropped only 0.2 pH levels below the media pH during the log phase and increased
about 0.6 pH levels above the media pH when it settled in stationary phase. In FBS the
recorded pH value for S. epidermidis stayed below the pH of sterile FBS for the entire duration
of the experiment. A drop from a neutral level to slight acidic levels is visible, followed by a
rise in pH during the stationary phase. Once S. epidermidis enters death phase, however, the
pH started dropping again.
Figure 35: General pH profile of S. aureus during growth. The pH of the beginning of the experiment is
as neutral as the media used. During the log phase of S. aureus, the pH level drops drastically up to two
entire pH levels. After the pH dropped to acidic levels, the pH begins to rise again and continues rising
up to alkaline pH values.

87
In the measurements with both bacteria the difference between the pH change in LB media
and FBS is visible. This could be due to the fact that LB media is buffered, which is usually the
case for any growth medium. This means that the media pH is regulated and will stay fairly
stable around a chosen pH [Mahon et al. (2015)]. It is therefore especially interesting that a
pH change in a range of 6.4 and 8.0 is detectable during the experiment. A pH drop of 2 pH
levels like in FBS for S. aureus is not to be expected in LB media. FBS, like other serums uses
protein buffers to control its pH. However, the FBS used in this study was heat inactivated.
This is the reason such a big pH change could occur during the measurements.
The pH profile of S. aureus during these experiments is unique and can be easily
differentiated from the pH profile of the negative control or of S. epidermidis. It may be
possible to differentiate different bacteria species by comparing the collected data to known
pH profiles. This is, however, not sufficiently proven and has to be further investigated.
Both bacteria profiles, however, also show similarities. For example, a pH drop followed by a
rise in pH can be detected in both bacteria even though the magnitude of the drop and rise
is different for both bacteria. It is, however, plausible to assume a similar behaviour in all
bacterial infections in chronic wounds. Recent studies showed that infected wounds
generally have a high pH which would support this claim [2, Uzun et al. (2011)].
The underlying mechanisms of the pH profile are not yet fully understood and more research
has to be conducted in that field. However, a few speculations were made, collected and are
presented in the following paragraphs.
88
The pH drop into acidic levels can possibly be explained by the bacteria metabolism and the
thereby produced acidic end products. In section 2.2.f Metabolism other metabolic pathways
are presented.
The pH drop into acidic levels can possibly be explained by the bacteria metabolism and the
thereby produced acidic end products. In section 2.2.f Metabolism other metabolic pathways
are presented. The pH drop could also occur from increased proton efflux out of the bacteria.
The following pH rise of the bacteria is more difficult to explain through traditional metabolic
pathways, and could be caused by other bacterial mechanisms. A possible explanation is that
the bacteria gene expression is altered due to exposure to an acidic environment. The so-
called Mild Acid Stimulation (MAS), further explained in 2.2.f Metabolism, is thought to cause
a gene expression alteration in order for the bacteria to adapt to the new environment. A
study from Weinrick et al. (2004) found that S. aureus produced acidic end products which
lowered the media pH two entire pH levels when the gene expression of S. aureus adapted
to the acidic pH via MAS and altered its gene expression accordingly. The study further
suggests that a pH change similar to the one found is likely to be a defence mechanism. Only
bacteria able to adapt to such big pH changes can be found in the infected wounds, while
bacteria incapable of this response will be terminated [Weinrick et al. (2004)].
A more drastic way of gene expression alteration is the Acid Tolerance Response (ATR) [Rode
et al. (2010)]. Bacteria might try to regulate their cytoplasmic pH and adapt their metabolism
accordingly. This might not only change the pH of the cytoplasm, but also the environmental
pH in the media. Furthermore, during the stationary or decline phase, bacteria lysis will spill
cytoplasm in the media which might further alter the pH. These are, however, only
89
speculations and further studies will have to investigate this behaviour in order to draw
sound conclusions.
It has to be kept in mind that all findings in this theses were discovered in vitro with FBS as
chronic wound fluid model and are only partly applicable to real in vivo environment of
chronic ulcers. An in vivo situation is always more complex due to several reactions and
cofactors within the wound area that cannot be simulated in a simplified in vitro experiment.
One major point is the presence of far more proteins and microorganisms in the wound site
and blood. The FBS used was heat treated through which many microorganisms were
inactivated and proteins were denatured. Furthermore, it has to be noted that the protein
presence in chronic wounds is decreased compared to normally healing wounds, but once
the wound started healing the protein amount present in the wound fluid increases which is
not simulated by FBS [Gethin et al. (2008)]. A chronic wound is colonized by several bacteria
species and the wound fluid is filled of enzymes like proteases and other proteins including
various growth factors [Wysocki et al. (2012), Wolcott et al. (2009), Shai et al. (2005) and
Schneider et al. (2007)]. The proteins present in chronic wounds can also serve as pH buffers
for the wound fluid, making it more difficult for the produced substances to change the pH
within the wound site.
The pH measurements change with temperature [Puchberger-Enengl et al. (2012)]. This is
why the temperature of the wound will have to be assessed as a second parameter if the
wearable pH sensor is integrated in wound dressings. A typical infection sign is a rise in
temperature at the wound site [Puchberger-Enengl et al. (2012)]. This would however,
change the measured pH of the wound and would further influence the conclusions about
90
the measurements even though any change can be compensated with an equation. A multi
parameter sensor including pH, temperature and other relevant parameters, for example
moisture, is a promising technique for sufficient, continuous wound assessment without
additional stress for the wound site in form of wound dressing removal.
More research will have to be done to determine if a chronic wound environment is aerobic
or anaerobic. Depending on this the metabolism and end products of the bacteria will vary
and the measured pH could be invalid with the current technique. The Bohr-effect that was
mentioned in 2.2.f Metabolism helps to supply a healing wound with more oxygen due to its
low pH. If a wound is, however, infected or is already chronic, the oxygen supply will be
limited. Consistent conditions and wound dressings should be used for further in vivo studies.
Another big difference between the in vitro and in vivo situation is the variation of wound pH
and bacterial growth due to wound dressings. Wound dressings have two ways of influencing
the pH change in the wound; actively and passively. The choice of wound dressings is wide
and ranges from acidic over impermeable to silver dressings. While acidic wound dressings
influence the wound fluid pH actively, silver and impermeable bandages manipulate the pH
only passively.
Acidic wound dressings are designed to actively lower the wound pH and try to promote
wound healing that way [Schneider et al. (2007), Gethin et al. (2008)]. This will interfere with
the original pH change in the wound fluid and might dominate the pH profile of the wound
from the point of application. It has to be tested if the pH change profile of bacterial infection
is detectable under these conditions or if it is impossible to combine the two principles.

91
Silver dressings have been shown to inhibit bacterial growth in the wound [Percival et al.
(2014), Uzun et al. (2011)]. However, most modern wound dressings have one or another
antimicrobial substance in them to avoid microbial growth in wounds [Uzun et al. (2011)].
Minimizing the amount of bacteria in the wound site translates to fewer end products
produced during the metabolism which would have otherwise change the pH. Furthermore,
it should be noted that the silver dressings are more effective at acidic pH values of 5.5 rather
than at neutral pH of 7 or alkaline pH values [Uzun et al. (2011)].
Wounds where non-permeable wound dressings were used have a more acidic milieu than
wound with permeable dressings [Schneider et al. (2007)]. This situation touches the
previously discussed anaerobic or micro aerophilic environment. A bacteria’s metabolism
changes from the more energy efficient respiration to fermentation in anaerobic
environment. In 2.2.g Metabolism the possible fermentation pathways were shown and it
can be seen that most of them produce acidic end products which would explain the
acidification of the wound for non-permeable wound dressings.
A modern technique of chronic wound treatment is vacuum dressing [Pruksapong (2011)]. It
is nowadays mostly practiced on in-bed patients but is currently implemented in an efficient
portable vacuum dressing for out-patients [Pruksapong (2011)]. The metabolism of the
bacteria is altered in vacuum and further research of bacterial pH profiles has to be
conducted in vacuum to decide if the pH profile of the wound can still be linked to bacterial
contamination and, therefore, both techniques are compatible.

92
6. Future Directions
More research will have to be done with several different focus points to verify the insights
that were found in this study and deepen the knowledge about it.
Different bacteria strains should be tested in growth curve experiments to identify their pH
profile and verify the assumption that bacteria presence will increase the pH of FBS and
chronic wounds. An interesting bacteria to investigate would be typical pathogens of chronic
wound infections including P. aeruginosa. Once more bacteria would have been tested, their
pH profile could be compared to each other and it can be evaluated if the pH profile yields
enough information to differentiate between different bacterial species.
The effect of bacterial colonisation and multiple bacterial strains present in the same wound
gives rise to the question whether the bacteria inhibit each other and control their growth
rates during growth phase as they do when they are in equilibrium on the skin surface.
The pH profile during healing and the question why chronic wounds develop should also be
investigated further in order to draw decisive conclusions relating to pH change in wounds.
As already mentioned in 5. Discussion, the pH profile measurements should be carried out in
vivo in order to verify the results gained in this in vitro study. Furthermore, it should be
investigated whether the wound environment is aerobic or anaerobic and what effect
different wound dressings have. The use of different wound dressings has the potential to
disrupt the natural pH change with infection and alter the bacterial response during growth.
Finally, it would be interesting to investigate if the infection detection technique according
to the pH profile of the wound is applicable to other wounds, for example normal healing

93
wounds or burn wounds. This would broaden the scope of this technique and would be
beneficial in all applicable fields to detect bacterial infection as early as possible.

94
7. Conclusion
In this study the correlation between bacteria presence and pH was investigated. The
necessary knowledge about normal wound healing, chronic wound, normal pH change in
wounds and bacterial behaviour, growth and metabolism was presented for better
understanding of the discussion of the results. Growth curve experiments of S. aureus and S.
epidermidis were implemented in LB media and FBS over 25 hours. Moreover, one long term
growth experiment over 72 hours was conducted to see the longer term changes in pH.
During these experiments a unique pH profile for both bacteria compared to each other and
compared to the negative control could be found. At first the pH of both bacteria dropped
from neutral to acidic which was followed by a rise in pH into alkaline levels at the end of the
log phase. Further research is required to confirm these results with other bacteria and, more
importantly, in vivo. More research objectives are given in 6. Future Directions.
The in this study investigated pH sensor offers great opportunities in chronic wound
treatment. Once the pH profile can be approved and bacterial infections in chronic wounds
are shown to follow a similar detectable pH profile as the one found in this study, the pH
sensor technology can be integrated into wound dressings. It is possible to include the pH
measurement in a multi-parameter sensor included in wound dressings to continuously
measure wound parameters. This way further trauma to the wound due to dressing removal
can be reduced which saves patient from unnecessary pain and discomfort, bacterial
infections can be identifies and treated before they become critical and delay the wound
healing.

95
It is also imaginable that this technology can be adapted for critical bacterial count detection
in burn wounds or even normally healing wounds. This would widen the scope of the
application possibilities even further incentivising continued research.
96
8. Reference
|A|B|S| Initiative Deutschland. 2011. Antibiotic Stewardship. As on 23.04.2015,
http://www.antibiotic-stewardship.de/cms/
Amirmorteza Ebrahimzadeh Namvar et al., 2014. Clinical characteristics of Staphylococcus
epidermidis: a systematic review. GMS Hygiene and Infection Control, 9(3).
Booth, I. R., 1985. Regulation of Cytoplasmic pH in Bacteria. Microbiology Reviews, 49,
pp.359-378.
Broughton, et al., 2006. Wound Healing: An Overview. Plastic & Reconstructive Surgery, 117,
pp.7s
Burmølle, M., Thomsen, T., 2010. Biofilms in chronic infections- a matter of opportunity -
monospecies biofilms in multispecies infections. FEMS Immunol Med Microbiol, 59, pp.324–
336.
Chandan K. S., Gordillo, G. M., Sashwati, R., et al., 2009. Human skin wounds: A major and
snowballing threat to public health and the economy. Wound Repair and Regeneration, 17
(6), pp.763–771.
Dargaville, T., et al., 2013. Sensors and imaging for wound healing: A review. Biosensors and
Bioelectronics, 41, pp.30–42.
Drew, P., Posnett, J., Rusling, L., 2007. The cost of wound care for a local population in
England. Int Wound J. 4 (2), pp.149–155.
Donelli, G., 2014. Biofilm-based Healthcare-associated Infections. 2nd edition Springer, pp.29-
32
Elliott, T., et al., 2011. Medical Microbiology and Infection. 5th edition. Wiley-Blackwell.
Oxford
97
Fazli, M., Bjarnsholt, T., et al., 2009. Nonrandom distribution of Pseudomonas aeruginosa
and Staphylococcus aureus in chronic wounds. J Clin Microbiol, 47,pp.4084–4089.
Ford, M., et al., 2010. Medical Microbiology. 2nd edition. Oxford.
Foulston, L., et al., 2014. The Extracellular Matrix of Staphylococcus aureus Biofilms
Comprises Cytoplasmic Proteins That Associate with the Cell Surface in Response to
Decreasing pH. MBIO, 5, e01667-14
Gethin, G. T., Cowman, S., Conroy, R. M., 2008. The impact of Manuka honey dressings on
the surface pH of chronic wounds. International Wound Journal, 5, pp.185-194.
Gosain, A., DiPietro, L.A., 2004. Aging and wound healing. World J Surg, 28, pp.321-326.
Halbert, A.R., Stacey, M.C., Rohr, J.B., Jopp-McKay, A., 1992. The effect of bacterial
colonization on venous ulcer healing. Australas J Dermatol, 33, pp.75-80.
Hansson, C., Faergemann, J., 1995. The effect of antiseptic solutions on microorganisms in
venous leg ulcers. Acta Dermato Venereologica, 75, pp.31-33.
Herigstad, B., et al., 2001. How to optimize the drop plate method for enumerating bacteria.
Journal of Microbiological Methods, 44, pp.121-129
Hostacka, A., Ciznar, I., Stefkovicova, M., 2010. Temperature and pH Affect the Production of
Bacterial Biofilm. FOLIA MICROBIOLOGICA, 55, pp.75-78.
International Diabetes Federation, International Diabetes Federation Annual Report 2013,
2014, as on 3.03.2015, http://www.idf.org/sites/default/files/attachments/IDF-AR2013-
final.pdf
Kang, C., Song, J., Soo Ko, K., Chung, D. R., Ran Peck, K., 2011. Clinical features and outcome
of Staphylococcus aureus infection in elderly versus younger adult patients. International
Journal of Infections Diseases, 15, pp.E58-e62.

98
Keith, F., et al., 2004. Criteria for Identifying Wound Infection — Revisited. British Journal of
Community Nursing, 9(3), pp.S6–S16. http://www.o-wm.com/content/criteria-identifying-
wound-infection-%E2%80%94-revisited
Löffler et al., 2013. Wound Fluid in Diabetic Foot Ulceration: More Than Just an Undefined
Soup? International Journal of Lower Extremity Wounds.,12 (2), pp.2 113-129.
Margolis D.J., Malay D.S., Hoffstad O.J., et al., 2011. Economic burden of diabetic foot ulcers
and amputations: Data Points #3. 2011 Mar 8. In: Data Points Publication Series [Internet].
Rockville (MD): Agency for Healthcare Research and Quality (US). Available from, as on Mar.
8th: http://www.ncbi.nlm.nih.gov/books/NBK65152/
Mahon, C.R., et al., 2015. Diagnostic Microbiology. 5th edition. Saunders Elsevier. Missouri.
Pp.10-17, 25-35, 112, 127-137, 169-171, 315-327, 752-764, 804-834.
Mahon, C. R., Lehman, D. C., Manuselis, G., 2015. Textbook of Diagnostic Microbiology. 5th
edition. Saunders Elsevier. Maryland Hights.pp.13-18, 32-33, 314-327, 752-764, 804-834.
McArdle, C., Lagan, K. M., McDowell, D. A., 2014. The pH of wound fluid in diabetic foot
ulcers- the way forward in detecting clinical infection?. Current Diabetes Reviews, 10,
pp.177-181.
Mehmood, N., Hariz, A., Fitridge, R., Voelcker, N. H., 2014. Applications of modern sensors
and wireless technology in effective wound management. J Biomed Mater Res Part B,102B,
pp.885–895.
Michael B., et al., 2015. Current wound healing procedures and potential care, Materials
Science and Engineering: C, 48, pp.651-662., http://dx.doi.org/10.1016/j.msec.2014.12.068
Michael, T., et al., 2002. Brock Microbiology. 12th ed., New York: Pearson Education, pp.28,
447, 415, 904.

99
Milne, S.D., Connolly, P., Hamad H. A., Seoudi, I., 2014. Development of Wearable Sensors
for Tailored Patient Wound Care. Conf Proc IEEE Eng Med Biol Soc, pp.618-21
Muller, M., Trocme, C., Lardy, B., Morel, F., Halimi, S.,Benhamou, P. Y., 2007. Matrix
Metalloproteinases and diabetic foot ulcers: the ratio of MMP-1 to TIMP-1 is a predictor of
wound healing. Diabetic Medicine, 25, pp.419-426.
Murray, P. R., et al., 2009. Medical Microbiology. 6th edition. Mosby Elsevier. Philadelphia.
Pp.23-38, 157-224.
Mustoe, T.A., O'Shaughnessy, K., Kloeters, O., 2006. Chronic wound pathogenesis and current
treatment strategies: a unifying hypothesis. Plast Reconstr Surg. 117(7), pp.35S-41S.
NHS choices, analysed by Bazian. 2015. New blood test could help prevent antibiotic misuse.
As on 23.04.2015, http://www.nhs.uk/news/2015/03March/Pages/New-blood-test-could-
help-prevent-antibiotic-misuse.aspx
NHS. 2015. Staphylococcal infections. As on 24.04.2015,
http://www.nhs.uk/conditions/Staphylococcal-infections/Pages/Introduction.aspx
Ono, S., Imai, R., Ida, Y., Shibata, D., Komiya, T., Matsumura, H., 2015. Increased wound pH
as an indicator of local wound infection in second degree burns. Burns, 41, pp.820-824.
Percival, S. L., McCarty, S., Hunt, J., et al., 2014. The effects of pH on wound healing, biofilms,
and antimicrobial efficacy. WOUND REPAIR AND REGENERATION,22, pp.174-186.
Pruksapong, C., 2011. Efficacy of portable vacuum dressing in chronic wound care: a
prospective randomized control trial. J Med Assoc Thai, 94(10), pp.1212-7.
Public health England. 2013 Bacteria Collection: Staphylococcus aureus. https://www.phe-
culturecollections.org.uk/products/bacteria/detail.jsp?refId=NCTC%2010788&collection=nc
tc, as on 20.07.2015
100
Public health England. 2013, Bacteria Collection: Staphylococcus epidermidis.
http://www.phe-
culturecollections.org.uk/products/bacteria/detail.jsp?refId=NCTC+11964&collection=nctc,
as on 20.07.2015
Puchberger-Enengl, D., et al., 2012. Characterisation of a multi-parameter sensor for
continuous wound assessment. Procedia Engineering, 47, pp.985-988.
Ramsel, H. H., 1961. Endogenous Respiration of Staphylococcus aureus. J. Bacteriol, 83,
pp.507-514.
Rode, T. M., Møretrø, T., et al., 2010. Responses of Staphylococcus aureus to Environmental
Stresses. Responses of Staphylococcus aureus to Environmental Stresses, 17, pp.509-546.
Rode, T. M., Møretrø, T., et al., 2010. Responses of Staphylococcus aureus exposed to HCl
and organic acid stress. Canadian Journal of Microbiology, 56(9), pp.777-792.
Schneider, L. A., Korber, A., Grabbe, S., Dissemond, J., 2007. Influence of pH on wound-
healing: a new perspective for wound-therapy?. Arch Dermatol Res, 298, pp.413-420.
Schröter, A., Walther, A., et al., 2012. Infection monitoring in wounds. Procedia Chemistry,
6, pp.175-183.
Sen, C.K., Gordillo, G.M., Roy, S., et al., 2009. Human Skin Wounds: A Major and Snowballing
Threat to Public Health and the Economy. Wound repair and regeneration : official
publication of the Wound Healing Society [and] the European Tissue Repair Society. 17(6),
pp.763-771.
Shai, A., Maibach, H. I., 2005. Wound healing and ulcers if the skin: Diagnosis and Therapy –
The practical Approach. 1st edition. Springer. Berlin Heidelberg
101
Shi, L., Ramsay, S., et al., 2011. pH in the Bacteria-Contaminated Wound and Its Impact on
Clostridium histolyticum Collagenase Activity. J Wound Ostomy Continence Nurs., 38(5),
pp.514-521.
Spicer, W. J., 2000. Clinical bacteriology, mycology and parasitology. Edinburgh; New York :
Churchill Livingstone, pp.3, 28-31.
Stokes, E., et al., 1987. Clinical microbiology. 7th ed. London : Edward Arnold 1987. Pp.96,
100,101,105-110
Strasters, K. C., Winkler, K. C., 1963. Carbohydrate Metabolism of Staphylococcus aureus. J.
gen. Microbiol, 33, pp.213-229.
Strelkauskas, S., Strelkauskas, J., Moszyk-Strelkauskas, D., 2010. Microbiology, a clinical
approach. 1st edition. Garland Science. New York
Suleman, 2015. Biofilm-based Healthcare-associated Infections, Volume II (831), pp.29-43.
Thomsen, T. R., Aasholm, M. S., Rudkjøbing, V. B., Saunders, A. M., Bjarnsholt, T., Givskov,
M., Kirketerp-Møller, K. and Nielsen, P. H., 2010. The bacteriology of chronic venous leg ulcer
examined by culture-independent molecular methods. Wound Repair and Regeneration, 18,
pp.38–49.
Trengrove, N. J., Stacey, M. C., et al., 1999. Analysis of the acute and chronic wound
environments: the role of proteases and their inhibitors. Wound repair and regeneration,
7(6), pp.442-452.
Uccioli, L., Izzo, V., Meloni, M., Vainieri, E., Ruotolo, V., Giurato, L., 2015. Non-healing foot
ulcers in diabetic patients: general and local interfering conditions and management options
with advanced wound dressings. Journal of wound care, 24(4), pp.35-42.
102
Uzun, M., Anand, S. C., Shah, T., 2011. Study of the pH and physical performance
characteristics of silver-treated absorbent wound dressing. Journal of Industrial Textiles,
42(3), pp.231-243.
Weinrick, B., Dunman, P. M., McAleese, F., Murphy, E., Projan, S. J., Fang, J., Novick, R. P.,
2004. Effect of Mild Acid on Gene Expression in Staphylococcus aureus. Journal of
Bacteriology, pp.8407-8423.
Wild, T., Rahbarnia, A., et al., 2010. Basics in nutrition and wound healing. Nutrition, 26,
pp.862-866.
Wolcott, R.D., Gontcharova, V., Sun, Y., Dowd, S.E., 2009. Evaluation of the bacterial diversity
among and within individual venous leg ulcers using bacterial tag-encoded FLX and titanium
amplicon pyrosequencing and metagenomic approaches. BMC Microbiol, 9, pp.226.
Wysocki, A. B., et al., 2012. Proteolytic Activity by Multible Bacterial Species Isolated From
Chronic Venous Leg Ulcers Degrades Matrix Substances. Biological Research for Nursing,
15(4) pp.407-415.
Yosipovitch, G., Howard, I., et al., 1996. Skin Surface pH: A Protective Acid Mantle. Cosmetics
& Toiletries magazine, 111(12), pp.101