Embed Size (px)
Citation preview
Personal use of this material is permitted. Permission must be obtained for all other uses, in any current or future media, including reprinting/republishing this material for advertising or promotional purposes, creating new collective works, for resale or redistribution to servers or lists, or reuse of any copyrighted component of this work in other works.
AN EXTRAMEDULLARY THREE DEGREE OF FREEDOM LIMB DEFORMITY CORRECTION DEVICE FOR PEDIATRIC APPLICATIONS
Sarah M. Esser Mechanical Engineering
University of Wisconsin-Madison Madison, WI, U.S.A.
Nathaniel J. Vlietstra Mechanical Engineering
University of Wisconsin-Madison Madison, WI, U.S.A
Daniel P. Farley Mechanical Engineering
University of Wisconsin-Madison Madison, WI, U.S.A
Aditya Medicherla
Mechanical Engineering University of Wisconsin-Madison
Madison, WI, U.S.A.
Scott A. Sokn Biomedical Engineering
University of Wisconsin-Madison Madison, WI, U.S.A.
Caitlyn J. Collins Mechanical Engineering
University of Wisconsin-Madison Madison, WI, U.S.A
James J. McCarthy, MD
Pediatric Orthopaedic Surgery Cincinnati Children’s Hospital
Cincinnati, OH, U.S.A
Heidi-Lynn Ploeg, Ph.D. Mechanical Engineering
University of Wisconsin-Madison Madison, WI, U.S.A.
Michael R. Zinn, Ph.D. Mechanical Engineering
University of Wisconsin-Madison Madison, WI, U.S.A.
Abstract
Thousands of children are born in the United States annually with limb deformities and leg length inequalities [1]. While many others suffer injuries or infections affecting future growth, leaving them with similar limb deformities [1]. Current tools used to treat these deformities are limited and often require prolonged use of external fixation limb deformity correction devices (LDCDs) with transcutaneous pins that cause pain, unsightly scars, and infections. Implantable lengthening LDCDs exist, but can only acutely correct angular deformity and, in some instances, have limited use in children due to concerns of growth plate injury. This paper describes the design and evaluation of a prototype LDCD which addresses these concerns. An initial 5:4 scale prototype has been manufactured, for use in design evaluation. The proposed LDCD is capable of one linear distraction and two angular correction degrees of freedom and is designed for extramedullary implantation. Device distraction is achieved through the combined movement of three racks, arranged in a triangular pattern. To meet the restrictive physical envelope requirements while still providing sufficient load capacity, a novel pseudo-differential gearing system was designed and incorporated into the device. Device validation was achieved through a combination of analytical and experimental methods including kinematic and dynamic simulation, finite element strength analysis, and experimental evaluation of a device prototype.
Keywords:
Limb-Lengthening, extramedullary, kinematics, dynamics, FEA
1 Introduction
Over 85% of the United States’ population has some form of limb length discrepancy, with 67% of those experiencing related pain [2]. Limb abnormalities, both length and angular, can be caused from a variety of sources including congenital defects, trauma, disease, and tumors. Limb lengthening and angular correction via distraction osteogenesis has been a widely accepted form of treatment of limb abnormalities for over 50 years. The process is characterized by a primary osteotomy followed by a slow separation of
2
the bone gap, which allows the bone to lengthen (and/or straighten) as it heals. External fixation frames and intramedullary nails are the two most prevalent methods employed in distraction osteogenesis. Yet despite years of innovation both types of devices still suffer from high failure rates, with less than 60% of patients achieving the preoperative intended results [3]. In addition, patient selection factors, such as bone canal size and unfused growth plates, limit the patient group capable of receiving this treatment [3].
External fixation frames were pioneered in the 1970s by Dr. Gavriel Ilizarov[4, 5]. Since the creation of the Ilizarov frame, additional external fixation devices have been developed with improved characteristics including significantly less cumbersome monolateral Limb Deformity Correction Devices (LDCD) and six degree of freedom (DOF) frames capable of correcting complex limb deformities [6-8] . The most common complications in these devices are pin site infections, pin fracture, joint contracture, and muscle stiffness [9]. With 10-20% of all patients experiencing a pin track infection and pin fracture rates of 23-27% [10, 11]. In addition to pin site infection and fracture, significant scarring is observed in all patients due to transcutaneous pins which track through the skin as the device extends.
Intramedullary nails minimize the problem of pin site infection, pin fracture, and scarring, but are limited in patient selection and do little to combat joint contracture and muscle stiffness. These nails are inserted into the bone canal of the patient and lengthen either through mechanical or electrical means [12-14] . Angular correction can only be performed acutely prior to the implantation of the nail. Therefore patient selection for the device is limited by bone canal size and the presence of fused growth plates; and therefore, are often not applicable for use in adolescents and children [15].
Motorized intramedullary nails are available on the market, but due to high failure rates and patient pain, they are not a viable option at this time. The only motorized nail capable of distraction, contraction, and sophisticated rate control has a 25% failure rate [16] . Meanwhile mechanical devices which are only capable of distraction, have limited rate control which results in large distraction steps. Due to this limited control, 27% of patients required distraction under anesthesia [12].
Aside from the high infection rate, the primary complication found in distraction osteogenesis is a result of the complex, and rather poorly understood response of the soft and hard tissues to lengthening. Several studies suggest that force feedback could be used to aid in the prevention of premature consolidation and non-union of the bone callus [8, 15, 17-22].
To address these limitations the authors have developed a prototype active bone deformity correction device. The prototype device is designed to be implantable and allows for general deformity correction, including lengthening and two angular degrees of freedom. The device is applicable for use in gradual limb deformity correction in children, as well as adults. This is an implantable device that rests outside of the medullary canal of the bone, and therefore allows for use in children without concern for injury to the growth plates. The device functions much as an external fixator, but will not require exposed hardware (that leads to infection) and muscle penetration from the pins (that cause pain). Additionally, the device will not leave the dramatic scars from the pin sites as the device is placed inside the skin. It also allows for angular correction, and thus more easily accommodates the complex deformity that occurs in children. Finally, the device is equipped with dual six-axis force/torque sensors capable of measuring the full set of reaction forces and moments in real-time. The current article details the design of the proposed device, including a description of a novel compact gear mechanism and its associated kinematics. Performance
3
verification is achieved through a combination of analytical and computational modeling and functional testing of a rapid-prototyped device.
2 Materials and Methods
The device design, including design requirements, major device features, and relevant design details are described in this section. In addition, the analytical and computational tools used in device verification, including a finite element strength analysis, kinematic and dynamic modeling, and an experimental motion analysis, are described.
2.1 LDCD Design Specifications
Product design specifications were determined from literature review and surgeon interviews. An overview of the design specifications are enumerated below.
Functional and Size Requirements
A maximum total distraction of 80 mm, with a 1 mm/day extension rate and ±20° of rotation about two planes was required of the LDCD [23-25]. For the greatest success in pediatric applications the LDCD was required to fit within a 20 mm diameter by 200 mm length envelope and be installed extramedullary, using less invasive surgical techniques via two small incisions.
Figure 1: Example of Limb Deformity Correction: from left to right, first angular correction is performed, followed by a maximum 1 mm/day extension of the LDCD until the device reaches 80 mm of extension. Strength Requirements
Based upon the maximum loading conditions found in the literature, distraction forces for adult patients can reach 1000 N (directed along centerline of the bone) [18, 26, 27]. For pediatric patients, the loading
4
conditions are not well established. As such, for the LDCD described here, the pediatric patient population distraction loads are estimated to be approximately 50% of the maximum adult distraction loads (i.e. 500 N). In addition, assuming a 20 mm offset from the bone’s central axis to the centerline of the device, the moment loads applied to the device during distraction are 10 N-m (about an axis orthogonal to the long axis of the device).
Control Requirements
The device should support a distraction extension rate of 1 mm per day with a single step resolution of 0.01 mm or less and a distraction angular rate of 5.0 º per day with an angular step resolution of 0.05 º or less. Misalignment of the joint biomechanical axis by greater than 5° has been linked to osteoarthritis [28]. Therefore in order to decrease patient risk to post-operative complications the angular control of the device will be accurate to ±2.5°. In addition, the device shall be capable of actuating over its complete range of motion in 30 minutes or less (to support initial device positioning and implantation). The device should be capable of measuring reaction forces and moments (due to callus and soft tissue forces) continuously with a sample time of 1.0 second or less. While the final product version shall be fully implantable, the prototype version shall receive power and communication via a percutaneous harness.
2.2 LDCD Design Details
Device Overview
The LDCD consists of a telescoping shell mounted to a two-axis rotating end-plate (or end-effector), the combination of which provides one linear and two angular degrees of freedom (see Figure 1). Device actuation is provided by three stepper-motor driven gearhead/lead screw assemblies. The device is fixed to the bone through a pair of bone plates mounted on each end of the device. An optional six-axis force-torque sensor can be mounted between the device and bone plates to provide force and torque measurement during bone distraction. The device design details regarding motion kinematics, actuation, and the embedded force-torque sensor are given below.
Pseudo-Differential Overview
Device linear motion is supported through a telescoping shell. The shell is designed with a square cross-section to react moments about the long-axis of the device (both from actuator torque loads and un-modeled clinical loads). To minimize the overall physical envelope of the device, rolling bearings were not incorporated into the linear motion design. However, to reduce frictional forces, the shells are machined from polished 316L stainless steel with a low friction PTFE coating applied to the bearing surfaces. The linear motion axis is actuated through a lead screw (bronze, ¼”-20 RH acme nut and stainless steel powerac ¼”-20 RS rolled acme screw) which is driven by a stepper motor-gearhead drive (Faulhaber ADM 1220-V6-09, 12 mm two phase stepper motors with 6V winding and a 1024:1 gear reduction drive from Micro Motion Solutions (Clearwater, FL, USA)).
The two angular degrees of freedom are supported by a pair of intersecting rotation axes at one end of the device (see Figure 2 (c)). Device motion is described by a pair of successive rotations (i.e. pitch followed by yaw). The device pitch axis is grounded to the telescoping shell and provides rotation in the plane intersecting the central axis of the bone. The device yaw axis, which is grounded to the output frame of the pitch axis, provides rotation in the plane perpendicular to the pitch plane. The output of the yaw axis is
5
rigidly connected to the device end-plate. Both the pitch and yaw axis rotation are supported on sintered brass bearings.
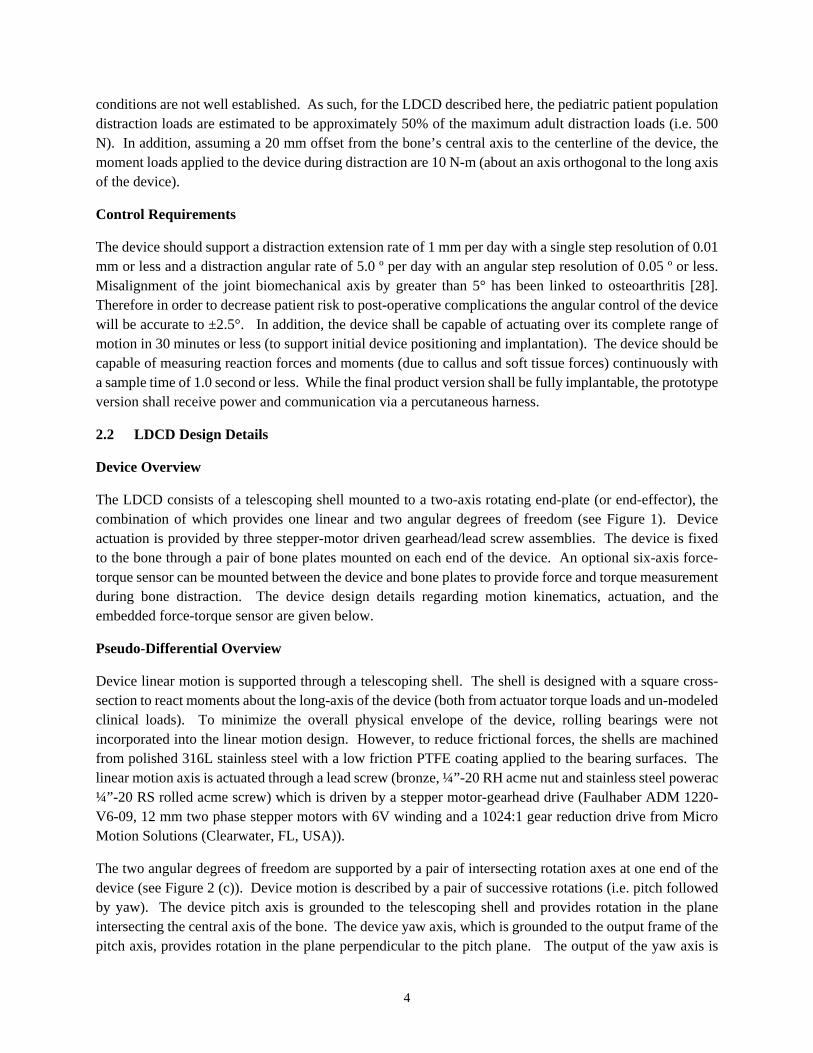
Figure 2: LDCD components. (a.) External sliding components allow for linear motion while protecting interior components (b.) Interior components (c.) close up of pseudo-differential gearing system.
Direct coupling of the actuation to the rotational axes was impractical as the long narrow physical envelope of the device limits actuator placement to lie along the centerline of the telescoping shell. As such, the actuators were arranged in a tight triangular pattern, parallel to the telescoping shell’s centerline (see Figure 2 (b)). To actuate the two successive rotational degrees of freedom (pitch and yaw) a traditional differential gear design, driven by two linear rack motion inputs, was initially considered (see Figure 3). In this case, the pitch and yaw rotation of the end-plate are a linear combination of the two linear motion (rack driven) inputs. However, this approach proved difficult to implement as the resulting gear stresses were high - due to the small physical envelope in which the gear design was restricted. To address this issue, a compact gear-train design was developed. The design allowed for the use of larger gear teeth which resulted in lower contact stresses. The gear design kinematics approximates that of a differential gear set, as the resulting pitch and yaw motions come from the combination of two linear rack-driven motion inputs.
Figure 3: Overview of Initial differential gear design.
6
However, the relationship between the input and output motions is no longer linear, as in the traditional differential design. Due to the similarity with a traditional differential gear set, we refer to this design as a pseudo-differential. An overview of the gear design is shown in Figure 2 (c).
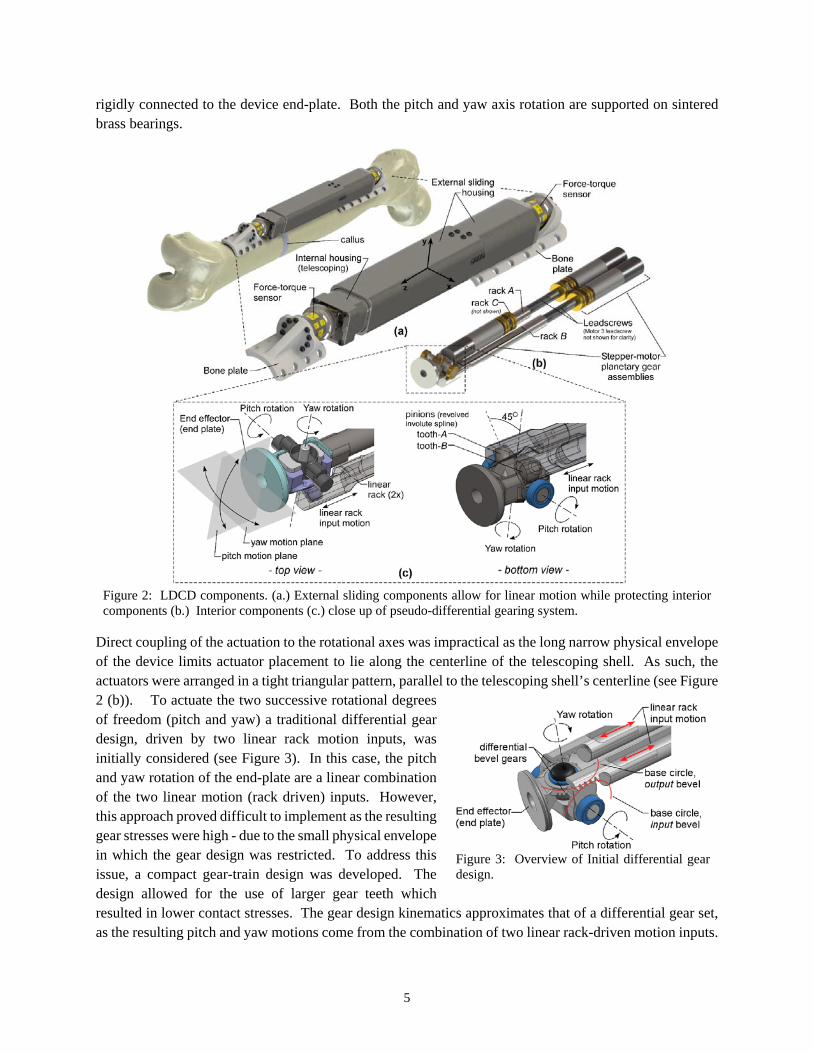
Figure 4: Overview of pseudo-differential gear design. (a) Simplified schematic of gear and end-plate kinematics, (b) bulk device rotation due to input rack linear motion.
The pseudo-differential design consists of two, rack-driven linear motion inputs. Each of the two rack inputs drives the end-plate directly through a pinion gear. Each rack-pinion gear pair enforces a single degree-of-freedom constraint as the pinion tooth makes point contact with the rack surface. The two rack-pinion constraints are sufficient to fully constrain the two-axis pitch-yaw motion of the end-plate. To reduce the amount of gear surface sliding that occurs, the pinion tooth geometry is defined by a revolved involute spline while the mating rack geometry is defined by a simple trapezoidal cross-section. The plane defined by the centerlines of the pinions is coincident with intersection of the pitch and yaw axis. The centerlines of the pinions are oriented at 45º from the yaw axis (see Figure 2 (c)). The gear design parameters are given in Figure 4(a).
7
About the nominal device position (i.e. zero pitch and yaw angle), the instantaneous kinematics relating the linear motion of the rack to the resulting pitch and yaw motion of the end-plate are identical to that of the differential gear set shown in Figure 3. However, as the device moves away from its nominal position, the kinematics deviate from this ideal (see Section 2.3). In addition, unlike the rack and pinion design in Figure 3, the involute tooth profiles of the pseudo differential will result in some sliding motion at the gear tooth interface – resulting in a reduction in gear train efficiency. While not ideal, the significant reduction in gear-train size justifies this reduction in efficiency.
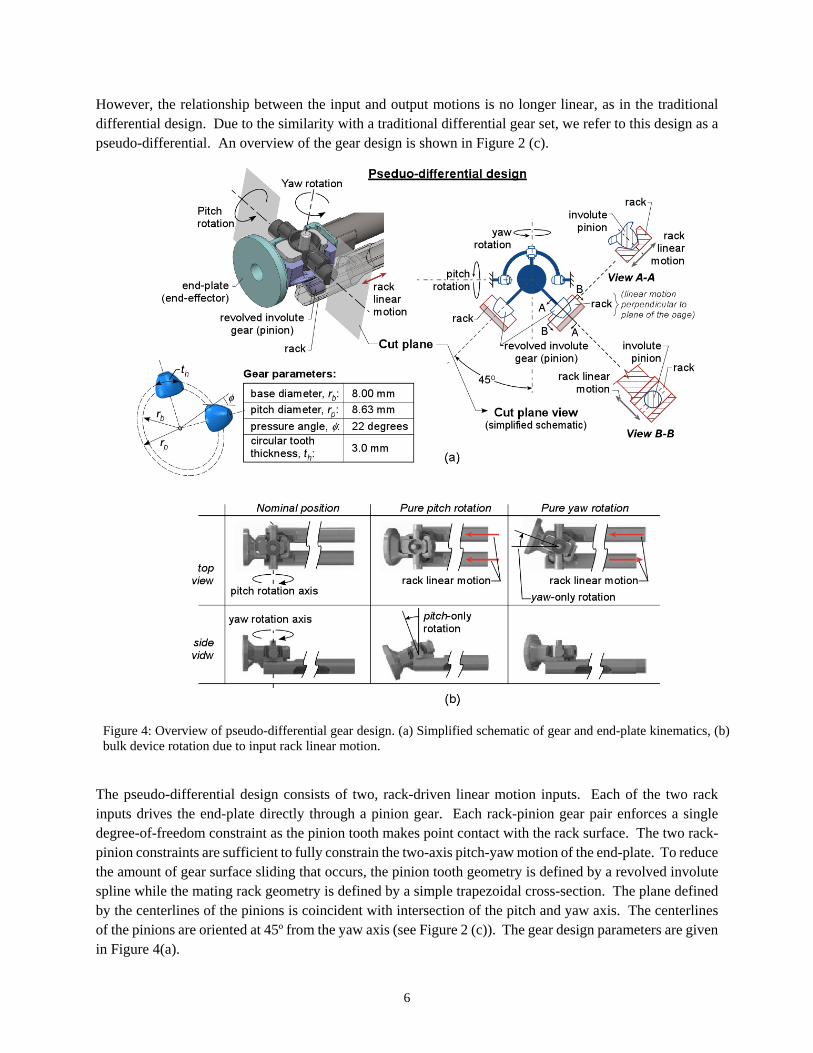
To better understand the gear design, it is instructive to compare the pseudo-differential design to that of two limiting cases in the design space. A simplified functional schematic representation of the pseudo-differential gear design is shown in Figure 4(a). As seen, the pinion teeth are oriented 45º relative to the yaw axes. As mentioned previously, in this configuration pitch and yaw motion results in a combination of rolling and sliding between the pinion and rack surfaces. However, if the pinions’ centerlines were oriented parallel to the yaw axis, a pitch-biased differential design would result (see Figure 5(a)). In this case, pure pitch motion (induced through equal linear actuation of the two racks) would result in pure rolling between the pinions and their mating involute rack profiles. However, pure yaw motion (induced through equal but opposite linear actuation of the two input racks) results in a combination of rolling and sliding between the pinions and mating racks. The relative amount of rolling and sliding is a function of the local geometry.
Figure 5: Comparison of the pseudo-differential design to that of two limiting cases in the design space. (a) pitch-biased differential design, (b) yaw-biased differential design.
Conversely, if the pinions’ centerlines are aligned perpendicular to the yaw axis, a yaw-biased differential design results (see Figure 5(b)). In this case, pure yaw motion results in pure rolling while pure pitch motion results in a combination of rolling and sliding. From these two limiting cases we can make a qualitative argument that, for general pitch and yaw motion, orienting the pinion centerlines 45º to the yaw axis will minimize the overall proportion of sliding that occurs and thus maximize the efficiency of the
8
pseudo-differential. As an aside, if the clinical task was defined such that the ratio of pitch and yaw motion were known, the gear tooth orientation could be adjusted to preferentially bias pitch or yaw, based on this a priori knowledge of task motion.
Force-Torque Sensor Design
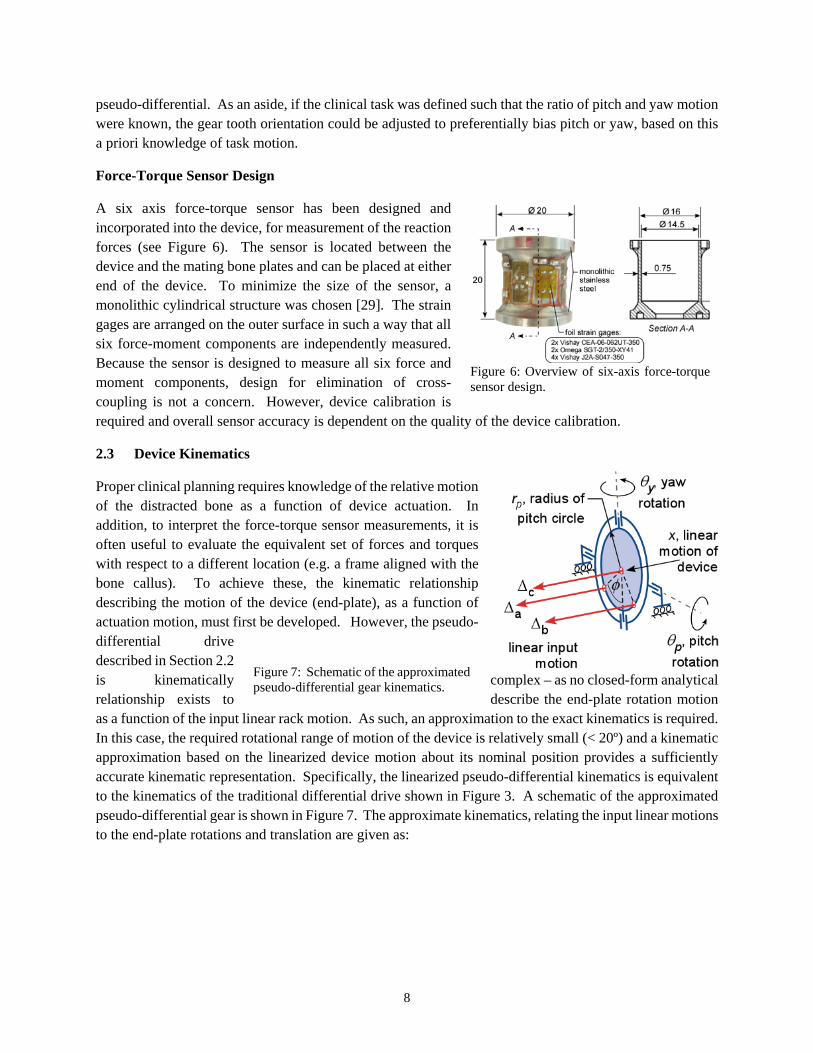
A six axis force-torque sensor has been designed and incorporated into the device, for measurement of the reaction forces (see Figure 6). The sensor is located between the device and the mating bone plates and can be placed at either end of the device. To minimize the size of the sensor, a monolithic cylindrical structure was chosen [29]. The strain gages are arranged on the outer surface in such a way that all six force-moment components are independently measured. Because the sensor is designed to measure all six force and moment components, design for elimination of cross-coupling is not a concern. However, device calibration is required and overall sensor accuracy is dependent on the quality of the device calibration.
2.3 Device Kinematics
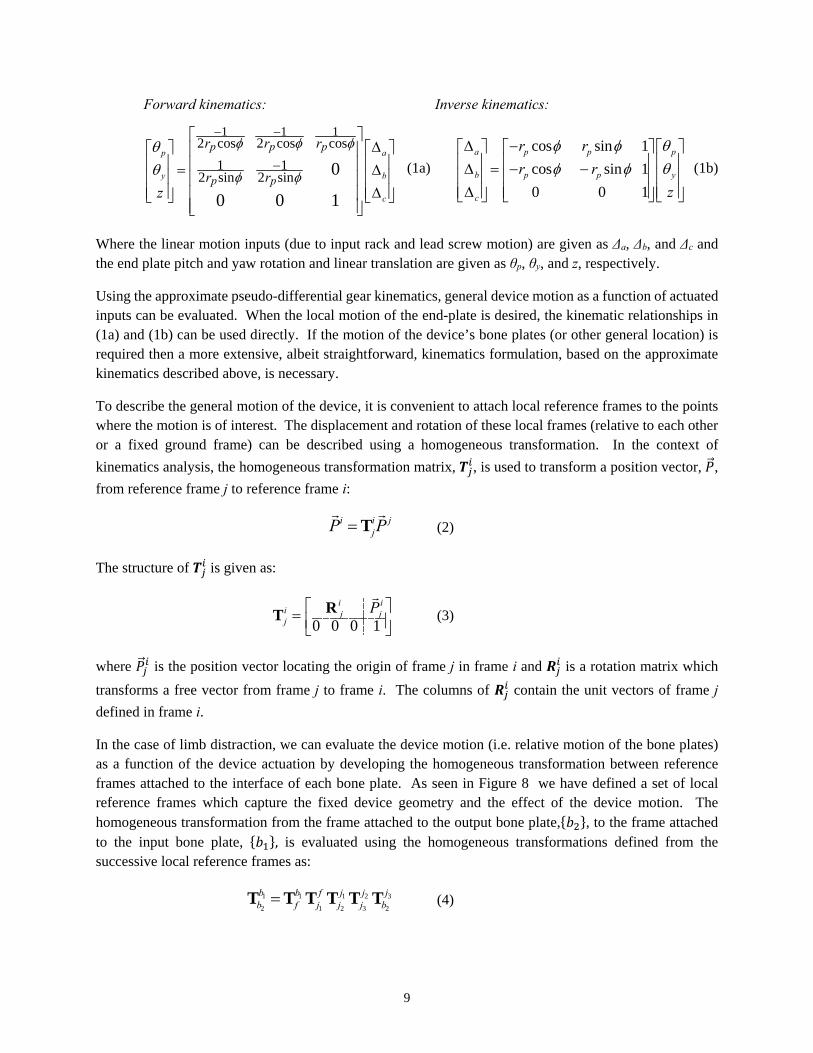
Proper clinical planning requires knowledge of the relative motion of the distracted bone as a function of device actuation. In addition, to interpret the force-torque sensor measurements, it is often useful to evaluate the equivalent set of forces and torques with respect to a different location (e.g. a frame aligned with the bone callus). To achieve these, the kinematic relationship describing the motion of the device (end-plate), as a function of actuation motion, must first be developed. However, the pseudo-differential drive described in Section 2.2 is kinematically complex – as no closed-form analytical relationship exists to describe the end-plate rotation motion as a function of the input linear rack motion. As such, an approximation to the exact kinematics is required. In this case, the required rotational range of motion of the device is relatively small (< 20º) and a kinematic approximation based on the linearized device motion about its nominal position provides a sufficiently accurate kinematic representation. Specifically, the linearized pseudo-differential kinematics is equivalent to the kinematics of the traditional differential drive shown in Figure 3. A schematic of the approximated pseudo-differential gear is shown in Figure 7. The approximate kinematics, relating the input linear motions to the end-plate rotations and translation are given as:
Figure 6: Overview of six-axis force-torque sensor design.
Figure 7: Schematic of the approximated pseudo-differential gear kinematics.
9
Forward kinematics: Inverse kinematics:
1 1 12 cos 2 cos cos
1 12 sin 2 sin 0
0 0 1
p a
y b
c
p p p
p p
r r r
r rz
(1a)
cos sin 1
cos sin 1
0 0 1
a p p p
b p p y
c
r r
r r
z
(1b)
Where the linear motion inputs (due to input rack and lead screw motion) are given as Δa, Δb, and Δc and the end plate pitch and yaw rotation and linear translation are given as θp, θy, and z, respectively.
Using the approximate pseudo-differential gear kinematics, general device motion as a function of actuated inputs can be evaluated. When the local motion of the end-plate is desired, the kinematic relationships in (1a) and (1b) can be used directly. If the motion of the device’s bone plates (or other general location) is required then a more extensive, albeit straightforward, kinematics formulation, based on the approximate kinematics described above, is necessary.
To describe the general motion of the device, it is convenient to attach local reference frames to the points where the motion is of interest. The displacement and rotation of these local frames (relative to each other or a fixed ground frame) can be described using a homogeneous transformation. In the context of
kinematics analysis, the homogeneous transformation matrix, , is used to transform a position vector, ,
from reference frame j to reference frame i:
i i j
jP PT
(2)
The structure of is given as:
0 0 0 1
i ii j jj
P RT
(3)
where is the position vector locating the origin of frame j in frame i and is a rotation matrix which
transforms a free vector from frame j to frame i. The columns of contain the unit vectors of frame j
defined in frame i.
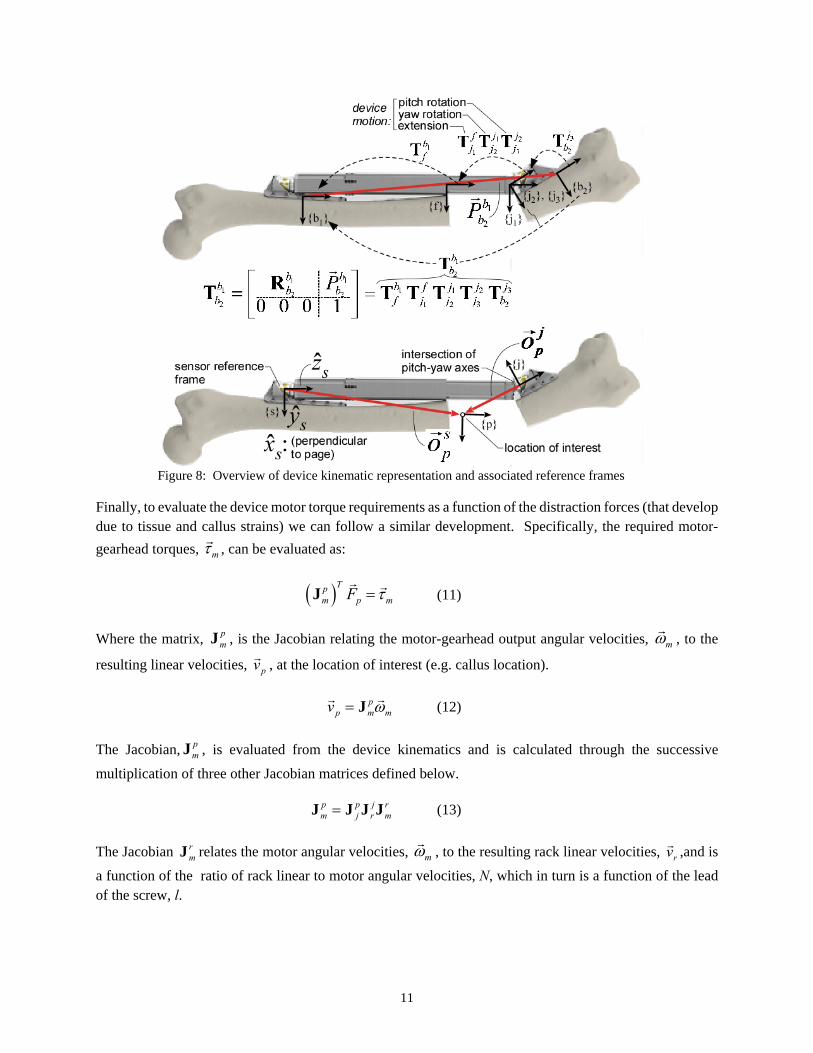
In the case of limb distraction, we can evaluate the device motion (i.e. relative motion of the bone plates) as a function of the device actuation by developing the homogeneous transformation between reference frames attached to the interface of each bone plate. As seen in Figure 8 we have defined a set of local reference frames which capture the fixed device geometry and the effect of the device motion. The homogeneous transformation from the frame attached to the output bone plate, , to the frame attached to the input bone plate, , is evaluated using the homogeneous transformations defined from the successive local reference frames as:
31 1 1 2
2 1 2 3 2
jb b j jfb f j j j bT T T T T T (4)
10
The homogeneous transformation matrices, , and , are due to device extension (z), and the
actuated joint rotations yaw (θy) and pitch (θp), respectively, and are given as:
1
1 0 0 00 1 0 00 0 10 0 0 1
fj x
T (5) 1
2
cos 0 sin 01 0 0 0
sin 0 cos 00 0 0 1
y y
jj
y y
T (6) 2
3
1 0 0 00 cos sin 00 sin cos 00 0 0 1
j p pj
p p
T (7)
The device motions are a function of the linear motion inputs (due to lead screw actuation) as given in equation (1)
To interpret the force-torque sensor measurements, it is often useful to evaluate the equivalent set of forces and torques with respect to a different location on the device or within the anatomy. For example, evaluating the equivalent forces/torques at the interface of the bone plates would reveal the reaction forces and moments that the device is imposing on the distracted anatomy. Alternatively, evaluating the equivalent forces/torques at the center of the callus would provide a measure of the callus distraction forces (assuming negligible soft tissue forces). Assuming that the device is in equilibrium, we can use the principle of virtual
work to relate the measured forces and torques at the sensor, , to the equivalent forces and moments at a
location of interest, , by the expression:
T
p sF FJ
(8)
where the matrix, J, is the Jacobian relating virtual velocities (or infinitesimal displacements) of the sensor coordinate system, , to those of the coordinate system associated with the location of interest, .
p sv v J
(9)
The virtual velocity is defined here as the virtual linear and angular velocities acting along the unit vectors of the local reference frames. The Jacobian, J, is evaluated from the device kinematics and is a function of the device motion:
ˆ ˆ ˆ ˆˆ ˆ
ˆ ˆ ˆ0 0 0
s s ss s s s p s p s p
s s s
x y z x o y o z o
x y z
J
(10)
where , , ̂ are the unit vectors of the sensor coordinate system and is a vector giving the position
of the coordinate system associated with the location of interest relative to the origin of the sensor coordinate system. The velocity and force vector components are arranged as
and , respectively.
11
Figure 8: Overview of device kinematic representation and associated reference frames
Finally, to evaluate the device motor torque requirements as a function of the distraction forces (that develop due to tissue and callus strains) we can follow a similar development. Specifically, the required motor-
gearhead torques, m
, can be evaluated as:
Tpm p mF J
(11)
Where the matrix, pmJ , is the Jacobian relating the motor-gearhead output angular velocities, m
, to the
resulting linear velocities, pv
, at the location of interest (e.g. callus location).
pp m mv J
(12)
The Jacobian, pmJ , is evaluated from the device kinematics and is calculated through the successive
multiplication of three other Jacobian matrices defined below.
p p j rm j r mJ J J J (13)
The Jacobian rmJ relates the motor angular velocities, m
, to the resulting rack linear velocities, rv
,and is
a function of the ratio of rack linear to motor angular velocities, N, which in turn is a function of the lead of the screw, l.
12
rr m mv J
where
0 00 00 0
rm
NN
N
J and 2
lN
(14)
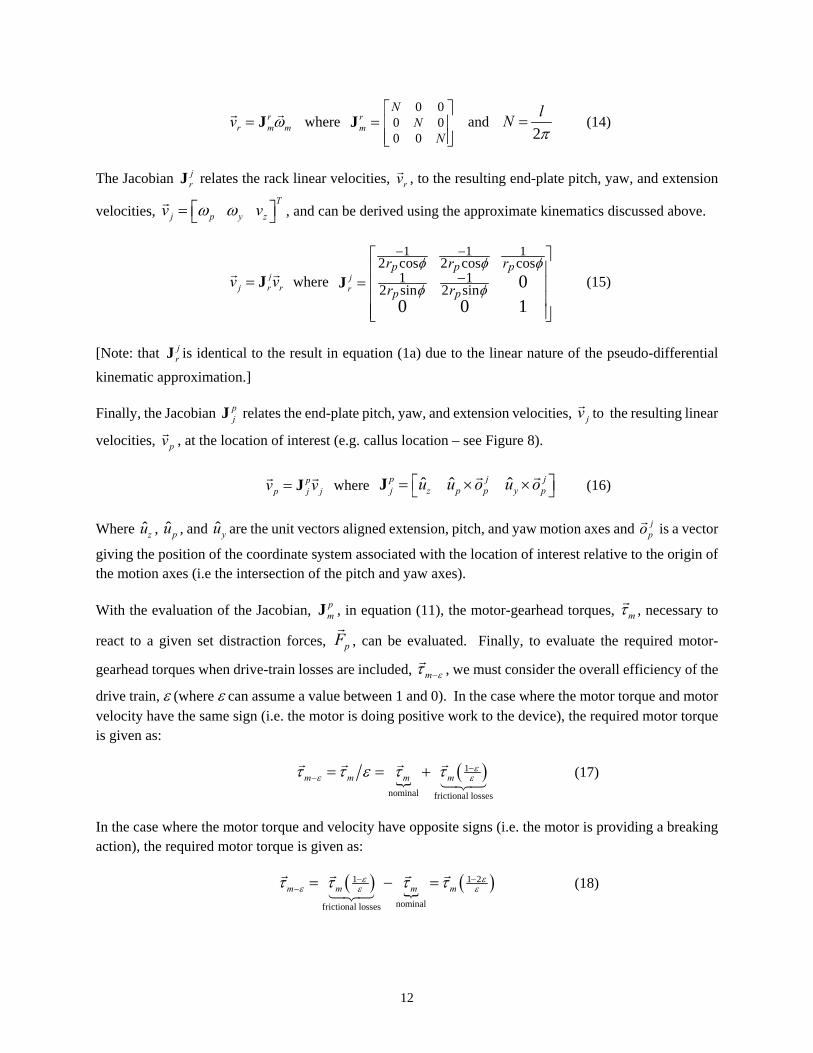
The Jacobian jrJ relates the rack linear velocities, rv
, to the resulting end-plate pitch, yaw, and extension
velocities, T
j p y zv v
, and can be derived using the approximate kinematics discussed above.
jj r rv v J
where
1 1 12 cos 2 cos cos
1 12 sin 2 sin 0
0 0 1
jr
p p p
p p
r r r
r r
J (15)
[Note: that jrJ is identical to the result in equation (1a) due to the linear nature of the pseudo-differential
kinematic approximation.]
Finally, the Jacobian pjJ relates the end-plate pitch, yaw, and extension velocities, jv
to the resulting linear
velocities, pv
, at the location of interest (e.g. callus location – see Figure 8).
pp j jv v J
where ˆ ˆ ˆp j jj z p p y pu u o u o J
(16)
Where ˆzu , ˆpu , and ˆyu are the unit vectors aligned extension, pitch, and yaw motion axes and jpo
is a vector
giving the position of the coordinate system associated with the location of interest relative to the origin of the motion axes (i.e the intersection of the pitch and yaw axes).
With the evaluation of the Jacobian, pmJ , in equation (11), the motor-gearhead torques, m
, necessary to
react to a given set distraction forces, pF
, can be evaluated. Finally, to evaluate the required motor-
gearhead torques when drive-train losses are included, m
, we must consider the overall efficiency of the
drive train, (where can assume a value between 1 and 0). In the case where the motor torque and motor velocity have the same sign (i.e. the motor is doing positive work to the device), the required motor torque is given as:
1
nominal frictional losses
m m m m
(17)
In the case where the motor torque and velocity have opposite signs (i.e. the motor is providing a breaking action), the required motor torque is given as:
1 1 2
nominalfrictional losses
m m m m
(18)
13
2.4 Computational Kinematics Model
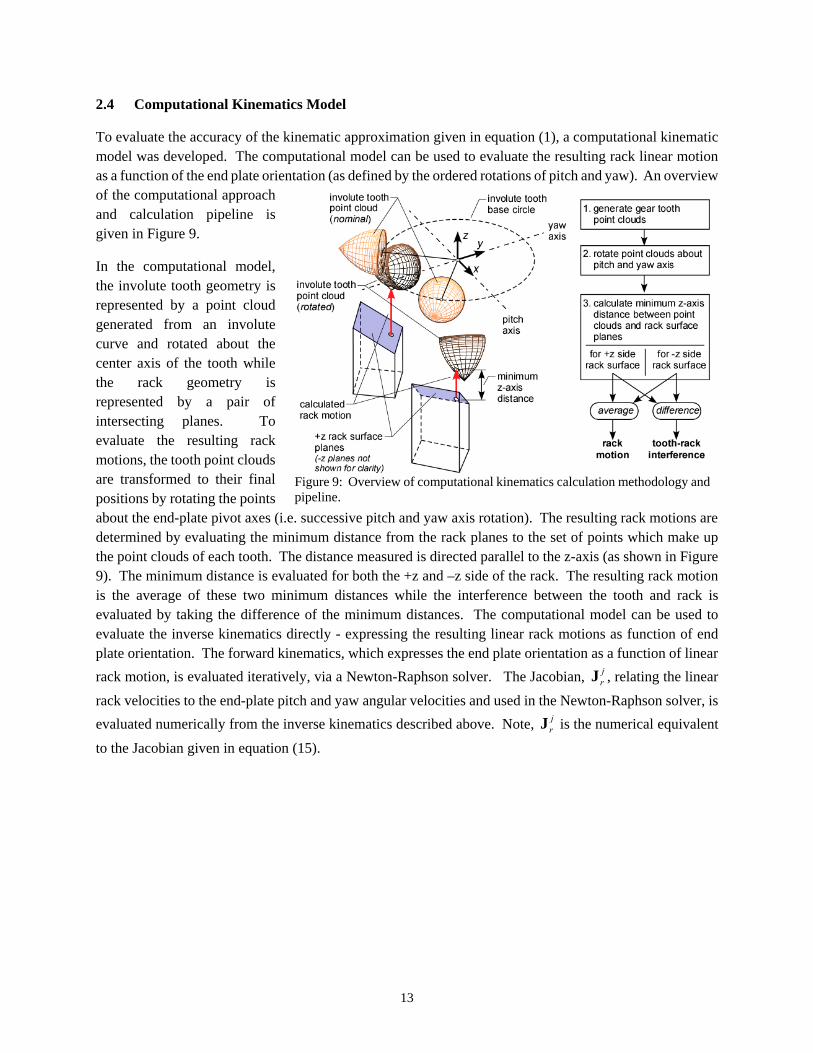
To evaluate the accuracy of the kinematic approximation given in equation (1), a computational kinematic model was developed. The computational model can be used to evaluate the resulting rack linear motion as a function of the end plate orientation (as defined by the ordered rotations of pitch and yaw). An overview of the computational approach and calculation pipeline is given in Figure 9.
In the computational model, the involute tooth geometry is represented by a point cloud generated from an involute curve and rotated about the center axis of the tooth while the rack geometry is represented by a pair of intersecting planes. To evaluate the resulting rack motions, the tooth point clouds are transformed to their final positions by rotating the points about the end-plate pivot axes (i.e. successive pitch and yaw axis rotation). The resulting rack motions are determined by evaluating the minimum distance from the rack planes to the set of points which make up the point clouds of each tooth. The distance measured is directed parallel to the z-axis (as shown in Figure 9). The minimum distance is evaluated for both the +z and –z side of the rack. The resulting rack motion is the average of these two minimum distances while the interference between the tooth and rack is evaluated by taking the difference of the minimum distances. The computational model can be used to evaluate the inverse kinematics directly - expressing the resulting linear rack motions as function of end plate orientation. The forward kinematics, which expresses the end plate orientation as a function of linear
rack motion, is evaluated iteratively, via a Newton-Raphson solver. The Jacobian, jrJ , relating the linear
rack velocities to the end-plate pitch and yaw angular velocities and used in the Newton-Raphson solver, is
evaluated numerically from the inverse kinematics described above. Note, jrJ is the numerical equivalent
to the Jacobian given in equation (15).
Figure 9: Overview of computational kinematics calculation methodology and pipeline.
14
2.5 Dynamic Computational Model
A dynamic computational model was developed to perform functional testing on the device. The dynamic model was created using ADAMS/View (x64, 2012, MSC Software, Santa Ana, CA, USA). As the kinematic model does not represent the effect of friction in the interaction of the gear teeth and rack, and the prototype is not useful in bench top testing due to material limitations (see section 2.7), a computational dynamic model was created. The overview of the computational model is below. In addition a comparison between experimental, kinematic, and dynamic pitch and yaw angles was performed to validate the use of the dynamic model for bench top testing.
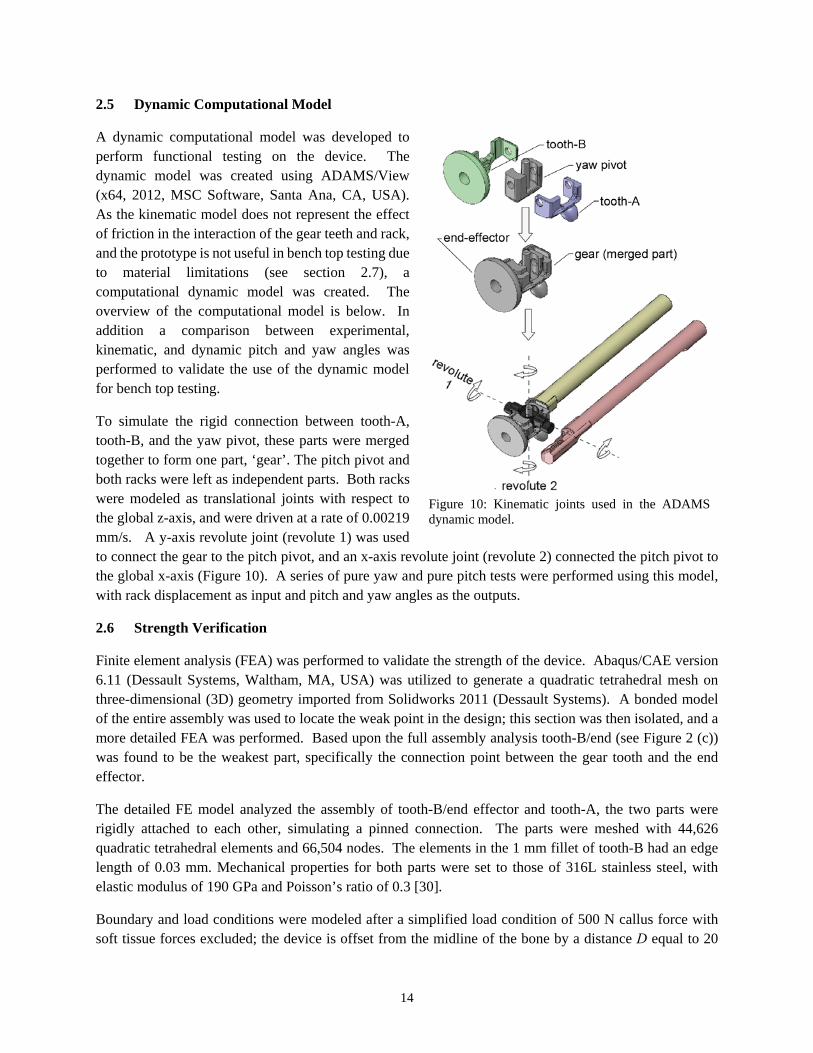
To simulate the rigid connection between tooth-A, tooth-B, and the yaw pivot, these parts were merged together to form one part, ‘gear’. The pitch pivot and both racks were left as independent parts. Both racks were modeled as translational joints with respect to the global z-axis, and were driven at a rate of 0.00219 mm/s. A y-axis revolute joint (revolute 1) was used to connect the gear to the pitch pivot, and an x-axis revolute joint (revolute 2) connected the pitch pivot to the global x-axis (Figure 10). A series of pure yaw and pure pitch tests were performed using this model, with rack displacement as input and pitch and yaw angles as the outputs.
2.6 Strength Verification
Finite element analysis (FEA) was performed to validate the strength of the device. Abaqus/CAE version 6.11 (Dessault Systems, Waltham, MA, USA) was utilized to generate a quadratic tetrahedral mesh on three-dimensional (3D) geometry imported from Solidworks 2011 (Dessault Systems). A bonded model of the entire assembly was used to locate the weak point in the design; this section was then isolated, and a more detailed FEA was performed. Based upon the full assembly analysis tooth-B/end (see Figure 2 (c)) was found to be the weakest part, specifically the connection point between the gear tooth and the end effector.
The detailed FE model analyzed the assembly of tooth-B/end effector and tooth-A, the two parts were rigidly attached to each other, simulating a pinned connection. The parts were meshed with 44,626 quadratic tetrahedral elements and 66,504 nodes. The elements in the 1 mm fillet of tooth-B had an edge length of 0.03 mm. Mechanical properties for both parts were set to those of 316L stainless steel, with elastic modulus of 190 GPa and Poisson’s ratio of 0.3 [30].
Boundary and load conditions were modeled after a simplified load condition of 500 N callus force with soft tissue forces excluded; the device is offset from the midline of the bone by a distance D equal to 20
Figure 10: Kinematic joints used in the ADAMS dynamic model.
15
mm. Both gear teeth were fixed and the callus load was modeled as 500 N axial tension applied as an evenly distributed pressure on the end effector surface. A 10,000 N-mm moment was applied to the end effector to simulate the D offset (see Figure 11).
Figure 11: Simplified loading during the extension phase. The callus force is estimated at 500 N based upon design specifications. A 10,000 N-mm moment was applied due to the D offset (where D=20 mm).
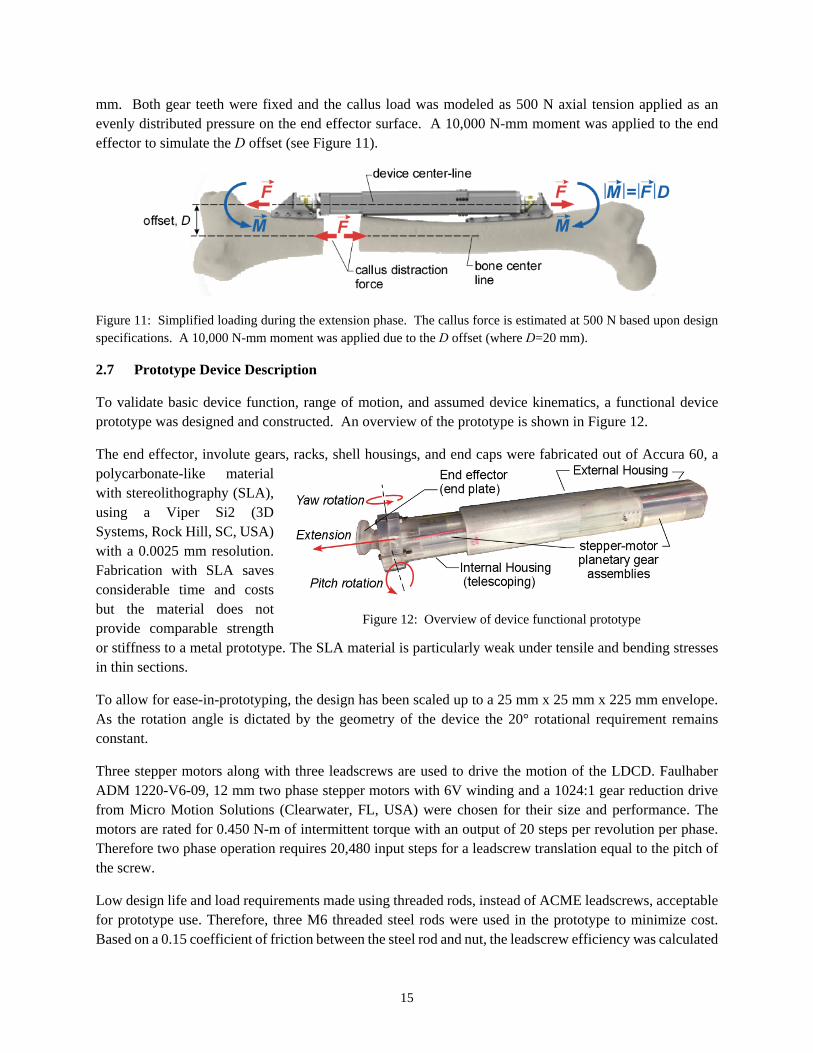
2.7 Prototype Device Description
To validate basic device function, range of motion, and assumed device kinematics, a functional device prototype was designed and constructed. An overview of the prototype is shown in Figure 12.
The end effector, involute gears, racks, shell housings, and end caps were fabricated out of Accura 60, a polycarbonate-like material with stereolithography (SLA), using a Viper Si2 (3D Systems, Rock Hill, SC, USA) with a 0.0025 mm resolution. Fabrication with SLA saves considerable time and costs but the material does not provide comparable strength or stiffness to a metal prototype. The SLA material is particularly weak under tensile and bending stresses in thin sections.
To allow for ease-in-prototyping, the design has been scaled up to a 25 mm x 25 mm x 225 mm envelope. As the rotation angle is dictated by the geometry of the device the 20° rotational requirement remains constant.
Three stepper motors along with three leadscrews are used to drive the motion of the LDCD. Faulhaber ADM 1220-V6-09, 12 mm two phase stepper motors with 6V winding and a 1024:1 gear reduction drive from Micro Motion Solutions (Clearwater, FL, USA) were chosen for their size and performance. The motors are rated for 0.450 N-m of intermittent torque with an output of 20 steps per revolution per phase. Therefore two phase operation requires 20,480 input steps for a leadscrew translation equal to the pitch of the screw.
Low design life and load requirements made using threaded rods, instead of ACME leadscrews, acceptable for prototype use. Therefore, three M6 threaded steel rods were used in the prototype to minimize cost. Based on a 0.15 coefficient of friction between the steel rod and nut, the leadscrew efficiency was calculated
Figure 12: Overview of device functional prototype
16
to be 32.6%. The maximum allowable axial thrust the screw can carry is 836 N [29]. The device shell can withstand a maximum bending load of 2183 Nm, assuming the device is fixed at one end and fully extended, per ANSI/ASME B1.13M-1995 test standards. The M6 screw has a 1.0 mm pitch and a theoretical precision of 24.4 nm per step (assuming there is no backlash within the screw and the system is rigid), with a maximum speed of 0.023 mm/sec.
A total of four ball bearings are used within the rack and pinion assembly for rotational motion. ABEC-5 double shielded miniature, high precision, stainless steel ball bearings with a 5 mm bore diameter and a 9 mm outer diameter were used for the y-axis bearings. Two, high performance, stainless steel, thrust ball bearings with a 3 mm bore diameter and an 8 mm outer diameter were used for the x-axis bearings.
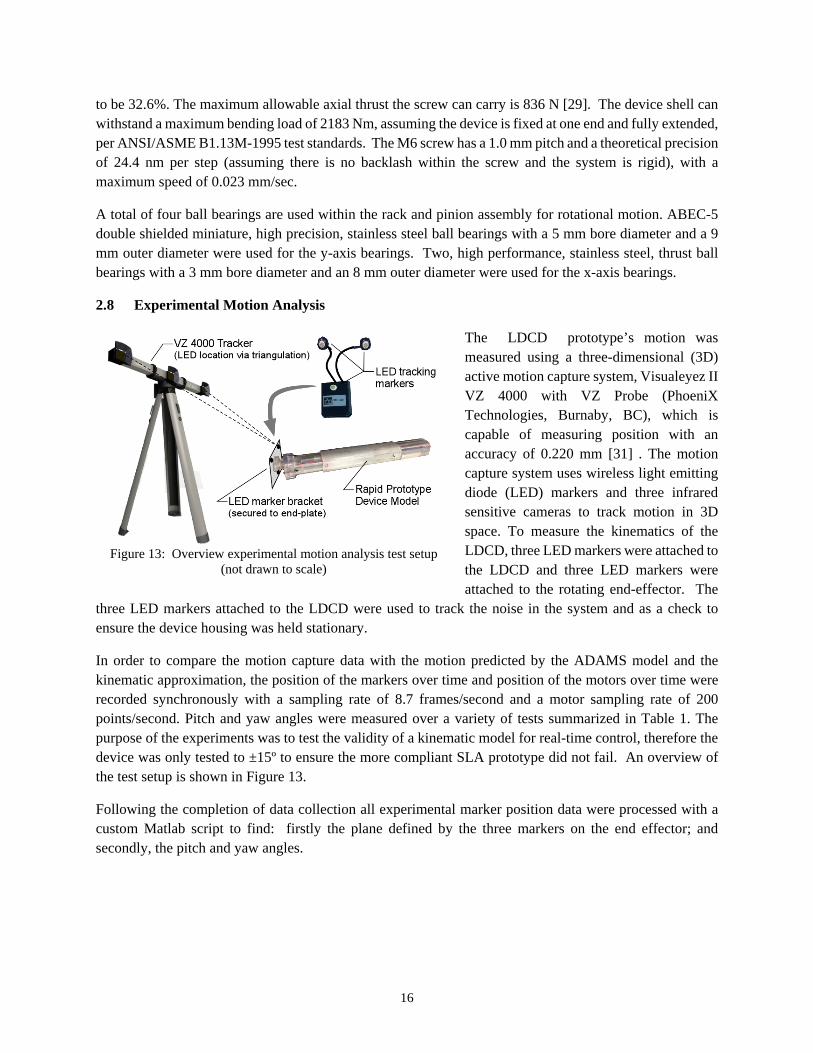
2.8 Experimental Motion Analysis
The LDCD prototype’s motion was measured using a three-dimensional (3D) active motion capture system, Visualeyez II VZ 4000 with VZ Probe (PhoeniX Technologies, Burnaby, BC), which is capable of measuring position with an accuracy of 0.220 mm [31] . The motion capture system uses wireless light emitting diode (LED) markers and three infrared sensitive cameras to track motion in 3D space. To measure the kinematics of the LDCD, three LED markers were attached to the LDCD and three LED markers were attached to the rotating end-effector. The
three LED markers attached to the LDCD were used to track the noise in the system and as a check to ensure the device housing was held stationary.
In order to compare the motion capture data with the motion predicted by the ADAMS model and the kinematic approximation, the position of the markers over time and position of the motors over time were recorded synchronously with a sampling rate of 8.7 frames/second and a motor sampling rate of 200 points/second. Pitch and yaw angles were measured over a variety of tests summarized in Table 1. The purpose of the experiments was to test the validity of a kinematic model for real-time control, therefore the device was only tested to ±15º to ensure the more compliant SLA prototype did not fail. An overview of the test setup is shown in Figure 13.
Following the completion of data collection all experimental marker position data were processed with a custom Matlab script to find: firstly the plane defined by the three markers on the end effector; and secondly, the pitch and yaw angles.
Figure 13: Overview experimental motion analysis test setup (not drawn to scale)
17
Table 1: Summary of motor parameters for motion capture experiments.
3 Results and Discussion
3.1 Strength Verification
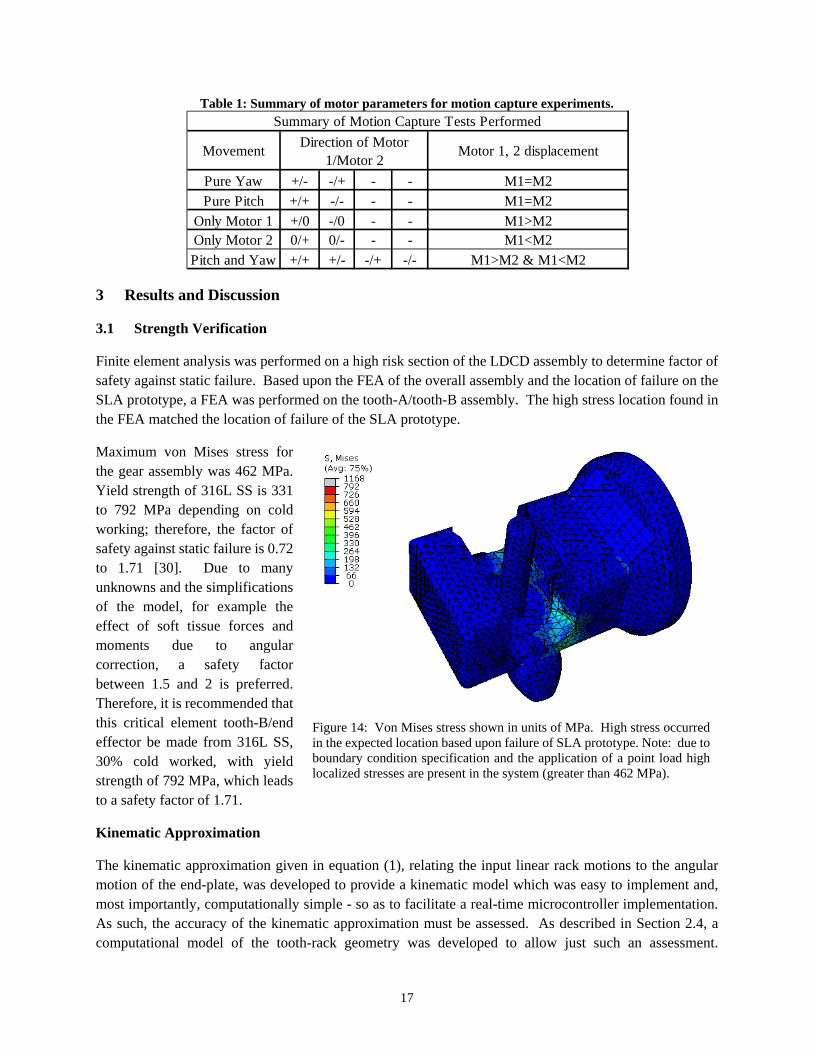
Finite element analysis was performed on a high risk section of the LDCD assembly to determine factor of safety against static failure. Based upon the FEA of the overall assembly and the location of failure on the SLA prototype, a FEA was performed on the tooth-A/tooth-B assembly. The high stress location found in the FEA matched the location of failure of the SLA prototype.
Maximum von Mises stress for the gear assembly was 462 MPa. Yield strength of 316L SS is 331 to 792 MPa depending on cold working; therefore, the factor of safety against static failure is 0.72 to 1.71 [30]. Due to many unknowns and the simplifications of the model, for example the effect of soft tissue forces and moments due to angular correction, a safety factor between 1.5 and 2 is preferred. Therefore, it is recommended that this critical element tooth-B/end effector be made from 316L SS, 30% cold worked, with yield strength of 792 MPa, which leads to a safety factor of 1.71.
Kinematic Approximation
The kinematic approximation given in equation (1), relating the input linear rack motions to the angular motion of the end-plate, was developed to provide a kinematic model which was easy to implement and, most importantly, computationally simple - so as to facilitate a real-time microcontroller implementation. As such, the accuracy of the kinematic approximation must be assessed. As described in Section 2.4, a computational model of the tooth-rack geometry was developed to allow just such an assessment.
Pure Yaw +/- -/+ - - M1=M2
Pure Pitch +/+ -/- - - M1=M2
Only Motor 1 +/0 -/0 - - M1>M2Only Motor 2 0/+ 0/- - - M1<M2
Pitch and Yaw +/+ +/- -/+ -/- M1>M2 & M1<M2
Motor 1, 2 displacement
Summary of Motion Capture Tests Performed
MovementDirection of Motor
1/Motor 2
Figure 14: Von Mises stress shown in units of MPa. High stress occurred in the expected location based upon failure of SLA prototype. Note: due to boundary condition specification and the application of a point load high localized stresses are present in the system (greater than 462 MPa).
18
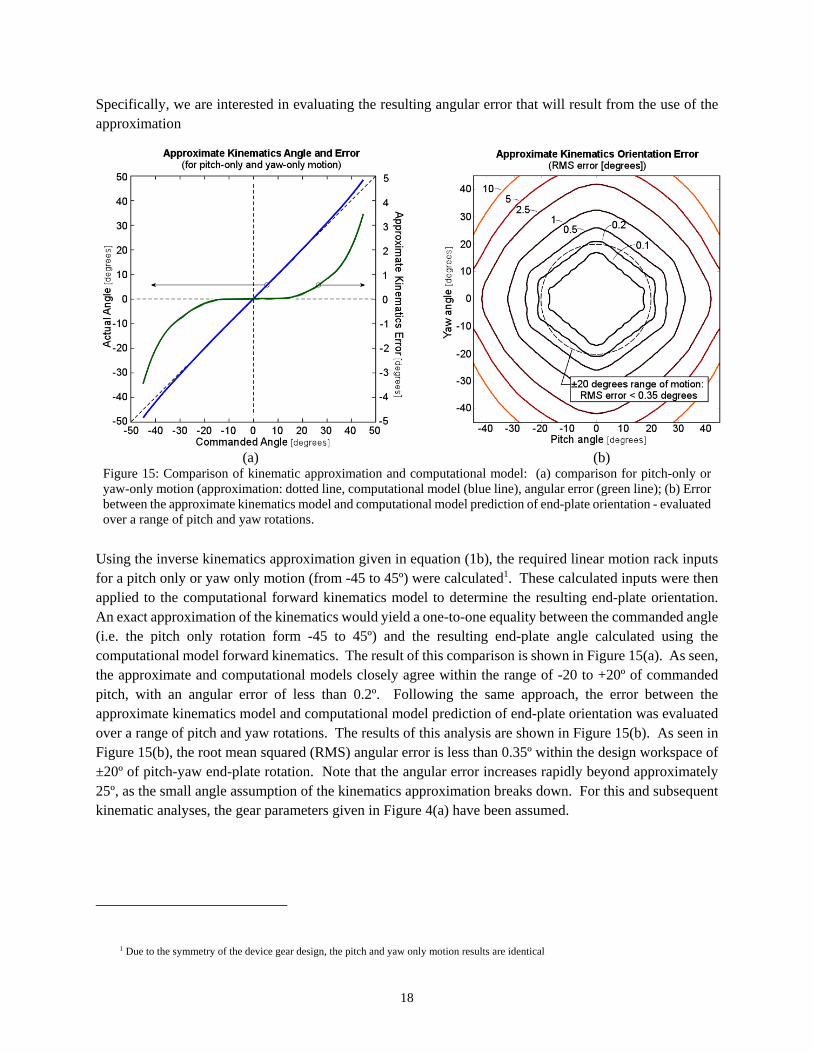
Specifically, we are interested in evaluating the resulting angular error that will result from the use of the approximation
(a) (b) Figure 15: Comparison of kinematic approximation and computational model: (a) comparison for pitch-only or yaw-only motion (approximation: dotted line, computational model (blue line), angular error (green line); (b) Error between the approximate kinematics model and computational model prediction of end-plate orientation - evaluated over a range of pitch and yaw rotations.
Using the inverse kinematics approximation given in equation (1b), the required linear motion rack inputs for a pitch only or yaw only motion (from -45 to 45º) were calculated1. These calculated inputs were then applied to the computational forward kinematics model to determine the resulting end-plate orientation. An exact approximation of the kinematics would yield a one-to-one equality between the commanded angle (i.e. the pitch only rotation form -45 to 45º) and the resulting end-plate angle calculated using the computational model forward kinematics. The result of this comparison is shown in Figure 15(a). As seen, the approximate and computational models closely agree within the range of -20 to +20º of commanded pitch, with an angular error of less than 0.2º. Following the same approach, the error between the approximate kinematics model and computational model prediction of end-plate orientation was evaluated over a range of pitch and yaw rotations. The results of this analysis are shown in Figure 15(b). As seen in Figure 15(b), the root mean squared (RMS) angular error is less than 0.35º within the design workspace of ±20º of pitch-yaw end-plate rotation. Note that the angular error increases rapidly beyond approximately 25º, as the small angle assumption of the kinematics approximation breaks down. For this and subsequent kinematic analyses, the gear parameters given in Figure 4(a) have been assumed.
1 Due to the symmetry of the device gear design, the pitch and yaw only motion results are identical
19
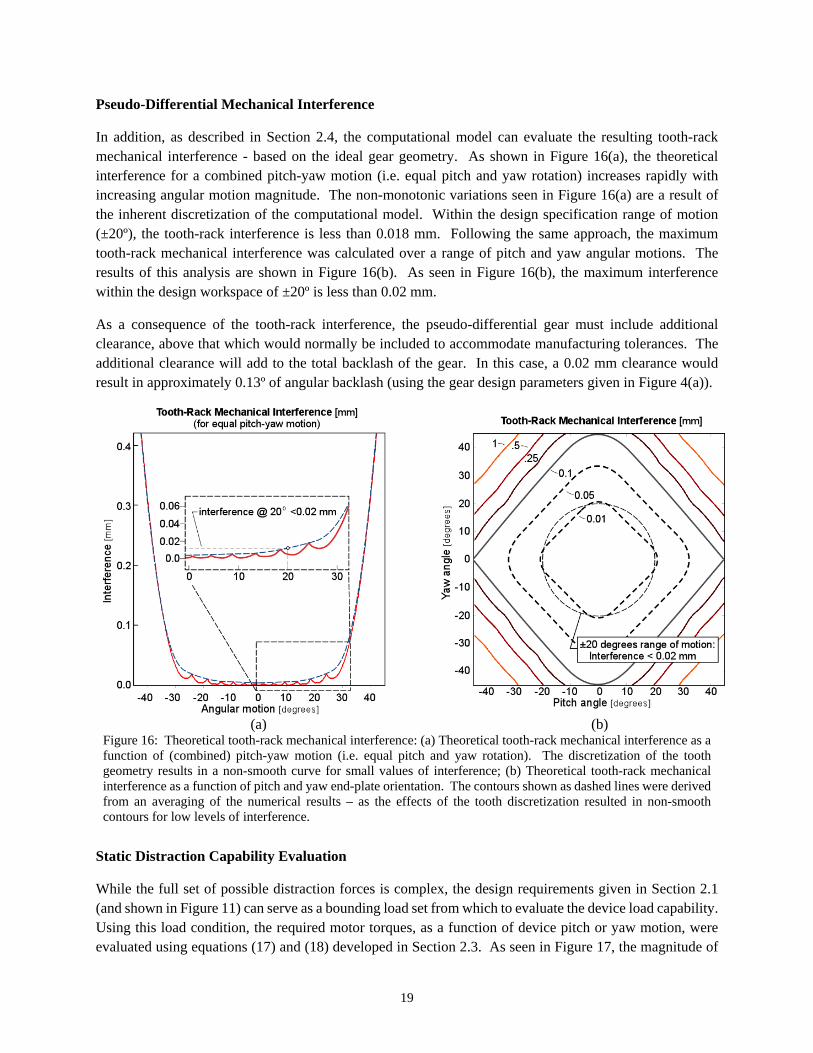
Pseudo-Differential Mechanical Interference
In addition, as described in Section 2.4, the computational model can evaluate the resulting tooth-rack mechanical interference - based on the ideal gear geometry. As shown in Figure 16(a), the theoretical interference for a combined pitch-yaw motion (i.e. equal pitch and yaw rotation) increases rapidly with increasing angular motion magnitude. The non-monotonic variations seen in Figure 16(a) are a result of the inherent discretization of the computational model. Within the design specification range of motion (±20º), the tooth-rack interference is less than 0.018 mm. Following the same approach, the maximum tooth-rack mechanical interference was calculated over a range of pitch and yaw angular motions. The results of this analysis are shown in Figure 16(b). As seen in Figure 16(b), the maximum interference within the design workspace of ±20º is less than 0.02 mm.
As a consequence of the tooth-rack interference, the pseudo-differential gear must include additional clearance, above that which would normally be included to accommodate manufacturing tolerances. The additional clearance will add to the total backlash of the gear. In this case, a 0.02 mm clearance would result in approximately 0.13º of angular backlash (using the gear design parameters given in Figure 4(a)).
(a) (b) Figure 16: Theoretical tooth-rack mechanical interference: (a) Theoretical tooth-rack mechanical interference as a function of (combined) pitch-yaw motion (i.e. equal pitch and yaw rotation). The discretization of the tooth geometry results in a non-smooth curve for small values of interference; (b) Theoretical tooth-rack mechanical interference as a function of pitch and yaw end-plate orientation. The contours shown as dashed lines were derived from an averaging of the numerical results – as the effects of the tooth discretization resulted in non-smooth contours for low levels of interference.
Static Distraction Capability Evaluation
While the full set of possible distraction forces is complex, the design requirements given in Section 2.1 (and shown in Figure 11) can serve as a bounding load set from which to evaluate the device load capability. Using this load condition, the required motor torques, as a function of device pitch or yaw motion, were evaluated using equations (17) and (18) developed in Section 2.3. As seen in Figure 17, the magnitude of
20
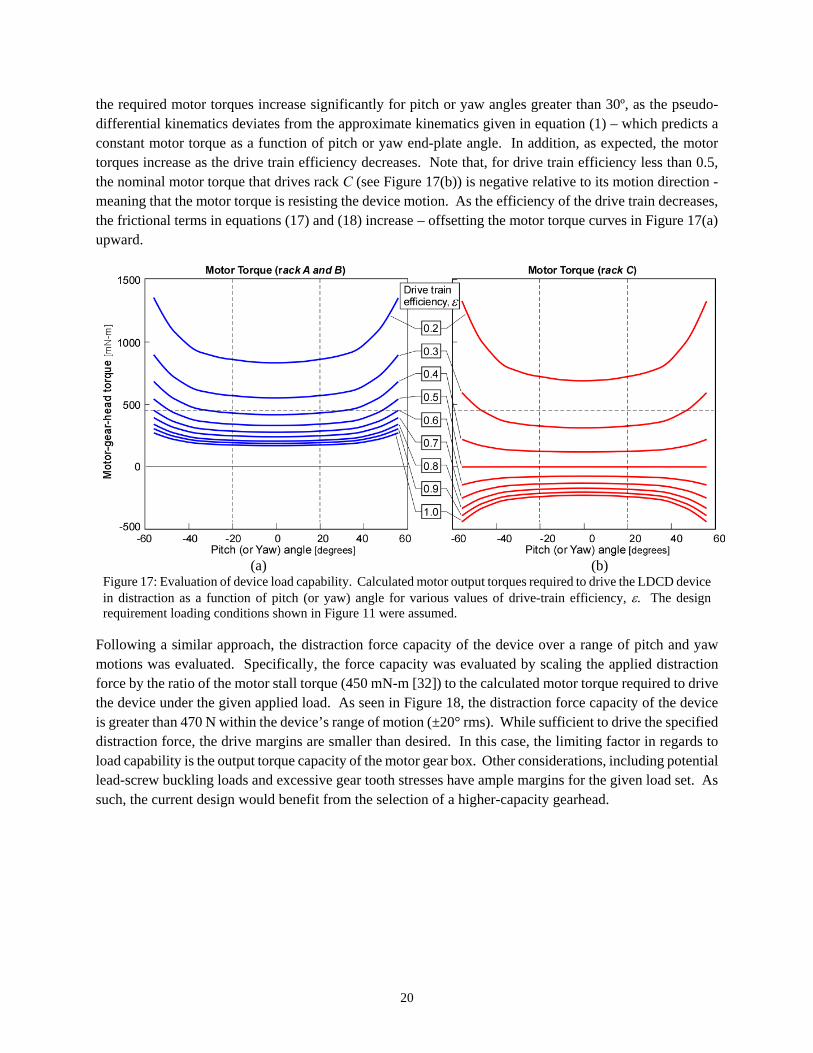
the required motor torques increase significantly for pitch or yaw angles greater than 30º, as the pseudo-differential kinematics deviates from the approximate kinematics given in equation (1) – which predicts a constant motor torque as a function of pitch or yaw end-plate angle. In addition, as expected, the motor torques increase as the drive train efficiency decreases. Note that, for drive train efficiency less than 0.5, the nominal motor torque that drives rack C (see Figure 17(b)) is negative relative to its motion direction - meaning that the motor torque is resisting the device motion. As the efficiency of the drive train decreases, the frictional terms in equations (17) and (18) increase – offsetting the motor torque curves in Figure 17(a) upward.
(a) (b) Figure 17: Evaluation of device load capability. Calculated motor output torques required to drive the LDCD device in distraction as a function of pitch (or yaw) angle for various values of drive-train efficiency, . The design requirement loading conditions shown in Figure 11 were assumed.
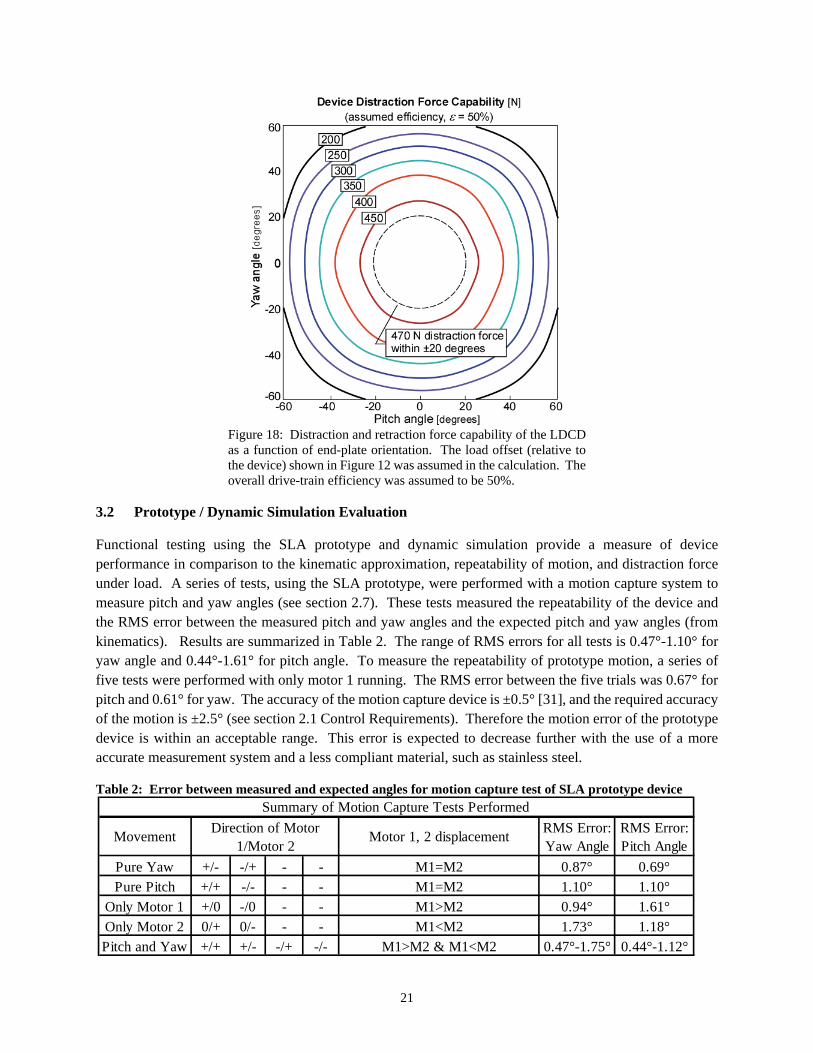
Following a similar approach, the distraction force capacity of the device over a range of pitch and yaw motions was evaluated. Specifically, the force capacity was evaluated by scaling the applied distraction force by the ratio of the motor stall torque (450 mN-m [32]) to the calculated motor torque required to drive the device under the given applied load. As seen in Figure 18, the distraction force capacity of the device is greater than 470 N within the device’s range of motion (±20° rms). While sufficient to drive the specified distraction force, the drive margins are smaller than desired. In this case, the limiting factor in regards to load capability is the output torque capacity of the motor gear box. Other considerations, including potential lead-screw buckling loads and excessive gear tooth stresses have ample margins for the given load set. As such, the current design would benefit from the selection of a higher-capacity gearhead.
21
Figure 18: Distraction and retraction force capability of the LDCD as a function of end-plate orientation. The load offset (relative to the device) shown in Figure 12 was assumed in the calculation. The overall drive-train efficiency was assumed to be 50%.
3.2 Prototype / Dynamic Simulation Evaluation
Functional testing using the SLA prototype and dynamic simulation provide a measure of device performance in comparison to the kinematic approximation, repeatability of motion, and distraction force under load. A series of tests, using the SLA prototype, were performed with a motion capture system to measure pitch and yaw angles (see section 2.7). These tests measured the repeatability of the device and the RMS error between the measured pitch and yaw angles and the expected pitch and yaw angles (from kinematics). Results are summarized in Table 2. The range of RMS errors for all tests is 0.47°-1.10° for yaw angle and 0.44°-1.61° for pitch angle. To measure the repeatability of prototype motion, a series of five tests were performed with only motor 1 running. The RMS error between the five trials was 0.67° for pitch and 0.61° for yaw. The accuracy of the motion capture device is ±0.5° [31], and the required accuracy of the motion is ±2.5° (see section 2.1 Control Requirements). Therefore the motion error of the prototype device is within an acceptable range. This error is expected to decrease further with the use of a more accurate measurement system and a less compliant material, such as stainless steel.
Table 2: Error between measured and expected angles for motion capture test of SLA prototype device
Pure Yaw +/- -/+ - - M1=M2 0.87° 0.69°
Pure Pitch +/+ -/- - - M1=M2 1.10° 1.10°
Only Motor 1 +/0 -/0 - - M1>M2 0.94° 1.61°
Only Motor 2 0/+ 0/- - - M1<M2 1.73° 1.18°
Pitch and Yaw +/+ +/- -/+ -/- M1>M2 & M1<M2 0.47°-1.75° 0.44°-1.12°
Summary of Motion Capture Tests Performed
Motor 1, 2 displacementRMS Error:Yaw Angle
RMS Error:Pitch Angle
MovementDirection of Motor
1/Motor 2
22
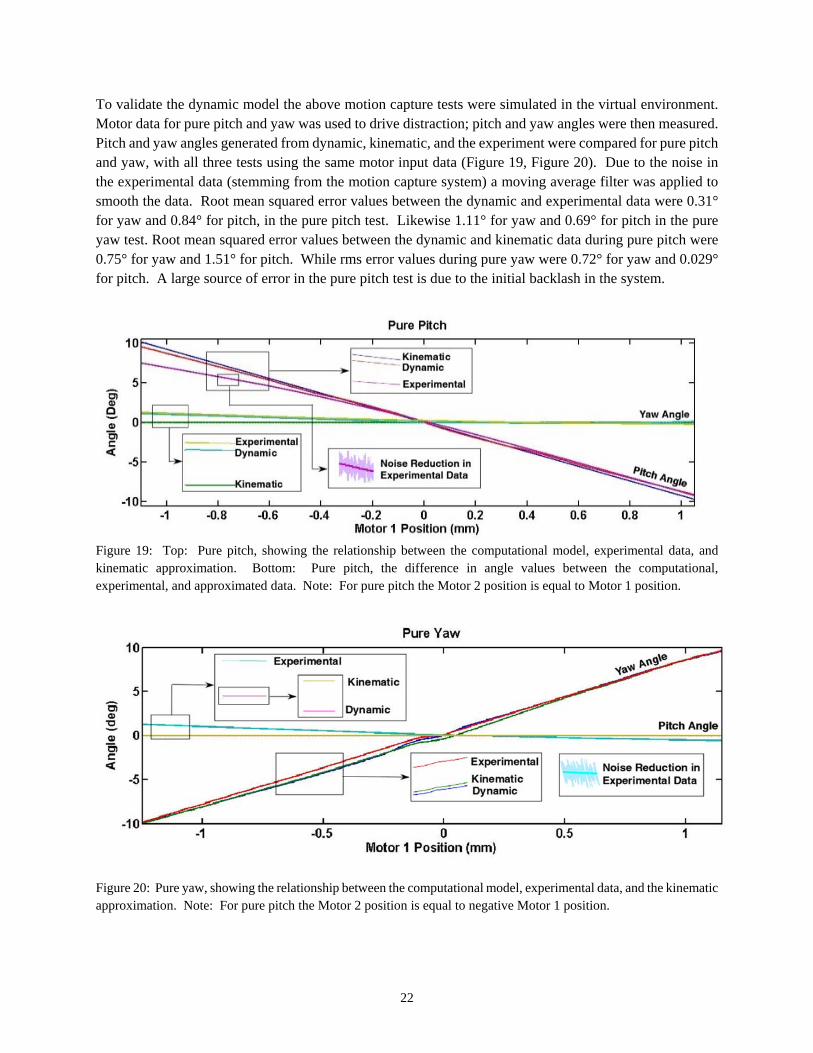
To validate the dynamic model the above motion capture tests were simulated in the virtual environment. Motor data for pure pitch and yaw was used to drive distraction; pitch and yaw angles were then measured. Pitch and yaw angles generated from dynamic, kinematic, and the experiment were compared for pure pitch and yaw, with all three tests using the same motor input data (Figure 19, Figure 20). Due to the noise in the experimental data (stemming from the motion capture system) a moving average filter was applied to smooth the data. Root mean squared error values between the dynamic and experimental data were 0.31° for yaw and 0.84° for pitch, in the pure pitch test. Likewise 1.11° for yaw and 0.69° for pitch in the pure yaw test. Root mean squared error values between the dynamic and kinematic data during pure pitch were 0.75° for yaw and 1.51° for pitch. While rms error values during pure yaw were 0.72° for yaw and 0.029° for pitch. A large source of error in the pure pitch test is due to the initial backlash in the system.
Figure 19: Top: Pure pitch, showing the relationship between the computational model, experimental data, and kinematic approximation. Bottom: Pure pitch, the difference in angle values between the computational, experimental, and approximated data. Note: For pure pitch the Motor 2 position is equal to Motor 1 position.
Figure 20: Pure yaw, showing the relationship between the computational model, experimental data, and the kinematic approximation. Note: For pure pitch the Motor 2 position is equal to negative Motor 1 position.
23
The test was run from a -1.25 mm motor position and advanced until a 1.25 mm motor position; the initial backlash in the system can be seen from -1.25 to -0.6 mm motor position. This backlash was predominantly due to the compliance in the SLA prototype and is expected to decrease with the use of a metal device. But some backlash will still be present due to the need for additional clearance. The rms error values between the experimental and kinematic values and the dynamic values were within the ± 2.5° error tolerance for device control. Therefore use of the dynamic model for measurement of expected distraction force and the use of the kinematic approximation for control is reasonable.
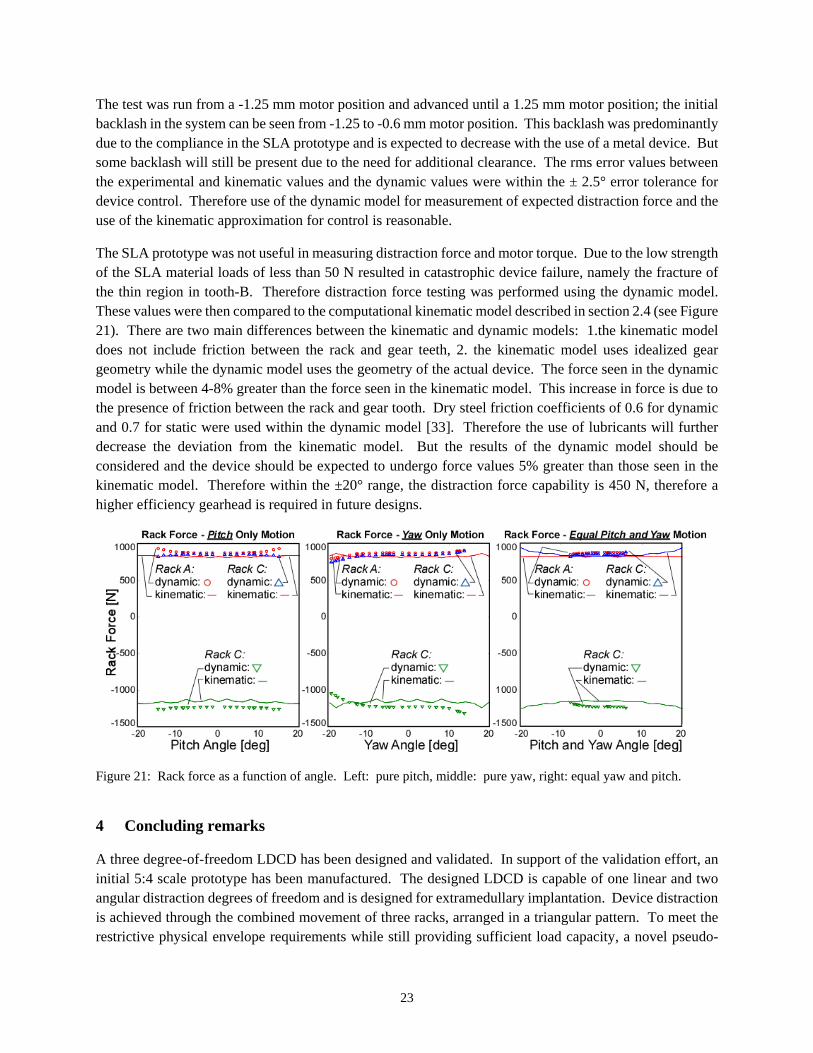
The SLA prototype was not useful in measuring distraction force and motor torque. Due to the low strength of the SLA material loads of less than 50 N resulted in catastrophic device failure, namely the fracture of the thin region in tooth-B. Therefore distraction force testing was performed using the dynamic model. These values were then compared to the computational kinematic model described in section 2.4 (see Figure 21). There are two main differences between the kinematic and dynamic models: 1.the kinematic model does not include friction between the rack and gear teeth, 2. the kinematic model uses idealized gear geometry while the dynamic model uses the geometry of the actual device. The force seen in the dynamic model is between 4-8% greater than the force seen in the kinematic model. This increase in force is due to the presence of friction between the rack and gear tooth. Dry steel friction coefficients of 0.6 for dynamic and 0.7 for static were used within the dynamic model [33]. Therefore the use of lubricants will further decrease the deviation from the kinematic model. But the results of the dynamic model should be considered and the device should be expected to undergo force values 5% greater than those seen in the kinematic model. Therefore within the ±20° range, the distraction force capability is 450 N, therefore a higher efficiency gearhead is required in future designs.
Figure 21: Rack force as a function of angle. Left: pure pitch, middle: pure yaw, right: equal yaw and pitch.
4 Concluding remarks
A three degree-of-freedom LDCD has been designed and validated. In support of the validation effort, an initial 5:4 scale prototype has been manufactured. The designed LDCD is capable of one linear and two angular distraction degrees of freedom and is designed for extramedullary implantation. Device distraction is achieved through the combined movement of three racks, arranged in a triangular pattern. To meet the restrictive physical envelope requirements while still providing sufficient load capacity, a novel pseudo-
24
differential gearing system was designed and incorporated into the device. Device validation was achieved through a combination of analytical and experimental methods including kinematic and dynamic simulation, FE strength analysis, and experimental evaluation of a device prototype.
A kinematic approximation of the pseudo-differential gearing system was developed for use in device control. The approximation was based on the linearized equations of the coupled pitch-yaw axis motions and its use was justified by the limited range of device angular motion (±20°) allowed. The approximation was validated against a computational model, showing less than 0.2° deviation within the ±20° range of motion. In addition, the approximation was validated through comparison to a dynamic simulation and a prototype experiment. Errors between the experiment, dynamic, and kinematic angles were less than the required ±2.5° accuracy.
To validate the distraction load capability of the device both strength and load analyses was performed. To validate structural design margins, a FEA was performed. The FEA provided a safety factor against static failure of 1.71 for the most high risk part within the assembly when subjected to a 500 N distraction force offset from the device centerline by 20 mm. The distraction load analysis, performed using a computational kinematic model as well as a dynamic simulation, demonstrated that the device is capable of continuous distraction when subjected to a 450 N callus force within its specified ±20° range of motion. However, load margins are small and are limited by the capacity of the motor gear head. Future design iterations will incorporate a higher capacity and higher efficiency gearhead to improve the load margins. The next step in the development process is the construction of a 316L SS prototype device for use in additional functional, strength and animal model testing.
NOMENCLATURE LDCD – Limb Deformity Correction Device Pitch – rotation about the x axis Yaw – rotation about the y axis FEA – finite element analysis SLA – stereolithography RMS – Root Mean Square
ACKNOWLEDGEMENTS 1. John Peterman, Simplex Scientific, Madison, WI 2. Dr. Kenneth Noonan, University of Wisconsin School of Medicine and Public Health, Madison, WI 3. Machine Tool Technologies Research Foundation (MTTRF.org) 4. Funding: Innovation & Economic Development Research Program (IEDR), University of Wisconsin Institute
for Clinical and Translational Research (UW-ICTR), Wisconsin Alumni Research Foundation (WARF), and Faustin Prinz Undergraduate Research Fellowship.
REFERENCES
1. R., D.T., P.L. E., and M.E. J., Limb amputation and limb deficiency: Epidemiology and recent trends in the United States. Vol. 8. 2002. 875-883.
2. Kiper, D., "Leg Length Discrepancies". Fitness Runner, 1999. Holiday. 3. Zarzycki, D., et al., Long-term results of lower limb lengthening by the Wagner method. Journal of
pediatric orthopedics, 2002. 22: p. 371-4. 4. Ilizarov, G.a., The tension-stress effect on the genesis and growth of tissues: Part II. The influence of
the rate and frequency of distraction. Clinical orthopaedics and related research, 1989: p. 263-85. 5. Spiegelberg, B., et al., Ilizarov principles of deformity correction. Annals of the Royal College of
Surgeons of England, 2010. 92(2): p. 101-5.
25
6. De Bastiani, G., et al., Limb Lengthening by Callus Distraction (Callotasis). Journal of Pediatric Orthopaedics, 1987. 7: p. 129-134.
7. H., W., Surgical lengthening or shortening of the femur and tibia. Technique and indications1977. 71-94.
8. F., T.K., et al., Linear Increase in Axial Stiffness of regenerate callus during limb lengthening. Vol. June. 2005. 239-244.
9. Marina Makarov, M., John Birch, MD, and Mikhail Samchukov, MD, The Role of Variable Muscle Adaptation to Limb Lengthening in the Development of Joint Contractures An Experimental Study in the Goat. Journal of Pediatric Orthopaedics, 2009. 29(2): p. 7.
10. Aston, W.J.S., Calder, P. R., Baker, D., Hartley, J., Hill, R. A, Lengthening of the Congenital Short Femur using the Ilizarov Technique: a Single-Surgeon Series. Journal of Bone and Joint Surgery, 2009. 91-B: p. 962-967.
11. Rogers, L.C., Bevilacqua, N. J., Frykberg, R. G., Armstrong, D. G, Predictors of Postoperative Complications of Ilizarov External Ring Fixators in the Foot and Ankle. Journal of Foot and Ankle Surgery, 2007. 46(5): p. 372-375.
12. Leidinger, B., Winkelmann, W., Roedl, R, Limb lengthening with a fully implantable mechanical distraction intramedullary nail. Orthop Ihre Grenzgeb, 2006. 144: p. 419-426.
13. Burghardt, R.D., Herzenberg, J. E., Specht, S. C., Paley, D. , Mechanical Failure of the Intramedullary Skeletal Kinetic Distractor in Limb Lengthening. Journal of Bone and Joint Surgery, 2011. 93-B: p. 639-643.
14. Krieg, A.H., B.M. Speth, and B.K. Foster, Leg lengthening with a motorized nail in adolescents : an alternative to external fixators? Clinical orthopaedics and related research, 2008. 466(1): p. 189-97.
15. S., H., et al., Improved comfort in lower limb lengthening with the intramedullary skeletal kinetic distractor-Principles and preliminary clinical experiences. Vol. 2. 2004. 129-133.
16. Krieg, A.H., Lenze, U., Speth, B. M., Hasler, C. C, Intramedullary leg lengthening with a motorized nail. acta orthopaedica belgica, 2011. 82: p. 344-350.
17. Brunner, U.H., et al., Force required for bone segment transport in the treatment of large bone defects using medullary nail fixation. Clinical orthopaedics and related research, 1994: p. 147-55.
18. Younger, a.S., W.G. Mackenzie, and J.B. Morrison, Femoral forces during limb lengthening in children. Clinical orthopaedics and related research, 1994: p. 55-63.
19. W., S.A.H.R., C.J. L., and K. J., Tissues during leg lengthening: a clinical study. Vol. November. 1996.
20. P., W., et al., Muscle fibre damage and regeneration resulting from surgical limb distraction. Vol. 4. 2001. 395-400.
21. I., O., et al., Measurement of the tensile forces during bone lengthening. Vol. 4. 2005. 421-7. 22. J., W., et al., Development of a Force-Driven Distractor for Distraction Osteogenesis. Vol. Dec. 2011. 23. J., A., Current Concepts Review: Limb-Lengthening, Skeletal Reconstruction, and Bone Transport
with the Ilizarov Method. Vol. 8. 1997. 1243-58. 24. S., F.D., et al., Correction of tibia vara with six-axis deformity analysis and the Taylor Spatial Frame.
Vol. 3. 2003. 387-91. 25. S., S., L. a, and I. M., The results of limb lengthening by callus distraction using an extending
intramedullary nail (Fitbone) in non-traumatic disorders. Vol. 7. 2006. 938-42. 26. B., O. and J. G., Joint Reaction Forces During Femoral Lengthening1994. 64-67. 27. N., W., et al., Force and Stiffness Changes During Ilizarov Leg Lengthening. Vol. January. 58-60. 28. S. Robert Rozbruch, K.S., Svetlana Illizarov, Austin T. Fragomen, Gabriel Illizarov, Does the Taylor
Spatial Frame Accurately Correct Tibial Deformities? Clin Orthop, 2010. 468(5): p. 9. 29. Andrei M. Reinhorn, J.B., Multi Axis Load Cell: Design and Construction, 1992, University At
Buffalo - State University of New York. 30. Ratner, B.D., ed. An Introduction to Materials in Medicine. Second ed. 31. N., H., Accuracy Testing of of the VisualeyezTM II Camera System.”2010. 32. Stepper Motors (ADM 1220-ww-ee), Faulhaber, Editor 2012-2013.

26
33. Sullivan, J.F.W., ed. Technical Physics. ed. J.J. Wiley1988. 204.