Embed Size (px)
Citation preview
22
INDUSTRIAL ENGINEERING JOURNALMarch 2018
Vol. XI & Issue No. 3 March - 2018
AN EVALUATION OF TPM STRATEGIES FOR ENHANCING MANUFACTURING PERFORMANCE OF INDIAN SMES
Abhishek JainHarwinder SinghRajbir S. Bhatti
AbstractReliable manufacturing equipment's play a vital role in the performance improvement of Indian Small & Medium Enterprises (ISMEs) in this highly competitive scenario. In this paper, authors have approached a large number of small and medium manufacturing organizations to get the contribution of TPM implementation strategies in ISMEs towards realizing manufacturing performance improvement. Most of Indian manufacturing organizations, especially ISMEs work under pressure to perform better in the future. In this paper, the authors have prepared a questionnaire to identify input parameters (TPM implementation strategies) and output parameters (manufacturing performance improvement). The study investigates that all the input parameters have a positive impact on output parameters in the ISMEs through Pearson correlation coefficient (PCC) calculation. Multiple regression analysis (MRA) is used to find the key input parameter for the improvement of manufacturing performance. Statistical analysis of the collected data for the calculation of the PCC and MRA is done by using SPSS software.
Keywords: TPM, ISMEs, TPM strategies, Preventive maintenance, manufacturing performance improvement.
1. �INTRODUCTION
The recent global competitive environment has been pushed Indian manufacturing organizations to utilize their available resources optimally to enhance their productivity (Garg and Deshmukh, 2006). To improve performance of maintenance, TPM has been recognized as a highly acceptable strategy (Nakajima, 1988). The implementation of TPM, TQM and RCM together can change the working culture of manufacturing organizations (Hongyi, 2003; Hansson et al. 2003). The competitiveness of modern organizations leads them to refine their manufacturing processes continuously. Time and motion study as well as continuous improvement programs is very effective tool to analyze manufacturing processes for manufacturing performance improvement. The term Total productive maintenance (TPM) was originated for the improvement of manufacturing performance, maintenance, operations and quality of product in 1971 in Japan. It has been identified as a tool by a renowned researcher as Nakajima in 1988 for better maintenance strategies by total employee's involvement. TPM implementation is a major departure from the “you operate, I maintain” philosophy to “I operate and maintain” philosophy. Although TPM implementation gives a drastic change in manufacturing performance still Indian manufacturing organizations are facing a lot of challenges in TPM implementation (Tripathi 2005, Ahuja and Khamba 2007, 2008, Shahanaghi and Yazdia 2009, Almeanazel 2010, Amin et al. 2013, Jain et al. 2015). The authors (Ahmed et al., 2005; Ahuja and Khamba, 2007) have identified the need of TPM implementation in manufacturing sectors and the authors (Patra et al., 2005; Pramod et al., 2006) have also found the importance of TPM in the service sector for performance measurement. The main goal of the TPM program is to bring critical maintenance, skilled workers and production workers together (Labib, 1999). Total employee involvement, autonomous maintenance by operators, small group activities to improve equipment reliability, maintainability, productivity, and continuous improvement are the principles given by TPM.
2. �SMALL AND MEDIUM ENTERPRISES (SMES)
Small and medium enterprises are considered as a backbone of economic growth all over the world (Singh et al. 2008). They contribute in providing job opportunities and also act as a supplier of goods and services to large organizations. The Indian organizations have classified on the basis of investment as micro, small and medium enterprises (MSME). There are a number of definitions of MSME given by different countries on the basis of different criteria as the number of employees, value of assets, the value of sales and the size of capital as well as the turnover of the plant (Deshmukh and Chavan, 2012).
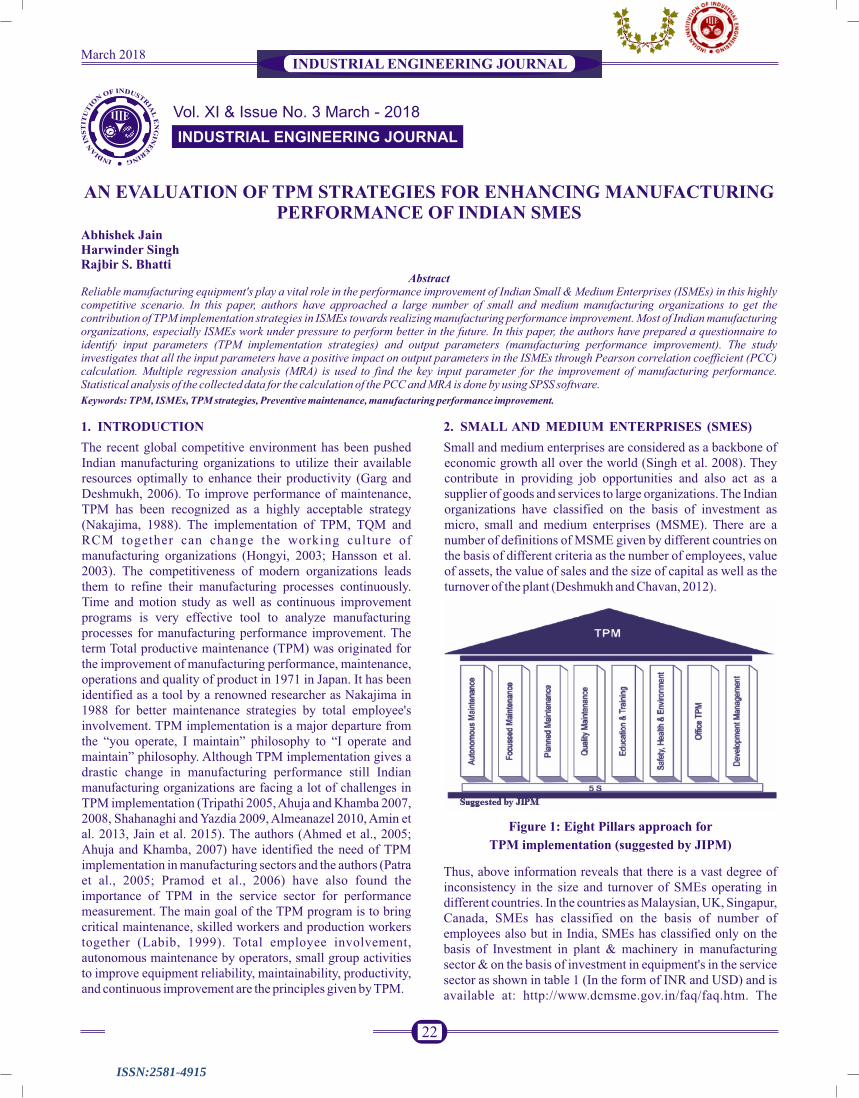
Figure 1: Eight Pillars approach for
TPM implementation (suggested by JIPM)
Thus, above information reveals that there is a vast degree of inconsistency in the size and turnover of SMEs operating in different countries. In the countries as Malaysian, UK, Singapur, Canada, SMEs has classified on the basis of number of employees also but in India, SMEs has classified only on the basis of Investment in plant & machinery in manufacturing sector & on the basis of investment in equipment's in the service sector as shown in table 1 (In the form of INR and USD) and is available at: http://www.dcmsme.gov.in/faq/faq.htm. The
DOI: 10.26488/IEJ.6.10.5
DOI: 10.26488/IEJ.6.10.5
DOI: 10.26488/IEJ.6.10.5
ISSN:2581-4915
ISSN:2581-4915
ISSN:2581-4915

23
INDUSTRIAL ENGINEERING JOURNALMarch 2018
authors have explained this classification of Indian SMEs on the basis of investment in INR and USD also to understand globally by researchers outside India. To implement TPM, the production and maintenance units should work jointly. TPM program is used to increase production and also improve employee morale and job satisfaction. The full commitment of senior management to the program is also essential. The purpose of this paper is to find the key TPM strategies (Pillars) and proposed a TPM Model for ISMEs to improve their manufacturing performance. It is not necessary to implement all the pillars of the proposed TPM model in ISMEs simultaneously. The main objectives of this paper are as
follows:
To access the current status of TPM strategies in Indian SMEs through a questionnaire survey.
To identify the need for implementation of TPM strategies in Indian SMEs.
To identify the interrelationship between input and output parameters.
To identify key TPM strategies for manufacturing performance improvement and proposed a TPM Model for ISMEs.
Table 1: Classification of Enterprises on The Basis of Investment on Plant, Machinery and Equipment's
Manufacturing Sector *
Enterprises Investment in plant & machinery
In INR (Rs.) In USD#
Micro Enterprises Does not exceed 25 lakh rupees Does not exceed 38 thousand dollars
Small Enterprises More than 25 lakh rupees but does not exceed 5 crore rupees
More than 38 thousand dollars but does not exceed 7.5 lakh dollars
Medium Enterprises More than 5 crore rupees but does not exceed ten crore rupees
More than 7.5 lakh dollars but does not exceed 15 lakh dollars
Service Sector **
Enterprises Investment in equipments
In INR In USD
Micro Enterprises Does not exceed 10 lakh rupees: Does not exceed 15 thousand dollars
Small Enterprises More than 10 lakh rupees but does not exceed 2 crore rupees
More than 15 thousand dollars but does not exceed 3 lakh dollars
Medium Enterprises More than 2 crore rupees but does not exceed 5 core rupees
More than 3 lakh dollars but does not exceed 7.5 lakh dollars
#( I USD ≈ 66 INR) *Investment limit in Plant & Machinery ** Investment limit in equipments
First of all, Authors have performed a questionnaire survey in SMEs of North-Central India to access the status of the implementation of TPM strategies and need of these strategies for manufacturing performance improvement in ISMEs as mentioned in first and second objectives. It is very difficult to find the appropriate TPM strategies for ISMEs without analyzing the need of these strategies in ISMEs. The third and fourth objectives are the purpose of this paper itself. In this paper, the authors also find the key TPM strategies on the basis of this questionnaire survey and literature review available. After that, validate these strategies (Input & Output parameters) by identifying the interrelationship between them. SPSS Software is used for this purpose. After validation, proposed a TPM Model for ISMEs (figure 4). These objectives play a vital role to fulfill the purpose of this paper as discussed above.
3. �LITERATURE REVIEW
The authors has been classified the relevant literature into two sections as TPM Implementation strategies and Manufacturing Performance improvement and subdivision of these two sections are as shown in table 2.
3.1 TPM Implementation Strategies
Implementation of TPM strategies plays an important role in manufacturing performance improvement. In this study, TPM
strategies include top management leadership, preventive maintenance, implementation of TPM pillars and TPM Enablers. The top management leadership is playing a vital role in the TPM implementation (Lazim et al. 2009). The full commitment of top management to the program is also essential. Now-a-days, maintenance system of Indian SMEs was complex and definitely become more complex in future. (Sherwin et al., 1995). Preventive maintenance is also one of the TPM strategies. Machines of manufacturing organizations can be kept in good condition by implementing this concept. TPM implementation is not short term planning it takes time to implement to change the attitude of both companies as well as employees (Panneerselvam, 2012). TPM plays a great role to achieve quality in processes and products (Modgil and Sharma, 2016).There are few TPM Enablers, which also responsible for manufacturing performance improvement as Respect for employees (Seiling, 1999), Responsibility (Goetsch and Davis, 2000), empathy and (Bogue, 1997), Humbleness (Gupta, 1996; Gibson, 1995), Trust (Axline, 1991), Cooperation (Oakland, 1997) and Quality (Kaur et al., 2013). Total employee involvement and top management support are the key factors in TPM implementation and can be implemented in industrial plants, construction, building maintenance, transportation and in a variety of other situations (Prashanth et al., 2016).
DOI: 10.26488/IEJ.6.10.5
DOI: 10.26488/IEJ.6.10.5
DOI: 10.26488/IEJ.6.10.5
ISSN:2581-4915
ISSN:2581-4915
ISSN:2581-4915

24
INDUSTRIAL ENGINEERING JOURNALMarch 2018
Table 2: TPM Implementation Strategies and Manufacturing Performance Improvement
TPM implementation strategies
Top Management Leadership Preventive Maintenance Implementation of TPM Pillars TPM Enablers
Manufacturing Performance Improvement
Organizational achievement Productivity Cost Quality Benefits of TPM Implementation Customer Satisfaction
3.2 Manufacturing Performance Improvement
In order to remain competitive, inter-organizational relations among organizations should improve so as to improve performance of the organizations. For this, top management should encourage their employees for a large number of small improvements in place of an improvement of large magnitude in their organizations. As far as the benefits from the Implementation of TPM strategies are concerned, it will help in changing the culture of the organization (ETI et al., 2004). Organizations can adopt any TPM pillar to enhance productivity and also improve employee morale & job satisfaction (Patra et al., 2005). TPM implementation has developed the willingness in employees to do autonomous maintenance to optimized equipment effectiveness, reduce breakdown (Ahuja and Khamba, 2007). The implementation of TPM can also improve productivity and reducing losses (Memdez and Rodriguez, 2017; Hooiand Leong, 2017). Implementation of TPM pillars improves overall equipment effectiveness (OEE) by improving equipment availability, quality rate, performance rate (Wakjira and Singh, 2012). TPM implementation initiatives have always been contributed to face the challenges in Indian industry (Ahuja and Kumar, 2009). Ohunakin and Leramo (2012) have said that only one pillar of TPM model, i.e. continuous improvement has been proven that
improvement of OEE by 50% through reduction of losses. OEE is found to be an effective tool for measuring the effectiveness of TPM implementation in most of the industries. It was found that improving Overall Equipment Effectiveness (OEE) is one of the main benefits in TPM (Ramchandra et al., 2016; Patel and Tomar, 2017). Most of ISMEs are not interested to adopt any improvement concept was said by Jain et al. (2014) on the basis of literature review of total 148 research papers published between the periods of 1988 to 2014 in various International Journals as Emerald, Science Direct, Springer, ASME, Conferences, Books & other research outlets.
4. �METHODOLOGY
This study has been carried out in the small and medium scale organizations in India that needs to implement any improvement strategy for manufacturing performance improvement. Figure 2 illustrates the methodology adopted in this study to evaluate TPM strategies for the manufacturing performance improvement of Indian SMEs.
5. �QUESTIONNAIRE PREPARATION
A TPM questionnaire has been prepared to evaluate the contribution of TPM strategies in the successful implementation of TPM in ISMEs. A short and easy-to-answer questionnaire was developed through the process as shown in figure 3.
Figure 2: Methodology employed in the study
DOI: 10.26488/IEJ.6.10.5
DOI: 10.26488/IEJ.6.10.5
DOI: 10.26488/IEJ.6.10.5
ISSN:2581-4915
ISSN:2581-4915
ISSN:2581-4915

25
INDUSTRIAL ENGINEERING JOURNALMarch 2018
Figure 3: Procedure for the development of Questionnaire
It has been found that, the five-point Likert type scale used in this questionnaire to rate all the responses obtain are suitable. A total 151 questions were asked in the Questionnaire. In Likert scale, point 1 represents “strongly disagree” while point 5 represents “strongly agree” for each question asked. The
questionnaire was explained to top management of individual organizations and requested to enter the facts or his/her ideas on each question. There are 2 parts in the questionnaire. Part 1 is designed to obtain general organizational information, including:
Part 1
Part 2
· Organization Name;
· Organization Address;
· Respondent’s Name and Designation;
· Respondent contact number; · Primary product of the organization; · Type of company;
· Primary Information;
· Implementation of TPM pillars or principles;
· Preventive Maintenance;
· TPM Enablers for an organization; · TPM Pillars; · Important barriers in TPM Implementation; · Correlation of issues with TPM; · Impact of Implementation of TPM pillars or principles; · Benefits of Implementation of TPM principles or pillars;
The authors have designed this questionnaire to collect information from top level management (managers & Engineers) regarding the status of their own organizations as well as their ideas and thinking for manufacturing performance improvement. This questionnaire has covered all the aspects of TPM. The authors have requested to the Manager or Engineer of three different organizations to pre-test and three academicians to pilot-test the questionnaire for finding the improvement needed. The questionnaire has revised as per the suggestions given from these experts from academia and industry before sending to the targeted organizations. The questionnaire was written in simple English which can be easily understood by respondents. In India, the procedure of sending questionnaires and receiving responses through E-mail is not adequate. To get the reliable responses through questionnaires, the authors personally visited each company and explain the purpose of this questionnaire. In this study, authors have approached 200 organizations covering electronic/electrical, m/c component,
textile, food, and printing and packaging industry, and oil industry, chemical industry, rolled product, sugar mill, fasteners and plastic industry and others by the authors, for the evaluation of TPM strategies in ISMEs. The authors have included only small and medium manufacturing organizations of north & central India not service industries in this study. Researchers have got to succeed to visit 141 ISMEs personally and received 129 filled questionnaires from the respondents.
Table 3: Survey Response Rate
S. No. Items Numbers
1. Numbers of organizations
approached
200
2. Numbers of organizations visited 141
3. Total responses received 129
4. Unusable responses 15
5. Usable responses 114
DOI: 10.26488/IEJ.6.10.5
DOI: 10.26488/IEJ.6.10.5
DOI: 10.26488/IEJ.6.10.5
ISSN:2581-4915
ISSN:2581-4915
ISSN:2581-4915

26
INDUSTRIAL ENGINEERING JOURNALMarch 2018
Table 4: Breakdown of Responses given by the Organizations
S.
No.
Type of organization
Small scale
organization (70/114 = 61.40%)
Medium scale
organization (44/114 = 38.60%)
Total SMEs
1.
Food Industry
13 / 114 = 11.4%
0
13 / 114 = 11.4%
2.
Auto / M/c component Industry
8 / 114 = 7%
9 / 114 = 7.9%
17 / 114 = 14.9%
3.
Printing / Packaging Industry
7 / 114 = 6.1%
1 / 114 = 0.9%
8 / 114 = 7%
4. Oil Industry 7 / 114 = 6.1% 8 / 114 = 7% 15 / 114 = 13.1%
5. Textile Industry 2 / 114 = 1.75% 3 / 114 = 2.6% 5 / 114 = 4.35%
6. Electronics / Electrical Industry 11 / 114 = 9.6% 4 / 114 = 3.5% 15 / 114 = 13.1%
7. Chemical Industry / Tyre plant 5 / 114 = 4.4% 4 / 114 = 3.5% 9 / 114 = 7.9%
8. Rolled product / Plastic Industry 5 / 114 = 4.4% 2 / 114 = 1.75% 7 / 114 = 6.15%
9.
Fasteners
1 / 114 = 0.9%
6 / 114 = 5.2%
7 / 114 = 6.1%
10. Casting component / Stone
Industry 1 / 114 = 0.9%
2 / 114 = 1.75%
3 / 114 = 2.65%
11.
Sugar mill
1 / 114 = 0.9%
2 / 114 = 1.75%
3 / 114 = 2.65%
12.
Other
9 / 114 = 7.9%
3 / 114 = 2.6%
12 / 114 = 10.5
The authors have found 114 filled usable responses out of 129 filled questionnaire which is 57% of the total approached
organizations as shown in Table 3.
Figure 4: Input and Output parameters
These usable responses have classified on the basis of product manufactured as shown in table 4.The authors have compiled and analyzed these responses to find the need for TPM strategies in ISMEs and also identified 4 input and 6 output parameters from questionnaire data as given in table 5 and table
6 respectively. Figure 4 illustrates the interrelationships between Input parameters (I1, I2, I3 and I4) and Output parameters (O1, O2, O3, O4, O5 and O6). These parameters are found from literature review and questionnaire survey as given in table 5 and table 6.
DOI: 10.26488/IEJ.6.10.5
DOI: 10.26488/IEJ.6.10.5
DOI: 10.26488/IEJ.6.10.5
ISSN:2581-4915
ISSN:2581-4915
ISSN:2581-4915

27
INDUSTRIAL ENGINEERING JOURNALMarch 2018
Table 5: Input ParametersInput Parameters (TPM Implementation Strategies):
I1: Top Management Leadership 1. Production and maintenance departments are adequately staffed and motivated to do their job. 2. Your organization encourages the cross functional teams to resolve the issues affecting both production and maintenance department. 3. Coordination among maintenance, production, engineering, planning and management is good in your plant. 4. The organization should compete with other organizations in this competitive scenario. 5. Top management has communicated to all employees regarding TPM principles or pillars. 6. Your organization has TPM quality manual and policy. 7. The responsibility and authority of maintenance department are clearly defined. 8. Your organization is following 5S concept. 9. Your organization is motivating employees through rewards. 10. Your organization implements suggestion schemes, small group activities, quality circle approach to improve maintenance quality. 11. Your organization has prepared a TPM Implementation plan or thinks to implement any one of TPM pillars. 12. Top management strongly encourages the employee involvement in TPM.
I2: Preventive Maintenance Initiatives 1. How many plant equipment’s are considered under preventive maintenance program? 2. Your organization has an effective preventive maintenance (PM) program. 3. Your organization extensively uses well defined checklists for maintenance and inspection. 4. Your organization records the information regarding maintenance into the equipment log book. 5. A maintenance program is updated and reviewed periodically time-to-time in your organization. 6. Your organization is tracking preventive maintenance program cost. 7. Countermeasures are to be deployed effectively.
I3: Implementation of TPM Pillars 1. Autonomous Maintenance (AM)
· Production operators should accept that the autonomous maintenance is their responsibility.
· Production operators must also be considered for training every year.
· Both production and maintenance personnel should be involved in equipment selection decision.
· Both production and maintenance personnel should work together.
· Production operators should do a daily maintenance task on their machines.
· Production operators should have demonstrated the ownership of their machines.
· Cleaning, lubricating and tightening (C-L-T) standards should be developed or implemented in the organization. 2. Continuous Improvement (CI)
· The employee should search new ideas and technologies for information as a part of CI practice.
· Employees must take reasonable risks by continuously experimenting with the new ways of doing work.
· Employees must use failures as an opportunity to learn as part of continuous improvement.
· A number of small changes are better than a big change for the improvement of the organization.
· Implementation of CI is not limited to, production & maintenance area; it can also be extended to the administration. 3. Maintenance Planning & Mobile Maintenance (MP&MM)
· Inventory for maintenance should be available when needed.
· The organization should prepare a schedule in advance for various types of maintenance activities.
· Machines should be free from any breakdowns to produce defect free product for customer satisfaction.
· Mobile maintenance is suitable for maintenance of machines instantly.
· Mobile maintenance and preventive maintenance can reduce unplanned downtime of machines. 4. Quality Maintenance & Mock Drill (QM&MD)
· The organization should record performance metrics like OEE, MTTR, MTBF etc.
· A maintenance program should include procedures & practices for equipment enhancement.
· A maintenance program should include training of maintenance personnel in the appropriate field.
· Quality maintenance should focus on customer delight and customer satisfaction.
· Mock-dill or rehearsal of maintenance tasks to reduce MTTR and improve MTBF and productivity.
· Root causes of all the losses should be tracked.
· Production system can be improved by assessing OEE. 5. Maintenance Management (MM)
· The organization should track the overall maintenance program cost for new initiatives.
· Maintenance cost analysis is very important, especially in SMEs.
· Maintenance cost should also be optimized for survival in this competitive environment for any organization. 6. Education, Training & Knowledge Management (ET&KM)
· The potential of the workforce through the training, education, skills and knowledge should increase.
· Production operators should also be motivated for training & education every year.
· Lack of knowledge is more dangerous than no knowledge regarding any issue.
· Top management is taking part in making their employees multi-Skilling.
· Evaluate employees skill to improve it time-to-time. 7. Administration & Office TPM (AOT)
· Administrative and office departments are also playing a vital role in the Manufacturing as well as in other departments in reducing waste and losses.
DOI: 10.26488/IEJ.6.10.5
DOI: 10.26488/IEJ.6.10.5
DOI: 10.26488/IEJ.6.10.5
ISSN:2581-4915
ISSN:2581-4915
ISSN:2581-4915

28
INDUSTRIAL ENGINEERING JOURNALMarch 2018
Table 6: Output Parameters
Output Parameters (Manufacturing Performance)
O1: Organizational Achievement O2: Productivity 1. Improved housekeeping & work place organization. 2. Effective office administration and management. 3. Effective use of existing technologies. 4. Overall Equipment effectiveness improvement. 5. Enhance Autonomous maintenance capabilities. 6. Employee empowerment. 7. Achieving high return on capital employed. 8. Development of Core level Competencies. 9. Increased Profit 10. Performance of business improves. 11. Enhanced Professionalism in the Organization. 12. The image of the Organization improves.
1. Improve capacity of production lines. 2. Improve controls on production lines. 3. Enhanced Production rates. 4. Improve overall productivity. 5. Movement of operators and materials decreases. 6. Improve process flow. 7. Set-up time decreases. 8. Cycle time decrease.
O3: Cost O4: Quality 1. Operating cost decrease. 2. Cost of consumables decreases. 3. Cost of overhead expenditure decreases. 4. Cost of inventories decreases. 5. The inspection cost decrease. 6. Reduce product cost.
7. Customer complaints decrease. 8. Utilization of quality tools improves. 9. Scrap and rework decrease. 10. Operator mistakes decrease. 11. Total percentage of defects decrease. 12. Improve Quality.
O5: Benefits of TPM Implementation 1. TPM Improve employee alignment to organizational goals. 2. TPM improves planned maintenance systems. 3. TPM improves the quality of maintenance as well as productivity. 4. TPM improves teamwork between production and maintenance departments. 5. TPM improves equipment availability and reliability. 6. TPM reduces overall maintenance costs. 7. TPM works to reduce process defects. 8. TPM provides visibility to all major losses that are the results of poor equipment performance. 9. TPM strives for zero breakdowns. 10. TPM implementation improves the potential of employees through education & training. 11. TPM promotes cleanliness. 12. TPM also focuses on health, safety and environmental issues. 13. Every employee has involved in TPM implementation.
O6: Customer Satisfaction 1. Reliability of Delivery improves. 2. Delivery of goods improves. 3. Customer satisfaction improves by fast delivery at the right time.
6. � DATA AN ALYSIS
In this study, the authors have identified four input parameters as top management leadership (I1), preventive maintenance initiatives (I2), Implementation of TPM pillars (I3) and TPM
Enablers (I4) and six output parameters as organizational achievement (O1), productivity (O2), cost (O3), quality (O4), benefits of TPM Implementation (O5) and customer satisfaction (O6). In order to analyze each Input parameters and output parameters, the authors have used a five point Likert scale in
· Additional 5s (Safety, security, satisfaction, survival and support) are improving willingness of employees to do work more efficiently.
· 5S initiatives should be implemented in office area.
· Role of Administration should be limited to ruling and controlling
· Office decisions and process should be executed on the basis of priority. 8. Safety, Health & Environment (SHE)
· Top management should focus on health, safety and environmental issues.
· Top management should be responsible to create a safe working environment.
· Maintenance activities should include activities for safety, health & Environment (SHE).
· The incidents of injuries & identification of accidents and its countermeasures should be implemented effectively on a regular basis. I4: TPM Enablers
1. Respect 2. Responsibility 3. Trust 4. Cooperation 5. Empathy 6. Quality 7. Humbleness 8. Leadership 9. Ensuring competitive prices of the products.
10. Improve flexibility in meeting customer orders. 11. The firm’s reputation is important to the firm’s competitive advantage.
The quality of the supplied product is important to the firm’s competitive advantage 12.
DOI: 10.26488/IEJ.6.10.5
DOI: 10.26488/IEJ.6.10.5
DOI: 10.26488/IEJ.6.10.5
ISSN:2581-4915
ISSN:2581-4915
ISSN:2581-4915

29
March 2018INDUSTRIAL ENGINEERING JOURNAL
which 1, 2, 3, 4, and 5 represents “strongly disagree”, “not agree”, “neutral”, “agree”, and “strongly agree” respectively. SPSS software is used to analyze these I/P and O/P parameters.Moreover the Cronbach's alpha (CA) calculation is used to test the reliability and validity of collecting data for Input and output parameters. The values of CA for these parameters are found in the range of 0.687 to 0.956 (According to Black and Porter 1996; Nunnally 1978, the significant value of CA ≥ 0.65) which represents the reliability of data is significantly higher. Table 7 illustrates the CA value for these parameters. Z-statics (z-test is applicable for more than 30 samples) are used both to explore the level of importance of TPM strategies in TPM implementation and to find the role of TPM strategies in enhancing manufacturing performance.
Mean, standard deviation and z-value of input and output parameters are as shown in table 8. These z-values are compared with critical Z-value at a significant level (1% and 5%) adopted and found that the calculated |z| values is less than the critical z-value hence data are significant. The Pearson correlation coefficients (PCCs) have also worked out as shown by correlation matrix in table 9 to find the correlation between input and output parameters. Since all the PCCs are positive which indicates that each TPM strategy has a positive impact on manufacturing performance improvement? These calculated PCCs values have compared with the critical PCC value at a significant level (1% and 5%) and found that the calculated PCCs values are greater than the critical PCC value hence data are significant.
Table 7: Calculation of Cronbach's Alpha for Input and Output ParametersParameters I1 I2 I3 I4 O1 O2 O3 O4 O5 O6
Cronbach’s Alpha (CA) 0.815 0.687 0.956 0.822 0.802 0.690 0.781 0.744 0.826 0.746
Table 8: Results of Z-test for TPM strategies and Manufacturing Performance
Multiple regression analysis (MRA) of collecting data has done to investigate key input parameters and validate their PCCs as shown in Table 9 in which β and R represents the regression coefficient and multiple correlation coefficients respectively.
The R value, R-square values, Adjusted R-square values, and F values for each dependent variable are calculated and represented in table 10.
Table 9: Computation of Pearson correlation coefficient r between I/P and O/P Parameters O1
O2
O3
O4
O5
O6
I1 0.417**
0.297**
0.016
0.056
0.249**
0.199*I2 0.440** 0.330** 0.196* 0.041 0.411** 0.064I3 0.506** 0.302** 0.212* 0.081 0.822** 0.091I4 0.302**
0.227*
0.197*
0.239* 0.657**
0.221*
*Correlation is significant at 5% level (Critical value = 0.1965) ** Correlation is significant at 1% level (Critical value = 0.2550)
Table 10: Multiple regression analysis between variablesDependent variables
Independent
variables
Beta value
t value
p value
R value
R-square value
Adjusted R-square value
F-value
O1
I3
0.416
3.826
0.000
0.591
0.349
0.325
14.630
I2
0.072
0.587
0.000
I1
0.263
2.285
0.000
I4
-0.008
-0.081
0.001
O2 I2
0.121
0.868
0.000
0.393 0.154 0.123 4.973I3
0.159
1.282
0.000
I1 0.163 1.243 0.001
I4 0.079 0.668 0,008
O3
I3 0.036 0.277 0.038 0.213 0.045 0.019 1.734I4 0.147 1.191 0.020
I2 0.081 0.783 0.075 O4
I4
0.139
1.483
0.070
0.139
0.019
0.011
2.2
O5
I3
0.651
8.903
0.000
0.840
0.706
0.695
65.329I4
0.216
3.107
0.000
I2
0.046
0.558
0.000
I1
0.040
0.514
0.004
O6I4
0.143
1.528
0.055
0.179
0.032
0.015
1.833
I1 0.097 1.039 0.127
TPM strategies Mean Standard deviation Z-statistics Top Management Leadership (I1) 2.481 0.634624 -2.24725**
Preventive Maintenance Initiatives (I2) 2.754 0.552781 -1.86886* Implementation of TPM Pillars (I3) 3.859 0.715349 1.722352*
TPM Enablers (I4) 3.850 0.7041 1.703447*
Manufacturing Performance Mean Standard deviation Z-statistics Organizational Achievement (O1) 3.690 0.665072 0.120646*
Productivity (O2) 3.712 0.589813 0.182999* Cost (O3) 3.527 0.745988 -0.36715*
Quality (O4) 3.635 0.684699 -0.03853* Benefits of TPM Implementation (O5) 3.748 0.662215 0.282651*
Customer Satisfaction (O6) 3.578 0.821363 -0.20924*
Note: *� significant at 5% level (critical value of z = 1.96) *� *significant at 1% level (critical value of z = 2.550)
DOI: 10.26488/IEJ.6.10.5
DOI: 10.26488/IEJ.6.10.5
DOI: 10.26488/IEJ.6.10.5
ISSN:2581-4915
ISSN:2581-4915
ISSN:2581-4915

30
INDUSTRIAL ENGINEERING JOURNALMarch 2018
7. � RESULTS & DISCUSSION
A questionnaire survey was conducted by the authors to access the current status of TPM strategies in Indian SMEs and also to identify the need of these strategies for manufacturing performance improvement. The data has been collected from various small & medium scale organizations of India as food, oil, packaging, auto, textile, electronics, chemical, steel industries etc. situated in North-Central India through the questionnaire survey. Most of the approached organizations had not implemented TPM, but management of these organizations wants to implement for their manufacturing performance improvement. The mean values of these input and output parameters indicate their level of importance in TPM Implementation. Implementation of TPM Pillars is the key parameter followed by TPM Enablers, preventive maintenance initiatives and then top management leadership. The 75% of PCCs is significant at the 5% level (range of 0.1965 to 0.2550) and 1% level (more than 0.2550) of significance. In most of the cases the value of factor p is less than 0.05 (obtained by using multiple regression analysis) hence concluded that various input and output parameters are highly correlated to each other. The data collected in this study are reliable and validate as shown by CA in table 7. SPSS software is used for this analysis. Table 9 shows that TPM implementation strategies (Input parameter) and manufacturing performance improvement (Output parameter) are highly correlated as to signify by a PCC (r). These relationships between input and output parameters can be used to indicate the effectiveness of TPM implementation strategies toward manufacturing performance improvement. Further results of correlation indicated that top management leadership has a positive effect on organizational achievement, Productivity, benefits of TPM implementation and customer satisfaction up to a great extent but not on cost and quality. The second input parameter as preventive maintenance initiatives also has a positive effect on organizational achievement, Productivity, cost and benefits of TPM implementation up to a great extent but not on quality and customer satisfaction. The third input parameter as implementation of TPM pillars has a positive effect on all output parameters except cost and customer satisfaction. And last input parameter as TPM Enablers also shows the positive impact on all the output parameters. The authors have proposed a TPM model for Indian SMEs on the basis of the third I/P parameter. Pillars of this proposed model are applicable to Indian SMEs and also in large organizations. These pillars can also be implemented in Non-Indian organizations if they feel comfortable to adopt.
8. � CONCLUSION
This paper has reported that how to evaluate the TPM Strategies for manufacturing performance improvement in ISMEs. For that a questionnaire has been designed on the basis of 5 Likert scale for data collection. The result of this questionnaire survey indicates that Indian SMEs are not in habit to adopt TPM strategy. This questionnaire survey also indicates that these organizations are very interested to implement any one of TPM strategies for their manufacturing performance improvement. This study identified some I/P and O/P parameters and interrelationship between them. The SPSS software is useful for
the checking of reliability and validity of the collected data. This study also depicts that how different input parameters are related to organizational achievement, productivity, cost, quality, benefits of TPM implementation and customer satisfaction. The third I/P parameter, i.e. implementation of TPM pillars is the key TPM strategy for manufacturing performance improvement in this study. The authors have proposed a TPM model for ISMEs consisting 8 pillars as Autonomous Maintenance, Continuous Improvement, Maintenance Planning & Mobile Maintenance, Quality Maintenance & Mock drill, Maintenance Management, Education & Training, Administration & Office TPM and safety, health & Environment with a strong base of 10S. The flexibility of the implementation of individual pillars in ISMEs is the novelty of the model in this paper. The finding of this study suggests that effective TPM implementation strategies are significantly contributing towards manufacturing performance improvement.
ACKNOWLEDGEMENT
The authors would like to thank Amity University, Jaipur, Rajasthan and I.K. Gujral PTU Jalandhar, Punjab for providing an opportunity to do the research work. The authors would also like to thank the reviewers for their valuable comments. This work was supported by the “University Grants Commission (UGC), New Delhi” under grant number “F.30-1/2014/RA-2014-16-GE-PUN-5159(SA-II)” and dated Ferbury 20, 2015 under the Research Award Scheme.
REFERENCES
1. Ahmed, S., Hassan, M.H., and Taha, Z. (2005), “TPM can go beyond main tenance: excerp t f rom a case implementation”, Journal of Quality in Maintenance Engineering, Vol. 11, Issue 1, pp:19-42.
2. Ahuja, I.P.S., and Khamba, J.S. (2007), "An evaluation of TPM implementation initiatives in an Indian manufacturing enterprise", Journal of Quality in Maintenance Engineering, Vol. 13,Issue 4, pp:338 – 352.
3. Ahuja, I. P. S., and Khamba, J. S.(2008), “An Evaluation of TPM Initiatives in Indian Industry for Enhanced Manufacturing Performance.International Journal of Quality and Reliability Management, Vol. 25, Issue 2, pp:147–172.
4. Ahuja, I.P.S., and Kumar, P. (2009),"A case study of total productive maintenance, implementation at precision tube mills", Journal of Quality in Maintenance Engineering, Vol. 15, Issue 3, pp:241 – 258.
5. Amin, S. S., Atre, R. Vardia, A., Gupta, V. and Sebastian, B.(2013),“Indigenous development amongst challenges, International journal of productivity and performance management, Vol. 62, Issue3, pp:323 – 338.
6. Axline, L.L. (1991), “TQM: a look in the mirror”, European Business Review, Vol. 95, Issue 40, pp:30–41.
7. Black, S.A. and L.J. Porter. (1996), “Identification of critical factors of TQM.” Decision Science,Vol. 27, Issue 1, pp:1-19.
8. Bogue, G.E. (1997),“Beyond systems: moral outrage and other servants of quality”, Technovation, Vol. 14, Issue 3,
DOI: 10.26488/IEJ.6.10.5
DOI: 10.26488/IEJ.6.10.5
DOI: 10.26488/IEJ.6.10.5
ISSN:2581-4915
ISSN:2581-4915
ISSN:2581-4915

31
INDUSTRIAL ENGINEERING JOURNALMarch 2018
pp:7–28.
9. Deshmukh, Sunil V. and Chavan, A. (2012), “Six Sigma and SMEs: a critical review of literature”, International Journal of Lean Six Sigma, Vol. 3, Issue 2, pp: 157-167.
10. ETI, M. C., Ogaji, S. O. T., and Probert, S. D. (2004), “Implementing Total Productive Maintenance in Nigerian Manufacturing Industries”, Applied Energy, Vol. 79, Issue 4, pp: 385 - 401.
11. Eugen, P. (2010), “Implementation $ Results of Total Productive Maintenance In a SME” Fascicle of Management and Technological Engineering, Vol. 9, Issue 19, pp: 3.167 – 3.172
12. Garg, A. and Deshmukh, S.G. (2006), "Maintenance management: literature review and directions", Journal of Quality in Maintenance Engineering, Vol. 12, Issue 3, pp: 205 – 238.
13. Gibson, P. (1995), “One renewal journey”, The Journal for Quality & Participation, Vol. 18, Issue 4, pp: 62–80.
14. Goetsch, D.L. and Davis, S.B. (2000), “Introduction to Total Quality Management: Quality Management for Production”, Processing and Services, 3rd ed., Prentice Hall International, Englewood Cliffs, NJ
15. Gupta, R. (1996), “Everything in the garden's lovely”, The Economist, Vol. 340, Issue 76, pp: 56.
16. Hansson, J., Backlund, F., and Lycke, L. (2003), "Managing commitment: increasing the odds for successful implementation of TQM, TPM or RCM", International Journal of Quality & Reliability Management, Vol. 20, Issue 9, pp: 993 – 1008.
17. Hirano & Hiroyuki. (1995), “5 pillars of the visual workplace: the source book for 5s implementation”.
18. Hongyi, Sun Richard Yam Ng Wai-Keung (2003), “The implementation and evaluation of TPM – An action case study in Hong Kong Manufacturing Company”, International Journal Advance in Manufacturing Technology, Vol. 22, pp: 224-228.
19. Hooi, Lai Wan and Leong, Tat Yuen (2017) "Total productive maintenance and manufacturing performance improvement", Journal of Quality in Maintenance Engineering, Vol. 23 Issue: 1, pp.2-21.
20. Jain, A., Bhatti, R., and Singh, H.(2015),“OEE enhancement in SMEs through mobile maintenance: a TPM concept”, International Journal of quality & reliability management, Vol. 32, Issue 5, pp: 503 - 516.
21. Jutla, D., Bodorik, P. and Dhaliqal, J. (2002), “Supporting the e-business readiness of small and medium-sized enterprises: approaches and metrics'', Internet Research: Electronic Networking Applications and Policy, Vol. 12, Issue 2, pp: 139-164.
22. Kaur, M., Singh, K. and Ahuja, I.P.S. (2013), "An evaluation of the synergies implementation of TQM and TPM paradigms on business performance", International Journal of Productivity and Performance Management, Vol. 62, Issue 1, pp: 66 – 84.
23. Labib, A.W. (1999), “A framework for benchmarking appropriate productive maintenance”, Management Decision, Vol. 37, Issue 10, pp: 792-799.
24. Lazim, H. M., Ahmad, N., Hamid, K. B. A., and Ramayah, T. (2009), “Total Employee Participation in Maintenance Activity: A Case Study of Autonomous Maintenance Approach”, Malaysia Labor Review, Vol. 3, Issue 2, pp: 47– 62.
25. Méndez, Jonathan David Morales and Rodriguez, Ramon Silva (2017), “Total productive maintenance (TPM) as a tool for improving productivity: a case study of application in the bottleneck of an auto-parts machining line”, The International Journal of Advanced Manufacturing Technology, ISSN: 1433-3015, Vol. 92, Issue 1-4, pp: 1013 - 1026.
26. Modgil, Sachin and Sharma, Sanjay, (2016) "Total productive maintenance, total quality management and operational performance: An empirical study of Indian pharmaceutical industry", Journal of Quality in Maintenance Engineering, Vol. 22 Issue: 4, pp.353-377.
27. MSME website, Govt. of India, Act 2006. “The limit for investment in plant and machinery/equipments for manufacturing/service enterprises as notified as, video S.O. 1642 (E) d td . 29 -09 -2006” and ava i l ab l e a t : http://www.dcmsme.gov.in/faq/faq.htm
28. Nunnally, J.C. (1978),“Psychometric Theory”, McGraw- Hill, New York, NY.
29. Panneerselvam, Murugadoss K. (2012), “TPM implementation to invigorate manufacturing performance: an Indian industrial rubric” International Journal of Scientific & Engineering Research, ISSN 2229-5518, Vol. 3, Issue 6, pp: 1 – 10.
30. Patel, Dip Kumar and Tomar, Prashantsingh (2017), “Implement Total Productive Maintenance (TPM) concept in manufacturing Industry”, International Conference on Ideas, Impact and Innovation in Mechanical Engineering, 2321-8169, Vol. 5, Issue 6, pp: 102 - 110.
31. Patra, N. K., Tripathy, J. K. and Choudhary, B. K. (2005), "Implementing the office total productive maintenance ("office TPM") program: a library case study", Library Review, Vol. 54, Issue 7, pp: 415 – 424.
32. Pramod, V.R., Devadasan, S.R., Muthu, S., Jagathyraj, V.P., and Moorthy, G.D. (2006), “Integrating TPM and QFD for improving quality in maintenance engineering”, Journal of Quality in Maintenance Engineering, Vol. 12, Issue 2, pp: 150-171.
33. Prashanth, P. M., Ramachandra, C. G., Srinivas, T. R..andRaghavendra, M. J. (2016), "Effect of Total Productive Maintenance (TPM) Implementation in Manufacturing and Service Industries – A Review”, Proceeding of National Conference on Advances in Mechanical Engineering Science (NCAMES-2016), pp: 346 - 350.
34. Ramachandra, C. G., Prashanth, P. M., Srinivas, T. R. And Raghvendra, M. J. (2016), "OEE - A tool to measure the
DOI: 10.26488/IEJ.6.10.5
DOI: 10.26488/IEJ.6.10.5
DOI: 10.26488/IEJ.6.10.5
ISSN:2581-4915
ISSN:2581-4915
ISSN:2581-4915

INDUSTRIAL ENGINEERING JOURNALMarch 2018
32
effectiveness of TPM implementation in industries - A review”, Global Research and Development Journals, ISSN : 2455-5703, 1(12): 92 - 96.
35. Seiling, J.G. (1999), “Reaping the reward and rewarding work”, The Journal of Quality and Participation, Vol. 22, Issue 2, pp: 16–20.
36. Shahanaghi, K. and Yazdian, S. A.(2009), “Analyzing the effects of implementation of Total Productive Maintenance (TPM) in the manufacturing companies: a system dynamics approach. England, UK World Journal of Modeling and Simulation, ISSN: 746-7233, Vol. 5, Issue 2, pp: 120-129.
37. Sherwin, David J. and Jonsson, P. (1995), "TQM, maintenance and plant availability", Journal of Quality in Maintenance Engineering, Vol. 1, Issue 1, pp: 15 – 19.
38. Singh, R.K., Garg, S.K., and Deshmukh, S.G. (2006), “Strategy development by Indian SMEs in plastic sector: an empirical study”, Singapore Management Review, Vol. 28, Issue 2, pp: 65-83.
39. Singh, R. K., Garg, S. K., and Deshmukh, S.G. (2008), “Strategy development by SMEs for competitiveness: a review”, benchmarking: An International Journal, Vol. 15, Issue 5, pp: 525 – 547.
40. Tripathi, D.(2005), “Influence of Experience and Collaboration on Effectiveness of Quality Management Practices: the Case of Indian Manufacturing”, International Journal of Productivity and Performance Management, Vol. 54, Issue 1, pp: 23–33.
41. Oakland, J.S. (1997), “Interdependence and cooperation: the essentials of total quality management”, Total Quality Management, Vol. 8, Issue 2, pp: 10–24.
42. Ohunakin, Olayinka S. and Leramo, Richard O. (2012), “Total Productive Maintenance Implementation in a Beverage Industry: A case study”, Journal of Engineering and Applied Science, ISSN: 1816-948X, Vol. 7, Issue 2, pp: 28 - 133.
43. Wakjira, Melissa Workneh and Singh, Ajit Pal (2012), “Total Productive Maintenance: A Case Study in Manufacturing Industry”, Global Journal of researches in engineering Industrial engineering, Double Blind Peer Reviewed International Research Journal Publisher: Global Journals Inc. (USA) Online ISSN: 2249-4596 Print ISSN:0975-5861, Vol. 12, Issue 1, pp: 25 - 32.
AUTHORS
Dr. Abhishek Jain, Assistant Professor, Amity University Jaipur, RajasthanE-mail:[email protected]
Dr. Harwinder Singh, Professor, Mechanical Engineering Department, GNDEC, Ludhiana, Punjab
Dr. Rajbir S. Bhatti, Assistant Professor, Department of International Business and Supply Chain Management & Aviation, CANADA
DOI: 10.26488/IEJ.6.10.5
DOI: 10.26488/IEJ.6.10.5
DOI: 10.26488/IEJ.6.10.5
ISSN:2581-4915
ISSN:2581-4915
ISSN:2581-4915