Embed Size (px)
Citation preview

www.siemens.com/energy
“An Enterprising Wind”An economic analysis of the job creation potential of the wind sector in ireland

Jobs are at the forefront of the national debate as our society seeks to economically stand tall once more. Examining how emerging technologies and the expanding green energy sector can deliver the growth we need, has perhaps been overlooked in favour of more traditional sectors.
Ireland is a leader in Europe’s renewable energy transition, and wind energy in particular has proven itself as a vital part of the Irish generation mix, providing almost a fifth of our electricity in 2013 alone. However while the benefits of clean energy are publically known
and discussed, too often the job creation potential of the sector remains somewhat side-lined.
The key motivation behind this report is therefore, to add independent academic and economic rigour to this debate, particularly where it relates to the job creation potential of the wind energy sector in Ireland. This research, carried out by TCD and the ESRI addresses the jobs potential and macro-economic investment potential of the wind sector in Ireland. Siemens and IWEA would like to thank Assistant Prof. Eleanor Denny and Dr. Amy O’Mahoney of TCD and Prof. John FitzGerald of the ESRI who carried out the research and produced the report. This report is the first of its kind as it is based on a detailed study of delivered wind energy projects in Ireland.
In addition to the requirements to meet our legal obligations under our 2020 targets, the debate now includes the immense opportunity of harnessing this natural resource, and creating an indigenous industry in Ireland, one that can rival existing industries such as pharmaceuticals and food in its global outlook.
Siemens and IWEA feel that it is critically important that Ireland’s decisions on energy policy are based on the facts, a clear understanding of what is already in place, and the positive potential this sector holds for our economy and our community.
Ireland is fortunate to enjoy one of the best onshore and offshore wind regimes in the world - a resource that is not just about quantity, but also quality. In this report, three scenarios are set out as to the potential future of the wind sector in Ireland. The first scenario sees Ireland
Foreword
achieve our existing EU binding 2020 commitments. Considering the future onset of 2030 renewables targets and the potential to develop our clean energy industry further, we look at additional levels of wind growth including delivering to other European markets in Scenarios 2 and 3.
The ability to create from 8,400 to 35,000 jobs in a domestic industry while contributing to Ireland’s GDP growth in the coming years is highly significant. We believe these benefits need to be considered by all policy makers as part of the local and national discussion on how we sustainably address our future energy needs. Siemens, IWEA and its members will continue to be key players in an indigenous industry which will continue to assist in Ireland’s recovery while at the same time promoting responsible and sensitive development. This report represents part of our contribution and commitment to assist all stakeholders make informed sustainable decisions, decisions that could have economic and environmental benefits for generations to come.
Gary O’Callaghan Kenneth Matthews Head of Energy Sector CEO Siemens Ltd. IWEA
02
1. executive summary 04
1.1 Key Findings: 04
2. introduction 05
3. Background 06
4. scenarios 07
5. Job Creation 08
5.1 Industry Jobs 09
5.2 Grid Jobs 12
5.3 Manufacturing Jobs 14
5.4 Conclusions 16
6. investment 17
6.1 Industry Investment 17
6.2 Grid Investment 18
6.3 Investing in Wind Industry Manufacturing 20
7 Macroeconomic effects 22
7.1 Assumptions 23
7.2 Methodology 25
7.3 Results 25
7.3.1 Debt reduction 27
7.3.2 Revenue Recycled as cut in Taxation 27
8. discussion & policy recommendations 28
8.1 Existing Barriers to achieving potential job levels 29
9. Conclusions 30
10. references 31
Acknowledgements 32
Appendix 1: industry survey 33
Appendix 2: Grid survey 36
Appendix 3: Manufacturing survey 38
Contents
03
04
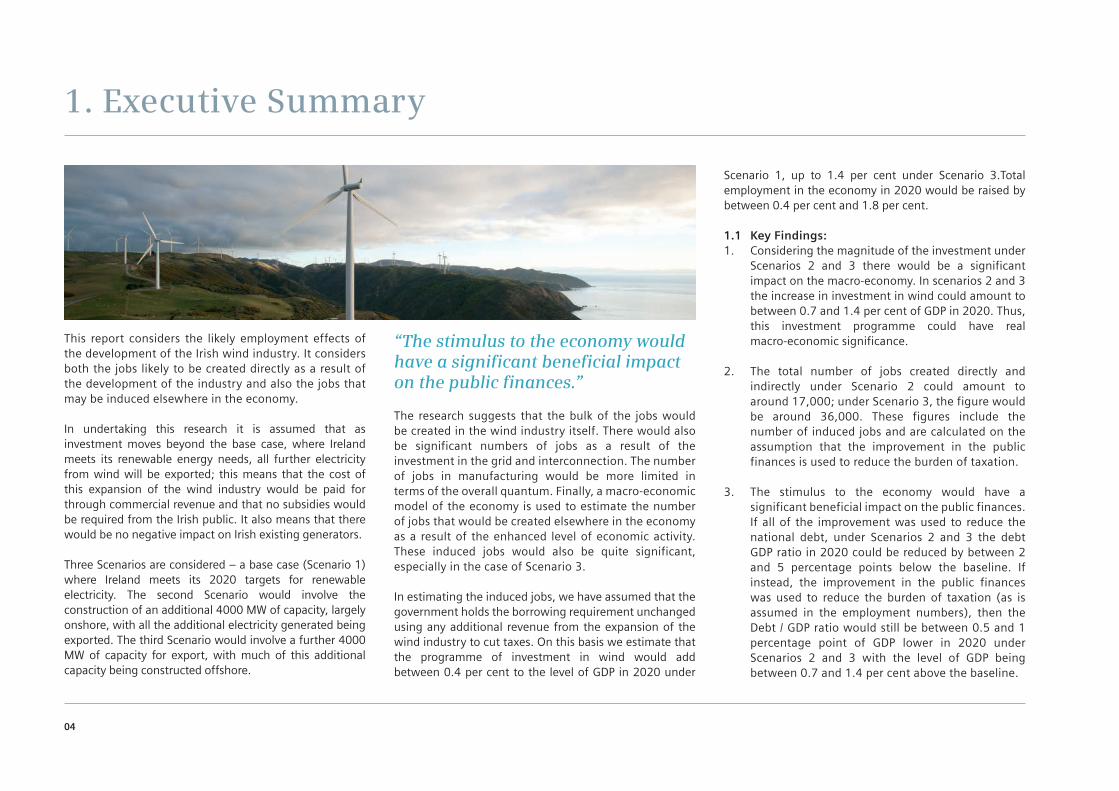
This report considers the likely employment effects of the development of the Irish wind industry. It considers both the jobs likely to be created directly as a result of the development of the industry and also the jobs that may be induced elsewhere in the economy.
In undertaking this research it is assumed that as investment moves beyond the base case, where Ireland meets its renewable energy needs, all further electricity from wind will be exported; this means that the cost of this expansion of the wind industry would be paid for through commercial revenue and that no subsidies would be required from the Irish public. It also means that there would be no negative impact on Irish existing generators.
Three Scenarios are considered – a base case (Scenario 1) where Ireland meets its 2020 targets for renewable electricity. The second Scenario would involve the construction of an additional 4000 MW of capacity, largely onshore, with all the additional electricity generated being exported. The third Scenario would involve a further 4000 MW of capacity for export, with much of this additional capacity being constructed offshore.
The research suggests that the bulk of the jobs would be created in the wind industry itself. There would also be significant numbers of jobs as a result of the investment in the grid and interconnection. The number of jobs in manufacturing would be more limited in terms of the overall quantum. Finally, a macro-economic model of the economy is used to estimate the number of jobs that would be created elsewhere in the economy as a result of the enhanced level of economic activity. These induced jobs would also be quite significant, especially in the case of Scenario 3.
In estimating the induced jobs, we have assumed that the government holds the borrowing requirement unchanged using any additional revenue from the expansion of the wind industry to cut taxes. On this basis we estimate that the programme of investment in wind would add between 0.4 per cent to the level of GDP in 2020 under
1. Executive Summary
“The stimulus to the economy would have a significant beneficial impact on the public finances.”
Scenario 1, up to 1.4 per cent under Scenario 3.Total employment in the economy in 2020 would be raised by between 0.4 per cent and 1.8 per cent.
1.1 Key Findings:1. Considering the magnitude of the investment under
Scenarios 2 and 3 there would be a significant impact on the macro-economy. In scenarios 2 and 3 the increase in investment in wind could amount to between 0.7 and 1.4 per cent of GDP in 2020. Thus, this investment programme could have real macro-economic significance.
2. The total number of jobs created directly and indirectly under Scenario 2 could amount to around 17,000; under Scenario 3, the figure would be around 36,000. These figures include the number of induced jobs and are calculated on the assumption that the improvement in the public finances is used to reduce the burden of taxation.
3. The stimulus to the economy would have a significant beneficial impact on the public finances. If all of the improvement was used to reduce the national debt, under Scenarios 2 and 3 the debt GDP ratio in 2020 could be reduced by between 2 and 5 percentage points below the baseline. If instead, the improvement in the public finances was used to reduce the burden of taxation (as is assumed in the employment numbers), then the Debt / GDP ratio would still be between 0.5 and 1 percentage point of GDP lower in 2020 under Scenarios 2 and 3 with the level of GDP being between 0.7 and 1.4 per cent above the baseline.

The purpose of this research is to consider the likely employment effects in Ireland from the future development of the Irish wind industry. This report considers both the jobs likely to be created directly as a result of the development of the industry and also the jobs that may arise in other sectors of the economy as a result of this investment.
In undertaking this research it is assumed that as investment moves beyond the base case, where Ireland meets its renewable energy needs, all further electricity from wind will be exported; this allows us to assume that the cost of this expansion of the wind industry is paid for through commercial revenue and that no subsidies are required from the Irish public sector. It also means that we do not have to take into account potential negative impact on existing generators of high levels of wind serving an Irish market.
This study concentrates on the potential employment effects of an expansion of the wind industry. It does not attempt to quantify any other effects, such as system costs from ramping, balancing etc.
The remainder of this report is structured as follows: We first present the industry background upon which this report is based in Section 3. In Section 4 we propose three scenarios for the future of the wind industry in the Republic of Ireland in 2025, and use these scenarios to consider job creation and investment levels in Sections 5 and 6 respectively. We use this information in Section 7 to estimate the macroeconomic effects of the direct employment and investment in the Irish wind industry. These results are discussed Section 8 and the report concludes in Section 9.
2. Introduction
05

Energy policy is based on the pillars of sustainability, competitiveness and security of supply. Renewable energy options are particularly appealing in terms of meeting energy policy goals, as they have low emissions, have low or zero marginal cost and thus can be used to increase competitiveness in the market, and allow nations to use whatever renewables they have available domestically, thereby promoting security of supply.
In recent years renewable energy generation for electricity production has been primarily in wind energy systems, largely due to technological advances and cost reduction. Installed wind capacity has grown from 17.4 GW in 2000 to 2825 GW worldwide by the end of 2012 (GWEC 2013). Specifically, installed capacity grew by 18.7 per cent between 2011 and 2012. With international emissions and renewable targets set at increasingly ambitious levels, this growth is set to continue for the foreseeable future. Ireland has over 2000 MW of installed wind capacity (as of January 2014)1 and wind energy in Ireland contributed to 16 per cent of the national demand in 2012. Within the electricity sector Ireland has a target of 40 per cent from renewable sources to be achieved by 2020, of which wind promises to be a major contributor (Government of Ireland 2008).
Given the high renewable energy targets, combined with often less than optimal local conditions for renewables in some states (either through lack of resources or infrastructure), recent EU legislation allows for cooperation agreements between member states which would allow renewable energy to be generated in one
state but consumed (and contribute to the renewable targets) in another. The logic for Europe and Ireland to develop wind energy is that it is the most cost effective method of meeting binding EU targets to reduce emissions and increase energy generation from renewable sources, in addition to advancing both EU and Ireland’s security of supply.
A necessary consequence of developing wind energy is that the required investment will involve significant employment. Of course, the alternative energy sources displaced by wind would also involve some employment effects e.g. in gas fired stations. Ernst & Young (2012) compared wind power to CCGT stations and found that on average in the EU, wind creates 61% more employment than a CCGT unit. However, if the wind energy is exported from Ireland, the jobs created as a result of the investment will arise in Ireland whereas any jobs lost through the displacement of other generators will arise in the country importing the power.
In January 2013, the Irish and British governments signed a Memorandum of Understanding to help progress plans for the trading of renewable energy between both countries. The indicative quantum of wind energy exported from Ireland to the UK in a timeframe up to 2020 would be of such a scale that this would represent a significant increase in wind farm development in Ireland from what is required to deliver the national target of approximately 4 GW of installed capacity.
The aim of the research outlined in this paper is to
3. Background
06
quantify the employment potential in Ireland as domestic and export wind strategies are pursued. We will look at the types of jobs that can be created and associated value in the coming years, infrastructure required, urgency and challenges to deliver on Ireland potential.
1 IWEA Figures as of January 2014 ROI 2011MW
“on average in the EU, wind creates 61% more employment than a CCGT unit.”
We consider three scenarios for different levels of installed wind capacity by 2025, with a view to identifying the cost of infrastructure and the number of jobs that could be created under each scenario. Each of these scenarios considers direct employment as a result of the physical capacity, the grid reinforcement and expansion, and potential manufacturing in the form of wind turbine assembly. Direct employment refers to the total labour necessary in order to meet the installed wind capacity levels. Indirect employment then relates to jobs generated in the economy as a result of expenditure related to installing the wind capacity; we account for this capital expenditure in order to allow us to quantify indirect jobs and the multiplier effects after we calculate the direct employment levels through surveys, detailed industry interviews and questionnaires.
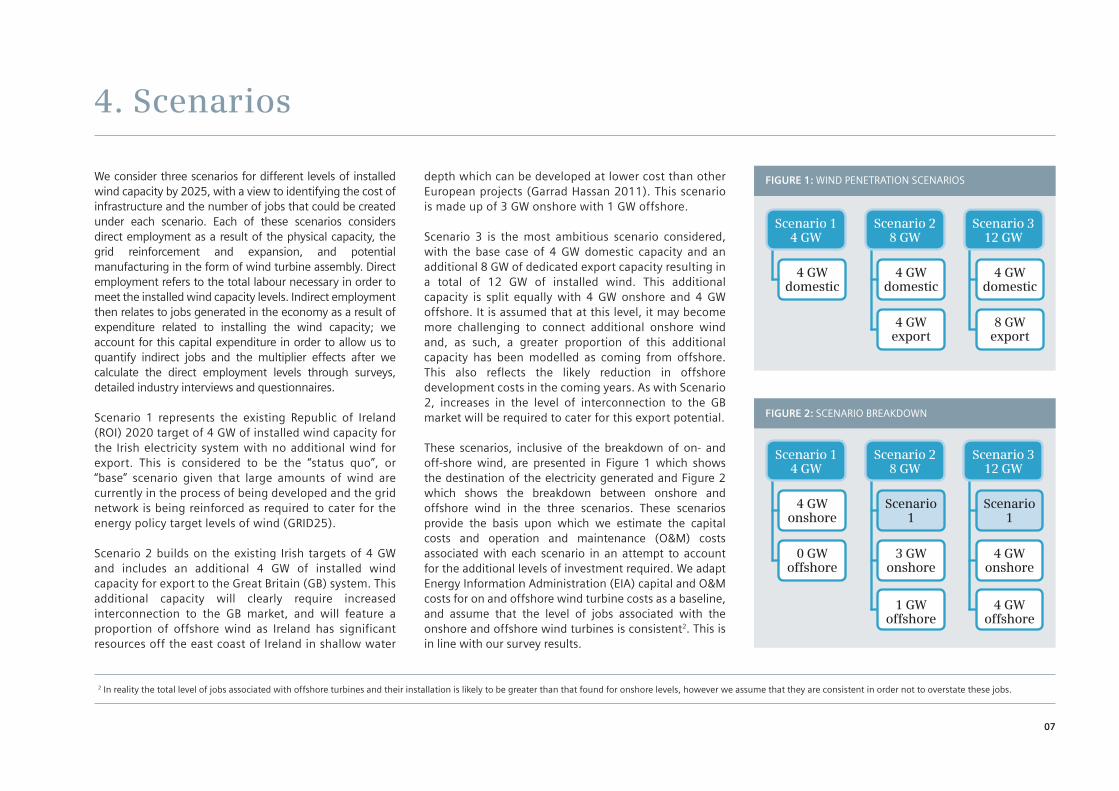
Scenario 1 represents the existing Republic of Ireland (ROI) 2020 target of 4 GW of installed wind capacity for the Irish electricity system with no additional wind for export. This is considered to be the “status quo”, or “base” scenario given that large amounts of wind are currently in the process of being developed and the grid network is being reinforced as required to cater for the energy policy target levels of wind (GRID25).
Scenario 2 builds on the existing Irish targets of 4 GW and includes an additional 4 GW of installed wind capacity for export to the Great Britain (GB) system. This additional capacity will clearly require increased interconnection to the GB market, and will feature a proportion of offshore wind as Ireland has significant resources off the east coast of Ireland in shallow water
depth which can be developed at lower cost than other European projects (Garrad Hassan 2011). This scenario is made up of 3 GW onshore with 1 GW offshore.
Scenario 3 is the most ambitious scenario considered, with the base case of 4 GW domestic capacity and an additional 8 GW of dedicated export capacity resulting in a total of 12 GW of installed wind. This additional capacity is split equally with 4 GW onshore and 4 GW offshore. It is assumed that at this level, it may become more challenging to connect additional onshore wind and, as such, a greater proportion of this additional capacity has been modelled as coming from offshore. This also reflects the likely reduction in offshore development costs in the coming years. As with Scenario 2, increases in the level of interconnection to the GB market will be required to cater for this export potential.
These scenarios, inclusive of the breakdown of on- and off-shore wind, are presented in Figure 1 which shows the destination of the electricity generated and Figure 2 which shows the breakdown between onshore and offshore wind in the three scenarios. These scenarios provide the basis upon which we estimate the capital costs and operation and maintenance (O&M) costs associated with each scenario in an attempt to account for the additional levels of investment required. We adapt Energy Information Administration (EIA) capital and O&M costs for on and offshore wind turbine costs as a baseline, and assume that the level of jobs associated with the onshore and offshore wind turbines is consistent2. This is in line with our survey results.
4. Scenarios
2 In reality the total level of jobs associated with offshore turbines and their installation is likely to be greater than that found for onshore levels, however we assume that they are consistent in order not to overstate these jobs.
FIGURE 1: WIND PENETRATION SCENARIOS
Scenario 14 GW
Scenario 28 GW
Scenario 312 GW
4 GW domestic
4 GW domestic
4 GW export
4 GW domestic
8 GW export
FIGURE 2: SCENARIO BREAKDOWN
Scenario 28 GW
Scenario 1
3 GW onshore
1 GW offshore
Scenario 312 GW
Scenario 1
4 GW onshore
4 GW offshore
Scenario 14 GW
4 GW onshore
0 GW offshore
07
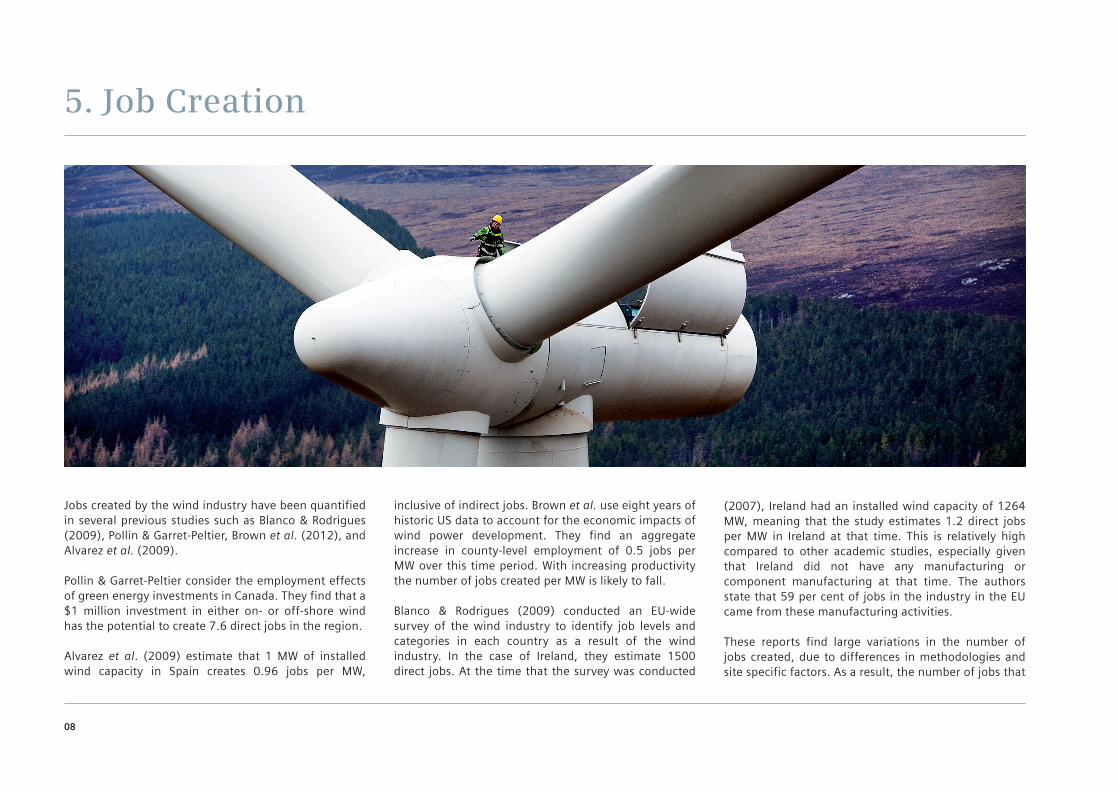
Jobs created by the wind industry have been quantified in several previous studies such as Blanco & Rodrigues (2009), Pollin & Garret-Peltier, Brown et al. (2012), and Alvarez et al. (2009).
Pollin & Garret-Peltier consider the employment effects of green energy investments in Canada. They find that a $1 million investment in either on- or off-shore wind has the potential to create 7.6 direct jobs in the region.
Alvarez et al. (2009) estimate that 1 MW of installed wind capacity in Spain creates 0.96 jobs per MW,
inclusive of indirect jobs. Brown et al. use eight years of historic US data to account for the economic impacts of wind power development. They find an aggregate increase in county-level employment of 0.5 jobs per MW over this time period. With increasing productivity the number of jobs created per MW is likely to fall.
Blanco & Rodrigues (2009) conducted an EU-wide survey of the wind industry to identify job levels and categories in each country as a result of the wind industry. In the case of Ireland, they estimate 1500 direct jobs. At the time that the survey was conducted
5. Job Creation
08
(2007), Ireland had an installed wind capacity of 1264 MW, meaning that the study estimates 1.2 direct jobs per MW in Ireland at that time. This is relatively high compared to other academic studies, especially given that Ireland did not have any manufacturing or component manufacturing at that time. The authors state that 59 per cent of jobs in the industry in the EU came from these manufacturing activities. These reports find large variations in the number of jobs created, due to differences in methodologies and site specific factors. As a result, the number of jobs that
can be created in one region as a result of wind cannot be used in order to accurately identify the potential jobs levels elsewhere.
In this report we consider three types of direct employment as a result of wind power on the Irish system:
• Industry employment, which considers all the employment directly in the wind industry such as installation, development, planning, O&M, legal, advisory and investor activity.
• Grid employment, which includes all additional grid employment as a result of wind.
• Manufacturing employment, which is potential future manufacturing employment (should manufacturers choose to set up in Ireland under wind export scenarios).
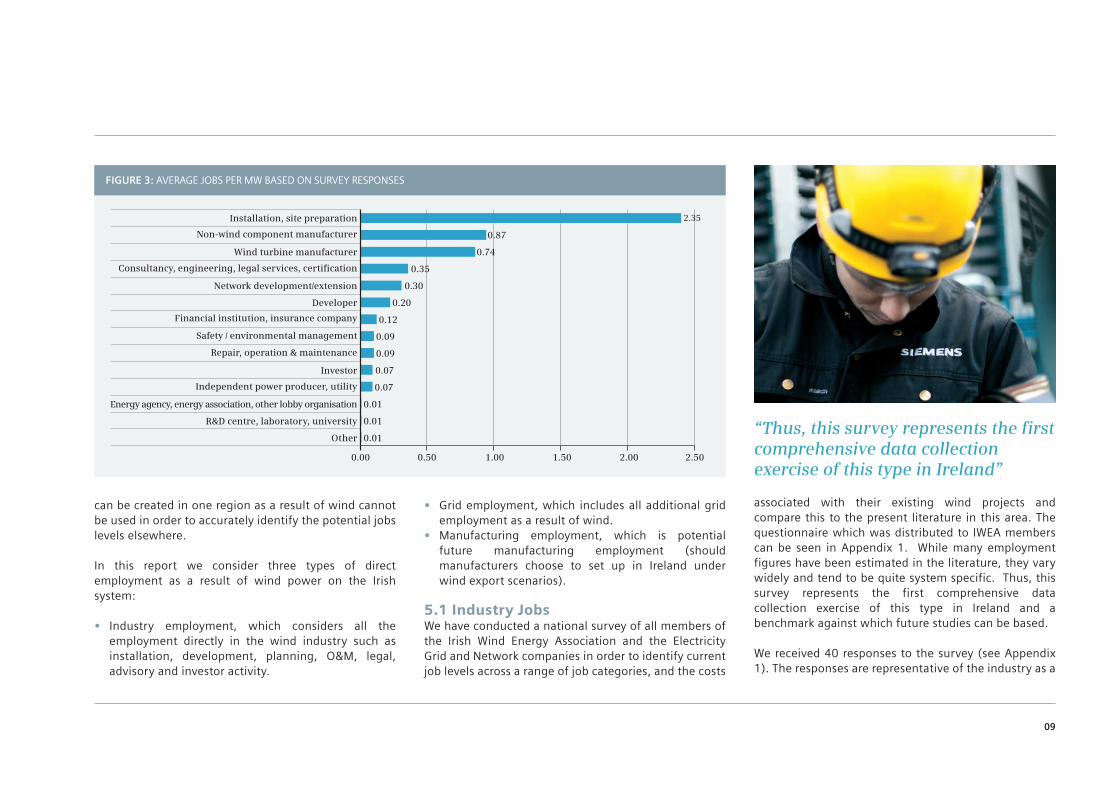
5.1 Industry JobsWe have conducted a national survey of all members of the Irish Wind Energy Association and the Electricity Grid and Network companies in order to identify current job levels across a range of job categories, and the costs
associated with their existing wind projects and compare this to the present literature in this area. The questionnaire which was distributed to IWEA members can be seen in Appendix 1. While many employment figures have been estimated in the literature, they vary widely and tend to be quite system specific. Thus, this survey represents the first comprehensive data collection exercise of this type in Ireland and a benchmark against which future studies can be based.
We received 40 responses to the survey (see Appendix 1). The responses are representative of the industry as a
09
Installation, site preparation 2.35
Non-wind component manufacturer 0.87
Wind turbine manufacturer 0.74
Consultancy, engineering, legal services, certification 0.35
Network development/extension 0.30
Developer 0.20
Financial institution, insurance company 0.12
Safety / environmental management 0.09
Repair, operation & maintenance 0.09
Investor 0.07
Independent power producer, utility 0.07
Energy agency, energy association, other lobby organisation 0.01
R&D centre, laboratory, university 0.01
Other 0.01
0.00 1.000.50 1.50 2.00 2.50
FIGURE 3: AVERAGE JOBS PER MW BASED ON SURVEY RESPONSES
“Thus, this survey represents the first comprehensive data collection exercise of this type in Ireland”
depending on the age of their installed capacity. Figure 3 shows the average jobs per MW by jobs category. Installation and site preparation represents the highest number of jobs per MW, with 2.35 jobs per MW. The categories with the lowest number of jobs per MW are those in R&D and energy agencies, both with 0.01 jobs per MW. These job numbers do not account for the duration of the jobs however.
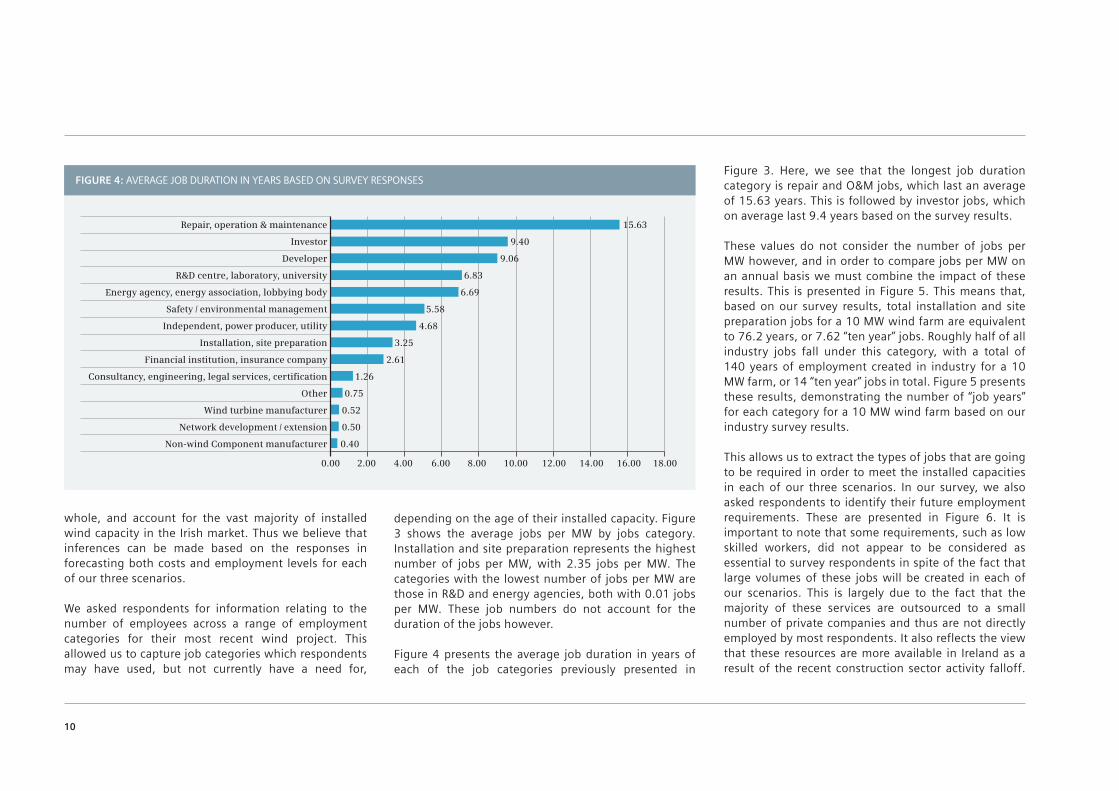
Figure 4 presents the average job duration in years of each of the job categories previously presented in
10
Figure 3. Here, we see that the longest job duration category is repair and O&M jobs, which last an average of 15.63 years. This is followed by investor jobs, which on average last 9.4 years based on the survey results.
These values do not consider the number of jobs per MW however, and in order to compare jobs per MW on an annual basis we must combine the impact of these results. This is presented in Figure 5. This means that, based on our survey results, total installation and site preparation jobs for a 10 MW wind farm are equivalent to 76.2 years, or 7.62 “ten year” jobs. Roughly half of all industry jobs fall under this category, with a total of 140 years of employment created in industry for a 10 MW farm, or 14 “ten year” jobs in total. Figure 5 presents these results, demonstrating the number of “job years” for each category for a 10 MW wind farm based on our industry survey results.
This allows us to extract the types of jobs that are going to be required in order to meet the installed capacities in each of our three scenarios. In our survey, we also asked respondents to identify their future employment requirements. These are presented in Figure 6. It is important to note that some requirements, such as low skilled workers, did not appear to be considered as essential to survey respondents in spite of the fact that large volumes of these jobs will be created in each of our scenarios. This is largely due to the fact that the majority of these services are outsourced to a small number of private companies and thus are not directly employed by most respondents. It also reflects the view that these resources are more available in Ireland as a result of the recent construction sector activity falloff.
FIGURE 4: AVERAGE JOB DURATION IN YEARS BASED ON SURVEY RESPONSES
Repair, operation & maintenance 15.63
Investor 9.40
Developer 9.06
R&D centre, laboratory, university 6.83
Energy agency, energy association, lobbying body 6.69
Safety / environmental management 5.58
Independent, power producer, utility 4.68
Installation, site preparation 3.25
Financial institution, insurance company 2.61
Consultancy, engineering, legal services, certification 1.26
Other 0.75
Wind turbine manufacturer 0.52
Network development / extension 0.50
Non-wind Component manufacturer 0.40
0.00 4.00 10.002.00 6.00 12.008.00 14.00 16.00 18.00
whole, and account for the vast majority of installed wind capacity in the Irish market. Thus we believe that inferences can be made based on the responses in forecasting both costs and employment levels for each of our three scenarios.
We asked respondents for information relating to the number of employees across a range of employment categories for their most recent wind project. This allowed us to capture job categories which respondents may have used, but not currently have a need for,
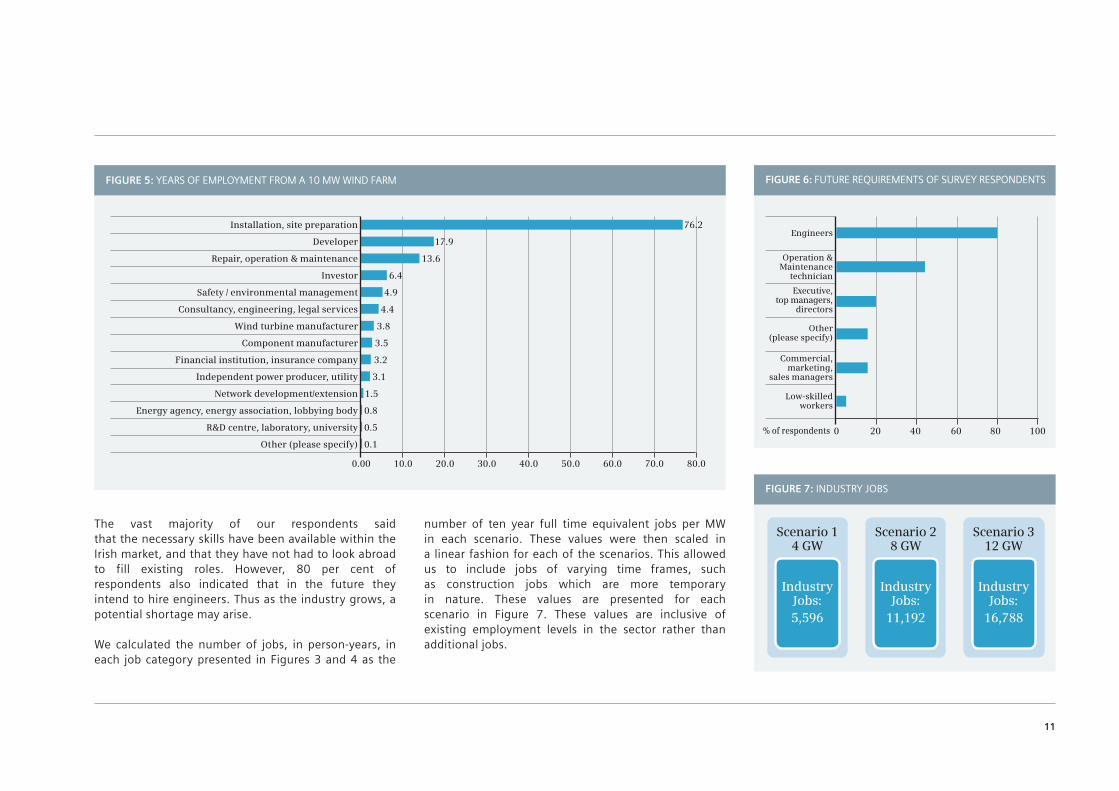
The vast majority of our respondents said that the necessary skills have been available within the Irish market, and that they have not had to look abroad to fill existing roles. However, 80 per cent of respondents also indicated that in the future they intend to hire engineers. Thus as the industry grows, a potential shortage may arise.
We calculated the number of jobs, in person-years, in each job category presented in Figures 3 and 4 as the
number of ten year full time equivalent jobs per MW in each scenario. These values were then scaled in a linear fashion for each of the scenarios. This allowed us to include jobs of varying time frames, such as construction jobs which are more temporary in nature. These values are presented for each scenario in Figure 7. These values are inclusive of existing employment levels in the sector rather than additional jobs.
11
FIGURE 5: YEARS OF EMPLOYMENT FROM A 10 MW WIND FARM
Installation, site preparation 76.2
Developer 17.9
Repair, operation & maintenance 13.6
Investor 6.4
Safety / environmental management 4.9
Consultancy, engineering, legal services 4.4
Wind turbine manufacturer 3.8
Component manufacturer 3.5
Financial institution, insurance company 3.2
Independent power producer, utility 3.1
Network development/extension 1.5
Energy agency, energy association, lobbying body 0.8
R&D centre, laboratory, university 0.5
Other (please specify) 0.1
0.00 20.0 50.010.0 30.0 60.040.0 70.0 80.0
FIGURE 7: INDUSTRY JOBS
Scenario 14 GW
Industry Jobs:5,596
Scenario 28 GW
Industry Jobs:
11,192
Scenario 312 GW
Industry Jobs:
16,788
FIGURE 6: FUTURE REQUIREMENTS OF SURVEY RESPONDENTS
% of respondents 0 40 10020 60 80
Engineers
Operation & Maintenance
technician
Executive, top managers,
directors
Other (please specify)
Commercial, marketing,
sales managers
Low-skilled workers
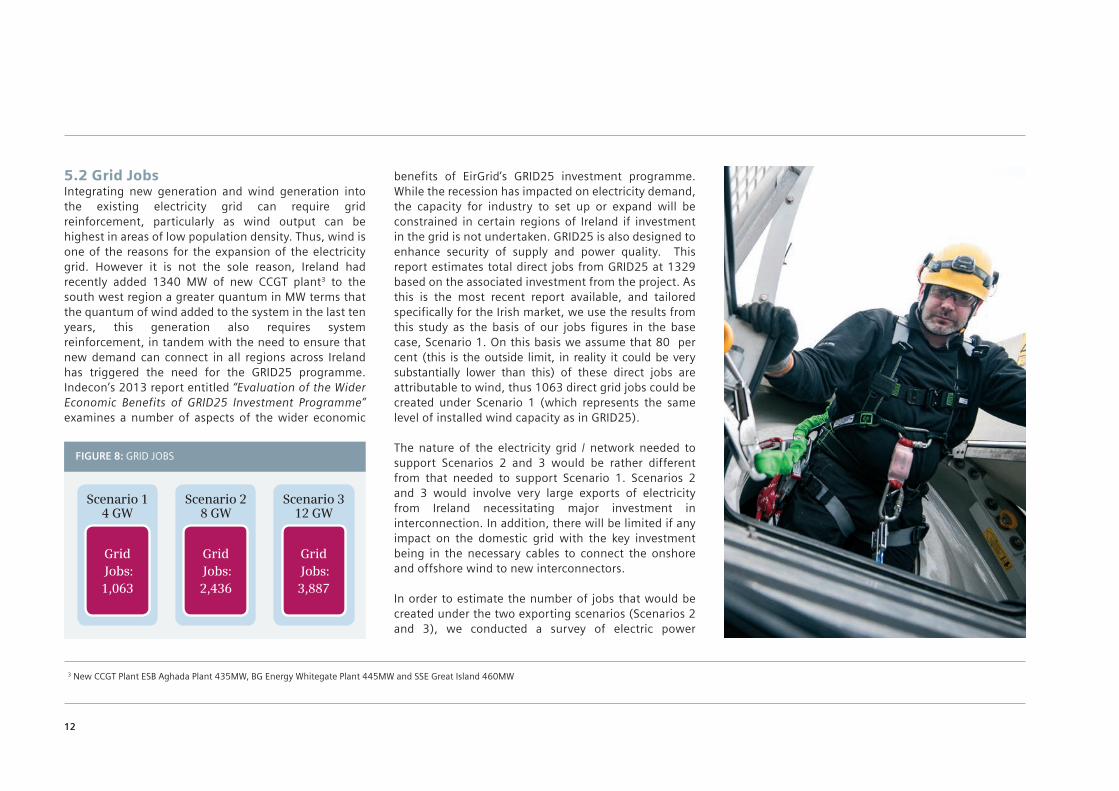
5.2 Grid JobsIntegrating new generation and wind generation into the existing electricity grid can require grid reinforcement, particularly as wind output can be highest in areas of low population density. Thus, wind is one of the reasons for the expansion of the electricity grid. However it is not the sole reason, Ireland had recently added 1340 MW of new CCGT plant3 to the south west region a greater quantum in MW terms that the quantum of wind added to the system in the last ten years, this generation also requires system reinforcement, in tandem with the need to ensure that new demand can connect in all regions across Ireland has triggered the need for the GRID25 programme. Indecon’s 2013 report entitled “Evaluation of the Wider Economic Benefits of GRID25 Investment Programme” examines a number of aspects of the wider economic
benefits of EirGrid’s GRID25 investment programme. While the recession has impacted on electricity demand, the capacity for industry to set up or expand will be constrained in certain regions of Ireland if investment in the grid is not undertaken. GRID25 is also designed to enhance security of supply and power quality. This report estimates total direct jobs from GRID25 at 1329 based on the associated investment from the project. As this is the most recent report available, and tailored specifically for the Irish market, we use the results from this study as the basis of our jobs figures in the base case, Scenario 1. On this basis we assume that 80 per cent (this is the outside limit, in reality it could be very substantially lower than this) of these direct jobs are attributable to wind, thus 1063 direct grid jobs could be created under Scenario 1 (which represents the same level of installed wind capacity as in GRID25).
The nature of the electricity grid / network needed to support Scenarios 2 and 3 would be rather different from that needed to support Scenario 1. Scenarios 2 and 3 would involve very large exports of electricity from Ireland necessitating major investment in interconnection. In addition, there will be limited if any impact on the domestic grid with the key investment being in the necessary cables to connect the onshore and offshore wind to new interconnectors.
In order to estimate the number of jobs that would be created under the two exporting scenarios (Scenarios 2 and 3), we conducted a survey of electric power
3 New CCGT Plant ESB Aghada Plant 435MW, BG Energy Whitegate Plant 445MW and SSE Great Island 460MW
12
FIGURE 8: GRID JOBS
Scenario 14 GW
Grid Jobs:1,063
Scenario 28 GW
Grid Jobs:2,436
Scenario 312 GW
Grid Jobs:3,887

transmission operators and the operator of the electricity distribution system in the Republic of Ireland. The questionnaire distributed can be seen in Appendix 2. These survey responses included questions regarding the required number of employees for the Irish electricity grid for each scenario. The results tended to extrapolate the estimates from the base case. However, as indicated above, it is clear that the nature of the electricity grid needed to support Scenarios 2 and 3 would be rather different from the base case.
As a result, we used IWEA data, to estimate the costs associated with electrical equipment and substation installations and investment in the HVDC grid, in terms of converter stations and cables. On this basis, we estimated that an additional grid investment of €2.5 billion would be needed in Scenario 2 and an additional investment of €5.2 billion in Scenario 3, exclusive of the cost of interconnection. This slightly more than doubles Scenario 2 values due to the increased proportion of offshore wind in Scenario 3.
Using the same number of jobs per investment as seen from GRID25 in Scenario 1, results in direct grid job levels of 2040 in Scenario 2 and 3095 in Scenario 3, exclusive of jobs created from additional interconnection. We estimate the number of jobs created from interconnection separately as the cables are extremely capital intensive, yet do not result in similar levels of jobs. Also many of the jobs involved in building the interconnectors will not arise in Ireland, the focus of this study.
In addition to the network to connect up the wind generators, there would be substantial investment in the interconnectors themselves.
Ireland currently has two interconnectors to the GB market – the Moyle interconnector and East-West interconnector, both with a rated capacity of 500 MW. Wind and all other generators are able to use these interconnectors in order to trade their electricity into, or from, the GB market. For Scenarios 2 and 3, the new interconnectors that would need to be installed would, initially, be exclusively for exporting domestic onshore and offshore wind to the UK, and therefore the jobs and costs associated with the new interconnectors would be directly as a result of wind.
The most recent interconnector to the GB market cost €600 million (Eirgrid 2008, Denny et al. 2010); of this cost, the HVDC cable was 260 km in length and using data from the International Expert Commission (IEC) Report to Eirgrid (2012), this would have cost approximately €354 million. The remainder of the total cost is broken down mainly into the stations at both ends and employment costs.
Based on job levels from the East-West Interconnection (EWIC), we find that per interconnector, approximately 100 ten year jobs are created4. These jobs are not based on the size of the interconnector but rather the number of interconnectors required; we assume that interconnection as a result of wind would be in 1GW
units, meaning that four new interconnectors would be required in Scenario 2 and potentially up to eight5 in Scenario 3. On this basis, the investment in interconnection would result in additional direct jobs of 396 in Scenario 2 and 792 in Scenario 3.
In Figure 8, the total jobs that might arise as a result of both investment in the domestic network and in interconnection are added together to arrive at the total “grid” jobs under the three scenarios.
4 3700 workers over 45 months5 The current market proven HVDC back to back technology is in 1GW modules, as the technology advances this may move upwards requiring less infrastructure for 8GW exporting.
13
5.3 Manufacturing JobsIn this section we consider the potential job levels that might be expected to arise in manufacturing as a result of a major increase in the scale of deployment of wind turbines in Ireland. Following a review of the literature and discussions with turbine manufacturers and the IDA, the basis upon which full turbine manufacturing facilities firms would set up in Ireland would be: • Minimum output of 1000 MW per annum• Minimum factory timeframe of ten years
Additionally, no manufacturing jobs are considered in Scenario 1 as this is the “status quo”, or “base” scenario. It is considered that that demand would not be sufficiently high in this scenario to entice a manufacturer to set up in Ireland. Despite the desire to progress the EU 2030 climate and energy framework and the positive impact this would have on renewables in Ireland, it is assumed that unless an export market for wind energy is created, the demand for manufacturing of equipment for the wind industry would not be sufficient in the short term to encourage manufacturing to set up in Ireland.
Blanco and Rodrigues (2009) found that the vast majority of wind energy jobs internationally are in the manufacturing sector. To date, this has not been the case in Ireland. Denmark began producing wind turbines in the 1970s, and presently, roughly a third of wind turbines internationally are produced in Denmark (DEA 2013). In addition to manufacturing, Denmark also produces a significant proportion of electricity from
wind. This has been supported through regular expansion of the electricity network and interconnection levels with neighbouring countries (DEA 2013). The size of the manufacturing sector in Denmark devoted to wind reflects the fact that Denmark was first in the field in deploying extensive wind generation. They had “first mover” advantage.
This has resulted in a high level of employment in the Danish wind sector. Blanco & Rodrigues (2009) found that the wind industry in Denmark created 9875 direct jobs - 9000 more than was found for Ireland. This is largely due to the existing manufacturing industry there; Deloitte (2012) found the 76 per cent of all direct jobs in the Danish wind sector were in turbine and component manufacturing.
In Portugal, the German manufacturer ENERCON employs 1,400 in manufacturing blades, towers and other parts for wind turbines.6 These jobs were created over a five year period for a 1.1 GW project that is nearing completion. These facilities are now manufacturing for the export market.
While there have been success cases in terms of manufacturing, such as Denmark and Portugal mentioned above, there can also be uncertainty surrounding the setting up of new wind turbine factories. For example, Wausaukee Composites Inc in Wisconsin opened a nacelles plant in 2008 which was to manufacture 1.5-3 MW turbines. In the following two
6 http://www.jornaldenegocios.pt/empresas/detalhe/enercon_investe_10_milhoes_em_viana_do_castelo.html7 http://news.yahoo.com/arkansas-wind-turbine-plant-stop-123447633.html
14
years it shut down twice, laying off employees. In 2012 it was anticipated that it would produce 800 nacelles annually and employ 200 workers. Yet again, by July 2013, it announced it was closing the plant permanently. This likely relates to the changes in US policy decisions. In Scotland, Wind Towers Scotland was established in 2011 to supply wind turbine towers to Europe. This was recently expanded to employ 130 people, and aims to produce 400 towers by 2017. However, its annual output remains uncertain, and over the course of the past five years the project has changed hands on several occasions.
In Germany, AREVA Wind’s main production facility is based in Bremerhaven and has a workforce of about 300 individuals. This plant is dedicated to the production of the M5000 (5 MW) wind turbine nacelles and hubs. Another manufacturer of wind turbines, Nordex, opened a plant in Arkansas designed to supply nacelles for the US market. However, they have subsequently closed the plant and are centralising production in their Rostock plant in Germany.7 The Spanish company Gamesa has been concentrating its domestic production in Spain in fewer plants while, at the same time, expanding production in low cost destinations, such as India and China.
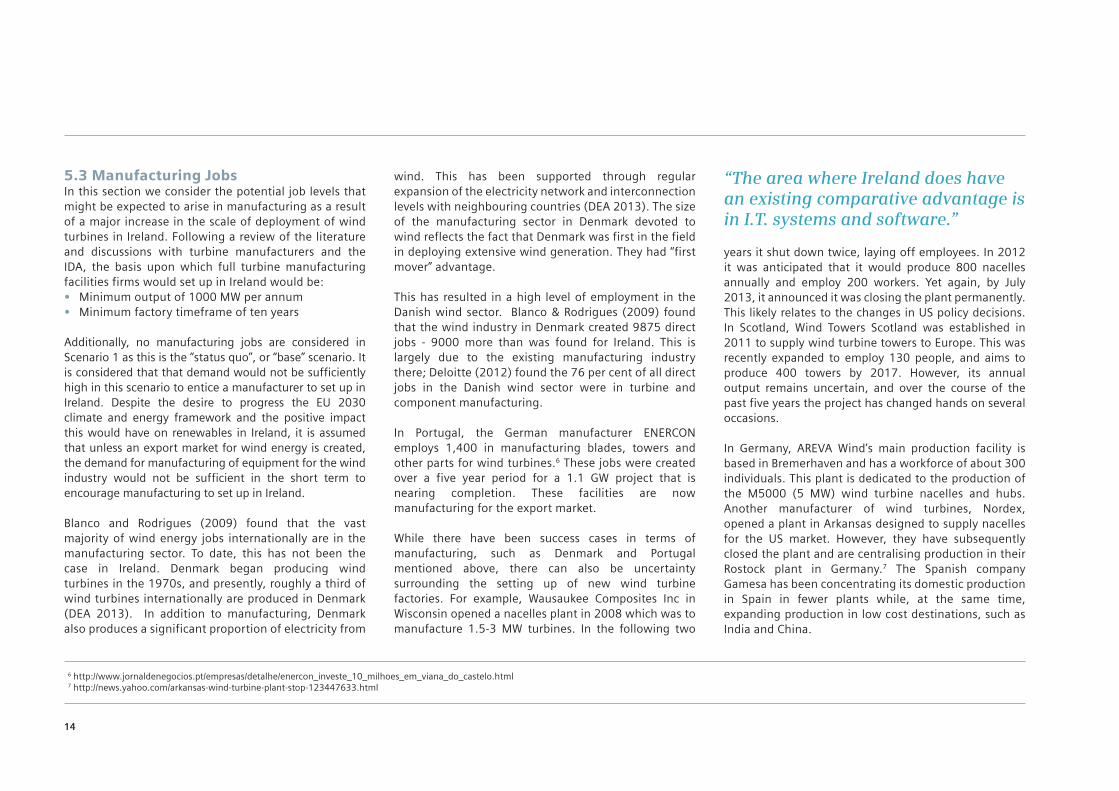
“The area where Ireland does have an existing comparative advantage is in I.T. systems and software.”
Thus, with the exception of Denmark, the evidence suggests that, to date, in developed economies such as the EU and the US, wind generation has not been a major stimulator of employment in manufacturing.
Over the last twenty years, the mechanical engineering sector in Ireland has seen little growth in employment, with an actual fall in the share of manufacturing jobs over the period 1990-2008 from around 9.5% to around 7.5%. Thus, Ireland does not appear to have a comparative advantage in this sector. The areas of manufacturing which showed the greatest expansion in the boom, and the most resilience in the recession, have been more high tech sectors, such as pharmaceuticals, involving very skilled workforces. As a result, while some increase in manufacturing in this sector could be envisaged on foot of major domestic demand for wind turbines, a major exporting industry is unlikely to evolve.
The area where Ireland does have an existing comparative advantage is in I.T. and software. The design of systems for control and management for smart grids etc. is likely to be a more fruitful field for future investment and employment. However, such activity is likely to be driven by world demand rather than purely domestic forces.
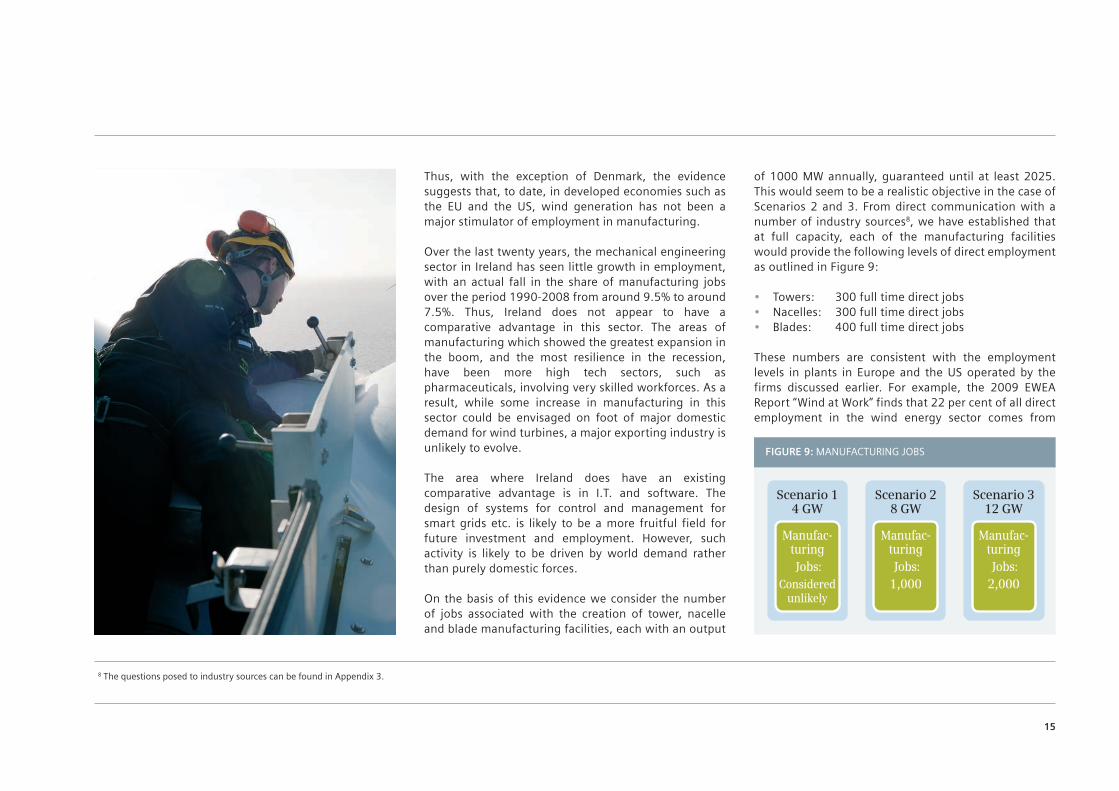
On the basis of this evidence we consider the number of jobs associated with the creation of tower, nacelle and blade manufacturing facilities, each with an output
of 1000 MW annually, guaranteed until at least 2025. This would seem to be a realistic objective in the case of Scenarios 2 and 3. From direct communication with a number of industry sources8, we have established that at full capacity, each of the manufacturing facilities would provide the following levels of direct employment as outlined in Figure 9:
• Towers: 300 full time direct jobs• Nacelles: 300 full time direct jobs• Blades: 400 full time direct jobs
These numbers are consistent with the employment levels in plants in Europe and the US operated by the firms discussed earlier. For example, the 2009 EWEA Report “Wind at Work” finds that 22 per cent of all direct employment in the wind energy sector comes from
15
8 The questions posed to industry sources can be found in Appendix 3.
FIGURE 9: MANUFACTURING JOBS
Scenario 14 GW
Manufac-turing Jobs:
Considered unlikely
Scenario 28 GW
Manufac-turing Jobs:1,000
Scenario 312 GW
Manufac-turing Jobs:2,000

component manufacturing. Bloomberg (2012) estimates that manufacturing employment creates an average of 3 direct jobs per MW, and 5.5 indirect jobs per MW in the supply chain. Experience in other countries finds that nacelle assembly jobs are largely in line with those identified in our analysis. For example, in January 2012 Alstom set up a 300 MW factory in Brazil which created 150 full time jobs (Alstom 2012) and Siemens set up a factory in Kansas which provided 400 jobs for an output of 1500 MW annually (Siemens 2012). Thus, the value we identify of 0.3 direct nacelle jobs per MW is in line with international experience in manufacturing employment levels.
Under Scenario 2, we assume that one of each type of factory (tower, nacelle, and blade) would set up in Ireland, producing an additional 1000 full time jobs. We double this value to two of each factory type under Scenario 3. However, it is noted that jobs levels are much more uncertain in Scenario 3 than in Scenarios 1 and 2.
Following discussion from Industry players, the categories of manufacturing jobs required in each of the facilities considered would be non-specialist in nature and, therefore, this would further benefit a local region in terms of employment levels.
16
5.4 ConclusionsFigure 10 identifies the total number of projected jobs in the wind industry, grid, and manufacturing across each of the three scenarios considered. These results clearly suggest that the majority of jobs created as a result of wind energy development in Ireland are likely to be in the industry category, followed by grid jobs and finally potential manufacturing jobs. While the number of potential manufacturing jobs may appear small relative to those in the previous categories, it should be noted that the majority of the manufacturing jobs would be likely to be low skilled or require on the job training. This means that it is reasonable to assume that the majority of these jobs would be filled by people who would have a higher probability of being unemployed. The inclusion of these manufacturing jobs also results in an increase in the jobs per MW figure from one scenario to the next. The jobs/MW values are as follows:
• Scenario 1: 1.66 direct jobs/MW• Scenario 2: 1.83 direct jobs/MW• Scenario 3: 1.89 direct jobs/MW
These values are in excess of those found in studies by Alvarez et al. (2009,) Brown et al. and Blanco & Rodrigues (2009). This is particularly noteworthy in terms of comparing our analysis with that of Blanco & Rodrigues (2009), as they also considered Irish direct jobs via an EWEA survey. This would imply that in the past four years the number of jobs per MW has increased in Ireland. In order to identify the wider macroeconomic effects of the direct jobs identified in this section, we must first consider the associated costs which will allow us to identify the level of investment in Ireland the levels of wind in each Scenario will create.
Scenario 14 GW
6,659
0
1,063
5,596
Total
Manufacturing
Grid
Industry
Scenario 28 GW
14,628
1,000
2,436
11,192
Scenario 312 GW
22,675
2,000
3,887
16,788
FIGURE 10: DIRECT WIND SECTOR JOBS TOTAL
In this section, the direct investment required by project promoters and operators of the different categories of investment are considered across the three jobs sectors previously analysed. This is important because it provides information to check the consistency of the employment estimates. Also, together with the employment estimates, it provides a guide to the indirect employment effects of the investment and operation of increased wind generation which are analysed in the following section.
In this study we do not consider the costs of any support provided directly or indirectly by the Irish or foreign governments (including the EU) which may be needed to make the investment economically viable.9 Instead, we assume that the investment associated with exporting scenarios are fully met through the industry and paid for through the revenue from the sale of the electricity. We also do not consider the costs of externalities arising from the investment, as we believe this to be outside the scope of this study.
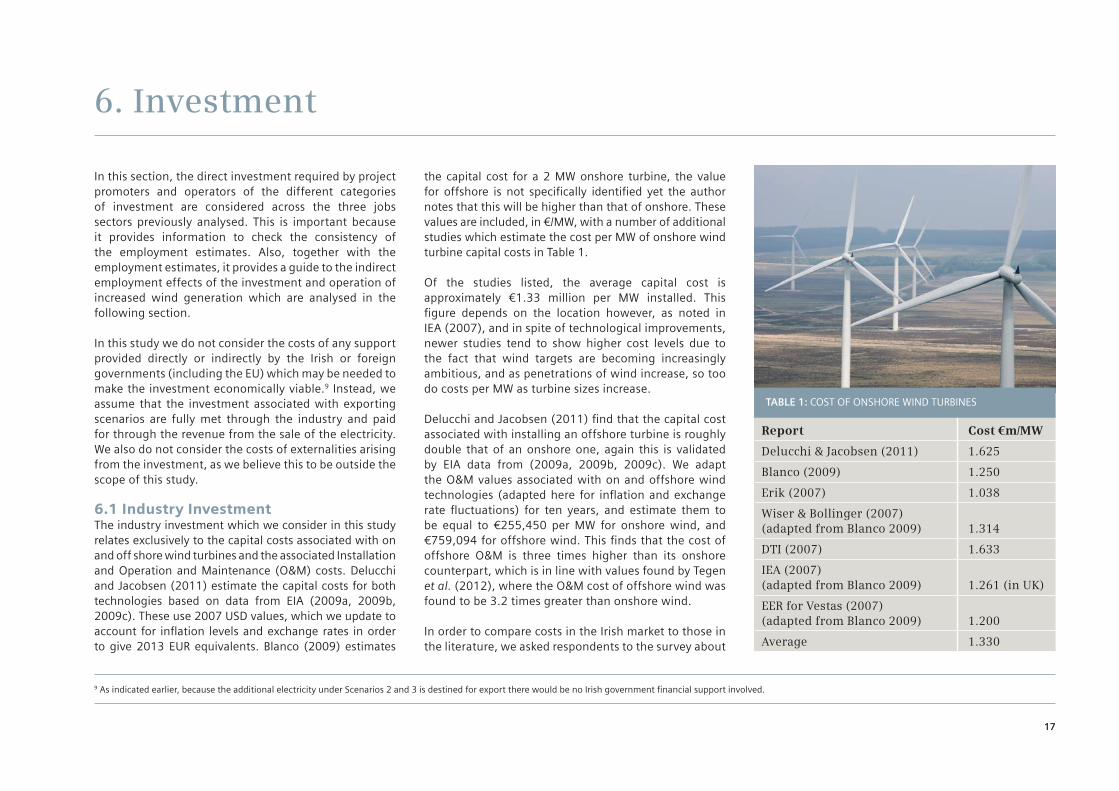
6.1 Industry Investment The industry investment which we consider in this study relates exclusively to the capital costs associated with on and off shore wind turbines and the associated Installation and Operation and Maintenance (O&M) costs. Delucchi and Jacobsen (2011) estimate the capital costs for both technologies based on data from EIA (2009a, 2009b, 2009c). These use 2007 USD values, which we update to account for inflation levels and exchange rates in order to give 2013 EUR equivalents. Blanco (2009) estimates
the capital cost for a 2 MW onshore turbine, the value for offshore is not specifically identified yet the author notes that this will be higher than that of onshore. These values are included, in €/MW, with a number of additional studies which estimate the cost per MW of onshore wind turbine capital costs in Table 1.
Of the studies listed, the average capital cost is approximately €1.33 million per MW installed. This figure depends on the location however, as noted in IEA (2007), and in spite of technological improvements, newer studies tend to show higher cost levels due to the fact that wind targets are becoming increasingly ambitious, and as penetrations of wind increase, so too do costs per MW as turbine sizes increase.
Delucchi and Jacobsen (2011) find that the capital cost associated with installing an offshore turbine is roughly double that of an onshore one, again this is validated by EIA data from (2009a, 2009b, 2009c). We adapt the O&M values associated with on and offshore wind technologies (adapted here for inflation and exchange rate fluctuations) for ten years, and estimate them to be equal to €255,450 per MW for onshore wind, and €759,094 for offshore wind. This finds that the cost of offshore O&M is three times higher than its onshore counterpart, which is in line with values found by Tegen et al. (2012), where the O&M cost of offshore wind was found to be 3.2 times greater than onshore wind.
In order to compare costs in the Irish market to those in the literature, we asked respondents to the survey about
6. Investment
17
9 As indicated earlier, because the additional electricity under Scenarios 2 and 3 is destined for export there would be no Irish government financial support involved.
Report Cost €m/MW
Delucchi & Jacobsen (2011) 1.625
Blanco (2009) 1.250
Erik (2007) 1.038
Wiser & Bollinger (2007) (adapted from Blanco 2009) 1.314
DTI (2007) 1.633
IEA (2007) (adapted from Blanco 2009) 1.261 (in UK)
EER for Vestas (2007) (adapted from Blanco 2009) 1.200
Average 1.330
TABLE 1: COST OF ONSHORE WIND TURBINES
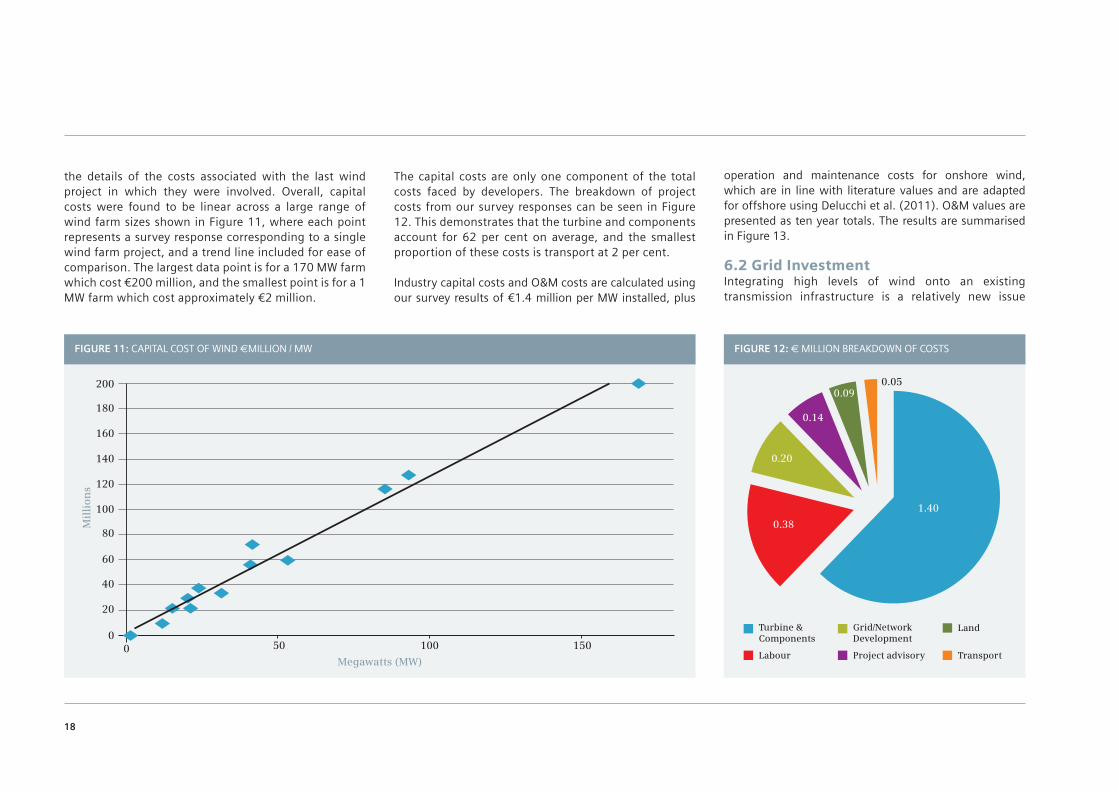
the details of the costs associated with the last wind project in which they were involved. Overall, capital costs were found to be linear across a large range of wind farm sizes shown in Figure 11, where each point represents a survey response corresponding to a single wind farm project, and a trend line included for ease of comparison. The largest data point is for a 170 MW farm which cost €200 million, and the smallest point is for a 1 MW farm which cost approximately €2 million.
The capital costs are only one component of the total costs faced by developers. The breakdown of project costs from our survey responses can be seen in Figure 12. This demonstrates that the turbine and components account for 62 per cent on average, and the smallest proportion of these costs is transport at 2 per cent.
Industry capital costs and O&M costs are calculated using our survey results of €1.4 million per MW installed, plus
18
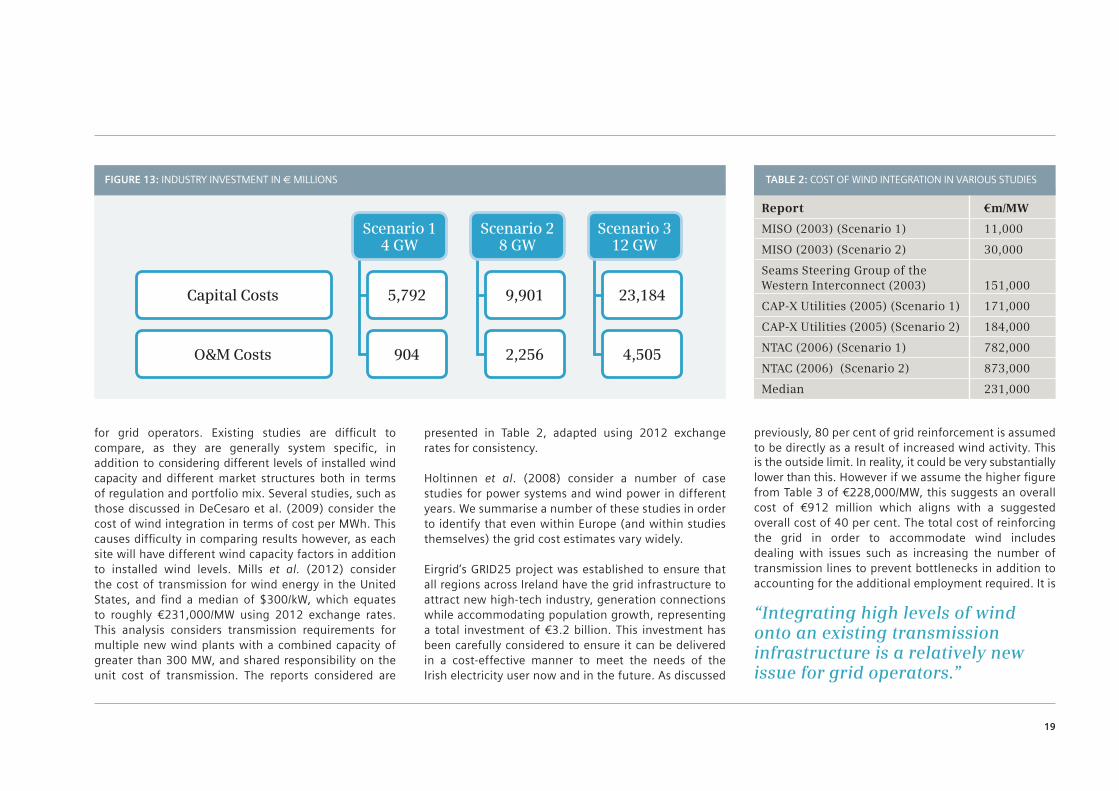
operation and maintenance costs for onshore wind, which are in line with literature values and are adapted for offshore using Delucchi et al. (2011). O&M values are presented as ten year totals. The results are summarised in Figure 13.
6.2 Grid Investment Integrating high levels of wind onto an existing transmission infrastructure is a relatively new issue
FIGURE 11: CAPITAL COST OF WIND €MILLION / MW FIGURE 12: € MILLION BREAKDOWN OF COSTS
200
180
160
140
120
100
80
60
40
20
00 10050 150
Turbine & Components
Labour
Grid/Network Development
Project advisory
Land
Transport
1.40
0.38
0.20
0.14
0.090.05
Mil
lio
ns
Megawatts (MW)
Report €m/MW
MISO (2003) (Scenario 1) 11,000
MISO (2003) (Scenario 2) 30,000
Seams Steering Group of the Western Interconnect (2003) 151,000
CAP-X Utilities (2005) (Scenario 1) 171,000
CAP-X Utilities (2005) (Scenario 2) 184,000
NTAC (2006) (Scenario 1) 782,000
NTAC (2006) (Scenario 2) 873,000
Median 231,000
TABLE 2: COST OF WIND INTEGRATION IN VARIOUS STUDIESFIGURE 13: INDUSTRY INVESTMENT IN € MILLIONS
Scenario 312 GW
Scenario 28 GW
9,901
2,256
Scenario 14 GW
5,792
904
Capital Costs
O&M Costs
23,184
4,505
for grid operators. Existing studies are difficult to compare, as they are generally system specific, in addition to considering different levels of installed wind capacity and different market structures both in terms of regulation and portfolio mix. Several studies, such as those discussed in DeCesaro et al. (2009) consider the cost of wind integration in terms of cost per MWh. This causes difficulty in comparing results however, as each site will have different wind capacity factors in addition to installed wind levels. Mills et al. (2012) consider the cost of transmission for wind energy in the United States, and find a median of $300/kW, which equates to roughly €231,000/MW using 2012 exchange rates. This analysis considers transmission requirements for multiple new wind plants with a combined capacity of greater than 300 MW, and shared responsibility on the unit cost of transmission. The reports considered are
presented in Table 2, adapted using 2012 exchange rates for consistency.
Holtinnen et al. (2008) consider a number of case studies for power systems and wind power in different years. We summarise a number of these studies in order to identify that even within Europe (and within studies themselves) the grid cost estimates vary widely.
Eirgrid’s GRID25 project was established to ensure that all regions across Ireland have the grid infrastructure to attract new high-tech industry, generation connections while accommodating population growth, representing a total investment of €3.2 billion. This investment has been carefully considered to ensure it can be delivered in a cost-effective manner to meet the needs of the Irish electricity user now and in the future. As discussed
19
previously, 80 per cent of grid reinforcement is assumed to be directly as a result of increased wind activity. This is the outside limit. In reality, it could be very substantially lower than this. However if we assume the higher figure from Table 3 of €228,000/MW, this suggests an overall cost of €912 million which aligns with a suggested overall cost of 40 per cent. The total cost of reinforcing the grid in order to accommodate wind includes dealing with issues such as increasing the number of transmission lines to prevent bottlenecks in addition to accounting for the additional employment required. It is
“Integrating high levels of wind onto an existing transmission infrastructure is a relatively new issue for grid operators.”
noted however, that Ireland has four times the average distribution network to supply customers relative to the EU average, and 85 per cent of wind farms by volume (57 per cent by load) are connected to the distribution network.
We also include the cost of the interconnectors using data from IWEA. This estimates that four interconnectors will cost €2.5 billion in Scenario 2 and €5 billion in Scenario 3 – this is just over half the cost per MW relative to the recent EWIC interconnector reflecting economies of scale and expected cost reductions with technological progress.
The O&M of the grid associated specifically with wind are adapted as a proportion of total costs in line with survey results and then calculated for ten years.
20
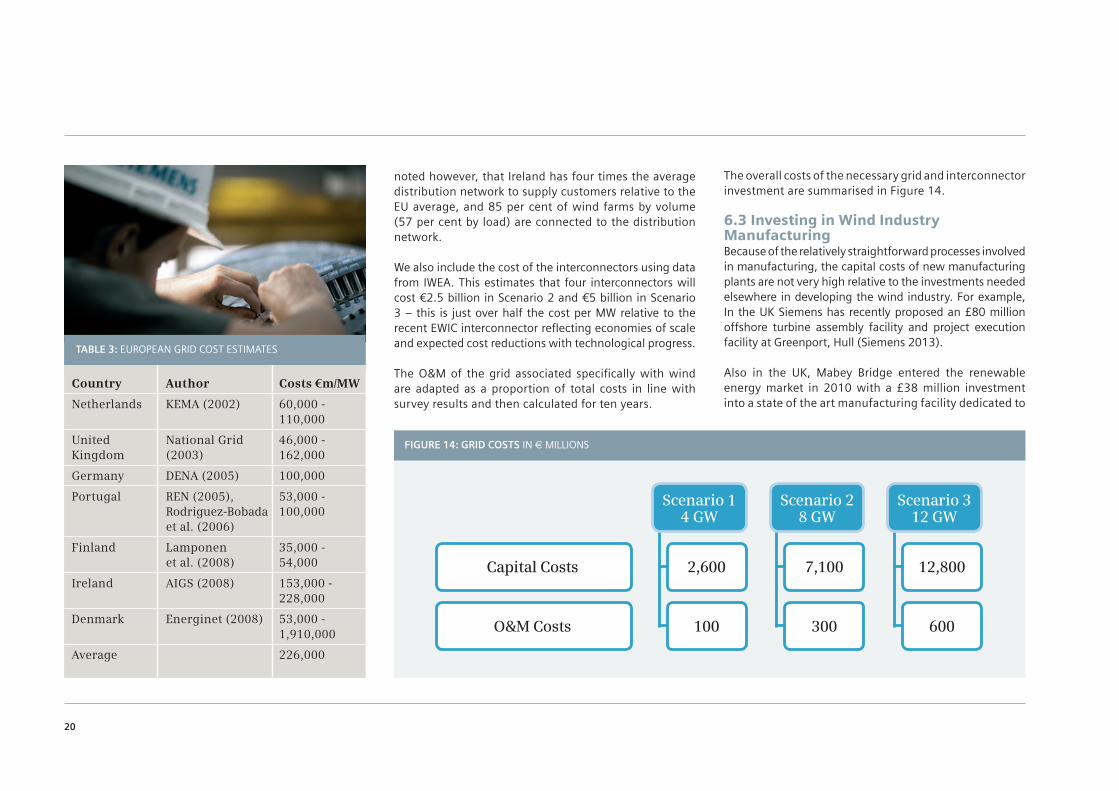
The overall costs of the necessary grid and interconnector investment are summarised in Figure 14.
6.3 Investing in Wind Industry ManufacturingBecause of the relatively straightforward processes involved in manufacturing, the capital costs of new manufacturing plants are not very high relative to the investments needed elsewhere in developing the wind industry. For example, In the UK Siemens has recently proposed an £80 million offshore turbine assembly facility and project execution facility at Greenport, Hull (Siemens 2013).
Also in the UK, Mabey Bridge entered the renewable energy market in 2010 with a £38 million investment into a state of the art manufacturing facility dedicated to
Country Author Costs €m/MW
Netherlands KEMA (2002) 60,000 - 110,000
United National Grid 46,000 - Kingdom (2003) 162,000
Germany DENA (2005) 100,000
Portugal REN (2005), 53,000 - Rodriguez-Bobada 100,000 et al. (2006)
Finland Lamponen 35,000 - et al. (2008) 54,000
Ireland AIGS (2008) 153,000 - 228,000
Denmark Energinet (2008) 53,000 - 1,910,000
Average 226,000
FIGURE 14: GRID COSTS IN € MILLIONS
Scenario 312 GW
Scenario 28 GW
7,100
300
Scenario 14 GW
2,600
100
Capital Costs
O&M Costs
12,800
600
TABLE 3: EUROPEAN GRID COST ESTIMATES
the fabrication of wind turbine towers, monopoles and other tubular steelwork in Chepstow. The facility has a maximum output of 100 wind turbine towers a year and has created approximately 240 new skilled jobs.
Spanish wind company Gamesa announced in March 2012 that its new UK wind turbine manufacturing plant is to be sited at the Port of Leith in Edinburgh, creating around 800 jobs, with an investment up to €150 million.
Dong Energy along with Belfast Port announced plans in November 2011 for an offshore wind turbine assembly in Belfast with an initial investment of £50 million creating 150 jobs in the construction phase alone.
Mitsubishi Power Systems Europe Ltd unveiled plans in 2010 to invest up to £100 million in an engineering facility to carry out research and development into offshore wind turbine technology in Edinburgh, creating up to 200 jobs over the next five years. Recently in Portugal, a tower facility was set up as part of the cluster of facilities supporting ENERCON turbine production for a 1.1 GW national Portuguese project. The final investment in this facility was €15 million which now produces 150 towers per year and employs 80 people in full time employment.
These examples indicate that the possible manufacturing investment needed to manufacture nacelles and towers is likely to be quite limited. This suggests that any investment in new manufacturing plant is likely to be dwarfed in scale by the investment by the wind industry itself and by the necessary investment in electricity networks (including interconnection) needed to support the wind industry.
21
The magnitude of the investment likely to be undertaken in wind energy in Ireland over the coming decade will have significant effects on the wider macro-economy.10 Here we consider the demand side effects of this investment. These effects will arise from the investment expenditure itself and also from the spending of the incomes that are generated in Ireland as a result of the investment. These multiplier effects include the consumption expenditure of those who are employed in undertaking the investment. The increased tax revenue that will accrue to the government from
this increase in economic activity will also have positive effects on the economy.
We do not take account of the effects on the supply side of the economy arising from this investment. Obviously increasing wind generation could have knock on effects on fossil fuel generators. (However, under Scenarios 2 and 3 these effects would arise outside of Ireland.) Also, the profits which will accrue to investors as a result of selling the wind energy may have further effects on the economy that we cannot quantify here.
7. Macroeconomic Effects
22
This analysis is based on the research outlined earlier in this report into the detailed micro-economic impact of the major programme of investment in wind in Ireland over the coming decade. In particular, this research
10 As discussed later, it is assumed that, at the margin, much of the additional wind energy will be exported.
“The magnitude of the investment likely to be undertaken in wind energy in Ireland over the coming decade will have significant effects on the wider macro-economy”

identified the likely employment impact of the different categories of investment that are likely to be undertaken. In undertaking this macro-economic analysis, we aggregate the industry and grid related jobs and analyse jointly their impact on the wider economy.
To undertake this task we use the ESRI HERMES macro-economic model of the Irish economy. This model has been developed over the last twenty five years to examine a range of important economic questions. It is used by the ESRI and the Department of Finance to analyse the impact of fiscal policy on the economy. It was also specially expanded in the early 1990s to look at the likely impact of government national investment plans. This analysis was published in a series of reports (e.g. FitzGerald et al., 1999, and FitzGerald and Morgenroth, 2006). As a result, it handles in an appropriate manner different categories of investment and it is a suitable tool for analysing the impact on the economy of a major programme of investment in wind energy. The latest version of the model has been documented in Bergin et al. 2013.
To illustrate the impact of the investment programme on the economy we consider the results for one year, 2020. The results for other years would not be very different from those for 2020. In choosing 2020 this gives sufficient time for the rest of the economy to adjust to this higher level of investment. This will also allow investment in other sectors of the economy to respond to the enhanced level of domestic demand and it will also allow time for prices and the labour market to adjust to the new circumstances.
7.1 AssumptionsIn modelling the macro-economic effects of major investment in wind energy over the next decade we make a number of simplifying assumptions.
The current problems with the Irish financial system mean that there are concerns that credit might be rationed. Even if there were no credit rationing, with imperfectly competitive capital markets, funding the large volume of wind investment domestically could potentially raise the cost of finance for other investors. However, there is evidence that the funding costs of Irish utilities are already falling. In any event, it is likely that much of the investment will be funded abroad and will not be dependent on the Irish financial system for support. Thus the major investment in wind is not likely to crowd out funding of other major investment projects in Ireland. For simplicity, by assuming all funding, debt and equity, comes from abroad we can ignore the possibility of such crowding out.
To the extent that the equity comes from within Ireland and that it does not crowd out other investment, this approach will underestimate the potential gains from the investment. This is because we are not counting possible benefits accruing to Irish equity from profits over and above those necessary to remunerate the very large investment.
In the case of the investment in the grid and interconnection, much of it may be funded by the relevant domestic utility, especially under Scenario 1. We assume that it will be possible to fund this
investment at a reasonable rate of interest on financial markets. Over the crisis period funding was not available to Irish utilities at a rate that would have facilitated the necessary expansion of the grid. However, in autumn 2012 the cost of funding for Irish utilities returned to levels where funding major investment would be feasible. We assume that the cost of funds needed to expand the grid remains reasonable over the course of this investment programme.
For simplicity, we are also assuming that, while most of the electricity generated by wind under Scenario 1 is used for domestic purposes, all of the additional electricity generated under Scenarios 2 and 3 is exported.11 This assumption is important for two reasons. Firstly, there are no knock on negative effects on other generators in Ireland. In considering the overall welfare effects of wind investment, the losses of
23
11 All the calculations, including the assumption of major investment in interconnection, hinges on this assumption.
such generators would have to be considered if the sales of electricity from “new” wind were made domestically. We are also not taking account of the revenue flow that will arise. As we are assuming that all of the revenue comes from outside Ireland and that this revenue stream will serve to pay off the foreign borrowing that funded the investment. It is only the profits arising from the sales of electricity that would accrue to any Irish equity holders in the investment. This means that we do not have to consider the negative implications of the substantial deterioration in the current account of the balance of payments, which will arise from the initial investment in wind. It will be funded by capital flows directly related to the investment undertaken and it will not represent any increased exposure for the Irish economy to possible external financial shocks.
As discussed earlier, to allow the investment in wind to take place, there would have to be major investment in the grid and in interconnection. Under Scenario 1, the costs of this grid investment is socialised and paid by all users of the electricity system. Instead, under Scenarios 2 and 3, what is proposed is that dedicated networks and interconnection are developed, where all costs fall on the buyers of the exported electricity, with no cost to the Irish government or Irish consumers. Thus there is no adverse competitiveness effects elsewhere in the economy under Scenarios 2 and 3.
If the planned investment were to be made in a short
period of time, this could result in significant inflation in costs due to potential bottlenecks in the economy. Instead, we feel it more realistic to assume that the investment programme takes place fairly evenly over the coming decade. This would certainly be how the wind industry would be likely to proceed.
We assume that there is no Irish government subsidy (or a cross-subsidy from Irish consumers) to support the investment under Scenarios 2 and 3. As discussed in Honohan and Irvine, 1987, and Honohan, 1997, the cost of public funds, at the margin, is high12; this is especially true when the public finances are under pressure, as they are today. Thus the true cost of any public funding would be much greater than its nominal value and it could alter significantly any conclusions drawn in this study on positive effects of wind investment on the economy, if there were any cost to the Irish Exchequer.
We are also not taking account of any special welfare effects that may arise from substantial wind investment in a particular locality. These local effects could be beneficial, in terms of jobs, or could be a cost, in so far as there is a local disamenity.
The final important assumption which underlies our analysis relates to how we handle the improvement in the public finances that will arise from the major expenditure on investment in wind. The HERMES model provides an estimate of the reduction in government
24
12 This additional cost arises from the fact that taxes have disincentive effects on economic agents and they lead to some loss of output. This loss of output magnifies the loss of economic welfare from any subsidies funded from taxation. The same is true where additional costs are imposed on consumers to cross-subsidise other activity. The additional cost to consumers has the same effect on their behaviour as indirect taxes, leading to an additional loss of output.
borrowing that will arise from the increased economic activity arising from the private sector investment. We look at two different approaches to how the effect of this reduction in borrowing is treated. In one case we assume that it is all used to avoid additional government borrowing. In this case there will be a positive effect on GNP in the very long term, as debt interest would be reduced. The second approach we take is to assume that the government uses all the additional revenue (or reduction in expenditure) to reduce taxes on income13. In this case government borrowing as a percentage of GDP is held unchanged but tax rates are reduced by an appropriate amount. This has knock on effects, which add to growth. The results for these alternative approaches are shown in this report. 7.2 MethodologyWe implement the investment programme in the model by increasing the variable representing investment by the utility sector. The investment under Scenarios 2 and 3 is assumed in the model to be commercially funded – having no direct financial cost for the government.14 However, because this investment has tended in the past to have a relatively high machinery and materials content and a low employment content, we modify the model to reflect the results presented earlier in this report for direct employment arising from the investment in wind. Thus the direct impact in the model of the additional investment is to create roughly the number of jobs suggested in Section 5 of this report. We include both the jobs referred to as industry jobs and the jobs in expanding the grid under this heading.
We adjust services sector output in the model to reflect the increased jobs involved in operation and maintenance, mainly in the wind industry itself. Thus there is a direct increase in the value added in the services sector as well, as an increase in employment in the sector, reflecting the estimated jobs created in operation and maintenance.
Finally, because the potential jobs created in manufacturing are quite small relative to the total jobs created (and less certain), we assume that these jobs
will be taken into account in the additional investment which the model estimates will be generated as a result of the positive shock to the economy from the investment in wind energy.
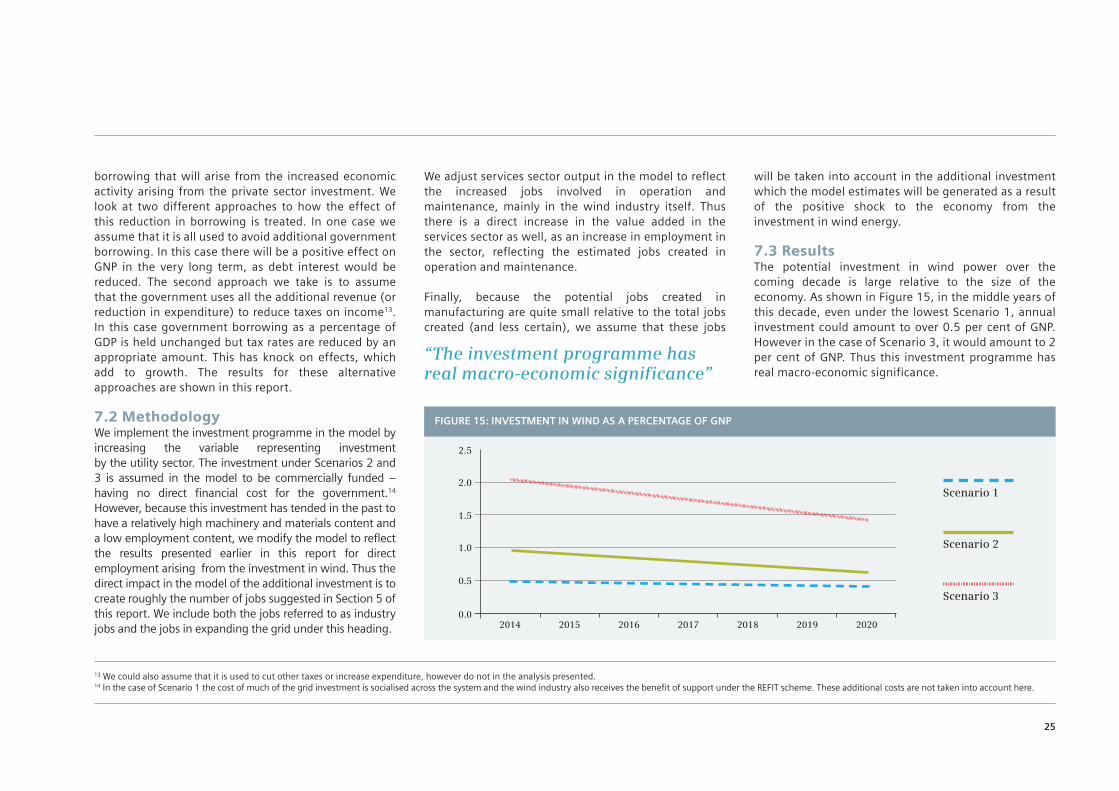
7.3 ResultsThe potential investment in wind power over the coming decade is large relative to the size of the economy. As shown in Figure 15, in the middle years of this decade, even under the lowest Scenario 1, annual investment could amount to over 0.5 per cent of GNP. However in the case of Scenario 3, it would amount to 2 per cent of GNP. Thus this investment programme has real macro-economic significance.
25
13 We could also assume that it is used to cut other taxes or increase expenditure, however do not in the analysis presented. 14 In the case of Scenario 1 the cost of much of the grid investment is socialised across the system and the wind industry also receives the benefit of support under the REFIT scheme. These additional costs are not taken into account here.
FIGURE 15: INVESTMENT IN WIND AS A PERCENTAGE OF GNP
2.5
2.0
1.5
1.0
0.5
0.02014 2015 2016 2017 2018 2019 2020
Scenario 1
Scenario 2
Scenario 3
“The investment programme has real macro-economic significance”
We undertake the analysis of the macro-economic effects by first constructing a base-line run out to 2025 using the HERMES model. In this case we use as the base the Recovery Scenario in the ESRI Medium-Term Review published in July 2013. We then introduce the additional investment as a “shock” to the model and we compare the results for the major aggregates in the “shocked” version of the model with the results for those aggregates in the base run. This provides a quantification of the effects of the wind energy investment.
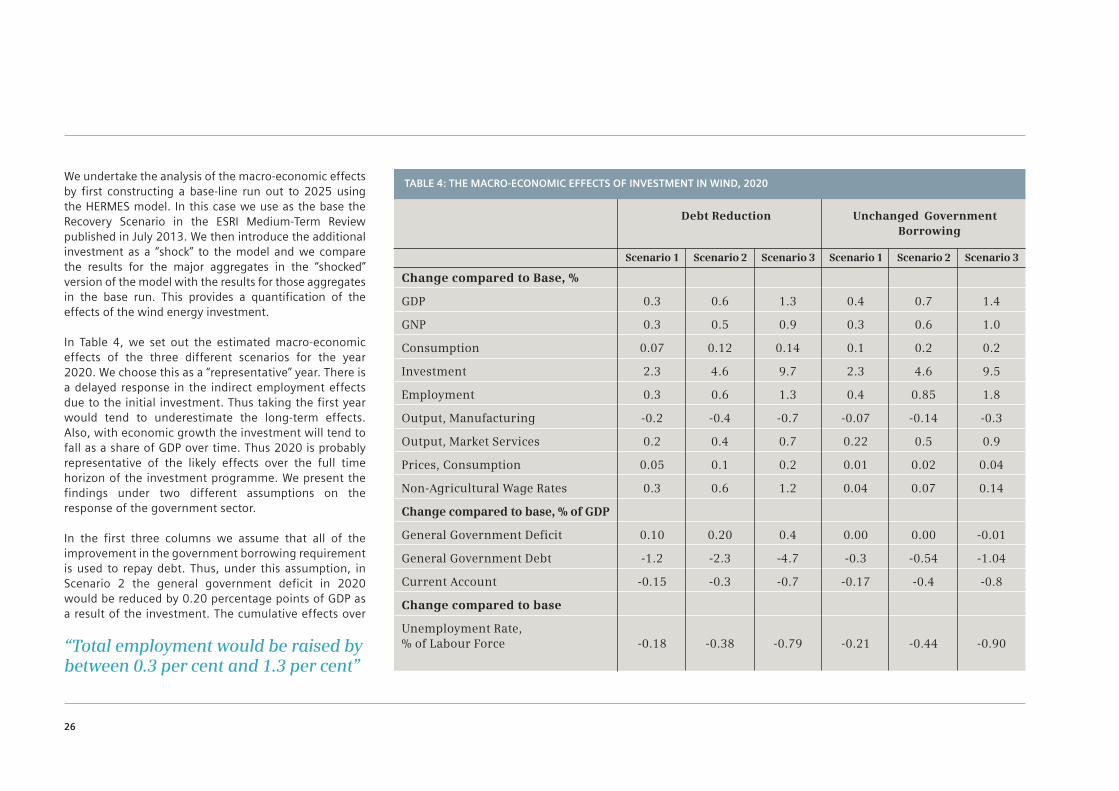
In Table 4, we set out the estimated macro-economic effects of the three different scenarios for the year 2020. We choose this as a “representative” year. There is a delayed response in the indirect employment effects due to the initial investment. Thus taking the first year would tend to underestimate the long-term effects. Also, with economic growth the investment will tend to fall as a share of GDP over time. Thus 2020 is probably representative of the likely effects over the full time horizon of the investment programme. We present the findings under two different assumptions on the response of the government sector.
In the first three columns we assume that all of the improvement in the government borrowing requirement is used to repay debt. Thus, under this assumption, in Scenario 2 the general government deficit in 2020 would be reduced by 0.20 percentage points of GDP as a result of the investment. The cumulative effects over
26
Debt Reduction Unchanged Government Borrowing
Scenario 1 Scenario 2 Scenario 3 Scenario 1 Scenario 2 Scenario 3
Change compared to Base, %
GDP 0.3 0.6 1.3 0.4 0.7 1.4
GNP 0.3 0.5 0.9 0.3 0.6 1.0
Consumption 0.07 0.12 0.14 0.1 0.2 0.2
Investment 2.3 4.6 9.7 2.3 4.6 9.5
Employment 0.3 0.6 1.3 0.4 0.85 1.8
Output, Manufacturing -0.2 -0.4 -0.7 -0.07 -0.14 -0.3
Output, Market Services 0.2 0.4 0.7 0.22 0.5 0.9
Prices, Consumption 0.05 0.1 0.2 0.01 0.02 0.04
Non-Agricultural Wage Rates 0.3 0.6 1.2 0.04 0.07 0.14
Change compared to base, % of GDP
General Government Deficit 0.10 0.20 0.4 0.00 0.00 -0.01
General Government Debt -1.2 -2.3 -4.7 -0.3 -0.54 -1.04
Current Account -0.15 -0.3 -0.7 -0.17 -0.4 -0.8
Change compared to base
Unemployment Rate, % of Labour Force -0.18 -0.38 -0.79 -0.21 -0.44 -0.90
TABLE 4: THE MACRO-ECONOMIC EFFECTS OF INVESTMENT IN WIND, 2020
“Total employment would be raised by between 0.3 per cent and 1.3 per cent”
the period 2014-20 would have been to reduce the debt GDP ratio by over 2 percentage points.
The alternative treatment, in the last three columns of the Table, assumes that all of the improvement in the borrowing requirement is recycled by cutting taxes on income. Thus the borrowing requirement is almost unchanged as a result of the investment. The Debt / GDP ratio falls because of the higher growth in GDP but is unaffected as a result of the fact that government borrowing as a percentage of GDP is unchanged from the base line.
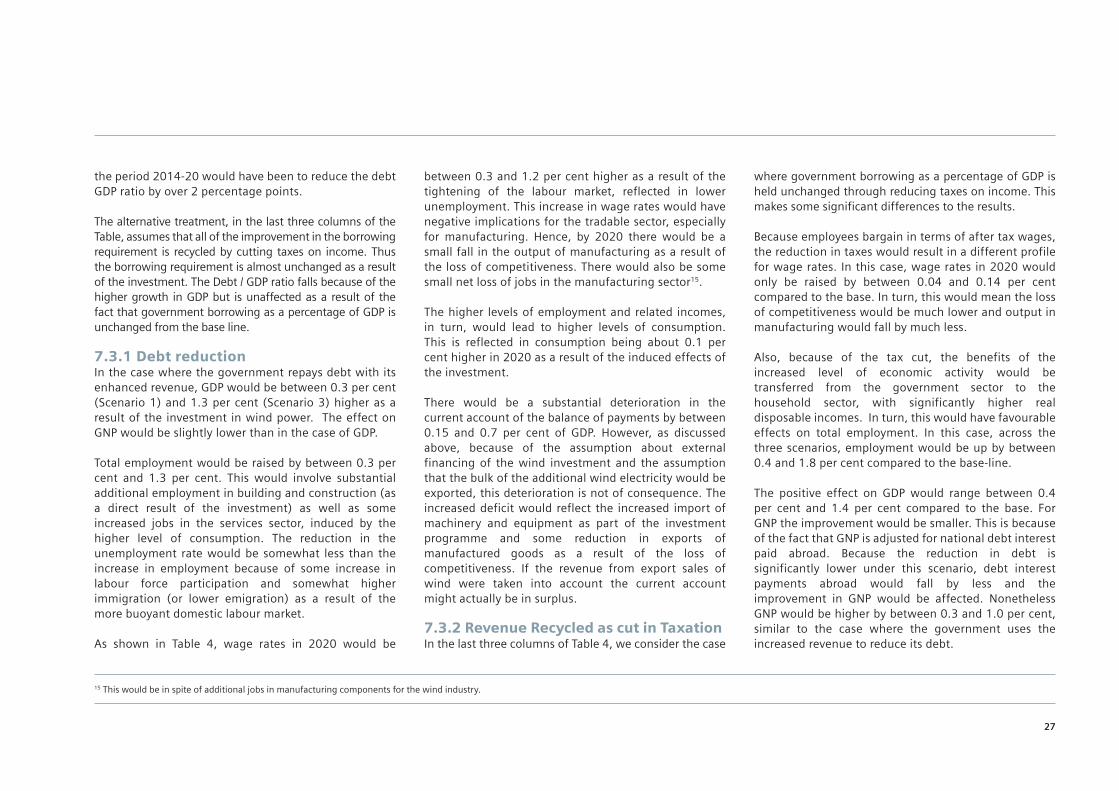
7.3.1 Debt reductionIn the case where the government repays debt with its enhanced revenue, GDP would be between 0.3 per cent (Scenario 1) and 1.3 per cent (Scenario 3) higher as a result of the investment in wind power. The effect on GNP would be slightly lower than in the case of GDP.
Total employment would be raised by between 0.3 per cent and 1.3 per cent. This would involve substantial additional employment in building and construction (as a direct result of the investment) as well as some increased jobs in the services sector, induced by the higher level of consumption. The reduction in the unemployment rate would be somewhat less than the increase in employment because of some increase in labour force participation and somewhat higher immigration (or lower emigration) as a result of the more buoyant domestic labour market.
As shown in Table 4, wage rates in 2020 would be
between 0.3 and 1.2 per cent higher as a result of the tightening of the labour market, reflected in lower unemployment. This increase in wage rates would have negative implications for the tradable sector, especially for manufacturing. Hence, by 2020 there would be a small fall in the output of manufacturing as a result of the loss of competitiveness. There would also be some small net loss of jobs in the manufacturing sector15.
The higher levels of employment and related incomes, in turn, would lead to higher levels of consumption. This is reflected in consumption being about 0.1 per cent higher in 2020 as a result of the induced effects of the investment.
There would be a substantial deterioration in the current account of the balance of payments by between 0.15 and 0.7 per cent of GDP. However, as discussed above, because of the assumption about external financing of the wind investment and the assumption that the bulk of the additional wind electricity would be exported, this deterioration is not of consequence. The increased deficit would reflect the increased import of machinery and equipment as part of the investment programme and some reduction in exports of manufactured goods as a result of the loss of competitiveness. If the revenue from export sales of wind were taken into account the current account might actually be in surplus.
7.3.2 Revenue Recycled as cut in TaxationIn the last three columns of Table 4, we consider the case
where government borrowing as a percentage of GDP is held unchanged through reducing taxes on income. This makes some significant differences to the results.
Because employees bargain in terms of after tax wages, the reduction in taxes would result in a different profile for wage rates. In this case, wage rates in 2020 would only be raised by between 0.04 and 0.14 per cent compared to the base. In turn, this would mean the loss of competitiveness would be much lower and output in manufacturing would fall by much less.
Also, because of the tax cut, the benefits of the increased level of economic activity would be transferred from the government sector to the household sector, with significantly higher real disposable incomes. In turn, this would have favourable effects on total employment. In this case, across the three scenarios, employment would be up by between 0.4 and 1.8 per cent compared to the base-line.
The positive effect on GDP would range between 0.4 per cent and 1.4 per cent compared to the base. For GNP the improvement would be smaller. This is because of the fact that GNP is adjusted for national debt interest paid abroad. Because the reduction in debt is significantly lower under this scenario, debt interest payments abroad would fall by less and the improvement in GNP would be affected. Nonetheless GNP would be higher by between 0.3 and 1.0 per cent, similar to the case where the government uses the increased revenue to reduce its debt.
27
15 This would be in spite of additional jobs in manufacturing components for the wind industry.
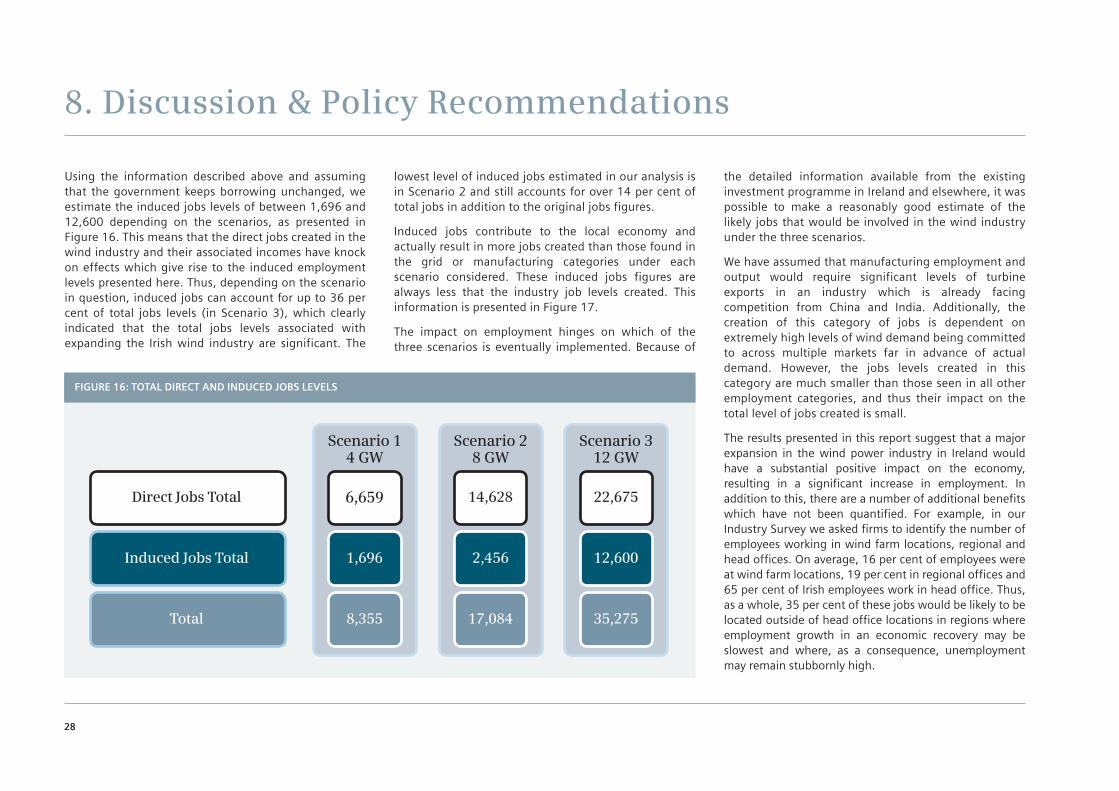
Using the information described above and assuming that the government keeps borrowing unchanged, we estimate the induced jobs levels of between 1,696 and 12,600 depending on the scenarios, as presented in Figure 16. This means that the direct jobs created in the wind industry and their associated incomes have knock on effects which give rise to the induced employment levels presented here. Thus, depending on the scenario in question, induced jobs can account for up to 36 per cent of total jobs levels (in Scenario 3), which clearly indicated that the total jobs levels associated with expanding the Irish wind industry are significant. The
lowest level of induced jobs estimated in our analysis is in Scenario 2 and still accounts for over 14 per cent of total jobs in addition to the original jobs figures.
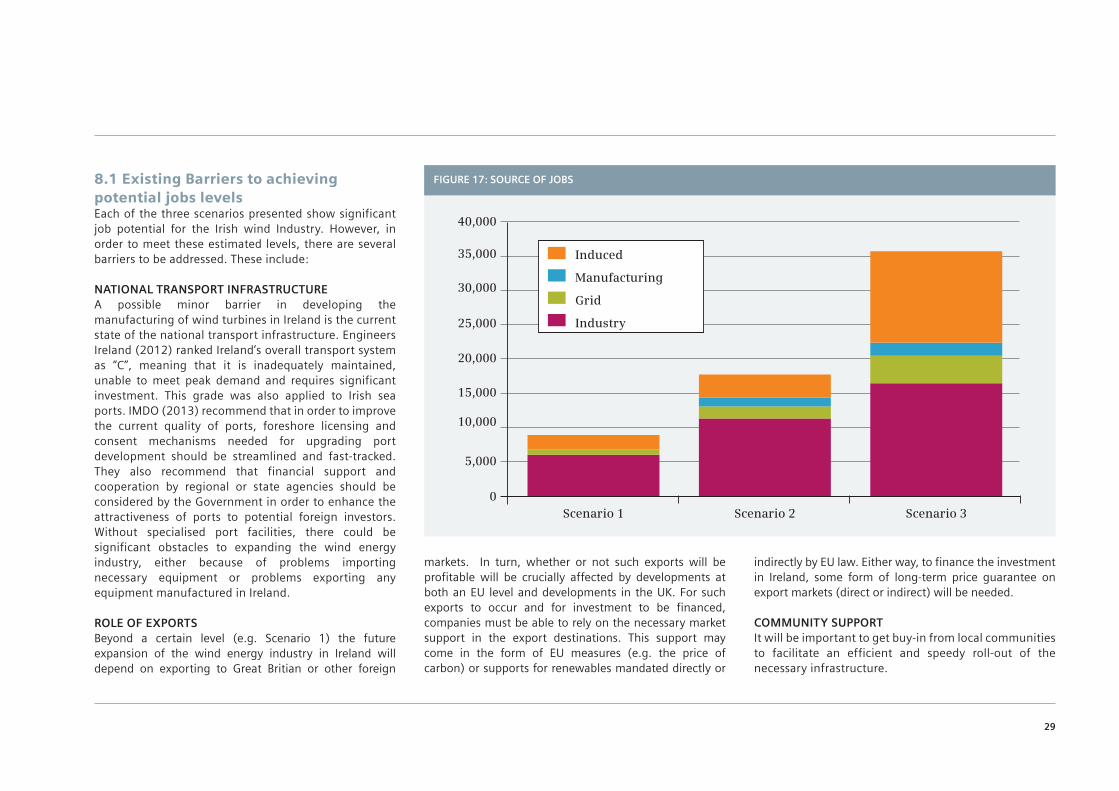
Induced jobs contribute to the local economy and actually result in more jobs created than those found in the grid or manufacturing categories under each scenario considered. These induced jobs figures are always less that the industry job levels created. This information is presented in Figure 17.
The impact on employment hinges on which of the three scenarios is eventually implemented. Because of
the detailed information available from the existing investment programme in Ireland and elsewhere, it was possible to make a reasonably good estimate of the likely jobs that would be involved in the wind industry under the three scenarios.
We have assumed that manufacturing employment and output would require significant levels of turbine exports in an industry which is already facing competition from China and India. Additionally, the creation of this category of jobs is dependent on extremely high levels of wind demand being committed to across multiple markets far in advance of actual demand. However, the jobs levels created in this category are much smaller than those seen in all other employment categories, and thus their impact on the total level of jobs created is small.
The results presented in this report suggest that a major expansion in the wind power industry in Ireland would have a substantial positive impact on the economy, resulting in a significant increase in employment. In addition to this, there are a number of additional benefits which have not been quantified. For example, in our Industry Survey we asked firms to identify the number of employees working in wind farm locations, regional and head offices. On average, 16 per cent of employees were at wind farm locations, 19 per cent in regional offices and 65 per cent of Irish employees work in head office. Thus, as a whole, 35 per cent of these jobs would be likely to be located outside of head office locations in regions where employment growth in an economic recovery may be slowest and where, as a consequence, unemployment may remain stubbornly high.
8. Discussion & Policy Recommendations
28
FIGURE 16: TOTAL DIRECT AND INDUCED JOBS LEVELS
Direct Jobs Total
Total
Induced Jobs Total
Scenario 14 GW
6,659
8,355
1,696
Scenario 28 GW
14,628
17,084
2,456
Scenario 312 GW
22,675
35,275
12,600
40,000
35,000
30,000
25,000
20,000
15,000
10,000
5,000
0Scenario 2Scenario 1 Scenario 3
Induced
Manufacturing
Grid
Industry
FIGURE 17: SOURCE OF JOBS8.1 Existing Barriers to achieving potential jobs levelsEach of the three scenarios presented show significant job potential for the Irish wind Industry. However, in order to meet these estimated levels, there are several barriers to be addressed. These include:
NATIONAL TRANSPORT INFRASTRUCTUREA possible minor barrier in developing the manufacturing of wind turbines in Ireland is the current state of the national transport infrastructure. Engineers Ireland (2012) ranked Ireland’s overall transport system as “C”, meaning that it is inadequately maintained, unable to meet peak demand and requires significant investment. This grade was also applied to Irish sea ports. IMDO (2013) recommend that in order to improve the current quality of ports, foreshore licensing and consent mechanisms needed for upgrading port development should be streamlined and fast-tracked. They also recommend that financial support and cooperation by regional or state agencies should be considered by the Government in order to enhance the attractiveness of ports to potential foreign investors. Without specialised port facilities, there could be significant obstacles to expanding the wind energy industry, either because of problems importing necessary equipment or problems exporting any equipment manufactured in Ireland.
ROLE OF EXPORTSBeyond a certain level (e.g. Scenario 1) the future expansion of the wind energy industry in Ireland will depend on exporting to Great Britian or other foreign
markets. In turn, whether or not such exports will be profitable will be crucially affected by developments at both an EU level and developments in the UK. For such exports to occur and for investment to be financed, companies must be able to rely on the necessary market support in the export destinations. This support may come in the form of EU measures (e.g. the price of carbon) or supports for renewables mandated directly or
indirectly by EU law. Either way, to finance the investment in Ireland, some form of long-term price guarantee on export markets (direct or indirect) will be needed.
COMMUNITY SUPPORTIt will be important to get buy-in from local communities to facilitate an efficient and speedy roll-out of the necessary infrastructure.
29

This analysis suggests that a major programme of investment in wind could have a sizeable positive effect on the labour market, resulting in substantial growth in employment. It would also add noticeably to GDP and produce a significant improvement in the Debt / GDP ratio by 2020. As discussed earlier, there is a much higher degree of reliability attaching to the estimates of direct jobs created in the wind industry than is the case for the estimated additional jobs in expanding the grid.16 Because the bulk of the jobs are estimated to occur in the wind energy industry itself, rather than in the grid, this makes the estimate of the macro-economic effects of the total investment more robust. This means that, even if the jobs created in expanding the grid were significantly lower than estimated above, it would not greatly change the overall result.
The estimate of jobs created directly and indirectly as a result of a major programme of investment in wind energy is only one of a number of channels through which such investment would affect the Irish economy. To arrive at an overall evaluation of the impact, many other issues would have to be considered.
9. Conclusions
30
16 The estimate of manufacturing jobs is the least certain of the estimates. These jobs could only occur if there were significant investment in wind but, even then, there would be uncertainty as to whether these jobs would actually occur in Ireland. It should be noted that the number of jobs in the grid are the outside limit and these could be substantially lower.
AIGS (2008) All Island Grid Study
Alstom (2012) Alstom inaugurates first wind turbine assembly facility in Brazil
Alvarez, Jara, Julien, Bielsa (2009) Study of the effect on employment of public aid to renewable energy sources
An Bord Pleanala (2007) Inspector’s Report 04.VC0023
Bergin, Confrey, FitzGerald, Kearney, Žnuderl (2013) The HERMES-13 macroeconomic model of the Irish economy. ESRI Working Paper 460
Blanco (2009) The economics of Wind Energy. Renewable and sustainable energy reviews (13)
Blanco, Rodrigues (2009) Direct employment in the wind energy sector: An EU study. Energy Policy (37)
Bloomberg (2012) Wind, Solar – Research note
Brown, Pender, Wiser, Lantz, Hoen (2012) Ex post analysis of economic impacts from wind power development in U.S. counties. Energy Economics (34)
CSO (2012) Regional Quality of Life in Ireland 2013
DeCesaro, Porter, Milligan (2009) Wind Energy and Power System Operations: A Review of Wind Integration Studies to Date
Deloitte Report Jobs and Investment in Irish Wind Energy June 2009
DENA (2005) Planning of the grid integration of wind energy in Germany onshore and offshore up to the year 2020
Denny, Tuohy, Meibom, Keane, Mullane, O’Malley (2010) The impact of increased interconnection on electricity systems with large penetration of wind generation: A case study of Ireland and Great Britain, Energy Policy (38)
DTI (2007) Study of the Costs of Offshore wind Generation
EIA (2009a) Annual Energy Outlook 2009
EIA (2009b) Assumptions to the Annual Energy Outlook 2009
EIA (2009c) Electric Power Annual 2007
Eirgrid (2008) Business Case – The developer of an East West Electricity Interconnector
Eirgrid (2012) Additional Briefing Notes
Energinet (2008) Technical report on the future expansion and undergrounding of the transmission grid
Erik (2007) Economics of Wind Power
EWEA (2009) Wind at work: Wind energy and job creation in the EU http://www.ewea.org/fileadmin/ewea_documents/documents/publications/reports/Wind_at_work_FINAL.pdf
Delucchi & Jacobsen (2011) Providing all global energy with wind, water, and solar power, Part II: reliability, system and transmission costs, and policies. Energy Policy (39)
Government of Ireland (2008). Building Ireland’s Smart Economy - A Framework for Sustainable Economic Renewal. D. o. t. Taoiseach. Dublin.
Greenwire (2012) Power without limits. Issue 2.
GWEC (2013) Global Wind Statistics 2012
Holttinnen, Meibom, Orths, O’Malley, Ummels, Tande, Estanqueiro, Gomez, Smith, Ela (2007) Impacts of large amounts of wind power on design and operation of power systems, results of IEA collaboration
Honohan (1998) Key issues of cost-benefit methodology for Irish industrial policy. Dublin: Economic and Social Research Institute.
IMDO (2013) A Review of Irish Ports Offshore Capability in Relation to Requirements for the Marine Renewable Energy Industry
Indecon (2013)
KEMA (2002) Inventarisatie inpassing in het elektriciteitsnet van 6.000 MW offshore windvermogen in 2020.
Lamponen (2008) Wind Power, grid reinforcement needs and connection issues
Milborrow (2006) Nuclear suddenly the competitor to beat. In Wind Power Monthly (January).
Mills, Wiser, Porter (2012) The cost of transmission for wind energy in the United States: A review of transmission planning studies
Murphy, Barry, (2003) Forfas: The National Policy and Advisory Board for Enterprise, Trade, Science, Technology, and Innovation. The economic appraisal system for projects seeking support from the industrial development agencies Dublin
National Grid (2003) Submission for the UK Energy White Paper
NCC (2013) Ireland’s Competitiveness Scorecard 2012
Pollin and Garrett-Peltier (2009) Building the Green Economy: Employment Effects of Green Energy Investments for Ontario
Siemens (2012) Made in Hutchinson, Kansas
Siemens (2013) Siemens’ investment in Greenport Hull
REN (2005) Estudio de Establidad Eolica de la Peninsula Iberica
Rodriguez-Bobada, Rodriguez, Cena, Giraut (2006) Study of wind penetration in the Iberian peninsula
Tegen, Hand, Maples, Lantz, Schwabe, Smith (2012) Cost of Wind Energy Review
10. References
31
Acknowledgements
32
The authors below would like to acknowledge the assistance provided by a number of individuals in the completion of this research. In particular, they would like to acknowledge the valuable advice and inputs from IWEA and Siemens. Both Siemens and IWEA also provided financial support for this study. The authors are also very grateful to the companies who responded to three surveys considering the employment levels in the wind industry, the grid and manufacturing. The usual disclaimer applies that the authors are solely responsible for the views expressed in this report.
Professor John FitzGerald, ESRI, Eleanor Denny, Assistant Professor in Economics, Trinity College Dublin and Dr. Amy O’Mahoney. Trinity College Dublin.
List of companies who responded to the Industry survey carried out by Trinity College Dublin:A. Cafferkey Developments Ltd, ABB Ltd, ABO Wind Ireland Ltd, AIB, Ballybane Windfarms Ltd, Bank of Ireland, Bord Gáis, Bord Na Móna (Energy) Ltd, Canavan Associates Ltd, Coillte, CWind Ltd, Daralinn Training and Consultancy, Deloitte, Denis Moriarty The Kerries Ltd, Ecopower Limited, Electricity Research Centre, Element Power Ireland, Energia, ESB Wind Development, Fehily Timoney & Company Ltd, Gaelectric, Gaeltec Utilities Ltd, IWEA, John Sisk & Son (Holdings) Ltd, Kirby Group Engineering, KPMG, Large US Asset Management company (unamed), Lynx Metmast Services Ltd, Mainstream Renewable Power, Matheson, Moneenatieve Wind Farms Ltd, NTR Plc, Saorgus Energy, Scart Energy Ltd, Siemens, SSE, Vestas, Wind Prospect Ireland.

8. Please list the total number of full time employees (those involved in wind energy and all other sectors) of your company in Ireland.
Network development/extension
Wind turbine manufacturer
Component manufacturer
Developer
Independent power producer, utility
Installation, site preparation
Repair, operation & maintenance
Consultancy, engineering, legal services, certification
R&D centre, laboratory, university
Financial institution, insurance company
Energy agency, energy association, other lobby organisation
Safety / environmental management
Investor
Other (please explain)
9. What is the breakdown of total employees in Ireland?
At wind farm locations
At regional offices
At head office
Appendix 1: Industry Survey
1. Company Name
2. Do you work in head office? Yes No
3. If not, in which country is the head office?
4. How many regional offices do you have, if any?
5. How many wind farm locations do you have, if any?
6. To which category does your company belong (please tick as many as apply)
Network development/extension
Wind turbine manufacturer
Component manufacturer
Developer
Independent power producer, utility
Installation, site preparation
Repair, operation & maintenance
Consultancy, engineering, legal services, certification
R&D centre, laboratory, university
Financial institution, insurance company
Energy agency, energy association, other lobby organisation
Safety / environmental management
Investor
Other (please specify)
7. What is the total capacity of wind that you own?
Ireland
Rest of World
33
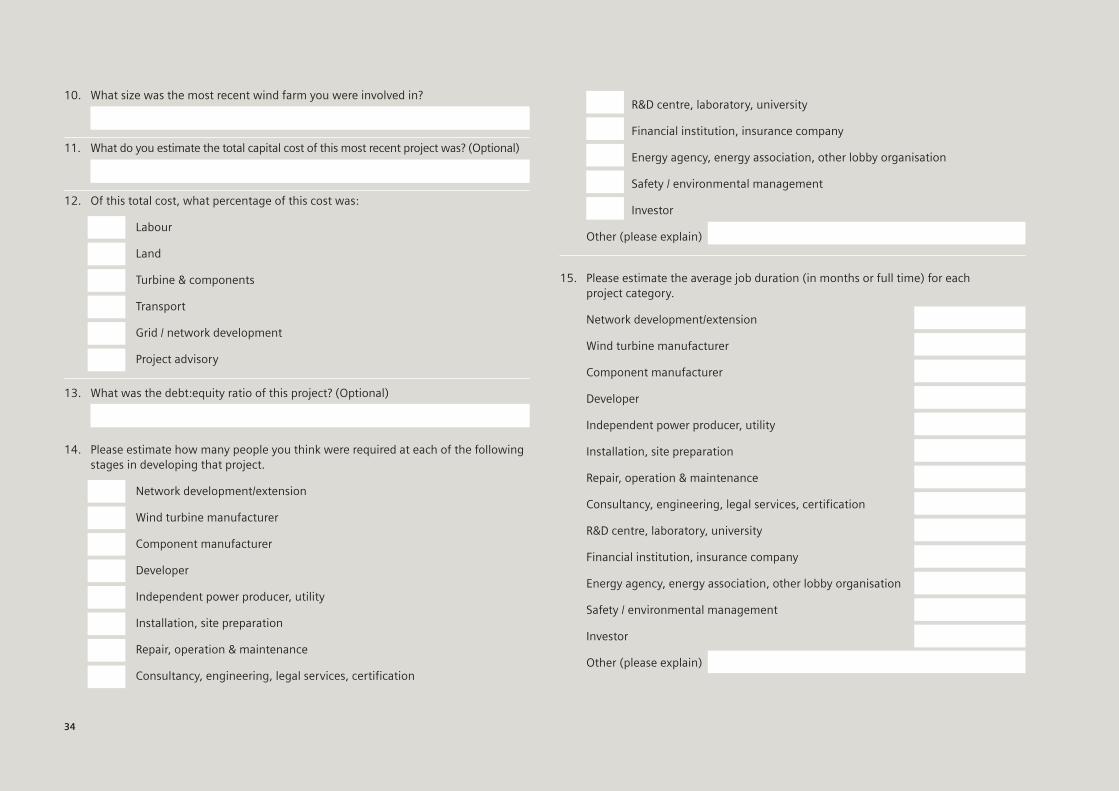
R&D centre, laboratory, university
Financial institution, insurance company
Energy agency, energy association, other lobby organisation
Safety / environmental management
Investor
Other (please explain)
15. Please estimate the average job duration (in months or full time) for each project category.
Network development/extension
Wind turbine manufacturer
Component manufacturer
Developer
Independent power producer, utility
Installation, site preparation
Repair, operation & maintenance
Consultancy, engineering, legal services, certification
R&D centre, laboratory, university
Financial institution, insurance company
Energy agency, energy association, other lobby organisation
Safety / environmental management
Investor
Other (please explain)
10. What size was the most recent wind farm you were involved in?
11. What do you estimate the total capital cost of this most recent project was? (Optional)
12. Of this total cost, what percentage of this cost was:
Labour
Land
Turbine & components
Transport
Grid / network development
Project advisory
13. What was the debt:equity ratio of this project? (Optional)
14. Please estimate how many people you think were required at each of the following stages in developing that project.
Network development/extension
Wind turbine manufacturer
Component manufacturer
Developer
Independent power producer, utility
Installation, site preparation
Repair, operation & maintenance
Consultancy, engineering, legal services, certification
34

21. What do you think are the main obstacles of investing in wind capacity in Ireland relative to the rest of the world?
22. Is there anything else you would like to tell us about the labour market impacts of wind farm development by your company in Ireland?
23. Please indicate when the data provided was collected (e.g. December 2012).
16. To date, have the necessary skills been available within the Irish labour market?
17. What type of profiles do you think your company will mainly be looking for in the next 5 years?
Executive, top managers, directors
Engineers
Commercial, marketing, sales managers
Operation & Maintenance technician
Low-skilled workers
Other (please specify)
18. What lessons have been learnt from delivering your last wind energy project?
19. Would you invest in the Irish market again?
20. What do you think are the main advantages of investing in wind capacity in Ireland relative to the rest of the world?
35

6. To date, have the necessary skills been available within the Irish labour market?
7. In order to effectively integrate wind power have you modified training or qualifications required in your organisation?
8. In order to meet 2020 targets of 4 GW installed wind capacity, what do you anticipate the required levels of the below to be:
Labour (no. employees)
O&M (€)
Capital costs (€)
9. In order to meet 2020 wind targets of 4 GW installed wind, what do you expect the cost of grid reinforcement to be?
10. Grid 25 States that €4 billion of grid reinforcements are necessary in order to meet 2020 targets. What proportion of this do you believe is exclusively as a result of wind?
Appendix 2: Grid Survey
1. Company Name
2. What is the breakdown of total employees in Ireland?
In head office
In regional offices
In other locations
3. Please list the number of full time employees specifically involved in wind energy?
In head office
In regional offices
In other locations
4. Of the employees involved in wind, what proportion are in:
Delivery
Design
Reinforcement
5. What type of profiles do you think your company will mainly be looking for in the next 5 years?
Executive, top managers, directors
Engineers
Commercial, marketing, sales managers
Operation & Maintenance technician
Low-skilled workers
Other (please specify)
36

15. What do you see as the biggest and/or most urgent change needed in your system or business to support the integration of additional wind energy?
16. What lessons have been learnt from installing wind capacity in the All Island market?
11. If Ireland were to connect 8 GW of wind capacity to the Irish network, what do you anticipate the required levels of the below to be:
Labour (no. employees)
O&M (€)
Capital costs (€)
12. If Ireland were to connect 12 GW of wind capacity to the Irish network, what do you anticipate the required levels of the below to be:
Labour (no. employees)
O&M (€)
Capital costs (€)
13. If no additional wind is installed, how much do you estimate grid reinforcements to cost up to 2020?
14. Which aspects of maintaining grid reliability will become most difficult with higher levels of wind power integration?
37

Appendix 3: Manufacturing Survey
Assume that each of the below refers to a stand-alone factory producing 1000 MW of capacity per annum. Each will have a guaranteed commitment of 10-15 years demand.
TOWERS
How many jobs would be created in a facility producing towers exclusively?
What do you estimate the capital cost of this facility to be?
NACELLES
How many jobs would be created in a facility producing nacelles exclusively?
What do you estimate the capital cost of this facility to be?
BLADES
How many jobs would be created in a facility producing blades exclusively?
What do you estimate the capital cost of this facility to be?
38

Reproduction of articles in whole or in part requires permission of the publishers. This also applies to storage in electronic databases, on the Internet and reproduction on CD-Rom. This report contains copyright protected materials, all rights reserved.
Siemens Limited Fitzwilliam Court Leeson Close Dublin 2 Ireland Telephone: +353 1 216 2000 www.siemens.ie