Embed Size (px)
Citation preview
Abstract—Pulsed Eddy Current (PEC) is an emerging non-
destructive testing and evaluation (NDT & E) technique and has been used for a wide range of conductive materials. Existing Pulsed Eddy Current probes use surface type probes on pipes. For this type of probes, it is assumed that the diameter of the pipe is significantly larger than that of the excitation coil and the pipe wall is assumed as a plate. In this work, a new encircling pulsed eddy current probe is proposed. The system aims to increase the scanned area by taking advantage of an encircling coil to scan the complete circumference of a pipe with a single pulse. The proposed system consists of an encircling driver coil, Giant magnetoresistance (GMR) magnetic field sensors, a conditioning circuit, a data acquisition card connected to a computer with Matlab software for signal processing and presentation.
Keywords—Pulsed Eddy Current, Encircling Probe, Array
Probe, Corrosion under Insulation
I. INTRODUCTION
IPES are extensively used for transportation and distribution in power generation, oil and gas, chemical,
and other related industries. Most of the pipes made of ferromagnetic carbon steel, thermally insulated. Over long period of service, corrosion may occur on the outer side of a pipe as corrosion under insulation (CUI) [1]. Corrosion under insulation of process pipework is a serious problem for oil and gas industries, and is difficult to detect because of the insulation cover that masks the corrosion problem until it is too late. This type of corrosion can cause failures if not inspected and treated [2]. The simplest corrosion tests (such as those defined by the ISO-DIS 9223 standard) are measurements of the mass loss (g/(m2•a)) or thickness loss (μm/a) [3]. Corrosion testing and detection is an increasingly important area in industry. Recent developments in metallic materials have also heightened the need for reliable corrosion detection and monitoring methods [4]. The most effective method is to remove the insulation, inspect the surface condition of the pipe and replace the insulation, however this method is very time consuming and costly. Several NDT techniques can be used for corrosion detections and monitoring. The acoustic emission (AE) technique, based on the rapid release of energy within a material generating transient elastic wave propagation, is used for monitoring corrosion and pitting corrosion [5] [6]. Radiographic methods provide images of the variation in density of metallic components; however it has limited use due to safety issues [7].In addition, eddy current (EC) nondestructive evaluation (NDE) techniques are widely used in the industry for the
testing and evaluation of electrically conductive parts. Eddy current technique and other electromagnetic techniques are particularly popular since they are noncontact, easy to use and sensitive to the defects that may be present in the inspected parts [8]. Pulsed eddy current (PEC) has demonstrated its detection capabilities in stress measurement [9], flaw detection [10] and corrosion characterization [11] [12].Several features can be extracted to identify and classify the defects in time-domain, as well as frequency-domain features [13] [14]. Recent researches include design and testing of new probe configurations and signal processing. A great extent of work has been carried out on surface type probes [1], [14]. These types of coil are used for inspection of plates and pipes. When used in inspection of pips, pipe’s wall is assumed as a plate in compare to a probe diameter [1] .This assumption is correct in many cases as long as coil diameter is relatively smaller than the pipe diameter. Pulsed eddy current surface type coils can be used for detection of flaws in pipes but the method can be slow when inspection of the whole circumference of the pipe is needed. Encircling pulsed eddy current probes can be used to scan the complete circumference of the pipe in one pulse. Proposed system in this paper, consist of a large encircling coil with the view to increase the magnetic field produced by the coil. This method can be beneficial when a relatively thick nonconductive insulation covers the pipe. Proposed system is further investigated in this paper.
The paper is organized as follows. Firstly, the basic principle of eddy current technique is explained in section II. Modeling of Encircling PEC is described in section III. Section IV includes experimental set-up and results of the proposed system. Comparison of modeling and experimental results and discussions are presented in section V. Finally, conclusions and future work are outlined in Section VI.
II. PRINCIPLE OF EDDY CURRENT TESTING
The basic principle of electromagnetic techniques lie on the induction of eddy currents (EC) within the part by means of an appropriate electromagnetic inducer fed with time varying excitation currents (AC), and on the measurement of the magnetic field at the surface of the part, which result from the local interactions between the EC and the part features. The technique aims at estimating electromagnetic or geometric features of the inspected part, starting from the measured data [15]. Eddy current techniques typically compare test signals with a reference signal. Reference signals are mainly captured from calibration blocks or non-defected areas of test sample [16].
However, Eddy Current NDE techniques suffer from
An Encircling Pulsed Eddy Current Probe
S.Majidnia, Graduate Student Member, IEEE, J.Rudlin, and Nilavalan, Senior Member, IEEE
p
inherent drawbacks. One major limitation of EC techniques is due to the diffusion of the magnetic field within the part, which limits the investigation depth when high excitation frequencies are used (skin effect), and, on the other hand, the spatial resolution of the EC data is rather coarse, especially when low frequencies are used [15]. Since Eddy Current techniques use an AC current to excite the coil with one frequency, penetration of eddy currents are limited to one depth of penetration which relates to the depth at which the field’s amplitude has decreased to 1/e in compare to its value at the surface and can be driven from equation (1)
(1)
. Where: δ is the standard depth of penetration, f is the
excitation frequency, μ is magnetic permeability of the specimen and σ is the conductivity of the specimen.
Pulsed Eddy Current techniques use a square wave for excitation of the driver coil which carries a broadband spectrum of frequencies and allows more depth information to be extracted from the signals [13]. From transient response analysis in PEC, several features can be extracted to identify and classify the defects in time-domain, as well as frequency-domain features.
III. MODELING OF PEC
Proposed pulsed eddy current system was modeled using finite element techniques (COMSOL Multiphysics).The 3D model was set up using AC/DC module and magnetic field interface of COMSOL Multiphysics. The model was solved using a time dependent study. The magnetic fields interface has the equations and external currents for modeling magnetic fields and solving for the magnetic vector potential [17]. The models consisted of a coil around the pipe with 50 mm air gap to simulate a non-conductive insulation and an air domain which includes all the geometries. Boundary conditions were specified for outer boundaries of air domain where magnetic insulation was assumed.
A. Model Details
Coil used in modeling was a circular type coil with 10 turn of copper wires with conductivity of 60 MS/m .Coil diameter was 298 mm and wire’s diameter was 8 mm which were in 2 layers.
Pipe used in modeling was a steel pipe with conductivity of 5.25 MS/m and relative magnetic permeability of 1000.Pipe inside diameter, wall thickness and length were 140 mm, 14mm, and 1000 mm respectively.
The air domain was a sphere which contained all the geometries and its outer boundaries where set as magnetic insulation boundaries.
Model was solved for 2 different scenarios. Firstly, magnetic field was calculated for the coil around the pipe to obtain the reference signals and in the second scenario, the model was solved for coil around the pipe with a defect in order to capture the test signals The specification of the defect modeled for this paper are shown Table 1. Fig.1 illustrates the model and magnetic field diffusion on the pipe when there is a defect
present. Arrows show coil current density and induced current density on the pipe.
Fig.1. Magnetic field diffusion, Current density and induced current density
at 0.208 ms (maximum driver current)
B. Modeling Results
There was 4 magnetic field sensors placed at 90 degrees from each other as is shown in Fig.6 of the experimental probe.
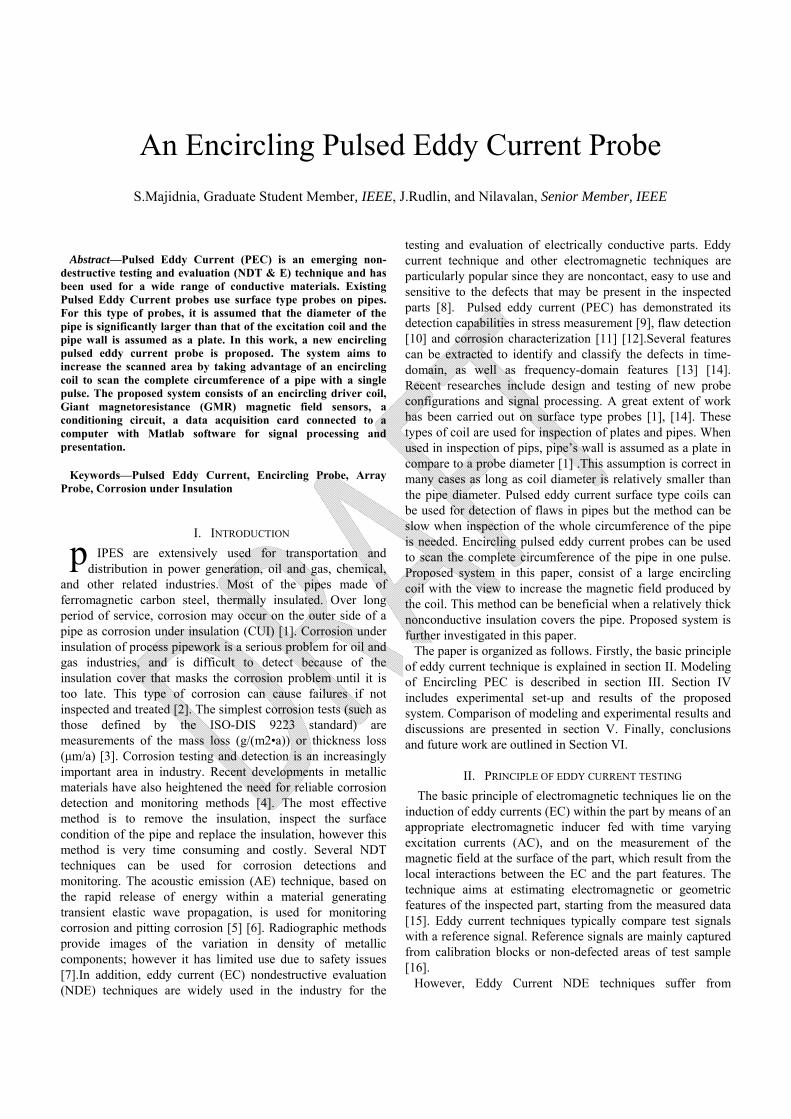
Sensor 1 was placed directly above and center of the defect. Fig.2 shows the differential results in time domain (ΔB) for
defect A which are calculated from equation (2) shown below:
∆ (2) Where BREF is the reference signal obtained on non-defected
pipe for each sensor; B is the total signal on the defected area and (ΔB) is the differential magnetic field signal.
Fig. 3 shows the ΔB of sensor 1 for all defects. These results show that the magnetic field is disturbed at all sensors’ positions with largest disturbance at sensor placed over the defect. This can be explained by the eddy current induced in the pipe. As the eddy currents travel around the pipe, magnetic fields at the position of all the sensors are disturbed due to the presence of the defect.
Fig.2. Diffrential magnetic field (Defect A)
-30
-20
-10
0
10
20
30
40
50
0 0.05 0.1 0.15 0.2 0.25 0.3 0.35 0.4
Dif
fren
tial
Mag
neti
c fi
eld
(A/m
)
Time (ms)
Defect_A_p1
Defect_A_p2
Defect_A_p3
Defect_A_p4
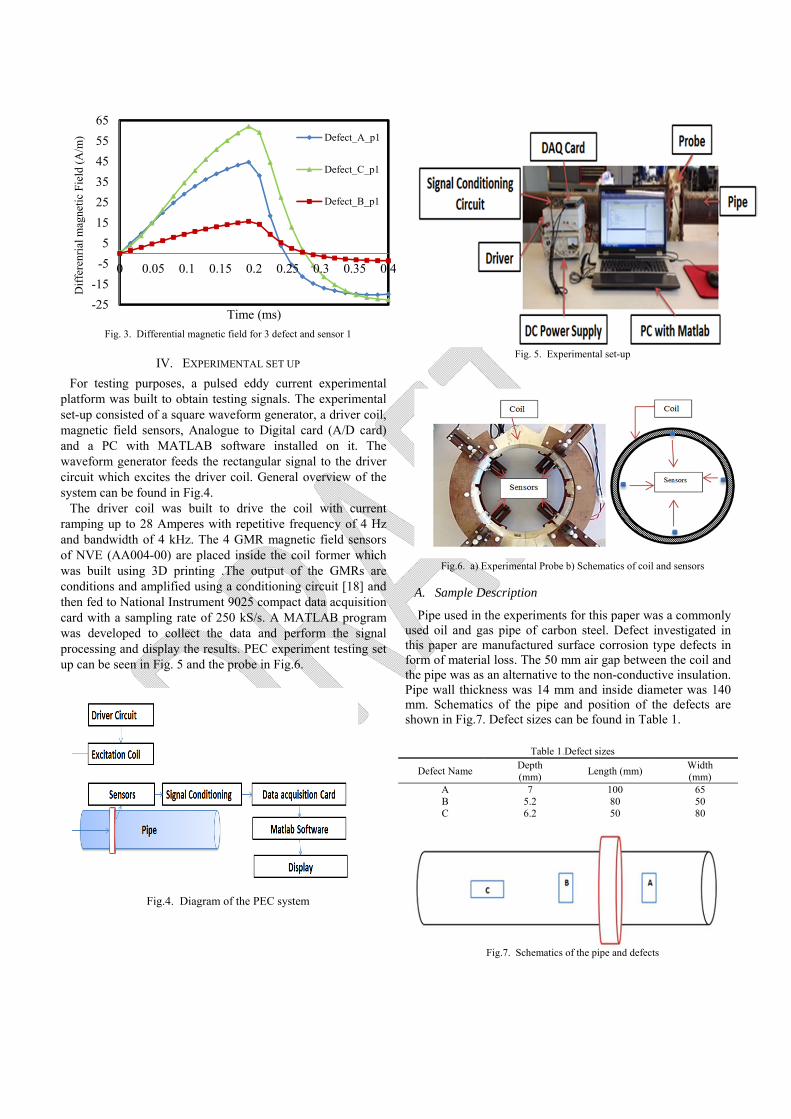
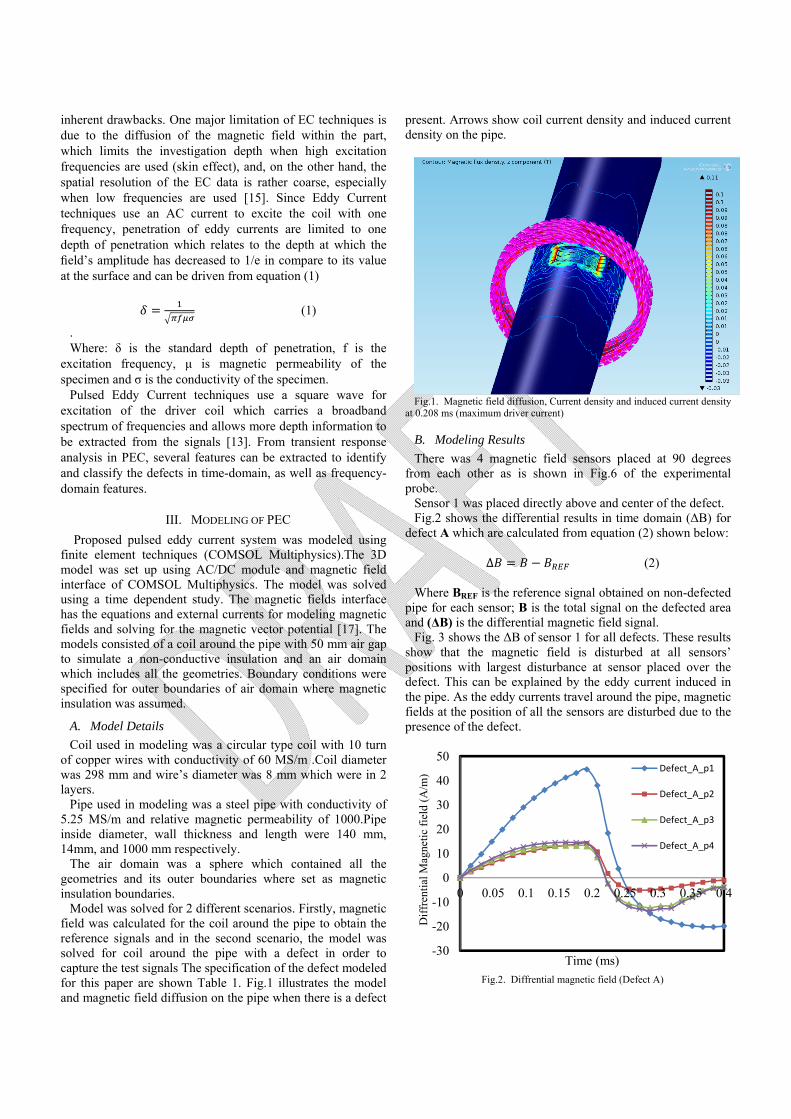
Fig. 3. Differential magnetic field for 3 defect and sensor 1
IV. EXPERIMENTAL SET UP
For testing purposes, a pulsed eddy current experimental platform was built to obtain testing signals. The experimental set-up consisted of a square waveform generator, a driver coil, magnetic field sensors, Analogue to Digital card (A/D card) and a PC with MATLAB software installed on it. The waveform generator feeds the rectangular signal to the driver circuit which excites the driver coil. General overview of the system can be found in Fig.4.
The driver coil was built to drive the coil with current ramping up to 28 Amperes with repetitive frequency of 4 Hz and bandwidth of 4 kHz. The 4 GMR magnetic field sensors of NVE (AA004-00) are placed inside the coil former which was built using 3D printing .The output of the GMRs are conditions and amplified using a conditioning circuit [18] and then fed to National Instrument 9025 compact data acquisition card with a sampling rate of 250 kS/s. A MATLAB program was developed to collect the data and perform the signal processing and display the results. PEC experiment testing set up can be seen in Fig. 5 and the probe in Fig.6.
Fig.4. Diagram of the PEC system
Fig. 5. Experimental set-up
Fig.6. a) Experimental Probe b) Schematics of coil and sensors
A. Sample Description
Pipe used in the experiments for this paper was a commonly used oil and gas pipe of carbon steel. Defect investigated in this paper are manufactured surface corrosion type defects in form of material loss. The 50 mm air gap between the coil and the pipe was as an alternative to the non-conductive insulation. Pipe wall thickness was 14 mm and inside diameter was 140 mm. Schematics of the pipe and position of the defects are shown in Fig.7. Defect sizes can be found in Table 1.
Table 1.Defect sizes
Defect Name Depth (mm)
Length (mm) Width (mm)
A 7 100 65 B 5.2 80 50 C 6.2 50 80
Fig.7. Schematics of the pipe and defects
-25
-15
-5
5
15
25
35
45
55
65
0 0.05 0.1 0.15 0.2 0.25 0.3 0.35 0.4
Dif
fere
nria
l mag
neti
c F
ield
(A
/m)
Time (ms)
Defect_A_p1
Defect_C_p1
Defect_B_p1
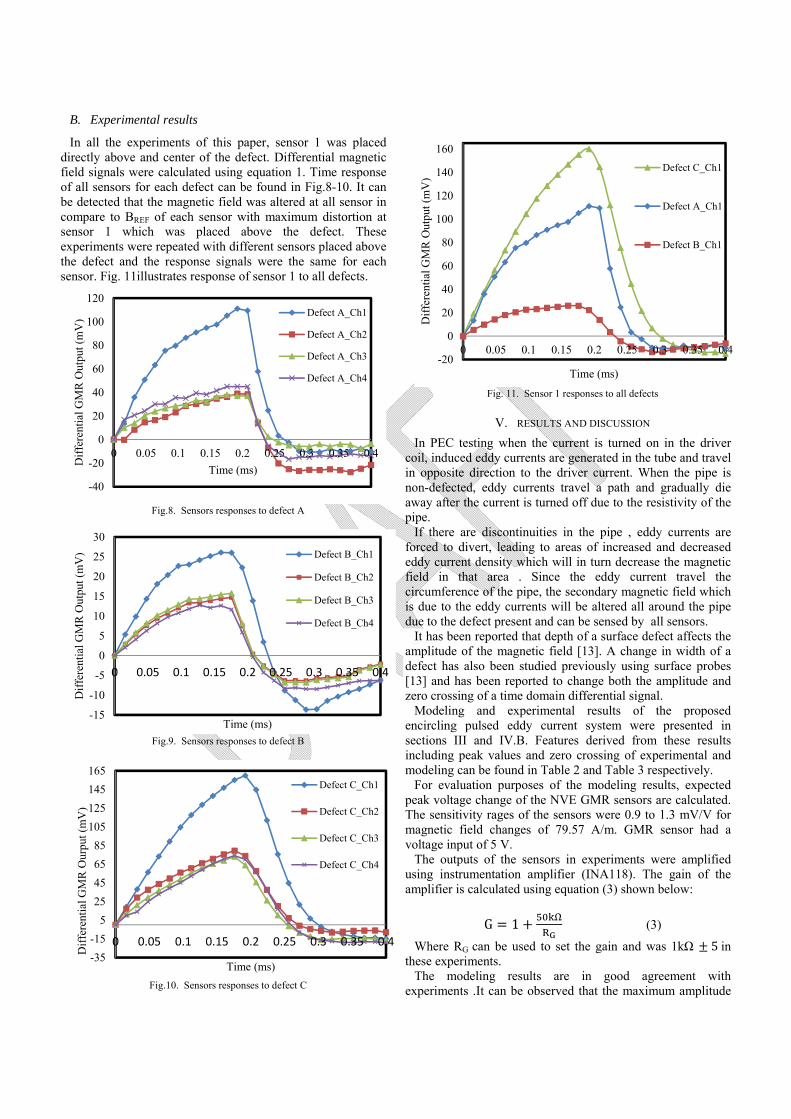
B. Experimental results
In all the experiments of this paper, sensor 1 was placed directly above and center of the defect. Differential magnetic field signals were calculated using equation 1. Time response of all sensors for each defect can be found in Fig.8-10. It can be detected that the magnetic field was altered at all sensor in compare to BREF of each sensor with maximum distortion at sensor 1 which was placed above the defect. These experiments were repeated with different sensors placed above the defect and the response signals were the same for each sensor. Fig. 11illustrates response of sensor 1 to all defects.
Fig.8. Sensors responses to defect A
Fig.9. Sensors responses to defect B
Fig.10. Sensors responses to defect C
Fig. 11. Sensor 1 responses to all defects
V. RESULTS AND DISCUSSION
In PEC testing when the current is turned on in the driver coil, induced eddy currents are generated in the tube and travel in opposite direction to the driver current. When the pipe is non-defected, eddy currents travel a path and gradually die away after the current is turned off due to the resistivity of the pipe.
If there are discontinuities in the pipe , eddy currents are forced to divert, leading to areas of increased and decreased eddy current density which will in turn decrease the magnetic field in that area . Since the eddy current travel the circumference of the pipe, the secondary magnetic field which is due to the eddy currents will be altered all around the pipe due to the defect present and can be sensed by all sensors.
It has been reported that depth of a surface defect affects the amplitude of the magnetic field [13]. A change in width of a defect has also been studied previously using surface probes [13] and has been reported to change both the amplitude and zero crossing of a time domain differential signal.
Modeling and experimental results of the proposed encircling pulsed eddy current system were presented in sections III and IV.B. Features derived from these results including peak values and zero crossing of experimental and modeling can be found in Table 2 and Table 3 respectively.
For evaluation purposes of the modeling results, expected peak voltage change of the NVE GMR sensors are calculated. The sensitivity rages of the sensors were 0.9 to 1.3 mV/V for magnetic field changes of 79.57 A/m. GMR sensor had a voltage input of 5 V.
The outputs of the sensors in experiments were amplified using instrumentation amplifier (INA118). The gain of the amplifier is calculated using equation (3) shown below:
G 1 (3)
Where RG can be used to set the gain and was 1kΩ 5in these experiments.
The modeling results are in good agreement with experiments .It can be observed that the maximum amplitude
-40
-20
0
20
40
60
80
100
120
0 0.05 0.1 0.15 0.2 0.25 0.3 0.35 0.4
Dif
fere
ntia
l GM
R O
utpu
t (m
V)
Time (ms)
Defect A_Ch1
Defect A_Ch2
Defect A_Ch3
Defect A_Ch4
-15
-10
-5
0
5
10
15
20
25
30
0 0.05 0.1 0.15 0.2 0.25 0.3 0.35 0.4
Dif
fere
ntia
l GM
R O
utpu
t (m
V)
Time (ms)
Defect B_Ch1
Defect B_Ch2
Defect B_Ch3
Defect B_Ch4
-35
-15
5
25
45
65
85
105
125
145
165
0 0.05 0.1 0.15 0.2 0.25 0.3 0.35 0.4
Dif
fere
ntia
l GM
R O
urpu
t (m
V)
Time (ms)
Defect C_Ch1
Defect C_Ch2
Defect C_Ch3
Defect C_Ch4
-20
0
20
40
60
80
100
120
140
160
0 0.05 0.1 0.15 0.2 0.25 0.3 0.35 0.4
Dif
fere
ntia
l GM
R O
utpu
t (m
V)
Time (ms)
Defect C_Ch1
Defect A_Ch1
Defect B_Ch1
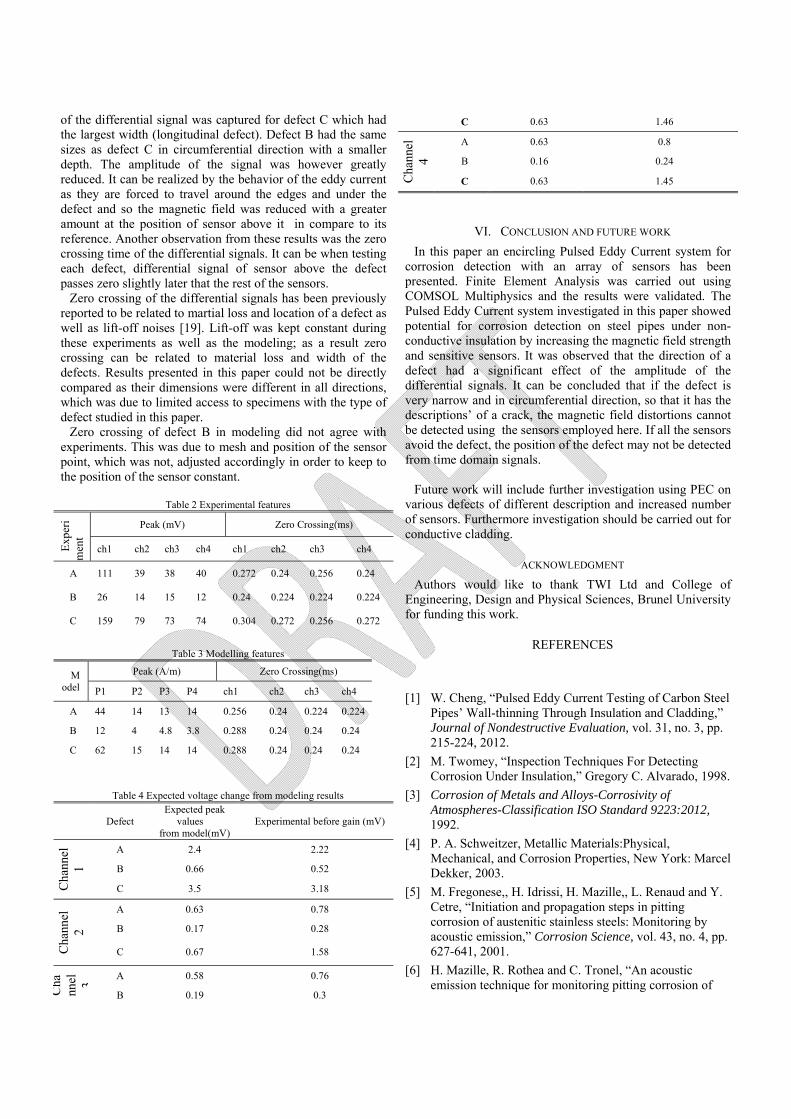
of the differential signal was captured for defect C which had the largest width (longitudinal defect). Defect B had the same sizes as defect C in circumferential direction with a smaller depth. The amplitude of the signal was however greatly reduced. It can be realized by the behavior of the eddy current as they are forced to travel around the edges and under the defect and so the magnetic field was reduced with a greater amount at the position of sensor above it in compare to its reference. Another observation from these results was the zero crossing time of the differential signals. It can be when testing each defect, differential signal of sensor above the defect passes zero slightly later that the rest of the sensors.
Zero crossing of the differential signals has been previously reported to be related to martial loss and location of a defect as well as lift-off noises [19]. Lift-off was kept constant during these experiments as well as the modeling; as a result zero crossing can be related to material loss and width of the defects. Results presented in this paper could not be directly compared as their dimensions were different in all directions, which was due to limited access to specimens with the type of defect studied in this paper.
Zero crossing of defect B in modeling did not agree with experiments. This was due to mesh and position of the sensor point, which was not, adjusted accordingly in order to keep to the position of the sensor constant.
Table 2 Experimental features
Exp
eri
men
t
Peak (mV) Zero Crossing(ms)
ch1 ch2 ch3 ch4 ch1 ch2 ch3 ch4
A 111 39 38 40 0.272 0.24 0.256 0.24
B 26 14 15 12 0.24 0.224 0.224 0.224
C 159 79 73 74 0.304 0.272 0.256 0.272
Table 3 Modelling features
Model
Peak (A/m) Zero Crossing(ms)
P1 P2 P3 P4 ch1 ch2 ch3 ch4
A 44 14 13 14 0.256 0.24 0.224 0.224
B 12 4 4.8 3.8 0.288 0.24 0.24 0.24
C 62 15 14 14 0.288 0.24 0.24 0.24
Table 4 Expected voltage change from modeling results
Defect
Expected peak values
from model(mV) Experimental before gain (mV)
Cha
nnel
1
A 2.4 2.22
B 0.66 0.52
C 3.5 3.18
Cha
nnel
2
A 0.63 0.78
B 0.17 0.28
C 0.67 1.58
Cha
nnel
3
A 0.58 0.76
B 0.19 0.3
C 0.63 1.46
Cha
nnel
4
A 0.63 0.8
B 0.16 0.24
C 0.63 1.45
VI. CONCLUSION AND FUTURE WORK
In this paper an encircling Pulsed Eddy Current system for corrosion detection with an array of sensors has been presented. Finite Element Analysis was carried out using COMSOL Multiphysics and the results were validated. The Pulsed Eddy Current system investigated in this paper showed potential for corrosion detection on steel pipes under non-conductive insulation by increasing the magnetic field strength and sensitive sensors. It was observed that the direction of a defect had a significant effect of the amplitude of the differential signals. It can be concluded that if the defect is very narrow and in circumferential direction, so that it has the descriptions’ of a crack, the magnetic field distortions cannot be detected using the sensors employed here. If all the sensors avoid the defect, the position of the defect may not be detected from time domain signals.
Future work will include further investigation using PEC on
various defects of different description and increased number of sensors. Furthermore investigation should be carried out for conductive cladding.
ACKNOWLEDGMENT
Authors would like to thank TWI Ltd and College of Engineering, Design and Physical Sciences, Brunel University for funding this work.
REFERENCES
[1] W. Cheng, “Pulsed Eddy Current Testing of Carbon Steel Pipes’ Wall-thinning Through Insulation and Cladding,” Journal of Nondestructive Evaluation, vol. 31, no. 3, pp. 215-224, 2012.
[2] M. Twomey, “Inspection Techniques For Detecting Corrosion Under Insulation,” Gregory C. Alvarado, 1998.
[3] Corrosion of Metals and Alloys-Corrosivity of Atmospheres-Classification ISO Standard 9223:2012, 1992.
[4] P. A. Schweitzer, Metallic Materials:Physical, Mechanical, and Corrosion Properties, New York: Marcel Dekker, 2003.
[5] M. Fregonese,, H. Idrissi, H. Mazille,, L. Renaud and Y. Cetre, “Initiation and propagation steps in pitting corrosion of austenitic stainless steels: Monitoring by acoustic emission,” Corrosion Science, vol. 43, no. 4, pp. 627-641, 2001.
[6] H. Mazille, R. Rothea and C. Tronel, “An acoustic emission technique for monitoring pitting corrosion of
austenitic stainless steels,” Corrosion Science, vol. 37, no. 9, pp. 1365-1375, 1995.
[7] J. K. Paik, “Condition assessment of aged ships,” in 16th International Ship and Offshore Structures Congress, Southampton,UK, 2006.
[8] P. Y. Joubert, Y. L. Diraison, Z. Xi and E. Vourc’h, “Pulsed eddy current imaging device for non destructive evaluation applications,” in IEEE Sensors, Baltimore, MD, 2013.
[9] M. Morozov, G. Y. Tian and P. J. Withers, “Noncontact evaluation of the dependency of electrical conductivity on stress for various Al alloys as a function of plastic deformation and annealing,” Journal of Applied Physics, vol. 108, no. 2, pp. 024909-1–024909-9, 2010.
[10] G. Y. Tian, A. Sophian,, D. Taylor and J. Rudlin, “Multiple sensors on pulsed eddy-current detection for 3-D subsurface crack assessment,” IEEE Sensors, vol. 5, no. 1, pp. 90-96, 2005.
[11] Y. He, G. Tian, H. Zhang, M. Alamin, A. Simm and P. Jackson, “Steel Corrosion Characterization Using Pulsed Eddy Current Systems,” IEEE SENSORS JOURNAL, vol. 12, no. 6, pp. 2113-2120, 2012.
[12] Y. A. Plotnikov, W. J. Bantz and J. p. Hansen, “Enhanced corrosion detection in airframe structures using pulsed eddy current and advanced processing,” Materials Evaluation, vol. 65, no. 4, pp. 403-410, 2007.
[13] A. Sophian, Characterisation of Surface and Sub-Surface Discountinuities in Materials Using Pulsed Eddy Current Sensors, PhD Thesis, 2003, pp. 46-51.
[14] G. Y. Tian and A. Sophian, “Defect Classification Using a New Feature for Pulsed Eddy Current Sensors,” NDT and E International, vol. 38, no. 1, pp. 77-82, 2005.
[15] S. Udpa and P. Moore, Nondestructive Testing Handbook, 3 ed., vol. 5, American Nondestructive Society, 2004.
[16] S. Majidnia, C. Schineider, J. Rudlin and R. Nilavalan, “A Method of Determining the Eddy Current Instrument Response from Models,” Insight, vol. 56, pp. 82-86, 2014.
[17] C. Multiphysiscs, “Comsol Multiphysiscs User's Guide,” 2010.
[18] J. P. Sebasti´a, J. A. Lluch, and R. L. Vizca´ıno, “Signal conditioning for GMR magnetic sensors,” Sensors and Actuators A: Physical, no. 137, pp. 230-235, 2007.
[19] M. S. Safizadeh, B. A. Lepine, D. S. Forsyth and A. Fahr, “Time-Frequency Analysis of Pulsed Eddy Current Signals,” Journal of Nondestructive Evaluation, vol. 20, no. 2, pp. 73-86, 2001.