Embed Size (px)
Citation preview

Supplemental Materials
“The Big-Fish-Little-Pond Effect: Generalizability of Social Comparison Processes Over Two Age Cohorts From Western, Asian, and Middle Eastern Islamic Countries”
by H. W. Marsh et al., 2014, Journal of Educational Psychology
http://dx.doi.org/10.1037/a0037485
Appendix A
Big Fish Little Pond: Theoretical Background
Focusing on ASC in educational contexts, Marsh (1984; see also Marsh & Parker, 1984;
Marsh, Seaton, et al., 2008) proposed the BFLPE to encapsulate frame of reference effects that
are based on an integration of theoretical models and empirical research from diverse disciplines:
relative deprivation theory (Davis, 1966; Stouffer, Suchman, DeVinney, Star, & Williams,
1949); sociology (Alwin & Otto, 1977; Hyman, 1942); psychophysical judgment (e.g., Helson,
1964; Marsh, 1974; Parducci, 1995; Wedell & Parducci, 2000); social judgment (e.g. Morse &
Gergen, 1970; Upshaw, 1969); and social comparison theory (Festinger, 1954). In this BFLPE
model, Marsh hypothesized that students compare their abilities with the abilities of their
classmates and use this social comparison impression as one basis for forming their own self-
concept. A negative BFLPE occurs when equally able students have lower ASCs if they compare
themselves with more able classmates, and higher ASCs if they compare themselves with less
able classmates.
Cross-Cultural Support for the BFLPE
One of the goals of cross-cultural research is to test the replicability of existing theories
in other cultures, investigate new angles in diverse cultural contexts, and propose universal, pan-
human theories (Segall, Lonner, & Berry, 1998, p. 1102). In their critique of self-concept
research from this cross-cultural perspective, Marsh and Yeung (1999) noted the need to pursue
more carefully constructed cross-national comparisons in order to evaluate more fully the
generalizability of support for the BFLPE. Clearly, stronger cross-cultural studies need to
compare the results from at least two—and preferably many—countries based on comparable
samples, the same academic self-concept instrument, and the same measures of achievement.
Because of the difficulty in achieving these criteria, apparent cross-cultural differences are
typically confounded with potential differences in the composition of samples being compared
and, perhaps, the appropriateness of materials.
However, there now exists very strong support for the cross-cultural generalizability of
the BFLPE for high school students, based on successive data collections of the Organisation for
Economic Co-operation and Development (OECD) Program for International Student
Assessment (PISA) data. Marsh and Hau (2003) used the PISA 2000 data based on 103,558 15
year-old students from 26 predominantly industrialized Western countries. Using multilevel
modeling, they found support for the BFLPE (positive effects of individual student achievement
on ASC, but negative effects of school-average achievement on ASC) for the total sample and in
24 of the 26 countries considered separately. Although there were significant differences
between countries, the country-level variation in the negative effect of school-average
achievement was small, thus supporting the cross-cultural generalizability of the BFLPE.
Seaton, Marsh, and Craven (2009, 2010) used PISA 2003 (265,180 students, 10,221
schools, 41 countries), which included more collectivist and developing economies than PISA
2000. They also found strong support for the generalizability of the BFLPE, which was
significant in 38 of the 41 countries. The BFLPE was not moderated by the cultural orientation
or economic development level of the country. This led the authors to conclude that the BFLPE
was a pan-human theory, as it “is not only a symptom of developed countries and individualist
societies, but it is also evident in developing nations and collectivist countries of the world” (p.
414). Seaton et al. (2010) then evaluated 16 potential moderators of the BFLPE for PISA 2003,
finding that BFLPEs were somewhat larger for students who were highly anxious, used
memorization strategies, or preferred to work cooperatively. However, the BFLPE was not
moderated by ability, SES, intrinsic and extrinsic motivation, self-efficacy, elaboration and
control learning strategies, competitive orientation, sense of belonging to school, or relationship
with teachers; this again attests to the broad generalizability of the BFLPE.
Nagengast and Marsh (2012) used the PISA 2006 database in the largest cross-cultural
study of the BFLPE undertaken to date, and significantly extended the previous PISA studies.

Based on newly developed doubly latent contextual effects models (Lüdtke, et al., 2011; Marsh,
et al., 2009), their results indicated that the BFLPE on science self-concept was significant in 50
out of 56 countries included in PISA 2006, which included more culturally and economically
diverse countries than previously sampled. They also extended the BFLPE to career aspirations
in science, demonstrating that career aspirations were positively predicted by individual student
academic achievement but negatively predicted by school-average achievement. However, both
the positive effects of individual achievement and the negative effects of school-average
achievement on aspirations were significantly mediated by ASC.
In summary, of the three BFLPE-PISA studies, Nagengast and Marsh (2012) reported
that the effect of school-average achievement was negative in all but one of the 123 samples
considered across the three studies, and significantly so in 114 samples. However, particularly
for the earliest of these PISA studies, the countries included were predominantly OECD and
Western-developed countries; this restricted the generalizability of the findings.
Developmental Support for the Generalizability of the BFLPE
For many developmental, educational, and psychological researchers, self-concepts are a
“cornerstone of both social and emotional development” (Kagen, Moore, & Bredekamp, 1995, p.
18; also see Davis-Kean & Sandler, 2001; Marsh, Ellis, & Craven, 2002); self-concepts develop
early in childhood and, once established, they are enduring (e.g., Eder & Mangelsdorf, 1997).
The development of self-concept is therefore emphasized in many early childhood programs
(e.g., Fantuzzo et al., 1996). In a meta-analysis of the reliability of young children’s self-
concepts, Davis-Kean and Sandler (2001) argued that young children have both the language and
the cognitive ability to discuss the self by the time they are in preschool (see also Bates, 1990;
Bornholt, 1997; Damon & Hart, 1988; Lewis & Brooks-Gunn, 1979; Penn, Burnett, & Patton,
2001), but that early childhood programs need a reliable basis for evaluating interventions to
enhance children’s self-concepts (Fantuzzo et al., 1996; Marsh, Debus, & Bornholt, 2005).
However, there is surprisingly little systematic self-concept research with young children,
particularly in relation to individual student, class-average, and school-average achievement.
Hattie (1992; Hattie & Marsh, 1996) reviewed theoretical and empirical support for
stages of growth in the development of self-concept, arguing against the notion of fixed stages

that all persons must pass through. Instead, he posited seven parallel developments that are
relevant to self-concept formation: (1) children distinguish self and others, (2) children
distinguish self and the environment, (3) changes in major reference groups lead to changes in
expectations, (4) attributions are made to salient personal and social or external sources, (5)
cognitive processing capacities develop, (6) children develop particular cultural values, and (7)
children develop strategies for confirmation and disconfirmation of self-referent information.
Thus, with age and development, young children increasingly integrate information from their
immediate environment into their self-concept formation. This is particularly relevant to the
present investigation, emphasizing the integration of external frames of reference and social
comparison into self-concept formation.
During the 1990s, developmental psychologists addressed progressive differentiation
among self-concepts (e.g., Dweck, 1999; Eccles et al., 1993; Eder & Mangelsdorf, 1997; Harter,
1998; Marsh, Craven, & Debus, 1998; Ruble & Dweck, 1995; Wigfield et al., 1997). Harter
(1983, 1999, in press) proposed a developmental model in which self-concept becomes
increasingly abstract and differentiated with age, moving from a global perspective of being
smart, to more differentiated self-representations in specific school subjects. She suggests that
during early childhood the young child can construct concrete cognitive representations of
observable features of self, but has difficulty in differentiating actual and desired attributes, and
incorporating social comparison information for purposes of self-evaluation; this results in
unrealistically positive self-evaluations. At the next stage of development, Harter (1998)
indicates that young children form representational sets of related attributes—what Fischer
(1980) labeled “representational mappings.” However, such self-descriptions are highly
reflective of reductive, good-or-bad, all-or-none conceptions, resulting in unidimensional
thinking. Harter suggested that it is not until middle childhood that children become capable of
integrating information from specific features to higher-order generalizations reflecting trait
labels—what Fischer has referred to as “representational systems”; more balanced
representations of underlying competencies that were more closely related to external criteria.
Consistent with Harter’s framework, there is growing evidence to suggest that the self-concept of
children becomes more accurate (in relation to external criteria) and more differentiated with age
and increasing cognitive functioning (see also Bouffard et al., 1998; Eccles et al., 1983, 1993;
Russell, Bornholt, & Ouvrier, 2002; Wigfield et al., 1997; Wigfield & Eccles, 1992). On the

basis of earlier research (e.g., Nicholls, 1979; Stipek & Mac Iver, 1989), Eccles et al. proposed
that declining self-concepts for young children reflected an optimistic bias for young children
that was tempered by experience, based on feedback and social comparison, so that their self-
perceptions became more accurate with age. This trend is reinforced by changes in school
environments, as educational achievements become more salient and education encourages
competition, social comparisons, and external frames of reference.
Indeed, many authors (Chapman & Tunmer, 1995; Eccles, Wigfield, Harold, &
Blumenfeld, 1993; Harter, 1999; Marsh, 1989; Marsh & Craven, 1997; Skaalvik & Hagtvet,
1990; Wigfield & Eccles, 1992; Wigfield et al., 1997) have offered a developmental perspective
on the relation between academic self-concept and academic achievement. For example, Marsh
(1989, 1990) proposed that the self-concepts of very young children are very positive and are not
highly correlated with external indicators (e.g., skills, accomplishments, achievement, self-
concepts inferred by significant others) but that with increasing life experience, children learn
their relative strengths and weaknesses, so that specific self-concept domains become more
differentiated and more highly correlated with external indicators. It should be noted, however,
that this positive halo effect is normal in young children. As Harter (1999, p. 38) has pointed out,
“Self-descriptions typically represent an overestimation of personal abilities. It is important to
appreciate, however, that these apparent distortions are normative in that they reflect cognitive
limitations rather than conscious efforts to deceive the listener.” In line with this perspective,
Marsh et al. (1998) showed that reliability, stability, and factor structure of self-concept scales
improve with age (children 5–8 years of age). In addition, consistent with the proposal that
children’s self-perceptions become more realistic with age, self-ratings of older children were
more correlated with inferred self-concept ratings by their teachers.
In a summary of this developmental research on relations between self-concept and
achievement, Guay, Marsh, and Boivin (2003) suggested that this developmental trend could be
explained by three factors: (a) Older children have higher cognitive abilities, which improves
their coordination between self-representations, thus leading to better agreement between self-
concept ratings and external indicators; (b) these higher cognitive skills lead older children to use
social comparison processes, which foster a more balanced view of the self; and (c) older
children have internalized evaluative standards of others, which lead to less egocentric

evaluations of the self. These three developmental processes lead to greater accuracy, due to
increased attunement to environmental feedback among older children, thus making it possible
for ASC to predict changes in academic achievement. Using a multi-cohort multi-wave design
(children in grades 2, 3, and 4 tested in each of three successive years), Guay et al. (2003) found
that as children grew older, their ASC responses became more reliable, more stable, and more
highly correlated with achievement. However, due in part to the modest sample sizes (Ns less
than 150 for each age cohort), the age differences in stability and relations with achievement in
multigroup structural equation models were not statistically significant. In their meta-analysis of
studies evaluating relations between math and verbal self-concept and achievement, Möller et al.
(2009) reported that relations among self-concept and achievement were higher when
achievement was based on school grades rather than achievement test scores. Although they
found that correlations among verbal and math self-concept became more differentiated with
age, Möller et al. (2009) reported that relations between achievement and the matching ASC
domain (.61 for math, .49 for verbal) were reasonably consistent over age. However, because of
the paucity of available studies with young children (only 3 of 69 samples reported results for
children in Grade 4 or younger) the generalizability of this finding was not strong.
An important limitation in BFLPE research is thus the lack of developmental perspective
and a paucity of research with younger children. Indeed, very few of the studies reviewed by
Marsh, Seaton, et al. (2008) were based on responses by primary school students. In the first
BFLPE, Marsh and Parker (1984) coined the phrase “BFLPE” based on a small-scale study of
primary students in sixth grade. Marsh, Chessor, et al. (1995) used a matching design to evaluate
the effects of attending academically selective schools on the ASCs of primary school students.
Compared to pre-test measures (prior to selection for selective schools) and compared to a
matched control group (matched on achievement prior to selection for selective schools),
attending selective schools had negative effects on ASC. In related German research, Jerusalem
(1984) examined the self-concepts of West German students who moved from non-selective,
heterogeneous primary schools to secondary schools that were streamed on the basis of academic
achievement. Based on pre-test scores collected prior to the transition and post-test scores at the
end of the first year of secondary school, the effect of attending selective schools on ASC was
negative. Tymms (2001) evaluated the BFLPE as part of a large-scale (21,000 2nd grade students,
1,078 classes, 628 schools) study of school effectiveness. In line with BFLPE predictions, he

found that class-average academic achievement had negative effects on academic attitudes
(which included some ASC-like items). Although these studies are heuristic and collectively
suggest that the BFLPE can be identified in primary school students, it would be dubious to use
them to make generalizations about the sizes of BFLPEs in primary schools, or to compare these
to the large body of research based mostly on students attending secondary schools.

Appendix B
TIMSS Constructs Used in This Study
Math Self-Concept (MSC)
I usually do well in math (MSC1)
Math is harder for me than for many of my classmates (MSC2)
I am just not good at math (MSC3)
I learn things quickly in math (MSC4)
Individual Student Math Achievement
Composite based on Algebra; Data & Chance; Number; Geometry
Class-Average Math Achievement
Individual Student Achievement Aggregated to the class level
Cluster (Class ID; School ID; complex design cluster by class)
Note. Responses to the math self-concept, positive affect and coursework were all along the same
4-point Likert (agree–disagree) response scale.

Appendix C
Reliability Estimates
In preliminary analyses, we estimated the average reliability of the MSC score for each of
the 26 (2 age cohorts 13 country) groups. Due in part to the brevity of the 4-item MSC scale,
at least some of the coefficient alpha (α) estimates of reliability (Table 1) are modest for
purposes of use in manifest models that do not correct for unreliability; reliabilities sometimes
reached a desirable standard of .80, but in other cases fell below an acceptable value of .70 or
even .60. Reliability estimates were systematically higher for the older age cohort (M α = .781)
than the younger cohort (M α = .681). The reliability estimates were substantially lower in the
Middle Eastern Islamic countries than in the Western or Asian countries. Although these country
level differences are evident in both age cohorts, the reliability estimates were particularly low
for the younger cohort in the Middle Eastern Islamic countries (M α = .512) compared to
Western (M α = .725) and Asian (M α = .743) countries. Even though reliability estimates for the
older Middle Eastern students (M α = .687) were still lower than for Western (M = .810) and
Asian (M = .811) students, these differences were smaller than for the younger cohort. Overall
reliability estimates are broadly similar for Western and Asian countries, but lower for Middle
Eastern Islamic countries.
Particularly when reliability estimates are as low as in some younger cohorts from
Middle Eastern Islamic countries, it is of dubious merit to make country-to-country comparisons
based on manifest scale or composite scores, which are the basis of most TIMSS studies, and
which are given implicit support in the test manual. In this sense, these preliminary results
support the need to consider latent-variable models that control for unreliability, but are also
consistent with the logic of country-specific control for measurement error. Similarly, systematic
differences in reliability for the two age cohorts make problematic, those studies that do not
control for these differences in measurement error. In summary, appropriately constructed latent
variable models overcome limitations in large part due to poor reliability that have the potential
to undermine the comparability of comparisons across countries or age cohorts based on TIMSS
data—a critical limitation to TIMSS studies based on manifest models of these TIMSS self-
belief constructs. We also note that reliability estimates based on the trichomized scale scores

provided in the TIMSS database and used in many studies, would result in substantially lower
and more biased estimates of relations among constructs and seriously undermine developmental
studies of the different age cohorts.

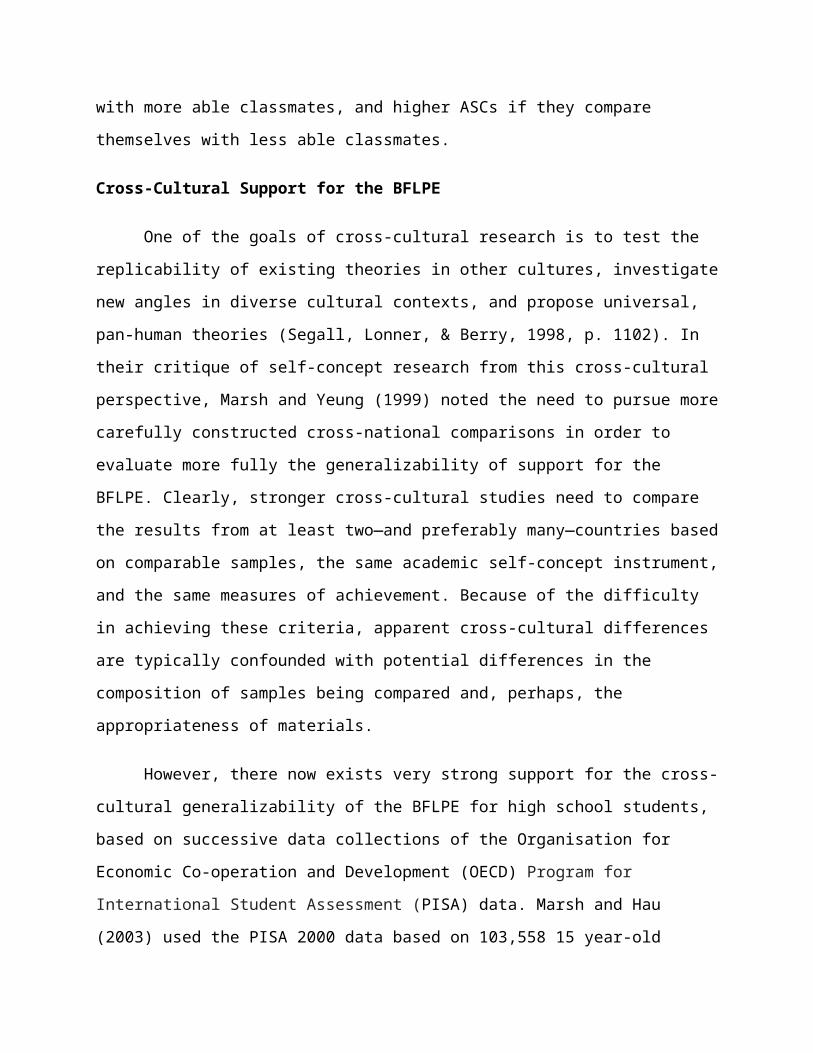
Table S1
Variance Components of the TIMSS Math and Science Motivation Constructs Used in this Study
Variances _
Country Cohort Achieve Self-concept
Western Countries
Aust 4 0.899(.043) 0.638(0.035)
8 0.935(.061) 0.859(0.067)
Engl 4 0.931(.030) 0.600(0.024)
8 1.045(.062) 0.923(0.060)
Ital 4 0.835(.031) 0.531(0.027)
8 0.868(.041) 0.641(0.036)
Norw 4 0.780(.024) 0.472(0.015)
8 0.710(.017) 0.418(0.012)
Scot 4 0.807(.029) 0.503(0.019)
8 0.949(.047) 0.515(0.019)
USA 4 0.842(.025) 0.732(0.032)
8 0.941(.033) 0.543(0.010)
Total 4 0.849(.013) 0.724(0.020)
8 0.908(.019) 0.773(0.047)
Asian Countries
Taiwan 4 0.608(.028) 0.394(0.023)
8 1.121(.092) 1.252(0.126)
Hong 4 0.716(.023) 0.437(0.017)
8 0.966(.044) 0.781(0.053)
Japa 4 1.042(.044) 0.362(0.011)

8 1.407(.080) 1.213(0.057)
Sing 4 0.713(.019) 0.637(0.027)
8 1.401(.048) 1.102(0.061)
Total 4 0.770(.015) 0.458(0.010)
8 1.224(.035) 1.087(0.042)
Middle Eastern Islamic Countries
Iran 4 1.085(.051) 0.764(0.049)
8 1.030(.052) 1.025(0.074)
Kuwa 4 1.639(.054) 0.870(0.041)
8 1.040(.038) 0.666(0.037)
Tuni 4 2.109(.070) 0.906(0.024)
8 0.593(.018) 0.716(0.028)
Total 4 1.611(.033) 1.084(0.049)
8 0.888(.022) 0.458(0.021)
Total Over All Countries
Total 4 1.000(.010) 0.600(0.008)
Total 8 1.000(.015) 0.834(0.019)
Total 1.000(.010) 0.717(0.010)
Note. Achievement scores are standardized to have variance = 1.0 within each cohort (across all countries). Self-concept items are standardized to have variance = 1.0 across all 26 (2 cohort 13 country) groups. For self-concept latent factors, variances are for latent variables based on Model ML3 (see Table S2 and earlier discussion).

Appendix D
Support for a Priori Factor Structure
Our a priori factor model (following from Marsh et al., 2013) is a simple model in which
the 4 self-concept items are associated with one latent self-concept factor, math achievement is a
single-item variable (represented by TIMMS’s five sets of plausible values which control for
unreliability), and there is a negative-item method effect represented by a correlated uniqueness
between the two negatively worded self-concept items. We began with single-level multi-group
models (using the Mplus complex design to control for clustering of students within classes and
schools). In the first model (SL1 in Table S2), factor loadings relating self-concept items to the
latent self-concept factor were freely estimated in each of the 26 (2 cohort 13 country) groups;
the goodness of fit was good (CFI = .976; TLI = .942; RMSEA = .062). In the next model (SL2
in Table S2), factor loadings were constrained to be the same in each of the 26 groups. Although
goodness of fit was slightly poorer for this highly restrictive model imposing invariance across
26 groups, the two indices that incorporate control for parsimony were nearly as good for this
highly constrained model (ΔTLI = .003, ΔRMSEA = .001). In Model SL3 we evaluated the
effect of removing the a priori hypothesized negative item method effect, which resulted in a
noticeable decline in goodness of fit (ΔTLI = .027, ΔRMSEA = .012), supporting the a priori
hypothesis and the need to include this effect in the model.
Next we tested multilevel multigroup CFA models. In three different multilevel models
(Models ML1-ML3 in Table S2), factor loadings were freely estimated at L2, constrained to be
equal across the 26 groups within L1 and within L2 (but not across L1 and L2), and constrained
to be equal within and across L1 and L2. Inspection of the goodness of fit indices provides good
support for total invariance across the student and class levels. Indeed, for fit indices that control
for parsimony, the fit indices for the more constrained models are actually better than the
unconstrained model. Subsequent results are based on the highly constrained ML3, in which all
factor loadings are constrained to be the same across all 26 groups at both the student and class
level (CFI = .956; TLI = .941; RMSEA = .054; see Appendix F for the Mplus syntax used to test
this model).

Table S2
Summary of Goodness of Fit Statistics for Multigroup Models of Invariance Over 26 Groups (13
Countries 2 Age) Cohorts: Single- and Multilevel Models (L1 = students, L2 = classroom)
Model χ 2 df CFI TLI RMSEA Description
Single-Level Models:
SL1 1907 105 .976 .942 .062 No invariance
SL2 3383 180 .958 .939 .063 Invariance over 26 groups
SL3 5448 206 .931 .913 .075 SL2 with no negative item method effects
SL4 3345 177 .958 .939 .063 Invariance over 13 counties within each of 2 cohorts
SL5 2419 144 .970 .946 .059 Invariance over 2 cohorts within each of 13 countries
Multi-Level Models
ML1 5310 309 .958 .929 .060 Invariance over 26 groups at L1 but not L2
ML2 5465 384 .957 .942 .055 Invariance over 26 groups Within Each Level
ML3 5588 387 .956 .941 .054 Invariance over 26 groups and Level
Note. CHI = chi-square; df = degrees of freedom ratio; CFI = Comparative fit index; TLI =
Tucker-Lewis Index; RMSEA = Root Mean Square Error of Approximation. All analyses were
weighted by the appropriate weighting factor and based on a complex design option to account
for nesting students within classrooms and schools.

Appendix E
Comparison of BFLPEs Based on PISA and TIMSS
Strong cross-cultural studies of the BFLPE need to compare the results from at least two
—and preferably many—countries based on comparable samples, the same academic self-
concept instrument, and the same measures of achievement; otherwise apparent cross-cultural
differences are confounded with potential differences in the composition of samples and,
perhaps, the appropriateness of materials. Addressing these challenges, there is strong support
for the cross-cultural generalizability of the BFLPE for high school students, based on successive
data collections of the Organisation for Economic Co-operation and Development (OECD)
Program for International Student Assessment (PISA) data: Marsh and Hau (2003) used the
PISA 2000 data based on 103,558 15 year-old students from 26 predominantly industrialized
Western countries; Seaton, Marsh, and Craven (2009, 2010) used PISA 2003 (265,180 students,
10,221 schools, 41 countries), which included more collectivist and developing economies than
PISA 2000; Nagengast and Marsh (2012) used the PISA 2006 database in the largest cross-
cultural study of the BFLPE undertaken to date, and significantly extended the previous PISA
studies. In summary, of the three BFLPE-PISA studies, Nagengast and Marsh (2012) reported
that the effect of school-average achievement was negative in all but one of the 123 samples
across the three studies, and significantly so in 114 samples. The average effect size across all
123 samples is -.223 (see Table S3).
Here we provide a detailed, country-by-country comparison of results from these three
PISA studies with the results of the present investigation—the first large-scale cross-cultural
study of the BFLPE not based on PISA. Importantly, the consistency of the BFLPEs for both
cohorts for the TIMSS data in our study is even stronger than in previous cross-cultural studies
based on PISA data. Thus, the average BFLPE ES across 123 samples based on PISA data (59
countries sampled in one or more data collections in PISA2000, PISA2003, and PISA2006) is
-.223, while the average BFLPE ES across 24 samples (12 countries 2 age cohorts) in the
present study is -.377. Furthermore this general trend is reasonable consistent across overlapping
countries that participated in both PISA and TIMSS. This might seem surprising, in that PISA
data is based on somewhat older students—15-year-olds—than even the oldest TIMSS cohort,
and our results suggest that the BFLPE is somewhat stronger for older students (-.292 for Year 4,
-.426 for Year 8). However, these findings are consistent with our a priori predictions based on
the local dominance effect when comparing results based on school-average achievement (PISA)
and class-average achievement (TIMSS). Nevertheless, there are a number of critical differences
between TIMSS and PISA sampling designs that might explain, in part, these differences but
also dictate caution in interpretation of the results.

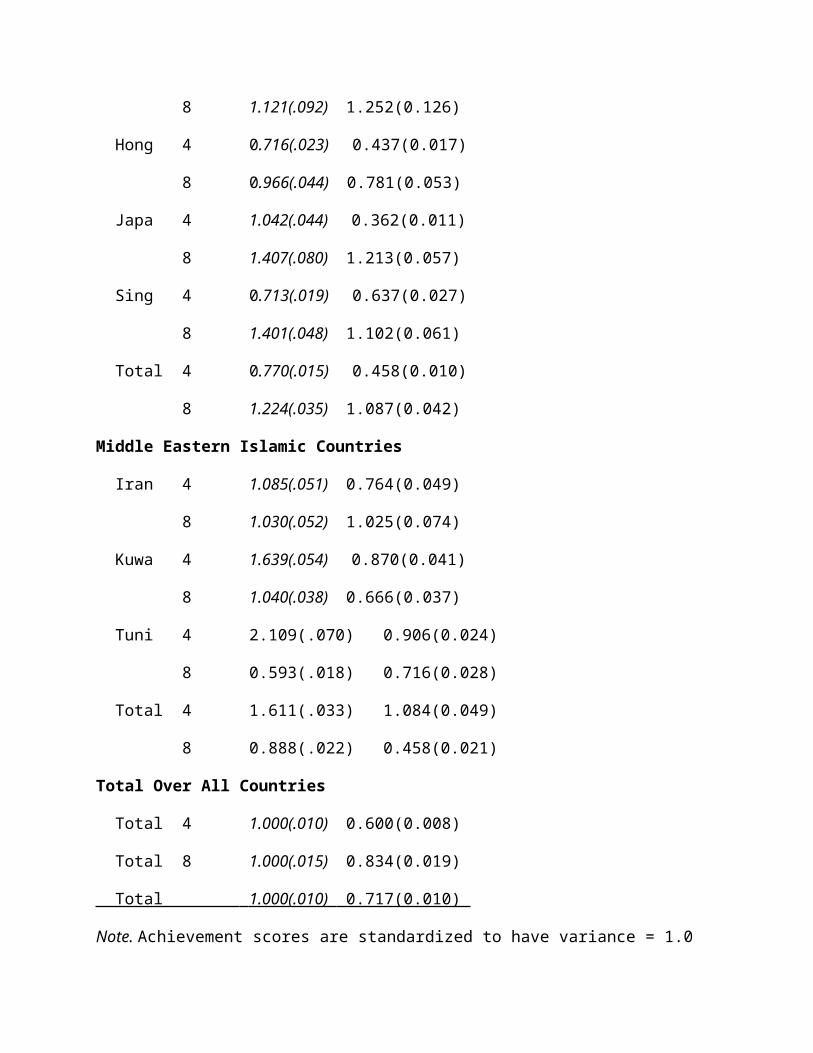
Table S3
Summary of BFLPEs in Three PISA Studies and the Current TIMSS Study
PISA TIMSS
2006 2003 2000 Year 4 Year 8
Science Math General Country Math Math
-0.154 Azerbaijan
-0.177 Argentina
-0.168 -0.281 -0.23 Australia -0.358 -0.627
-0.231 -0.483 -0.23 Austria
-0.183 -0.447 -0.12 Belgium
-0.118 -0.372 -0.26 Brazil
-0.073 Bulgaria
-0.234 -0.427 Canada
-0.118 Chile
-0.08 Chinese Taipei -0.475 -0.180
-0.129 Colombia
-0.123 Croatia
-0.221 -0.446 -0.24 Czech Republic
-0.19 -0.296 -0.17 Denmark
-0.182 Estonia

-0.254 -0.301 -0.14 Finland
-0.226 -0.383 France
-0.301 -0.713 -0.3 Germany
-0.148 -0.174 Greece
-0.209 -0.200 Hong Kong -0.441 -0.549
-0.209 -0.323 -0.05 Hungary
-0.173 -0.209 -0.18 Iceland
-0.195 -0.235 Indonesia
-0.191 -0.103 -0.24 Ireland
Iran -0.175 -0.362
-0.222 Israel
-0.212 -0.409 -0.36 Italy -0.482 -0.907
-0.097 -0.307 Japan -0.247 -0.482
-0.105 Jordan
0.05 -0.014 -0.02 Korea
Kuwait -0.089 -0.342
-0.187 Kyrgyzstan
-0.118 -0.221 -0.06 Latvia

-0.554 -0.2 Liechtenstein
-0.135 Lithuania
-0.076 -0.428 -0.17 Luxembourg
-0.16 -0.33 Macao-China
-0.061 -0.357 -0.08 Mexico
-0.136 Montenegro
-0.287 -0.696 -0.26 Netherlands
-0.235 -0.314 -0.26 New Zealand
-0.198 -0.168 -0.18 Norway -0.134 -0.527
-0.126 -0.279 Poland
-0.274 -0.205 -0.18 Portugal
-0.269 Qatar
-0.087 Romania
-0.222 -0.187 -0.21 Russian
-0.141 -0.181 Serbia
Singapore -0.211 -0.585
-0.189 -0.411 Slovak Republic
-0.188 Slovenia
-0.08 -0.244 Spain

-0.177 -0.202 -0.33 Sweden
-0.198 -0.446 -0.17 Switzerland
-0.176 -0.194 Thailand
-0.117 -0.161 Tunisia -0.117 -0.314
-0.109 -0.252 Turkey
-0.225 -0.344 -0.23 United
Kingdom
England -0.294 -0.359
Scotland -0.418 -0.282
-0.352 -0.23 -0.26 United States -0.352 -0.502
-0.158 -0.24 Uruguay
-0.177-0.303 -0.197 Cohort Mean -0.292 -0.463 -0.377
57 41 25 N of Countries 12 12
-0.223 Grand Mean -0.377
Note. Results for PISA 2006 are taken from Nagengast & Marsh (2012); results for PISA 2003
are taken from Seaton, Marsh, and Craven (2009); results for PISA 2000 are taken from Marsh
and Hau (2003); results the two TIMSS age cohorts are from the present investigation. BFLPE =
big-fish-little-pond effect, the effect of school-average (PISA) or class-average achievement on
academic self-concept.

Appendix F
Mplus Syntax for Model
TITLE: Model ML3 (see Table S3) Invariance over country & cohort; decomposition of effects;
USEVARIABLES ARE
MSCp1 MSCn2 MSCn3 MSCp4 MAch group MACHB;
WEIGHT IS HOUWGT;
! HOUWGT is the weighting variable in the TIMSS database; incorporates six components;
! three have to do with sampling of the school, class and student, and adjustment factors
! associated with non-participation at the level of the school, class and student.
cluster is TIDCLASX7 TIDSCHX7;
! cluster by classroom and school;
grouping is group
(101=grpA 201=grpB 501=grpE 601=grpF 701=grpG 801=grpH 901=grpI
1001=grpJ 1201=grpL 1301=grpM 1401=grpN 1501=grpO 1601=grpP 102=grpxA
202=grpxB 502=grpxE 602=grpxF 702=grpxG 802=grpxH 902=grpxI
1002=grpxJ 1202=grpxL 1302=grpxM 1402=grpxN 1502=grpxO 1602=grpxP);
! Define the 26 multiple groups in terms of 13 countries x 2 age cohorts;

Define:
group = IDCNTRX3*100 + cohort;
MACHB = CLUSTER_MEAN (MAch); ! Define group to be a unique combination of country (country ID code multiplied by 1000) and age !cohort (1 or 2); Define MACHB to be the class-average of individual math achievement
!The define function is executed before the group labeling function previously described.
ANALYSIS:
ESTIMATOR = MLR;
PROCESSORS = 4;
TYPE = COMPLEX TWOLEVEL;
H1ITERATIONS = 20000;ITERATIONS = 6000;
! Two-level analysis uses MLR estimator and complex design;
MODEL:
%within%
MSCW by [email protected] MSCn2 MSCn3 MSCp4 (1-4);
MAchP1W by [email protected]; MACH@0;
mscW on MAchP1W;
!CUs for negatively worded items
MSCn2 with MSCn3;
%between%
MSCB by [email protected] MSCn2 MSCn3 MSCp4 (1-4);
MAchP1B by [email protected]; MAChb@0;

mscB on MAchP1B;!
!fixed factor loading of first indicator of each factor to provide common metric standardization;
!The syntax ‘(1-4)’ following the factor loadings for both within and between models constrains
!the 4 factor loadings to be invariant over level;
MODEL grpA:
%WITHIN%
mscW on MAchP1W (b1A1);
MachP1W(b1A4);
[mach];
MSCW by [email protected] MSCn2 MSCn3 MSCp4 (z1-z4);
%between%
[mscp1-MSCp4]; [MSCB-MAchP1B@0]; [MACHB];
MSCB by [email protected] MSCn2 MSCn3 MSCp4 (z1-z4);
mscb on MachP1b (b2A1);
MachP1b(b2A4);
!Model definition is for grpA (the first of the 26 (13 country x 2 cohort) groups
!values in parentheses define constraints on parameters z1-z4 are the four factor loadings
!that define the four factor loadings for the latent math self-concept factor.
! Because the z1-z4 are used for all 26 groups, the factor loadings are invariant over
! 13 countries x 2 age cohorts; These can be altered to constrain factor loadings for
!countries, cohorts or to have no invariance constraints;

! The expression ‘mscW on MAchP1W (b1A1);’ defines the regression of effect of L1-Achievement
! on L1 self-concept and gives this value a lablel (b1A1) that is unique for each group;
! The expression ‘mscb on MachP1b (b2A1);’ defines the regression of effect of L2-Achievement
! on L2 self-concept and gives this value a lablel (b2A1) that is unique for each group;
MODEL grpB:
%WITHIN%
mscW on MAchP1W (b1B1);
MachP1W(b1B4);
[mach];
MSCW by [email protected] MSCn2 MSCn3 MSCp4 (z1-z4); !(B1-B4);
%between%
[mscp1-MSCp4]; [MSCB-MAchP1B@0]; [MACHB];
MSCB by [email protected] MSCn2 MSCn3 MSCp4 (z1-z4);
mscb on MachP1b (b2b1);
MachP1b(b2B4);
<<< Model specifications are shown for the first two and last of the 26 groups; All other groups are defined in a similar manner>>
MODEL grpXO:
%WITHIN%
mscW on MAchP1W (b1XO1);
MachP1W(b1XO4);
[mach];

MSCW by [email protected] MSCn2 MSCn3 MSCp4 (z1-z4); !(XO1-XO4);
%between%
[mscp1-MSCp4]; [MSCB-MAchP1B@0]; [MACHB];
MSCB by [email protected] MSCn2 MSCn3 MSCp4 (z1-z4);
mscb on MachP1b (b2XO1);
MachP1b(b2XO4);
MODEL grpXP:
%WITHIN%
mscW on MAchP1W (b1XP1);
MachP1W(b1XP4);
[mach];
MSCW by [email protected] MSCn2 MSCn3 MSCp4 (z1-z4); !(XP1-XP4);
%between%
[mscp1-MSCp4]; [MSCB-MAchP1B@0]; [MACHB];
MSCB by [email protected] MSCn2 MSCn3 MSCp4 (z1-z4);
mscb on MachP1b (b2XP1);
MachP1b(b2XP4);
model constraint:
!Model constraints are used to define new parameters based on those estimated in the model
!that can then be used to make more specific comparisons
! new(b1g01);b1g01 = b2A1 *2 * (.124**.5)/(.523**.5);

! new(b1g02);b1g02 = b2B1 *2 * (.124**.5)/(.523**.5); !……………………………… ! new(b2g01);b2g01 = b2XA1 *2 * (.233**.5)/(.523**.5); ! new(b2g02);b2g02 = b2XB1 *2 * (.233**.5)/(.523**.5);
! B_G_ -0.373 0.012 -32.381 0.000 0.000 ! Stand in relation to ach for each cohort(L2) and SC across cohort (L1+L2)
new(b1g01);b1g01 = b2A1 *2 * (.124 )**.5 /((.523**.5));
new(b1g02);b1g02 = b2B1 *2 * (.124 )**.5 /((.523**.5));
new(b1g03);b1g03 = b2E1 *2 * (.124 )**.5 /((.523**.5));
new(b1g04);b1g04 = b2F1 *2 * (.124 )**.5 /((.523**.5));
new(b1g05);b1g05 = b2G1 *2 * (.124 )**.5 /((.523**.5));
new(b1g06);b1g06 = b2H1 *2 * (.124 )**.5 /((.523**.5));
new(b1g07);b1g07 = b2I1 *2 * (.124 )**.5 /((.523**.5));
new(b1g08);b1g08 = b2J1 *2 * (.124 )**.5 /((.523**.5));
new(b1g09);b1g09 = b2L1 *2 * (.124 )**.5 /((.523**.5));
new(b1g10);b1g10 = b2M1 *2 * (.124 )**.5 /((.523**.5));
new(b1g11);b1g11 = b2N1 *2 * (.124 )**.5 /((.523**.5));
new(b1g12);b1g12 = b2O1 *2 * (.124 )**.5 /((.523**.5));
new(b1g13);b1g13 = b2P1 *2 * (.233 )**.5 /((.523**.5));
new(b2g01);b2g01 = b2XA1*2 * (.233 )**.5 /((.523**.5));
new(b2g02);b2g02 = b2XB1*2 * (.233 )**.5 /((.523**.5));
new(b2g03);b2g03 = b2XE1*2 * (.233 )**.5 /((.523**.5));
new(b2g04);b2g04 = b2XF1*2 * (.233 )**.5 /((.523**.5));
new(b2g05);b2g05 = b2XG1*2 * (.233 )**.5 /((.523**.5));

new(b2g06);b2g06 = b2XH1*2 * (.233 )**.5 /((.523**.5));
new(b2g07);b2g07 = b2XI1*2 * (.233 )**.5 /((.523**.5));
new(b2g08);b2g08 = b2XJ1*2 * (.233 )**.5 /((.523**.5));
new(b2g09);b2g09 = b2XL1*2 * (.233 )**.5 /((.523**.5));
new(b2g10);b2g10 = b2XM1*2 * (.233 )**.5 /((.523**.5));
new(b2g11);b2g11 = b2XN1*2 * (.233 )**.5 /((.523**.5));
new(b2g12);b2g12 = b2XO1*2 * (.233 )**.5 /((.523**.5));
new(b2g13);b2g13 = b2XP1*2 * (.233 )**.5 /((.523**.5));
!26 new variables—one for each group are defined and each is set equal the effect of
!L2 Achievement on math self-concept (e.g., b2A1 was the label for this value in first group;
!The .523 the average within-group variance of the latent self-concept factor (the sum of
!variances at L1 and L2 as there was latent aggregation; The values .124 and .233 are the average !within-group variance of the L2 achievement (as this was a manifest variable defined by manifest
!aggregation; !In a separate analysis the 26 new variables were defined as the effects L1
!Achievement on ! L2 math self-concept.
new(b_g01-b_g13);
b_g01=(b1g01+b2g01)/2;
b_g02=(b1g02+b2g02)/2;
b_g03=(b1g03+b2g03)/2;
b_g04=(b1g04+b2g04)/2;
b_g05=(b1g05+b2g05)/2;
b_g06=(b1g06+b2g06)/2;

b_g07=(b1g07+b2g07)/2;
b_g08=(b1g08+b2g08)/2;
b_g09=(b1g09+b2g09)/2;
b_g10=(b1g10+b2g10)/2;
b_g11=(b1g11+b2g11)/2;
b_g12=(b1g12+b2g12)/2;
b_g13=(b1g13+b2g13)/2;
! create 13 new variables that are the average of the 2 age cohorts for each of 13 countries;
new(b1g_ b2g_);
b1g_=(b1g01+b1g02+b1g03+b1g04+b1g05+b1g06+b1g07+
b1g08+b1g09+b1g10+b1g11+b1g12+b1g13)/13;
b2g_=(b2g01+b2g02+b2g03+b2g04+b2g05+b2g06+b2g07+
b2g08+b2g09+b2g10+b2g11+b2g12+b2g13)/13;
! create 2 age-cohort means (averaged across 13 countries within each age cohort);
new(b_g_); b_g_=(b1g_+b2g_)/2;
!create 1 grand mean;
new(ss1 ss2 ss3);
!create 3 new variables to represent sums of squared deviations; These sums of squared deviations are ANOVA-like decompositions in which the sums of squared deviations between individual parameter estimates and corresponding means are computed. In this example the decomposition is based on the average of the ESs for the BFLPE for each of the 26 (13 countries x 2 age cohorts). However, simple variations of this syntax were used to decompose variance associated with each of the parameter estimates

ss1=13*((b1g_-b_g_)**2+(b2g_-b_g_)**2);
!compute sums of squared deviations for Main effect of differences across 2 age cohorts;
!Create sums of squares groups;
ss2=2*((b_g01-b_g_)**2+(b_g02-b_g_)**2+(b_g03-b_g_)**2+(b_g04-b_g_)**2+
(b_g05-b_g_)**2+(b_g06-b_g_)**2+(b_g07-b_g_)**2+(b_g08-b_g_)**2+(b_g09-b_g_)**2+
(b_g10-b_g_)**2+(b_g11-b_g_)**2+(b_g12-b_g_)**2+ (b_g13-b_g_)**2);
!compute sums of squared deviations for Main effect of differences across 13 countries;
ss3=
(b1g01+b_g_-b1g_-b_g01)**2+
(b1g02+b_g_-b1g_-b_g02)**2+
(b1g03+b_g_-b1g_-b_g03)**2+
(b1g04+b_g_-b1g_-b_g04)**2+
(b1g05+b_g_-b1g_-b_g05)**2+
(b1g06+b_g_-b1g_-b_g06)**2+
(b1g07+b_g_-b1g_-b_g07)**2+
(b1g08+b_g_-b1g_-b_g08)**2+
(b1g09+b_g_-b1g_-b_g09)**2+
(b1g10+b_g_-b1g_-b_g10)**2+
(b1g11+b_g_-b1g_-b_g11)**2+
(b1g12+b_g_-b1g_-b_g12)**2+
(b1g13+b_g_-b1g_-b_g13)**2+
(b2g01+b_g_-b2g_-b_g01)**2+
(b2g02+b_g_-b2g_-b_g02)**2+
(b2g03+b_g_-b2g_-b_g03)**2+
(b2g04+b_g_-b2g_-b_g04)**2+
(b2g05+b_g_-b2g_-b_g05)**2+
(b2g06+b_g_-b2g_-b_g06)**2+
(b2g07+b_g_-b2g_-b_g07)**2+
(b2g08+b_g_-b2g_-b_g08)**2+
(b2g09+b_g_-b2g_-b_g09)**2+
(b2g10+b_g_-b2g_-b_g10)**2+
(b2g11+b_g_-b2g_-b_g11)**2+
(b2g12+b_g_-b2g_-b_g12)**2+
(b2g13+b_g_-b2g_-b_g13)**2;
!compute sums of squared deviations for Age-cohort by country interaction;
new(west1);west1= (b1g01+b1g05+b1g08+b1g11+b1g12+b1g13)/6;
new(east1);east1= (b1g02+b1g03+b1g06+b1g09)/4;
new(MEI1);MEI1= (b1g04+b1g07+b1g10)/3;
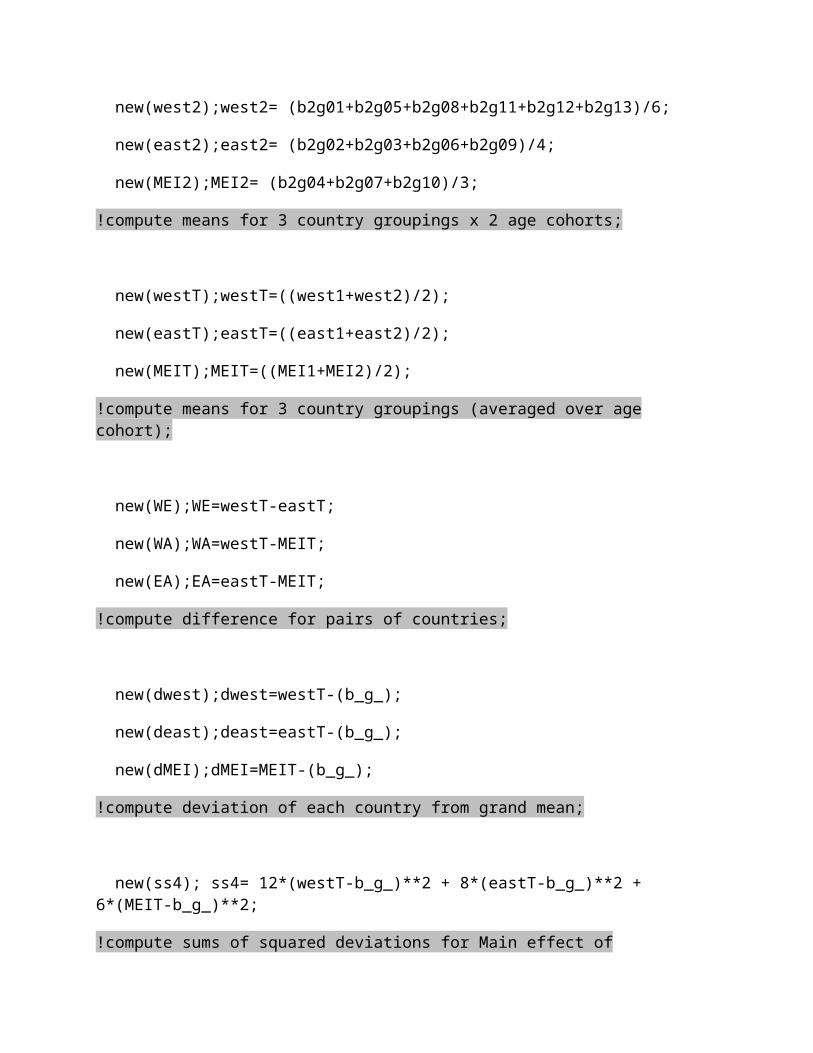
new(west2);west2= (b2g01+b2g05+b2g08+b2g11+b2g12+b2g13)/6;
new(east2);east2= (b2g02+b2g03+b2g06+b2g09)/4;
new(MEI2);MEI2= (b2g04+b2g07+b2g10)/3;
!compute means for 3 country groupings x 2 age cohorts;
new(westT);westT=((west1+west2)/2);

new(eastT);eastT=((east1+east2)/2);
new(MEIT);MEIT=((MEI1+MEI2)/2);
!compute means for 3 country groupings (averaged over age cohort);
new(WE);WE=westT-eastT;
new(WA);WA=westT-MEIT;
new(EA);EA=eastT-MEIT;
!compute difference for pairs of countries;
new(dwest);dwest=westT-(b_g_);
new(deast);deast=eastT-(b_g_);
new(dMEI);dMEI=MEIT-(b_g_);
!compute deviation of each country from grand mean;
new(ss4); ss4= 12*(westT-b_g_)**2 + 8*(eastT-b_g_)**2 + 6*(MEIT-b_g_)**2;
!compute sums of squared deviations for Main effect of differences across 3 country groupings;
new(ss5); ss5 =
(west1+b_g_-b1g_-westT)**2+
(east1+b_g_-b1g_-eastT)**2+
(MEI1+b_g_-b1g_-MEIT)**2+
(west2+b_g_-b2g_-westT)**2+
(east2+b_g_-b2g_-eastT)**2+
(MEI2+b_g_-b2g_-MEIT)**2;

!compute sums of squared deviations for Age-cohort by 3-country grouping interaction;
OUTPUT: TECH1 TECH4 STDYX sampstat;

References
Abu-Hilal, M. M. (2001). Correlates of achievement in the United Arab Emirates: A
sociocultural study. In D. M. McInerney & S. Van Etten (Eds.), Research on sociocultural
influences on motivation and learning (Vol. 1, pp. 205–230). Greenwich, CT: Information Age.
Abu-Hilal, M. M., & Aal-Hussain, A. A. (1997). Dimensionality and hierarchy of the SDQ in a
non-Western milieu: A test of self-concept invariance across gender. Journal of Cross-Cultural
Psychology, 28, 535–553. doi:10.1177/0022022197285002
Abu-Hilal, M. M., & Bahri, T. M. (2000). Self-concept: The generalizability of research on the
SDQ, Marsh/Shavelson model and I/E reference model to United Arab Emirates students. Social
Behavior and Personality, 28, 309–322. doi:10.2224/sbp.2000.28.4.309
Alicke, M. D., Zell, E., & Bloom, D. L. (2010). Mere categorization and the frog-pond effect.
Psychological Science, 21, 174–177. doi:10.1177/0956797609357718
Alwin, D. F., & Otto, L. B. (1977). High school context effects on aspirations. Sociology of
Education, 50, 259–273. doi:10.2307/2112499
American Institutes for Research. (2005). Reassessing U.S. international mathematics
performance: New findings from the 2003 TIMSS and PISA. Washington, DC: Author. Retrieved
from http://www.air.org/files/TIMSS_PISA_math_study1.pdf
Bandura, A. (2006). Toward a psychology of human agency. Perspectives on Psychological
Science, 1, 164–180. doi:10.1111/j.1745-6916.2006.00011.x
Bates, E. (1990). Language about me and you: Pronominal reference and the emerging concept
of self. In D. Cicchetti & M. Beeghly (Eds.), The self in transition: Infancy to childhood (pp.
165–182). Chicago, IL: University of Chicago Press.
Beauducel, A., & Herzberg, P. Y. (2006). On the performance of maximum likelihood versus
means and variance adjusted weighted least squares estimation in CFA. Structural Equation
Modeling, 13, 186–203. doi:10.1207/s15328007sem1302_2

Bornholt, L. J. (1997). Aspects of self knowledge about activities with young children. Every Child, 3,
15–18.
Bouffard, T., Markovits, H., Vezeau, C., Boisvert, M., & Dumas, C. (1998). The relation between
accuracy of self-perception and cognitive development. British Journal of Educational Psychology, 68,
321–330. doi:10.1111/j.2044-8279.1998.tb01294.x
Bruner, J. (1996). A narrative model of self construction. Psyke & Logos, 17, 154–170.
Chapman, J. W., & Tunmer, W. E. (1995). Development of children’s reading self-concepts: An
examination of emerging subcomponents and their relation with reading achievement. Journal of
Educational Psychology, 87, 154–167. doi:10.1037/0022-0663.87.1.154
Chen, F. F. (2007). Sensitivity of goodness of fit indexes to lack of measurement invariance.
Structural Equation Modeling, 14, 464–504. doi:10.1080/10705510701301834
Cheung, G. W., & Rensvold, R. B. (2002). Evaluating goodness-of-fit indexes for testing
measurement invariance. Structural Equation Modeling, 9, 233–255.
doi:10.1207/S15328007SEM0902_5
Cohen, J. (1988). Statistical power analysis for the behavioral sciences (2nd ed.). Hillsdale, NJ:
Erlbaum.
Damon, W., & Hart, D. (1988). Self-understanding in childhood and adolescence. New York,
NY: Cambridge University Press.
Davis, J. (1966). The campus as a frog pond: An application of the theory of relative deprivation
to career decisions of college men. American Journal of Sociology, 72, 17–31.
doi:10.1086/224257
Davis-Kean, P. E., & Sandler, H. M. (2001). A meta-analysis of measures of self-esteem for
young children: A framework for future measures. Child Development, 72, 887–906.
doi:10.1111/1467-8624.00322

Diener, E. (2000). Subjective well-being: The science of happiness and a proposal for a national
index. American Psychologist, 55, 34–43. doi:10.1037/0003-066X.55.1.34
Diener, E., & Fujita, F. (1997). Social comparison and subjective well-being. In B. P. Buunk &
F. X. Gibbons (Eds.), Health, coping, and well-being: Perspectives from social comparison
theory (pp. 329–358). Mahwah, NJ: Erlbaum.
DiStefano, C. (2002). The impact of categorization with confirmatory factor analysis. Structural
Equation Modeling, 9, 327–346. doi:10.1207/S15328007SEM0903_2
Dolan, C. V. (1994). Factor analysis of variables with 2, 3, 5 and 7 response categories: A
comparison of categorical variable estimators using simulated data. British Journal of
Mathematical and Statistical Psychology, 47, 309–326. doi:10.1111/j.2044-8317.1994.tb01039.x
Dweck, C. S. (1999). Self-theories: Their role in motivation, personality, and development.
Philadelphia, PA: Psychology Press.
Eccles, J. S. (with Adler, T. F., Futterman, R., Goff, S. B., Kaczala, C. M., Meece, J. L., &
Midgley, C.). (1983). Expectancies, values, and academic behaviors. In J. T. Spence (Ed.),
Achievement and achievement motivation: Psychological and sociological approaches (pp. 75–
146). San Francisco, CA: Freeman.
Eccles, J., Wigfield, A., Harold, R. D., & Blumenfeld, P. (1993). Age and gender differences in
children’s self- and task perceptions during elementary school. Child Development, 64, 830–847.
doi:10.2307/1131221
Eder, R. A., & Mangelsdorf, S. C. (1997). The emotional basis of early personality development:
Implications for the emergent self-concept. In R. Hogan, J. Johnson, & S. Briggs (Eds.),
Handbook of personality psychology (pp. 209–240). San Diego, CA: Academic Press.
doi:10.1016/B978-012134645-4/50010-X
Ertl, H. (2006). Educational standards and the changing discourse on education: The reception
and consequences of the PISA study in Germany. Oxford Review of Education, 32, 619–634.
doi:10.1080/03054980600976320

Fantuzzo, J. W., McDermott, P. A., Manz, P. H., Hampton, V. R., & Burdick, N. A. (1996). The
pictorial scale of perceived competence and social acceptance: Does it work with low-income
urban children? Child Development, 67, 1071–1084. doi:10.2307/1131880
Festinger, L. (1954). A theory of social comparison processes. Human Relations, 7, 117–140.
doi:10.1177/001872675400700202
Fischer, K. W. (1980). A theory of cognitive development: The control and construction of
hierarchies of skills. Psychological Review, 87, 477–531. doi:10.1037/0033-295X.87.6.477
Guay, F., Marsh, H. W., & Boivin, M. (2003). Academic self-concept and academic
achievement: Developmental perspectives on their causal ordering. Journal of Educational
Psychology, 95, 124–136. doi:10.1037/0022-0663.95.1.124
Harter, S. (1983). Developmental perspectives on the self-system. In P. H. Mussen (Ed.),
Handbook of child psychology (Vol. 4, 4th ed., pp. 275–385). New York, NY: Wiley.
Harter, S. (1998). The development of self-representations. In W. Damon (Ed.) & S. Eisenberg
(Vol. Ed.), Handbook of child psychology: Vol. 3. Social, emotional, and personality
development (5th ed., pp. 553–617). New York, NY: Wiley.
Harter, S. (1999). The construction of the self: A developmental perspective. New York, NY:
Guilford Press.
Harter, S. (2006). The self. In N. Eisenberg, W. Damon, & R. M. Lerner (Eds.), Handbook of
child psychology: Vol. 3. Social, emotional, and personality development (6th ed., pp. 505–570).
Hoboken, NJ: Wiley.
Harter, S. (2012). The construction of the self: Developmental and sociocultural foundations
(2nd ed.). New York, NY: Guilford Press.
Hattie, J. (1992). Self-concept. Hillsdale, NJ: Erlbaum.

Hattie, J., & Marsh, H. W. (1996). Future directions in self-concept research. In B. A. Bracken
(Ed.), Handbook of self-concept (pp. 421–462). New York, NY: Wiley.
Helson, H. (1964). Adaptation-level theory. New York, NY: Harper & Row.
Hopmann, S., Brinek, G., & Retzl, M. (Eds.). (2007). PISA According to PISA. Vienna, Austria:
Verlag.
Hu, L.-T., & Bentler, P. M. (1999). Cutoff criteria for fit indexes in covariance structure
analysis: Conventional criteria versus new alternatives. Structural Equation Modeling, 6, 1–55.
doi:10.1080/10705519909540118
Huguet, P., Dumas, F., Marsh, H. W., Régner, I., Wheeler, L., Suls, J., . . . Nezlek, J. (2009).
Clarifying the role of social comparison in the big-fish-little-pond effect (BFLPE): An
integrative study. Journal of Personality and Social Psychology, 97, 156–170,
doi:10.1037/a0015558
Hutchison, G., & Schagen, I. (2007). Comparisons between PISA and TIMSS—Are we the man
with two watches? In T. Loveless (Ed.), Lessons learned: What international assessments tell us
about math achievement (pp. 227–261). Washington, DC: Brookings Institution.
Hyman, H. (1942). The psychology of subjective status. Psychological Bulletin, 39, 473–474.
James, W. (1963). The principles of psychology. New York, NY: Holt, Rinehart & Winston.
(Original work published 1890)
Jerusalem, M. (1984). Reference group, learning environment and self-evaluations: A dynamic
multi-level analysis with latent variables. In R. Schwarzer (Ed.), Advances in psychology: Vol.
21. The self in anxiety, stress and depression (pp. 61–73). Amsterdam, the Netherlands: North-
Holland. doi:10.1016/S0166-4115(08)62115-9
Kagen, S. L., Moore, E., & Bredekamp, S. (Eds.). (1995). Reconsidering children’s early
development and learning: Toward common views and vocabulary (Report No. 95-03).
Washington, DC: National Education Goals Panel.

Lewis, M., & Brooks-Gunn, J. (1979). Social cognition and the acquisition of self. New York,
NY: Plenum Press. doi:10.1007/978-1-4684-3566-5
Liem, G. A. D., Marsh, H. W., Martin, A. J., McInerney, D. M., & Yeung, A. A. (2013). The
big-fish-little-pond effect and a national policy of within-school ability streaming: Alternative
frames of reference. American Educational Research Journal, 50, 326–370.
doi:10.3102/0002831212464511
Lüdtke, O., Marsh, H. W., Robitzsch, A., & Trautwein, U. (2011). A 2 2 taxonomy of
multilevel latent contextual models: Accuracy–bias trade-offs in full and partial error correction
models. Psychological Methods, 16, 444–467. doi:10.1037/a0024376
Lüdtke, O., Marsh, H. W., Robitzsch, A., Trautwein, U., Asparouhov, T., & Muthén, B. (2008).
The multilevel latent covariate model: A new, more reliable approach to group-level effects in
contextual studies. Psychological Methods, 13, 203–229. doi:10.1037/a0012869
Marsh, H. W. (1974). Judgmental anchoring: Stimulus and response variables (Unpublished
doctoral dissertation). University of California, Los Angeles.
Marsh, H. W. (1984). Self-concept: The application of a frame of reference model to explain
paradoxical results. Australian Journal of Education, 28, 165–181.
Marsh, H. W. (1987). The big-fish-little-pond effect on academic self-concept. Journal of
Educational Psychology, 79, 280–295. doi:10.1037/0022-0663.79.3.280
Marsh, H. W. (1989). Age and sex effects in multiple dimensions of self-concept:
Preadolescence to early adulthood. Journal of Educational Psychology, 81, 417–430.
doi:10.1037/0022-0663.81.3.417
Marsh, H. W. (1990). A multidimensional, hierarchical model of self-concept: Theoretical and
empirical justification. Educational Psychology Review, 2, 77–172. doi:10.1007/BF01322177

Marsh, H. W. (1991). Failure of high ability schools to deliver academic benefits commensurate
with their students’ ability levels. American Educational Research Journal, 28, 445–480.
doi:10.3102/00028312028002445
Marsh, H. W. (2007). Self-concept theory, measurement and research into practice: The role of
self-concept in educational psychology. Leicester, England: British Psychological Society.
Marsh, H. W., Abduljabbar, A. S., Abu-Hilal, M. M., Morin, A. J. S., Abdelfattah, F., Leung, K.
C., & Parker, P. (2013). Factorial, convergent, and discriminant validity of TIMSS math and
science motivation measures: A comparison of Arab and Anglo-Saxon countries. Journal of
Educational Psychology, 105, 108–128. doi:10.1037/a0029907
Marsh, H. W., Balla, J. R., & McDonald, R. P. (1988). Goodness-of-fit indices in confirmatory
factor analysis: The effect of sample size. Psychological Bulletin, 103, 391–410.
doi:10.1037/0033-2909.103.3.391
Marsh, H. W., Chessor, D., Craven, R. G., & Roche, L. (1995). The effects of gifted and talented
programs on academic self-concept: The big fish strikes again. American Educational Research
Journal, 32, 285–319. doi:10.3102/00028312032002285
Marsh, H. W., & Craven, R. (1997). Academic self-concept: Beyond the dustbowl. In G. Phye
(Ed.), Handbook of classroom assessment: Learning, achievement, and adjustment (pp. 131–
198). Orlando, FL: Academic Press.
Marsh, H. W., & Craven, R. G. (2006). Reciprocal effects of self-concept and performance from
a multidimensional perspective: Beyond seductive pleasure and unidimensional perspectives.
Perspectives on Psychological Science, 1, 133–163. doi:10.1111/j.1745-6916.2006.00010.x
Marsh, H. W., Craven, R. G., & Debus, R. (1998). Structure, stability, and development of young
children’s self-concepts: A multicohort–multioccasion study. Child Development, 69, 1030–
1053. doi:10.1111/j.1467-8624.1998.tb06159.x
Marsh, H. W., Debus, R., & Bornholt, L. (2005). Validating young children’s self-concept
responses: Methodological ways and means to understand their responses. In D. M. Teti (Ed.),

Handbook of research methods in developmental science (pp. 138–160). Oxford, England:
Blackwell. doi:10.1002/9780470756676.ch8
Marsh, H. W., Ellis, L., & Craven, R. G. (2002). How do preschool children feel about
themselves? Unraveling measurement and multidimensional self-concept structure.
Developmental Psychology, 38, 376–393. doi:10.1037/0012-1649.38.3.376
Marsh, H. W., & Hau, K.-T. (2003). Big-fish-little-pond effect on academic self-concept: A
crosscultural (26-country) test of the negative effects of academically selective schools.
American Psychologist, 58, 364–376. doi:10.1037/0003-066X.58.5.364
Marsh, H. W., & Hau, K.-T. (2004). Explaining paradoxical relations between academic self-
concepts and achievements: Cross-cultural generalizability of the internal–external frame of
reference predictions across 26 countries. Journal of Educational Psychology, 96, 56–67.
doi:10.1037/0022-0663.96.1.56
Marsh, H. W., Hau, K.-T., & Craven, R. G. (2004). The big-fish-little-pond effect stands up to
scrutiny. American Psychologist, 59, 269–271. doi:10.1037/0003-066X.59.4.269
Marsh, H. W., Hau, K.-T., & Grayson, D. (2005). Goodness of fit in structural equation models.
In A. Maydeu-Olivares & J. J. McArdle (Eds.), Contemporary psychometrics: A festschrift for
Roderick P. McDonald (pp. 276–340). Mahwah, NJ: Erlbaum.
Marsh, H. W., Hau, K.-T., & Wen, Z. (2004). In search of golden rules: Comment on hypothesis-
testing approaches to setting cutoff values for fit indexes and dangers in overgeneralizing Hu and
Bentler’s (1999). findings. Structural Equation Modeling, 11, 320–341.
doi:10.1207/s15328007sem1103_2
Marsh, H. W., Kong, C.-K., & Hau, K.-T. (2000). Longitudinal multilevel models of the big-
fish-little-pond effect on academic self-concept: Counterbalancing contrast and reflected-glory
effects in Hong Kong schools. Journal of Personality and Social Psychology, 78, 337–349.
doi:10.1037/0022-3514.78.2.337

Marsh, H. W., Lüdtke, O., Robitzsch, A., Trautwein, U., Asparouhov, T., Muthén, B., &
Nagengast, B. (2009). Doubly-latent models of school contextual effects: Integrating multilevel
and structural equation approaches to control measurement and sampling error. Multivariate
Behavioral Research, 44, 764–802. doi:10.1080/00273170903333665
Marsh, H. W., & O’Mara, A. (2010). Long-term total negative effects of school-average ability
on diverse educational outcomes: Direct and indirect effects of the big-fish-little-pond effect.
Zeitschrift für Pädagogische Psychologie, 24, 51–72. doi:10.1024/1010-0652.a000004
Marsh, H. W., & Parker, J. W. (1984). Determinants of student self-concept: Is it better to be a
relatively large fish in a small pond even if you don’t learn to swim as well? Journal of
Personality and Social Psychology, 47, 213–231. doi:10.1037/0022-3514.47.1.213
Marsh, H. W., Seaton, M., Trautwein, U., Lüdtke, O., Hau, K. T., O’Mara, A. J., & Craven, R.
G. (2008). The big-fish-little-pond-effect stands up to critical scrutiny: Implications for theory,
methodology, and future research. Educational Psychology Review, 20, 319–350.
doi:10.1007/s10648-008-9075-6
Marsh, H. W., Trautwein, U., Lüdtke, O., Baumert, J., & Köller, O. (2007). Big-fish-little-pond
effect: Persistent negative effects of selective high schools on self-concept after graduation.
American Educational Research Journal, 44, 631–669. doi:10.3102/0002831207306728
Marsh, H. W., & Yeung, A. S. (1997). Causal effects of academic self-concept on academic
achievement: Structural equation models of longitudinal data. Journal of Educational
Psychology, 89, 41–54. doi:10.1037/0022-0663.89.1.41
Marsh, H. W., & Yeung, A. S. (1999). The lability of psychological ratings: The chameleon
effect in global self-esteem. Personality and Social Psychology Bulletin, 25, 49–64.
doi:10.1177/0146167299025001005
Millsap, R. E. (2011). Statistical approaches to measurement invariance. New York, NY:
Routledge.
Möller, J., Streblow, L., & Pohlmann, B. (2009). Achievement and self-concept of students with
learning disabilities. Social Psychology of Education, 12, 113–122. doi:10.1007/s11218-008-
9065-z
Morse, S., & Gergen, K. J. (1970). Social comparison, self-consistency, and the concept of self.
Journal of Personality and Social Psychology, 16, 148–156. doi:10.1037/h0029862
Muthén, B. O., & Kaplan, D. (1985). A comparison of some methodologies for the factor
analysis of non-normal Likert variables. British Journal of Mathematical and Statistical
Psychology, 38, 171–189. doi:10.1111/j.2044-8317.1985.tb00832.x
Muthén, L. K., & Muthén, B. O. (2013). Mplus user’s guide. Los Angeles, CA: Muthén &
Muthén.
Nagengast, B., & Marsh, H. W. (2012). Big fish in little ponds aspire more: Mediation and cross-
cultural generalizability of school-average ability effects on self-concept and career aspirations
in science. Journal of Educational Psychology, 104, 1033–1053. doi:10.1037/a0027697
National Center for Education Statistics. (2008). Comparing NAEP, TIMSS, and PISA in
mathematics and science. Retrieved from
http://nces.ed.gov/timss/pdf/naep_timss_pisa_comp.pdf
Neidorf, T. S., Binkley, M., Gattis, K., & Nohara, D. (2006). Comparing mathematics content in
the National Assessment of Educational Progress (NAEP), Trends in International Mathematics
and Science Study (TIMSS), and Program for International Student Assessment (PISA) 2003
assessments: Technical report (NCES 2006-029). Washington, DC: U.S. Department of
Education, Institute of Education Sciences, National Center for Education Statistics.
Nicholls, J. G. (1979). Development of perceptions of own attainment and causal attributions of
success and failure in reading. Journal of Educational Psychology, 71, 94–99. doi:10.1037/0022-
0663.71.1.94
Olson, J. F., Martin, M. O., & Mullis, I. V. S. (Eds.). (2008). TIMSS 2007 Technical Report.
Chestnut Hill, MA: TIMSS & PIRLS International Study Center, Boston College.

Parducci, A. (1995). Happiness, pleasure, and judgment: The contextual theory and its
applications. Mahwah, NJ: Erlbaum.
Penn, C. S., Burnett, P. C., & Patton, W. (2001). The impact of attributional feedback on the self-
concept of children aged four to six years in preschool. Australian Journal of Guidance and
Counselling, 9, 21–34.
Rubin, D. B. (1987). Multiple imputation for nonresponse in surveys. New York, NY: Wiley.
doi:10.1002/9780470316696
Ruble, D. N., & Dweck, C. S. (1995). Self-conceptions, person conceptions, and their
development. In N. Eisenberg (Ed.), Review of personality and social psychology: Vol. 15.
Social development (pp. 109–139). Thousand Oaks, CA: Sage.
Russell, L., Bornholt, L., & Ouvrier, R. (2002). Brief cognitive screening and self concepts for
children with low intellectual functioning. British Journal of Clinical Psychology, 41, 93–104.
doi:10.1348/014466502163831
Schafer, J. L. (1997). Analysis of incomplete multivariate data. New York, NY: Chapman and
Hall/CRC. doi:10.1201/9781439821862
Seaton, M., & Marsh, H. W. (2013). Celebrating methodological-substantive synergy: Self-
concept theory and methodological innovation. In D. McInerney, H. W. Marsh, R. G. Craven, &
F. Guay (Eds.), International advances in self research: Vol. 4. Theory driving research: New
wave perspectives on self-processes and human development (pp. 161–181). Greenwich, CT:
Information Age Press.
Seaton, M., Marsh, H. W., & Craven, R. G. (2009). Earning its place as a pan-human theory:
Universality of the big-fish-little-pond effect across 41 culturally and economically diverse
countries. Journal of Educational Psychology, 101, 403–419. doi:10.1037/a0013838
Seaton, M., Marsh, H. W., & Craven, R. G. (2010). Big-fish-little-pond effect: Generalizability
and moderation—Two sides of the same coin. American Educational Research Journal, 47,
390–433. doi:10.3102/0002831209350493

Seaton, M., Marsh, H. W., Dumas, F., Huguet, P., Monteil, J.-M., Régner, I., . . . Wheeler, L.
(2008). In search of the big fish: Investigating the coexistence of the big-fish-little-pond effect
with the positive effects of upward comparisons. British Journal of Social Psychology, 47, 73–
103. doi:10.1348/014466607X202309
Segall, M. H., Lonner, W. J., & Berry, J. W. (1998). Cross-cultural psychology as a scholarly
discipline: On the flowering of culture in behavioural research. American Psychologist, 53,
1101–1110. doi:10.1037/0003-066X.53.10.1101
Seligman, M. E. P., & Csikszentmihalyi, M. (2000). Positive psychology: An introduction.
American Psychologist, 55, 5–14. doi:10.1037/0003-066X.55.1.5
Skaalvik, E. M., & Hagtvet, K. A. (1990). Academic achievement and self-concept: An analysis
of causal predominance in a developmental perspective. Journal of Personality and Social
Psychology, 58, 292–307. doi:10.1037/0022-3514.58.2.292
Stipek, D., & Mac Iver, D. (1989). Developmental change in children’s assessment of
intellectual competence. Child Development, 60, 521–538. doi:10.2307/1130719
Stouffer, S. A., Suchman, E. A., DeVinney, L. C., Star, S. A., & Williams, R. M. (1949). The
American soldier: Adjustments during army life (Vol. 1). Princeton, NJ: Princeton University
Press.
Tymms, P. (2001). A test of the big fish in a little pond hypothesis: An investigation into the
feelings of seven-year-old pupils in school. School Effectiveness and School Improvement, 12,
161–181. doi:10.1076/sesi.12.2.161.3452
Upshaw, H. S. (1969). The Personal Reference Scale: An approach to social judgment. In L.
Berkowitz (Ed.), Advances in experimental social psychology (Vol. 4, pp. 315–370). New York,
NY: Academic Press. doi:10.1016/S0065-2601(08)60081-7
Wedell, D. H., & Parducci, A. (2000). Social comparison: Lessons from basic research on
judgment. In J. Suls & L. Wheeler (Eds.), Handbook of social comparison: Theory and research

(pp. 223–252). Dordrecht, the Netherlands: Kluwer Academic. doi:10.1007/978-1-4615-4237-
7_12
Wigfield, A., & Eccles, J. S. (1992). The development of achievement task values: A theoretical
analysis. Developmental Review, 12, 265–310. doi:10.1016/0273-2297(92)90011-P
Wigfield, A., Eccles, J. S., Yoon, K. S., Harold, R. D., Arbreton, A. J. A., Freedman-Doan, C., &
Blumenfeld, P. C. (1997). Change in children’s competence beliefs and subjective task values
across the elementary school years: A 3-year study. Journal of Educational Psychology, 89, 451–
469. doi:10.1037/0022-0663.89.3.451
Wu, M. (2009). A comparison of PISA and TIMSS 2003 achievement results in mathematics.
Prospects, 39, 33–46. doi:10.1007/s11125-009-9109-y
Zell, E., & Alicke, M. D. (2009). Contextual neglect, self-evaluation, and the frog-pond effect.
Journal of Personality and Social Psychology, 97, 467–482. doi:10.1037/a0015453