Embed Size (px)
Citation preview
ELSEVIER Sensors and Actuators A 44 (1994) 219-229 A PHYSICAL
An automated SAW gas sensor testing system
M.S. Nieuwenhuizen, J.L.N. Harteveld Prim hiaurits Labomtmy TNO, PO Box 45, 2280 AA Rijswijk Netherlands
Received 26 April 1994; accepted 6 May 1994
Abstract
An automated, reliable and safe system for the unattended and safe testing of surface acoustic wave (SAW) gas sensors has been developed. The system includes the possibility of generating and/or diluting almost any gas or vapour and can easily be adapted for testing sensors or equipment other than SAW sensors. A large range of concentrations is achievable by the option of single-stage or two-stage dilution. The reliability of the gas-generation system is guaranteed by the continuous monitoring of the concentration and the relative humidity of the gas generated as well as the temperature of the measuring cell. Aspecific sampling effects on the sensor response are excluded by using the same conditions (temperature, humidity and flow rate) for the diluting and the reference gas flows. Examples are given of recent research on SAW gas sensors employing the system, i.e., the development of a silicon-based SAW sensor for NO1 and a SAW gas sensor for organophosphorus chemical warfare agents.
Kqvard~ Automated testing system; SAW gas sensors
1. Introduction
In chemical sensors, chemical signals are transduced into the appropriate electrical signals. Generally, se- lectivity is very important. Therefore often a so-called chemical interface is used, which interacts with the analyte as selectively as possible, thereby modulating the flow of physical or electrical signals in the sensor device.
Surface acoustic wave (SAW) devices are attractive for chemical sensor applications because of their small size, low cost, sensitivity and reliability [1,2]. SAW sensor technology as a whole has the potential to be applied on a surface rather than in a three-dimensional space. As a result, this technique is very compatible with planar silicon technology, thereby opening pos- sibilities for applying both the sensor and the electronics on a single silicon-based device: a so-called smart sensor chip.
At our IaboratoIy chemical interfaces for SAW gas sensors are being designed and synthesized or obtained commercially and subsequently applied to the SAW sensor surface in several ways and tested. When chemical
interfaces are to be selected and in a next stage com- pletely tested for sensitivity, selectivity, response time, reversibility, reproducibility, reliability, aging and shelf- life, an extensive testing programme has to be performed.
In a number of papers [3-U] we already reported on our SAW chemical sensor research, concentrating on the development of SAW gas sensors. In this paper we describe our SAW testing system, including an automated gas- or vapour-generation system (simply called the gas-generation system) and data-acquisition system.
In the literature [12-181 many papers deal with the generation of test atmospheres for testing all kinds of systems including chemical sensors. Especially Grate et al. [17] describe a testing system for SAW chemical sensors. Our approach is significantly different. In build- ing the system we particularly aimed at a highly efficient way of testing by utilizing the time outside working hours by unmanned operation, even when testing a sensor with highly toxic compounds. As in one of our research programmes we are developing a SAW gas sensor for chemical warfare agents to be used as a warning or monitoring device by military forces, special attention was paid to safety.
0924-4247/94/$07.00 Q 1994 Elsevier Science S.A. All rights reserved SSDI 0924-4247(94)00807-T
220 MS. Nieuumhuizen, J.L.N. Hamveld I Semors and Actuators A 44 (1994) 219-229
2. System description
2.1. General
To test many different chemical interfaces applied to SAW sensor devices, a variety of vapours and gases has to be generated in a large range of concentrations. Often the sensors must be characterized at different operating temperatures or relative humidities. A uni- versal gas-generation system was designed to dilute gases or to generate vapours from liquid compounds.
The efficiency of testing different parameters of sen- sors was improved by both controlling all functions of the gas-generation system and the sensor system as well as data acquisition of the sensor output and other relevant parameters by a computer.
These features make unattended operation possible by programming the testing parameters, such as the operating temperature of the sensor, the duration of the test, the analyte concentrations, the time of exposure of the sensor to the analyte and the relative humidity.
2.2. System design
The material from which the gas-generation system was built up was chosen to be a combination of glass and stainless steel. Glass is attractive because of its inertness, as some of the analytes are very corrosive compounds. Moreover the weak adsorption properties of glass, its transparency (some kinds of contamination of the system can easily be observed) and its relatively low cost are of interest. Stainless steel tubing was used in those parts of the system that had to resist increased pressure. Connections between glass and stainless steel were made by means of Teflon ferrules adapted to standard Swagelock fittings.
Mass-flow controllers (MFCs) were used for accurate measurement and control of gas flows. Independent of the supply pressure and the temperature, these in- struments pass through a fixed mass of gas adjustable by the electronic sentient of the controller. An MFC consists of a flow sensor and an integrated control valve. The flow sensor contains a capillary tube provided with two temperature sensors. The difference in tem- perature sensed by the two sensors depends on the heat-transfer properties of the gas flow. The heat trans- fer is determined by the mass of the gas flow and the specific heat and density of the gas. The difference between the output signal of the flow sensor and the set-point of the sentient signal is used to control the valve. The sentient signal is determined by a poten- tiometer on the MFC central control unit, incorporating a digital read-out module, or by a remote sentient from a computer. When using a gas with a specitic heat and/ or density different from that of air, the output reading must be corrected by the conversion factor stated by
the manufacturer. For proper operation the MFC re- quires a pressure difference of 0.2-0.5 bar between the supply- and back-pressure to force the gas into the capillary tube. The MFCs used in our laboratory are calibrated by a qualified institute every two years under standard conditions in air.
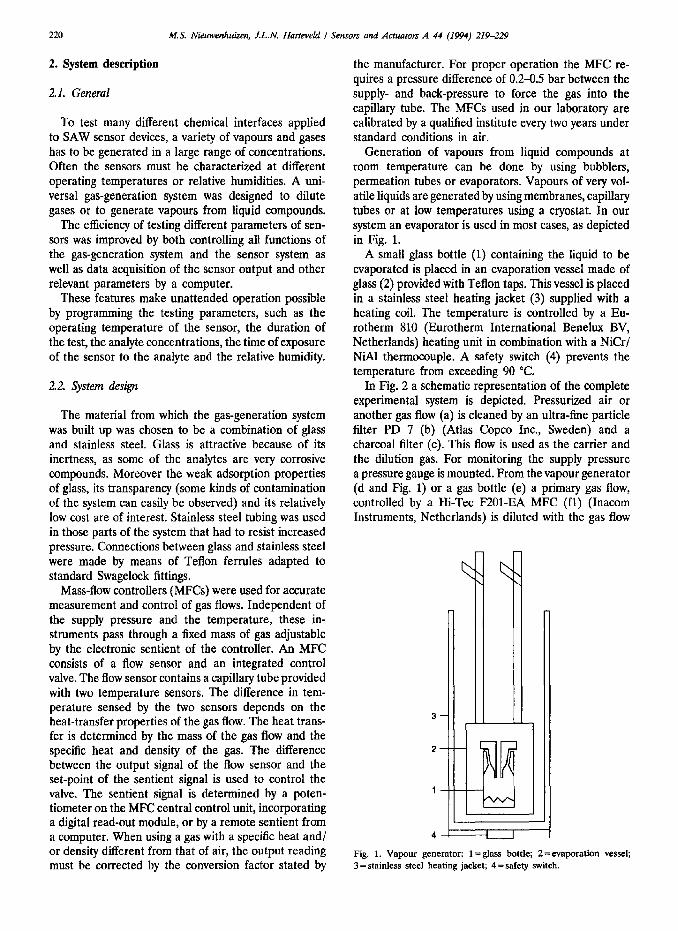
Generation of vapours from liquid compounds at room temperature can be done by using bubblers, permeation tubes or evaporators. Vapours of very vol- atile liquids are generated by using membranes, capillary tubes or at low temperatures using a cryostat. In our system an evaporator is used in most cases, as depicted in Fig. 1.
A small glass bottle (1) containing the liquid to be evaporated is placed in an evaporation vessel made of glass (2) provided with Teflon taps. This vessel is placed in a stainless steel heating jacket (3) supplied with a heating coil. The temperature is controlled by a Eu- rotherm 810 (Eurotherm International Benelux BV, Netherlands) heating unit in combination with a NiCr/ NiAl thermocouple. A safety switch (4) prevents the temperature from exceeding 90 “C.
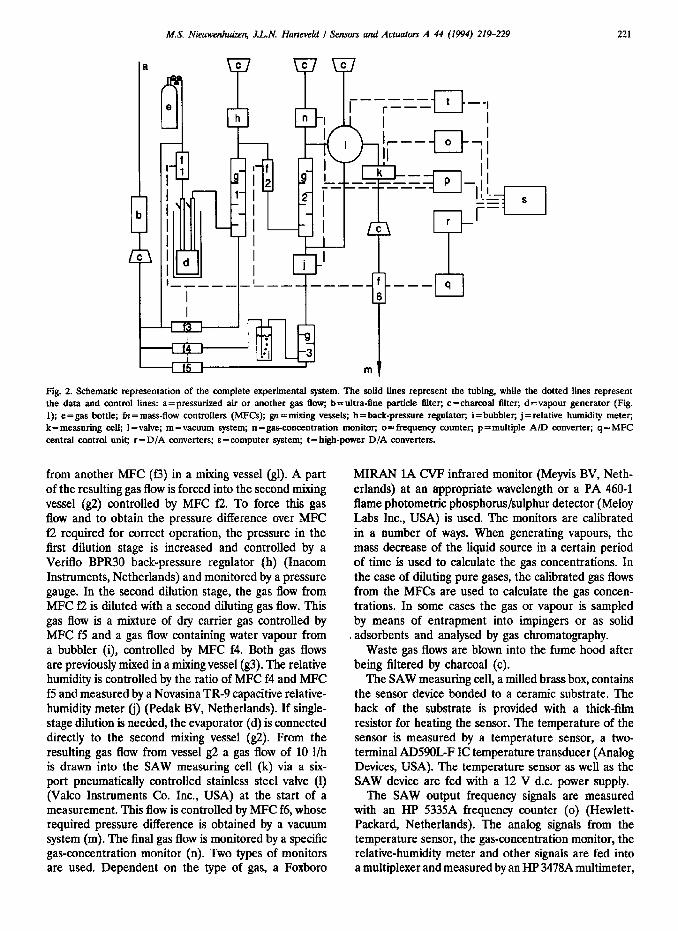
In Fig. 2 a schematic representation of the complete experimental system is depicted. Pressurized air or another gas flow (a) is cleaned by an ultra-tine particle filter PD 7 (b) (Atlas Copco Inc., Sweden) and a charcoal filter (c). This flow is used as the carrier and the dilution gas. For monitoring the supply pressure a pressure gauge is mounted. From the vapour generator (d and Fig. 1) or a gas bottle (e) a primary gas flow, controlled by a Hi-Tee F201-EA MFC (fl) (Inacom Instruments, Netherlands) is diluted with the gas flow
Fig. 1. Vapur generator: 1 =glass bottle; 2=evapration vessel; 3 = stainless steel heating jacket; 4 = safety switch.
M.S. Nieuwenhuiztx, J.L.N. Harteveki / Sensors and Actuators A 44 (1994) 219-229 221
Fig. 2. Schematic representation of the complete experimental system. The solid lines represent the tubing, while the dotted lines represent the data and control lines: a=pressurized air or another gas flow; b=ultra-fine particle titter; c=charcoal titter; d=vapour generator (Fig. 1); e=gas bottle; ti =mass-flow controllers (MFCs); gn=mixing vessels; h=back-pressure regulator; i=bubbler, j =relative humidity meter, k=measuring cell; I=vafve; m=vacuum system; n=gas-concentration monitor; o=frequency counter; p=multiple A/D converter; q=MFC central control unit; r=D/A converters; s=computer system; t= high-power D/A converters.
from another MFC (f3) in a mixing vessel (gl). A part of the resulting gas flow is forced into the second mixing vessel (g2) controlled by MFC f2. To force this gas flow and to obtain the pressure difference over MFC f2 required for correct operation, the pressure in the first dilution stage is increased and controlled by a Veriflo BPR30 back-pressure regulator (h) (Inacom Instruments, Netherlands) and monitored by a pressure gauge. In the second dilution stage, the gas flow from MFC f2 is diluted with a second diluting gas flow. This gas flow is a mixture of dry carrier gas controlled by MFC f5 and a gas flow containing water vapour from a bubbler (i), controlled by MFC f4. Both gas flows are previously mixed in a mixing vessel (g3). The relative humidity is controlled by the ratio of MFC f4 and MFC f5 and measured by a Novasina TR-9 capacitive relative- humidity meter (i) (Pedak BV, Netherlands). If single- stage dilution is needed, the evaporator (d) is connected directly to the second mixing vessel (g2). From the resulting gas flow from vessel g2 a gas flow of 10 l/h is drawn into the SAW measuring cell (k) via a six- port pneumatically controlled stainless steel valve (1) (Valco Instruments Co. Inc., USA) at the start of a measurement. This flow is controlled by MFC f6, whose required pressure difference is obtained by a vacuum system (m). The final gas flow is monitored by a specific gas-concentration monitor (n). Two types of monitors are used. Dependent on the type of gas, a Foxboro
MIRAN 1A CVF infrared monitor (Meyvis BV, Neth- erlands) at an appropriate wavelength or a PA 460-l flame photometric phosphorus/sulphur detector (Meloy Labs Inc., USA) is used. The monitors are calibrated in a number of ways. When generating vapours, the mass decrease of the liquid source in a certain period of time is used to calculate the gas concentrations. In the case of diluting pure gases, the calibrated gas flows from the MFCs are used to calculate the gas concen- trations. In some cases the gas or vapour is sampled by means of entrapment into impingers or as solid
. adsorbents and analysed by gas chromatography. Waste gas flows are blown into the fume hood after
being filtered by charcoal (c). The SAW measuring cell, a milled brass box, contains
the sensor device bonded to a ceramic substrate. The back of the substrate is provided with a thick-film resistor for heating the sensor. The temperature of the sensor is measured by a temperature sensor, a two- terminal AD59OGF IC temperature transducer (Analog Devices, USA). The temperature sensor as well as the SAW device are fed with a 12 V d.c. power supply.
The SAW output frequency signals are measured with an HP 5335A frequency counter (0) (Hewlett- Packard, Netherlands). The analog signals from the temperature sensor, the gas-concentration monitor, the relative-humidity meter and other signals are fed into a multiplexer and measured by an HP 3478A multimeter,
222 M.S. Nieuwenhuizen, J.L.N. Harteveld i Senmrs and Actuators A 44 (1994) 219-229
which serves as a multiple A/D converter (p). The MFCs are operated by the MFC central control unit (q). Remote setpoints for this control unit are generated by the HP 86 B central computer system (s) using D/ A converters (r). The computer system is equipped with an HP 9121 disc drive unit and an HP 7470A plotter. High-power D/A converters (t) are used as a programmable power supply for heating the sensor and switching the control valve to activate the pneumatically controlled valve (1).
The data-acquisition system collects the number of the measurement, the frequency signals of both delay lines of the SAW sensor, the dual delay-line signal being equal to the difference between both frequencies, the signal from the temperature sensor, the signal from the gas-concentration monitor and the point of time of the measurement. These signals are stored on floppy disc in blocks of 30 measurements, preventing loss of data by failures of the electricity or the computer system. Stored data can be retrieved for presentation on screen or plotter for further analysis.
2.3. Software
The software for performing the SAW sensor mea- surements and controlling the instrumentation and gas- generation system was developed by the use of the HP- BASIC language peculiar to HP 85/86 computers. Part of the software concerns the regulation of the generated gas concentrations. The calibration curves of the gas- concentration monitors are mathematically fitted into an equation and integrated into the software. The output signal from the gas-concentration monitor is converted to a concentration value using these calibration curves and is compared with the desired concentration. A proportional integral differential (PID) regulator cal- culates the new concentration output, using the following formula:
Here kl, k2 and k3 are constant factors, being 4, 0.2 and 0.01, respectively. C, = normalized new concentra- tion, C, = normalized present concentration, E, = (required concentration-present concentration) and E, =previous E,. For mathematical reasons the actual concentrations should be normalized to C, and C,, respectively, in order to obtain values around 100. This calculation is performed periodically (e.g., every 20 s), depending on the dead volume of the concentration monitor and the total flow rate through this monitor.
Upon this concentration output the setpoints of the MFCs are calculated based on a minimum stochastic error in the resulting concentration. In this way a feedback of the concentration signal is realized. Similar regulating systems are present for thermostatting the
sensor device in the range 30-150 “C and controlling the relative humidity in the range l&100%. In the case of temperature, C, and C, in the formula described above become output power P,, and PI, whereas E,, and E, deal with the difference between the required temperature and the present temperature.
2.4. Accuracy and precision of the gas-generation system
The accuracy and precision of the generated con- centrations are largely dependent on the type of gas or vapour used and on the settings of the MFCs. The best results are obtained using all MFCs at set-points as high as possible to reach the desired concentrations. The noise of the output signal of the gas-concentration monitor is a measure of the precision of the concen- tration. The accuracy of the concentration is determined by the calibration procedure.
2.5. Safety mea37.ues
As many of the compounds used are harmful to the environment and especially to human health, the com- plete gas-generation system is placed in a continuously ventilated fume hood. The ventilation system is provided with two safety features. First, a flow sensor verifies the operation of the ventilation system. Secondly, a gas-monitoring system is placed in the fume hood close to the gas-generation system. When ventilation stops or when the alarm level of the gas monitor is exceeded, an alarm system is activated, which in turn switches off the entire experimental system. By this action gas generation is stopped, so the exhaust of gas from the system is minimized.
3. Evaluation and performance of the gas-generation system
3.1. Concentration range
Because of the possibility of choosing one- or two- stage dilution, a large range of concentrations can be achieved. When diluting a pure gas the concentration range is 0.5-208 000 ppm, assuming 5% of the maximum capacity of an MFC to be the minimum sentient. Vapours can be generated at lower concentrations depending on the physical properties of the compound.
3.2. Concentration stability
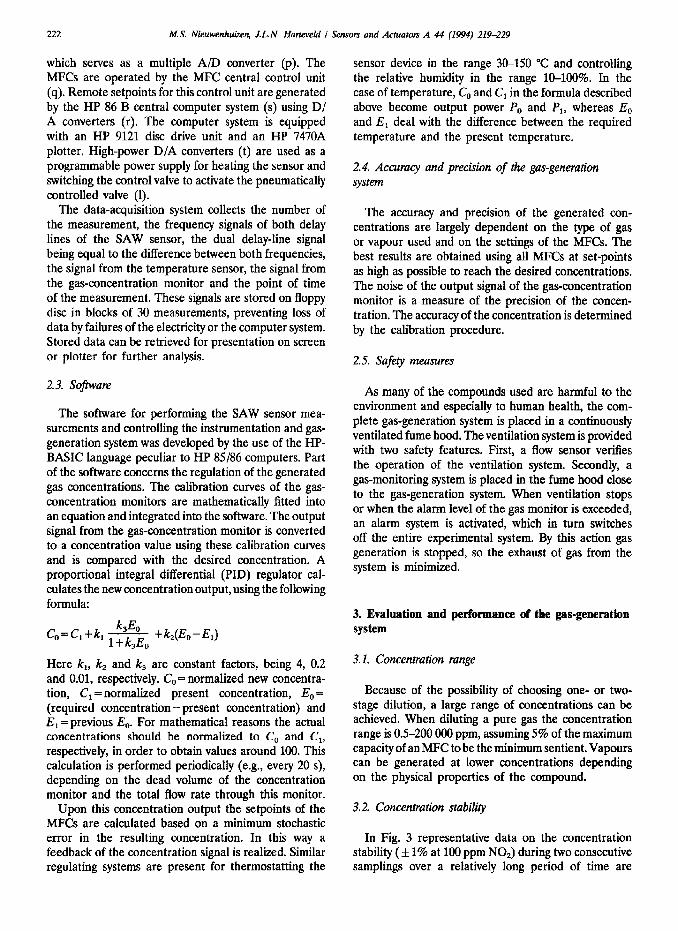
In Fig. 3 representative data on the concentration stability ( f 1% at 100 ppm NOJ during two consecutive samplings over a relatively long period of time are
MS. Niewmhuizm, J.L.N. Haneveld I Sen.wm and Actuators A 44 (1994) 219-229 223
105 -
P
8 Q
IOO-
95 -
I L I
0 120 240 SO
time (min)
Fig. 3. Representative data on the concentration stability of the vapour-generation system (at 100 ppm NO*) during two consecutive samplings.
c I I I I I 154
F 150
149.95
149.9
149.85
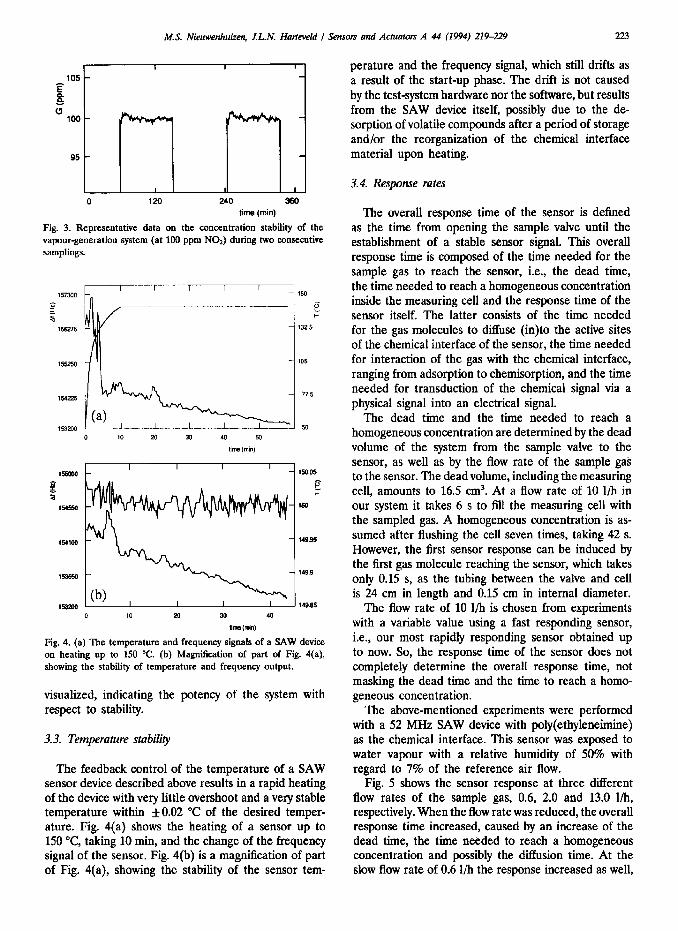
Fig. 4. (a) The temperature and frequency signals of a SAW device on heating up to 150 “C. (b) Magnification of part of Fig. 4(a), showing the stability of temperature and frequency output.
visualized, indicating the potency of the system with respect to stability.
3.3. Temperature stability
The feedback control of the temperature of a SAW sensor device described above results in a rapid heating of the device with very little overshoot and a very stable temperature within f0.02 “C of the desired temper- ature. Fig. 4(a) shows the heating of a sensor up to 150 “C, taking 10 min, and the change of the frequency signal of the sensor. Fig. 4(b) is a magnification of part of Fig. 4(a), showing the stability of the sensor tem-
perature and the frequency signal, which still drifts as a result of the start-up phase. The drift is not caused by the test-system hardware nor the software, but results from the SAW device itself, possibly due to the de- sorption of volatile compounds after a period of storage and/or the reorganization of the chemical interface material upon heating.
3.4. Response rates
The overall response time of the sensor is defined as the tune from opening the sample valve until the establishment of a stable sensor signal. This overall response time is composed of the time needed for the sample gas to reach the sensor, i.e., the dead time, the time needed to reach a homogeneous concentration inside the measuring cell and the response time of the sensor itself. The latter consists of the time needed for the gas molecules to diffuse (in)to the active sites of the chemical interface of the sensor, the time needed for interaction of the gas with the chemical interface, ranging from adsorption to chemisorption, and the time needed for transduction of the chemical signal via a physical signal into an electrical signal.
The dead time and the time needed to reach a homogeneous concentration are determined by the dead volume of the system from the sample valve to the sensor, as well as by the flow rate of the sample gas to the sensor. The dead volume, including the measuring cell, amounts to 16.5 cm3. At a flow rate of 10 l/h in our system it takes 6 s to fill the measuring cell with the sampled gas. A homogeneous concentration is as- sumed after flushing the cell seven times, taking 42 s. However, the first sensor response can be induced by the first gas molecule reaching the sensor, which takes only 0.15 s, as the tubing between the valve and cell is 24 cm in length and 0.15 cm in internal diameter.
The flow rate of 10 l/h is chosen from experiments with a variable value using a fast responding sensor, i.e., our most rapidly responding sensor obtained up to now. So, the response time of the sensor does not completely determine the overall response time, not masking the dead time and the time to reach a homo- geneous concentration.
The above-mentioned experiments were performed with a 52 MHz SAW device with poly(ethyleneimine) as the chemical interface. This sensor was exposed to water vapour with a relative humidity of 50% with regard to 7% of the reference air flow.
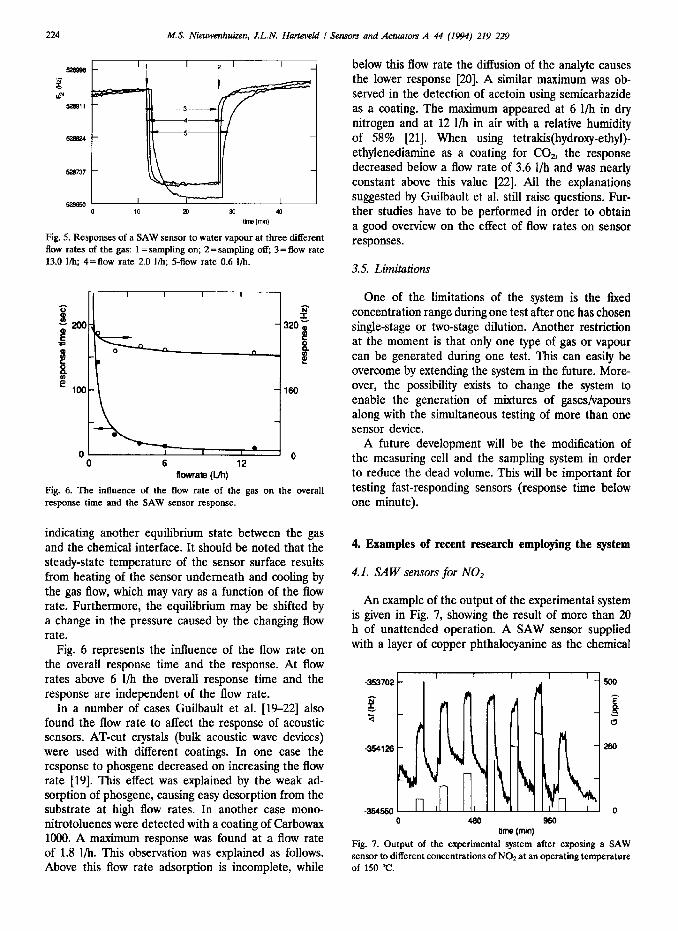
Fig. 5 shows the sensor response at three different flow rates of the sample gas, 0.6, 2.0 and 13.0 I/h, respectively. When the flow rate was reduced, the overall response time increased, caused by an increase of the dead time, the time needed to reach a homogeneous concentration and possibly the diffusion time. At the slow flow rate of 0.6 l/h the response increased as well,
224 M.S. Niewenhuizen, J.L.N. Hartweld I Stwsors and Actuators A 44 (1994) 219-229
Fig. 5. Responses of a SAW sensor to water vapour at three different flow rates of the gas: 1 = sampling on; 2 = sampling off; 3 = flow rate 13.0 I/b; 4=flow rate 2.0 I/h; S-flow rate 0.6 I/h.
6 12 ilowrate (vh)
A future development will be the modification of the measuring cell and the sampling system in order to reduce the dead volume. This will be important for
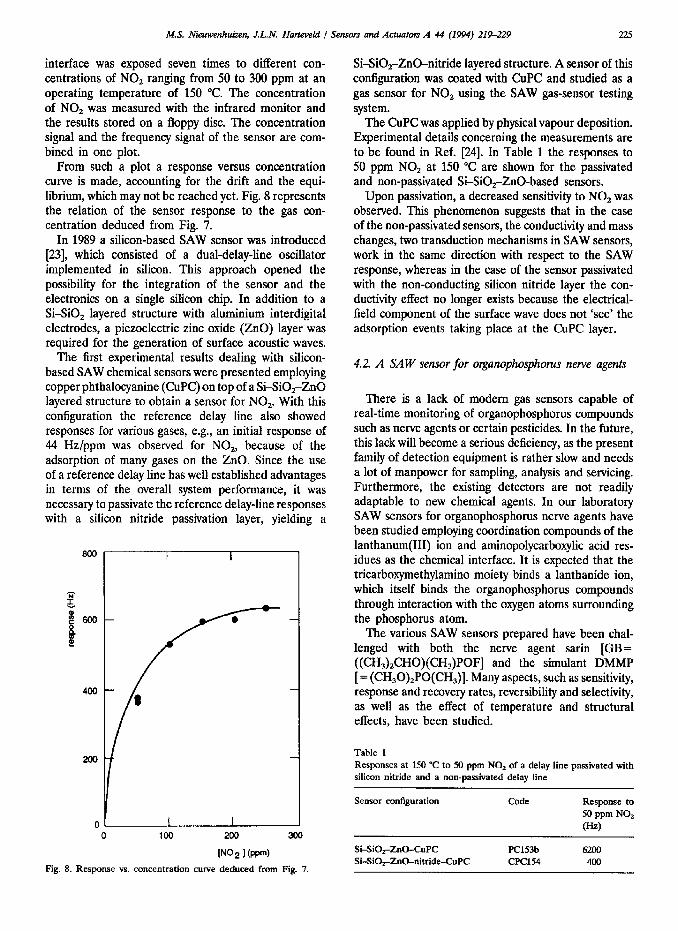
Fig. 6. The influence of the flow rate of the gas on the overall testing fast-responding sensors response time and the SAW sensor response. one minute).
indicating another equilibrium state between the gas and the chemical interface. It should be noted that the steady-state temperature of the sensor surface results from heating of the sensor underneath and cooling by the gas flow, which may vary as a function of the flow rate. Furthermore, the equilibrium may be shifted by a change in the pressure caused by the changing flow rate.
Fig. 6 represents the influence of the flow rate on the overall response time and the response. At flow rates above 6 l/h the overall response time and the response are independent of the flow rate.
In a number of cases Guilbault et al. [19-221 also found the flow rate to affect the response of acoustic sensors. AT-cut crystals (bulk acoustic wave devices) were used with different coatings. In one case the response to phosgene decreased on increasing the flow rate [19]. This effect was explained by the weak ad- sorption of phosgene, causing easy desorption from the substrate at high flow rates. In another case mono- nitrotoluenes were detected with a coating of Carbowax 1000. A maximum response was found at a flow rate of 1.8 l/h. This observation was explained as follows. Above this flow rate adsorption is incomplete, while
below this flow rate the diffusion of the analyte causes the lower response [20]. A similar maximum was ob- served in the detection of acetoin using semicarbazide as a coating. The maximum appeared at 6 l/h in dry nitrogen and at 12 I/h in air with a relative humidity of 58% [21]. When using tetrakis(hydroxy-ethyl)- ethylenediamine as a coating for CO*, the response decreased below a flow rate of 3.6 l/h and was nearly constant above this value [22]. All the explanations suggested by Guilbault et al. still raise questions. Fur- ther studies have to be performed in order to obtain a good overview on the effect of flow rates on sensor responses.
3.5. Limitations
One of the limitations of the system is the fixed concentration range during one test after one has chosen single-stage or two-stage dilution. Another restriction at the moment is that only one type of gas or vapour can be generated during one test. This can easily be overcome by extending the system in the future. More- over, the possibility exists to change the system to enable the generation of mixtures of gaseslvapours along with the simultaneous testing of more than one sensor device.
(response t!ime below
4. Examples of recent research employing the system
4.1. SAW sensors for NO,
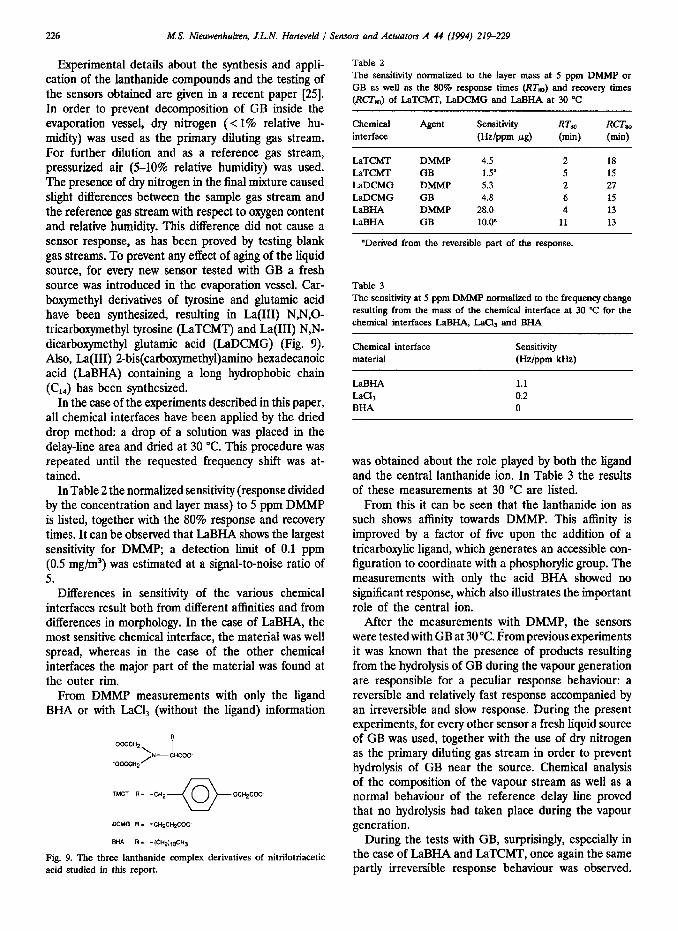
An example of the output of the experimental system is given in Fig. 7, showing the result of more than 20 h of unattended operation. A SAW sensor supplied with a layer of copper phthalocyanine as the chemical
0 460 WI
hme (min)
Fig. 7. Output of the experimental system after exposing a SAW sensor to different concentrations of NO2 at an operating temperature of 150 “C.
M.S. Nieuwenhuizen, J.L.N. HartmId / Sensors and Actuators A 44 (1994) 21%229 225
interface was exposed seven times to different con- centrations of NO, ranging from 50 to 300 ppm at an operating temperature of 150 “C. The concentration of NO* was measured with the infrared monitor and the results stored on a floppy disc. The concentration signal and the frequency signal of the sensor are com- bined in one plot.
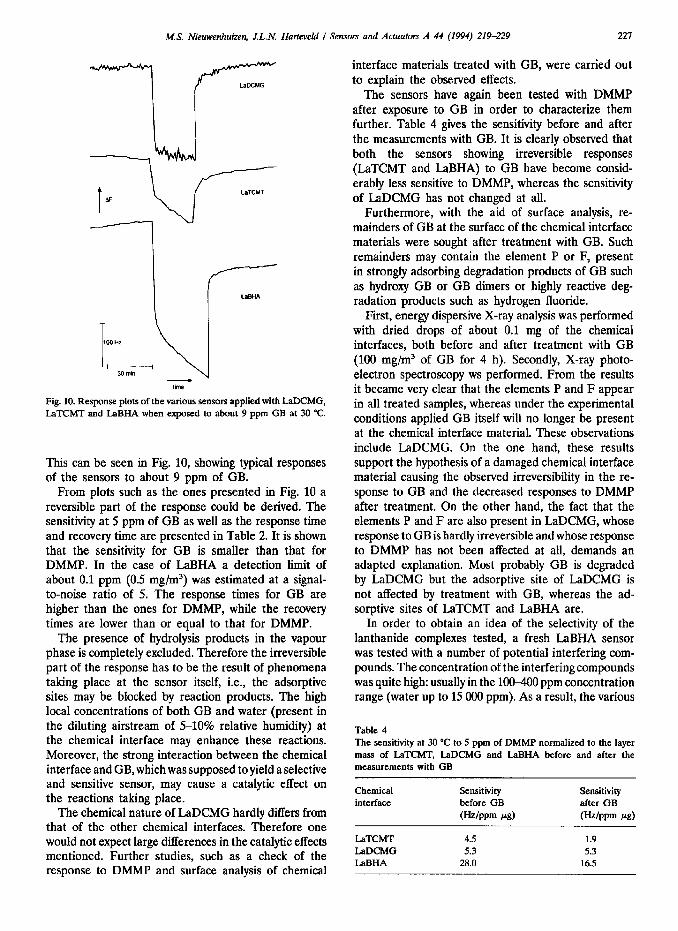
From such a plot a response versus concentration curve is made, accounting for the drift and the equi- librium, which may not be reached yet. Fig. 8 represents the relation of the sensor response to the gas con- centration deduced from Fig. 7.
In 1989 a silicon-based SAW sensor was introduced [23], which consisted of a dual-delay-line oscillator implemented in silicon. This approach opened the possibility for the integration of the sensor and the electronics on a single silicon chip. In addition to a Si-SiO, layered structure with aluminium interdigital electrodes, a piezoelectric zinc oxide (ZnO) layer was required for the generation of surface acoustic waves.
The first experimental results dealing with silicon- based SAW chemical sensors were presented employing copper phthalocyanine (CuPC) on top of a SiSiO,-ZnO layered structure to obtain a sensor for NO,. With this configuration the reference delay line also showed responses for various gases, e.g., an initial response of 44 Hz/ppm was observed for NO,, because of the adsorption of many gases on the ZnO. Since the use of a reference delay line has well established advantages in terms of the overall system performance, it was necessary to passivate the reference delay-line responses with a silicon nitride passivation layer, yielding a
800
2 8600 c
400
200
0
I I
I I 0 100 200 300
Wp 1 (ppm) Rg. 8. Response vs. concentration curve deduced from Fig. 7.
Si-SiO,-ZnO-nitride layered structure. A sensor of this configuration was coated with CuPC and studied as a gas sensor for NO, using the SAW gas-sensor testing system.
The CuPC was applied by physical vapour deposition. Experimental details concerning the measurements are to be found in Ref. [24]. In Table 1 the responses to 50 ppm NO, at 150 “C are shown for the passivated and non-passivated Si-SiO,-ZnO-based sensors.
Upon passivation, a decreased sensitivity to NOz was observed. This phenomenon suggests that in the case of the non-passivated sensors, the conductivity and mass changes, two transduction mechanisms in SAW sensors, work in the same direction with respect to the SAW response, whereas in the case of the sensor passivated with the non-conducting silicon nitride layer the con- ductivity effect no longer exists because the electrical- field component of the surface wave does not ‘see’ the adsorption events taking place at the CuPC layer.
4.2. A SAW sensor for organophosphorus nerve agents
There is a lack of modern gas sensors capable of real-time monitoring of organophosphorus compounds such as nerve agents or certain pesticides. In the future, this lack will become a serious deficiency, as the present family of detection equipment is rather slow and needs a lot of manpower for sampling, analysis and servicing. Furthermore, the existing detectors are not readily adaptable to new chemical agents. In our laboratory SAW sensors for organophosphorus nerve agents have been studied employing coordination compounds of the lanthanum(II1) ion and aminopolycarboxylic acid res- idues as the chemical interface. It is expected that the tricarboxymethylamino moiety binds a lanthanide ion, which itself binds the organophosphorus compounds through interaction with the oxygen atoms surrounding the phosphorus atom.
The various SAW sensors prepared have been chal- lenged with both the nerve agent sarin [GB= ((CH,),CHO)(CH,)POF] and the simulant DMMP [ = (CH,O),PO(CH,)]. Many aspects, such as sensitivity, response and recovery rates, reversibility and selectivity, as well as the effect of temperature and structural effects, have been studied.
Table 1 Responses at 1.50 “C to 50 ppm NO2 of a delay line passivated with silicon nitride and a non-passivated delay line
Sensor conliguration Code Response to 50 pptn NOI
(9
SiiiO,ZnO-CuPC Si-SiO,ZnO-nitride-CuPC
PC153b 6200 cPC154 400
226 M.S. Nieuwenhuizeq J.L.N. Harteve[d I Sensors and Actuators A 44 (1994) 21%229
Experimental details about the synthesis and appli- cation of the lanthanide compounds and the testing of the sensors obtained are given in a recent paper [25]. In order to prevent decomposition of GB inside the evaporation vessel, dry nitrogen (< 1% relative hu- midity) was used as the primary diluting gas stream. For further dilution and as a reference gas stream, pressurized air (540% relative humidity) was used. The presence of dry nitrogen in the tinal mixture caused slight differences between the sample gas stream and the reference gas stream with respect to oxygen content and relative humidity. This difference did not cause a sensor response, as has been proved by testing blank gas streams. To prevent any effect of aging of the liquid source, for every new sensor tested with GB a fresh source was introduced in the evaporation vessel. Car- boxymethyl derivatives of tyrosine and glutamic acid have been synthesized, resulting in La(II1) N,N,O- tricarboxymethyl tyrosine (LaTCMT) and La(II1) N,N- dicarboxymethyl glutamic acid (LaDCMG) (Fig. 9). Also, La(II1) 2-bis(carboxymethyl)amino hexadecanoic acid (LaBHA) containing a long hydrophobic chain (C,,) has been synthesized.
In the case of the experiments described in this paper, all chemical interfaces have been applied by the dried drop method: a drop of a solution was placed in the delay-line area and dried at 30 “C. This procedure was repeated until the requested frequency shift was at- tained.
In Table 2 the normalized sensitivity (response divided by the concentration and layer mass) to 5 ppm DMMP is listed, together with the 80% response and recovery times. It can be observed that LaBHA shows the largest sensitivity for DMMP; a detection limit of 0.1 ppm (0.5 mg/m3) was estimated at a signal-to-noise ratio of 5.
Differences in sensitivity of the various chemical interfaces result both from different affinities and from differences in morphology. In the case of LaBHA, the most sensitive chemical interface, the material was well spread, whereas in the case of the other chemical interfaces the major part of the material was found at the outer rim.
From DMMP measurements with only the ligand BHA or with LaCl, (without the ligand) information
TYCT R. -CH* 0
0 OCHICOO DCMO R- -CH*CH*COO- BHA R= -~W13Ch
Fig. 9. The three lanthanide complex derivatives of nitrilotriacetic acid studied in this report.
Table 2 The sensitivity normalized to the layer mass at 5 ppm DMMP or GB as well as the 80% response. times (RT,) and recovery times (RCT,) of IaTCMT, LaDCMG and LaBHA at 30 “C
Chemical Agent Sensitivity RT, interface (Wppm ILP) (mh)
LaTChJT DMMP 4.5 2 LaTCMT GB 1.5” 5 LaDCMG DMMP 5.3 2 LaDCMG GB 4.8 6 LaBHA DMMP 28.0 4 LaBHA GB 10.0” 11
“Derived from the reversible part of the response.
RCT, (min)
18 15 21 15 13 13
Table 3 The sensitivity at 5 ppm DMMP normalized to the frequency change resulting from the mass of the chemical interface at 30 “C for the chemical interfaces LaBHA, LaCI, and BHA
Chemical interface Sensitivity material (Wppm m)
LaBHA 1.1 La& 0.2 BHA 0
was obtained about the role played by both the ligand and the central lanthanide ion. In Table 3 the results of these measurements at 30 “C are listed.
From this it can be seen that the lanthanide ion as such shows affinity towards DMMP. This affinity is improved by a factor of five upon the addition of a tricarboxylic ligand, which generates an accessible con- figuration to coordinate with a phosphorylic group. The measurements with only the acid BHA showed no significant response, which also illustrates the important role of the central ion.
After the measurements with DMMP, the sensors were tested with GB at 30 “C. From previous experiments it was known that the presence of products resulting from the hydrolysis of GB during the vapour generation are responsible for a peculiar response behaviour: a reversible and relatively fast response accompanied by an irreversible and slow response. During the present experiments, for every other sensor a fresh liquid source of GB was used, together with the use of dry nitrogen as the primary diluting gas stream in order to prevent hydrolysis of GB near the source. Chemical analysis of the composition of the vapour stream as well as a normal behaviour of the reference delay line proved that no hydrolysis had taken place during the vapour generation.
During the tests with GB, surprisingly, especially in the case of LaBHA and LaTCMT, once again the same partly irreversible response behaviour was observed.
MS. Nieuwenhuizen, J.L.N. Ha&m&i I Senwm and Actuators A 44 (1994) 219-229 227
Fig. 10. Response plots of the various sensors applied with LaDCMG, LaTCMT and LaBHA when exposed to about 9 ppm GB at 30 “C.
This can be seen in Fig. 10, showing typical responses of the sensors to about 9 ppm of GB.
From plots such as the ones presented in Fig. 10 a reversible part of the response could be derived. The sensitivity at 5 ppm of GB as well as the response time and recovery time are presented in Table 2. It is shown that the sensitivity for GB is smaller than that for DMMP. In the case of LaBHA a detection limit of about 0.1 ppm (0.5 mg/m’) was estimated at a signal- to-noise ratio of 5. The response times for GB are higher than the ones for DMMP, while the recovery times are lower than or equal to that for DMMP.
The presence of hydrolysis products in the vapour phase is completely excluded. Therefore the irreversible part of the response has to be the result of phenomena taking place at the sensor itself, i.e., the adsorptive sites may be blocked by reaction products. The high local concentrations of both GB and water (present in the diluting airstream of 510% relative humidity) at the chemical interface may enhance these reactions. Moreover, the strong interaction between the chemical interface and GB, which was supposed to yield a selective and sensitive sensor, may cause a catalytic effect on the reactions taking place.
The chemical nature of LaDCMG hardly differs from that of the other chemical interfaces. Therefore one would not expect large differences in the catalytic effects mentioned. Further studies, such as a check of the response to DMMP and surface analysis of chemical
interface materials treated with GB, were carried out to explain the observed effects.
The sensors have again been tested with DMMP after exposure to GB in order to characterize them further. Table 4 gives the sensitivity before and after the measurements with GB. It is clearly observed that both the sensors showing irreversible responses (LaTCMT and LaBHA) to GB have become consid- erably less sensitive to DMMP, whereas the sensitivity of LaDCMG has not changed at all.
Furthermore, with the aid of surface analysis, re- mainders of GB at the surface of the chemical interface materials were sought after treatment with GB. Such remainders may contain the element P or F, present in strongly adsorbing degradation products of GB such as hydroxy GB or GB dimers or highly reactive deg- radation products such as hydrogen fluoride.
First, energy dispersive X-ray analysis was performed with dried drops of about 0.1 mg of the chemical interfaces, both before and after treatment with GB (100 mg/m3 of GB for 4 h). Secondly, X-ray photo- electron spectroscopy ws performed. From the results it became very clear that the elements P and F appear in all treated samples, whereas under the experimental conditions applied GB itself will no longer be present at the chemical interface material. These observations include LaDCMG. On the one hand, these results support the hypothesis of a damaged chemical interface material causing the observed irreversibility in the re- sponse to GB and the decreased responses to DMMP after treatment. On the other hand, the fact that the elements P and F are also present in LaDCMG, whose response to GB is hardly irreversible and whose response to DMMP has not been affected at all, demands an adapted explanation. Most probably GB is degraded by LaDCMG but the adsorptive site of LaDCMG is not affected by treatment with GB, whereas the ad- sorptive sites of LaTCMT and LaBHA are.
In order to obtain an idea of the selectivity of the lanthanide complexes tested, a fresh LaBHA sensor was tested with a number of potential interfering com- pounds. The concentration of the interfering compounds was quite high: usually in the 100-400 ppm concentration range (water up to 15 000 ppm). As a result, the various
Table 4 The sensitivity at 30 “C to 5 ppm of DMMP normalized to the layer mass of LaTcMT, LaDCMG and LaBHA before and after the measurements with GB
Chemical interface
IATCMT LaDCMG LaBHA
Sensitivity before GB
W/ppm w)
4.5 5.3
28.0
Sensitivity after GB
@/PPm fig)
1.9 5.3
165
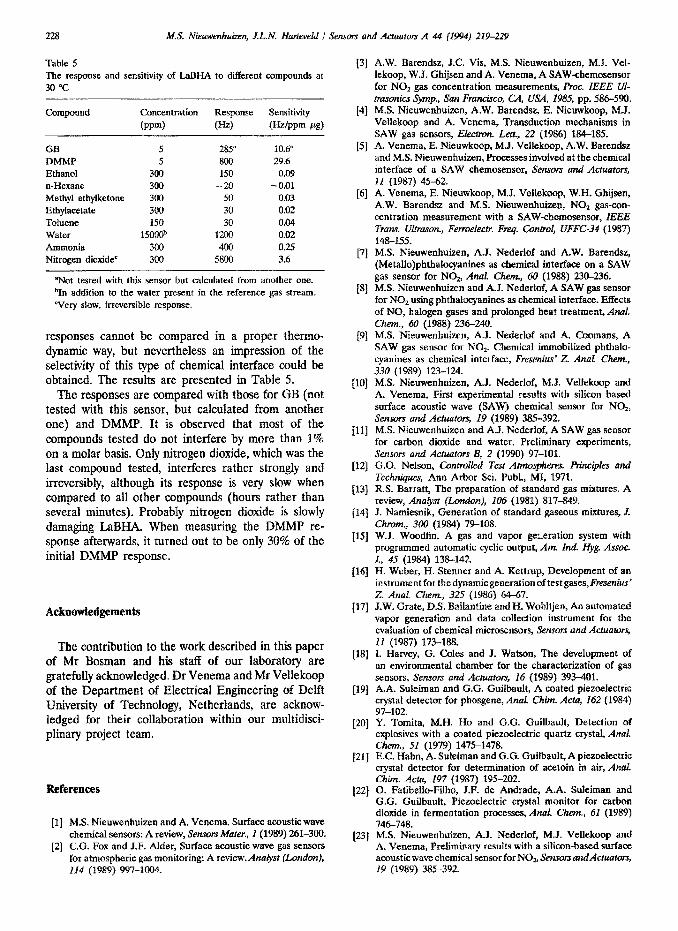
Table 5 The response and sensitivity of LaBHA to different compounds at 30 “C
Compound Concentration Response Sensitivity
(PP4 (Hz) @&Pm itg)
GB 5 285” 10.6” DMMP 5 800 29.6 Ethanol 300 150 0.09 n-Hexane 300 -20 - 0.01 Methyl ethylketone 300 50 0.03 Ethylacetate 300 30 0.02 Toluene 150 30 0.04 Water lSOc@ 1200 0.02 Ammonia 300 400 0.25 Nitrogen dioxide’ 300 5800 3.6
“Not tested with this sensor but calculated from another one. ‘In addition to the water present in the reference gas stream. ‘Very slow, irreversible response.
responses cannot be compared in a proper thermo- dynamic way, but nevertheless an impression of the selectivity of this type of chemical interface could be obtained. The results are presented in Table 5.
The responses are compared with those for GB (not tested with this sensor, but caiculated from another one) and DMMP. It is observed that most of the compounds tested do not interfere by more than 1% on a molar basis. Only nitrogen dioxide, which was the last compound tested, interferes rather strongly and irreversibly, although its response is very slow when compared to all other ~mpo~ds (hours rather than several minutes). Probably nitrogen dioxide is slowly damaging LaBHA. When measuring the DMMP re- sponse afterwards, it turned out to be only 30% of the initial DMMP response.
AcknowIedgements
The contribution to the work described in this paper of Mr Bosman and his staff of our laboratory are gratefully acknowledged. Dr Venema and Mr Veliekoop of the Department of Electrical Engineering of Delft University of Technology, Netherlands, are acknow- ledged for their collaboration within our multidisci- plinary project team.
References
[I] M.S. Nieuwenhuizen and A. Venema, Surface acoustic wave chemical sensors: A review, Sensors Muter., l(lP89) 261-300.
[2] C.G. Fox and J.F. Alder, Surface acaustic wave gas sensors for atmospheric gas monitoring: A review&a&% (London], Ii4 (1989) 997-1004.
131
141
I61
(71
PI
[91
WI
11x1
WI
[I31
1141
WI
WI
u71
WI
B91
PO1
PJI
12-A
[231
A.W. Barendsz, J.C. Vis, M.S. Nieuwenhuizen, M.J. Vel- lekoop, W.J. Ghijsen and A. Venema, A SAWchemosensor for NOz gas concentration measurements, Pmt. IEEE U- trasonics Symp., San Francisco, CM, USA, 1985, pp. 586-590. MS. Nieuwenhuizen, A.W. Barendsz, E. Nieuwkoop, M.J. Veflekoop and A. Venema, Transduction mechanisms in SAW gas sensors, Eiectxwz. Let&, 22 (1986) 184-185. A. Venema, E. Nieuwkoop, Md. Vellekoop, A.W. Barer&z and M.S. Nieuwenhuizen, Processes involved at the chemical interface of a SAW chemosensor, Sensors and Actuators, II (1987) 45-62. A. Venema, E. Nieuwkoop, M.J. Vellekoop, W.H. Ghijsen, A.W. Barendsz and MS. Nieuwenhuizen, NOZ gas-con- centration measurement with a SAW-chemosensor, IEEE Trans. @@ason., Ferroelectr. FF~%$ Con&$ UFFC-3# (1987) 148-155. M.S. Nieuwenhuizen, A.J. Nederlof and A.W. Barendsz, (MetaUo)phthalocyanines as chemical interface on a SAW gas sensor for NO, Anal. Ckem, 60 (1988) 230-236. M.S. Nieuwenhuizen and A.J. Nederlof, A SAW gas sensor for NO* using phthalocyanines as chemical interface. Effects of NO, haiogen gases and prolonged heat treatment, Anal. c&m., 60 (1988) 236-240. MS. Nieuwenhuizen, A.J. Nederiof and A. C&mans, A SAW gas sensor for NO*. Chemical immobilized phthalo- cyanines as chemical interface, Fresenius’ Z. Anal. Ckem., 330 (1989) 123-124. MS. Nieuwenhuizen, A.J. Nederlof, M.J. Vellekoop and A. Vcnema, First experimental results with silicon based surface acoustic wave (SAW) chemical sensor for NO*, Sensors and Actuators, 19 (1989) 385-392. M.S. Nieuwenhuizen and A.J. Nederlof, A SAW gas sensor for carbon dioxide and water. Preliminary experiments, Sensors and Actuators B, 2 (1990) 97-101. G.O. Nelson, Controlled Test Atmospkerw. Rinciples and Techniques, Ann Arbor Sci. Fubl., MI. 1971. R.S. Barratt, The preparation of standard gas mixtures. A review, AnaJyst (Lundon~, 106 (1981) 817-849. J. Namiesnik, Generation of standard gaseous mixtures, J; Chnun., 300 (1984) 79-108. W.J. Woodfin, A gas and vapor ge:.eration system with programmed automatic cyclic output, Am Ind. Hyg Assoc. I., 45 (1984) 138-142. H. Weber, H. Stenner and A. Kettrup, Development of an instrumentfor thed~amicgenerationoftestgases,~~~~~’ Z. An& Ckem., 325 (1986) 64-67. J.W. Grate, D.S. Ballantine andH. WohItjen, An automated vapor generation and data collection instrument for the evaluation of chemical microsensors, Sensors and Actuators, II (1987) 173-188. I. Harvey, G. tiles and J. Watson, The development of an environmental chamber for the characterization of gas sensors, Sensor and Actuatorq 16 (1989) 393401. A.A. Sufeiman and G.G. Guilbault, A coated piezoelectric crysta1 detector for phosgene, AnaL Ckim. Acta, 162 (1984) 97-102. Y. Tomita, M.H. Ho and G.G. Guilbault, Detection of explosives with a coated piezoelectric quartz crystal, Anal. Ckem., 51 (1979) 147>1478. E.C. Hahn, A. Suleiman and G.G. Guilbault, A piezoefectric crystal detector for determination of aeetoin in air, Anal Ckim. Acra, I97 (1987) 195-202. 0. Fatibello-Fiiho, J.F. de Andrade, A.A. Suleiman and G.G. Guilbault, Piezoelectric crystal monitor for carbon dioxide in fermentation processes, Anal. Ckem., 61 (1989) 746-748. M.S. Nieuwenhuizen, A.J. Nederlof, M.J. Vellekoop and A. Venema, Preliminary results with a silicon-based surface acoustic wave chemical sensor for NO, .Senso~ andActuat~, 19 (1989) 385-392.
M.S. Nieuwenhuizen, J.L.N. Hartewki I Sensors and Actualo~~ A 44 (1994) 219-229 229
[24] M.S. Nieuwenhuizen and A.J. Nederlof, A silicon based SAW chemical sensor for NO2 by applying a silicon nitride passivation layer, Sensors andActuators B, 9 (1992) 171-176.
[25] M.S. Nieuwenhuizen and J.L.N. Harteveld, Development of a surface acoustic wave gas sensor for organophosphorus nerve agents employing lanthanide compounds as the chem- ical interface, Tulunta, 41 (1994) 461-472
Biographies
Maarten S. Nieuwenhuizen was born in 1954 in ‘s Gravenzande, The Netherlands, and received his M.Sc. (1980) and Ph.S. (1985) from the Delft University of Technology (Department of Chemical Technology), The Netherlands. He did research in organic chemistry. In 1985, he joined the Prins Maurits Laboratory TNO,
where he was in charge of the development of detection and warning equipment ranging from very simple dis- posable devices and kits to more sophisticated instru- ments (automatic chemical agent alarm systems and microsensors). Currently he is manager of the research group Analysis of Toxic and Explosives Substances.
Johannes LJV. Harteveld was born in 1960 in The Hague, The Netherlands. He received a B.Sc. (1984) in analytical chemistry from the Van Leeuwenhoek Institute, Delft, The Netherlands. In 1986, he joined the Prins Maurits Laboratory TNO, where he was involved in studies concerning the adsorption of chem- ical warfare agents. Since 1992 he has been involved in research in the field of acoustic chemical sensors for both the gas phase (sensors for chemical warfare agents and CO,) and the liquid phase (immunosensors).