Embed Size (px)
Citation preview
AUTOMATED DATA ACQUISTION & WIRELESS ADDITIONS FOR STUDENT SENSOR LABS
1Gale Allen, 1Srikanth Komati-Reddy, 1Praveen Uppalapati and 2David Jones
1ECET Department, MSU Mankato 2Emerson Process Management
1. INTRODUCTION 1.1 Abstract Recent additions to laboratory capabilities being developed to introduce students to sensor technology are described in this paper. During the 2004/05 school year a test fixture was developed to monitor air pressure using equipment which included a deadweight tester, Emerson pressure meter, diaphragm-capacitance pressure sensor and capacitance meter. A laboratory experiment was created and the test fixture is being used in student labs. During this school year the data acquisition process was improved using LabVIEW, a DAQ card and signal conditioning amplifiers to collect data from the Emerson meter, the capacitance meter, and a temperature sensor. A LabVIEW program was written to decode the BK Precision capacitance meter data and to store the data in files for future processing. A wireless link between the computer and the capacitance meter was developed using ZIGBEE transceivers from Freescale. The new capabilities are being used in student lab experiments. 1.2 Background Making repeatable, accurate sensors and using them correctly in test systems and products is very difficult. As a result there are many jobs available to engineers in related fields. Process control, medical devices, packaging, mechanical positioning, motion sensing; etc., the applications are endless. Engineers working in these fields use a common body of statistical techniques and experimental methods to measure performance and size factors which contribute to variation. Our industry-university team with help from others in their organizations started in September 2004 developing laboratory experiments which could be used to introduce students to sensor technology (Allen, et al, 2005). Emerson Process Management generously provided sensors, pressure meters, a dead weight tester and technical guidance for this project. In a series of laboratory projects students will take data, analyze results and study sensor technology topics. 1.3 Emerson Pressure Sensor The Emerson pressure sensor consists of two matching steel cylinders welded together with a diaphragm sandwiched between (Figure 1). The Emerson pressure meter product consists of the sensor, electronics, and LCD readout housed in a heavy-duty steel chamber (Figure 2). The diaphragm moves between the two plates in response to the difference in pressure between two
“American Society for Engineering Education March 31-April 1, 2006 – Indiana University Purdue University Fort Wayne (IPFW)
2006 Illinois-Indiana and North Central Joint Section Conference”

air inlets (Figure 3). The capacitance between the diaphragm and each plate (C = єA/d) changes as the diaphragm is moved by the pressure difference.
Figure 1. Emerson Pressure Sensor
Figure 2.Emerson PressureMeter
Figure 3. Sensor Capacitances
“American Society for Engineering Education March 31-April 1, 2006 – Indiana University Purdue University Fort Wayne (IPFW)
2006 Illinois-Indiana and North Central Joint Section Conference”

1.4 Pressure Sensor Test Fixture The student lab test fixture (Figures 4 & 5) consists of a pressure sensor, pressure meter, capacitance meter, air-pressure source, valves and pipes.
Figure 4. Test Fixture Diagram
wires to capacitance meter
The dead weight tester (Figure 6) is an air-pressair-pressure to a value determined by weights plaof capacitance readings taken on each side of thare shown in Figure 7. The curves differ due tothe position of the diaphragm.
Figure 6. Dead Weight Tester
“American Society for March 31-April 1, 2006 – Indiana Univers
2006 Illinois-Indiana and North C
Figure 5. Test Fixture
ure regulator which reduces a high-level input-ced on a floating cylinder. An example of plots
e sensor as the pressure is increased on one side the nonlinear relationship between pressure and
Meter Pressure vs Sensor Capacitance
0
5
10
15
20
25
20 25 30 35
Capacitance(pF)
Met
er P
ress
ure
(inch
es o
f wat
er)
Labelled
Non Labelled
Figure 7. Example Capacitance
Measurements
Engineering Education ity Purdue University Fort Wayne (IPFW) entral Joint Section Conference”

2. DATA ACQUISITION ADDITION A LabVIEW program was developed to process data from three sources: 1) a capacitance meter, 2) the Emerson pressure meter and 3) a thermocouple attached to the pressure sensor. 2.1 Capacitance Meter Data Format The BK Precision Capacitance meter (Model # 890) used in this project has an RS232 serial interface which operates at 2400 Baud with 6-bits of data, 1 stop bit and no parity. Nine 6-bit codes are sent by the capacitance meter each time the meter takes a reading. The code values and details of the nine items are summarized in the tables below: An example of code received for one reading (1183 n
\0F#(!!\s$\s\s\00 The string was decoded as shown in the table below:
“American Society for EnginMarch 31-April 1, 2006 – Indiana University Pu
2006 Illinois-Indiana and North Centra
Codes Transferred for Each Reading Item # Information 1 Start 2 1st digit (rightmost) 3 2nd digit 4 3rd digit 5 4th digit (leftmost) 6 Sign 7 Range 8 Battery state 9 Stop
6-bit Codes Value LabVIEW Reads Codes as ASCII
001111 Start 0F 000000 Stop NUL 100000 0 SP 100001 1 ! 100010 2 “ 100011 3 # 100100 4 $ 100101 5 % 100110 6 & 100111 7 ‘ 101000 8 ( 101001 9 ) 101011 0L +
F) sent by the capacitance meter is,
Item ASCII Received
Code Sent ASCII Vaue Meaning
1 \0F 001111 \0F (Start code) 2 # 100011 # 3 (Value digital 1) 3 ( 101000 ( 8 (Value digital 2) 4 ! 100001 ! 1 (Value digital 3) 5 ! 100001 ! 1 (Value digital 4) 6 \s 100000 \s 0 (plus) 7 $ 100100 $ 4 (nF) 8 \s 100000 \s 0 (Right - OK) 9 \00 000000 \00 0 (stop code)
eering Education rdue University Fort Wayne (IPFW) l Joint Section Conference”

2.2 Read Data String Program A LabVIEW program (Figure 8) for reading data from an RS232 port is provided in the National Instruments software package. With appropriate settings the VISA serial block reads the 6-bit characters until the termination character, \00, is found and places the characters in a buffer file.
Figure 8. Read Data Program
2.3 String Processing Program The LabVIEW program shown in Figure 9 was developed to process the character string in order to extract capacitance values.
Figure 9. String Processing Program
“American Society for Engineering Education March 31-April 1, 2006 – Indiana University Purdue University Fort Wayne (IPFW)
2006 Illinois-Indiana and North Central Joint Section Conference”
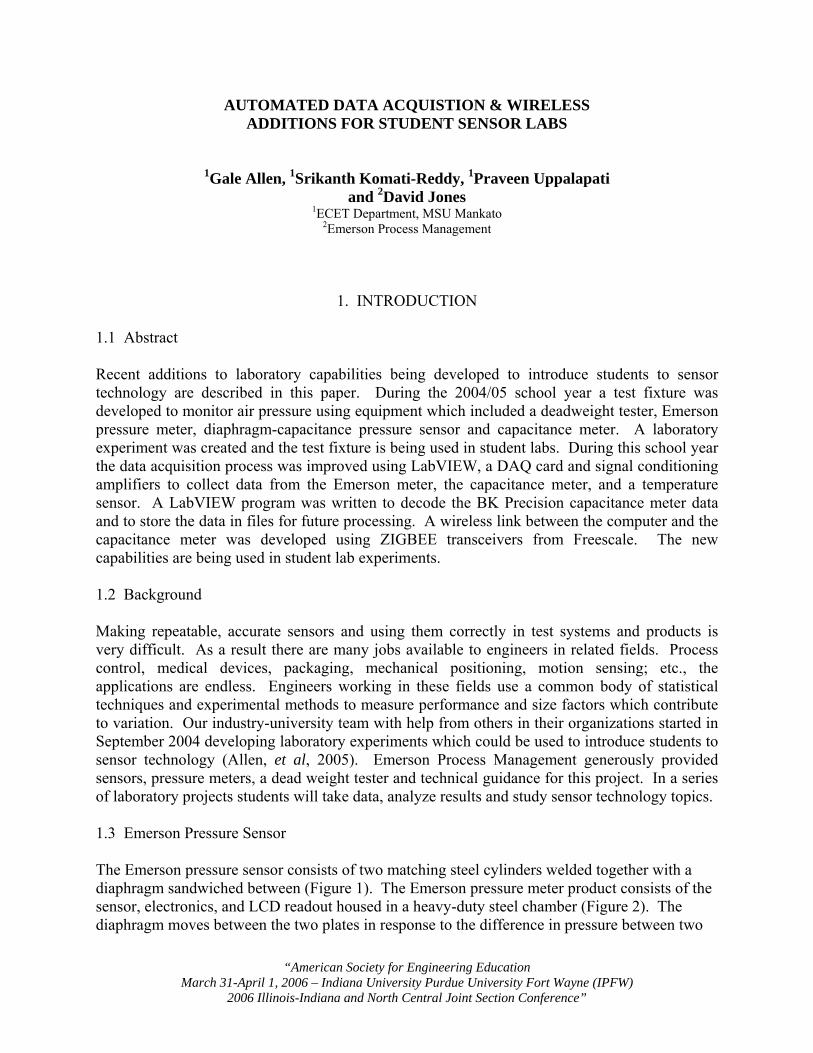
In the above program the Search and Replace String function shown in Figure 10 was used ten times to replace characters with their equivalent decimal value.
Figure 10. Search and Replace Function
The String Subset function shown in Figure 11 was used to extract values from the string which determine the magnitude and sign of the capacitance.
Figure 11. String Subset Function
Three other LabVIEW functions were used in the string processing program.
a) Decimal String-to-Number - converts the numeric characters to decimal. b) Reverse String - reverses the order of the four digits. c) CASE Structure - scales the 4-digit number to the correct value.
2.4 Pressure Meter and Temperature Data Collection Program The LabVIEW program shown in Figure 12 was developed for collecting and storing voltage data from the Emerson pressure meter and from a thermocouple temperature sensor.
Figure 12. Program to collect Pressure Meter and Temperature Data
“American Society for Engineering Education March 31-April 1, 2006 – Indiana University Purdue University Fort Wayne (IPFW)
2006 Illinois-Indiana and North Central Joint Section Conference”

2.5 User Interface The LabVIEW Front Panel of the combined programs shown in Figure 13 gives an example of data collected for capacitance, temperature and pressure.
Figure 13. Front Panel of the LabVIEW Program
“American Society for Engineering Education March 31-April 1, 2006 – Indiana University Purdue University Fort Wayne (IPFW)
2006 Illinois-Indiana and North Central Joint Section Conference”

3.0 WIRELESS LINK ADDITION
A wireless link capability was seen as being useful for future sensor projects. The IEEE 802.15.4 Standard / Zigbee was selected to be investigated because low data rate and low power would fit many data collection and instrument control applications involving sensors. The capacitance meter RS-232 link was selected as a test vehicle. The Freescale MC13192 accelerometer transceiver was used for the project (Figure 14).
Figure 14. MC13192 Transceiver 13192 Features: • 2.4 GHz transceiver, printed circuit antenna • MC9S08GT60 MCU, 60KB on-chip Flash • Programming port • IEEE 802.15.4 modem
• Three Accelerometers • RS-232 port • Switches and LEDs
An accelerometer program provided by Freescale was used to verify that the boards were functional. Using the bootloader program provided in flash memory the accelerometer program was downloaded into the microcontroller. Graphic and numeric displays on the PC connected to one of the SARD boards showed the results of moving the 2nd board and indicated they operated properly. A communication range program provided by Freescale was used to determine the maximum operating distance. The Media Access Control (MAC) address in each board was erased and the range-test program was loaded in each board. LEDs on the boards displayed relative power levels. The boards operated properly when separated several hundred feet with a clear line-of-sight path. A LabVIEW program was used to display the data received at the RS-232 port.
“American Society for Engineering Education March 31-April 1, 2006 – Indiana University Purdue University Fort Wayne (IPFW)
2006 Illinois-Indiana and North Central Joint Section Conference”
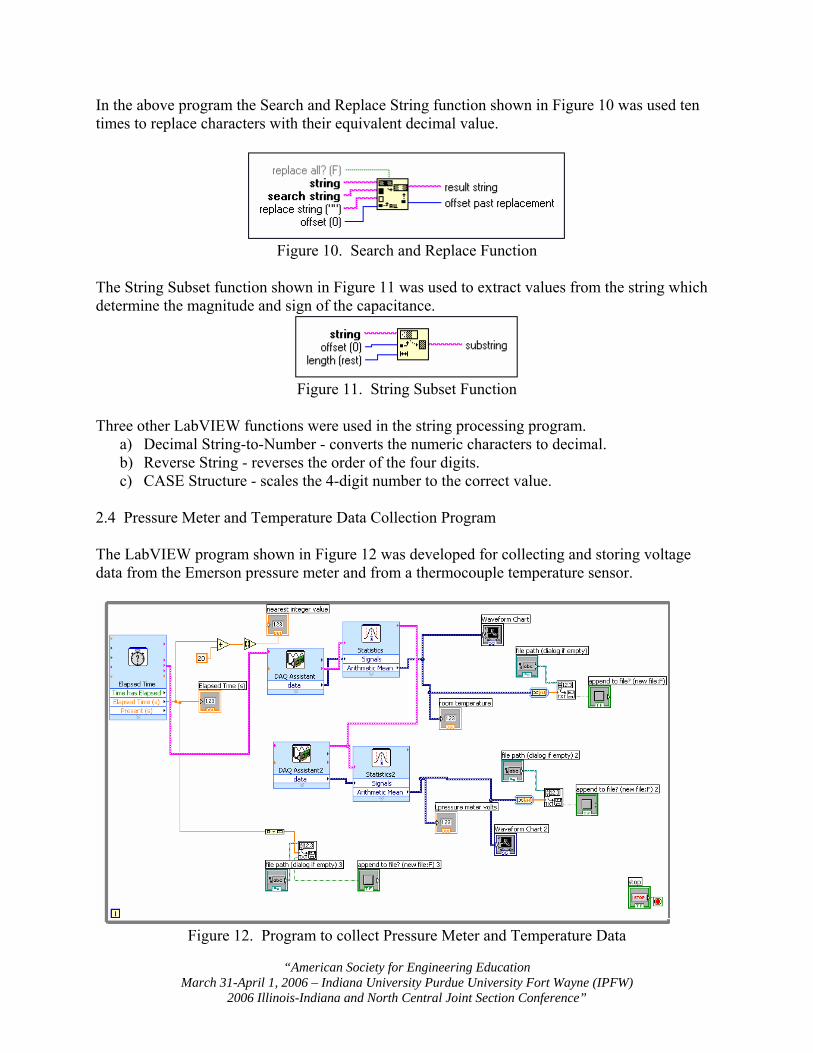
In Fall 2005 the first sensor laboratory class was held (Figure 15). The theory of operation was presented and the students recorded capacitance values and pressure meter readings.
Figure 15. First Sensor Laboratory Class
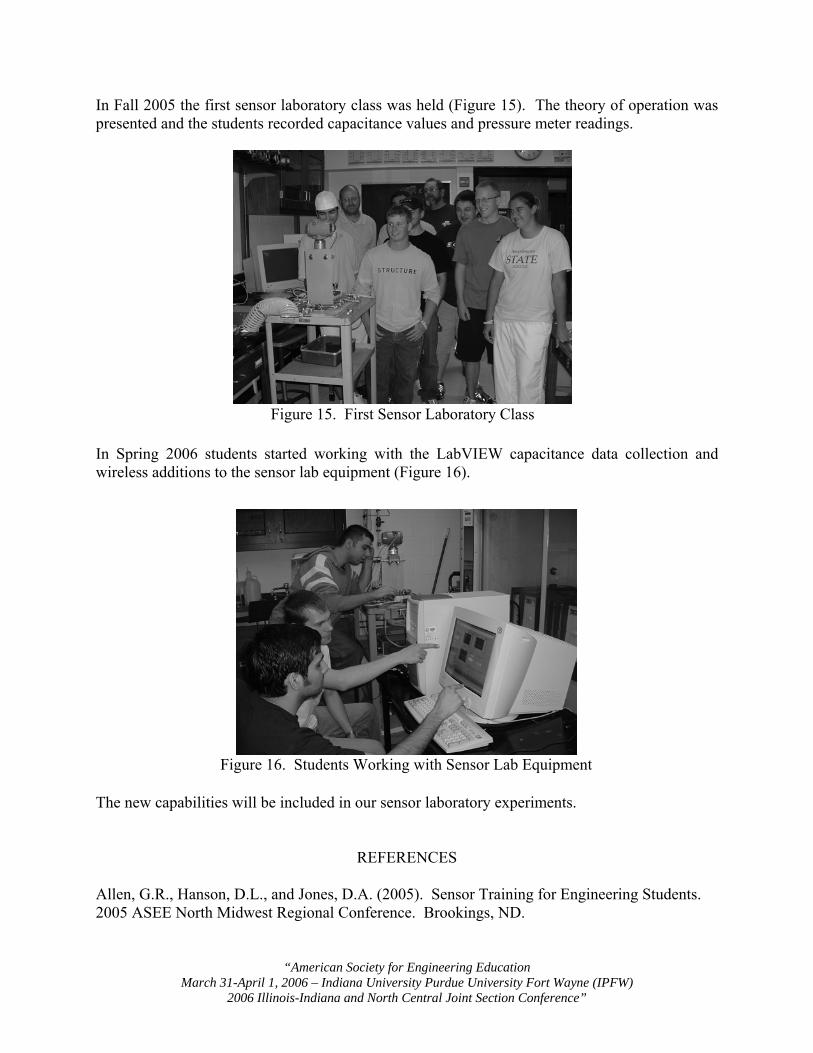
In Spring 2006 students started working with the LabVIEW capacitance data collection and wireless additions to the sensor lab equipment (Figure 16).
Figure 16. Students Working with Sensor Lab Equipment
The new capabilities will be included in our sensor laboratory experiments.
REFERENCES
Allen, G.R., Hanson, D.L., and Jones, D.A. (2005). Sensor Training for Engineering Students. 2005 ASEE North Midwest Regional Conference. Brookings, ND.
“American Society for Engineering Education March 31-April 1, 2006 – Indiana University Purdue University Fort Wayne (IPFW)
2006 Illinois-Indiana and North Central Joint Section Conference”