Embed Size (px)
Citation preview

AIAC-13 Thirteenth Australian International Aerospace Congress
Automated design and optimisation of sensor sets for Condition-Based Monitoring
S. D. Rudov-Clark, A. J. Ryan, C. M. Stecki, J. S. Stecki
PHM Technology Pty Ltd.
1/15 Pickering Rd Mulgrave VIC 3170
Abstract A software tool was developed for automating the design, optimisation and performance assessment of sensor sets to support the Prognostics and Health Management (PHM) of the Joint Strike Fighter. The software (MADe) is based on a model-based simulation of failure propagation through the various subsystems of the aircraft to generate a system-level failure modes and effects database. The failure database generated by this analysis is used to identify the monitoring requirements of the system to achieve a specified level of failure coverage. This paper outlines the analysis approach and provides a case study to demonstrate the application of automated sensor design and optimisation. Keywords: PHM, FMEA, system health monitoring, failure database
Introduction
The traditional system design process is primarily concerned with meeting performance specification and therefore maintainability is usually not included explicitly in the design process. As a result, Useful Life, Fallback analysis, Hazard analysis, Failure analysis and Maintenance analysis tasks are typically carried out only after the system design has been completed. When carried out post-design or post-manufacturing, the results of these studies have only a limited impact on design of the system which by then is already completed and the system may already exist. Thus, if the results of these analyses show that there will be unfavourable impact on maintainability of the system the corrective actions have to be carried out by modifying existing hardware, adding sensors, revamping maintenance procedures. The PHM paradigm aims to achieve improved reliability and maintainability of systems by applying failure analysis, model based monitoring and artificial intelligence technology to predict when a machine will need to be serviced or replaced. Successful application of PHM requires the integration of system reliability and safety into the design process, in order to identify PHM requirements and optimise system design to fulfil them. The concept of a Maintenance Aware Design environment (MADe) is considered to be an enhancement to, and front end methodology for, Prognostics and Health Management (PHM). The MADe approach is based on the application of functional analysis, failure analysis, sensor selection algorithms as well as prognostic and health monitoring tools in the early design stages i.e. during development of specification, concept formulation (synthesis) and hardware implementation. It provides a framework within which PHM related software tools can work together to provide design support for two major tasks. The first is to identify potential operational and diagnostic problems in the conceptual stages of system design and provide aids to making the necessary capability and requirements trade-offs to optimise design of the final system. The second task is concerned with what-if analysis of new design concepts as well as pre-existing hardware systems from the point of system's PHM and health management capabilities.
Sixth DSTO International Conference on Health & Usage Monitoring

AIAC-13 Thirteenth Australian International Aerospace Congress
The basic tool in MADe is automated FMEA/FMECA which identifies functional faults by qualitative modelling and/or simulation of generalised information (energy, information or mass) flow in a system [1]. The effects of failure modes, identified by FMEA, are considered to be ‘symptoms’ from a health monitoring point of view. The results of FMEA are used to determine diagnostics requirements, (i.e.: the location and types of sensors) and also to formulate models for use in diagnostic and prognostic work. In this paper the sensor selection and minimisation methodology is outlined using a simple hydraulic actuator system to demonstrate the method and verification of analysis results.
Sensors analysis technique
To demonstrate the capabilities of the MADe sensor module, an actuator system was modelled using the MADe system modelling interface. The model, shown in Fig.1, consists of functional blocks representing system elements connected by black lines which represent the interactions between them in terms of energy flow. For the energy-based model of the actuator system, the functions are defined using a standardised functional taxonomy [2] and by assigning dynamic properties to the component in accordance with the bond graph methodology, for example, the fluid line pictured in Fig. 1 transports fluid from the flowrate supply to the relief valve. In terms of energy, the ideal fluid line acts as a capacitor for hydraulic energy - the input to the fluid line being volumetric flow, and its output hydraulic pressure - thus the bond-type of the fluid line is 0-C [3].
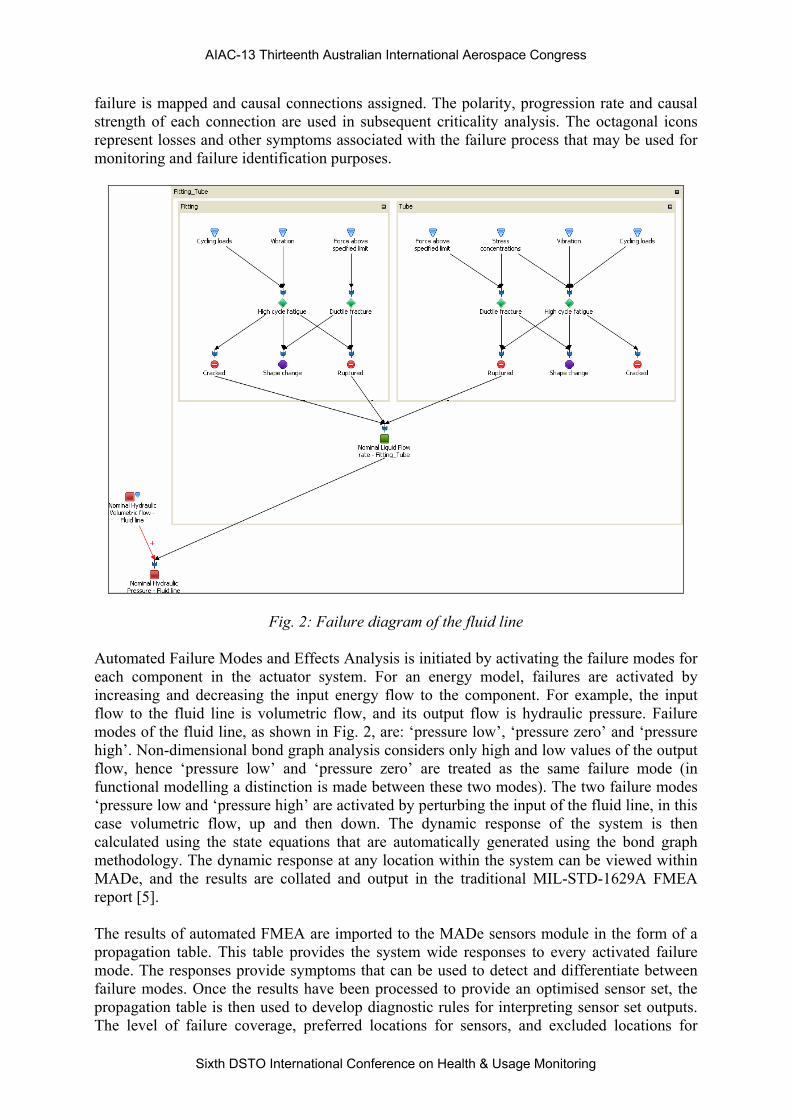
Fig. 1: Actuator System model Having defined the functions and flows between components, their failure modes are identified in physical terms using a ‘failure diagram’. The diagram enables the engineer to map the sequence of events that result in a failure mode, and forms the starting point for automated processing of the Failure Concept Map for functional FMEA. The failure diagram is also used to calculate the criticality of each causal path from initial failure cause to final end-effect of the failure mode. The failure diagram for the fluid line is presented in Fig. 2. Using the MADe terms for failure cause (triangular icon), failure mechanism (diamond icon) and fault (circular icon) of each part of the line (tube and fitting), the physical process of
Sixth DSTO International Conference on Health & Usage Monitoring
AIAC-13 Thirteenth Australian International Aerospace Congress
failure is mapped and causal connections assigned. The polarity, progression rate and causal strength of each connection are used in subsequent criticality analysis. The octagonal icons represent losses and other symptoms associated with the failure process that may be used for monitoring and failure identification purposes.
Fig. 2: Failure diagram of the fluid line Automated Failure Modes and Effects Analysis is initiated by activating the failure modes for each component in the actuator system. For an energy model, failures are activated by increasing and decreasing the input energy flow to the component. For example, the input flow to the fluid line is volumetric flow, and its output flow is hydraulic pressure. Failure modes of the fluid line, as shown in Fig. 2, are: ‘pressure low’, ‘pressure zero’ and ‘pressure high’. Non-dimensional bond graph analysis considers only high and low values of the output flow, hence ‘pressure low’ and ‘pressure zero’ are treated as the same failure mode (in functional modelling a distinction is made between these two modes). The two failure modes ‘pressure low and ‘pressure high’ are activated by perturbing the input of the fluid line, in this case volumetric flow, up and then down. The dynamic response of the system is then calculated using the state equations that are automatically generated using the bond graph methodology. The dynamic response at any location within the system can be viewed within MADe, and the results are collated and output in the traditional MIL-STD-1629A FMEA report [5]. The results of automated FMEA are imported to the MADe sensors module in the form of a propagation table. This table provides the system wide responses to every activated failure mode. The responses provide symptoms that can be used to detect and differentiate between failure modes. Once the results have been processed to provide an optimised sensor set, the propagation table is then used to develop diagnostic rules for interpreting sensor set outputs. The level of failure coverage, preferred locations for sensors, and excluded locations for
Sixth DSTO International Conference on Health & Usage Monitoring

AIAC-13 Thirteenth Australian International Aerospace Congress
sensor placement are set by the user. The failure coverage can be selected by manually deleting failure modes that are not to be covered, or by applying a ‘criticality threshold’ which automatically excludes failure modes whose criticality value is below a set threshold value. The sensors module can also be used to assess the failure coverage of an existing sensor set. The coverage results are returned to the FMECA module and used to revise the detectability rankings of failure modes to provide an updated criticality assessment of the system. The sensor module supports more comprehensive implementation of the risk mitigation methods indicated by FMECA by enabling the designer to examine different ‘what-if’ system design scenarios in order to achieve a system design with minimum criticality. Failure propagation table Automated FMECA is conducted by activating every failure cause in turn in order to simulate the failure modes of every system element. The response of the system is then analysed using either a dynamic model or by Fuzzy Cognitive Map analysis [2]. The propagation table generated by automated FMECA lists the response of every system element to each activated failure mode in functional terms: that is, as changes to the properties of their output flows. From this table the next and end-effects of a failure mode are identified and presented in a FMECA report. The results are also imported into the sensor analysis module and used to conduct sensor set design. The actuator system model under consideration is dynamic: for this type of model failure modes are activated by ‘perturbing’ the input energy flows of each system element up or down. Table 1 lists the failure modes for each system element (at the highest indenture level only) and the perturbations applied to activate them. Table 1: Failure modes and perturbations for actuator system elements (top indenture level)
System element Perturbation (cause) ID Failure Mode Actuator Delta force Decrease F(1) Actuator - Force Low Flow Control Valve
Delta pressure Increase F(2) Flow Control Valve - Volumetric flow High
Flow Control Valve
Delta pressure Decrease F(3) Flow Control Valve - Volumetric flow Low
Fluid line Compressibility flowrate Decrease
F(4) Fluid line - Pressure Low
Fluid line Compressibility flowrate Decrease
F(5) Fluid line 2 - Pressure Low
Relief valve Flow resistance Decrease F(6) Relief valve - Volumetric flow High
Relief valve Flow resistance Increase F(7) Relief valve - Volumetric flow Low
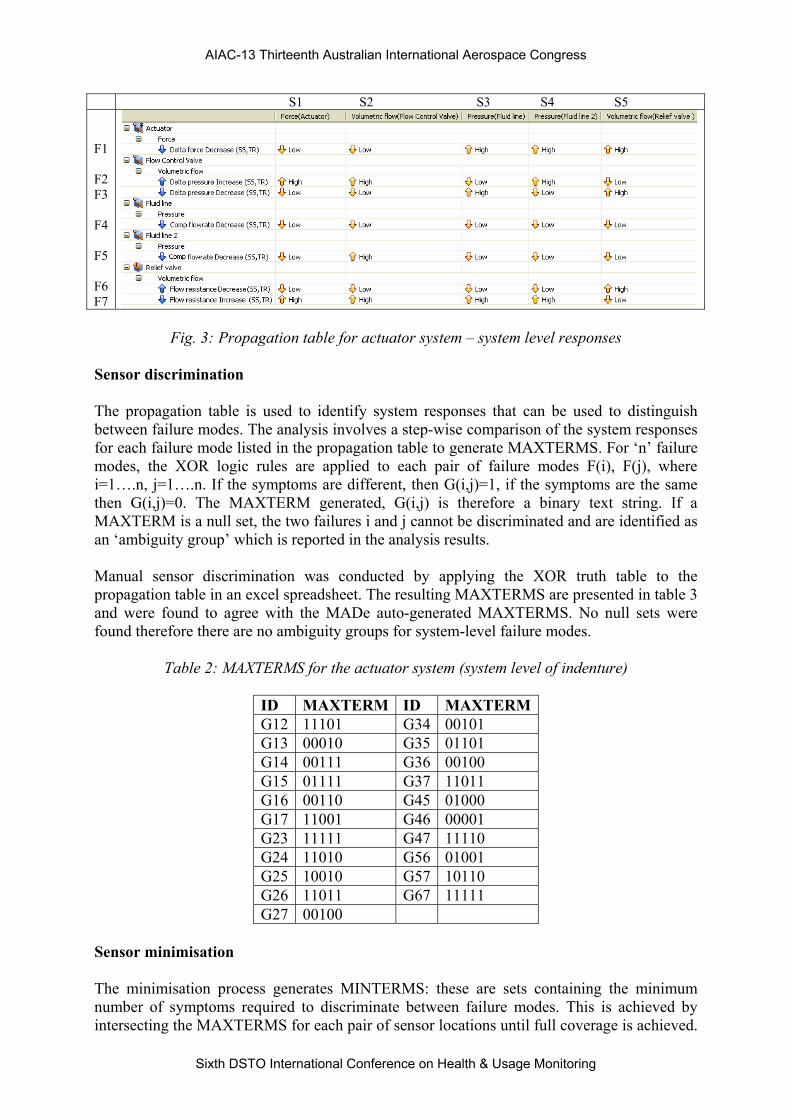
Fig. 3 shows the propagation table reported in MADe for the system level responses to these perturbations. Every row corresponds to a perturbation used to simulate a failure mode, and the column headers refer to the system response at a location on the system model. For example, perturbing the actuator force down (to simulate failure mode F1) causes an increase in the pressure in the fluid line (location S3 in the system model). The system response numbering system is also used to identify sensor locations for sensor set design and analysis.
Sixth DSTO International Conference on Health & Usage Monitoring
AIAC-13 Thirteenth Australian International Aerospace Congress
S1 S2 S3 S4 S5 F1 F2 F3 F4 F5 F6 F7
Fig. 3: Propagation table for actuator system – system level responses
Sensor discrimination The propagation table is used to identify system responses that can be used to distinguish between failure modes. The analysis involves a step-wise comparison of the system responses for each failure mode listed in the propagation table to generate MAXTERMS. For ‘n’ failure modes, the XOR logic rules are applied to each pair of failure modes F(i), F(j), where i=1….n, j=1….n. If the symptoms are different, then G(i,j)=1, if the symptoms are the same then G(i,j)=0. The MAXTERM generated, G(i,j) is therefore a binary text string. If a MAXTERM is a null set, the two failures i and j cannot be discriminated and are identified as an ‘ambiguity group’ which is reported in the analysis results. Manual sensor discrimination was conducted by applying the XOR truth table to the propagation table in an excel spreadsheet. The resulting MAXTERMS are presented in table 3 and were found to agree with the MADe auto-generated MAXTERMS. No null sets were found therefore there are no ambiguity groups for system-level failure modes.
Table 2: MAXTERMS for the actuator system (system level of indenture)
ID MAXTERM ID MAXTERMG12 11101 G34 00101 G13 00010 G35 01101 G14 00111 G36 00100 G15 01111 G37 11011 G16 00110 G45 01000 G17 11001 G46 00001 G23 11111 G47 11110 G24 11010 G56 01001 G25 10010 G57 10110 G26 11011 G67 11111 G27 00100
Sensor minimisation The minimisation process generates MINTERMS: these are sets containing the minimum number of symptoms required to discriminate between failure modes. This is achieved by intersecting the MAXTERMS for each pair of sensor locations until full coverage is achieved.
Sixth DSTO International Conference on Health & Usage Monitoring
AIAC-13 Thirteenth Australian International Aerospace Congress
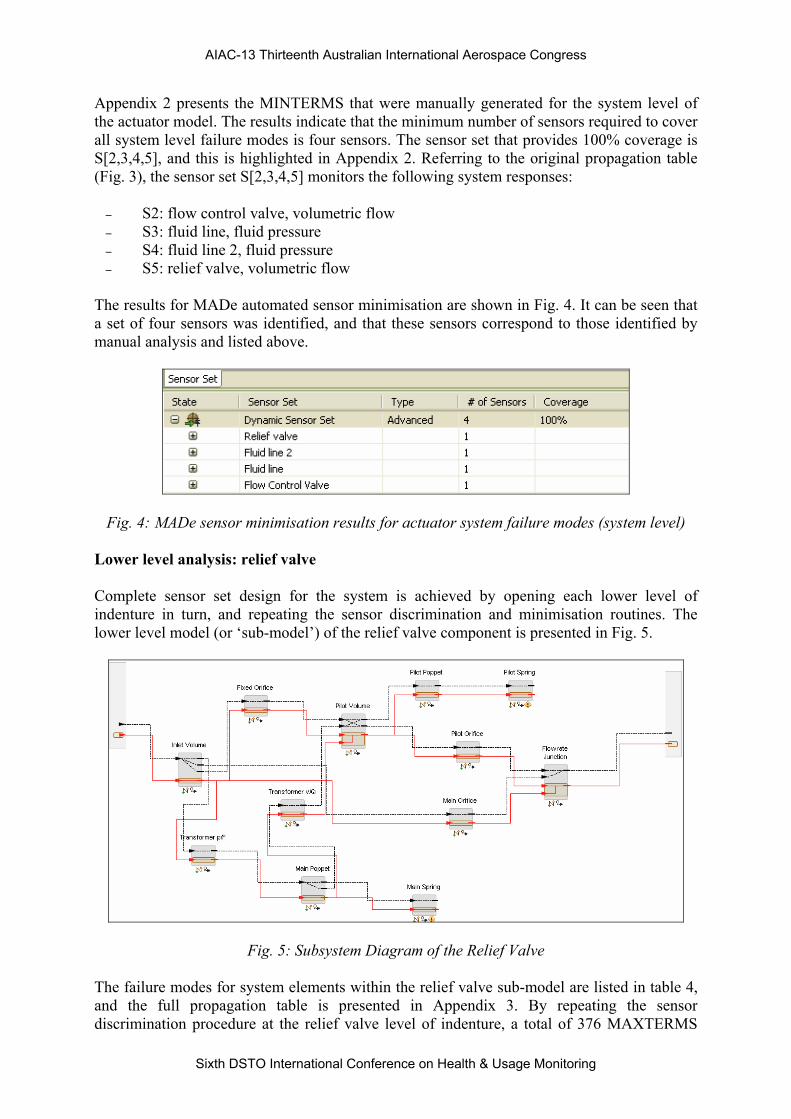
Appendix 2 presents the MINTERMS that were manually generated for the system level of the actuator model. The results indicate that the minimum number of sensors required to cover all system level failure modes is four sensors. The sensor set that provides 100% coverage is S[2,3,4,5], and this is highlighted in Appendix 2. Referring to the original propagation table (Fig. 3), the sensor set S[2,3,4,5] monitors the following system responses:
– S2: flow control valve, volumetric flow – S3: fluid line, fluid pressure – S4: fluid line 2, fluid pressure – S5: relief valve, volumetric flow
The results for MADe automated sensor minimisation are shown in Fig. 4. It can be seen that a set of four sensors was identified, and that these sensors correspond to those identified by manual analysis and listed above.
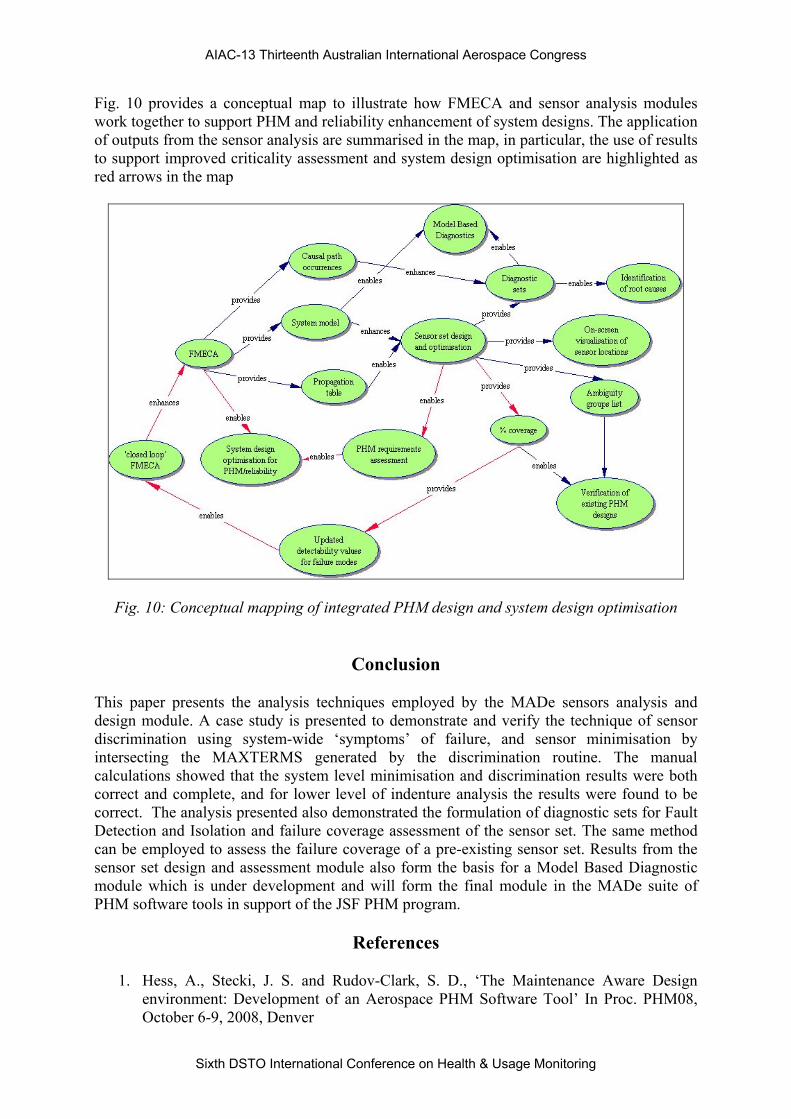
Fig. 4: MADe sensor minimisation results for actuator system failure modes (system level) Lower level analysis: relief valve Complete sensor set design for the system is achieved by opening each lower level of indenture in turn, and repeating the sensor discrimination and minimisation routines. The lower level model (or ‘sub-model’) of the relief valve component is presented in Fig. 5.
Fig. 5: Subsystem Diagram of the Relief Valve The failure modes for system elements within the relief valve sub-model are listed in table 4, and the full propagation table is presented in Appendix 3. By repeating the sensor discrimination procedure at the relief valve level of indenture, a total of 376 MAXTERMS
Sixth DSTO International Conference on Health & Usage Monitoring

AIAC-13 Thirteenth Australian International Aerospace Congress
were generated, all of which were verified against manual calculations using an excel spreadsheet.
Table 4: Failure modes for the relief valve sub-model
Cause Failure Mode Flow resistance decrease High volumetric flow - Fixed Orifice Flow resistance increase Low volumetric flow - Fixed Orifice Flow resistance decrease High volumetric flow - Main Orifice Flow resistance increase Low volumetric flow - Main Orifice Delta pressure increase High linear velocity - Main Poppet Delta pressure decrease Low linear velocity - Main Poppet Delta velocity increase High linear force - Main Spring Delta velocity decrease Low linear force - Main Spring Flow resistance decrease High volumetric flow - Pilot Orifice Flow resistance increase Low volumetric flow - Pilot Orifice Delta pressure decrease Low linear velocity - Pilot Poppet Delta velocity increase High linear force - Pilot Spring Delta velocity decrease Low linear force - Pilot Spring Compressibility Flowrate decrease Low hydraulic pressure - Pilot Volume
Two candidate sensor sets afforded 100% coverage of failure modes for the relief valve sub-model, as shown in Fig. 6. Using the sensor location numbering system in Appendix 3, these sensor locations correspond to the sets S(3,5,6,7,8,9) and S(1,5,6,7,8,9) respectively. Due to the large computing requirements for the relief valve sub-model, the results were verified by determining whether the candidate sensor sets provided 100% coverage. Thus the results were shown to be correct, but not necessarily complete, as was determined for the system level model. The failure coverage of each candidate sensor set was verified by trimming the MAXTERMS for the relief valve sub-model such that only symptoms corresponding to the nominated sensor locations remained. The MAXTERMS were then checked for null sets. If no null-sets were found, then 100% coverage is provided by those symptoms. Results showed that the MAXTERMS did not contain any null-sets and thus it could be independently established that the candidate sensor sets provided 100% failure coverage of the relief valve sub-model.
Fig. 6: Candidate sensor sets for 100% coverage of relief valve failure modes
Sixth DSTO International Conference on Health & Usage Monitoring

AIAC-13 Thirteenth Australian International Aerospace Congress
Sensor selection and optimisation The MADe sensor analysis results are automatically output as a ‘tree-list’ of candidate sensor sets in the format shown in Fig. 7. At this stage, the candidate sets are really only a list of locations on the system that require monitoring for the specified failure coverage. The candidate sensor set is only fully defined once actual sensors have been associated with each nominated sensor location. The results for the actuator system indicate that there is one optimal solution for 100% failure coverage at the system level of indenture, and this is a sensor set named ‘dynamic sensor set’. This set has been expanded to list the individual sensor locations for this set.
Fig. 7: Candidate sensor sets for 100% failure coverage of actuator system failure modes Where multiple candidate sensor sets are available, the user can rank the list of candidate sensor sets according to their total coverage, cost or weight. The cost and weight are generalised values based on the types of sensors required at the specified sensor locations. To obtain a more accurate cost or weight estimate, the user must open the advanced properties window for a candidate sensor set and associate specific sensors with each sensor location. The advanced properties window is shown in Fig. 8. Information provided includes: – the type of FMEA analysis that was conducted to generate the propagation table (type:
advanced) – the overall failure coverage that was achieved for the indenture level under investigation – the total cost and weight of the sensor set (based on sensor details in the library) – a listing of any ambiguity groups if 100% failure coverage is not achieved – a list of all monitorable elements at this level of indenture (this identifies the
components and their symptoms for every sensor location nominated for the sensor set) – a sensors library, containing specifics that have been entered for each type of sensor to
be used on the system The sensors library allows the user to enter details of the sensors that have been selected for the system under analysis. Information for each sensor includes: – cost and weight – sensitivity, range, response time – operational/environmental constraints – type of flow property/loss symptom that is measured
Sixth DSTO International Conference on Health & Usage Monitoring

AIAC-13 Thirteenth Australian International Aerospace Congress
Fig. 8: Sensor set details for system level sensor set The sensor types that are required are automatically selected by identifying sensor types that can measure the relevant flow properties or loss symptoms for each sensor location in the candidate sensor set. A matrix is used by MADe sensors to store sensor details for the library and associate sensors with their measurable flow properties/loss symptoms. An extract of this matrix is shown in Fig. 9. In Fig. 9 four flow properties - angular acceleration, force, contact pressure and linear velocity - are displayed in the left hand columns. The associated sensors are identified by class and type and their details are also listed.
Fig. 9: Matrix of sensor properties and associated flows/symptom losses Fault detection and Isolation Diagnostic sets are lists of symptoms that can be used to identify that a particular failure mode has occurred, given that a set of symptoms (system responses) has been detected. They are generated by trimming the propagation table such that only system responses for the selected sensor set are displayed, then constructing either a table or text string of the system responses for each failure mode.
Sixth DSTO International Conference on Health & Usage Monitoring

AIAC-13 Thirteenth Australian International Aerospace Congress
The diagnostic table for the sensor set S(2,3,4,5) is shown in Table5. The results can also be output as a as text strings, for example: “If (S1=Low, S2=Low, S3=High, S4=High) then F(1)” or: “If S1= actuator force low, S2=flow control valve volumetric flow low, S3=fluid line pressure high and S4=fluid line 2 pressure high then F(1):actuator force low”
Table 5: Diagnostic sets for S(2,3,4,5)
Diagnostic set S1 S2 S3 S4 Failure mode D(1) Low Low High High F(1) D(2) High High Low High F(2) D(3) Low Low High Low F(3) D(4) Low Low Low Low F(4) D(5) Low High Low Low F(5) D(6) Low Low Low Low F(6) D(7) High High High High F(7)
The FMECA analysis provides information as to the origins or causes of the failure mode. These are recorded in the failure diagram of each component. For failure mode F(4) = fluid line pressure low, the failure diagram of the fluid line (Fig. 2) indicates that this failure mode is caused by the fault ‘fluid line bent’. The diagram also shows that there are multiple causes and mechanisms which can lead to this fault, and these are listed in table 6.
Table 6: Causal chains of events for Failure Mode F(4), Fluid Line - Pressure Low
Cause Mechanism Fault Cracked fitting Cracked tube Ruptured fitting
Cycling loads High cycle fatigue
Ruptured tube Cracked fitting Cracked tube Ruptured fitting
Vibration High cycle fatigue
Ruptured tube Ruptured fitting Force above specified limit Ductile fracture Ruptured tube Ruptured fitting Stress concentrations Ductile fracture Ruptured tube
For root cause analysis, the user has access to additional information which can indicate which cause is most likely to have triggered a diagnosed failure mode: – criticality information that is stored within the concept nodes and causal connections of
the failure diagram can be used to compare the relative occurrences, progression rates and causal strengths for each path from cause to failure mechanism
– if any loss symptoms associated with the mechanism or fault are detected, these can be used to distinguish between causes
Sixth DSTO International Conference on Health & Usage Monitoring
AIAC-13 Thirteenth Australian International Aerospace Congress
Fig. 10 provides a conceptual map to illustrate how FMECA and sensor analysis modules work together to support PHM and reliability enhancement of system designs. The application of outputs from the sensor analysis are summarised in the map, in particular, the use of results to support improved criticality assessment and system design optimisation are highlighted as red arrows in the map
Fig. 10: Conceptual mapping of integrated PHM design and system design optimisation
Conclusion This paper presents the analysis techniques employed by the MADe sensors analysis and design module. A case study is presented to demonstrate and verify the technique of sensor discrimination using system-wide ‘symptoms’ of failure, and sensor minimisation by intersecting the MAXTERMS generated by the discrimination routine. The manual calculations showed that the system level minimisation and discrimination results were both correct and complete, and for lower level of indenture analysis the results were found to be correct. The analysis presented also demonstrated the formulation of diagnostic sets for Fault Detection and Isolation and failure coverage assessment of the sensor set. The same method can be employed to assess the failure coverage of a pre-existing sensor set. Results from the sensor set design and assessment module also form the basis for a Model Based Diagnostic module which is under development and will form the final module in the MADe suite of PHM software tools in support of the JSF PHM program.
References
1. Hess, A., Stecki, J. S. and Rudov-Clark, S. D., ‘The Maintenance Aware Design environment: Development of an Aerospace PHM Software Tool’ In Proc. PHM08, October 6-9, 2008, Denver
Sixth DSTO International Conference on Health & Usage Monitoring

AIAC-13 Thirteenth Australian International Aerospace Congress
Sixth DSTO International Conference on Health & Usage Monitoring
2. Rudov-Clark, S. D., Stecki, J. S., ‘The language of FMEA: on the effective use and
reuse of FMEA data’ submitted to HUMS2009, Melbourne, 10 -12 March, 2009 3. Broenink, J. F., ‘Introduction to Physical Systems Modelling with Bond Graphs’ 1999,
in University of Twente Website, url: http://www.ce.utwente.nl/bnk/papers/BondGraphsV2.pdf last accessed 08/01/2009
4. Bouamama, B. O., Medjaher, K., Bayart, M., Samantaray, A.K., Conrard, B., ‘Fault
detection and isolation of smart actuators using bond graphs and external models’ in Control Engineering Practice 13 (2005) 159–175
5. Anon., ‘Procedures for performing a failure mode, effects and criticality analysis’,
MIL-STD-1629A, US Department of Defense, 1980

AIAC-13 Thirteenth Australian International Aerospace Congress
Appendix 1: Functions of the Actuator System Elements
Item Name Level 1 Level 2 Level 3
Element type Function Inputs Outputs
Actuator System System Convert angular velocity to linear velocity
Angular velocity Linear velocity
Fluid Line Component Store hydraulic energy Volumetric flow Hydraulic pressure Tube/Fitting Pair Transport liquid n/a Liquid flow rate Relief Valve Subsystem Regulate hydraulic
pressure Hydraulic pressure Volumetric flow
Fixed Orifice Component Convert hydraulic energy Hydraulic pressure Volumetric flow Transformer (p/f) Component Convert hydraulic pressure Hydraulic pressure Linear force Pilot Volume Component Store hydraulic energy Volumetric flow
Hydraulic pressure
Main Spring Component Store mechanical energy Linear velocity Linear force Pilot Spring Component Store mechanical energy Linear velocity Linear force Transformer (v/q) Component Convert mechanical energy Linear velocity Volumetric flow Flowrate Junction Component Connect hydraulic flow Volumetric flow
Volumetric flow Volumetric flow
Main Orifice Component Convert hydraulic pressure Hydraulic pressure Volumetric flow Main Poppet Component Store mechanical energy Linear force Linear velocity Pilot Poppet Component Store mechanical energy Hydraulic pressure Linear velocity Pilot Orifice Component Convert hydraulic energy Hydraulic pressure Volumetric flow Inlet Volume Component Distribute hydraulic energy Hydraulic pressure Hydraulic pressure Flow Control
Valve Component Convert hydraulic energy Hydraulic pressure Volumetric flow
Fluid Line 2 Component Store hydraulic energy Volumetric flow Hydraulic pressure Actuator Component Convert hydraulic energy Hydraulic pressure Linear force Flowrate Supply Component Translate volumetric flow Rotational velocity Volumetric flow Load Component Convert mechanical energy Linear force Linear velocity Reservoir Component Store hydraulic energy Hydraulic pressure
Volumetric flow
Sixth DSTO International Conference on Health & Usage Monitoring

AIAC-13 Thirteenth Australian International Aerospace Congress
Appendix 2: MINTERMS for Actuator System – System Level
S123 S124 S125 S234 S235 S245 S345 S1234 S1235 S2345 L12 L12 L12 L12 L12 L12 L12 L12 L12 L12 L13 L13 L13 L13 L13 L13 L14 L14 L14 L14 L14 L14 L14 L14 L14 L14 L15 L15 L15 L15 L15 L15 L15 L15 L15 L15 L16 L16 L16 L16 L16 L16 L16 L16 L16 L17 L17 L17 L17 L17 L17 L17 L17 L17 L17 L23 L23 L23 L23 L23 L23 L23 L23 L23 L23 L24 L24 L24 L24 L24 L24 L24 L24 L24 L24 L25 L25 L25 L25 L25 L25 L25 L25 L25 L26 L26 L26 L26 L26 L26 L26 L26 L26 L26 L27 L27 L27 L27 L27 L27 L27 L34 L34 L34 L34 L34 L34 L34 L34 L34 L35 L35 L35 L35 L35 L35 L35 L35 L35 L35 L36 L36 L36 L36 L36 L36 L36 L37 L37 L37 L37 L37 L37 L37 L37 L37 L37 L45 L45 L45 L45 L45 L45 L45 L45 L45 L46 L46 L46 L46 L46 L46 L47 L47 L47 L47 L47 L47 L47 L47 L47 L47 L56 L56 L56 L56 L56 L56 L56 L56 L56 L56 L57 L57 L57 L57 L57 L57 L57 L57 L57 L57 L67 L67 L67 L67 L67 L67 L67 L67 L67 L67
Sixth DSTO International Conference on Health & Usage Monitoring

AIAC-13 Thirteenth Australian International Aerospace Congress
Appendix 3: Propagation table for Relief Valve sub-model Abbreviations: (ss) steady state response of the system (tr) transient response of the system nom nominal response lo decrease response hi increase response
Fixed Orifice
Flowrate Junction
Inlet Volume
Main Orifice
Main Poppet
Main Spring
Pilot Orifice
Pilot Poppet
Pilot Spring
Pilot Volume
Component Cause Failure Mode
ID
Vol. flow Vol. flow Press. Vol. flow Lin. vel. Force Vol. flow Lin. vel. Force Press. Flow resist. inc (ss)
Vol. flow hi
F1 hi nom lo lo nom lo hi nom hi hi
Flow resist. inc (tr)
Vol. flow hi
F2 hi nom lo lo lo lo hi hi hi hi
Flow resist. dec (ss)
Vol. flow lo
F3 lo nom hi hi nom hi lo nom lo lo
Fixed Orifice
Flow resist. dec (tr)
Vol. flow lo
F4 lo nom hi hi hi hi lo lo lo lo
Flow resist. inc (ss)
Vol. flow hi
F5 lo nom lo hi nom lo lo nom lo lo
Flow resist. inc (tr)
Vol. flow hi
F6 lo nom lo hi lo lo lo lo lo lo
Flow resist. dec (ss)
Vol. flow lo
F7 hi nom hi lo nom hi hi nom hi hi
Main Orifice
Flow resist. dec (tr)
Vol. flow lo
F8 hi nom hi lo hi hi hi hi hi hi
Delta press. inc (ss)
Lin. vel hi
F9 nom nom nom nom nom hi nom nom nom nom
Delta press. inc (tr)
Lin. vel hi
F10 lo nom lo lo hi hi hi hi hi hi
Delta press. dec (ss)
Lin. vel lo
F11 nom nom nom nom nom lo nom nom nom nom
Main Poppet
Delta press. Lin. vel F12 hi nom hi hi lo lo lo lo lo lo
Sixth DSTO International Conference on Health & Usage Monitoring

AIAC-13 Thirteenth Australian International Aerospace Congress
Sixth DSTO International Conference on Health & Usage Monitoring
dec (tr) lo Delta vel. inc (ss)
Force hi
F13 hi nom hi hi lo hi lo nom lo lo
Delta vel. inc (tr)
Force hi
F14 hi nom hi hi lo hi lo lo lo lo
Delta vel. dec (ss)
Force lo
F15 lo nom lo lo hi lo hi nom hi hi
Main Spring
Delta vel. dec (tr)
Force lo
F16 lo nom lo lo hi lo hi hi hi hi
Flow resist. inc (ss)
Vol. flow hi
F17 hi nom lo lo nom hi hi nom lo lo
Flow resist. inc (tr)
Vol. flow hi
F18 hi nom lo lo hi hi hi lo lo lo
Flow resist. dec (ss)
Vol. flow lo
F19 lo nom hi hi nom lo lo nom hi hi
Pilot Orifice
Flow resist. dec (tr)
Vol. flow lo
F20 lo nom hi hi lo lo lo hi hi hi
Delta press. dec (ss)
Lin. vel lo
F21 nom nom nom nom nom nom nom nom lo nom Pilot Poppet
Delta press. dec (tr)
Lin. vel lo
F22 lo nom hi hi lo lo hi lo lo hi
Delta vel. inc (ss)
Force hi
F23 lo nom hi hi nom lo hi lo hi hi
Delta vel. inc (tr)
Force hi
F24 lo nom hi hi lo lo hi lo hi hi
Delta vel. dec (ss)
Force lo
F25 hi nom lo lo nom hi lo hi lo lo
Pilot Spring
Delta vel. dec (tr)
Force lo
F26 hi nom lo lo hi hi lo hi lo lo
Flowrate delta dec (ss)
Press. lo
F27 hi nom lo lo nom hi lo nom lo lo Pilot Volume
Flowrate delta dec (tr)
Press. lo
F28 hi nom lo lo hi hi lo lo lo lo