Embed Size (px)
Citation preview
An Approach to Resilient Strategic Planning in the Face of Climate Change: A Case
Study of Oman
By
Amna Mohammed Al Ruheili
A dissertation submitted in partial satisfaction of the
requirements for the degree of
Doctor of Philosophy
in
Landscape Architecture and Environmental Planning
in the
Graduate Division
of the
University of California, Berkeley
Committee in charge:
Professor John D. Radke, Chair
Professor G. Mathias Kondolf
Professor Nelson H. Graburn
Summer 2017


Copyright © Amna Mohammed Al Ruheili, 2017
All rights reserved
1
Abstract
An Approach to Resilient and Intelligent Developmental Planning in the Face of
Climate Change: A Case Study of Oman
by
Amna Mohammed Al Ruheili
John D. Radke, Chair
This research makes a significant contribution to strategic planning by introducing an approach
that integrates science into the planning practices and policy-making of Oman to enable more
informed and resilient development. Oman, like many of its neighbors in the Arabian Sea
region, is quite vulnerable to the potential impacts of climate change including: increased
temperatures, erratic precipitation, desertification of much of its land mass, coastal flooding
brought on by sea level rise (SLR), and increasing frequency of hazardous storms events.
Throughout history, Oman has been subjected to various storms and cyclonic events that have
resulted in both flash wadi flooding and high-tidal storm surge. Records show that major storms
and cyclonic events have not only caused catastrophic damage to infrastructure and loss of
agricultural lands and livestock, they have often resulted in loss of human life.
These events have been frequent and climate change projections indicate that they are on the
increase. Northern Oman has documented evidence of major storms and cyclonic events as far
back as 1890, and increasing in periodicity today (ie. 1971, 1977, 1987, 1995, 1997, 1999, 2003,
2007, 2010, 2015, 2016, and 2017). Dhofar, located in southern Oman and the geographic study
region for this research, has experienced major storms and cyclonic events on a regular basis (ie.
1948, 1959, 1963, 1966, 1983, 1996, 2002, 2004, 2011, and 2015). In order to mitigate and
reduce the damage caused by these events, Oman, at an early stage of economic and industrial
development, must modify its approach to strategic planning and policy-making. In fact the
motivation behind this research is to promote resilient planning within the strategic-development
planning process already taking place in Oman by providing a better understanding of how
integrating science into the process can result in a better vision for the future, and more resilient
infrastructure and development in general.
This dissertation produces the first visualization of the inundation caused by the 2002 storm at
Dhofar. It integrates a high-resolution earth surface model with a dynamic three-dimensional
flood model based on the 2002 historic Dhofar extreme storm event that resulted in
unprecedented damage. This novel modeling method allows researchers to analyze the realistic
flow of water across the landscape during an extreme storm event. In addition, increments of sea
level rise are modeled to predict future inundation levels based on predicted climate change.
New GIS based technologies support the modeling and quantifying of impacts on infrastructure
at a very high resolution at not only local scales but across vast regions.
2
This research demonstrates the application of a process that can help Oman move toward
sustainable development and develop the creation of a resilient infrastructure to support the local
population, in addition to the tourist industry that is quickly becoming a vital economic driver. It
offers a glimpse into a future in which this knowledge and approach could be informative for the
development of Oman and other Gulf countries. This is achieved by: 1) providing an overview of
the principles of sustainable development and the implementation of those principles within the
Omani context, 2) modeling the 2002 storm-surge event in association with various SLR
scenarios along the coast of Dhofar, 3) quantifying coastal tourism projects that show
vulnerabilities for the 2002 storm-surge event with different SLR projections, and 4) modeling
the impacts of flash wadi flooding in 2002 and investigating the effects of this flooding on
urbanization and infrastructure.
Producing accurate measurements regarding the depth and extent of sea level rise and wadi
flooding inundation in areas where infrastructure and urban areas are threatened is critical to
sound decision-making. Analyzing the impacts of flooding on current infrastructure, economic
projects, and urban areas are first steps in implementing resilient and intelligent planning in
Oman.

i
DEDICATION
This work is dedicated to my beloved daughter, Layan, and to my husband, Ahmed.
Dear daughter Layan, thank you for your patience and for accompanying me during this journey.
Thank you for tolerating the long hours of my being away from you. As much as I regret being
apart from you and missing your wonderful growth, I hope I will be your role model in future.
We started this journey together, and now I am finishing and there you are, cheering me on.
There are no words in the world that can express my gratitude and thankfulness for you, but I
promise I will be there for you when you are doing your Ph.D.
Dear husband Ahmed, I owe you my loving thanks. Thank you for keeping, supporting,
encouraging, and advising me throughout all these years. Ahmed, you are my hero. Thank you
for your patience and for tolerating being apart from me and from Layan. I would never have
been able to do it without your love and help.
ii
TABLE OF CONTENTS
Page
Abstract ........................................................................................................................................... 1
Dedication ........................................................................................................................................ i
List of Figures ................................................................................................................................ iv
List of Tables ................................................................................................................................. vi
Acknowledgements ....................................................................................................................... vii
CHAPTER 1 ................................................................................................................................... 1
1.1 Introduction ......................................................................................................................... 1
1.2 Problem Statement .............................................................................................................. 3
1.3 Research Contributions ....................................................................................................... 4
1.4 Research Outline ................................................................................................................. 5
CHAPTER 2 ................................................................................................................................... 7
2.1 Introduction ......................................................................................................................... 7
2.2 Resilient Infrastructure and Its Importance to Sustainable Development .......................... 9
2.2.1 Sustainable Development Interpretations and Applications ................................... 9
2.2.2 Social and Economic Interpretations in Sustainable Development ...................... 10
2.2.3 Significance of Resilient Infrastructure to Sustainable Development .................. 11
2.3 Oman’s Application to Sustainable Development ............................................................ 13
2.3.1 Sustainable Development in Oman’s Environmental Context ............................. 14
2.3.2 Sustainable Development in Oman’s Social Context ........................................... 14
2.3.3 Sustainable Development in the Context of Oman’s Economy............................ 15
2.4 The Piece of SD That Is Lacking in Oman: Resilient Infrastructure ................................ 16
2.4.1 The Urgent Need for Resilience in Oman............................................................. 18
2.5 Conclusion ........................................................................................................................ 20
CHAPTER 3 ................................................................................................................................. 22
3.1 Introduction ....................................................................................................................... 22
3.2 Study Site .......................................................................................................................... 25
3.3 History of Natural Hazards in Dhofar ............................................................................... 26
3.4 Method of Inquiry ............................................................................................................. 27
3.4.1 Digital Elevation Model (DEM) ........................................................................... 28
3.4.2 Bathymetry ............................................................................................................ 28
3.4.3 Water Level ........................................................................................................... 28
3.5 3Di Modeling of Dhofar’s Coast ...................................................................................... 30
3.5.1 Consequences of Flooding .................................................................................... 31
3.6 Results ............................................................................................................................... 32
3.6.1 Dhofar’s Coast Inundation Output ........................................................................ 32
3.7 Dhofar’s Governance Buildings and Roads Inundation Output ....................................... 36
3.8 Accuracy Assessments ...................................................................................................... 38
3.9 Limitations ........................................................................................................................ 38
iii
3.10 Conclusion ...................................................................................................................... 40
CHAPTER 4 ................................................................................................................................. 41
4.1 Introduction ....................................................................................................................... 41
4.2 Sustainable Tourism.......................................................................................................... 41
4.3 Tourism in Oman .............................................................................................................. 43
4.4 Study Site .......................................................................................................................... 44
4.5 Method of Inquiry ............................................................................................................. 44
4.6 Results ............................................................................................................................... 46
4.7 Conclusion ........................................................................................................................ 48
CHAPTER 5 ................................................................................................................................. 49
5.1 Introduction ....................................................................................................................... 49
5.2 Rainfall Characteristics in Arid Regions .......................................................................... 52
5.3 Study Site .......................................................................................................................... 53
5.3.1 3Di Model Setup ................................................................................................... 55
5.3.2 Digital Elevation Model (DEM) ........................................................................... 55
5.3.3 Bathymetry ............................................................................................................ 55
5.3.4 Water Level ........................................................................................................... 56
5.3.5 Initial Water-Boundaries and Water-Level Data for Watershed .......................... 56
5.3.6 Roughness and Infiltration Maps .......................................................................... 56
5.3.7 Rainfall Events ...................................................................................................... 57
5.4 Results ............................................................................................................................... 57
5.4.1 Wadi Flash Flooding Damage to Urban Areas ..................................................... 58
5.4.2 Ghadow’s Watershed ............................................................................................ 59
5.4.3 Zayk’s Watershed ................................................................................................. 64
5.4.4 Flash Flooding Impacts on Agricultural Land in the Ghadow
and Zayk Watersheds .......................................................................................... 66
5.5 Limitations and Future Research ...................................................................................... 70
5.6 Conclusion and Discussion ............................................................................................... 70
CHAPTER 6 ................................................................................................................................. 73
6.1 Conclusion ........................................................................................................................ 73
References ..................................................................................................................................... 77
Bibliography ................................................................................................................................. 95
iv
LIST OF FIGURES
Page
Figure 1. Three elements of sustainable development. ................................................................ 10
Figure 2. Oman’s development timeline. ..................................................................................... 14
Figure 3. Oman’s implementation of the three elements of sustainable development. ................ 16
Figure 4. Flow chart of the modeling approach. .......................................................................... 30
Figure 5. 3Di 5 m2 resolution measured and simulated water level comparison at Port of
Salalah, and Marbat. .................................................................................................. 31
Figure 6. Total inundated land area, by Governorate. .................................................................. 32
Figure 7. Taqa and South Dahariz inundation through PWLx = SLRx + Extreme
Water Event of May 9-12, 2002 (where x = 0.0, 0.5, 1.0, and 1.41m). ...................... 34
Figure 8. Time-series inundation of extreme storm event associated with 1.41m SLR
in South Dahariz city (PWL1.41 = SLR1.41 + extreme storm event of 2002). ......... 35
Figure 9. Maps of impact on Dhofar’s roads by SLR of 1.41m to 0.0m inundation
coupled with 2002 extreme storm event. .................................................................... 36
Figure 10. San Diego selected site. .............................................................................................. 38
Figure 11. San Diego flood inundation extent at 1m and 5m DEM resolution. ........................... 39
Figure 12. Study site, Dhofar. ...................................................................................................... 45
Figure 13. Approach to mapping vulnerable coastal hotels and resorts. ...................................... 46
Figure 14. Rotana and Juwirah Hotels’ impacts from various scenarios of SLR
and storm surge. .......................................................................................................... 47
Figure 15. Zayk’s and Ghadow’s watershed extent. .................................................................... 54
Figure 16. Meteorological rain station readings during 2002 storms. .......................................... 55
Figure 17. Rainfall gauging record. .............................................................................................. 58
Figure 18. Wadi Ghadow flash flooding maximum inundation. .................................................. 60
Figure 19. Part of Salalah city. Time-series inundation extent and depth of
Wadi Ghadow flash flooding in association with 1.41 m SLR................................... 61
Figure 20. Vulnerable coastal tourism and new development due to flash flooding
in association with 1.41 SLR. ..................................................................................... 62
Figure 21. Roads affected by Wadi Zayk flash flooding in association with SLR at 0 m and
1.41 m maximum inundation are shown on the left, and roads affected by Wadi
Ghadow flash flooding (same parameters) are shown on the right. ........................... 63
Figure 22. Flash flooding in Wadi Zayk watershed in association with SLR at 0 m
and 1.41 m maximum inundation. .............................................................................. 64
Figure 23. Time-series flash wadi inundation of 2002 storm event. ............................................ 65
Figure 24. Sa’adah area time-series inundation extent and depth every 12 hours
for the duration of the May 2002 event. ..................................................................... 66

v
vi
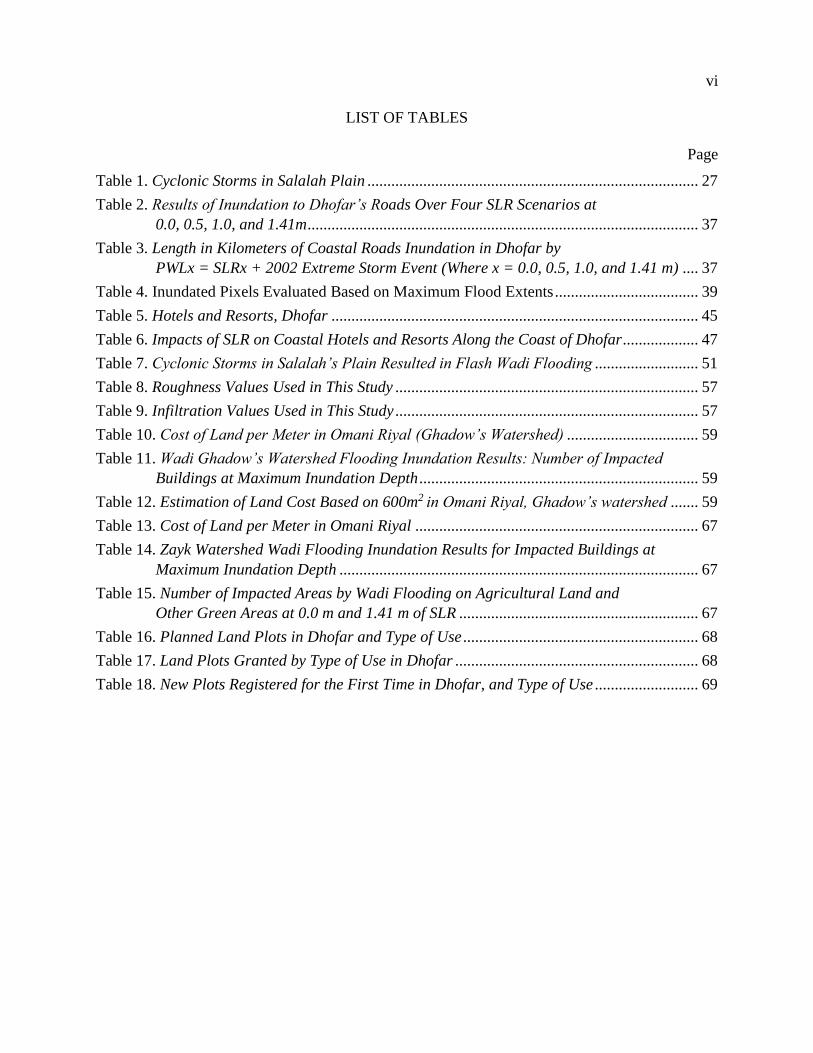
LIST OF TABLES
Page
Table 1. Cyclonic Storms in Salalah Plain ................................................................................... 27
Table 2. Results of Inundation to Dhofar’s Roads Over Four SLR Scenarios at
0.0, 0.5, 1.0, and 1.41m .................................................................................................. 37
Table 3. Length in Kilometers of Coastal Roads Inundation in Dhofar by
PWLx = SLRx + 2002 Extreme Storm Event (Where x = 0.0, 0.5, 1.0, and 1.41 m) .... 37
Table 4. Inundated Pixels Evaluated Based on Maximum Flood Extents .................................... 39
Table 5. Hotels and Resorts, Dhofar ............................................................................................ 45
Table 6. Impacts of SLR on Coastal Hotels and Resorts Along the Coast of Dhofar ................... 47
Table 7. Cyclonic Storms in Salalah’s Plain Resulted in Flash Wadi Flooding .......................... 51
Table 8. Roughness Values Used in This Study ............................................................................ 57
Table 9. Infiltration Values Used in This Study ............................................................................ 57
Table 10. Cost of Land per Meter in Omani Riyal (Ghadow’s Watershed) ................................. 59
Table 11. Wadi Ghadow’s Watershed Flooding Inundation Results: Number of Impacted
Buildings at Maximum Inundation Depth ...................................................................... 59
Table 12. Estimation of Land Cost Based on 600m2 in Omani Riyal, Ghadow’s watershed ....... 59
Table 13. Cost of Land per Meter in Omani Riyal ....................................................................... 67
Table 14. Zayk Watershed Wadi Flooding Inundation Results for Impacted Buildings at
Maximum Inundation Depth .......................................................................................... 67
Table 15. Number of Impacted Areas by Wadi Flooding on Agricultural Land and
Other Green Areas at 0.0 m and 1.41 m of SLR ............................................................ 67
Table 16. Planned Land Plots in Dhofar and Type of Use ........................................................... 68
Table 17. Land Plots Granted by Type of Use in Dhofar ............................................................. 68
Table 18. New Plots Registered for the First Time in Dhofar, and Type of Use .......................... 69

vii
ACKNOWLEDGEMENTS
There are many people to thank for their support in helping me to finish this dissertation and
encouraging me over the past six years. First, I would like to express my deep and sincere
appreciation to my supervisor, Professor John Radke, for his continuous encouragement, help,
support, and guidance throughout my study journey. Thank you for spending long hours with me
shaping my research, even during your weekend. Thank you for being there for me to overcome
any technical problem that I have, even when you were on airplanes. You always inspired me to
take one step further and made me develop a connection between my research, the current
situation, and the challenge of the future. Thank you for believing in me, building my skills, and
giving me the opportunity to work in what I love.
Thanks to Professor Matt Kondolf, whose love for rivers has given me enthusiasm for focusing
on water, particularly wadi flooding. Thank you for all of the opportunities you gave me.
Professor Nelson Graburn, thank for your patient and constant support and feedback. You made
time for me even when you were busy traveling and giving talks. Your regular updates about
Oman’s tourism projects and your feedback have opened my eyes regarding the potential of
tourism in Oman.
I am very thankful to Sultan Qaboos University, Oman, for funding this research and giving me
the opportunity to pursue my studies. I am thankful for additional funding from University of
California, Berkeley, which provided me with a fund to cover my sixth year on the Ph.D. journey
and I am very grateful for the Department of Landscape Architecture and Environmental
Planning for their support
I would like to extend my warmest thanks to the Com. Rabeea Al Agbari of the National
Authority Survey (NSA), Com. Juma Al Busidi at the National Hydrographic Office (NHO), and
the Ministry of Regional Municipalities & Water Resources (MRMWR) in Dhofar for their help
and support and for facilitating the process of providing the data for me.
My loving thanks are due to my mom, brother, sister, and all my family and friends in Oman.
Last, I offer my thankfulness for all of those who supported me in any respect during this
wonderful journey and kept me happy.
1
CHAPTER 1
1.1 Introduction
Climate change impacts have been increasing since the 20th century and continue to accelerate.
Even though many countries are focusing on reducing greenhouse gas (GHG) emissions, the
impacts of climate change on infrastructure and cities has not yet been mitigated, due to
adaptations to climate change not being widely implemented in planning and development. For
example, the impacts of climate change on Asia’s urban areas, infrastructure, and populations are
inevitable, and concern should be paramount given that these large cities contain the majority of
population and the greatest regions of development (Revi et al., 2014; Tyler & Moench, 2012).
According to Tyler and Moench (2012) the necessity of increasing investment in infrastructure
capacity and raising competencies is facing climate change impacts on urban areas and their
infrastructure. Land degradation in the Arab Region is continuing at an accelerated rate due to
failures in devising and implementing resource management policies and because of the use of
inappropriate technologies (Abahussain et al., 2002). Because the climate is changing, it is
essential to integrate science when planning infrastructure and development, to achieve
efficiency and resilience. This research studies a site located in Dhofar, in the southern part of
Oman, where a lack of infrastructure resilience was demonstrated following a substantial storm
in 2002. The term resilience1 has been defined as the ability of a system to withstand external
forces that are outside the norm, such as storm events, while maintaining its functionality during
an extreme event (Chang, 2014); or as the system’s ability to regain functionality rapidly after an
event (McDaniels et al., 2008).
When modern development in Oman began, the county adopted the concept of sustainable
development (SD) in its strategic development planning. Oman believes that applying SD
principles are the pathway to a sustainable future. Yet despite the professed popularity of SD
concepts, neither conventional development planning, nor environmental planning demonstrates
the integration of environmental concepts (Slocombe, 1993). A lack of emphasis on creating
resilient cities and infrastructure that are capable of withstanding expected climactic events, is
evident throughout Oman.
1The term resilience has been defined as the ability of a system to withstand external forces that are outside the
norm, such as storm events, while maintaining its functionality during an extreme event (Chang, 2014); or as the
system’s ability to regain functionality rapidly after an event (McDaniels et al., 2008).
2
Oman’s professed enthusiasm for applying SD principles to strategic developmental planning is
perhaps grounded in a desire to diversify the economy. Science has influenced policy for some
time, as is apparent in Oman’s national survey projects that are used to inform sustainable
economic development, such as Integrated Coastal Zone (ICZ) development for the entire
country. In 2005 a National Tourism Development Plan was formulated to integrate tourism as
an aspect of sustainable socioeconomic development. The integration of science into the realms
of natural, physical, and social policy has been effective in achieving informed policy and
regulations (Holmes & Clark, 2008). It is clear that the government and policy makers saw the
significance of integrating science in achieving the country’s target goals, in that science
provided a deepened understanding of, and solutions to, both current issues and those that are
expected to be encountered in the future. However, in Oman, most of these science-driven
policies are directed toward achieving sustainable economic development, with little emphasis
being placed on using science as a tool for building resilient infrastructure and cities that are
capable of serving future generations cities that are resilient in the face of the consequences of
climate change such as frequent flash wadi flooding and sea level rise (SLR).
Natural disasters serve as an alarm, delivering good lessons for policy makers and planners to
plan proactively for climate change and to encourage the building of resilient infrastructure.
Even though rain in excess of 50 mm per day is rare in Oman, when it does take place, the
consequences are severe, and include flash flooding, human and infrastructural devastation, and
land and environmental degradation (Kwarteng, Dorvlo, & Vijaya Kumar, 2009). That being
said, Oman is a country with a history of various cyclonic and storm events that have resulted in
tremendous infrastructural damage, disruption of human life, and loss of crops and animals. For
example, cyclonic storms took place in 1963 in Dhofar, in 1977 in Masirah, in 2002 in Dhofar,
and in 2007, 2010, and 2015 in Muscat. Oman’s mitigation strategy emphasized identifying risks
and responding through defensive measures in a reactive manner rather than implementing
proactive planning. The logic here followed that it is easier to mitigate the impacts of climate
change than to adapt the entire system to make it less vulnerable (Parry, 2007). The reactive
approach takes action to adopt in response to an existing impact or stimulus, whereas the
proactive approach is triggers changes made for the long-term, in expectation of climate change
or readiness for non-anticipated events (Berrang-Ford, Ford, & Paterson, 2011). Reactive
strategies temporarily reduce rather than eliminate the risk in potentially hazardous areas (Klein,
Nicholls, & Thomalla, 2003). For example, after the 2002 storm events in Dhofar, construction
of dams were used as a mitigation strategy to preclude future events. This approach has given the
country the perception that the flooding problems have been solved and has recently stimulated
the development of many new coastal infrastructure projects.
Frequent exposure to flash flooding of wadi, often the result of cyclones or short-term extreme
weather events, serves to illustrate Oman’s inability to mitigate such events. Measuring exposure
due to projected future Sea Level Rise (SLR) resulting from climate change, reveals
vulnerabilities of Oman’s population, cities, and infrastructure. These flood events also
demonstrate the urgency of the need for Oman to adapt to the consequences of climate change.
Only through acceptance of and preparation for the coming changes can Oman create resilient
infrastructure. Oman’s adoption of the reactive approach in facing any unpredicted challenges
indicates that the country needs to strengthen the relationships among sciences, planning, and
3
policy. To integrate science more fully into new strategies for planning development and
building infrastructure, beyond strictly planning for economic development.
The current developmental planning approaches in Oman are still incapable of handling the
uncertainty of natural hazards resulting from climate change. The potential magnitude of the
damage and destruction to the built area, cities, and infrastructure is not an acceptable risk for
Oman to take, especially in the currently unstable economy and with oil prices fluctuating.
Oman’s current and future infrastructure and developmental planning are highly vulnerable
given the country’s current developmental pathway. Since the inception of environmental
planning, people have been challenged to ascertain the causes and effects of environmental
problems. This has led to a change in the natural order and process, in which it was assumed that
nature would be resilient and would acclimate to the results of human interference. Once several
crises occurred, it became apparent that each crisis could not realistically be viewed in isolation
from a broader context. To solve environmental problems we must cautiously adapt to
anticipated futures (Briassoulis, 1989). The concept of creating a balance between long-term and
short-term, proactive and reactive, adaptation options is discussed by Lioubimtseva and Henebry
(2009). Oman’s ability to adjust to the unseen impacts of climate change by maintaining stability
between long-term and short-term adaption actions, is a first step toward designing resilient
infrastructure and sustainable cities. Relying on a reactive approach will result in adverse
environmental changes in the longer term and likely increased infrastructure vulnerabilities. This
could hinder Oman’s strategic developmental planning progress, and cost Oman an enormous
amount as the country is forced to fix the aftermath of impactful events. Planning to adapt for
climate change impacts, on the other hand, would contribute to the country’s well-being by
reducing the risks and financial costs associated with global climate change.
There is a need to protect cities and infrastructure from climate change consequences. Discussion
has already begun among researchers regarding the need to think beyond the modification of
physical structures. Work must be undertaken to improve planning strategies, governance
processes, and built structures to be ready to adapt to the impact of climate change on cities and
infrastructure (Birkmann, Garschagen, Kraas, & Quang, 2010). This means it is time for Oman
to change its adaptation direction from being reactive to being proactive. Planning for reactive
adaptations takes place when there is no government intervention, whereas proactive adaption
planning results when the government intervenes (Berrang-Ford et al., 2011). Oman is unique
here as, government intervene at the reactive approach level. Since Oman’s government is
already involved, effective and early may be possible. This research will hopefully motivate
Oman to take a more proactive approach in adapting for future climatic changes. A shift in
approach should serve to reduce the likelihood of sea level rise and of flooding resulting from
natural hazards, moving Oman toward developing longer term resilient cities and infrastructure.
1.2 Problem Statement
Natural hazards cause significant loss of life and setbacks to economic and social development in
many countries. Weather, water, and climate disasters contribute annually to 90% of the total
number of disasters, 70% of the two million casualties, and 75% of economic loss (Golnaraghi,
2012). The human and environmental damage resulting from Cyclone Gonu in 2007 and from a
4
Cyclonic Storm ARB 01 in 2002, showed Oman’s vulnerability to climate change and natural
hazards. This lead to the recognition for the need for precautions and for the integration of
science within Oman’s strategic developmental plans. The vulnerability of the Omani coastal
zone, for instance, is also related to the area’s socioeconomic significance. Sixty-seven percent
of the Omani population resides along the coast; population growth, infrastructure development,
and economic activity, for example the fisheries and tourism industries, are also clustered in the
coastal area (Al-Jufaili et al., 1999; Al-Shaqsi, 2010). The growth and expansion of coastal cities
means that people, the built environment, and the ecosystem are vulnerable to natural disasters
that may take place. Specifically, there is a need to assess Oman’s planning practices. According
to Belqacem (2010), planning in Oman is based on the assumption of a constant, arid climate and
normal weather conditions; such planning has previously been adequate due to the country’s
geographic location, which meant that natural disasters were rare. As a result, Oman’s urban
planners rarely take into account the natural disasters that might occur as a result of climate
change.
Charabi and Al-Hatrushi (2010) stated that “literature and scientific knowledge concerning the
climate of Oman are limited, incomplete and scattered” (p. 472). Yet, the literature demonstrates
awareness of the influence of climate change in Oman in terms of frequent and intense cyclones
(Al-Maskari, 2010; Al-Shaqsi, 2010; Bailey, 1988; Dibajnia, Soltanpour, Nairn, & Allahyar,
2010; Fritz, Blount, Albusaidi, & Al-Harthy, 2010; Membery, 2001). However, few studies have
been conducted in an effort to understand the consequences of climate change, including
potential sea level rise inundation and wadi flash flooding, and the potential impacts on existing
and future coastal development and infrastructure. This research aims to encourage and
demonstrate how Oman can integrate science, as the underlying process, into urban
infrastructure, and developmental planning. This research demonstrates a proactive approach to
measuring and quantifying future climate change impacts that lead to minimizing human loss,
property loss, and the disturbance or destruction of both private and public coastal infrastructure.
Such an approach will hopefully become an integral process within Oman’s developmental
planning.
Moreover, this study answers the following question: Given Oman’s current environmental
challenges and its geographic location, how can science be integrated as part of the underlying
process of creating policy within Oman’s planning practices. In addition, the results of this
research map and encourage the adoption of resilient building practices within the country’s
infrastructure.
1.3 Research Contributions
This research downscales models and maps at a very fine spatial scale the impacts of extreme
storm events in Oman’s future. Downscaled sea level rise (SLR) estimates, based on future
climate change predictions from the Intergovernmental Panel on Climate Change (IPCC), are
used to estimate storm surges to the year 2100. We specifically map and model Dhofar’s
vulnerability to SLR and wadi flash flooding using real-time data from a 2002 storm event to
calibrate our model. We employ our scientific SLR and storm surge estimates to analyze and
evaluate the resilience of the coastal infrastructure of Dhofar. We question whether current
policies, plans, and designs are sustainable under conditions of climate change, specifically SLR,
5
storm surge and wadi flash flooding. This research demonstrates an approach to enhancing
planning and design by integrating science into the process. As a result, Oman can better locate
future infrastructure development in a way that will achieve resiliency.
This research integrates high-resolution surface modeling with high-resolution 3 dimensional,
dynamic hydrology modeling and applies it as a regional scale to assist planning, design and
policy issues affected by extreme storm events and SLR. In addition, this research introduces
high resolution flood modeling within the wadi where extreme storm events can quickly turn a
watershed into a flash flood. These landscape models are built, processed and eventually
visualized within a GIS environment at a very high spatial resolution, not common in planning.
The contribution here allows not only for regional decision-making but also for the localized
quantification of impacts of storms to infrastructure at the building level. This resolution
produces spatial products that directly impact landscape design decisions at the sub-parcel level.
This research provides a process and direction for Oman’s planning with regards to adapting to
climate change and encouraging resilient infrastructure for the future. Only with accurate data
and the integration of science into Oman’s strategic development planning can successful
policies for the protection and safe transformation of the country’s infrastructure be realized.
This generalization of the approach taken here can benefit other countries facing similar
challenges. Other Gulf States are good candidates for this as they share similar social, economic,
political, and environmental situations with Oman.
1.4 Research Outline
This dissertation consists of four independent research chapters. Chapter 2 presents a review of
the literature addressing resilient infrastructure as an aspect of sustainable development (SD) in
Oman. Included is a review of sustainable development principles, the significance of integrating
resilient infrastructure to align with sustainable development principles, Oman’s attempts to
achieve SD, and discussion of the piece of SD that is lacking in Oman—resilient infrastructure.
The chapter concludes with recommendations for the Omani government about how to integrate
resilience into their infrastructure with their strategic developmental planning rather than being
focused on sustainability only in terms of the economy.
Chapter 3 of the thesis covers a case study of modeling the SLR and the storm surge of the 2002
cyclone along Dhofar’s coast. A 3 dimensional hydrodynamic model (3Di) simulation software
tool is used. The hydrodynamic modeling is based on 60-minute interval water level data for a
72-hour, extreme storm event, coupled with 0.5 meter, 1.0 meter, and 1.41 meter SLR for
different inundation scenarios. This chapter offers a visual representation of SLR and storm
surge inundation resulting from a 2002 cyclone. In addition, the storm’s impact on buildings and
roads in Dhofar’s Governance is documented here.
Chapters 4 covers the impacts of projected SLR scenarios and storm surge on some of the tourist
beach resorts along Dhofar’s costal area and proposes that science and calculating resilience, can
be incorporated into coastal tourism development plans in Oman.

6
Chapter 5 includes simulations of the 2002 flash wadi flood for the Zayk and Ghadow
watersheds in Dhofar in association with SLR projection. The simulations quantify the effect of
the 2002 wadi flash flooding on urban and agricultural lands; the simulations use a 3Di
hydrodynamic model and provided visual representation of flash flooding and its consequences
on the wadi every hour.
Finally, Chapter 6 provides the conclusions of the study and recommendations for future
research.
7
CHAPTER 2
2.1 Introduction
Since sustainable development (SD) theory was developed in 1987 by the World Commission on
Environment and Development, it has become a popular idea among the international
community and policy makers. The emergence of this theory has been helpful in addressing
various global issues in relation to the economy, the environment, and society. Therefore, the
term sustainable development has been used widely in sustainability planning; however,
discerning the best way to implement sustainability in planning is subjective and is confusing for
decision makers.
The term sustainable development is defined in different ways. The most commonly cited
definition was offered by the United Nation’s World Commission on Environment and
Development (WCED) in Our Common Future, also known as the Brundtland Report, that
describes sustainable development as the “ability to make development sustainable to ensure that
it meets the needs of the present generations without compromising the ability of future
generations to meet their own needs” (WCED, 1987, p. 15). This definition was embraced by
many countries, including Oman, as is evidenced by their initiating sustainable development in
their policies.
Generally, the term sustainability is used in planning to indicate sustainable development in
various realms; however, the term is interpreted subjectively. As Quaddus and Siddique (2001)
noted, sustainable development relies on the interpretation and the understanding of planners or
policymakers. For example, in Italy, planners had focused on natural resources analysis by
adopting the ultimate environmental threshold (UET) as a sustainable planning process to
achieve sustainable land use (Senes & Toccolini, 1998). Policy makers and planners are
anticipated to be able to draw a balance among the economy, quality of life, protection of the
environment, and preservation of natural resources for future generations. But the reality is that
making decisions in relation to sustainable development is challenging due to external factors
beyond their control, such as extreme natural hazards.
Although the definition of sustainable development indicates consciousness of the natural
environment, the economy, and society, it does not lay out how to approach a balance among
these three elements of SD. According to Santillo (2007), to achieve sustainable development, a
simultaneous linkage among the economy, the environment, and social well-being is required.
Therefore, many countries are facing challenges in creating a balance among the three elements
of SD since it is influenced by the country’s own interests. Applying SD elements alone is not
enough to achieve SD; awareness of infrastructure resilience is crucial if SD goals are to be
achieved.
The term resilience has been defined as the ability of a system to withstand external forces that
are outside the norm, such as storm events, while maintaining its functionality during an extreme
event (Chang, 2014); or as the system’s ability to regain functionality rapidly after an event
(McDaniels et al., 2008). Holling (1996) described resilience from two perspectives: that of
engineering resilience, and that of ecological resilience. These two perspectives are deviating
8
from one another because engineering resilience is based on long-term infrastructural efficiency,
constancy, and predictability, whereas ecological resilience is built on persistence, change, and
unpredictability. Even though the resilience of infrastructure and of ecology appear to contradict
one another, in real life they do coexist within one system; so achieving a mutual relationship
between these two will provide safe connection between the natural and built environment, and
people.
The idea of creating resilient infrastructure has emerged in response to natural hazards associated
with climate change impacts on infrastructure. Scholars have begun to implement proactive
planning to move toward resilient infrastructure; for example, Biging, Radke, and Lee (2012)
conducted a study to investigate the impacts of predicted sea level rise (SLR) and extreme storm
events on the transportation infrastructure in the San Francisco Bay region, and they
recommended to the government of California that it stop maintaining vulnerable infrastructure
transportation and instead build new roads that will not be vulnerable to SLR in the next 100
years. This example clearly indicates that adopting resilience infrastructure theory can help save
money in the long run and reduce the disruption of daily life.
The world has witnessed increasing natural hazard events that cause a crisis. In 2001, a universal
survey was conducted that showed that 700 natural disasters took place. These disasters were
combined with huge losses, resulting in 25,000 deaths, $36 billion in economic losses, and $11.5
billion in insured losses (Godschalk, 2003). Many countries face economic losses related to
natural hazards as a result of the vulnerability of their infrastructure, which is evidence of the
lack of inclusion of resilient infrastructure awareness in their sustainable development policy.
This paper discusses how Oman’s sustainable development strategy is missing the component of
resilient infrastructure.
Currently in Oman, whenever there are major or minor natural hazards, the infrastructure is often
severely impacted and requires expensive repair and maintenance. This action is in conflict with
the definition of sustainability and infrastructure resiliency. In the case of Oman, implementing
the three elements of sustainable development is challenging because it has an oil-based
economy along with challenging physical topography. Most of Oman’s national development,
including its infrastructure, is reliant on unsustainable oil revenue, and any crisis in oil prices has
a significant impact on strategic developmental plans. Even though Oman is using oil revenue to
build its infrastructure, the country’s inability—or unwillingness—to build resilient
infrastructure is what threatens sustainable development in Oman.
Much like the rest of the world, Oman has witnessed various natural hazards events such as
cyclones Gonu in 2007, Phet in 2010, and Ashoba in 2015. These cyclones affected the
infrastructure and daily life across the country and required a long time for recovery and return to
normal life. As a result, these events cost the country a great deal of money: $4 billion in 2007
and $1 billion in 2010, and the 2002 extreme event cost about $25 million dollars, just to
maintain the basic infrastructure (AlShaqsi, 2010). These severe impacts demonstrate the
significance of Oman’s missing resiliency in its infrastructure development: Long-term
functionality after an event is not present.
9
Since the sustainable development portion of Oman’s strategic development planning mainly
focused on diversification of the economy and sustainable socioeconomic development, this
paper argues that this strategy led the country to underestimate the need to incorporate resilient
infrastructure within the national development strategy planning. It also argues that any new
developmental project in Oman has inherited the similar goals of focusing on sustainable
socioeconomic development.
This paper focuses on understanding resilient infrastructure as an aspect of sustainable
development in Oman, and it is organized as follows. The second section reviews the literature
on resilient infrastructure and its importance to sustainable development. The third section
discusses the application of sustainable development to Oman. The fourth section provides an
overview of sustainable development in Oman and its lack of resilient infrastructure. The fifth
section goes over the urgent need for resilience in Oman. Finally, section six presents the
conclusion of the paper.
2.2 Resilient Infrastructure and Its Importance to Sustainable Development
To understand the contribution of resilient infrastructure to sustainable development, we need
first to review elements of sustainable development such as the theory’s application within social
and environmental contexts.
2.2.1 Sustainable Development Interpretations and Applications
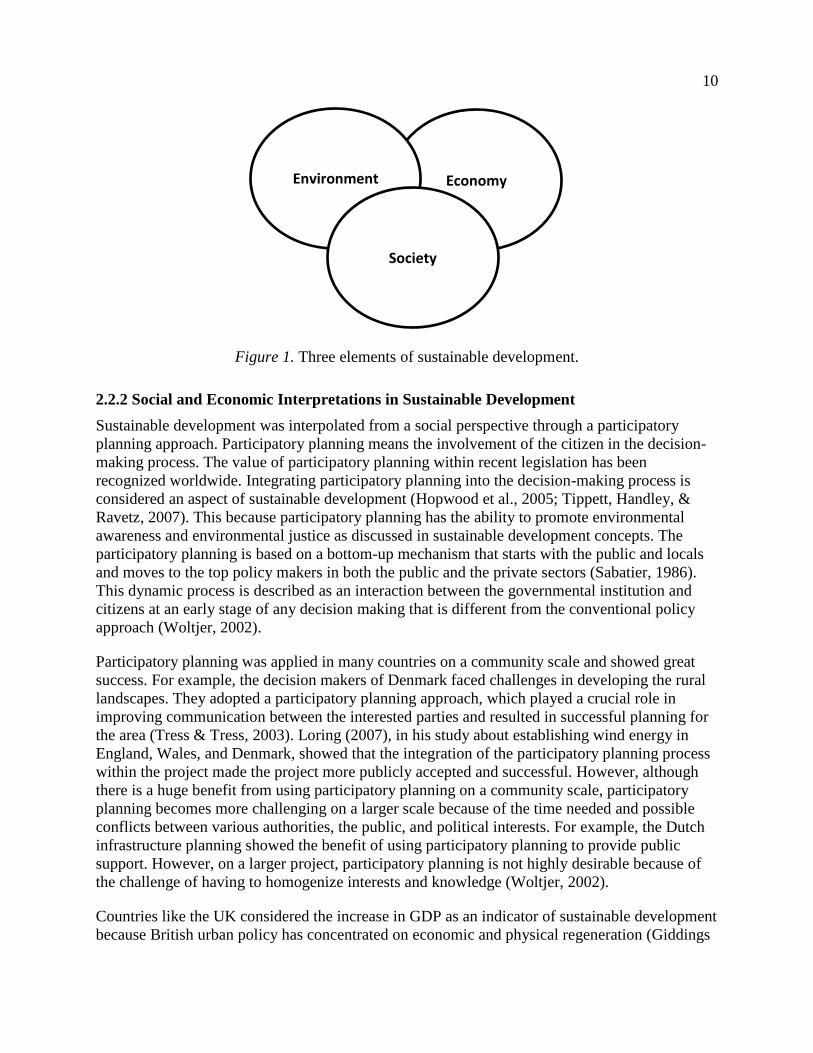
Sustainable Development is mostly concerned with both environmental and socioeconomic
issues. SD had been understood as comprising entities—the environment, the economy, and
society—that were both separate and connected, with a balanced intersection among them (see
Figure 1). Sustainable development debates usually prioritize either the environment or the
economy. According to Neumayer (2003), most often the economy takes priority in policies, and
the environment and society are treated as separate elements that will benefit from a strong
economy. For example, Agenda 21 agreements at the Rio Conference included issues having to
do with social and economic development, strengthening participation, and means of
implementation (Grubb, 1993). As a result, sustainable development is embraced by big
business, governments, social reformers, and environmental activists.
This study agrees with Giddings, Hopwood, and O’Brien (2002), who suggested that the
interpretation and implementation of sustainable development is subjective and that the three
elements of sustainable development are not properly connected and are treated differently at
various levels. Within the SD concept, the environment and society are focused on social equity
and environmental justice (Hopwood, Mellor, & O’Brien, 2005). Garcia-Ruiz et al. (1996)
showed at Central Spanish Pyrenees that sustainable development is achieved by focusing on
environmental issues within land use planning. Bilgen, Keleş, Kaygusuz, Sarı, and Kaygusuz
(2008) cited the use of renewable energy to reduce environmental pollution as a sign of
sustainable development in Turkey. Within developed countries, environmentalists advocated for
the preservation of wild animals and wilderness as a sustainable development requirement
(Howarth & Norgaard, 1992). These studies show how varied interpretations can be of SD from
an environmental perspective.
10
Figure 1. Three elements of sustainable development.
2.2.2 Social and Economic Interpretations in Sustainable Development
Sustainable development was interpolated from a social perspective through a participatory
planning approach. Participatory planning means the involvement of the citizen in the decision-
making process. The value of participatory planning within recent legislation has been
recognized worldwide. Integrating participatory planning into the decision-making process is
considered an aspect of sustainable development (Hopwood et al., 2005; Tippett, Handley, &
Ravetz, 2007). This because participatory planning has the ability to promote environmental
awareness and environmental justice as discussed in sustainable development concepts. The
participatory planning is based on a bottom-up mechanism that starts with the public and locals
and moves to the top policy makers in both the public and the private sectors (Sabatier, 1986).
This dynamic process is described as an interaction between the governmental institution and
citizens at an early stage of any decision making that is different from the conventional policy
approach (Woltjer, 2002).
Participatory planning was applied in many countries on a community scale and showed great
success. For example, the decision makers of Denmark faced challenges in developing the rural
landscapes. They adopted a participatory planning approach, which played a crucial role in
improving communication between the interested parties and resulted in successful planning for
the area (Tress & Tress, 2003). Loring (2007), in his study about establishing wind energy in
England, Wales, and Denmark, showed that the integration of the participatory planning process
within the project made the project more publicly accepted and successful. However, although
there is a huge benefit from using participatory planning on a community scale, participatory
planning becomes more challenging on a larger scale because of the time needed and possible
conflicts between various authorities, the public, and political interests. For example, the Dutch
infrastructure planning showed the benefit of using participatory planning to provide public
support. However, on a larger project, participatory planning is not highly desirable because of
the challenge of having to homogenize interests and knowledge (Woltjer, 2002).
Countries like the UK considered the increase in GDP as an indicator of sustainable development
because British urban policy has concentrated on economic and physical regeneration (Giddings
Economy Environment
Society
11
et al., 2002). Attention must be paid to creating resilient built environments and infrastructure,
and to the role and contribution of resilient infrastructure in sustainable development. Such
attention is warranted because the goal of economy prosperity and sustainable socioeconomic
development is to create an infrastructure that will serve these conditions. If the infrastructure is
not resilient, a sustainable socioeconomic status cannot be achieved due to the instability of the
context. We argue sustainable development cannot be achieved without resilient infrastructure,
and without resilient infrastructure, sustainable socioeconomic conditions cannot be achieved.
2.2.3 Significance of Resilient Infrastructure to Sustainable Development
Resilient infrastructure is an aspect of sustainable development. The impact of climate change on
infrastructure is no longer only a local matter for certain regions, but has become a global issue
that is subject to external variables. No nation in the world is immune to catastrophic natural
events. However, the destruction of infrastructure caused by these events can be reduced to
lessen economic loss and minimize the effects on daily life. The physical infrastructure is a
representation of a modern society that functions to serve people. Having a sustainable and
resilient infrastructure is crucial as countries develop.
Resilience is an “ability to bounce back or to overcome adversity” (McCubbin, 2001, p. 3).
Specifically, resilience in regard to infrastructure focuses on three elements: performance of a
system under stress; consequences of this stress on the system and return to normality; and scale
and affordability of required response (Hansen & Neale, 2014; Lokuge & Setunge, 2013;
McDaniels et al., 2008). Whenever an extreme event takes place, it goes in parallel with
economic loss and devastation of everyday life. The world has already experienced various
extreme natural hazards events that caused severe economic losses, such as the 2009 floods in
Jeddah, Saudi Arabia; Hurricane Katrina in the southeastern portion of the United States in 2005;
Hurricane Sandy in 2012, in New York, U.S.A; and flooding in the UK and Ireland from extreme
storms in 2012 and 2015. All these extreme events alerted us to the need for resilient
infrastructure because they caused huge disruption to critical infrastructure that cost millions to
billions of dollars to repair. In the case of floods in the summer of 2007 in the UK, the damage
cost about $3.5 billion; the flood disaster in 2009 in Australia that caused infrastructure damage
cost $6.8 billion; and natural events in the USA in 2012 cost about $400 million in damages
(Bissell, 2010; Lokuge & Setunge, 2013; Sullivan & Uccellini, 2013).
Infrastructure is the interface between humans and the environment (Chambers et al., 2008). A
city has resilient infrastructure when it is able to respond, recover, and adapt fast to a major
storm, and is able to reduce the risk of significant damage from future storm events (Hurricane
Sandy Rebuilding Task Force, 2013). In other words, resilience is reflected by being able to
predict prior to an event; being able to resist, absorb, and adapt to it; and being able to recover
rapidly. On the other hand, sustainability requires the capability to ensure long-term viability in
social, economic, and environmental contexts, which requires consideration of the consequences
associated with climate change (Hurricane Sandy Rebuilding Task Force, 2013). Infrastructural
resilience is measured in terms of its ability to maintain its functionality and ability to return to
normality after an event (McDaniels et al., 2008). Thus, a proactive approach is a requirement of
resilient infrastructure because failure in infrastructure represents its inability to adapt to changes
in the real world (Madni & Jackson, 2009). Therefore, resilient infrastructure contributes
positively toward the principle of sustainable development.
12
The developed countries incorporated the concept of resilient infrastructure and got fruitful
results. For instance, Australia understood the importance of resilient infrastructure, specifically
in terms of transportation, for promoting community resilience to reduce impacts on daily life
through strengthening rural roads and bridges (Lokuge & Setunge, 2013). Approaches such as
this have the potential to minimize social destruction and allow for rapid recovery after an
extreme event. In 2011, the UK took a step toward creating a resilient infrastructure by
publishing a national infrastructure plan that indicated the need for decision makers to integrate
resilience at all stages of the project life cycle, and to allocate funding at the early stages of
planning and conceptual design (Hansen & Neale, 2014). We concur with scholars who
suggested the need for designing infrastructure is proactive, reactive, and adaptive to get
resiliency into our infrastructure (Cormie et al., 2012; da Silva, Kernaghan, & Luque, 2012;
Hansen & Neale, 2014; McDaniels et al., 2008).
Bosher (2008) suggested that in countries like Bangladesh and in slum areas in India, the lack of
choice contributes to being not resilient socially and with respect to infrastructure. In the oil
producing countries in the Gulf, environmental constraints also contribute to the notion of lack of
choice. For example, in Saudi Arabia, the 2009 flooding in Jeddah caused about $3 billion in
infrastructural damage. The government lacked choice because of the area’s topography: Urban
settlements were distributed without regard for any natural risk that might occur, resulting in
post-event disadvantages for citizens and the infrastructure (Al Saud, 2010). The flood disaster in
Jeddah proves the country is not prepared to deal with natural disasters. The country responded
by improving its preparedness for and abilities to respond to natural and manmade disasters
(Abosuliman, Kumar, Alam, & Rasjidin, 2013; Momani & Fadil, 2010). This indicated a reactive
approach, and one that still failed to promote proactive planning and a response that would move
the country toward developing resiliency and a sustainable infrastructure.
The case of Oman is similar to that of Saudi Arabia in that the allocation of some residential,
infrastructural, and economic developments are within the wadi watershed and along the coastal
area due to Oman’s topographical challenges: 82% of Oman is desert, 15% is mountainous, and
3% is coastal (AlSuheili, 2015; Al-Qurashi, 2014). For example, some of the tourist and
infrastructure project allocations rely on using the natural asset of its location and. At the same
time, Oman is approaching sustainable development through sustainable social and economic
conditions. However, these projects lack the principle of resilient infrastructure. Resilient
infrastructure should be a requirement in these projects since their resilience is what will help
Oman move toward a sustainable socio-economic status.
Bosher et al. (2007) stated that damage from flooding is greater than from any other natural
disaster. For that reason, resilience must be integrated within the planning and design processes
and not added after an event. This idea complements McHarg’s (1971) idea of being in harmony
with nature, which, as he explains in his book Design with Nature, helps to mitigate impacts
from natural disasters. A collaborative effort among city planners, engineers, architects,
developers, and decision makers can help to increase knowledge and awareness of resilient
infrastructure planning and design (Burby, Deyle, Godschalk, & Olshansky, 2000; Godschalk,
2003). Being proactive and adaptive in planning is the path to resilient infrastructure. According
to one study, an increase in expenditure now can reduce long-term costs, and long-term planning
will be rewarded by long-term gains (Cormie et al., 2012). The infrastructure we develop now, if
13
it is resilient, has the potential to provide flexibility, to add security, and to be adaptable to
uncertainties of future scenarios related to climate change. We agree with Chambers et al.’s
(2008) suggestion of uniting resilient infrastructure through “good engineering” with sustainable
development principles to contribute toward resilient and adaptable cities that are able to
mitigate the impact of climate change.
2.3 Oman’s Application to Sustainable Development
Before 1970, Oman lacked basic infrastructure. After 1970, development in Oman moved at a
slow rate even though modern development started in 1970 when His Majesty Sultan Qaboos
came to power (Tear & Forester, 1992). This is due to the fact that during the 1970s we saw a
combination of minimal financial resources and various political problems and civil war.
However, upon the end of the civil war, the country started to look for ways to improve
development, and to diversify the economy by integrating and using natural resources. The main
challenge at that time was the lack of planning and direction in Oman, which are considered
among the first obstacles for the new government (Allen, 1987). Nevertheless, the new
government led by His Majesty Sultan Qaboos coupled with the introduction of oil to the
national economy in 1967, contributed to rapid development in Oman.
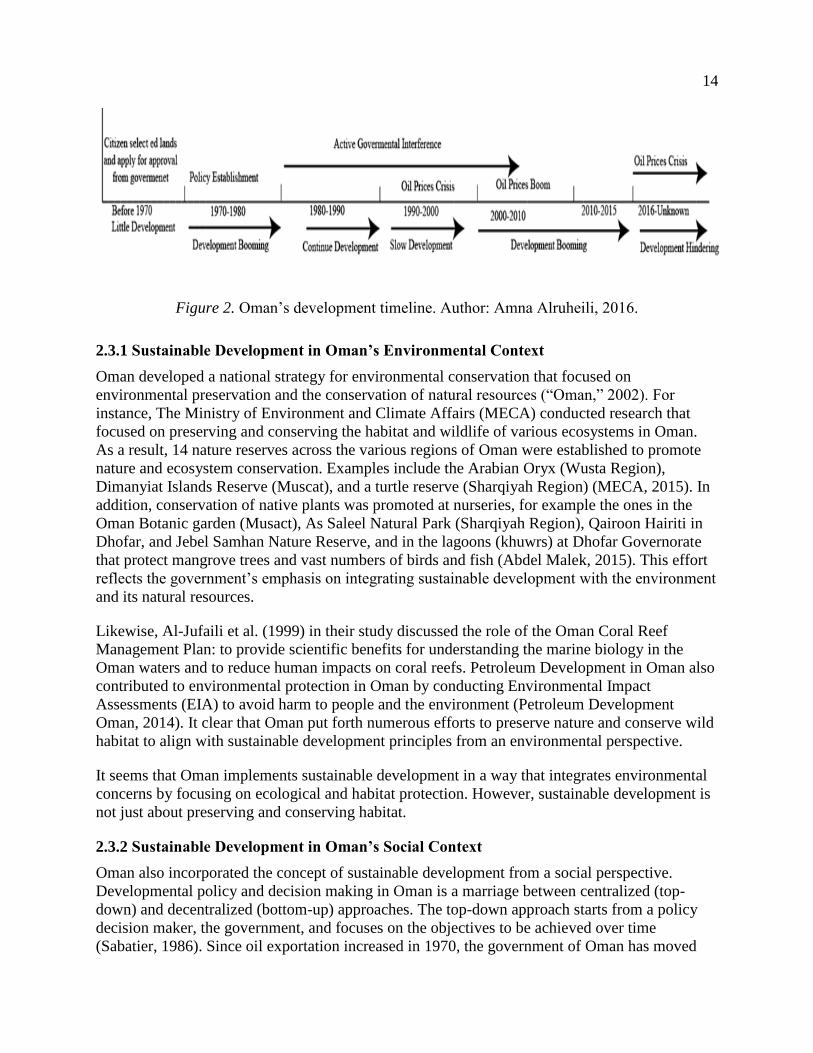
Oman is still undergoing major infrastructural developments as the country continues to build
(see Figure 2) across its regions and governance is seen in the strategic development plans.
However, the new development is taking the same process and path as older development. The
new structures are not resilient; they are based on old survey maps created since 1980s through
ICZMP (Salm, 1989); and they are located within areas that are vulnerable areas to SLR and
flash wadi flooding. Omani people are noticeably sensitive about their land and natural
resources. They did not allow construction on fertile land (Al Gharibi, 2014). For that reason,
people are actually building among the rock surfaces and keep the lowlands for their oasis and
farms; as is the case of Manah (Bandyopadhyay, 2010). If these practices are continuing and
implemented now, Oman will be the most resilient country with citizens able to understand their
topography, watershed, and environment, and actually apply McHarg’s ideas regarding
combining design with nature.
To further national development, Oman’s government implemented a 5-year strategic
development framework. Almost all of the strategic development planning is required to
integrate economic factors (Allen, 1987). For that reason, Oman underwent a significant increase
in development and building of infrastructure; the transportation sector achieved the highest
development across the country. For example, Oman allocated about US$78 billion for the
development of roads, ports, and airport infrastructure, as had been outlined in the Oman’s eight
strategic development plan (BI-ME, 2013; Palmieri, 2012). Much like the rest of the world,
Oman has embraced the concept of sustainable development and continues to put effort toward
it.
14
Figure 2. Oman’s development timeline. Author: Amna Alruheili, 2016.
2.3.1 Sustainable Development in Oman’s Environmental Context
Oman developed a national strategy for environmental conservation that focused on
environmental preservation and the conservation of natural resources (“Oman,” 2002). For
instance, The Ministry of Environment and Climate Affairs (MECA) conducted research that
focused on preserving and conserving the habitat and wildlife of various ecosystems in Oman.
As a result, 14 nature reserves across the various regions of Oman were established to promote
nature and ecosystem conservation. Examples include the Arabian Oryx (Wusta Region),
Dimanyiat Islands Reserve (Muscat), and a turtle reserve (Sharqiyah Region) (MECA, 2015). In
addition, conservation of native plants was promoted at nurseries, for example the ones in the
Oman Botanic garden (Musact), As Saleel Natural Park (Sharqiyah Region), Qairoon Hairiti in
Dhofar, and Jebel Samhan Nature Reserve, and in the lagoons (khuwrs) at Dhofar Governorate
that protect mangrove trees and vast numbers of birds and fish (Abdel Malek, 2015). This effort
reflects the government’s emphasis on integrating sustainable development with the environment
and its natural resources.
Likewise, Al-Jufaili et al. (1999) in their study discussed the role of the Oman Coral Reef
Management Plan: to provide scientific benefits for understanding the marine biology in the
Oman waters and to reduce human impacts on coral reefs. Petroleum Development in Oman also
contributed to environmental protection in Oman by conducting Environmental Impact
Assessments (EIA) to avoid harm to people and the environment (Petroleum Development
Oman, 2014). It clear that Oman put forth numerous efforts to preserve nature and conserve wild
habitat to align with sustainable development principles from an environmental perspective.
It seems that Oman implements sustainable development in a way that integrates environmental
concerns by focusing on ecological and habitat protection. However, sustainable development is
not just about preserving and conserving habitat.
2.3.2 Sustainable Development in Oman’s Social Context
Oman also incorporated the concept of sustainable development from a social perspective.
Developmental policy and decision making in Oman is a marriage between centralized (top-
down) and decentralized (bottom-up) approaches. The top-down approach starts from a policy
decision maker, the government, and focuses on the objectives to be achieved over time
(Sabatier, 1986). Since oil exportation increased in 1970, the government of Oman has moved
15
toward centralization to accelerate the country’s shift toward modernity (Allen, 1987). The new
government consists of a Council of Ministers and Majlis Oman, which consists of Majlis
AlDawla and Majlis Al Shura (Consultative Council) (“Greater Powers for Majlis Oman,” 2016;
Rabi, 2002). The Ministers’ Council is the supreme executive authority for the Administrative
Board of the State, as stated by Royal Decree (26/75). It approves the general policy of planning
in the Sultanate and supervises and follows the performance of all governmental units and
ministries in terms of applying their responsibilities and the correlations among them. The policy
is formulated after negotiations between the Sultan and the individual ministers (Metz, 1993).
Before negations take place, policy can be created in one of two ways: 1) Majlis Oman may
propose or draft laws and refer them to the Government (Sultan) for review, and then the
Government shall return the same to the Majlis; or 2) a policy can be created based on draft laws
referred by the Council of Ministers to Majlis Al Shura (Almoharby, 2010). After different
ministries agree upon a policy, the legislations are declared in the form of Royal Decrees. Any
major projects in the country are declared and approved by Royal Decree (Al Gharibi, 2014).
Researchers have suggested implementing participatory planning as one aspect of sustainable
development. Al Shueili (2015) and Al Hadhrami (2006) recommended doing so in Oman.
However, policy and strategic planning in Oman demonstrates a sense of the participatory
planning process already, as it is based on a bottom-up approach that reflects the essence of
participatory planning. Even though we affirm Al Shueili’s (2015) and Al Hadhrami’s (2006)
and Rodriguez’s (2015) findings about the need to strengthen the participatory planning aspects
and move toward sustainability in Oman, we argue that the centralization and decentralization
planning is not the main challenge regarding sustainable development. The country shows some
aspects of these practices within its planning process at various scales. However, the focus in
Oman on modernization and sustainable socioeconomic development has created a government
that perceived sustainable development through the lenses of sustainable socioeconomic
development and economic diversification.
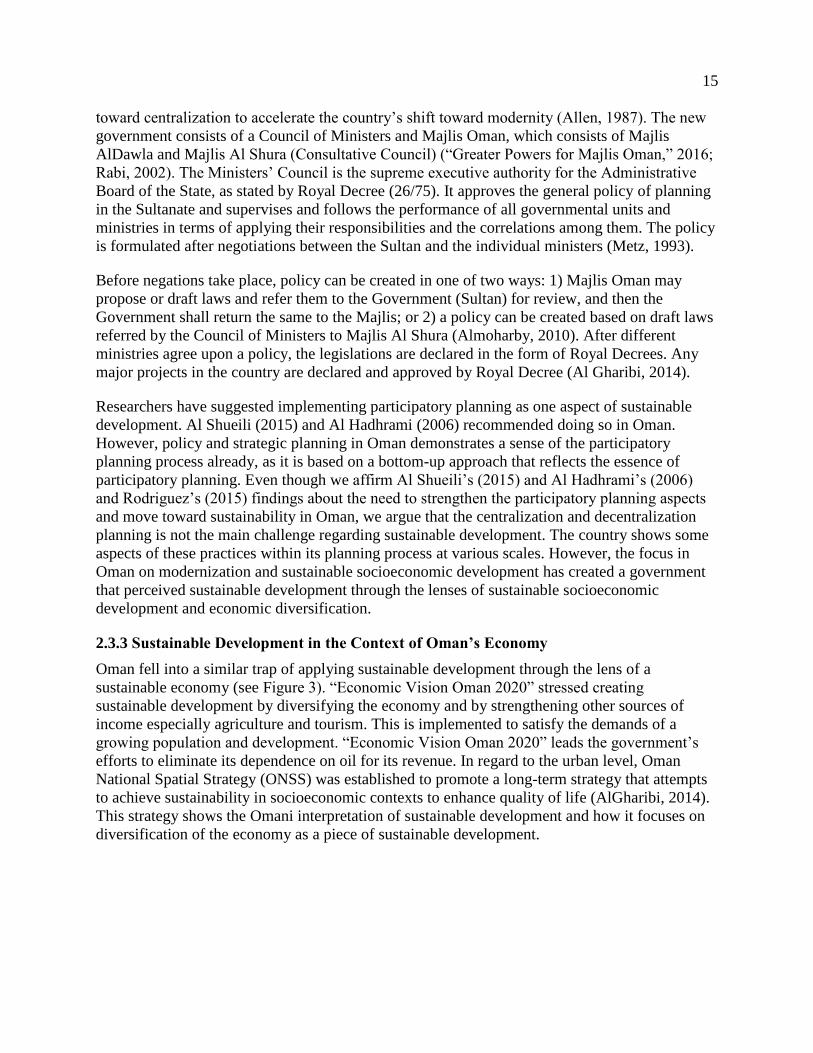
2.3.3 Sustainable Development in the Context of Oman’s Economy
Oman fell into a similar trap of applying sustainable development through the lens of a
sustainable economy (see Figure 3). “Economic Vision Oman 2020” stressed creating
sustainable development by diversifying the economy and by strengthening other sources of
income especially agriculture and tourism. This is implemented to satisfy the demands of a
growing population and development. “Economic Vision Oman 2020” leads the government’s
efforts to eliminate its dependence on oil for its revenue. In regard to the urban level, Oman
National Spatial Strategy (ONSS) was established to promote a long-term strategy that attempts
to achieve sustainability in socioeconomic contexts to enhance quality of life (AlGharibi, 2014).
This strategy shows the Omani interpretation of sustainable development and how it focuses on
diversification of the economy as a piece of sustainable development.
16
Figure 3. Oman’s implementation of the three elements of sustainable development.
As the government continually focused on improving life and infrastructure for the Omani
people, strategic developmental planning was shaped to respond to those issues. The various
strategic development plans in Oman showed a significant trend toward socioeconomic
development planning, with minimal focus on resilient, sustainable infrastructure development.
For example, the first development plan between 1976 and 1980 focused entirely on economic
and infrastructure development and had no focus on environmental or climate change issues. The
second development plan, of 1981–1985, offered the first discussion of regional planning and of
integrating natural resources into development as a way to diversify the economy (MNE, 2008).
It is obvious from the two strategic plans that sustainable development concepts are perceived as
sustaining an advantageous socioeconomic status through diversifying the economy and that no
attention is being paid to resilient infrastructure requirements.
The third development plan, developed between 1986 and 1990, also focused on socioeconomic
elements. It was not until the seventh strategic plan, of 2006–2010, that the government focused
on incorporating environmental criteria into development policies (MNE, 2008). Al Shueili
(2015) noted the existence of a gap between strategic development plans and implementation in
Oman. Despite this gap, the recent strategic development plan of 2016–2020 and the 2040 plan
still show minimal adaptation to the impacts of climate change in the country’s infrastructure and
developmental projects. Indeed, there are no signs of infrastructure resiliency in the newly
developed projects, such the new tourist projects and roads in Salalah, and in other regions as
well.
2.4 The Piece of SD That Is Lacking in Oman: Resilient Infrastructure
The era of oil discovery moved Oman toward vulnerability in the context of climate change and
its impacts on the country’s development, infrastructure, and urban areas. People’s day-to-day
life had changed to a stationary lifestyle that required the establishment of infrastructure to serve
people where they settled. The problem with the acceptance of the settled pattern is that the
chosen locations are prone to natural hazards. As these locations are further developed and
expanded, it became clear that these areas were not well planned, being neither resilient to
natural hazardous events nor having sufficient infrastructure to face the future impacts of the
Economy
Society
Environment
17
consequences of climate change. The necessity of integrating science, or of conducting out site
analysis in a proper way, is neglected in the early planning stages.
As mentioned earlier, Oman is applying the three principles of sustainable development—the
economy, the environment, and society—at different magnitudes, and the diversification of the
economy is dominant. However, Oman’s sustainable development strategy faces various
critiques. For instance, Al Shueili (2015) stated in his Muscat study that in Oman, the path
toward sustainable planning policy is still not clear within the SD context. Even though Oman is
applying the principles of SD, it is not enough to claim that Oman is under the umbrella of
sustainable development. Resilient infrastructure is not included in the country’s strategic
development, and the country’s infrastructures are not resilient in response to the effects of
climate change.
Researchers struggle to come up with a generalized definition of sustainable development. Since
the definition has not included focus on the built environment, almost all sustainable
development efforts have neglected this aspect. Infrastructure is not being taken into
consideration as the county further develops. Resilient infrastructure has not been linked to
sustainable development, a choice that ends up costing the county more from an economic and
an environmental perspective. Continuing efforts to create a sustainable economy will always be
wasted if they are directed toward fixing non-resilient infrastructure after a natural hazard is
exacerbated by climate change.
The role of resilient infrastructure is to reduce vulnerabilities and damage resulting from SLR or
flash wadi flooding. Oman’s focus is on meeting sustainable socioeconomic goals, which means
that Oman is not ready for the repercussions of climate change as they applied to infrastructural
development. Oman does not take care to create resilient infrastructure while implementing their
strategic developmental plans. Actions that the country takes in response to natural hazard
impacts, particularly the 2002 storm in Dhofar, includes building sea walls, building dams, and
re-channelizing wadis (AlHakmani, n.d.). The country’s long-term master plan shows no
evidence of Oman’s ability to guide urban and infrastructure development toward resilience.
Moreover, AlGharibi (2014) suggests that the fragmentation of planning policy among multiple
authorities creates fragmentation of land use and planning that hinders the application of
sustainable development practices. Since the Supreme Council for Planning (SCP) is the core for
both infrastructure and urban planning, fragmentation should not be an issue, because the
fragmentation of agencies can be perceived as a chance for SCP to be informed by
representatives of various regions. But it seems what is missing is SCP’s ability to move its focus
away from Oman’s main strategic sustainable development aim: creating sustainable
socioeconomic conditions (“Supreme Council for Planning Meets,” 2015).
The Supreme Council of Planning, is considered the engine of strategic development in Oman
and relies on the Ministry of Regional Municipalities and Water Resources to issue the required
policy for wadi-flooded areas (Ministry of Regional Municipalities and Water Resources, 2016,
“Specialties”). According to Belqacem (2010), the planning practice in Oman is based on the
assumption of a constant arid climate and normal weather conditions. As a result, Oman’s urban
planners rarely take into account the natural disasters that might occur due to climate change, and
they underestimate the effects of climate change on the country’s infrastructure. Charabi and Al-
18
Hatrushi (2010) stated that “literature and scientific knowledge concerning the climate of Oman
are limited, incomplete and scattered” (p. 472). Yet, new research has contributed to knowledge
and awareness about the influence of climate change in Oman in terms of frequent and intense
cyclones (Al-Maskari, 2010; Al-Shaqsi, 2010; Bailey, 1988; Dibajnia et al., 2010; Fritz, Blount,
Al-busaidi, & Al-Harthy, 2010; Membery, 2001), but no measure toward resilient infrastructure
has been implemented.
In short, Oman’s sustainable development plan lacks an emphasis on resilience. According to
Choguill (1996), a connection between infrastructure and sustainability has rarely been made.
However, Klein et al. (2003) and Carpenter, Walker, Anderies, and Abel (2001) stated that
resilience contributes to sustainability by providing attributes that complement those of
infrastructure. Sustainability discourse focuses on impacts on the economy, society, the
environment, and the infrastructure is allocated over its entire service life. Whereas resilience
focuses on the impacts of infrastructure failure during an extreme event, which at the same time
creates destruction to society, the environment, and the economy. As Bocchini et al. (2013)
noted, the joining of resilience with sustainability offers an inclusive assessment of the quality of
the infrastructure, and both these concepts measure the consequences of decisions associated
with the infrastructure.
Over the past 10 years, Oman has been exposed to more than three cyclones, costing the country
a substantial amount of money to repair damaged infrastructure and to support affected families.
The classic example of Gonu in 2007 cost the country about $4.2 billion dollars; Phet 2010 cost
about $1 billion dollars; and the 2002 extreme event cost about $25 million dollars. The country
reacted defensively by building more artificial defenses such as sea walls and dams. No change
within the physical planning strategy had been resolved; the new development taking place was
based on the old survey projects, that had no focus on the impact of climate change in Oman. An
example is the recent construction of new tourism resorts along Salalah coast that now are
threatened by SLR.
2.4.1 The Urgent Need for Resilience in Oman
Unfortunately, the ability of Oman to establish and maintain its infrastructure is largely
dependent on income from oil resources. Oil provides about 82% of the general budget of the
country. Therefore, any damage to the infrastructure in Oman will be costly. Although Oman has
included the concept of sustainability in its development plan, the reality is that oil resources
contribute significantly to the country’s infrastructural development; this means that any
fluctuation in oil prices and/or productions and prices could have serious implications for the
country’s developmental plan (Al-Badi, Malik, & Gastli, 2009; Allen, 1987). Since the early
stages of its development journey, Oman has tried to become less dependent upon oil revenues;
but the path is challenging and was not taken seriously in the early planning stages.
Instability in oil prices has an effect on the country’s development plans and on its citizens
(“Plan Council Reviews Steps,” 2015). Recently Oman reduced oil subsidies, increased the
corporation tax, and reduced government spending on development to cope with the oil price
crisis (Bouyamourn, 2015; Al Mukrashi, 2015; ONA, 2015). Oman continually looks for ways to
diversify the national economy, as doing so is one of the main objectives within its development
plan; however, the country has not achieved this goal. An emphasis on diversifying the economy
19
and finding sustainable socioeconomic development has kept the country mainly focused on
sustainable socioeconomic goals that have taken priority over the need for resilient infrastructure
(“Oman Development Plan,” 2001).
In addition, Oman underestimated issues related to the effects of climate change on current
development planning and to the need to focus on creating infrastructure resiliency. Thomas
Kuhn (1996) suggested that a shift in paradigm occurs in theories and methods when the
dominant paradigms are unable to formulate consistent solutions to scientific problems (as cited
in Ndubisi, 2002). In the case of Oman, integrating modeling of different sea level inundation
scenarios and flash wadi flooding, for example, will create a paradigm shift. The integration of
science with the current regional planning and strategic planning will help the country build both
resilient infrastructure and sustainable development. Creating resilient infrastructure is a step
toward Oman reaching its sustainable planning goals.
Because we are living in an era of uncertain futures, and with higher exposures to extreme
natural hazard events due to climate change, it is important to think seriously about resilient
infrastructure (Cormie et al., 2012; Bissell, 2010; Bosher, 2008; Godschalk, 2003; Fenner &
Ainger, 2014). Nonresilient infrastructure is vulnerable and usually requires reactive action after
an event. These reactive responses are usually slow, costly, inefficient, and ineffective (Hansen
& Neale, 2014). Oman needs to embrace resiliency in its infrastructure. It is clear that
nonfunctional infrastructure affects all measures of sustainable development, because it creates
disturbances in society and in the environment. To achieve sustainable development goals, it is
essential to avoid the destruction of everyday life, and doing so requires the presence of
functional infrastructure at all times.
Furthermore, the continuous pressure of population growth and migration to urban cities has put
the country in a mindset of moving toward what they call a sustainable economy to meet the
needs of a growing population. The resources that are now used to create infrastructure show no
resilience for the future generation: They are vulnerable at 0.2m or even 0.5m of sea level rise
and to flash wadi flooding in lowland areas. A study conducted in Oman, shows that Oman is
highly vulnerable to SLR given that 400 km2 of total land area potentially will be inundated in
the 0.2m scenario at a national scale. The study also indicated that the governor of both Al-
Batinah and Muscat will be vulnerable under all SLR scenarios. The governorate of Muscat, the
capital of Oman, is the most densely populated area, and SLR are projected to claim between 5
km2 and 23 km2 of valuable public/private property. This corresponds to between 10% and 16%
of residential, commercial, and government land (Al-Buloshi, Al-Hatrushi, & Charabi, 2014).
Even though Oman is an arid country, its location exposes the country to frequent cyclones; and
its geography of steep mountains, impermeable rocks that cover the wadi watershed, and narrow
wadi ravines make the flash wadi flooding significant (Al-Qurashi, 2014). Integrating science
into Omani national developmental planning and incorporating the various scenarios of 100
years of storm and extreme events must be the beginning of creating resilient and sustainable
infrastructure for Oman’s future. Lee (2001) stated that integrating science within a system
produces unexpected outcomes that at the same time help the researcher to recognize the non-
anticipated change within the system. For that reason, integrating science into strategic planning
20
in Oman is key in moving toward sustainability and resilience within an Omani strategic plan
where the country will be able to predict climate change impacts.
2.5 Conclusion
We concede that Oman, like the many countries worldwide, has gone down the sustainable
development path, we argue that Oman needs to consider resilient infrastructure as part of its
sustainable development strategy to avoid infrastructural and economic losses.
It is clear that Oman is applying the three principles of sustainable development regarding the
economy, the environment, and society at different magnitudes. Even though Oman is applying
these principles, resilience in infrastructure they are not included in the country’s strategic
development plans, where the country showed vulnerability and no resilience in its infrastructure
during the last decade’s extreme events and cyclones.
The strongest focus of Oman’s policy is on achieving sustainable development by diversifying
the economy. Oman’s “Vision 2020” represented the Omani hope of diversifying its economy as a
means of SD. This vision encouraged the country to invest in various sectors without paying
attention to the need to have these elements of infrastructure be resilient. One explanation for this
is Oman’s lack of resilience in infrastructure. Such resilience is not included in the definition of
sustainable development as it was stated in 1987. For that reason, varying interpretations and
applications of SD exist. The approach that Oman adopted toward sustainable development may
fit the definition of SD; however, SD is not just about preserving or conserving habitat and
diversifying the economy. The resilience in infrastructure is not just about being able to fortify or
being able to detect impacts of natural hazards and storms early on. Infrastructure resistance,
coupled with rapid recovery is what ensures the sustainability and resilience of infrastructure.
Being proactive in planning and being prepared for consequences of climate change with a
resilient infrastructure is a progressive move toward sustainable development. Since strategic
development planning in Oman has little to no emphasis on climate change and its impacts, the
country has and will continue to suffer huge economic losses from natural disasters.
The government and the decision makers have the responsibility to promote proactive planning
to provide resilient infrastructure for future generations. Developing resilient and sustainable
infrastructure is not an easy task, but it is possible to successfully undertake. Since Oman is not
yet infrastructurally mature, we consider it fortunate as it still has time to learn from Western
experiences. Being scientifically sound in planning and implementing infrastructure resilience
plans is what will protect Oman from wasting money or hindering the country’s developmental
plans during fluctuations in oil prices. Planning wisely by considering the various environmental,
physical, and social challenges associated with climate change will help Oman move toward
proactive planning and to ensure resiliency for the infrastructure, the people, and the
environment.
The latest reports from Ministry of Environment and Climate Affairs (2013) on the environment
and climate change, predict that Oman will experience cyclones more frequently over the next
several decades. Money is always required to fix infrastructure damage resulting from natural
disasters brought about by climate change. Although Oman is working hard to build a

21
sustainable economy, if it does not have a sustainable plan, resilient infrastructure and policy, it
is likely a sustainable economy cannot be achieved.
22
CHAPTER 3
3.1 Introduction
One of the challenging aspects of climate change is sea level rise (SLR). Global acceleration in
sea level rise has been taking place since the 20th century and continues to accelerate at an
increasing rate (Church & White, 2006; Church et al., 2008). New research continues to show
that during the early 21st century, the global sea level rise rate has increased more than ever
before (Church & White, 2011; International Panel on Climate Change [IPCC], 2013). The AR5
report from IPCC projects a significant increase in sea level rise over the next century. The new
SLR projections anticipate an increase of 0.26–0.55 meters (10–22 inches) by 2100 under a low
emissions scenario and of 0.52–0.98 meters (20–39 inches) under the high emissions scenario
(IPCC, 2013). Furthermore, various studies show uncertainty in predicting the future of sea level
rise given that most experts estimate a larger sea level rise by AD 2100 than the IPCC AR5
(Horton, Rahmstorf, Engelhart, & Kemp, 2014; Rahmstorf, Foster, & Cazenave, 2012). Due to
these studies indicating sea level is currently rising faster since the early 1990s, it is key that
countries prepare their coastal infrastructure and other construction to be resilient.
New studies show that SLR is likely to increase by 1.2m or 2.0m by 2100 (Parris et al., 2012),
which is significant for lowland areas. The causes of SLR are known to include such factors as
an increase in ocean temperature, the melting of land ice, and changes in water storage
(Cazenave & Llovel, 2010; Church et al., 2008; Nicholls & Cazenave, 2010; Pfeffer, Harper, &
O’Neel, 2008; Rahmstorf, 2007). According to Rignot et al. (2011), in Greenland, ice-sheet
melting is considered as the dominant contributor to SLR, since by 2006 ice melting contributed
to 1.3±0.4 mm/yr of SLR. In addition, the variability of El-Nino Oscillation also has the potential
to contribute to SLR over time (Church & White, 2006). The rising seas increase the risk of
coastal flooding, storm surge inundation, coastal erosion, shoreline retreat, and wetland loss. The
existing cities and infrastructure that lie along the coasts are already vulnerable to damage from
storm surges and SLR. The potential for more frequent storms due to climate change increases
the chances of frequent inundation and the resultant damage to infrastructure.
It is clear that SLR poses a threat to our environment, our economy, and our people. Our
response to SLR and its consequences must be effective, given the implications of climate
change. Sea level rise causes a variety damage to coastal zones, such as land loss through
inundation and erosion; infrastructure damage due to flooding during storm surges and
rainstorms; and ecosystems destruction due to saltwater intrusion into aquifers, estuaries, and
wetlands (Nicholls & Cazenave, 2010). In addition, underestimating SLR can result in weak
preparation for SLR and its effects that can have enormous financial implications (Pfeffer et al.,
2008). For example, raising California Central Valley levees by a mere 0.15 meters will cost
more than $1 billion (Mount & Twiss, 2005) in damages. It is essential, given the projections for
2100, that SLR be addressed in a serious way that includes long-term planning and
infrastructural resilience.
Climate change in Oman is evidenced by higher temperatures, frequent extreme storms, and
rainfall events. According to Al Wardy, Al Rawas, and Charabi (2016), between 2041 and 2060,
23
a trend of an increased temperature of 2–5°C will take place in Oman, and between 2061 and
2080 the temperature is likely to rise by about 1.5–5.5°C. Al Wardy et al.’s study also projected
a wetter climate over Dhofar’s region during the period of 2061–2080. Another study by Al
Hatrushi and Charabi (2016) anticipated a significant increase of warm nights in the southern
part of Oman. The projection of SLR in Oman, Muscat, is that at a 4°C temperature increase,
SLR is projected at a median of 0.64 m (low emission estimate: 0.44 m; high emission estimate:
1.04 m). With a 1.5°C temperature increase, median sea level rises of 0.34 m, 0.35 m, and 0.39
m are projected for Tunis, Tangier, and Muscat, respectively (Snoj, 2015). We adopt Bromirski
et al.’s (2012) global SLR projection of 1.41m by 2100 as a conservative metric.
Within the Omani context, extremes rainfall events/storms are usually associated with wadi flash
flooding and storm surge. The damages from natural hazards are challenging and expensive.
Golnaraghi (2012) estimates that natural hazards cause significant loss of life, in addition to
setbacks in economic and social development in many countries. Ninety percent of disasters
were related to weather, water, and climate; 70% of the events resulted in two million casualties;
and 75% caused economic loss. According to Dasgupta, Laplante, Murray, and Wheeler (2009),
Oman is placed within the top 10 countries that are likely to experience a 50% increased
exposure to intensified storm surge events along their coastal areas. The increase in extreme
storms or cyclone frequency for the coast of Oman was also predicted in a Ministry of
Environment and Climate Affairs (MECA) report in 2013 and in Al Habsi, Gunawardhana, and
Al Rawas’s study in 2015. Charabi, Al Wardy, and Al Rawas (2016) demonstrated that more
than 50% of the rainfall will be associated with extreme events. In other words, catastrophic
damages are what will be left after such events. Frequent natural hazards are already seen in
Oman, for instance, the cyclonic storm ARB 01 in 2002, cyclone Gonu in 2007, Phet in 2010,
cyclonic storm Keila in 2011, and Ashobaa in 2015. These events resulted in infrastructural
damage that cost about $50million, $5billion, and $1billion, respectively, and the costs of
infrastructural damage for cyclonic storms Keila and Ashobaa have not yet been released.
Charabi et al. (2016) stated that by 2050 there will be an increase in the extreme rainfall events
for return periods (49–52%), and change will be even more prominent by 2100 because the
return period of these events will be between 81% and 101%. These figures shed light on
Oman’s high vulnerability to flooding and its consequences for current and future development
and infrastructure. A path toward resilient infrastructure is what Oman needs to engage in to
mitigate for the future challenges of climate change.
Despite the effects of SLR in the coming decades, the consequences of storm surge are even
more critical at a lower magnitude for lowland areas. According to Tebaldi, Strauss, and Zervas
(2012), any increases in SLR by even a small amount creates huge impacts in low-lying coastal
areas’ infrastructure and development, and these impacts are magnified when combined with
storm surges. Therefore, the coastal zones are highly vulnerable to sea level rise when joined
with storm surge. For instance, 20% of the world’s population lives within 30km of the coastal
zone, and approximately 40% live within 100km of the coast. By 2100, 600 million people are
expected to dwell on the coastal floodplain below the 100-year flood level (Nicholls & Small,
2002; Small & Nicholls, 2003). In other words, large numbers of people and infrastructure in
low-lying lands will be vulnerable with the estimated SLR of 2100 and preparation for resiliency
is needed.
24
focusing in on Asia and Africa, most countries in the South, the Southeast, East Asia, and Middle
East/North Africa face serious consequences from SLR due to having densely populated cities
and a growing infrastructure (Dasgupta, Laplante, Meisner, et al., 2009). At the same time, the
Middle East and North Africa’s coastal populations are predicted to have the largest percentage
of exposure to storm surge devastations: 56.2% (Dasgupta, Laplante, Murray, & Wheeler, 2009).
In Singapore, major developed lands on the low-lying islands will be inundated at 0.86m, a truth
that led the country to construct a sea wall to protect their coastal areas (Ng & Mendelsohn,
2005). The socioeconomic infrastructure of Morocco’s Mediterranean coast is vulnerable at 2m
of SLR because 24% of the total area is subject to inundation (Snoussi, Ouchani, & Niazi, 2008).
Furthermore, Snoj (2015) stated that Qatar is projected to lose 2.7% of its total land area at 1m
SLR. Egypt is projected to lose about 13.1% of its agricultural and about 5.52% of its urban area.
Libya is projected to lose 5.39% of its urban areas, the United Arab Emirates 4.8% of its urban
areas, and Tunisia 4.5% of its urban areas. Another study, conducted by the World Bank in 2012,
showed that the Middle East and North African regions are vulnerable at 1m of SLR because
about 99% of their coastal wetlands at one meter elevations or less will be affected. It is
worthwhile to mention the consequences of SLR in the Middle East goes beyond land loss; it
also creates tension over the availability of fresh water sources due to the increased salinization
of fresh water resulting from SLR. Oman, like other countries such as Bahrain, Qatar, UAE,
Saudi Arabia, Kuwait, and Yemen is water-stressed country and would struggle to supply and
maintain a fresh water supply given the salt intrusion from SLR (David, 2014).
Oman has undergone rapid modernization that transformed the country from being 11% urban in
1970 to 79% urban by 2005, and it is projected to be 86% urban by 2030 (Peterson, 2004). In
Oman, sixty-seven percent of the Omani population inhabit the coastal areas. In addition to the
population, the economy has also been booming along the coast. For example, new industries
and tourism are located within the coastal area (Al-Jufaili et al., 1999). The coastal zone is an
important space in terms of its social, economic, and ecological value given that there is a need
to initiate reliable national-to-global scale readiness to deal with the potential consequences of
SLR (Vafeidis et al., 2008). The growth and the expansion of coastal cities in Oman indicates the
vulnerability of social, built environments and of ecosystems to any natural disasters or SLR that
may occur in the future (Belqacem, 2010). Quantifying land impacted or lost and infrastructure
damaged at various SLR scenarios is important to motivate Oman to take adaptive action toward
a resilient future in the context of coastal development and city expansion.
The geographical location of Oman exposes the country to various natural hazards, especially on
the eastern tip of the Arabian Peninsula (Warren & Miller, 2007). Tropical cyclones yield flash
flooding along the wadis (Al-Shaqsi, 2014; Al Rawas, Hewawasam, Alwardy, & Charabi, 2016).
The steep mountains and the impermeability of wadi watersheds, coupled with the narrow wadi
ravines, contribute to severe flooding in Oman during hazardous natural events (Al-Qurashi,
2014). The most sensitive area in Oman is the plain that overlooks the Omani Sea. This plain is
only 3% of the country’s total land area, yet it is the most densely populated area in the country
with rapid growth and industrialization that creates a challenge for emergency management
during the cyclone events. The mountain ranges occupy almost 15% of the total land area of
Oman, and the watersheds of this region endure an increased risk of wadi flooding. The
remaining 82% of the land area of Oman is mainly dry river beds and deserts (Al-Shaqsi, 2014).
Thus, looking at the extent of the flooding during the 2002 storm surge event in Dhofar in the
25
context of SLR is significant and provides valuable information for planners and decision-
makers.
The impact of SLR will be felt most intensely through extreme events. The water level
associated with storm surge is significant because it exposes coastal development and
communities to water intrusion at increasingly unusual tidal heights (Tebaldi et al., 2012). These
events encourage us to change our responses and to adapt in anticipation of frequent extreme
events. Consequences from climate change and storm surge require that designers, planners, and
policymakers promote the development of resilient infrastructure and cities for the future
(Hunter, 2012). For that reason, a delineation of 100-year floodplains or extreme events should
influence coastal policy and development toward resilient communities and infrastructure.
This study delineates and maps the flood damage to infrastructure and cities along Dhofar’s coast
from extreme storm surge in 2002. The 2002 storm was the first storm to hit Oman that resulted
in $50 million worth of infrastructural damage since the onset of development in the country.
Extensive flooding inundated the coastal area and led to the necessity to reconstruct roads and
rebuild residential areas. The goal of this research is to model and measure the extent of the
damage from the 2002 storm, and the risk of future damage given a rise in sea-level resulting
from climate change.
This research also presents a model of SLR using 3Di flooding software2 to Dhofar’s governance
in Oman and models the extent of the inundation resulting from the 2002 storm, and the storm
surge processes, to quantify and estimate the coastal and inland vulnerability to SLR. In addition,
the study maps and quantifies the impact of multiple SLR scenarios during extreme storm surge
events of 2002 in Dhofar in association with 0.5, 1.0, and 1.41 m of SLR. The model simulation
is based on 60-minute interval water level data for a 72-hour, extreme storm event, coupled with
0.5 meter, 1.0 meter, and 1.41 meter SLR for different inundation scenarios. The results of 3Di
modeling includes a series of inundated areas at 1-hour-interval time steps that demonstrate the
extent of spatial inundation and water depth at every hour of the 2002 event. The modeling effort
is both 3 dimensional and dynamic through time.
3.2 Study Site
The Dhofar Governance is located in the southern part of Oman. Its coastal plain is divided into
three geomorphological areas: the mountainous area, which forms the catchment for the
southward and northward flowing streams; the intermediate zone area, located at the mountain’s
foot; and the plain, which is a belt of tertiary limestone that extends to Rub AlKhali Basin
(Forster & Magnan, n.d.).
2Stelling, G. S. (2012). Quadtree flood simulations with sub-grid digital elevation models.
Proceedings of the ICE-Water Management, 165(10), 567-580. doi:10.1680/wama.12.00018
26
Generally, the climate in Oman is characterized by arid and semi-arid climates. The country is
exposed to two different climatic systems: one is a cyclonic system, moving from the north
during winter, and the second is the monsoon, moving from the southwest in summer. The
climate is known to be uncertain due to the variation in frequency of these two systems. Wadis
usually have water after rainstorm events. The density of wadi flooding is strongly related to the
annual rainfall duration and frequency in the long term (Nouh, 2006).
The coastal zone management plan of Dhofar that was created in 1988 and is used as the basis
for current and future development projects in the area. In 1988, the Ministry of Commerce and
Industry conducted an ecological survey of Dhofar’s coastal zone through IUN-World
Conservation Union. The goal of that study was to develop a management plan for different land
uses along Dhofar’s coastal area. The survey revealed that the coast of Dhofar is exposed to
seasonal wave action ranging from moderate to heavy. Ecological concerns were noted as a
result of road construction that created a significant threat for the lagoon area and in terms of
beach encroachment resulting from oil spills and solid waste (Salm & Jensen, 1989). It is worth
mentioning that the issues related to climate change were not within the scope of the survey at
that time. For that reason, some of the developments that are taking place in the Dhofar area are
vulnerable to effects of climate change such as SLR, which has an enormous impact on the
infrastructure.
3.3 History of Natural Hazards in Dhofar
Throughout the history of Dhofar Governance, the city of Salalah was at particular risk for
exposure to cyclonic and extreme events, which registered at various levels of the magnitude
table (Table 1). Salalah’s exposure to cyclonic storms resulted in extensive disruption of the life
and infrastructure of the city (Al-Hakamani, 2002). According to Forster and Magnan (n.d.), the
governance’s location had exposed the Salalah plain to frequent and severe weather events at six-
year intervals. Even though the city had experienced eight natural hazards before the extreme
storm events of 2002, that storm created a wake-up call for the government. This was partly
because the development in Oman had started by the onset of 1970s and any earlier damage from
storms was minimal from the perspective of infrastructure. The 2002 storm was the first storm to
result in high infrastructural damage that Oman had on record since development had begun.
According to Al-Hakmani (2002), the 2002 storm in Salalah was considered a severe storm
within Oman, especially in the context of the significant infrastructural damage it inflicted,
which cost about $50 million. Yet, the 2002 event was not close to the 100-year magnitude.
Looking at the amount of rainfall during 12 hours, a storm event in 1963 or 1966 was higher in
magnitude and had a higher potential for greater infrastructural damage. The density of wadi
flooding is strongly related to the annual rainfall depth and frequency (Nouh, 2006). The
morphology of Oman makes it conducive for severe flooding either from the sea or from flash
wadi flooding which often leads to serious damage.
The consequences of flooding for urban areas, infrastructure, and everyday life are significant
because damage from flooding creates direct and indirect monetary loss (Schmitt, Thomas, &
Ettrich, 2004; Mark et al., 2004). For that reason, the creation of long-term sustainable
development and resilient infrastructure is extremely important for the coastal area of Oman.
Modeling and integrating impacts of natural hazards into the land-use planning contributes to
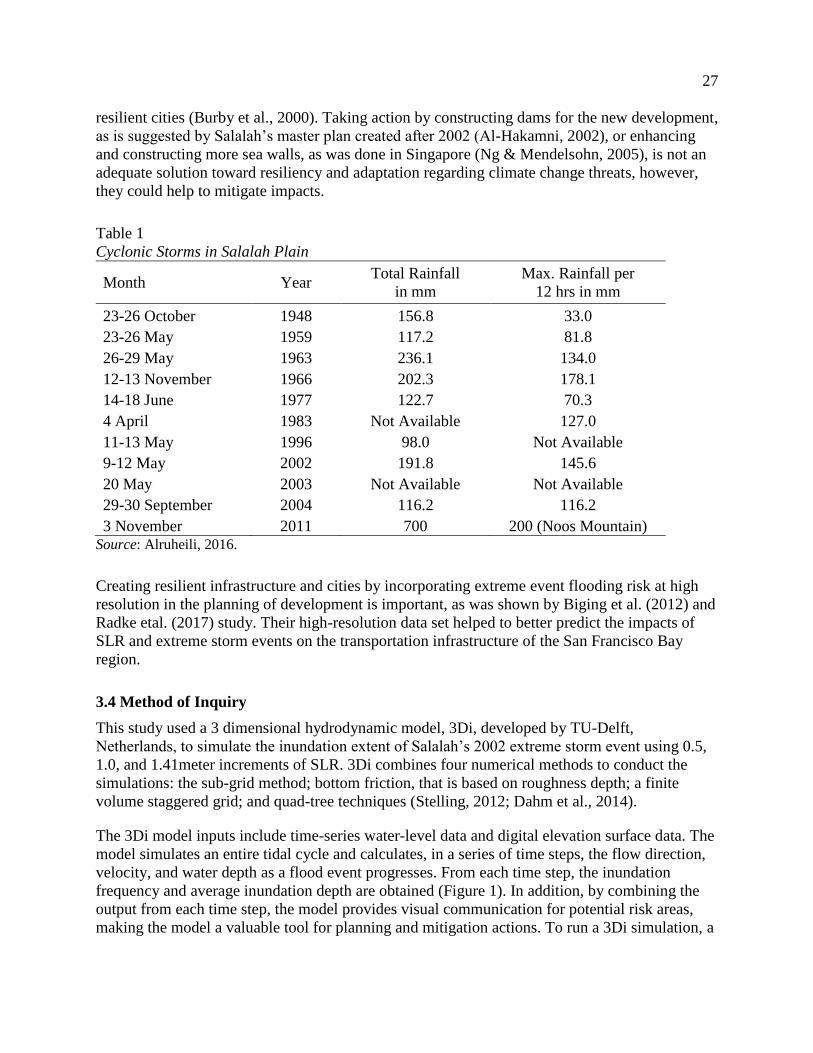
27
resilient cities (Burby et al., 2000). Taking action by constructing dams for the new development,
as is suggested by Salalah’s master plan created after 2002 (Al-Hakamni, 2002), or enhancing
and constructing more sea walls, as was done in Singapore (Ng & Mendelsohn, 2005), is not an
adequate solution toward resiliency and adaptation regarding climate change threats, however,
they could help to mitigate impacts.
Table 1
Cyclonic Storms in Salalah Plain
Month Year Total Rainfall
in mm
Max. Rainfall per
12 hrs in mm
23-26 October 1948 156.8 33.0
23-26 May 1959 117.2 81.8
26-29 May 1963 236.1 134.0
12-13 November 1966 202.3 178.1
14-18 June 1977 122.7 70.3
4 April 1983 Not Available 127.0
11-13 May 1996 98.0 Not Available
9-12 May 2002 191.8 145.6
20 May 2003 Not Available Not Available
29-30 September 2004 116.2 116.2
3 November 2011 700 200 (Noos Mountain) Source: Alruheili, 2016.
Creating resilient infrastructure and cities by incorporating extreme event flooding risk at high
resolution in the planning of development is important, as was shown by Biging et al. (2012) and
Radke etal. (2017) study. Their high-resolution data set helped to better predict the impacts of
SLR and extreme storm events on the transportation infrastructure of the San Francisco Bay
region.
3.4 Method of Inquiry
This study used a 3 dimensional hydrodynamic model, 3Di, developed by TU-Delft,
Netherlands, to simulate the inundation extent of Salalah’s 2002 extreme storm event using 0.5,
1.0, and 1.41meter increments of SLR. 3Di combines four numerical methods to conduct the
simulations: the sub-grid method; bottom friction, that is based on roughness depth; a finite
volume staggered grid; and quad-tree techniques (Stelling, 2012; Dahm et al., 2014).
The 3Di model inputs include time-series water-level data and digital elevation surface data. The
model simulates an entire tidal cycle and calculates, in a series of time steps, the flow direction,
velocity, and water depth as a flood event progresses. From each time step, the inundation
frequency and average inundation depth are obtained (Figure 1). In addition, by combining the
output from each time step, the model provides visual communication for potential risk areas,
making the model a valuable tool for planning and mitigation actions. To run a 3Di simulation, a
28
digital elevation model DEM, bathymetry, initial water boundaries, and water levels are required
as input for the software.
3.4.1 Digital Elevation Model (DEM)
The DEM is used to represent bare-ground elevations. A Lidar-based digital elevation model
(DEM) is an ideal input for flood modeling in 3Di as it can work with a Lidar-based DEM at
1meter resolution (Dahm et al., 2014). However, in Oman this type of data has not been
gathered.
For the Dhofar case study we use the most recent and highest resolution data, a 5m DEM that
exists for Oman. A 5m DEM was created for the “Nationwide Orthophoto Coverage and Data
Management System” project in 2013. The 5m DEM was obtained from Oman’s National
Survey Authority (NSA).
We delineate and include objects such as buildings when creating the 5m DEM because they
have the potential to play a significant role in diverting the path of water. Their inclusion
provides more realistic inundation and water movement paths during an event. Since Lidar data
does not exist in Oman, the elevations of objects on the ground, such as building height, is
assumed. Finally, the assumed building height, combined with the DEM and bathymetry, data an
elevation surface model that best represents the environment to be inundated by the 3Di
hydrodynamic model.
3.4.2 Bathymetry
Bathymetry for the coast of Salalah was obtained from National Oceanic and Atmospheric
Administration (NOAA) dataset. The bathymetry grids resolution is ~950m with ~ 10m vertical
accuracy (Amante & Eakins, 2009). We resample the bathymetry to 5m2 and then combine it
with the DEM grids to produce a final 5m2 horizontal resolution raster for input to the 3Di
model.
3.4.3 Water Level
The possibility that a 100-year storm took place in Dhofar Governance during 1966 is high, as
the governance witnessed about 178.1 mm of rainfall in 12 hours, during which huge wadi
flooding and losses took place (Al Barwani, 2010). However, no historical records are available
to provide information about storm surge height. In Oman, tidal data started to be collected in
1998 through Oman’s National Hydrographic Office (ONHO). In 2002, the Governance, Salalah
city, had been hit by an extreme storm event in which the city received about 145.6 mm in 12
hours (MRMWR, 2015). The 2002 extreme events were considered one of the most catastrophic
incidents that had hit Salalah and resulted in enormous damage to the city.
One aspect of the damage during the 2002 extreme event was to the infrastructure that cost the
country about $50 million (Al-Shaqsi, 2014). Due to the absence of historical tidal data records,
this research uses storm surge records from May 9–11 of the 2002 event to simulate storm surge.
Storm surge from this event was reported to be 3.2m at Marbat and 3.12m at Port of Salalah. The
tidal data of these two stations is obtained from ONHO and the data spatially referenced to the
WGS1984 vertical datum. Bromirski and Flick (2008) studied the impacts of tidal and storm
29
surge within the San Francisco Bay-Delta region and used hourly water level a data from the
1998 storm to predict storm surge impacts on the delta’s levee failure. Storm surge has a
significant impact on coastal zones and their ecosystems, and the damage they cause is huge due
to high tides.
The model 3Di has the capability to incorporate the dynamic tidal and storm surge processes—to
dynamically simulate the movement of changing water volumes over land surfaces over time.
For Salalah’s coast, the inundation simulation includes storm surge during the 2002 storm event
that is based on time-series water level data measured at the two existing tidal gauges in
association with different SLR scenarios. A recent study by MECA in 2013 had conducted a
simulation of SLR for the entire coast of Oman, but that study did not incorporate storm surge or
tidal process. The MECA study used a static bathtub model at 40m spatial resolution. Moreover,
no study to date has modeled the coast of Dhofar during the 2002 storm event.
More than 35 tiles are created along the coast of Dhofar Governance each tile is assigned water
level data recorded from the ONHO Tide Gauging Stations during the 2002 extreme storm event
that affected the Governance coast.
Initial water boundaries and water level data for each tile. Water boundaries are created to
simulate virtual waves in 3Di to provide initial water level data; in this case study, the hourly
water level is used. The coast of Dhofar is delineated by tiles, and the input of water level data is
provided for each tile. Each tile has its own initial boundary generated along the tile’s boundary
sections that are in the ocean (the bathymetry side of the surface model). As only two stations
exist along Dhofar’s coast, virtual stations are created at the mid-point of the initial ocean
boundary for each tile.
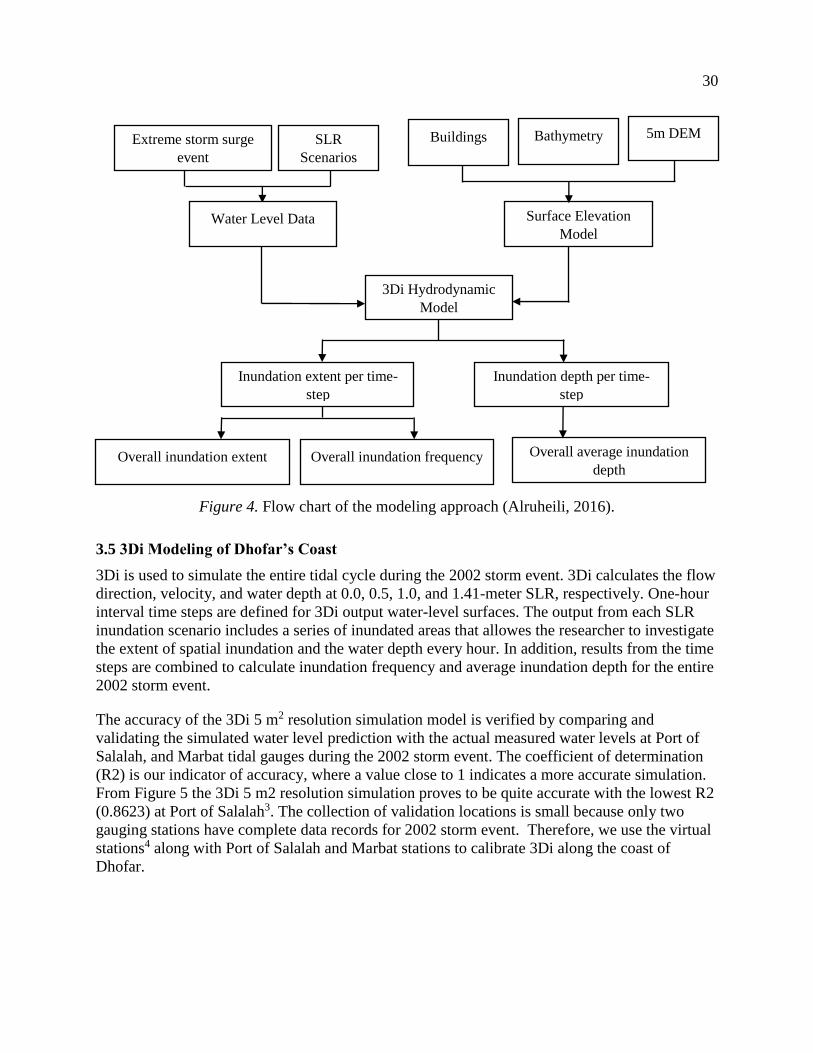
30
Figure 4. Flow chart of the modeling approach (Alruheili, 2016).
3.5 3Di Modeling of Dhofar’s Coast
3Di is used to simulate the entire tidal cycle during the 2002 storm event. 3Di calculates the flow
direction, velocity, and water depth at 0.0, 0.5, 1.0, and 1.41-meter SLR, respectively. One-hour
interval time steps are defined for 3Di output water-level surfaces. The output from each SLR
inundation scenario includes a series of inundated areas that allowes the researcher to investigate
the extent of spatial inundation and the water depth every hour. In addition, results from the time
steps are combined to calculate inundation frequency and average inundation depth for the entire
2002 storm event.
The accuracy of the 3Di 5 m2 resolution simulation model is verified by comparing and
validating the simulated water level prediction with the actual measured water levels at Port of
Salalah, and Marbat tidal gauges during the 2002 storm event. The coefficient of determination
(R2) is our indicator of accuracy, where a value close to 1 indicates a more accurate simulation.
From Figure 5 the 3Di 5 m2 resolution simulation proves to be quite accurate with the lowest R2
(0.8623) at Port of Salalah3. The collection of validation locations is small because only two
gauging stations have complete data records for 2002 storm event. Therefore, we use the virtual
stations4 along with Port of Salalah and Marbat stations to calibrate 3Di along the coast of
Dhofar.
5m DEM Bathymetry
Surface Elevation
Model
Buildings SLR
Scenarios
Extreme storm surge
event
Water Level Data
3Di Hydrodynamic
Model
Inundation depth per time-
step
Inundation extent per time-
step
Overall average inundation
depth Overall inundation extent Overall inundation frequency
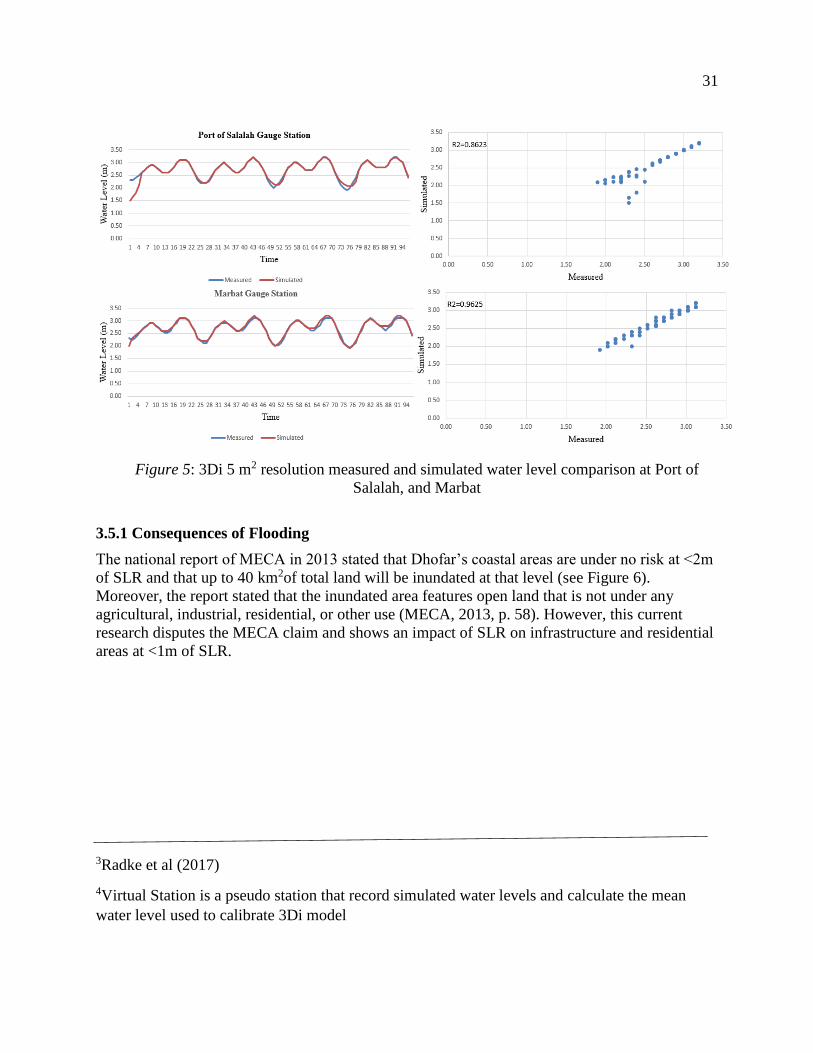
31
3.5.1 Consequences of Flooding
The national report of MECA in 2013 stated that Dhofar’s coastal areas are under no risk at <2m
of SLR and that up to 40 km2of total land will be inundated at that level (see Figure 6).
Moreover, the report stated that the inundated area features open land that is not under any
agricultural, industrial, residential, or other use (MECA, 2013, p. 58). However, this current
research disputes the MECA claim and shows an impact of SLR on infrastructure and residential
areas at <1m of SLR.
3Radke et al (2017)
4Virtual Station is a pseudo station that record simulated water levels and calculate the mean
water level used to calibrate 3Di model
Figure 5: 3Di 5 m2 resolution measured and simulated water level comparison at Port of
Salalah, and Marbat
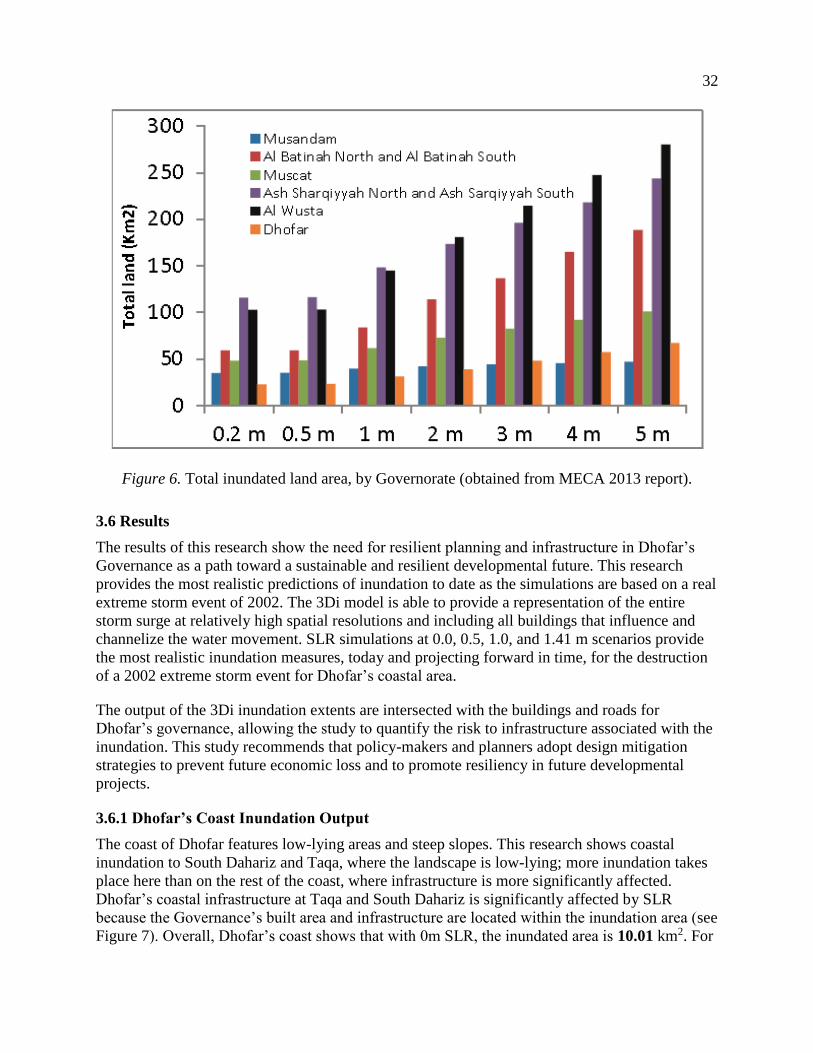
32
Figure 6. Total inundated land area, by Governorate (obtained from MECA 2013 report).
3.6 Results
The results of this research show the need for resilient planning and infrastructure in Dhofar’s
Governance as a path toward a sustainable and resilient developmental future. This research
provides the most realistic predictions of inundation to date as the simulations are based on a real
extreme storm event of 2002. The 3Di model is able to provide a representation of the entire
storm surge at relatively high spatial resolutions and including all buildings that influence and
channelize the water movement. SLR simulations at 0.0, 0.5, 1.0, and 1.41 m scenarios provide
the most realistic inundation measures, today and projecting forward in time, for the destruction
of a 2002 extreme storm event for Dhofar’s coastal area.
The output of the 3Di inundation extents are intersected with the buildings and roads for
Dhofar’s governance, allowing the study to quantify the risk to infrastructure associated with the
inundation. This study recommends that policy-makers and planners adopt design mitigation
strategies to prevent future economic loss and to promote resiliency in future developmental
projects.
3.6.1 Dhofar’s Coast Inundation Output
The coast of Dhofar features low-lying areas and steep slopes. This research shows coastal
inundation to South Dahariz and Taqa, where the landscape is low-lying; more inundation takes
place here than on the rest of the coast, where infrastructure is more significantly affected.
Dhofar’s coastal infrastructure at Taqa and South Dahariz is significantly affected by SLR
because the Governance’s built area and infrastructure are located within the inundation area (see
Figure 7). Overall, Dhofar’s coast shows that with 0m SLR, the inundated area is 10.01 km2. For
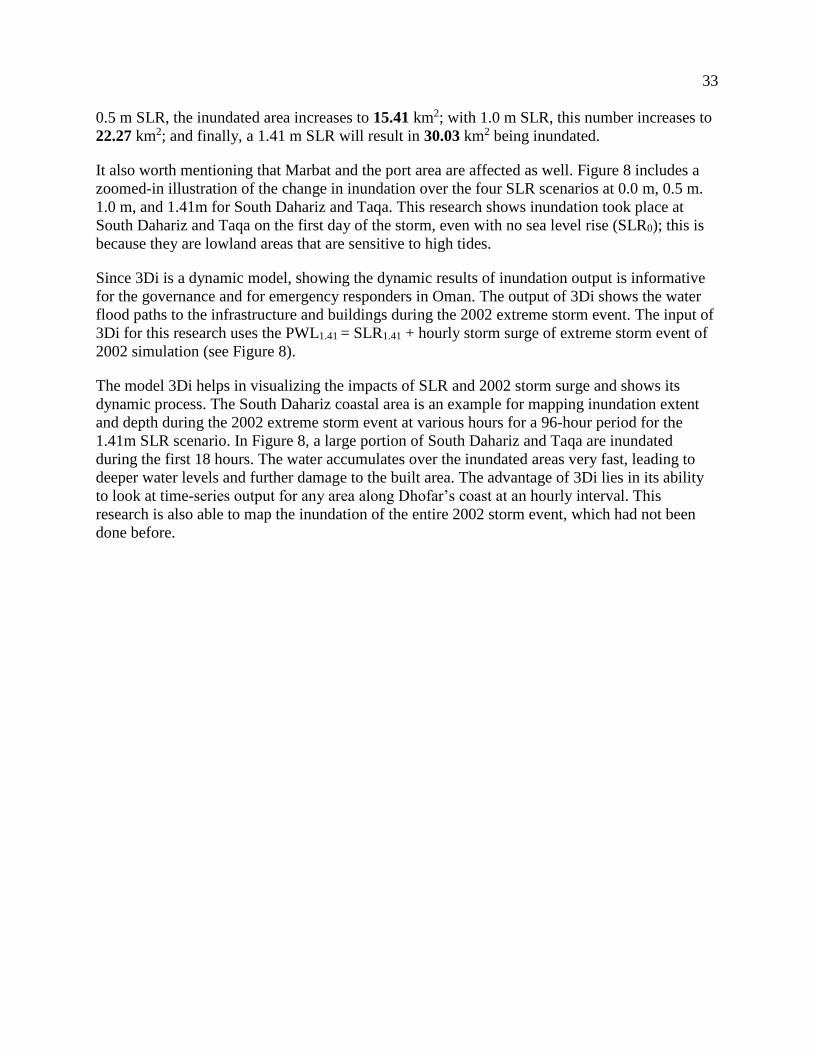
33
0.5 m SLR, the inundated area increases to 15.41 km2; with 1.0 m SLR, this number increases to
22.27 km2; and finally, a 1.41 m SLR will result in 30.03 km2 being inundated.
It also worth mentioning that Marbat and the port area are affected as well. Figure 8 includes a
zoomed-in illustration of the change in inundation over the four SLR scenarios at 0.0 m, 0.5 m.
1.0 m, and 1.41m for South Dahariz and Taqa. This research shows inundation took place at
South Dahariz and Taqa on the first day of the storm, even with no sea level rise (SLR0); this is
because they are lowland areas that are sensitive to high tides.
Since 3Di is a dynamic model, showing the dynamic results of inundation output is informative
for the governance and for emergency responders in Oman. The output of 3Di shows the water
flood paths to the infrastructure and buildings during the 2002 extreme storm event. The input of
3Di for this research uses the PWL1.41 = SLR1.41 + hourly storm surge of extreme storm event of
2002 simulation (see Figure 8).
The model 3Di helps in visualizing the impacts of SLR and 2002 storm surge and shows its
dynamic process. The South Dahariz coastal area is an example for mapping inundation extent
and depth during the 2002 extreme storm event at various hours for a 96-hour period for the
1.41m SLR scenario. In Figure 8, a large portion of South Dahariz and Taqa are inundated
during the first 18 hours. The water accumulates over the inundated areas very fast, leading to
deeper water levels and further damage to the built area. The advantage of 3Di lies in its ability
to look at time-series output for any area along Dhofar’s coast at an hourly interval. This
research is also able to map the inundation of the entire 2002 storm event, which had not been
done before.
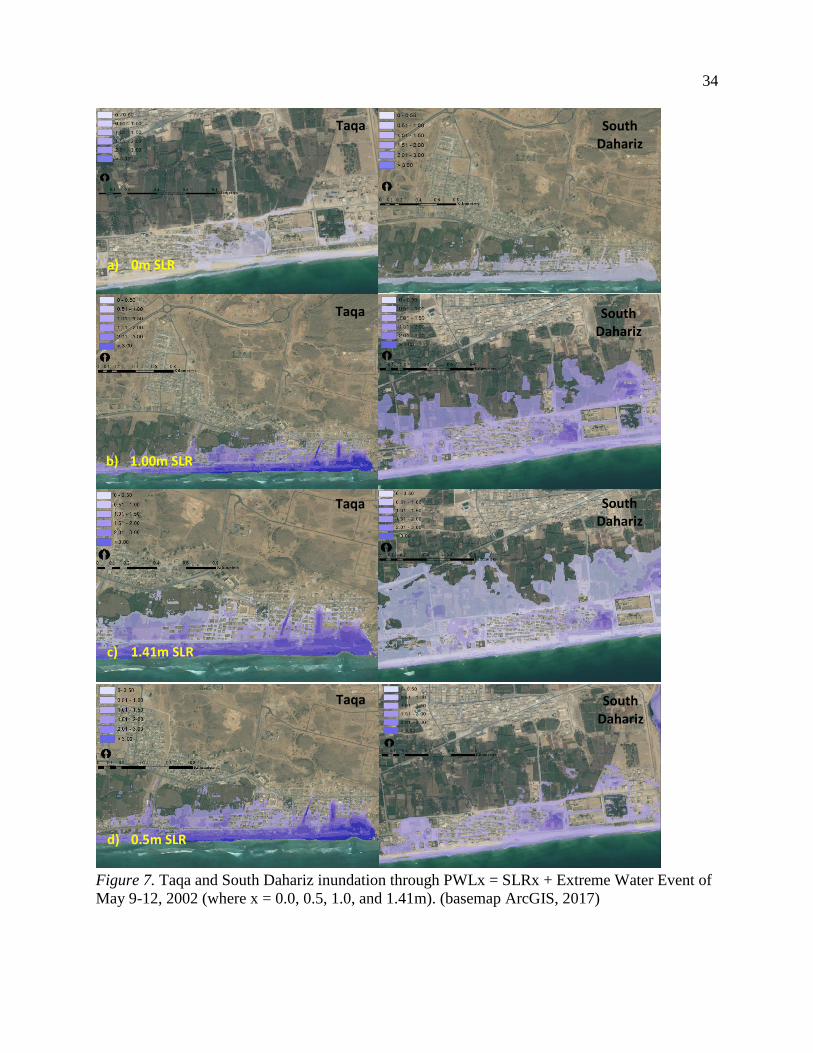
34
Figure 7. Taqa and South Dahariz inundation through PWLx = SLRx + Extreme Water Event of
May 9-12, 2002 (where x = 0.0, 0.5, 1.0, and 1.41m). (basemap ArcGIS, 2017)
Taqa South Dahariz
a) 0m SLR
b) 1.00m SLR
Taqa South Dahariz
c) 1.41m SLR
Taqa South Dahariz
Taqa South Dahariz
d) 0.5m SLR
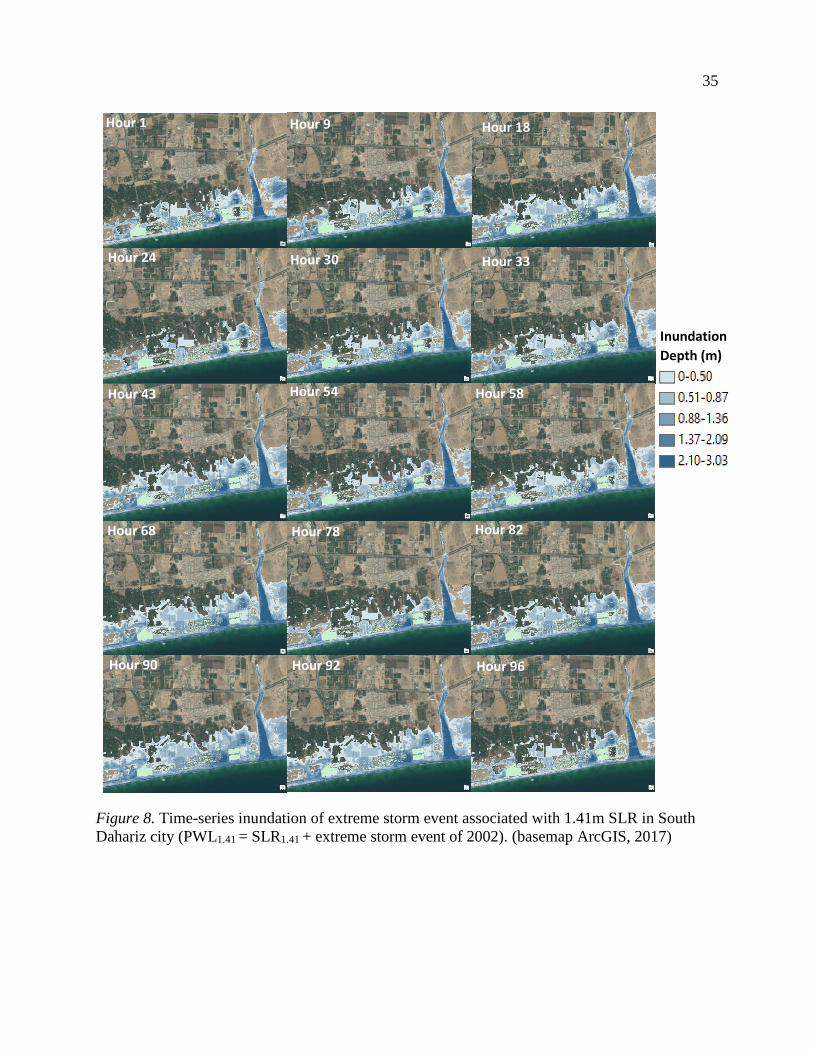
35
Figure 8. Time-series inundation of extreme storm event associated with 1.41m SLR in South
Dahariz city (PWL1.41 = SLR1.41 + extreme storm event of 2002). (basemap ArcGIS, 2017)
Hour 1 Hour 9 Hour 18
Hour 24 Hour 30 Hour 33
Hour 43 Hour 54 Hour 58
Hour 68 Hour 78 Hour 82
Hour 90 Hour 92 Hour 96
Inundation
Depth (m)
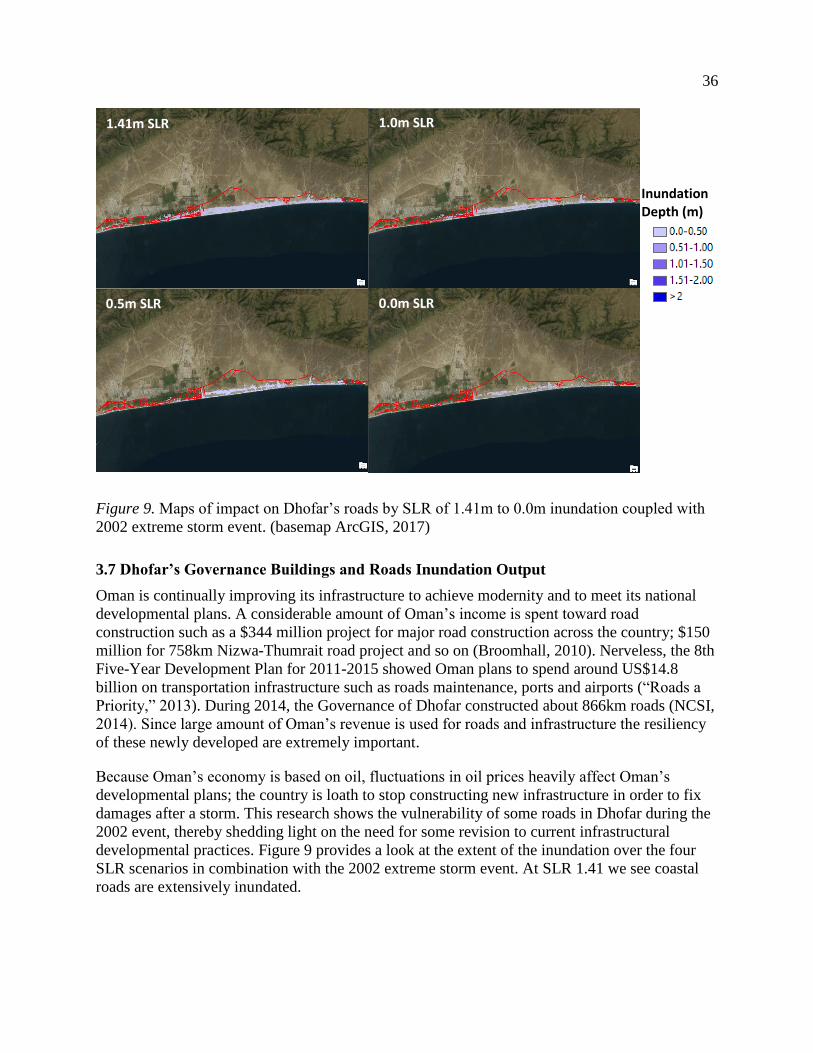
36
Figure 9. Maps of impact on Dhofar’s roads by SLR of 1.41m to 0.0m inundation coupled with
2002 extreme storm event. (basemap ArcGIS, 2017)
3.7 Dhofar’s Governance Buildings and Roads Inundation Output
Oman is continually improving its infrastructure to achieve modernity and to meet its national
developmental plans. A considerable amount of Oman’s income is spent toward road
construction such as a $344 million project for major road construction across the country; $150
million for 758km Nizwa-Thumrait road project and so on (Broomhall, 2010). Nerveless, the 8th
Five-Year Development Plan for 2011-2015 showed Oman plans to spend around US$14.8
billion on transportation infrastructure such as roads maintenance, ports and airports (“Roads a
Priority,” 2013). During 2014, the Governance of Dhofar constructed about 866km roads (NCSI,
2014). Since large amount of Oman’s revenue is used for roads and infrastructure the resiliency
of these newly developed are extremely important.
Because Oman’s economy is based on oil, fluctuations in oil prices heavily affect Oman’s
developmental plans; the country is loath to stop constructing new infrastructure in order to fix
damages after a storm. This research shows the vulnerability of some roads in Dhofar during the
2002 event, thereby shedding light on the need for some revision to current infrastructural
developmental practices. Figure 9 provides a look at the extent of the inundation over the four
SLR scenarios in combination with the 2002 extreme storm event. At SLR 1.41 we see coastal
roads are extensively inundated.
1.41m SLR 1.0m SLR
0.5m SLR 0.0m SLR
Inundation Depth (m)
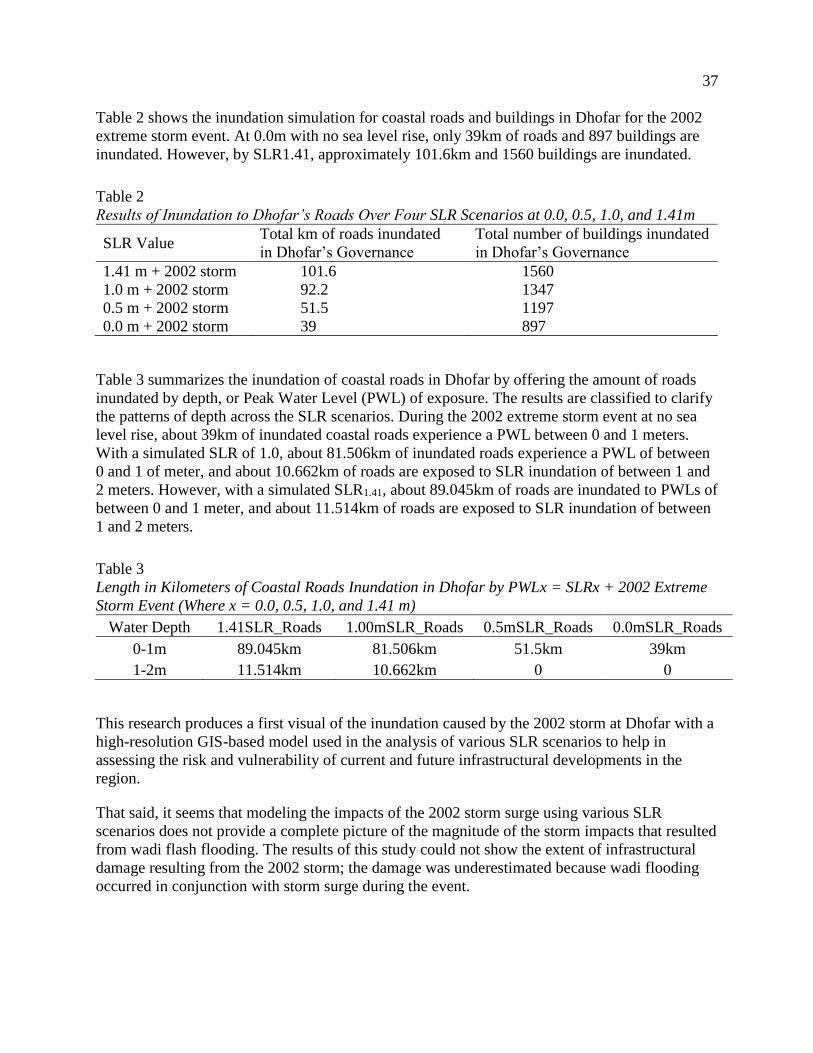
37
Table 2 shows the inundation simulation for coastal roads and buildings in Dhofar for the 2002
extreme storm event. At 0.0m with no sea level rise, only 39km of roads and 897 buildings are
inundated. However, by SLR1.41, approximately 101.6km and 1560 buildings are inundated.
Table 2
Results of Inundation to Dhofar’s Roads Over Four SLR Scenarios at 0.0, 0.5, 1.0, and 1.41m
SLR Value Total km of roads inundated
in Dhofar’s Governance
Total number of buildings inundated
in Dhofar’s Governance
1.41 m + 2002 storm 101.6 1560
1.0 m + 2002 storm 92.2 1347
0.5 m + 2002 storm 51.5 1197
0.0 m + 2002 storm 39 897
Table 3 summarizes the inundation of coastal roads in Dhofar by offering the amount of roads
inundated by depth, or Peak Water Level (PWL) of exposure. The results are classified to clarify
the patterns of depth across the SLR scenarios. During the 2002 extreme storm event at no sea
level rise, about 39km of inundated coastal roads experience a PWL between 0 and 1 meters.
With a simulated SLR of 1.0, about 81.506km of inundated roads experience a PWL of between
0 and 1 of meter, and about 10.662km of roads are exposed to SLR inundation of between 1 and
2 meters. However, with a simulated SLR1.41, about 89.045km of roads are inundated to PWLs of
between 0 and 1 meter, and about 11.514km of roads are exposed to SLR inundation of between
1 and 2 meters.
Table 3
Length in Kilometers of Coastal Roads Inundation in Dhofar by PWLx = SLRx + 2002 Extreme
Storm Event (Where x = 0.0, 0.5, 1.0, and 1.41 m)
Water Depth 1.41SLR_Roads 1.00mSLR_Roads 0.5mSLR_Roads 0.0mSLR_Roads
0-1m 89.045km 81.506km 51.5km 39km
1-2m 11.514km 10.662km 0 0
This research produces a first visual of the inundation caused by the 2002 storm at Dhofar with a
high-resolution GIS-based model used in the analysis of various SLR scenarios to help in
assessing the risk and vulnerability of current and future infrastructural developments in the
region.
That said, it seems that modeling the impacts of the 2002 storm surge using various SLR
scenarios does not provide a complete picture of the magnitude of the storm impacts that resulted
from wadi flash flooding. The results of this study could not show the extent of infrastructural
damage resulting from the 2002 storm; the damage was underestimated because wadi flooding
occurred in conjunction with storm surge during the event.
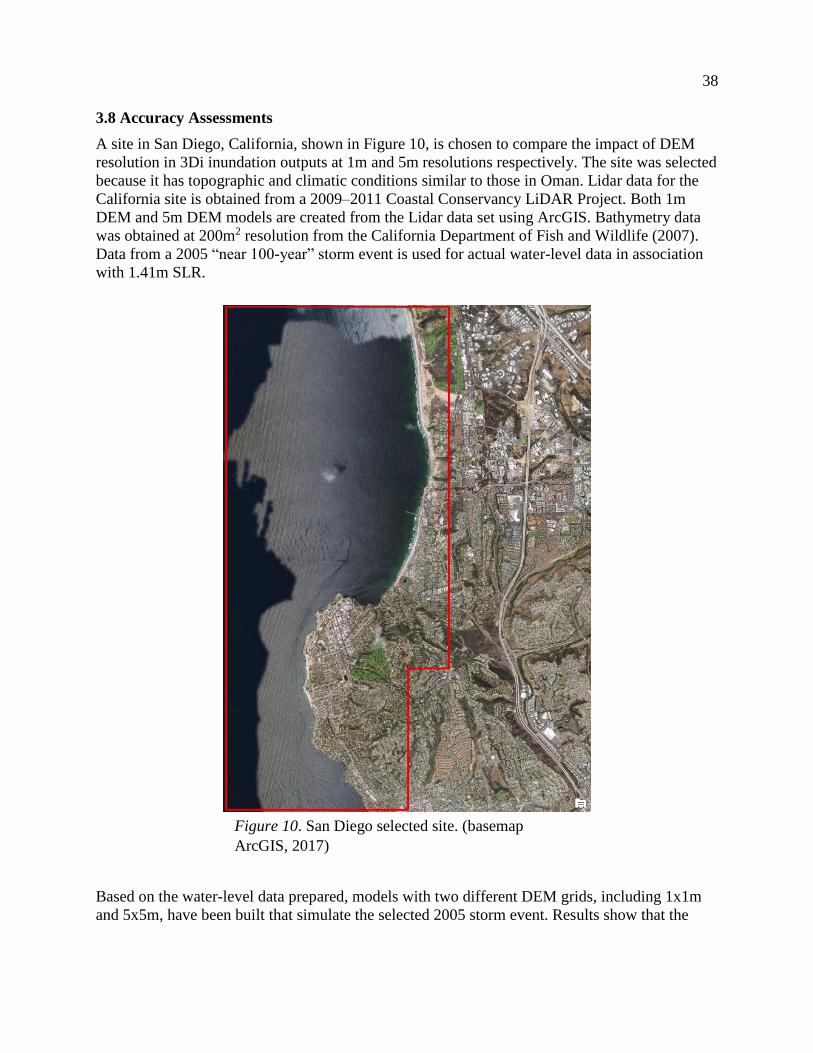
38
3.8 Accuracy Assessments
A site in San Diego, California, shown in Figure 10, is chosen to compare the impact of DEM
resolution in 3Di inundation outputs at 1m and 5m resolutions respectively. The site was selected
because it has topographic and climatic conditions similar to those in Oman. Lidar data for the
California site is obtained from a 2009–2011 Coastal Conservancy LiDAR Project. Both 1m
DEM and 5m DEM models are created from the Lidar data set using ArcGIS. Bathymetry data
was obtained at 200m2 resolution from the California Department of Fish and Wildlife (2007).
Data from a 2005 “near 100-year” storm event is used for actual water-level data in association
with 1.41m SLR.
Based on the water-level data prepared, models with two different DEM grids, including 1x1m
and 5x5m, have been built that simulate the selected 2005 storm event. Results show that the
Figure 10. San Diego selected site. (basemap
ArcGIS, 2017)
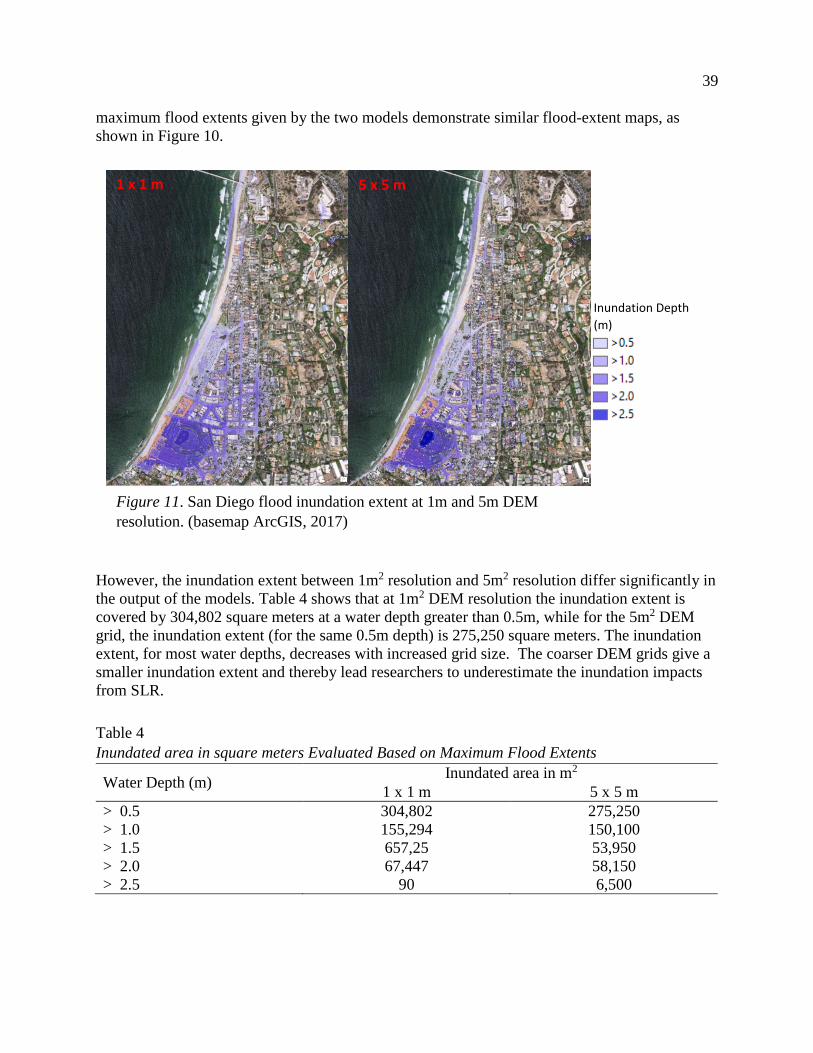
39
maximum flood extents given by the two models demonstrate similar flood-extent maps, as
shown in Figure 10.
However, the inundation extent between 1m2 resolution and 5m2 resolution differ significantly in
the output of the models. Table 4 shows that at 1m2 DEM resolution the inundation extent is
covered by 304,802 square meters at a water depth greater than 0.5m, while for the 5m2 DEM
grid, the inundation extent (for the same 0.5m depth) is 275,250 square meters. The inundation
extent, for most water depths, decreases with increased grid size. The coarser DEM grids give a
smaller inundation extent and thereby lead researchers to underestimate the inundation impacts
from SLR.
Table 4
Inundated area in square meters Evaluated Based on Maximum Flood Extents
Water Depth (m) Inundated area in m2
1 x 1 m 5 x 5 m
> 0.5 304,802 275,250
> 1.0 155,294 150,100
> 1.5 657,25 53,950
> 2.0 67,447 58,150
> 2.5 90 6,500
1 x 1 m 5 x 5 m
Inundation Depth
(m)
Figure 11. San Diego flood inundation extent at 1m and 5m DEM
resolution. (basemap ArcGIS, 2017)
40
3.9 Limitations
One of the main limitations of this research is the flow of water between pixels within the output.
This is likely due to the inability of 3Di to detect change within a very low-elevation surface like
Dhofar’s, even with very fine grid and time-step instruments such as DEM at 1m spatial
resolution. A Lidar-based DEM could overcome this problem. This study could be improved if
water data were available at 15-minute intervals instead of 1-hour intervals, as was the case with
data from Dhofar’s coast.
3.10 Conclusion
This research is helpful in developing a better forecast for infrastructural impacts from SLR and
storm surge than the study conducted by MECA in 2013 because it incorporates improved,
dynamic and higher dimensional sea level rise modeling and the storm surge tidal process.
This study can help the governance of Dhofar to create more realistic mitigation plans and
infrastructure management strategies. The ability to map the extent of the inundation area is
improved by using the 3Di hydrodynamic model, which simulates the entire tidal cycle. 3Di also
is able to model a very large region at a very high spatial resolution due to its sophisticated
quadtree-based data compression technology. This produces a better and a higher-resolution
surface model of Dhofar’s coast. This research includes objects such as buildings that might help
in channelizing and accelerating water movements produced by a storm surge. In addition, this
research incorporates real data from gauging stations of the 2002 event instead of modeling
based on theoretical 100-year storm events. This approach allows the research to produce more
realistic predictions and to be able to calibrate 3 dimensional hydrodynamic model.
It is clear that the morphology of Oman is challenging and serves to create severe flooding,
either from the sea or from wadi flash flooding that causes serious damage. For that reason,
taking steps toward creating local resilience within Dhofar’s infrastructure is a step toward
national resilience. Vale and Campanella (2005) stated that local resilience is an indication of
national resilience, which signifies the resilience of the government as a whole. If Oman is to be
ready for the new future, the new resiliency must be present in each unit of urban fabric and
government. Adopting resilient thinking and practices will provide a different understanding of
the situation around us and allow us to cope with the uncertain future (Walker & Salt, 2012).
Integrating science into planning will help us to achieve the meaning of infrastructural resilience
as it is defined: “the capacity of system to respond to change or disturbance without changing its
basic state and to recover in a short time” (NAIC, 2009, p8).
41
CHAPTER 4
4.1 Introduction
Since development has accelerated, environmental problems and degradation have become
obvious, stimulating the establishment of the World Commission on Environment and
Development (WCED) in 1983. WCED created a definition of sustainable development (SD):
“development that meets the needs of the present without compromising the ability of future
generations to meet their own needs” (WCED, 1987, p. 43). The goal of SD is to minimize
environmental degradation arising from developmental activities. Because the concept of SD is
ambiguous, it has been implemented in subjective ways, creating a challenge in terms of
developing an effective, unbiased process (Lele, 1991).
The term sustainable development usually refers to the ability of the system to maintain
productivity in the face of major disturbances, such as erosion and flooding, that result in system
collapse and productivity decreases that mean the system is not considered sustainable (Redclift,
2002). Coastal tourism is considered sustainable when it is able to withstand risks associated
with natural hazards, such as cyclones, hurricanes, and storms, without collapsing (Hall, 2001).
However, sustainability within the environmental context focuses on sustaining resources
through maintaining and prolonging the resources’ productivity and their integrity (Dixon &
Fallon, 1989). Therefore, the term sustainable development is used to indicate either ecologically
sustainable or environmentally sound development (Tolba, 1987). Moreover, the definition of
development usually is tied to economic growth (Lafferty, 2002; Redclift, 2002). This indicates
that SD is connected to reducing environmental and resources destruction resulting from
development and has less focus on preserving the built environment. This means that the term
sustainability originally developed in a biological/physical context and now is applied in a
socioeconomic context. Dixon and Fallon (1989) stated that the term sustainability has been used
as a bridge between development and the environment to justify proposed actions.
For instance, the concept of sustainability was linked to renewable resources, such as fisheries or
forests that were adopted by the environmental movement (Brown, Hansen, Liverman, &
Merideth, 1987). Sustainability as a concept continues to broaden and evolve as people
encounter the challenges of regulating these renewable resources. As a result, sustainability has
progressed from being purely physical for a single resource, to a physical concept for a group of
resources (ecosystem), to a social-physical-economic concept (Dixon & Fallon, 1989). Now the
term has been expanding further, heading toward social-physical-economic-ethic-equity, ever
since its appearance in the realm of sustaining forestry (Wiersum, 1995). The ambiguity present
in trying to define sustainability has created vagueness regarding what the word means, resulting
in varying interpretations and applications of the term.
4.2 Sustainable Tourism
The World Tourism Organization (WTO, 2001) defined sustainable tourism development as
development that meets the needs of current tourists and host regions while protecting and
enhancing opportunities for future generations. Enhancing opportunities for future generations
requires preserving the country’s cultural integrity, ecological processes, and biological
42
diversity, in addition to maintaining resources while fulfilling the economic, social, and aesthetic
needs of the area’s host regions and of tourists. Approaches to sustainable tourism described by
Hunter (1997) included tourism imperative, product led tourism, environmental-led tourism, and
neotenous tourism. These tools were proposed as pathways toward protecting the environment
and nature that would help Oman to achieve sustainable tourism.
In the developing world, sustainable tourism has become an increasingly popular field of
research since the late 1980s due to the popularization of the SD concept as an environmental
management approach (Hunter, 1997; Sharpley, 2000). As a result, sustainable tourism is used as
a tool to set principles, policy prescriptions, and management methods for destination tourist
areas (Lane, 1994). However, the concept of sustainable tourism is tourism-centric, which means
that it fails to provide policies that address concerns about SD and tourism sustainability (Wall,
1993). This is because sustainable tourism is perceived as having the ability to create balance
between the demands of tourism and of a sustainable environmental system, or a balance
between the environment and economic development (Hardy, Beeton, & Pearson, 2002; Hunter,
1997; Müller, 1994). But figuring out exactly how to achieve this balance is challenging, as was
mentioned earlier, because of the lack of clarity regarding what SD means. The question is
whether it is possible to have tourism development that has the capability to preserve the
absolute natural resources or could serve as a mitigating factor regarding impacts resulting from
climate change for future generations. Because we are living in a system and an ecosystem, any
interaction with a single element within the system and ecosystem will evoke a reaction in
another. As Lanfant and Graburn (1992) stated, the commodification of nature and other aspects
of the environment is always present in tourism practices. And there is always a price for
commodifying nature and the environment at different magnitudes.
Since tourism development and its associated industries must fit the environmental
characteristics of the intended site, developers need to understand the venue and be flexible if
they are to create sustainable tourism planning (Dowling, 1993; Lane, 1994). With this in mind,
a holistic approach with an environmental planning consideration within tourism planning has
the potential to achieve a reasonable tourism destination that demonstrates a closer balance
between the needs of tourism and of the environment. The holistic planning approach has been
practiced in coastal zone (CZ) planning, which is in a state of continuous change (Post, Lundin,
& Mundial, 1996; Sorensen, 1993). A systematic planning approach is needed to improve our
understanding of patterns of changes to tourism projects to help us to detect the dynamic
interaction of, and fluctuations within, the natural, technological, social, and economic
environments (Liu, 1994, 2003).
Researchers encouraged stakeholders to adapt the ecosystem process, modifying it within the
context of land use and development to reduce natural and environmental destruction (Berke &
Conroy, 2000). For example, the unplanned coastal tourism development in South East Asia
provides excellent examples of negative environmental and socioeconomic consequences,
because the ecosystem process is not incorporated into the tourism planning process (Wong,
1998). We agree with Liu’s (2003) statement about the need to blend information and a
transparent, systematic planning approach in working toward sustainable, tourism-related
development. Sustainable development is described as a process-oriented function that has the
ability to manage changes to improve the conditions for those involved (Butler, 1999). Both
43
sustainable tourism tools and SD are adopting Ian McHarg’s (1969) concept of environmental
planning, or “design with nature,” which takes into consideration human and environmental
interaction. Adopting the “design with nature” concept and working toward long-term benefits
for future generations may constitute sustainable tourism.
4.3 Tourism in Oman
New development, new buildings, and even roads make Oman more modern; however, they have
consequences. It is impossible to have a form of tourism development that does not have impacts
upon the location in which it occurs. Tourism in Oman began very conservatively in the late
1980s, when the country cautiously opened its gates to selective tourism. Initially, tourism
development policy in Oman focused on quality rather than on a mass tourism approach. The
government’s policy has been to move slowly in terms of tourism development, keeping
development numbers low to minimize environmental impacts (Hazbun, 2004; Mershen, 2006).
This decision was also made because only 7% of Oman’s land is actually in use, meaning that
portion needed to be protected (Al-Shaybany, 2001). According to Subramoniam, Al-Essai, Al-
Marashadi, and Al-Kindi (2010), Oman faces a variety of environmental problems, including soil
and water salinity, industrial pollution to ground water, desertification, and scarcity of water due
to long periods of drought. These challenges indicate the need to be conscious and careful with
new tourism-related development in Oman and to be sensitive to impacts on the country’s
environment and natural resources.
Recently, Oman has been considered as a new tourism destination since emerging in the
European travel industry in the mid-1990s (Feighery, 2012; Mershen, 2006). Even though
Oman’s initial reaction to selective tourism showed concern for the country’s environment and
culture, the pressure to engage in massive development to diversify the country’s income has
weakened the selective tourism approach. For that reason, coastal tourism development has
increased. In general, the coastal area is recognized as a hub for enhancing the socio-economic
status of many around the world. With the Omani goals of diversifying the economy and
becoming less dependent on oil revenue, the country has increased its coastal tourism
development (Deloitte, 2013). Presently, Oman is moving rapidly within the tourism realm, as is
shown by the increase in the number of hotels in the country—from 52 in1996 to 287 in 2014
(NCSI, 2016). According to Oman’s tourism site (www.omantourism.gov), a good number of
these new developed hotels and resorts are located along the coastal area, for example Barr Al
Jissah Resort, Sawadi Beach Resort, The Wave mega-project (Muscat), Millennium Resort
(Batinah coast), Salalah Rotana Resort, and Marriot Resort – Salalah Beach (Salalah). This
approach to mass tourism, with its corresponding large influx of tourists into the pristine land,
poses a great threat to Oman. The main challenges posed by the tourism industry are rising soil
salinity, beach pollution from oil spills, and limited natural fresh water resources. In addition,
solid waste management, if not carried out properly, will result in irrecoverable loss of beauty of
ancient towns and nature (Subramoniam et al., 2010). As Sharpley (2002) stated, it is essential
that those involved in Oman’s tourism development projects know about and understand the
country’s coastal resources and its environmental processes.
Since establishing SD principles, Oman has worked hard to apply those principles to the
country’s development. Recently, Oman has also promoted energy resilience by encouraging the
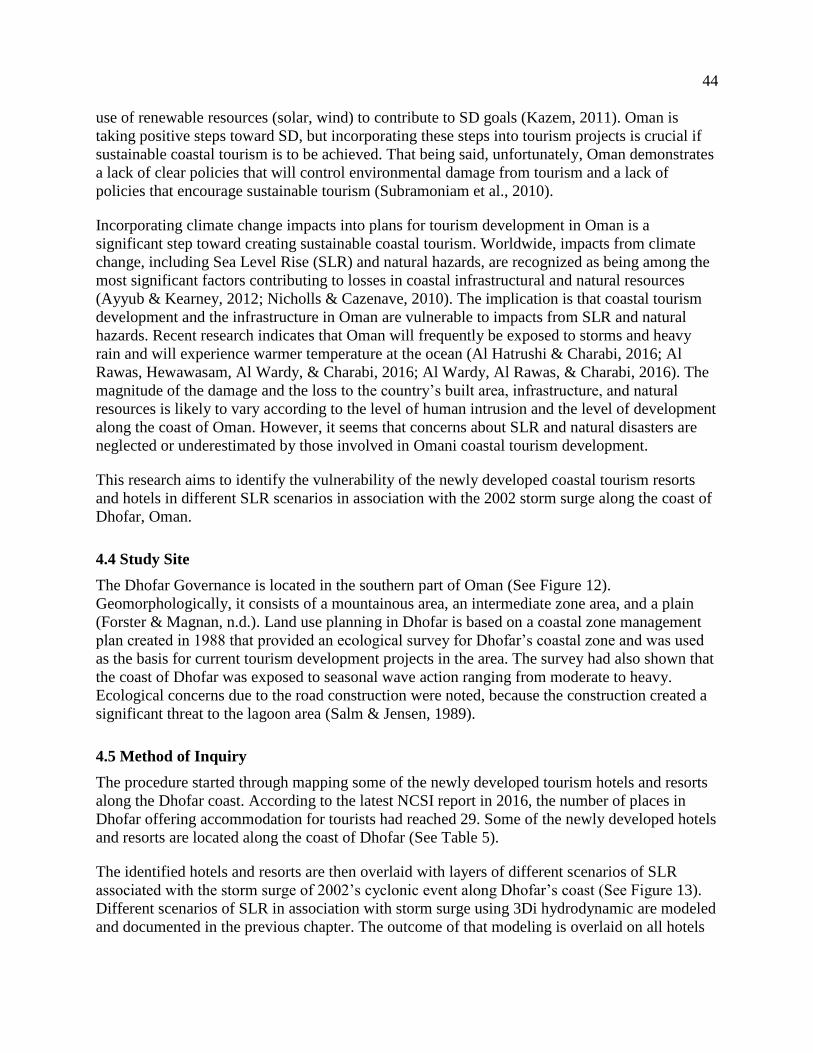
44
use of renewable resources (solar, wind) to contribute to SD goals (Kazem, 2011). Oman is
taking positive steps toward SD, but incorporating these steps into tourism projects is crucial if
sustainable coastal tourism is to be achieved. That being said, unfortunately, Oman demonstrates
a lack of clear policies that will control environmental damage from tourism and a lack of
policies that encourage sustainable tourism (Subramoniam et al., 2010).
Incorporating climate change impacts into plans for tourism development in Oman is a
significant step toward creating sustainable coastal tourism. Worldwide, impacts from climate
change, including Sea Level Rise (SLR) and natural hazards, are recognized as being among the
most significant factors contributing to losses in coastal infrastructural and natural resources
(Ayyub & Kearney, 2012; Nicholls & Cazenave, 2010). The implication is that coastal tourism
development and the infrastructure in Oman are vulnerable to impacts from SLR and natural
hazards. Recent research indicates that Oman will frequently be exposed to storms and heavy
rain and will experience warmer temperature at the ocean (Al Hatrushi & Charabi, 2016; Al
Rawas, Hewawasam, Al Wardy, & Charabi, 2016; Al Wardy, Al Rawas, & Charabi, 2016). The
magnitude of the damage and the loss to the country’s built area, infrastructure, and natural
resources is likely to vary according to the level of human intrusion and the level of development
along the coast of Oman. However, it seems that concerns about SLR and natural disasters are
neglected or underestimated by those involved in Omani coastal tourism development.
This research aims to identify the vulnerability of the newly developed coastal tourism resorts
and hotels in different SLR scenarios in association with the 2002 storm surge along the coast of
Dhofar, Oman.
4.4 Study Site
The Dhofar Governance is located in the southern part of Oman (See Figure 12).
Geomorphologically, it consists of a mountainous area, an intermediate zone area, and a plain
(Forster & Magnan, n.d.). Land use planning in Dhofar is based on a coastal zone management
plan created in 1988 that provided an ecological survey for Dhofar’s coastal zone and was used
as the basis for current tourism development projects in the area. The survey had also shown that
the coast of Dhofar was exposed to seasonal wave action ranging from moderate to heavy.
Ecological concerns due to the road construction were noted, because the construction created a
significant threat to the lagoon area (Salm & Jensen, 1989).
4.5 Method of Inquiry
The procedure started through mapping some of the newly developed tourism hotels and resorts
along the Dhofar coast. According to the latest NCSI report in 2016, the number of places in
Dhofar offering accommodation for tourists had reached 29. Some of the newly developed hotels
and resorts are located along the coast of Dhofar (See Table 5).
The identified hotels and resorts are then overlaid with layers of different scenarios of SLR
associated with the storm surge of 2002’s cyclonic event along Dhofar’s coast (See Figure 13).
Different scenarios of SLR in association with storm surge using 3Di hydrodynamic are modeled
and documented in the previous chapter. The outcome of that modeling is overlaid on all hotels
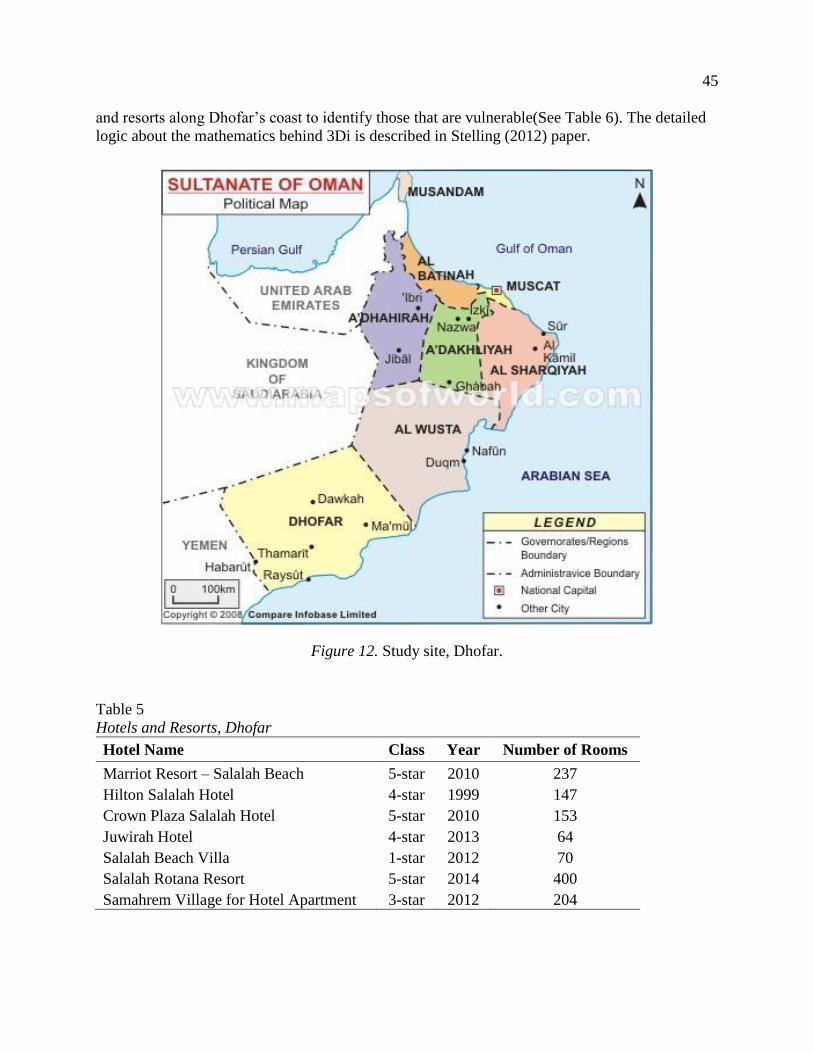
45
and resorts along Dhofar’s coast to identify those that are vulnerable(See Table 6). The detailed
logic about the mathematics behind 3Di is described in Stelling (2012) paper.
Figure 12. Study site, Dhofar.
Table 5
Hotels and Resorts, Dhofar
Hotel Name Class Year Number of Rooms
Marriot Resort – Salalah Beach 5-star 2010 237
Hilton Salalah Hotel 4-star 1999 147
Crown Plaza Salalah Hotel 5-star 2010 153
Juwirah Hotel 4-star 2013 64
Salalah Beach Villa 1-star 2012 70
Salalah Rotana Resort 5-star 2014 400
Samahrem Village for Hotel Apartment 3-star 2012 204
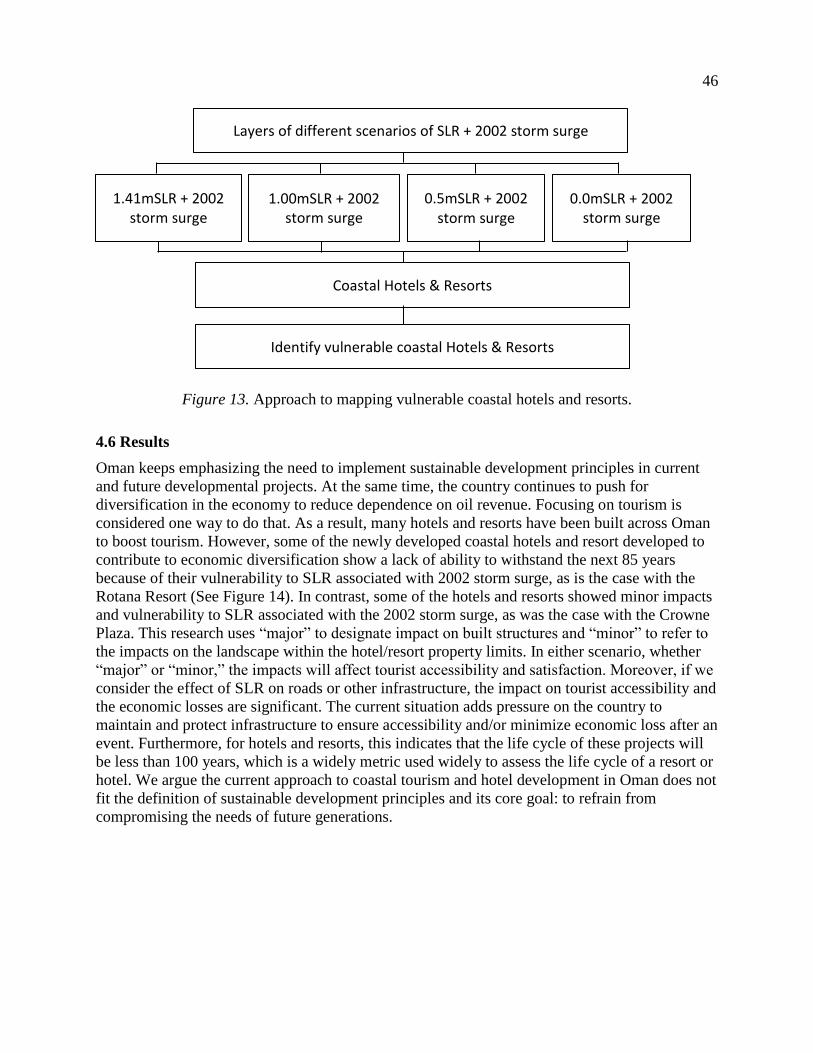
46
Figure 13. Approach to mapping vulnerable coastal hotels and resorts.
4.6 Results
Oman keeps emphasizing the need to implement sustainable development principles in current
and future developmental projects. At the same time, the country continues to push for
diversification in the economy to reduce dependence on oil revenue. Focusing on tourism is
considered one way to do that. As a result, many hotels and resorts have been built across Oman
to boost tourism. However, some of the newly developed coastal hotels and resort developed to
contribute to economic diversification show a lack of ability to withstand the next 85 years
because of their vulnerability to SLR associated with 2002 storm surge, as is the case with the
Rotana Resort (See Figure 14). In contrast, some of the hotels and resorts showed minor impacts
and vulnerability to SLR associated with the 2002 storm surge, as was the case with the Crowne
Plaza. This research uses “major” to designate impact on built structures and “minor” to refer to
the impacts on the landscape within the hotel/resort property limits. In either scenario, whether
“major” or “minor,” the impacts will affect tourist accessibility and satisfaction. Moreover, if we
consider the effect of SLR on roads or other infrastructure, the impact on tourist accessibility and
the economic losses are significant. The current situation adds pressure on the country to
maintain and protect infrastructure to ensure accessibility and/or minimize economic loss after an
event. Furthermore, for hotels and resorts, this indicates that the life cycle of these projects will
be less than 100 years, which is a widely metric used widely to assess the life cycle of a resort or
hotel. We argue the current approach to coastal tourism and hotel development in Oman does not
fit the definition of sustainable development principles and its core goal: to refrain from
compromising the needs of future generations.
Layers of different scenarios of SLR + 2002 storm surge
1.41mSLR + 2002 storm surge
1.00mSLR + 2002 storm surge
0.5mSLR + 2002 storm surge
0.0mSLR + 2002 storm surge
Coastal Hotels & Resorts
Identify vulnerable coastal Hotels & Resorts

47
Table 6
Impacts of SLR on Coastal Hotels and Resorts Along the Coast of Dhofar
Hotels/Resorts Name
1.41m SLR
+2002 storm
surge
1.00m SLR
+2002 storm
surge
0.5m SLR
+2002 storm
surge
0.0m SLR
+2002 storm
surge
Hilton Salalah Resort No Impact No Impact No Impact No Impact
Crown Plaza Salalah Hotel Major Impact Major Impact Major Impact Minor Impact
Juwirah Hotel Major Impact Major Impact Minor Impact Minor Impact
Salalah Beach Villa Major Impact Major Impact Major Impact Minor Impact
Salalah Hilton Minor Impact No Impact No Impact No Impact
Salalah Rotana Resort Major Impact Major Impact Major Impact Major Impact
Samahrem Village for
Hotel Apartment No Impact No Impact No Impact No Impact
Marriot Resort – Salalah
Beach Major Impact Minor Impact Minor Impact Minor Impact
Figure 14. Rotana and Juwirah Hotels’ impacts from various scenarios of SLR and storm surge,.
(Images from ArcGIS, 2017)
0.0m SLR 0.5m SLR
1.0m SLR 1.41m SLR
48
4.7 Conclusion
The aim of this chapter is to demonstrate the importance of integrating science into tourism
development and planning in Oman to impacts to sustainable development can be quantified and
measured. The government can use such integration to encourage sustainable tourism
development across Oman.
Depending on natural resources to attract tourism to Oman will stress the environment and
possibly destroy the very element that people find attractive. Expanding tourism development
without integrating science with planning and without being sensitive to natural resources
generates uncertainty and creates stress on Oman in the long term. Finding a balance that
includes protecting the natural environment and integrating science to minimize climate change
impacts is significant for maintaining long-term sustainable coastal tourism growth in Oman.
The essence of SD is to “sustain” the natural and physical environment as developments are
taking place, and this applies to coastal tourism development. Working with the concepts of
living in harmony with nature and preparing for the future is a strategy that could be used to
create sustainable coastal tourism. Oman can benefit by adopting strategies that integrate science
and consider impacts from climate change such as SLR, both in its current and its future tourism
development approach. As these strategies are woven within coastal tourism development, Oman
can prosper in the 21st century, and tourism then can contribute to the national economy without
destroying so much of what the country has to offer.
49
CHAPTER 5
5.1 Introduction
The impacts from global warming and climate change can be seen throughout Earth. A few
research studies have shown that a warmer climate resulting from climate change increases the
risk of frequent flooding globally by 42% (Hirabayashi et al., 2013; Milly, Wetherald, Dunne, &
Delworth, 2002). Natural disasters will have an impact on the economy and the infrastructure,
and their consequences will increase due to the rising number of people living in, and increasing
economic activities located within, areas that are prone to flooding. Researchers from around the
world, including the United States, China, Egypt, and Saudi Arabia, understand the importance
of quantifying the impacts resulting from the flooding of built areas (Al Saud, 2010; Liang et al.,
2011; Mastin, 2009; Youssef, Pradhan, & Hassan, 2011). For example, New Orleans in the
United States was exposed to extreme water levels and storm surge in 2005 (Hurricane Katrina),
resulting in major physical damage to the city and in social and economic disruption (Hanson et
al., 2011). During the last decade in the United States, annual losses from flooding reached tens
of billions of U.S. dollars, and thousands of people were killed each year (Hirabayashi et al.,
2013). In the Netherlands, two-dimensional hydrodynamic modeling was used to estimate the
flood extent and inundation depths for specific floods in order to calculate the damage (Bouwer,
Bubeck, Wagtendonk, & Aerts, 2009). The developed countries recognized the magnitude of the
damage caused by natural disasters to their infrastructure, and they are studying ways to mitigate
the impacts of such events.
Furthermore, about 65% of Asia’s population is living beneath the 100-year flood water level
(Guzman, Martine, McGranahan, Schensul, & Tacoli, 2009). Indonesia is another example of a
country that has been exposed to major flooding—in 2002, 2007, and 2013—that resulted in
displacement of more than half a million of people and the closure of infrastructure, such as
highways, airports, and rail lines. For, Jakarata, researchers used two-dimensional hydrodynamic
modeling to assess flood risk to estimate the vulnerabilities of the infrastructure and the cities
(Budiyono et al., 2015). Many researchers have already discussed the need for quantitative
assessments that would measure the impact of climate change on urban areas and infrastructure
given the lack of these types of studies in areas throughout North, Central, and West Asia,
including Oman (Hijioka et al., 2014; Watson, Zinyowera, & Moss, 1998). These assessments
are needed as it is anticipated that the impact of climate change resulting from intense events will
have negative consequences on the efforts toward sustainable development pursued by most of
the countries in Asia (Hijioka et al., 2014). For example, many Asian coasts are already exposed
to threats from flooding and coastal inundation (Hijioka et al., 2014; Revi et al., 2014). These
studies reveal the vulnerability of the infrastructure of Asian cities and the threat to future
development and populations posed by the effects of climate change on flooding.
In addtion, flash flooding in arid regions is considered one of the most destructive natural
catastrophes (Cools et al., 2012). In an arid country, flash wadi flooding is a common
phenomenon occurring when an extreme rainfall event is experienced over a short period. Flash
flooding takes place rapidly as flood waters flow over rugged watersheds that are already
extremely dry (Subyani, 2011). This event causes damage to infrastructure and results in both
50
economic and human loss—as observed in the aftermath of the impacted areas of Makkah in
2005 and of Dhofar (southern Oman) in 2002.
Natural disasters occurring in Oman will have major effects on society. Due to the consequences
of climate change, flooding from the coast or the fluvial system is often considered the most
hazardous event facing the country’s infrastructure and population, and threatens future
development. In developing countries, economic and infrastructural losses due to the loss of lives
resulting from natural hazards are a major concern since natural hazards account for 85% of lives
lost (Dao & Peduzzi, 2004). The exposure to the physical and economic threat of flooding is
predicted to increase within developing countries. For example, globally, Oman ranked fourth
for coastal flooding, with approximately 11.983% of its population exposed to flooding between
1970 and 2010. The impact of flood events on society, the economy, and infrastructure in Oman
is likely to continue to increase as a result of climate change that is projected to increase the
frequency and magnitude of flooding.
Oman will undoubtedly be impacted by climate change and flooding. According to Ahmed and
Choudri (2012), Oman is vulnerable to the impacts of climate change as a result of the
significant increase in average temperatures, precipitation that is both increasingly irregular and
reduced in quantity, sea level rise (SLR), and desertification. Recent research indicates that
Oman is frequently exposed to storms and heavy rain as a result of warmer temperatures near the
ocean (Al Hatrushi & Charabi, 2016; Al Rawas, Hewawasam, Al Wardy, & Charabi, 2016; Al
Wardy, Al Rawas, & Charabi, 2016). Oman also has the potential to be exposed frequently to
tropical depression and cyclonic storms. For instance, scientists predict that, by 2050, extreme
rainfall events will be more frequent, with a return period of between 49% and 52% (Charabi, Al
Wardy, & Al Rawas, 2016). In addition, the topographic features of Oman increase the potential
for flash wadi flooding that could result in significant societal and infrastructural damage to built
areas. Therefore, understanding and simulating the impacts of storm surge and flash wadi
flooding simultaneously is significant.
Furthermore, in regard to development and urbanization in Oman, city planning has adapted to
the low probability of extreme natural flooding (Belqacem, 2010). Oman also has limited
historical loss data and little simulations of loss events. Therefore, spatial models are needed to
provide a realistic range of potential damage to infrastructure and threats to urbanization. This is
particularly important for southern Oman, which will be exposed to frequent storms and cyclones
of higher intensities, as was indicated in a 2013 report of the Ministry of Environment and
Climate Affairs (MECA). In addition, researchers have shown that the precipitation intensity in
the Salalah area will increase (Al-Habsi, Gunawardhana, & Al-Rawas, 2015). The vulnerability
of the country’s population and its infrastructure largely runs parallel to its level of development
and the quality of its environment (Dao & Peduzzi, 2004; Peduzzi, Dao, Herold, & Mouton,
2009). Though surplus rainfall, exceeding 50 mm per day, rarely falls in Oman, when it does, it
brings severe consequences, such as flash flooding, human loss, and land degradation (Kwarteng
et al., 2009). The socioeconomic developmental progress that Oman has experienced during the
last three decades—especially during the 2000s—has made the country vulnerable to the impacts
of climate change. This is due to Oman’s frequent exposure to natural disasters, including the
2002 event in Dhofar, which cost the country approximately $50 million in damages to
infrastructure, cities, and agricultural lands. For that reason, assessing the impacts of climate
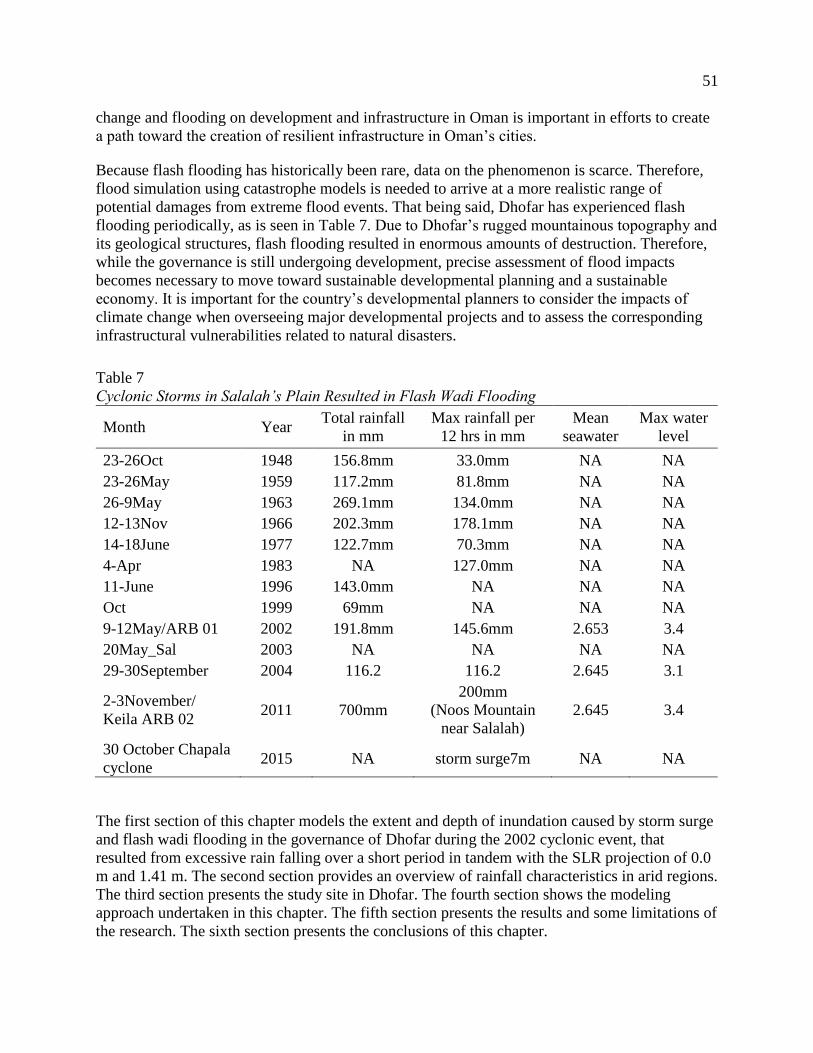
51
change and flooding on development and infrastructure in Oman is important in efforts to create
a path toward the creation of resilient infrastructure in Oman’s cities.
Because flash flooding has historically been rare, data on the phenomenon is scarce. Therefore,
flood simulation using catastrophe models is needed to arrive at a more realistic range of
potential damages from extreme flood events. That being said, Dhofar has experienced flash
flooding periodically, as is seen in Table 7. Due to Dhofar’s rugged mountainous topography and
its geological structures, flash flooding resulted in enormous amounts of destruction. Therefore,
while the governance is still undergoing development, precise assessment of flood impacts
becomes necessary to move toward sustainable developmental planning and a sustainable
economy. It is important for the country’s developmental planners to consider the impacts of
climate change when overseeing major developmental projects and to assess the corresponding
infrastructural vulnerabilities related to natural disasters.
Table 7
Cyclonic Storms in Salalah’s Plain Resulted in Flash Wadi Flooding
Month Year Total rainfall
in mm
Max rainfall per
12 hrs in mm
Mean
seawater
Max water
level
23-26Oct 1948 156.8mm 33.0mm NA NA
23-26May 1959 117.2mm 81.8mm NA NA
26-9May 1963 269.1mm 134.0mm NA NA
12-13Nov 1966 202.3mm 178.1mm NA NA
14-18June 1977 122.7mm 70.3mm NA NA
4-Apr 1983 NA 127.0mm NA NA
11-June 1996 143.0mm NA NA NA
Oct 1999 69mm NA NA NA
9-12May/ARB 01 2002 191.8mm 145.6mm 2.653 3.4
20May_Sal 2003 NA NA NA NA
29-30September 2004 116.2 116.2 2.645 3.1
2-3November/
Keila ARB 02 2011 700mm
200mm
(Noos Mountain
near Salalah)
2.645 3.4
30 October Chapala
cyclone 2015 NA storm surge7m NA NA
The first section of this chapter models the extent and depth of inundation caused by storm surge
and flash wadi flooding in the governance of Dhofar during the 2002 cyclonic event, that
resulted from excessive rain falling over a short period in tandem with the SLR projection of 0.0
m and 1.41 m. The second section provides an overview of rainfall characteristics in arid regions.
The third section presents the study site in Dhofar. The fourth section shows the modeling
approach undertaken in this chapter. The fifth section presents the results and some limitations of
the research. The sixth section presents the conclusions of this chapter.
52
5.2 Rainfall Characteristics in Arid Regions
Levels of rainfall in arid and semi-arid regions are marked by variability in space, time, quantity,
and duration (Abahussain et al., 2002; da Silva, 2004; Tabari, Abghari, & Hosseinzadeh Talaee,
2012; Watson et al., 1998). For example, Bahrain, an arid and semi-arid country, features
extreme cool-wet and extreme hot-dry seasons. This climate has resulted in variation in the
rainfall frequency, duration, and intensity because rainfall levels are low, irregular, seasonal, and
variable. This high variability has resulted in an inability to achieve water balance. Bahrain’s
climate variability has shifted the rainfall pattern; some months have become wetter and some
drier (Elagib & Abdu, 1997). Moreover, a study by Graef and Haigis (2001) shows that in Niger,
which is a semi-arid region, the pattern of rainfall is spatially and temporally variable—the
rainfall amount varies within a few kilometers on different time scales, resulting in unpredictable
crop yields. This high variability of precipitation in time and space in arid and semi-arid regions
is due to the intensity and short duration of flash flooding events in these areas. This results from
storms with a high degree of spatial variability, even for large catchments (Mays, 2001; Zeller,
1990).
Oman, as an arid and semi-arid country, is exposed to the variability and fluctuations of rainfall
(Abahussain et al., 2002). Rainfall in Oman is highly variable and irregular, and the geographical
features in different locations clearly play a role in shaping these variations, due to the levels of
average annual rainfall distribution in Oman as they vary throughout the country. For example,
the mean annual rainfall in Oman varies from a low of about 50 mm in the desert to a high of
200–300 mm in the mountains. Overall, Oman receives about 9.5 billion m3 of rainfall per year;
80% evaporates, and the other 20% either flows as surface water or joins directly with the
underground reservoirs (MRMWR, 2015). Oman also features three different arid regions of
high plains and foothills, that receive between 100 and 250 mm of rainfall; a semi-arid region of
the mountain slopes and summits of Northern Oman, that receive rainfall between 250 - 500 mm;
and a hyper-arid region along the coasts and plains, which receives less than 100 mm of rainfall
(Al-Ajmi, Idrees, & Al-Hatrushi, 2013; Charabi & Al-Hatrushi, 2010; Ghazanfar & Fisher, 2013;
Kwarteng et al., 2009).
The high elevation of the rugged mountains extending to the southeast part of the Arabian
Peninsula and the seasonal reversal of pressure and winds over the Arabian Peninsula along with
the neighboring Arabian Sea, are among the main causes of the varying rainfall distributions
over Oman’s regions. Because of Oman’s geographical location on the southeast part of the
Arabian Peninsula, it is affected by the Indian Ocean monsoon winds (Al-Rawas, 2009; MECA,
2013). The exposure to various seasonal reversals of pressure and winds create different
climates. The northwest and northeast winds result in rainfall during winter on the mountains and
the coastal regions. On the other hand, the summer monsoon winds dominate the south-central
areas, that get light showers from both summer monsoons and winter local troughs, while heavier
rainfall generally occurs at higher altitudes (Babikir, 1985; Charabi & Al-Hatrushi, 2010).
Therefore, Oman experiences two different rainy seasons: summer (from May to October),
occurring in Southern Oman; and winter (from November to April), that takes place in Northern
Oman (Al-Rawas, 2009; MECA, 2013; Tudhope et al., 1996). Clearly, the climate varies across
the country.
53
Rainfall in Northern Oman results from thunderstorms during the winter due to mid-latitude
westerly depression by polar-front jet streams. In contrast, the rainfall in the South results from
the monsoon season that dominates the Dhofar Mountains and the Salalah Plain (located on the
southern coast) and by the fall season in July and August, due to the southwest monsoon. The
rainfall months in the interior region are February and March (Al-Ajmi et al., 2013; MRMWR,
2015).
Due to Oman’s exposure to four meteorological systems of air masses coming from four
different directions, different rainfall events occur. For instance, convective rain storms could
take place at any time of the year but do so more frequently during the summer months. Cold-
frontal storms occur during winter and early spring while on-shore monsoon tides take place
from June to September, causing a frequent drizzle in Dhofar. Tropical cyclones approaching
from the Arabian Sea develop every 3 years—result in the development of intense storms nearly
once every 5 years in Dhofar and once every 10 years in Muscat, the capital of Oman (Charabi &
Al-Hatrushi, 2010; Kwarteng et al., 2009; MECA, 2013).
Rainfall in Dhofar reaches its peak in the mountains with an annual average of 184.6 mm, in
contrast to the Salalah Plain, which gets a yearly average rainfall of 112 mm. However, the
monsoon season in Dhofar brings about rainfall levels of between 100 and 400 mm (Dorvlo &
Vijaya Kumar, 2009). A study by Al-Ajmi and colleagues (2013) shows the 50-year prediction
for rainfall to be between1,048 and 565 mm in Al Hajar and the Dhofar Mountains respectively;
and an average annual maximum rainfall of 338 mm and 304 mm in the Salalah Plain and the
northwest coastal regions respectively. Being ready for the impacts of climate change with
regard to flooding risks to urban areas, infrastructure, and future developments and determining
the likely extent of flooding is important (Guzman et al., 2009). Being prepared for the
consequences of climate change on Oman’s development and infrastructure is the most effective
resilient approach.
5.3 Study Site
The research site for this chapter is located within the governance of Dhofar in Southern Oman.
Dhofar’s coastal plain is divided into three geomorphological areas: the mountainous area, the
intermediate zone area, and the plain (Forster & Magnan, n.d.). The peaks of Dhofar’s mountains
range from 1000 to 2000 m above mean sea level and dominate the southwestern part of the
country. This mountain range is represented by the Qairoon Hairiti station, which is 878.30 m
above mean sea level (Al-Ajmi et al., 2013). Topographic effects on precipitation, in addition to
the contact with various mountain rims and the presence of several narrow valleys, lead to a
range of different local climatic conditions (Charabi & Al-Hatrushi, 2010). Dhofar is known as a
tourist site for local and international visitors during its summer monsoon season (from June
through September), that allows the governance to contribute meaningfully to Oman’s economy
(Charabi, 2009).
This study focuses on the Zayk and Ghadow watersheds in Dhofar. The sites are selected
because of rainfall data available at15-minute intervals for ARB01 cyclonic storms in 2002. The
Zayk and Ghadow watersheds cover an area of 312.1 and 195.2 km2 respectively. Figure 15 is a
digital elevation map of the Zayk and Gadow watersheds and the built areas within them.
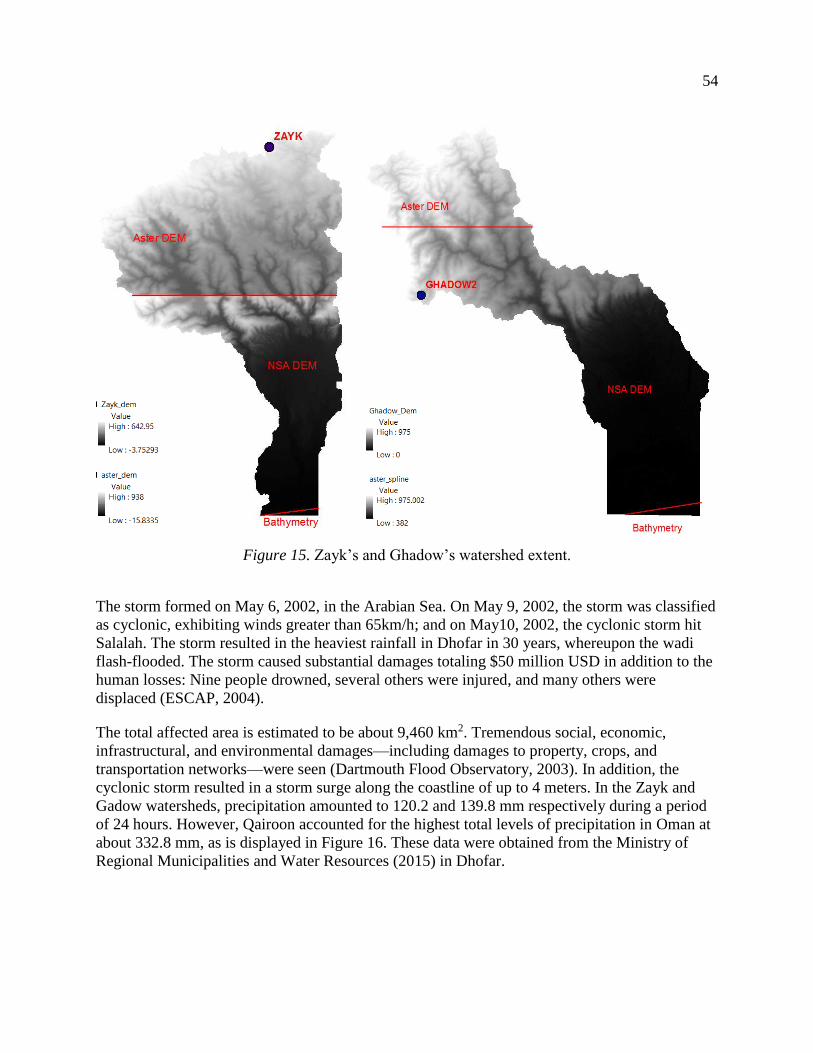
54
Figure 15. Zayk’s and Ghadow’s watershed extent.
The storm formed on May 6, 2002, in the Arabian Sea. On May 9, 2002, the storm was classified
as cyclonic, exhibiting winds greater than 65km/h; and on May10, 2002, the cyclonic storm hit
Salalah. The storm resulted in the heaviest rainfall in Dhofar in 30 years, whereupon the wadi
flash-flooded. The storm caused substantial damages totaling $50 million USD in addition to the
human losses: Nine people drowned, several others were injured, and many others were
displaced (ESCAP, 2004).
The total affected area is estimated to be about 9,460 km2. Tremendous social, economic,
infrastructural, and environmental damages—including damages to property, crops, and
transportation networks—were seen (Dartmouth Flood Observatory, 2003). In addition, the
cyclonic storm resulted in a storm surge along the coastline of up to 4 meters. In the Zayk and
Gadow watersheds, precipitation amounted to 120.2 and 139.8 mm respectively during a period
of 24 hours. However, Qairoon accounted for the highest total levels of precipitation in Oman at
about 332.8 mm, as is displayed in Figure 16. These data were obtained from the Ministry of
Regional Municipalities and Water Resources (2015) in Dhofar.
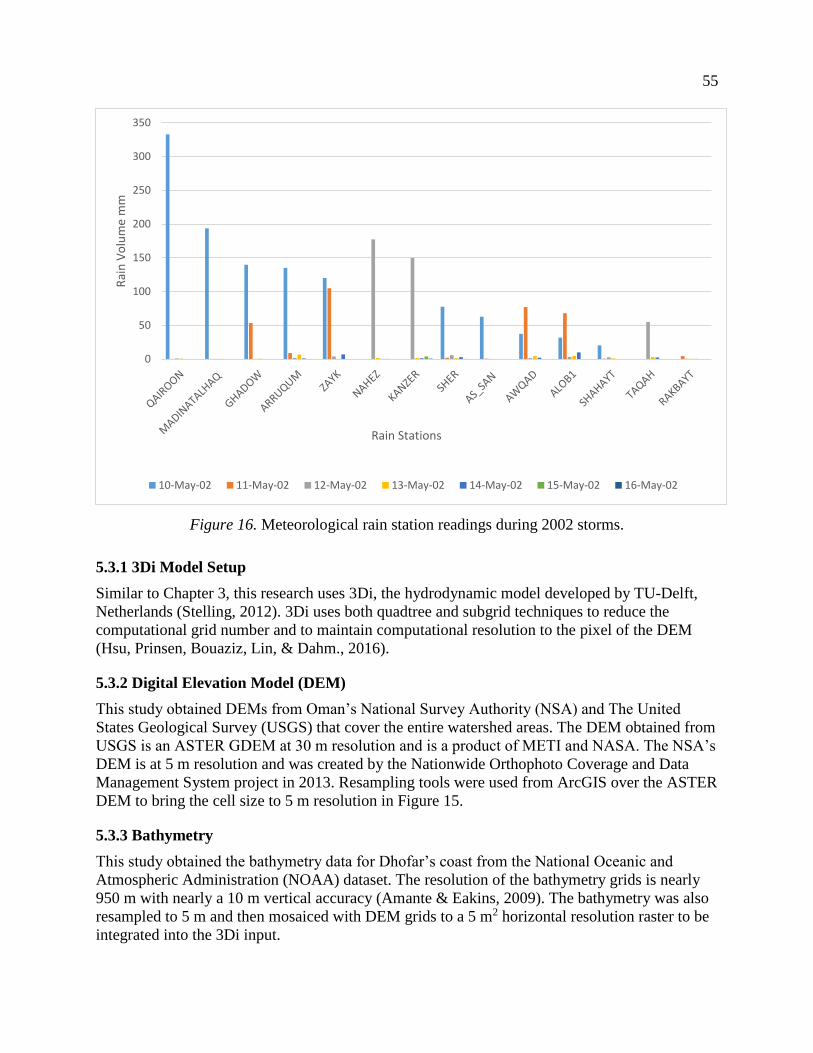
55
Figure 16. Meteorological rain station readings during 2002 storms.
5.3.1 3Di Model Setup
Similar to Chapter 3, this research uses 3Di, the hydrodynamic model developed by TU-Delft,
Netherlands (Stelling, 2012). 3Di uses both quadtree and subgrid techniques to reduce the
computational grid number and to maintain computational resolution to the pixel of the DEM
(Hsu, Prinsen, Bouaziz, Lin, & Dahm., 2016).
5.3.2 Digital Elevation Model (DEM)
This study obtained DEMs from Oman’s National Survey Authority (NSA) and The United
States Geological Survey (USGS) that cover the entire watershed areas. The DEM obtained from
USGS is an ASTER GDEM at 30 m resolution and is a product of METI and NASA. The NSA’s
DEM is at 5 m resolution and was created by the Nationwide Orthophoto Coverage and Data
Management System project in 2013. Resampling tools were used from ArcGIS over the ASTER
DEM to bring the cell size to 5 m resolution in Figure 15.
5.3.3 Bathymetry
This study obtained the bathymetry data for Dhofar’s coast from the National Oceanic and
Atmospheric Administration (NOAA) dataset. The resolution of the bathymetry grids is nearly
950 m with nearly a 10 m vertical accuracy (Amante & Eakins, 2009). The bathymetry was also
resampled to 5 m and then mosaiced with DEM grids to a 5 m2 horizontal resolution raster to be
integrated into the 3Di input.
0
50
100
150
200
250
300
350R
ain
Vo
lum
e m
m
Rain Stations
10-May-02 11-May-02 12-May-02 13-May-02 14-May-02 15-May-02 16-May-02
56
5.3.4 Water Level
Hourly tidal data were collocated from the National Hydrographic Office (ONHO) in Oman.
This study used the tidal and storm surge data from the 2002 event along Dhofar’s coast. Two
stations reported storm surge levels to be at 3.2 m in Marbat and at 3.12 m in the Port of Salalah.
Since 3Di has the capability of incorporating the data from dynamic tidal and storm surge
processes, the movement of changing water volumes over land surfaces over time is included.
This study simulated the oceanic storm surge of the 2002 event with SLR projection at 0.0 m and
1.41 m.
5.3.5 Initial Water-Boundaries and Water-Level Data for Watershed
Water boundaries were created to simulate virtual waves in 3Di to provide initial water-level
data. Each watershed had its own initial boundary generated along its boundary sections
(bathymetry).
5.3.6 Roughness and Infiltration Maps
3Di takes into account the fact that rainfall runoff can occur as interception, infiltration, and
evaporation, which makes the software suitable for urban application (Dahm et al., 2014). Both
the roughness map and the infiltration map were created by the author from a land-use map of
the digitized watersheds. The Manning’s n roughness values are shown in Table 8 (Kalyanapu,
Burian, & McPherson, 2010). The soil map was obtained from the Ministry of Agriculture and
Fisheries in Oman, and the soil infiltration rate is based on FAO guidelines. The infiltration rate
is based on the maximum infiltration rate of different land uses given in Table 9. Many factors
affect the infiltration rate, including soil type, soil moisture, and surface vegetation conditions.
However, the infiltration values in this research are constructed from a land-use map. The 3Di
model uses the maximum infiltration rate as a constant rate in time (Hsu et al., 2016).
57
Table 8
Roughness Values Used in This Study
Land use Manning’s n values
Agriculture/ Green Area 0.044
Developed area/High intensity 0.0404
Developed area/low & medium intensity 0.0678
Roads 0.012
Table 9
Infiltration Values Used in This Study
Land use Infiltration rate (mm/day)
Agriculture/ Green Area 120
Built Area 0.0
5.3.7 Rainfall Events
Dhofar’s coast has a history of exposure to frequent cyclone and storm events. The rainfall event
during May 10–12, 2002, has been selected for simulation because it represents the heaviest rain
in 30 years. The rainfall data from the two rainfall stations are shown in Figure 17. The
maximum precipitation level over a 5-minute period for the Zayk station is 11.4 mm; the
maximum level from 12 consecutive periods over the total duration of 1 hour is 38.8 mm; and
the daily total is 120.2 mm on May 10th and 105mm on May 11th. On the other hand, the
Ghadow station shows the maximum precipitation level over a 5-minute period at 7.2 mm; the
maximum level from 12 consecutive periods over the total duration of 1 hour is 42.6 mm; and
daily totals were 139.8 mm on May 10th and 53.6 mm on May 11th.
5.4 Results
The 3Di output simulation for the 2002 storm event of wadi Zayk and wadi Ghadow shows the
vulnerability of Dhofar’s urban area, infrastructure, and agricultural lands. This demonstrates the
need for resilient planning and infrastructure in Dhofar as a path toward a sustainable and
resilient developmental future. This study provides inundation results of wadi flooding and storm
surge during the 2002 event and represents the event in the most realistic way possible, given
that the simulation is based on the real 2002 storm event and real rainfall data. The simulation of
the 2002 event from this study included the dams constructed at the site after the 2002 event.
This means that the results of this simulation show what would happen at the site if a similar
storm were to take place at the site today. The 3Di model is able to provide a representation of
the entire wadi flooding and storm surge at a relatively high spatial resolution in which land-use
influencing infiltration and water movement are integrated.
The extent to which inundation, wadi flooding, and storm surge intersect with the buildings,
agricultural lands, and roads for both watersheds in the 3Di output allows the study to show the
risk to infrastructure, residential areas, and croplands affected by the inundation. This research
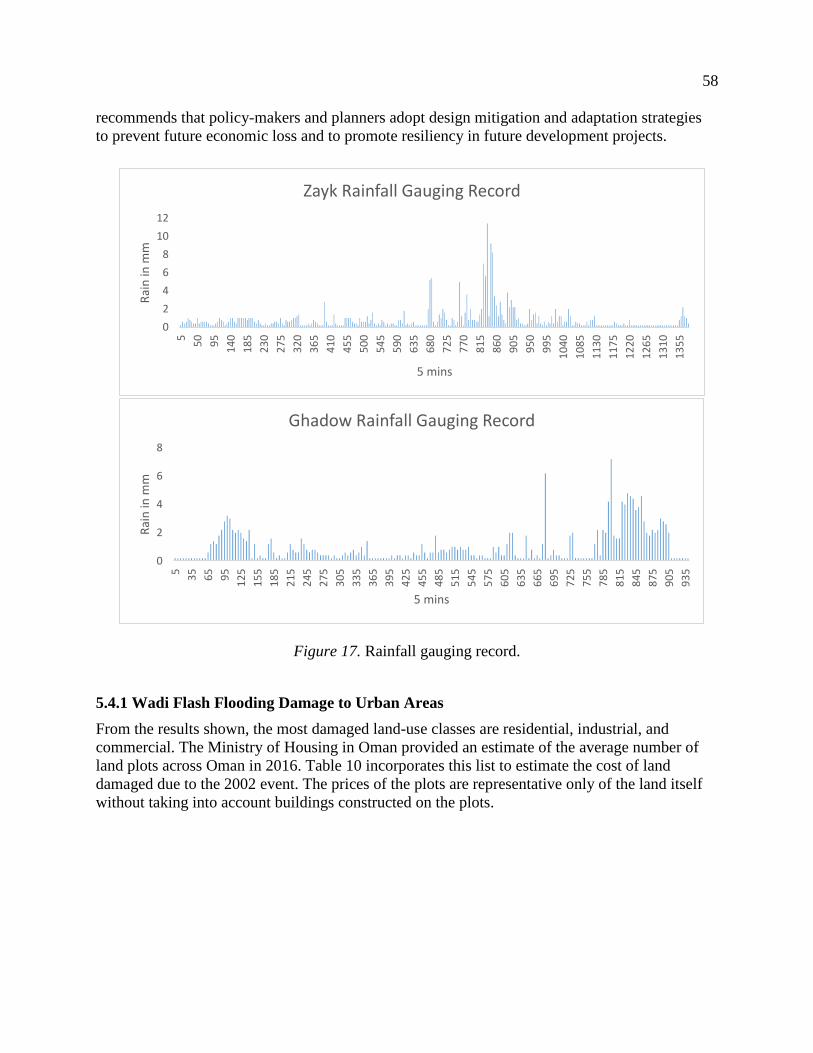
58
recommends that policy-makers and planners adopt design mitigation and adaptation strategies
to prevent future economic loss and to promote resiliency in future development projects.
Figure 17. Rainfall gauging record.
5.4.1 Wadi Flash Flooding Damage to Urban Areas
From the results shown, the most damaged land-use classes are residential, industrial, and
commercial. The Ministry of Housing in Oman provided an estimate of the average number of
land plots across Oman in 2016. Table 10 incorporates this list to estimate the cost of land
damaged due to the 2002 event. The prices of the plots are representative only of the land itself
without taking into account buildings constructed on the plots.
0
2
4
6
8
10
12
5
50
95
14
0
18
5
23
0
27
5
32
0
36
5
41
0
45
5
50
0
54
5
59
0
63
5
68
0
72
5
77
0
81
5
86
0
90
5
95
0
99
5
10
40
10
85
11
30
11
75
12
20
12
65
13
10
13
55
Rai
n in
mm
5 mins
Zayk Rainfall Gauging Record
0
2
4
6
8
5
35
65
95
12
5
15
5
18
5
21
5
24
5
27
5
30
5
33
5
36
5
39
5
42
5
45
5
48
5
51
5
54
5
57
5
60
5
63
5
66
5
69
5
72
5
75
5
78
5
81
5
84
5
87
5
90
5
93
5
Rai
n in
mm
5 mins
Ghadow Rainfall Gauging Record
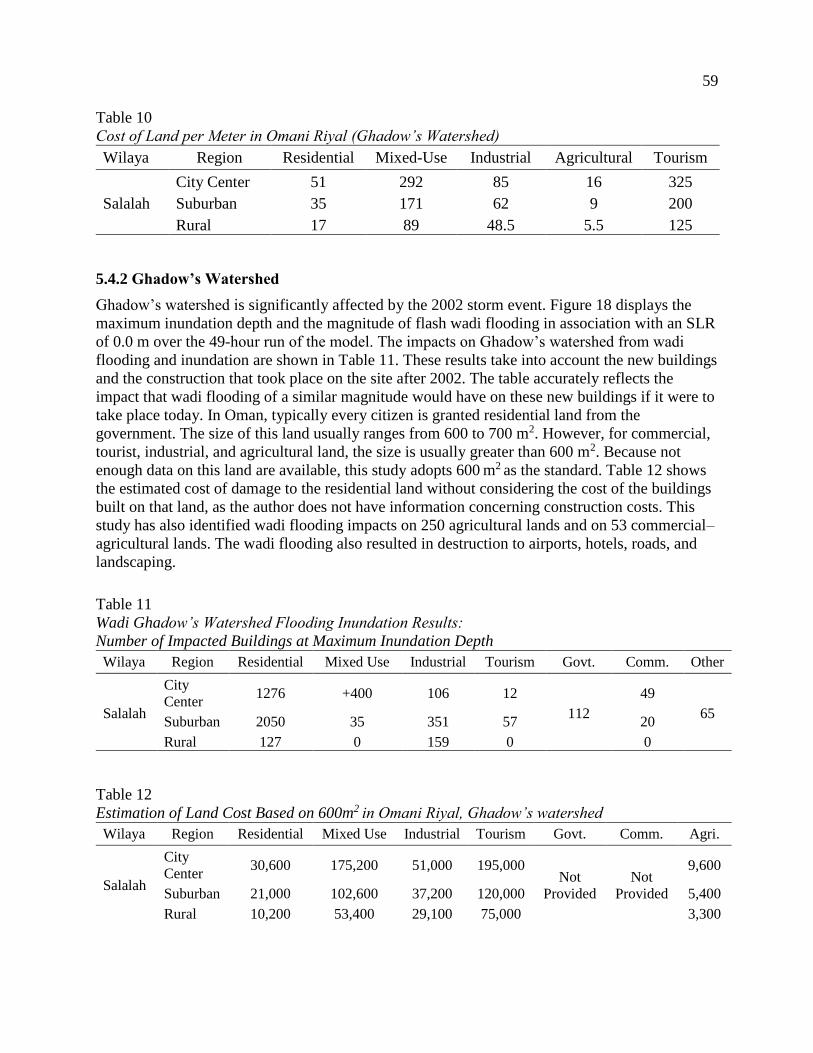
59
Table 10
Cost of Land per Meter in Omani Riyal (Ghadow’s Watershed)
Wilaya Region Residential Mixed-Use Industrial Agricultural Tourism
Salalah
City Center 51 292 85 16 325
Suburban 35 171 62 9 200
Rural 17 89 48.5 5.5 125
5.4.2 Ghadow’s Watershed
Ghadow’s watershed is significantly affected by the 2002 storm event. Figure 18 displays the
maximum inundation depth and the magnitude of flash wadi flooding in association with an SLR
of 0.0 m over the 49-hour run of the model. The impacts on Ghadow’s watershed from wadi
flooding and inundation are shown in Table 11. These results take into account the new buildings
and the construction that took place on the site after 2002. The table accurately reflects the
impact that wadi flooding of a similar magnitude would have on these new buildings if it were to
take place today. In Oman, typically every citizen is granted residential land from the
government. The size of this land usually ranges from 600 to 700 m2. However, for commercial,
tourist, industrial, and agricultural land, the size is usually greater than 600 m2. Because not
enough data on this land are available, this study adopts 600 m2 as the standard. Table 12 shows
the estimated cost of damage to the residential land without considering the cost of the buildings
built on that land, as the author does not have information concerning construction costs. This
study has also identified wadi flooding impacts on 250 agricultural lands and on 53 commercial–
agricultural lands. The wadi flooding also resulted in destruction to airports, hotels, roads, and
landscaping.
Table 11
Wadi Ghadow’s Watershed Flooding Inundation Results:
Number of Impacted Buildings at Maximum Inundation Depth
Table 12
Estimation of Land Cost Based on 600m2 in Omani Riyal, Ghadow’s watershed
Wilaya Region Residential Mixed Use Industrial Tourism Govt. Comm. Other
Salalah
City
Center 1276 +400 106 12
112
49
65 Suburban 2050 35 351 57 20
Rural 127 0 159 0 0
Wilaya Region Residential Mixed Use Industrial Tourism Govt. Comm. Agri.
Salalah
City
Center 30,600 175,200 51,000 195,000
Not
Provided
Not
Provided
9,600
Suburban 21,000 102,600 37,200 120,000 5,400
Rural 10,200 53,400 29,100 75,000 3,300
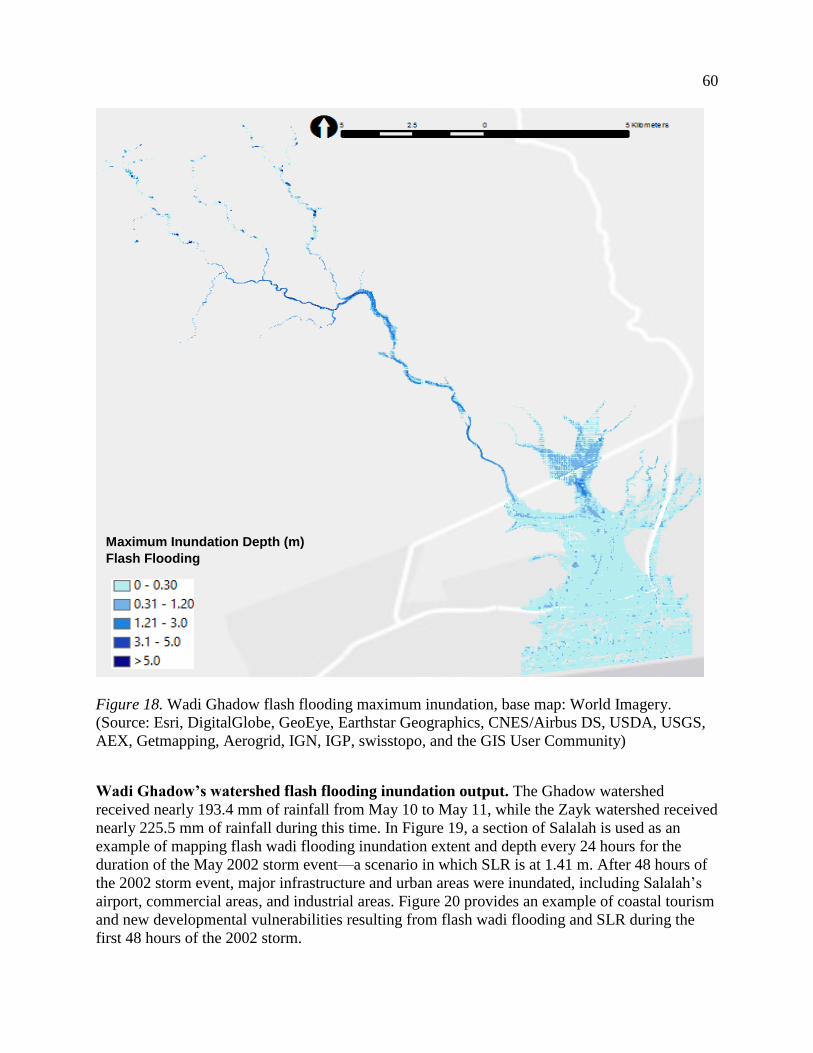
60
Figure 18. Wadi Ghadow flash flooding maximum inundation, base map: World Imagery.
(Source: Esri, DigitalGlobe, GeoEye, Earthstar Geographics, CNES/Airbus DS, USDA, USGS,
AEX, Getmapping, Aerogrid, IGN, IGP, swisstopo, and the GIS User Community)
Wadi Ghadow’s watershed flash flooding inundation output. The Ghadow watershed
received nearly 193.4 mm of rainfall from May 10 to May 11, while the Zayk watershed received
nearly 225.5 mm of rainfall during this time. In Figure 19, a section of Salalah is used as an
example of mapping flash wadi flooding inundation extent and depth every 24 hours for the
duration of the May 2002 storm event—a scenario in which SLR is at 1.41 m. After 48 hours of
the 2002 storm event, major infrastructure and urban areas were inundated, including Salalah’s
airport, commercial areas, and industrial areas. Figure 20 provides an example of coastal tourism
and new developmental vulnerabilities resulting from flash wadi flooding and SLR during the
first 48 hours of the 2002 storm.
Maximum Inundation Depth (m)
Flash Flooding
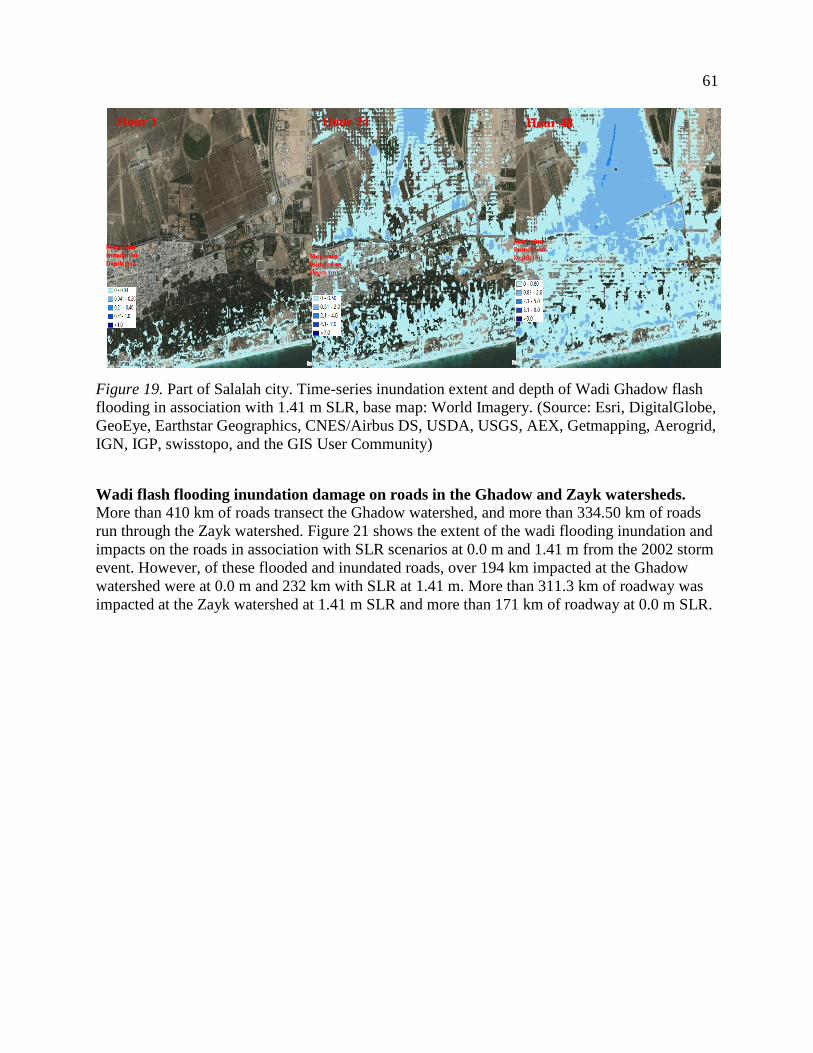
61
Figure 19. Part of Salalah city. Time-series inundation extent and depth of Wadi Ghadow flash
flooding in association with 1.41 m SLR, base map: World Imagery. (Source: Esri, DigitalGlobe,
GeoEye, Earthstar Geographics, CNES/Airbus DS, USDA, USGS, AEX, Getmapping, Aerogrid,
IGN, IGP, swisstopo, and the GIS User Community)
Wadi flash flooding inundation damage on roads in the Ghadow and Zayk watersheds. More than 410 km of roads transect the Ghadow watershed, and more than 334.50 km of roads
run through the Zayk watershed. Figure 21 shows the extent of the wadi flooding inundation and
impacts on the roads in association with SLR scenarios at 0.0 m and 1.41 m from the 2002 storm
event. However, of these flooded and inundated roads, over 194 km impacted at the Ghadow
watershed were at 0.0 m and 232 km with SLR at 1.41 m. More than 311.3 km of roadway was
impacted at the Zayk watershed at 1.41 m SLR and more than 171 km of roadway at 0.0 m SLR.
Maximum
Inundation
Depth (m)
Maximum
Inundation
Depth (m)
Hour 1 Hour 24
Maximum
Inundation
Depth (m)
Hour 48
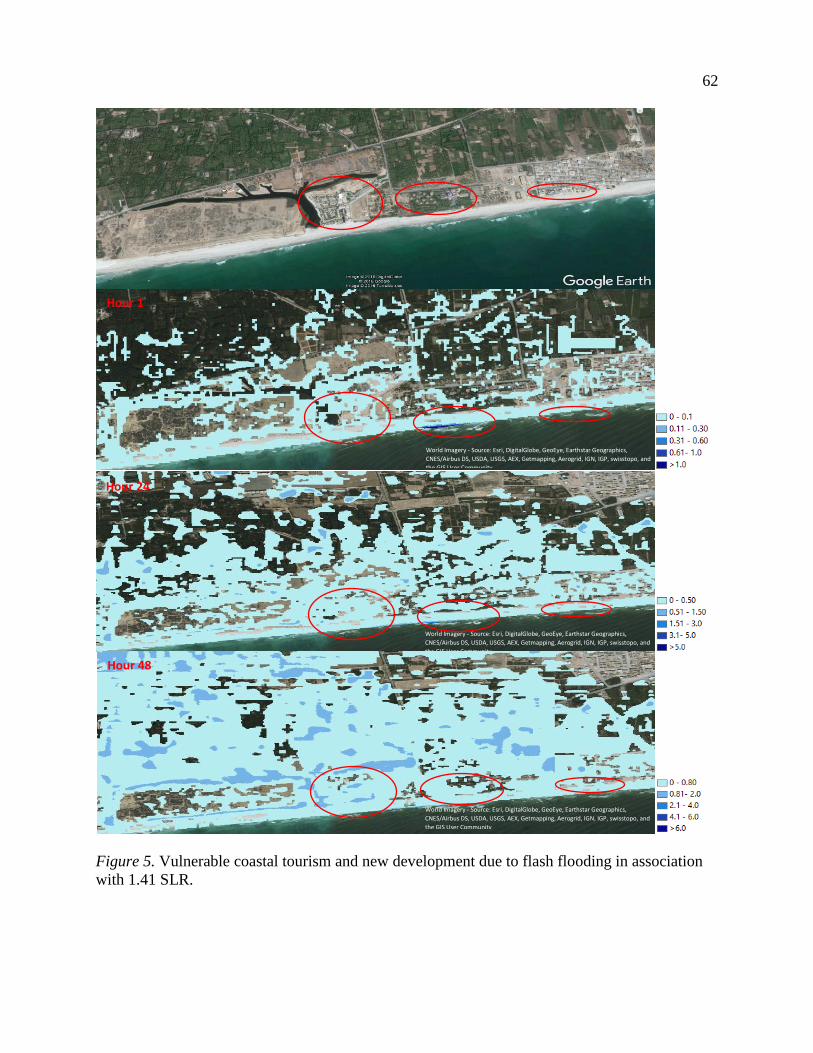
62
Figure 5. Vulnerable coastal tourism and new development due to flash flooding in association
with 1.41 SLR.
World Imagery - Source: Esri, DigitalGlobe, GeoEye, Earthstar Geographics,
CNES/Airbus DS, USDA, USGS, AEX, Getmapping, Aerogrid, IGN, IGP, swisstopo, and
the GIS User Community
Hour 1
World Imagery - Source: Esri, DigitalGlobe, GeoEye, Earthstar Geographics,
CNES/Airbus DS, USDA, USGS, AEX, Getmapping, Aerogrid, IGN, IGP, swisstopo, and
the GIS User Community
Hour 24
World Imagery - Source: Esri, DigitalGlobe, GeoEye, Earthstar Geographics,
CNES/Airbus DS, USDA, USGS, AEX, Getmapping, Aerogrid, IGN, IGP, swisstopo, and
the GIS User Community
Hour 48
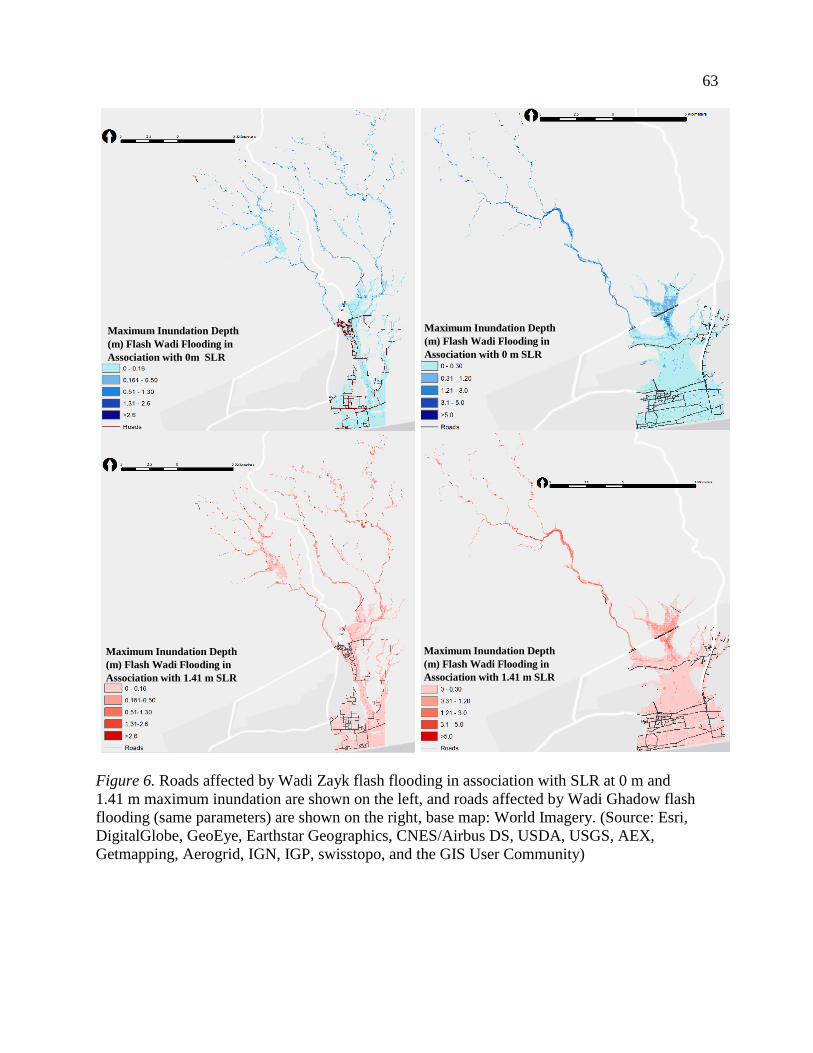
63
Figure 6. Roads affected by Wadi Zayk flash flooding in association with SLR at 0 m and
1.41 m maximum inundation are shown on the left, and roads affected by Wadi Ghadow flash
flooding (same parameters) are shown on the right, base map: World Imagery. (Source: Esri,
DigitalGlobe, GeoEye, Earthstar Geographics, CNES/Airbus DS, USDA, USGS, AEX,
Getmapping, Aerogrid, IGN, IGP, swisstopo, and the GIS User Community)
Maximum Inundation Depth
(m) Flash Wadi Flooding in
Association with 0m SLR
Maximum Inundation Depth
(m) Flash Wadi Flooding in
Association with 1.41 m SLR
Maximum Inundation Depth
(m) Flash Wadi Flooding in
Association with 0 m SLR
Maximum Inundation Depth
(m) Flash Wadi Flooding in
Association with 1.41 m SLR
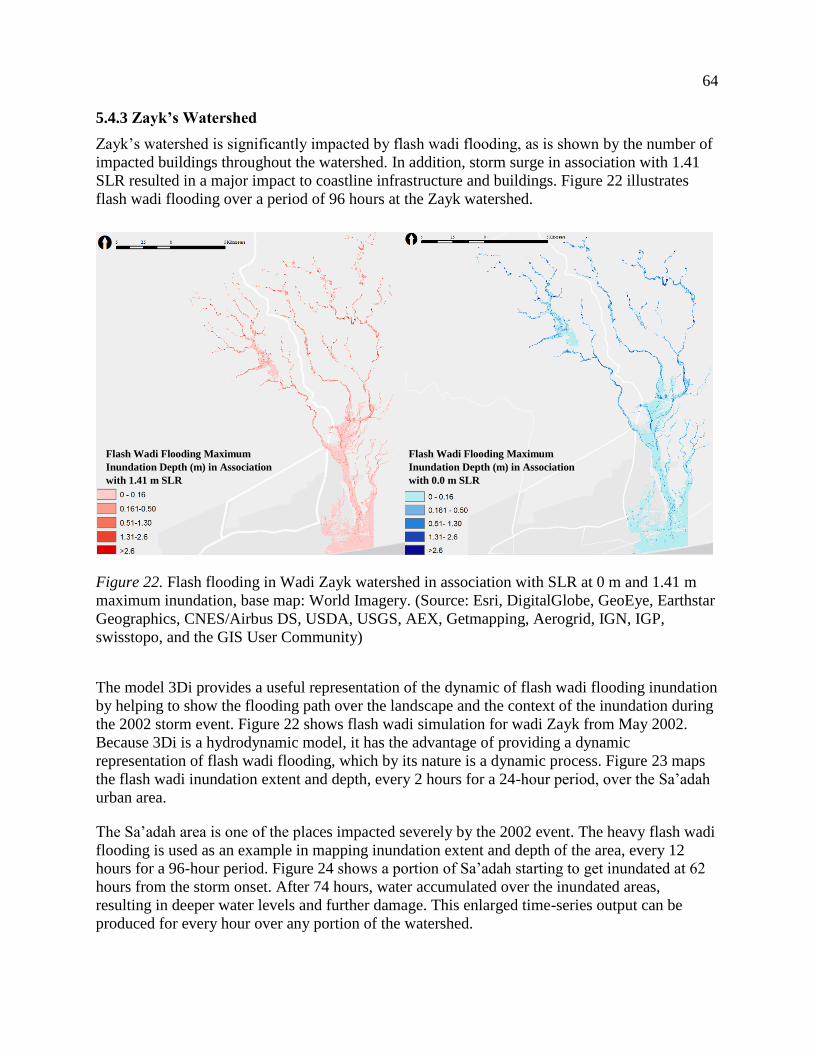
64
5.4.3 Zayk’s Watershed
Zayk’s watershed is significantly impacted by flash wadi flooding, as is shown by the number of
impacted buildings throughout the watershed. In addition, storm surge in association with 1.41
SLR resulted in a major impact to coastline infrastructure and buildings. Figure 22 illustrates
flash wadi flooding over a period of 96 hours at the Zayk watershed.
Figure 22. Flash flooding in Wadi Zayk watershed in association with SLR at 0 m and 1.41 m
maximum inundation, base map: World Imagery. (Source: Esri, DigitalGlobe, GeoEye, Earthstar
Geographics, CNES/Airbus DS, USDA, USGS, AEX, Getmapping, Aerogrid, IGN, IGP,
swisstopo, and the GIS User Community)
The model 3Di provides a useful representation of the dynamic of flash wadi flooding inundation
by helping to show the flooding path over the landscape and the context of the inundation during
the 2002 storm event. Figure 22 shows flash wadi simulation for wadi Zayk from May 2002.
Because 3Di is a hydrodynamic model, it has the advantage of providing a dynamic
representation of flash wadi flooding, which by its nature is a dynamic process. Figure 23 maps
the flash wadi inundation extent and depth, every 2 hours for a 24-hour period, over the Sa’adah
urban area.
The Sa’adah area is one of the places impacted severely by the 2002 event. The heavy flash wadi
flooding is used as an example in mapping inundation extent and depth of the area, every 12
hours for a 96-hour period. Figure 24 shows a portion of Sa’adah starting to get inundated at 62
hours from the storm onset. After 74 hours, water accumulated over the inundated areas,
resulting in deeper water levels and further damage. This enlarged time-series output can be
produced for every hour over any portion of the watershed.
Flash Wadi Flooding Maximum
Inundation Depth (m) in Association
with 1.41 m SLR
1.41 m SLR
Flash Wadi Flooding Maximum
Inundation Depth (m) in Association
with 0.0 m SLR
1.41 m SLR
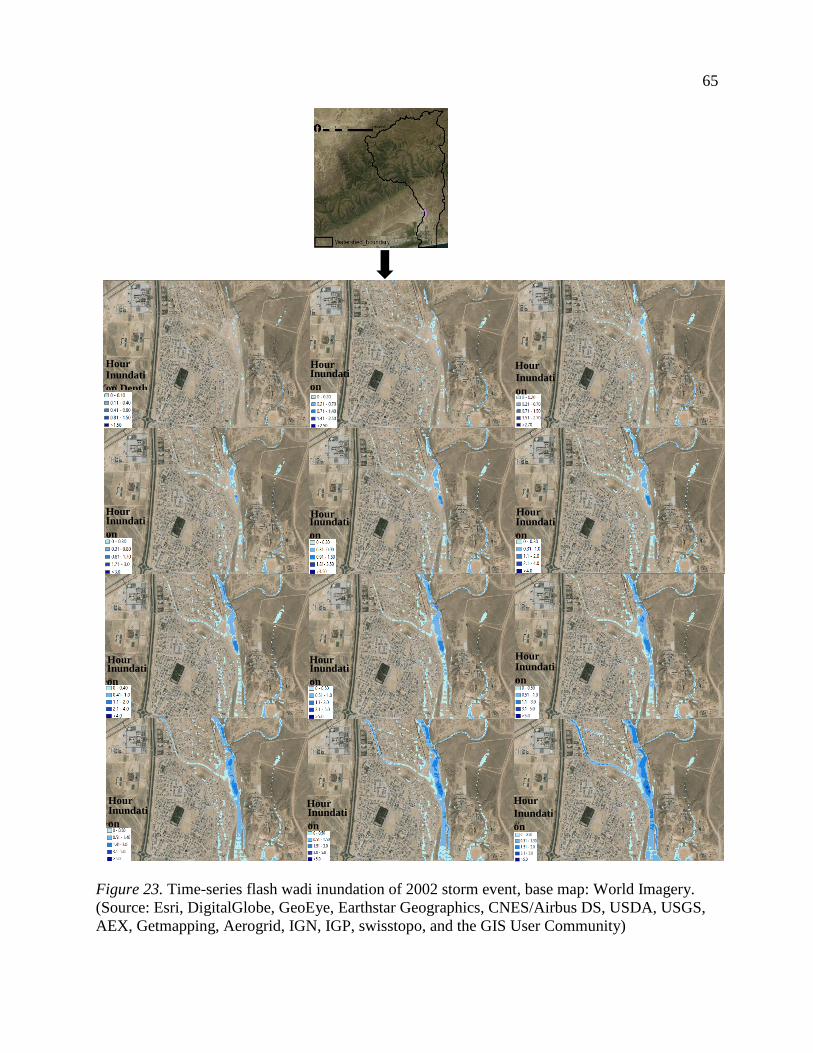
65
Figure 23. Time-series flash wadi inundation of 2002 storm event, base map: World Imagery.
(Source: Esri, DigitalGlobe, GeoEye, Earthstar Geographics, CNES/Airbus DS, USDA, USGS,
AEX, Getmapping, Aerogrid, IGN, IGP, swisstopo, and the GIS User Community)
Inundati
on Depth
Hour
2 Inundati
on
Depth
Hour
4
Hour
6 Inundati
on
Depth
Hour
8 Inundati
on
Depth
Hour
10 Inundati
on
Depth
Inundati
on
Depth
Hour
12
Hour
14 Inundati
on
Depth
Inundati
on
Depth
Hour
16
Hour
18 Inundati
on
Depth
Hour
20 Inundati
on
Depth
Hour
22 Inundati
on
Depth
Hour
24 Inundati
on
Depth
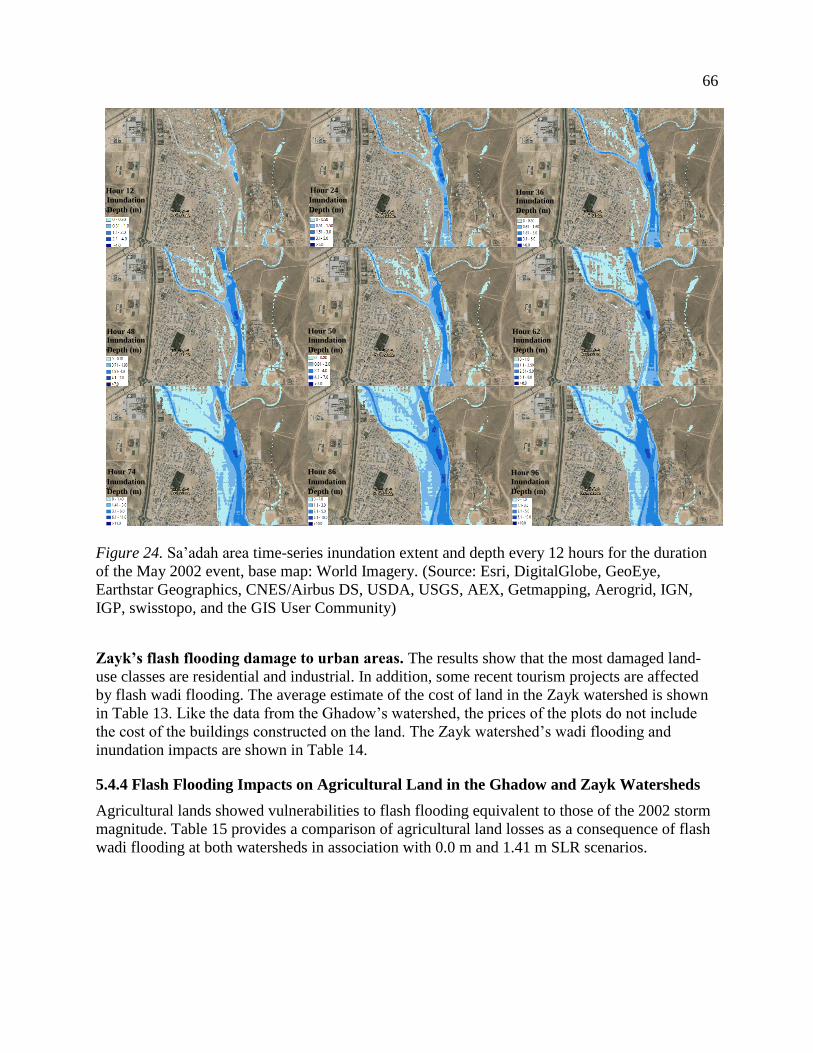
66
Figure 24. Sa’adah area time-series inundation extent and depth every 12 hours for the duration
of the May 2002 event, base map: World Imagery. (Source: Esri, DigitalGlobe, GeoEye,
Earthstar Geographics, CNES/Airbus DS, USDA, USGS, AEX, Getmapping, Aerogrid, IGN,
IGP, swisstopo, and the GIS User Community)
Zayk’s flash flooding damage to urban areas. The results show that the most damaged land-
use classes are residential and industrial. In addition, some recent tourism projects are affected
by flash wadi flooding. The average estimate of the cost of land in the Zayk watershed is shown
in Table 13. Like the data from the Ghadow’s watershed, the prices of the plots do not include
the cost of the buildings constructed on the land. The Zayk watershed’s wadi flooding and
inundation impacts are shown in Table 14.
5.4.4 Flash Flooding Impacts on Agricultural Land in the Ghadow and Zayk Watersheds
Agricultural lands showed vulnerabilities to flash flooding equivalent to those of the 2002 storm
magnitude. Table 15 provides a comparison of agricultural land losses as a consequence of flash
wadi flooding at both watersheds in association with 0.0 m and 1.41 m SLR scenarios.
Inundation
Depth (m)
Hour 12
Inundation
Depth (m)
Hour 24
Inundation
Depth (m)
Hour 36
Inundation
Depth (m)
Hour 48 Inundation
Depth (m)
Hour 50
Inundation
Depth (m)
Hour 62
Inundation
Depth (m)
Hour 74
Inundation
Depth (m)
Hour 86
Inundation
Depth (m)
Hour 96
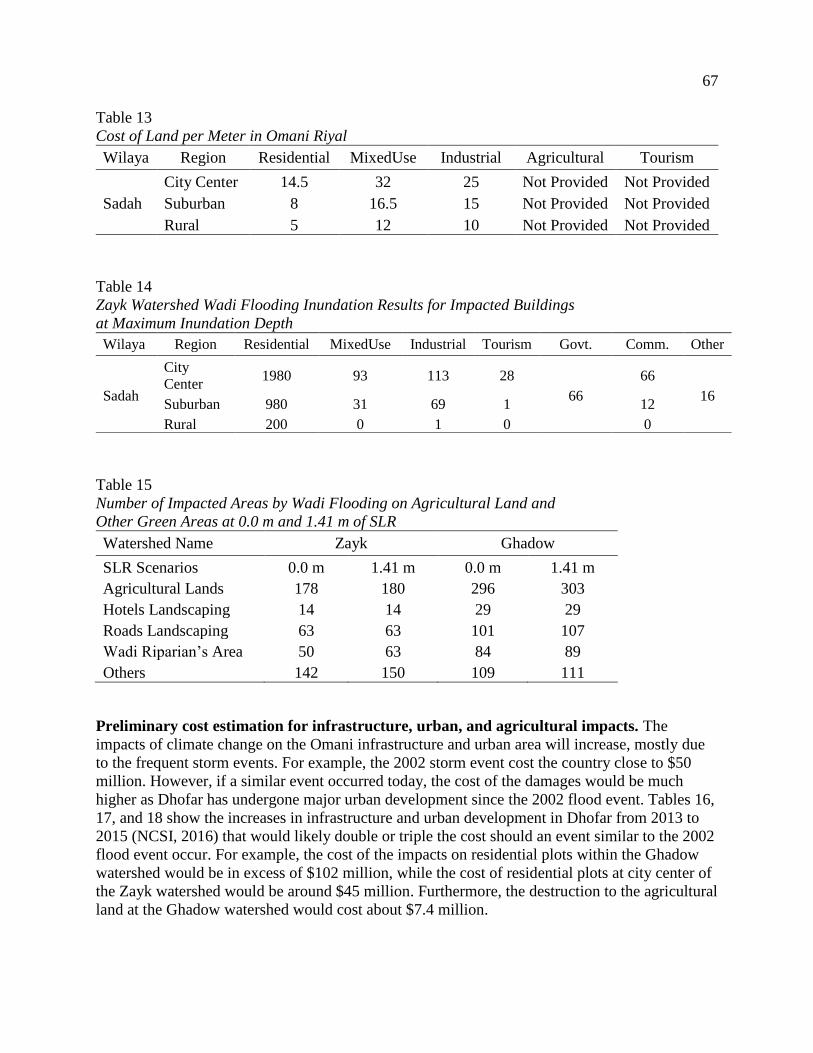
67
Table 13
Cost of Land per Meter in Omani Riyal
Wilaya Region Residential MixedUse Industrial Agricultural Tourism
Sadah
City Center 14.5 32 25 Not Provided Not Provided
Suburban 8 16.5 15 Not Provided Not Provided
Rural 5 12 10 Not Provided Not Provided
Table 14
Zayk Watershed Wadi Flooding Inundation Results for Impacted Buildings
at Maximum Inundation Depth
Table 15
Number of Impacted Areas by Wadi Flooding on Agricultural Land and
Other Green Areas at 0.0 m and 1.41 m of SLR
Watershed Name Zayk Ghadow
SLR Scenarios 0.0 m 1.41 m 0.0 m 1.41 m
Agricultural Lands 178 180 296 303
Hotels Landscaping 14 14 29 29
Roads Landscaping 63 63 101 107
Wadi Riparian’s Area 50 63 84 89
Others 142 150 109 111
Preliminary cost estimation for infrastructure, urban, and agricultural impacts. The
impacts of climate change on the Omani infrastructure and urban area will increase, mostly due
to the frequent storm events. For example, the 2002 storm event cost the country close to $50
million. However, if a similar event occurred today, the cost of the damages would be much
higher as Dhofar has undergone major urban development since the 2002 flood event. Tables 16,
17, and 18 show the increases in infrastructure and urban development in Dhofar from 2013 to
2015 (NCSI, 2016) that would likely double or triple the cost should an event similar to the 2002
flood event occur. For example, the cost of the impacts on residential plots within the Ghadow
watershed would be in excess of $102 million, while the cost of residential plots at city center of
the Zayk watershed would be around $45 million. Furthermore, the destruction to the agricultural
land at the Ghadow watershed would cost about $7.4 million.
Wilaya Region Residential MixedUse Industrial Tourism Govt. Comm. Other
Sadah
City
Center 1980 93 113 28
66
66
16 Suburban 980 31 69 1 12
Rural 200 0 1 0 0
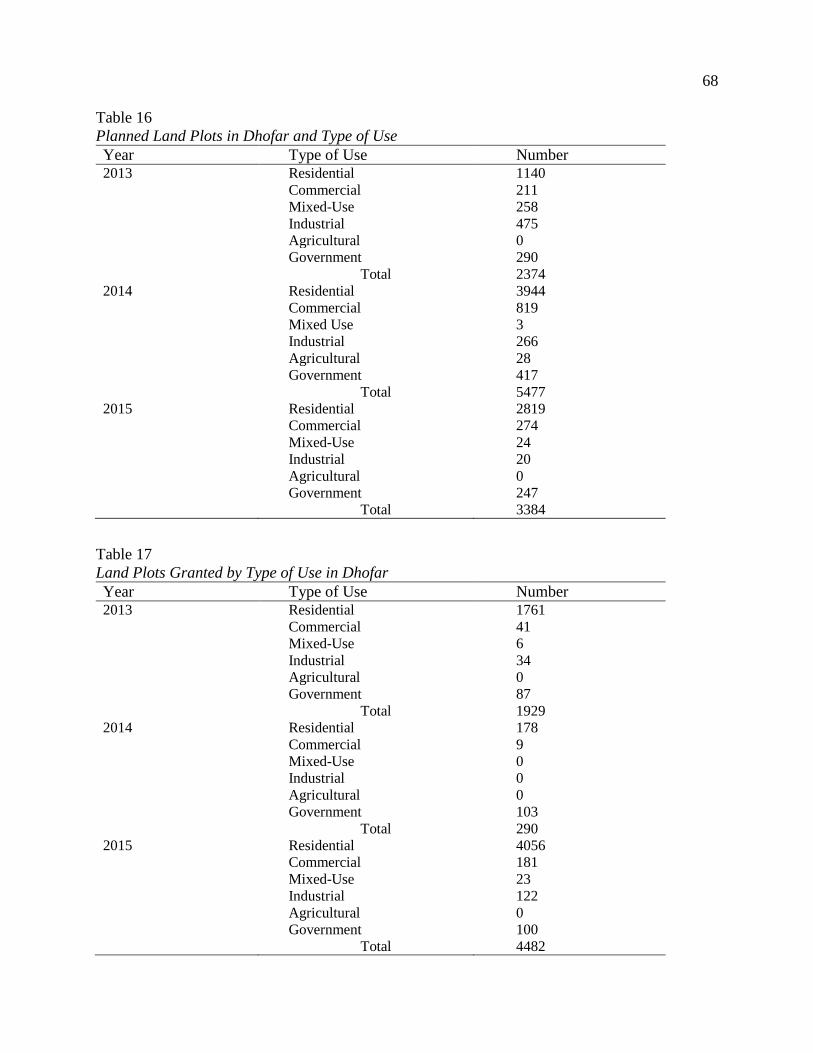
68
Table 16
Planned Land Plots in Dhofar and Type of Use
Year Type of Use Number 2013 Residential 1140
Commercial 211
Mixed-Use 258
Industrial 475
Agricultural 0
Government 290
Total 2374
2014 Residential 3944
Commercial 819
Mixed Use 3
Industrial 266
Agricultural 28
Government 417
Total 5477
2015 Residential 2819
Commercial 274
Mixed-Use 24
Industrial 20
Agricultural 0
Government 247
Total 3384
Table 17
Land Plots Granted by Type of Use in Dhofar
Year Type of Use Number 2013 Residential 1761
Commercial 41
Mixed-Use 6
Industrial 34
Agricultural 0
Government 87
Total 1929
2014 Residential 178
Commercial 9
Mixed-Use 0
Industrial 0
Agricultural 0
Government 103
Total 290
2015 Residential 4056
Commercial 181
Mixed-Use 23
Industrial 122
Agricultural 0
Government 100
Total 4482
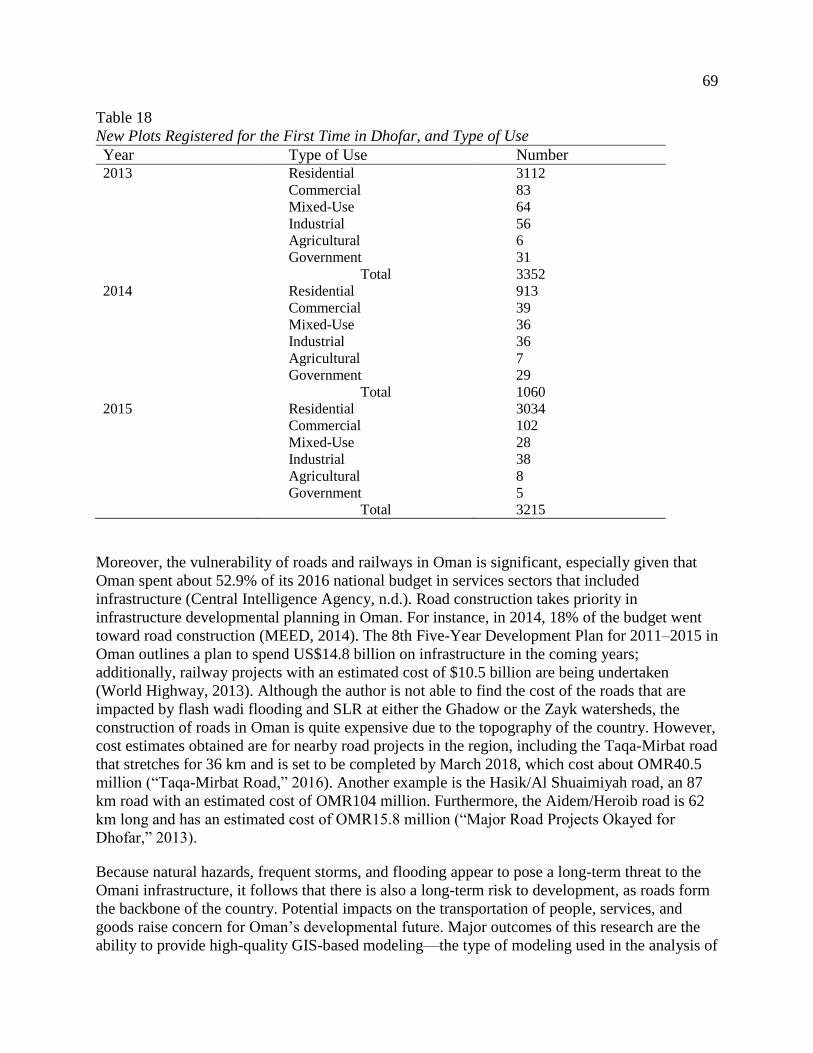
69
Table 18
New Plots Registered for the First Time in Dhofar, and Type of Use
Year Type of Use Number 2013 Residential 3112
Commercial 83
Mixed-Use 64
Industrial 56
Agricultural 6
Government 31
Total 3352
2014 Residential 913
Commercial 39
Mixed-Use 36
Industrial 36
Agricultural 7
Government 29
Total 1060
2015 Residential 3034
Commercial 102
Mixed-Use 28
Industrial 38
Agricultural 8
Government 5
Total 3215
Moreover, the vulnerability of roads and railways in Oman is significant, especially given that
Oman spent about 52.9% of its 2016 national budget in services sectors that included
infrastructure (Central Intelligence Agency, n.d.). Road construction takes priority in
infrastructure developmental planning in Oman. For instance, in 2014, 18% of the budget went
toward road construction (MEED, 2014). The 8th Five-Year Development Plan for 2011–2015 in
Oman outlines a plan to spend US$14.8 billion on infrastructure in the coming years;
additionally, railway projects with an estimated cost of $10.5 billion are being undertaken
(World Highway, 2013). Although the author is not able to find the cost of the roads that are
impacted by flash wadi flooding and SLR at either the Ghadow or the Zayk watersheds, the
construction of roads in Oman is quite expensive due to the topography of the country. However,
cost estimates obtained are for nearby road projects in the region, including the Taqa-Mirbat road
that stretches for 36 km and is set to be completed by March 2018, which cost about OMR40.5
million (“Taqa-Mirbat Road,” 2016). Another example is the Hasik/Al Shuaimiyah road, an 87
km road with an estimated cost of OMR104 million. Furthermore, the Aidem/Heroib road is 62
km long and has an estimated cost of OMR15.8 million (“Major Road Projects Okayed for
Dhofar,” 2013).
Because natural hazards, frequent storms, and flooding appear to pose a long-term threat to the
Omani infrastructure, it follows that there is also a long-term risk to development, as roads form
the backbone of the country. Potential impacts on the transportation of people, services, and
goods raise concern for Oman’s developmental future. Major outcomes of this research are the
ability to provide high-quality GIS-based modeling—the type of modeling used in the analysis of
70
the 2002 flood event—that will enable us to quantify and map future threats to infrastructure and
roads. We conclude that assessing the risk of SLR inundation and flash wadi flooding is a
necessity in moving toward sustainable development and resilient infrastructure.
5.5 Limitations and Future Research
This study used non-Lidar-based DEM at 5 m resolution as the research area does not have Lidar
product data. A disadvantage of the rough DEM resolution is the difficulty of simplified the
topographic characteristics of the research site. Due to this difficulty, the water flow over the
landscape is generalized as it is in the cases of the Zayk and Ghadow simulations as the channel
disappeared. This approach could result in an overestimation of the impacted area. The
influences of DEM resolution on 3Di flooding simulation are studied, and it has been shown that
the model accuracy decreases with rough DEM resolutions that result in inundation
overestimation. For example, the catchment of Sanyei at Tainan City showed differences in
estimating inundation, particularly in areas with an elevated highway and urban buildings, due to
the universalization of topographic information at rough DEM resolutions. The model simulation
at 1x1 m DEM resolution reported an inundation extent at 603.45 ha, while at 5x5m resolution
the inundation extent was 717.49 ha; with 40x40m resolution, 893.38 ha was the extent of the
inundation. These results indicate that the accuracy of the flood inundation models is reduced
with rougher DEM resolutions (Hsu et al., 2016). Therefore, using a Lidar-based DEM at 1 m
resolution is extremely important if Oman is to avoid overestimation and produce the most
accurate information for helping planners and decision-makers.
For future research, it will be helpful to study the flood risk estimates over future land use
projections by using the damage scanner model. This type of research will be useful in
examining the risk from wadi flooding and coastal flooding occurring simultaneously.
5.6 Conclusion and Discussion
The impetus for this research arose from the flash wadi flooding damage that resulted from the
2002 storm event in the Dhofar region. After the storm surge along Dhofar’s coast during the
2002 storm event is modeled in Chapter 3, the underestimation of the damage magnitude to the
urban area and infrastructure required an extension of the research to include the impacts from
flash wadi flooding that also took place during the event. The overwhelming flooding of the
infrastructure and urban area led the country to build more dams for the protection of the area.
However, if similar events are to transpire today, the damage would be greater because the
amount of urbanization and infrastructure has increased. Even after the construction of dams, the
area is still vulnerable to flash wadi flooding resulting from an event of the magnitude of the
2002 storm. Both of the areas in the watersheds in Dhofar are characterized by a pattern of
reducing agricultural farmland in favor of increasing industrial, tourism, and urban areas, which
increases the vulnerabilities for impacts from climate change. For example, Taihu Basin land use
in China underwent major changes due to urbanization and population growth that resulted in
tremendous flooding damages and economic loss during a storm event (Liang et al., 2011). With
this in mind, this research is intended to model, quantify and predict how much infrastructure
and urban areas might be at risk of extreme storm surge and wadi flooding today, and how much
71
would be at risk in the future with a rise in sea level or increased exposure to frequent cyclonic
and storm events resulting from climate change.
Adopting informed planning practices that take into consideration the future impact of forecasts
through flash wadi flooding modeling in association with different SLR scenarios will help
Oman produce more realistic mitigation and adaption plans, infrastructure management
strategies, and resilient future infrastructural development.
The importance of this research lies in its quantification and its ability in providing a visual
representation of the 2002 storm event with the highest DEM resolution available for Dhofar’s
region. This model includes a land-use map that might help to imitate much of the water’s
movements and infiltrations during the 2002 storm event. In addition, this research introduces
3Di, a hydrodynamic model that simulates entire rainfall events in association with the tidal
cycle along the coast simultaneously that has not been possible using other software (such as the
Arc-Hydrology tool in ArcGIS and Geo-HecRas). The 3Di program also has the ability to model
a very large region a watershed scale at a very high spatial resolution due to its sophisticated
quadtree-based data compression technology. Furthermore, because of 3Di’s quadtree
computational capabilities, the model provides the possibility of computing each watershed over
a 96-hour period in one simulation for the Zayk watershed and to compute over a 49-hour period
for the Ghadow watershed in association with different SLR scenarios. Moreover, this research
used real data from the 2002 rainfall storm event and tidal storm surge that was collected from
the gauging station throughout the event, which produced realistic outcomes similar to those of
the actual event.
From a planning perspective, this research shows the significance of understanding the impacts
of climate change over the built areas and the infrastructure of Oman. Incorporating the
knowledge of flooding simulations within the planning practices and within the strategic
developmental planning will save Oman a large amount of future expenduire. Planning major
infrastructural and economic projects in a haphazard manner can hold Oman back rather than
encourage progress toward developmental and infrastructural maturity. However, it is not simply
a desire to achieve the developmental target that makes this such an important issue, but also the
desire to protect future generations, who should not be left with unsafe, nonfunctional systems
and spaces.
This study demonstrates the need for flood risk assessments in Oman and the need to pay close
attention to the current planning practices and development in efforts to reduce vulnerabilities
when facing the impacts of climate change. An accurate coastal flood-inundation map of wadi
flooding is important to the government of Oman for any future project planning. With precise
flood inundation maps at high resolutions, decision-makers can make better-informed decisions
regarding engineering projects, future economic projects, and even the creation and location of
new urban areas. Moreover, the value of this research lies not simply in assessing impacts on
infrastructure and urban areas, but also in showing the need for making different types of
decisions to ensure that evacuation routes are safe and responses are quick during hazardous
natural events.
72
The results of this research are based on the highest DEM resolution available for Oman and
have substantial utility for informing future strategic developmental planning in Dhofar. The
inundation or flash wadi flooding results have significant utility for modeling other highly
developed parts of the country that are at risk of flash wadi flooding or sea level rise and storm
surge.
Although 5 m DEM may not be the optimal surface data for an accurate estimation, this study
produced a good baseline that should be informative for decision makers and planners. The 5 m
horizontal resolution of the DEM provides a sense of damage at the property level that takes into
account significant infrastructure and land-use maps that may affect water-flow, infiltration, and
inundation impacts. This research helps in assessing future costs of existing infrastructure and for
rebuilding and repairing systems. Strategic planning that focuses on proactive mitigation
strategies leads to more cost-effective adjustments and better-informed decisions for future
infrastructural developments.
This study recommends that Oman invest in creating a Lidar product for the entire country to
more accurately measure and quantify future impacts of climate change and achieve the goal of
moving toward a more sustainable Oman and a more resilient infrastructure. Using a rough DEM
offers an overestimation of inundated areas. Accurate estimation of inundated areas and
infrastructures is important for accurate economic loss assessment and for mitigating economic
losses.
73
CHAPTER 6
6.1 Conclusion
Climate change is a threat to current and future sustainable development. The impact of climate
change on most systems is challenging the continuation of sustainable development (SD) in
some locations (Denton et al., 2014). Recent research has shown that Oman is likely to be
exposed to frequent storm and cyclonic events. The results of this research motivate one to help
Oman become a better prepared nation for the impacts of sea level rise and storm surge. They
encourage the development of resiliency for the country’s strategic-development planning as
Oman faces an unstable economy and increased vulnerabilities in terms of its urban areas, its
growing population, its infrastructure, and its economic projects. Population and economic
growth in coastal 100-year flood plains are the leading factors increasing vulnerability (Hijioka
et al., 2014). The development and urban expansion in Oman is similar to growth found in
vulnerable coastal flood plains in general.
Planning for resilience and building a resilient infrastructure are the main strategies for achieving
sustainability in Oman. The main objective of this research is to integrate science that promotes
the creation of resilient infrastructure and development into the process of policy-making
concerning Oman’s strategic-development planning practices as the country is further exposed to
climate change impacts and other natural hazards. The research uses 3Di hydrodynamic
modeling to visualize the aftermath of the 2002 storm event in the Dhofar region. This modeling
provides a visual representation of the 2002 storm-surge impacts in association with different
SLR projections at 0.0 m, 0.5 m, 1.0 m, and 1.41 m along the coast of Dhofar. Employing 3Di
modeling quantifies and illustrates the impacts of storm surge on the Ghadow and Zayk
watersheds, resulting in the aftermath of flash wadi flooding in association with SLR at 0.0 m
and 1.41 m. Flash wadi flooding impacts on infrastructure and urban areas are produced and
considered in the first visual depiction of the 2002 event impacts. This research demonstrates the
significance of integrating and using science in the planning practices and policy-making of
Oman. It demonstrates the application of a process that can help Oman move toward sustainable
development and develop the creation of a resilient infrastructure. It offers a glimpse into a
future in which this knowledge and approach could be informative for the development of Oman
and other Gulf countries. This is achieved in four ways: (a) by providing an overview of the
principles of sustainable development and the implementation of those principles within the
Omani context; (b) by modeling the 2002 storm-surge event in association with various SLR
scenarios along the coast of Dhofar; (c) quantifying coastal tourism projects that show
vulnerabilities for the 2002 storm-surge event with different SLR projections; and finally, (d)
modeling the impacts of flash wadi flooding in 2002 and investigating the effects of this flooding
on urbanization and infrastructure. These four objectives were achieved through analysis and
discussion in Chapters 2, 3, 4, and 5, respectively.
In Chapter 2, the research focuses on the definition of SD and SD’s implementation within
Oman’s developmental strategy. Oman demonstrates varying levels of SD-principle application
in the economy, the environment, and society. Even though Oman is applying these principles,
infrastructural resilience is not included in the country’s strategic development plans, and the
74
country has shown vulnerability. There has been almost no resilience planning in Oman’s
infrastructure and urban areas during the extreme events and cyclones of the last decade. To
achieve sustainability consistent with SD principles in Oman, it is recommended that the concept
of resiliency in regard to Oman’s infrastructure be included in planning practices.
Chapter 3 describes modeling of storm surge in association with various SLR scenarios along the
coast of Dhofar using the 2002 extreme storm event—considered the storm with the greatest
magnitude in 30 years. The 3Di hydrodynamic modeling is used, showing the depth and the
extent of the inundation at every hour of the storm. Impacts on infrastructure and urbanization
are quantified. The 3Di modeling incorporates the buildings within the simulation area,
providing a more realistic representation of storm-surge depth and extent as water movement and
channelization through buildings is taken into consideration.
The DEM resolution is found to be an important factor in producing a better prediction of the
impacts of flooding, especially given the topography of the Dhofar region. The high-resolution
accuracy assessments show a precise flooding estimation at 1m, in contrast to low-resolution
assessments at 5m that show an overestimation of the flooding extent. This indicates the need to
create a high-resolution DEM for Oman to obtain a precise flooding estimation to make more
accurate cost predictions.
This research shows the vulnerability of urban areas and infrastructure increasing as
development progresses. In 2013, the Ministry of Environment and Climate Affairs predicted an
increase in the frequency of storms and cyclonic events in Dhofar related to climate change. This
prediction requires Oman to prepare for climate-change consequences by being ready to adapt to
future exposure and by being resilient as development progresses.
Chapter 4 demonstrates the importance of integrating science and incorporating storm-surge and
SLR projections into tourism development and planning in Oman. Because coastal tourism in
Oman relies on natural assets, placing new resorts in vulnerable areas will not only stress the
environment but also deplete the economy. Oman is planning to use tourism as a source of
national income to diversify the economy. However, expanding coastal tourism development
without considering climate change impacts during the planning stage will economically strain
Oman over time. Finding a balanced solution for coastal tourism development that is adaptable
and resilient to climate change impacts is significant for maintaining long-term sustainable
tourism growth along the coast, a sustainable economy, and a resilient infrastructure for future
generations.
Finally, Chapter 5 reveals flash wadi flooding destruction to urbanization, infrastructure, and
other land uses in Oman and then quantifies the number of urban, industrial, and commercial
buildings and roads that are impacted specifically in the Zayk and Ghadow watersheds of
Dhofar. The effects on urbanization and roads are significant and require Oman to take serious
action concerning current planning practices, to look for approaches that would reduce
vulnerabilities to any future storm events, and to promote resilient infrastructural practices for
current and future developments. This chapter undertakes modeling of flash wadi flooding at 5m
DEM, which is not an ideal resolution, and recommends the implementation of Lidar-based
DEM to acquire more precise surface for evaluating water movement and infrastructure
75
vulnerabilities. Moreover, this research demonstrates that modeling storm surge along the coast
alone, without including flash wadi flooding, resulted in underestimation of the destruction
magnitude during the 2002 events. For Oman, where storm surge and flash wadi flooding occur
simultaneously, the modeling approach needs to reflect this situation and should include flooding
from wadi and storm surge to obtain a realistic projections of damage.
Overall, this research indicates that the effect on urbanization, roads, and infrastructure—either
from SLR, or flash wadi flooding, or both—is alarming, and that measures for climate change
adaption are required. Oman’s urbanization, tourism projects, and infrastructure development are
increasing, and these changes in land use could lead to higher flash wadi flooding and storm-
surge impacts.
Achieving sustainability and resiliency for Oman’s infrastructure and urban areas requires that
the country adapt to climate change impacts. Because urban areas include not only the human
population but also built assets and economic activities, it is essential that planning of this
development must adopt resilience measures to the impacts of climate change on a broad
spectrum of infrastructural vulnerabilities.
When working to mitigate and reduce flooding impacts on planned buildings and infrastructure,
integrating science into land use planning is key to achieving developmental resilience. In
general, conscious land use planning would be effective in decreasing future increases in coastal
and wadi flooding risk. Using engineered defenses, such as sea walls and dams, to protect
infrastructure and human settlements from flooding may have negative consequences for natural
ecosystems. Such defenses may not be capable of preventing higher storm magnitude and may
not be less costly in the long run—especially given an unstable economy, but they are likely
more effective in guarding against disaster. This research recommends that the government and
planning agencies in Oman stop granting lands, including residential, commercial, mixed-use,
tourism, and industrial lands, that are located within flash wadi flooding plains or SLR and
storm-surge-affected areas. The government needs to use science to inform itself about how to
overcome these inundation challenges. For example, it can create open spaces (parks or buffer
zones) that can collect floodwater before that water hits buildings and infrastructure so that the
magnitude of the damage is reduced. Implementing the concept of constructing resilient
infrastructure within the current and future developmental strategies could significantly help in
reducing both impacts from flooding and vulnerability to the impacts of climate change,
especially in high-risk areas.
This research recommends that Oman take the following steps:
1. Increase the precise estimating of future and current exposure to climate change and
encourage the critical movement toward implementing a high resolution Lidar project
that would cover the entire country of Oman. High resolution Lidar would help in
obtaining, more accurate Lidar-based DEM, especially in areas that are currently, or are
likely to become, hotspots for development, including residential, commercial, economic,
and industrial areas. Taking this step will not only help in facilitating the smarter
planning of a more resilient infrastructure but it will also help to insure investment in
Oman over time.
76
2. After obtaining a high resolution Lidar-based DEM, Oman needs to conduct more
research to accurately quantify and assess impacts, vulnerabilities, and adaptations
needed in urban areas, including emergency evacuation and fuel transportation during
events.
3. Oman needs to continue to improve climate models and flooding simulations, and include
the sciences in planning and policy-making processes to achieve proactive and robust
planning practices that prepare the country to adapt to a constantly changing an uncertain
future.
4. Oman must recognize the importance of adapting to climate change now and in the
future. It needs to emphasize resilient infrastructure and development in planning current
and future strategic development.
5. Oman must continue to create awareness of climate change to affect policy at the political
and social levels in order to join the rest of the developed world in transitioning from the
awareness phase to a phase of constructing strategies and plans (Mimura et al., 2014).
6. Oman needs to transfer information to the Supreme Council for Planning where policy
and legal frameworks can be enlightened. They need to encourage stakeholders to take
actions to protect vulnerable areas, and to promote resiliency in infrastructure and urban
areas. There is evidence of a disconnect between the Ministry of Environment and
Climate Affairs and the Supreme Council for Planning in Oman when there should be
coordination between the two agencies. Land use planning does not reflect any adaptive
actions either in the current plans or in land-granting for residential, economic, and
industrial purposes. In addition, many recent tourism and transportation projects have
been developed within vulnerable areas, and many residential areas have been granted for
citizens as well. This practice must stop.
7. Oman must practice proactive, event-driven approaches, rather than reactive approaches,
in adapting to climate change impacts. The 2002 event in Dhofar is a good example
where local governments implemented reactive mitigation plans (dams) in response to the
event and that at risk development is still ongoing within flash wadi flooding and storm-
surge-vulnerable areas. This response highlights the urgency of new approaches.
8. Oman must improve the quality of rainfall and runoff data, and make these data available
at a higher resolution for storm events across the country to provide better simulation
results, a better understanding of the hydrological processes of impacted regions, and
better science in general.
9. Oman needs to simulate storm surge and flash wadi flooding together to obtain a better
picture of the actual storm or cyclonic damage of these events. Flood modeling in Oman
will always result in an underestimation when modeling is done for either storm surge or
flash wadi flooding alone, and not together.
77
REFERENCES
Abahussain, A. A., Abdu, A. S., Al-Zubari, W. K., El-Deen, N. A., & Abdul-Raheem, M. (2002).
Desertification in the Arab Region: analysis of current status and trends. Journal of Arid
Environments, 51(4), 521–545. Doi:10.1006/jare.2002.0975
Abdel Malek, K. (2015, July 3). In Oman, pioneer steps for the environment. Arab Weekly, issue
12, p. 15. Retrieved from http://www.thearabweekly.com/?id=977
Abosuliman, S. S., Kumar, A., Alam, F., & Rasjidin, R. (2013). Disaster planning and
management in Jeddah, Saudi Arabia. Paper presented at the 2013 International
Conference on Economics and Social Science (ICESS 2013), January 20–21, Melbourne,
Australia.
Al Barwani, A. (2010). General situation of flash floods and water resources problems in Oman.
Ministry of Regional Municipalities and Water Resources. Retrieved from
http://ars.gcoe.kyoto-u.ac.jp/assets/files/Gcoe_Ars_Seminar_20101019-11th.pdf
Al Gharibi, H. (2014). Urban growth from patchwork to sustainability: case study Muscat
(Doctoral dissertation). Technische Universität Berlin, Berlin, Germany.
Al Hadhrami, M. (2006). Long lasting tourism: Developing sustainability tourism in Dhofar-
Sultanate of Oman (Doctoral dissertation). University of Nottingham, Nottingham,
England.
Al Hatrushi, S. M., & Charabi, Y. (2016). Changes in the occurrence of extreme temperature
events in Oman. Issue (62), AAG Annual Meeting.
Al Mukrashi, F. (2015, October 5). Oman to cut fuel subsidies from next year. Gulf News.
Retrieved from http://gulfnews.com/news/gulf/oman/oman-to-cut-fuel-subsidies-from-
next-year-1.1595707
Al Rawas, G., Hewawasam, L., Al Wardy, M., & Charabi, Y. (2016). Spatio-temporal analysis
of extreme rainfall distribution and variability in Oman. Issue (62), AAG Annual
Meeting.
Al Saud, M. (2010). Assessment of flood hazard of Jeddah area 2009, Saudi Arabia. Journal of
Water Resource and Protection, 2(9), 839-847. doi:10.4236/jwarp.2010.29099
Al Shueili, K. S. M. (2015). Towards a sustainable urban future in Oman: Problem & process
analysis: Muscat as a case study (Doctoral dissertation). Glasgow School of Art,
Glasgow, Scotland.
Al Wardy, M., Al Rawas, G., & Charabi, Y. (2016). Observed and projected changes in the
climate of Oman. Issue (62), AAG Annual Meeting.
78
Al-Ajmi, D. N., Idrees, A. M., & Al-Hatrushi, S. M. (2013). Spatial and temporal analysis of
recurrence time of rainfall in the Sultanate of Oman. British Journal of Arts and Social
Sciences, 12(1). Retrieved from http://www.bjournal.co.uk/paper/BJASS_12_1
/BJASS_12_01_08.pdf
Al-Badi, A. H., Malik, A., & Gastli, A. (2009). Assessment of renewable energy resources
potential in Oman and identification of barrier to their significant utilization. Renewable
and Sustainable Energy Reviews, 13(9), 2734-2739. doi:10.1016/j.rser.2009.06.010
Al-Buloshi, A., Al-Hatrushi, S., & Charabi, Y. (2014). GIS-based framework for the simulation
of the impacts of sea level rise and coastal flooding on Oman. Journal of Earth Science &
Climatic Change, 5(10), 1-6. doi:10.4172/2157-7617.1000238
Al-Habsi, M., Gunawardhana, L., & Al-Rawas, G. (2015). Trend analysis of climate variability
in Salalah, Oman. International Journal of Students’ Research in Technology &
Management, 2(5), 168-171. doi:10.1029/2005JD006290
Al-Hakmani,A. M. (2002). Flood control project in Salalah, Oman. Dhofar Municipality, Oman.
Al-Jufaili, S., Al-Jabri, M., Al-Baluchi, A., Baldwin, R. M., Wilson, S. C., West, F., &
Matthews, A. D. (1999). Human impacts on coral reefs in the Sultanate of Oman.
Estuarine, Coastal and Shelf Science, 49, 65–74. Doi:10.1016/S0272-7714(99)80010-9
Allen, C. H. (1987). Oman: The modernization of the Sultanate. London, England: Westview
Press.
Al Ruheili, A. (2016). Modelling sea level rise and storm surge of 2002 along the coast of
Dhofar. Unpublished paper.
Al-Maskari, J. (2010). How the National Forecasting Centre in Oman dealt with tropical cyclone
Gonu. In Y. Charabi (Ed.), Indian Ocean tropical cyclones and climate change (pp. 265–
275). The Netherlands: Springer.
Al-Qurashi, A. (2014). Flood studies, protection, and flood control in the Sultanate of Oman.
Presentation at the Drainage, Rehabilitation, and Flood Control Conference in Muscat,
Sultanate of Oman, September 1–2, 2014. Retrieved from http://www.drainageoman.com
/FloodStudies,Protection,andGovRoleinOman-DrAishaAl-Qurashi.pdf
Al-Rawas, G. A. A. (2009). Flash flood modelling in Oman wadis (Doctoral dissertation).
University of Calgary, Alberta, Canada.
Al-Shaqsi, S. Z. (2010). Emergency management in the Arabian Peninsula: A case study from
the Sultanate of Oman. Retrieved from http://omancoast.blogspot.com/2014/06/living-in-
oman-emergency-management-in.html
79
Al-Shaqsi, S. Z. (2014, June 12). Emergency management in the Arabian Peninsula: A case
study from the Sultanate of Oman. Retrieved from http://omancoast.blogspot.com/2014
/06/living-in-oman-emergency-management-in.html
Al-Shaybany, Saleh (2001) Oman’s tourism potential all but untapped. Retrieved from
www.arabia.com/oman/business. Accessed July 27, 2016.
Almoharby, D. (2010). Shuratic decision‐making practice, a case of the Sultanate of Oman.
Humanomics, 26(1), 4-7. doi:10.1108/08288661011024968
Amante, C., & Eakins, B. W. (2009). ETOPO1 1 arc-minute global relief model: Procedures,
data sources and analysis. NOAA Technical Memorandum NESDIS NGDC-24. National
Geophysical Data Center, NOAA. doi:10.7289/V5C8276M
ArcGIS. (2017). World imagery. Retrieved from www.arcgis.com
Ayyub, B. M., & Kearney, M. S. (Eds.). (2012). Sea level rise and coastal infrastructure:
Prediction, risks, and solutions. Reston, VA: American Society of Civil Engineers.
doi:10.1061/9780784412008.fm
Babikir, A. A. A. (1985). On the distribution of rainfall over the Sultanate of Oman. GeoJournal,
11(2), 165-172. doi:10.1007/BF00212918
Bailey, R. W. (1988). Records of Oman: 1867–1947. (8 vols.). Buckinghamshire, England:
Archive Editions.
Bandyopadhyay, S. (2010). Manah: Omani oasis, arabian legacy architecture and social history
of an omani oasis settlement. Liverpool, England: Liverpool University Press.
Belqacem, M. (2010). Urban sprawl and city vulnerability: Where does Muscat stand? In Y.
Charabi (Ed.), Indian Ocean tropical cyclones and climate change (pp. 233–243). The
Netherlands: Springer.
Berke, P. R., & Conroy, M. M. (2000). Are we planning for sustainable development? An
evaluation of 30 comprehensive plans. Journal of the American Planning Association,
66(1), 21–33. doi:10.1080/01944360008976081
Berrang-Ford, L., Ford, J. D., & Paterson, J. (2011). Are we adapting to climate change? Global
Environmental Change, 21(1), 25–33. Doi:10.1016/j.gloenvcha.2010.09.012
Biging, G. S., Radke, J. D., & Lee, J. H. (University of California Davis). (2012). Impacts of
predicted sea level rise and extreme storm events on the transportation infrastructure in
the San Francisco Bay region. [White paper]. California Energy Commission. Retrieved
from http://www.energy.ca.gov/2012publications/CEC-500-2012-040/CEC-500-2012-
040.pdf
80
Bilgen, S., Keleş, S., Kaygusuz, A., Sarı, A., & Kaygusuz, K. (2008). Global warming and
renewable energy sources for sustainable development: A case study in Turkey.
Renewable and Sustainable Energy Reviews, 12(2), 372-396. doi:10.1016
/j.rser.2006.07.016
BI-ME. (2013, November 29). KFH-Research: Oman 5-year plan includes US$78 billion
spending, mainly on infrastructure projects. Retrieved from http://www.bi-me.com
/main.php?id=64047&t=1
Birkmann, J., Garschagen, M., Kraas, F., & Quang, N. (2010). Adaptive urban governance: New
challenges for the second generation of urban adaptation strategies to climate change.
Sustainability Science, 5(2), 185–206. Doi:10.1007/s11625-010-0111-3
Bissell, J. J. (2010). Resilience of UK infrastructure: POSTnote 362. Parliamentary Office of
Science and Society.
Bocchini, P., Frangopol, D. M., Ummenhofer, T., & Zinke, T. (2013). Resilience and
sustainability of civil infrastructure: Toward a unified approach. Journal of Infrastructure
Systems, 20(2), 04014004. doi:10.1061/(ASCE)IS.1943-555X.0000177
Bosher, L. (2008). Hazards and the built environment: Attaining built-in resilience. London,
UK: Routledge.
Bosher, L., Dainty, A., Carrillo, P., Glass, J., & Price, A. (2007). Integrating disaster risk
management into construction: A UK perspective. Building Research and Information,
35(2), 163-177. doi:10.1080/09613210600979848
Bouwer, L. M., Bubeck, P., Wagtendonk, A. J., & Aerts, J. C. (2009). Inundation scenarios for
flood damage evaluation in polder areas. Natural Hazards and Earth System Sciences,
9(6), 1995-2007. doi:10.5194/nhess-9-1995-2009
Bouyamourn, A. (2015, December 30). Oman to raise tax and cut subsidies as oil rout hits
sultanate hard. The National. Retrieved from http://www.thenational.ae/business
/economy/oman-to-raise-tax-and-cut-subsidies-as-oil-rout-hits-sultanate-hard
Briassoulis, H. (1989). Theoretical orientations in environmental planning: An inquiry into
alternative approaches. Environmental Management, 13(4), 381–392.
Bromirski, P. D., & Flick, R. E. (2008). Storm surge in the San Francisco Bay/Delta and nearby
coastal locations. Shore & Beach, 76(3), 29-37. Retrieved from http:
//www.bayplanningcoalition.org/downloads/dmc10/compendium/01_Bromirski_Flick_20
08.pdf
Bromirski, P. D., Cayan, D. R., Graham, N., Flick, R. E., & Tyree, M. (2012, July). Coastal
flooding potential projections: 2000–2100. California Energy Commission. Retrieved
from http://www.energy.ca.gov/2012publications/CEC-500-2012-011/CEC-500-2012-
011.pdf
81
Broomhall, E. (2010, November 29). Six companies win major road projects in Oman. Retrieved
from http://www.constructionweekonline.com/article-10314-six-companies-win-major-
road-projects-in-oman/
Brown, B. J., Hanson, M. E., Liverman, D. M., & Merideth R. W., Jr. (1987). Global
sustainability: Toward definition. Environmental Management, 11(6), 713–719.
doi:10.1007/BF01867238
Budiyono, Y., Aerts, J., Brinkman, J., Marfai, M. A., & Ward, P. (2015). Flood risk assessment
for delta mega-cities: A case study of Jakarta. Natural Hazards, 75(1), 389-413.
doi:10.1007/s11069-014-1327-9
Burby, R. J., Deyle, R. E., Godschalk, D. R., & Olshansky, R. B. (2000). Creating hazard
resilient communities through land-use planning. Natural Hazards Review, 1(2), 99-106.
doi:10.1061/(ASCE)1527-6988(2000)1:2(99)
Butler, R. W. (1999). Sustainable tourism: A state‐of‐the‐art review. Tourism Geographies, 1(1),
7–25. doi:10.1080/14616689908721291
Carpenter, S., Walker, B., Anderies, J. M., & Abel, N. (2001). From metaphor to measurement:
Resilience of what to what? Ecosystems, 4(8), 765-781. doi:10.1007/s10021-001-0045-9
Central Intelligence Agency. (n.d.). Middle East: Oman. The World Fact Book. Retrieved from
https://www.cia.gov/library/publications/the-world-factbook/geos/mu.html
Chang, S. E. (2014). Infrastructure resilience to disasters. The Bridge, 44(3). Retrieved from
http://www.nap.edu/read/12821/chapter/22
Charabi, Y. (2009). Arabian summer monsoon variability: Teleconexion to ENSO and IOD.
Atmospheric Research, 91(1), 105-117. doi:10.1016/j.atmosres.2008.07.006
Charabi, Y., & Al-Hatrushi, S. (2010). Synoptic aspects of winter rainfall variability in Oman.
Atmospheric Research, 95(4), 470–486. doi:10.1016/j.atmosres.2009.11.009
Charabi, Y., Al Wardy, M., & Al Rawas, G. (2016). Climate change risk modelling and decision-
making framework for Oman. Issue (62), AAG Annual Meeting.
Church, J., White, N., Hunter, J., McInnes, K., Cowell, P., & O’Farrell, S. (2008). Sea level rise.
In P. Newton (Ed.), Transitions: Pathways towards sustainable urban development in
Australia (pp. 191-210). Melbourne, Australia: CSIRO.
Church, J. A., & White, N. J. (2006). A 20th century acceleration in global sea‐level rise.
Geophysical Research Letters, 33(1). doi:10.1029/2005GL024826
Church, J. A., & White, N. J. (2011). Sea level rise from the late 19th to the early 21st century.
Surveys in Geophysics, 32(4), 585-602. doi:10.1007/s10712-011-9119-1
82
Coles, S. L. (1997). Reef corals occurring in a highly fluctuating temperature environment at
Fahal Island, Gulf of Oman (Indian Ocean). Coral Reefs, 16(4), 269-272. doi:10.1007
/s003380050084
Cools, J., Vanderkimpen, P., El Afandi, G., Abdelkhalek, A., Fockedey, S., El Sammany, M., . . .
Huygens, M. (2012). An early warning system for flash floods in hyper-arid Egypt.
Natural Hazards and Earth System Sciences, 12(2), 443-457. doi:10.5194/nhess-12-443-
2012
Cormie, D., Tufton, E., & Inglis, S., & Hudson, S. (2012, November). Engineering resilient
infrastructure. Civil Engineering, 165(6), 5-12. doi:10.1680/cien.11.00065
da Silva, J., Kernaghan, S., & Luque, A. (2012). A systems approach to meeting the challenges
of urban climate change. International Journal of Urban Sustainable Development, 4(2),
125-145. doi:10.1080/19463138.2012.718279
da Silva, V. D. P. R. (2004). On climate variability in Northeast of Brazil. Journal of Arid
Environments, 58(4), 575-596. doi:10.1016/j.jaridenv.2003.12.002
Dahm, R., Hsu, C. T., Lien, H. C., Chang, C. H., & Prinsen, G. (2014). Next generation flood
modelling using 3Di: A case study in Taiwan. Retrieved from http://www.dsd.gov.hk
/rdforum/2014/abstract/Paper%20(A5-3).pdf
Dao, Q. H., & Peduzzi, P. (2004). Global evaluation of human risk and vulnerability to natural
hazards. Enviro-info 2004, Sh@ ring, 435-446. Retrieved from https://archive-
ouverte.unige.ch/unige:32194
Dartmouth Flood Observatory. (2003). 2002 global register of extreme flood events. Archived
from the original on 25 July 2008. Retrieved from http://www.dartmouth.edu/~floods
/Archives/2002sum.htm
Dasgupta, S., Laplante, B., Meisner, C., Wheeler, D., & Yan, J. (2009). The impact of sea level
rise on developing countries: a comparative analysis. Climatic Dhange, 93(3-4), 379-388.
doi:10.1007/s10584-008-9499-5
Dasgupta, S., Laplante, B., Murray, S., & Wheeler, D. (2009). Climate change and the future
impacts of storm-surge disasters in developing countries. Retrieved from http:
//citeseerx.ist.psu.edu/viewdoc/download;jsessionid=6F5F0399142BCF0FCDD65F2573
E9899F?doi=10.1.1.625.424&rep=rep1&type=pdf
David, S. (2014). What climate change means for the Middle East. Retrieved from http:
//english.alarabiya.net/en/News/middle-east/2014/05/04/What-climate-change-means-for-
the-Middle-East.html
Deloitte. (2013, Fall.) Oman 20/20 vision. Retrieved from http://www2.deloitte.com/content
/dam/Deloitte/xe/Documents/About-Deloitte/mepovdocuments/mepov12/dtme_mepov12
_Oman2020vision.pdf
83
Denton, F., Wilbanks, T. J., Abeysinghe, A. C., Burton, I., Gao, Q., Lemos, M. C., Masui, T.,
O’Brien, K. L., & Warner, K. (2014). Climate-resilient pathways: Adaptation, mitigation,
and sustainable development. In C. B. Field, V. R. Barros, D. J. Dokken, K. J. Mach, M.
D. Mastrandrea, T. E. Bilir, . . . & L.L. White (Eds.), Climate change 2014: Impacts,
adaptation, and vulnerability. Part A: Global and sectoral Aspects. Contribution of
Working Group II to the fifth assessment report of the Intergovernmental Panel on
Climate Change (pp. 535-612). Cambridge, UK: Cambridge University Press.
Dibajnia, M., Soltanpour, M., Nairn, R., & Allahyar, M. (2010). Cyclone Gonu: The most
intense tropical cyclone on record in the Arabian Sea. In Y. Charabi (Ed.), Indian Ocean
tropical cyclones and climate change (pp. 149–157). The Netherlands: Springer.
Dixon, J. A., & Fallon, L. A. (1989). The concept of sustainability: Origins, extensions, and
usefulness for policy. Society & Natural Resources, 2(1), 73–84. doi:10.1080
/08941928909380675
Dowling, R. (1993). An environmentally-based planning model for regional tourism
development. Journal of Sustainable Tourism, 1(1), 17–37. doi:10.1080
/09669589309450698
Elagib, N. A., & Abdu, A. S. A. (1997). Climate variability and aridity in Bahrain. Journal of
Arid Environments, 36(3), 405-419. doi:10.1006/jare.1996.0237
Feighery, W. G. (2012). Tourism and self-Orientalism in Oman: A critical discourse analysis.
Critical Discourse Studies, 9(3), pp. 269–284. doi:10.1080/17405904.2012.688210
Fenner, R., & Ainger, C. M. (2014). Sustainable infrastructure: Principles into practice.
London, England: ICE.
Forster, D., & Magnan, D. (n.d.). Variable carbonate alluvium and the design of large dams in
Salalah, Sultanate of Oman. Retrieved from http://geologique.com.au/website_0807
/variable_carbonate_alluvium_and_the_design_of_large_dams_in_salalah_-
_final_badged_-_acknowledgement.pdf
Fritz, H. M., Blount, C. D., Albusaidi, F. B., & Al-Harthy, A. H. M. (2010). Cyclone Gonu storm
surge in Oman. Estuarine, Coastal and Shelf Science, 86(1), 102-106. doi:10.1007/978-
90-481-3109-9_30
Garcia-Ruiz, J. M., Lasanta, T., Ruiz-Flano, P., Ortigosa, L., White, S., González, C., & Martí,
C. (1996). Land-use changes and sustainable development in mountain areas: A case
study in the Spanish Pyrenees. Landscape Ecology, 11(5), 267-277. doi:10.1007
/BF02059854
Ghazanfar, S. A., & Fisher, M. (Eds.). (2013). Vegetation of the Arabian peninsula (Vol. 25).
Dordrecht, The Netherlands: Springer Science & Business Media.
84
Giddings, B., Hopwood, B., & O'Brien, G. (2002). Environment, economy and society: Fitting
them together into sustainable development. Sustainable Development, 10(4), 187-196.
doi:10.1002/sd.199
Godschalk, D. R. (2003). Urban hazard mitigation: creating resilient cities. Natural Hazards
Review, 4(3), 136-143. doi:10.1061/(ASCE)1527-6988(2003)4:3(136)
Golnaraghi, M. (2012). An overview: Building a global knowledge base of lessons learned from
good practices in multi-hazard early warning systems. In M. Golnaraghi (Ed.),
Institutional partnerships in multi-hazard early warning systems (pp. 1–8). Berlin,
Germany: Springer.
Graef, F., & Haigis, J. (2001). Spatial and temporal rainfall variability in the Sahel and its effects
on farmers' management strategies. Journal of Arid Environments, 48(2), 221-231.
doi:10.1006/jare.2000.0747
Greater powers for Majlis Oman. (2011). MuscatDaily.com. Retrieved from
http://www.muscatdaily.com/Archive/Oman/Greater-powers-for-Majlis-Oman
Guzman, J. M., Martine, G., McGranahan, G., Schensul, D., & Tacoli, C. (Eds.). (2009).
Population dynamics and climate change. New York, NY: UNFPA.
Hall, C. M. (2001). Trends in ocean and coastal tourism: The end of the last frontier? Ocean &
Coastal Management, 44(9), 601–618. doi:10.1016/S0964-5691(01)00071-0
Hansen, K. L., & Neale, B. S. (2014, November). Infrastructure resilience in the UK: An
overview of current approaches. In J. Crittenden, Hendrickson, C., & Wallace, B. (Eds.),
ICSI 2014: Creating infrastructure for a sustainable world (pp. 23-32). ASCE.
doi:10.1061/9780784478745.003
Hanson, S., Nicholls, R., Ranger, N., Hallegatte, S., Corfee-Morlot, J., Herweijer, C., & Chateau,
J. (2011). A global ranking of port cities with high exposure to climate extremes.
Climatic Change, 104(1), 89-111. doi:10.1007/s10584-010-9977-4
Hardy, A., Beeton, R. J., & Pearson, L. (2002). Sustainable tourism: An overview of the concept
and its position in relation to conceptualisations of tourism. Journal of Sustainable
Tourism, 10(6), 475–496. doi:10.1080/09669580208667183
Hazbun, H. (2004). Globalisation, reterritorialisation and the political economy of tourism
development in the Middle East. Geopolitics, 9(2), pp. 310–340. doi:10.1080
/14650040490442881
Hijioka, Y., Lin, E., Pereira, J. J., Corlett, R. T., Cui, X., Insarov, G. E., . . . & Surjan, A. (2014).
Asia. In V. R. Barros, C. B. Field, D. J. Dokken, M. D. Mastrandrea, K. J. Mach, T. E.
Bilir, . . . & L. L. White (Eds.), Climate change 2014: Impacts, adaptation, and
vulnerability. Part B: Regional aspects. Contribution of Working Group II to the fifth
85
assessment report of the Intergovernmental Panel on Climate Change (pp. 1327–1370).
Cambridge, UK: Cambridge University Press.
Hirabayashi, Y., Mahendran, R., Koirala, S., Konoshima, L., Yamazaki, D., Watanabe, S.,
Kanae, S. (2013). Global flood risk under climate change. Nature Climate Change, 3(9),
816-821. doi:10.1038/nclimate1911
Holling, C. S. (1996). Engineering resilience versus ecological resilience. In P. Schulze (Ed.),
Engineering within ecological constraints (pp. 31-44). Washington, DC: National
Academies Press. doi:10.17226/4919
Holmes, J., & Clark, R. (2008). Enhancing the use of science in environmental policy-making
and regulation. Environmental Science & Policy, 11(8), 702–711. Doi:10.1016
/j.envsci.2008.08.004
Hopwood, B., Mellor, M., & O’Brien, G. (2005). Sustainable development: Mapping different
approaches. Sustainable Development, 13(1), 38-52. doi:10.1002/sd.244
Horton, B. P., Rahmstorf, S., Engelhart, S. E., & Kemp, A. C. (2014). Expert assessment of sea
level rise by AD 2100 and AD 2300. Quaternary Science Reviews, 84, 1-6. doi:10.1016
/j.quascirev.2013.11.002
Howarth, R. B., & Norgaard, R. B. (1992). Environmental valuation under sustainable
development. The American Economic Review, 82(2), 473-477.
Hsu, Y. C., Prinsen, G., Bouaziz, L., Lin, Y. J., & Dahm, R. (2016). An investigation of DEM
resolution influence on flood inundation simulation. Procedia Engineering, 154, 826-
834. doi:10.1016/j.proeng.2016.07.435
Hunter, C. (1997). Sustainable tourism as an adaptive paradigm. Annals of Tourism Research,
24(4), 850–867. doi:10.1016/S0160-7383(97)00036-4
Hunter, J. (2012). A simple technique for estimating an allowance for uncertain sea level rise.
Climatic Change, 113(2), 239-252. doi:10.1007/s10584-011-0332-1
Hurricane Sandy Rebuilding Task Force. (2013, August). Hurricane Sandy rebuilding strategy.
Washington, DC: US Department of Housing and Urban Development. Retrieved from
http://portal.hud.gov/hudportal/documents/huddoc?id=hsrebuildingstrategy.pdf
IPCC. (2013). Climate change 2013: Synthesis report. Retrieved from http://www.ipcc.ch
/report/ar5/wg1/
Kalyanapu, A. J., Burian, S. J., & McPherson, T. N. (2010). Effect of land use-based surface
roughness on hydrologic model output. Journal of Spatial Hydrology, 9(2). Retrieved
from http://www.spatialhydrology.net/index.php/JOSH/article/view/84/83
86
Kazem, H. A. (2011). Renewable energy in Oman: Status and future prospects. Renewable and
Sustainable Energy Reviews, 15(8), 3465–3469. doi:10.1016/j.rser.2011.05.015
Klein, R. J., Nicholls, R. J., & Thomalla, F. (2003). Resilience to natural hazards: How useful is
this concept? Global Environmental Change Part B: Environmental Hazards, 5(1), 35–
45. Doi:10.1016/j.hazards.2004.02.001
Kwarteng, A. Y., Dorvlo, A. S., & Vijaya Kumar, G. T. (2009). Analysis of a 27‐year rainfall
data (1977–2003) in the Sultanate of Oman. International Journal of Climatology, 29(4),
605-617. doi:10.1002/joc.1727
Lafferty, W. M. (2002). Adapting government practice to the goals of sustainable development.
Expert report for OECD seminar Improving Governance for Sustainable Development,
November 22–23, 2001.
Lane, B. (1994). Sustainable rural tourism strategies: A tool for development and conservation.
Journal of Sustainable Tourism, 2(1–2), 102–111. doi:10.1080/09669589409510687
Lanfant, M. F., & Graburn, N. H. (1992). International tourism reconsidered: The principle of the
alternative. In V. L. Smith & W. R. Eadington (Eds.), Tourism alternatives: Potentials
and problems in the development of tourism (pp. 88–112). U.S.: International Academy
for the Study of Tourism.
Lee, K. N. (2001). Appraising adaptive management. Ecology and Society, 3(2).
doi:10.1201/9781420042597
Lele, S. M. (1991). Sustainable development: A critical review. World Development, 19(6), 607–
621. Retrieved from http://disciplinas.stoa.usp.br/pluginfile.php/333429/mod_resource
/content/1/texto_1pdf
Liang, W., Yongli, C., Hongquan, C., Daler, D., Jingmin, Z., & Juan, Y. (2011). Flood disaster in
Taihu Basin, China: causal chain and policy option analyses. Environmental Earth
Sciences, 63(5), 1119-1124. doi:10.1007/s12665-010-0786-x
Lioubimtseva, E., & Henebry, G. M. (2009). Climate and environmental change in arid Central
Asia: Impacts, vulnerability, and adaptations. Journal of Arid Environments, 73(11),
963–977. Doi:10.1016/j.jaridenv.2009.04.022
Liu, Z. (2003). Sustainable tourism development: A critique. Journal of Sustainable Tourism,
11(6), 459–475. doi:10.1080/09669580308667216
Liu, Z. H. (1994). Tourism development–a systems analysis. In A. V. Seaton et al. (Eds.),
Tourism: The state of the art (pp. 20–30). Chichester, UK: John Wiley.
Lokuge, W., & Setunge, S. (2013). Evaluating disaster resilience of bridge infrastructure when
exposed to extreme natural events. In M. Hall, D. Amaratunga, R. Haigh, B. Ingirige, K.
Karaminiyage, U. Kulatunga, & C. Pathirage (Eds.), Proceedings of the 3rd international
87
conference on building resilience 2013 (pp. 1-12). University of Salford. Retrieved from
http://www.buildresilience.org/2013/proceedings/
Loring, J. M. (2007). Wind energy planning in England, Wales and Denmark: Factors
influencing project success. Energy Policy, 35(4), 2648-2660. doi:10.1016
/j.enpol.2006.10.008
Madni, A. M., & Jackson, S. (2009). Towards a conceptual framework for resilience
engineering. IEEE Systems Journal, 3(2), 181-191. doi:10.1109/JSYST.2009.2017397
Major road projects okayed for Dhofar. (2013, May 28). Times of Oman. Retrieved from
http://timesofoman.com/article/17036/Oman/Major-road-projects-okayed-for-Dhofar
Mark, O., Weesakul, S., Apirumanekul, C., Aroonnet, S. B., & Djordjević, S. (2004). Potential
and limitations of 1D modelling of urban flooding. Journal of Hydrology, 299(3), 284-
299. doi:10.1016/j.jhydrol.2004.08.014
Mastin, M. C. (2009). Watershed models for decision support for inflows to potholes reservoir,
Washington, DC: U. S. Geological Survey. Retrieved from https://pubs.usgs.gov
/sir/2009/5081/
Mays, L. (2001). General characteristics of arid and semiarid regions. In M. Noueh (Ed.), Urban
drainage in arid and semiarid regions (Chapter 2). IHP-V 1 Technical Documents in
Hydrology, 1(40), Vol. lll. Retrieved from http://unesdoc.unesco.org/images
/0012/001247/124708eo.pdf
McCubbin, L. (2001). Challenges to the definition of resilience. Retrieved from
https://www.researchgate.net/publication/234629052_Challenges_to_the_Definition_of_
Resilience
McDaniels, T., Chang, S., Cole, D., Mikawoz, J., & Longstaff, H. (2008). Fostering resilience to
extreme events within infrastructure systems: Characterizing decision contexts for
mitigation and adaptation. Global Environmental Change, 18(2), 310-318. doi:10.1016
/j.gloenvcha.2008.03.001
McHarg, I. L. (1969). Design with nature. Garden City, NY: Natural History Press.
McHarg, I. L. (1971). Design with nature. New York, NY: Natural History Press.
MEED Insight Report. (n.d.). Oman projects market report 2014: A comprehensive forecast and
assessment of one of the region’s most diversified and dynamic projects markets.
Retrieved from https://www.meed.com/Journals/2014/06/08/q/g/t/sample-pages.pdf
Membery, D. (2001). Monsoon tropical cyclones: Part 1. Weather, 56(12), 431–438.
Doi:10.1002/j.1477-8696.2001.tb06526.x
88
Mershen, B. (2006). Development of community-based tourism in Oman: Challenges and
opportunities. In R. F. Daher (Ed.), Tourism in the Middle East: Continuity, change and
transformation (Chapter 7). Clevedon, UK: Channel View.
Metz, H. C. (Ed.). (1993). Persian Gulf states: A country study. Collingdale, PA: DIANE.
Retrieved from http://countrystudies.us/persian-gulf-states/
Milly, P. C. D., Wetherald, R. T., Dunne, K. A., & Delworth, T. L. (2002). Increasing risk of
great floods in a changing climate. Nature, 415(6871), 514-517. doi:10.1038/415514a
Mimura, N., Pulwarty, R. S., Duc, D. M., Elshinnawy, I., Redsteer, M. H., Huang, H. Q., Nkem,
J. N., & Sanchez Rodriguez, R. A. (2014). Adaptation planning and implementation. In
C. B. Field, V. R. Barros, D. J. Dokken, K. J. Mach, M. D. Mastrandrea, T. E. Bilir, . . .
& L. L. White (Eds.), Climate change 2014: Impacts, adaptation, and vulnerability. Part
A: Global and sectoral aspects. Contribution of Working Group II to the fifth assessment
report of the Intergovernmental Panel on Climate Change (pp. 869-898). Cambridge,
UK: Cambridge University Press.
Ministry of Environment & Climate Affairs. (2013, October). Initial National Communication
under the United Nations Framework Convention on Climate Change. Sultanate of
Oman. Retrieved from http://unfccc.int/resource/docs/natc/omnnc1.pdf
Ministry of Regional Municipalities and Water Resources. (2015).
http://mrmwr.gov.om/new/en/Page.aspx?id=82&li=8&Type=W_Sec&Slide=false
Ministry of Regional Municipalities and Water Resources. (2016). Specialties. Retrieved from
http://moeca.gov.om/MinistryInfo/ministryServices.aspx
Momani, N. M., & Fadil, A. S. (2010). Changing public policy due to Saudi City of Jeddah flood
disaster. Journal of Social Sciences, 6(3), 424-428. doi:10.3844/jssp.2010.424.428
Mount, J., & Twiss, R. (2005). Subsidence, sea level rise, and seismicity in the Sacramento-San
Joaquin Delta. San Francisco Estuary and Watershed Science, 3(1). Retrieved from
http://escholarship.org/uc/item/4k44725p#page-2
Müller, H. (1994). The thorny path to sustainable tourism development. Journal of Sustainable
Tourism, 2(3), 131–136. doi:10.1080/09669589409510690
NCSI. (2015, October). Statistical year book. Sultanate of Oman. Issue 43.
Ndubisi, F. (2002). Ecological planning: A historical and comparative synthesis [Kindle
version]. Baltimore, MD: Johns Hopkins University Press.
Neumayer, E. (2003). Weak versus strong sustainability: Exploring the limits of two opposing
paradigms (2nd ed.). Cheltenham, England: Edward Elgar.
89
Ng, W. S., & Mendelsohn, R. (2005). The impact of sea level rise on Singapore. Environment
and Development Economics, 10(02), 201-215. doi:10.1017/S1355770X04001706
Nicholls, R. J., & Cazenave, A. (2010). Sea level rise and its impact on coastal zones. Science,
328(5985), 1517–1520. doi:10.1126/science.1185782
Nicholls, R. J., & Small, C. (2002). Improved estimates of coastal population and exposure to
hazards released. Eos, Transactions American Geophysical Union, 83(28), 301-305.
doi:10.1029/2002EO000216
Oman development plan lays increasing emphasis on privatisation. (2001, February 12).
Alexander’s Gas & Oil Connections. Retrieved from http://www.gasandoil.com
/news/2001/03/ntm11058?month:int=5
Oman. (2002, September 3). Statement by His Highness Sayyid Assaad bin Tariq Al-Said at the
World Summit on Sustainable Development, Johannesburg, South Africa. Retrieved from
http://www.un.org/events/wssd/statements/omanE.htm
ONA. (2015, December 31). New fuel prices in Oman to be announced soon. Times of Oman.
Retrieved from http://www.timesofoman.com/article/74601/Oman/Government/Oman-
fuel-prices-to-be-effective-from-next-month
Palmieri, M. (2012). The impact of Arab Spring on regional infrastructure. KMPG. Retrieved
from https://www.kpmg.com/Ca/en/IssuesAndInsights/ArticlesPublications/Documents
/Emerging-trends-in-the-MENA-Private-Equity.pdf
Parris, A., Bromirsji, P., Burkett, V., Cayan, D., Culver, M., Hall, J. . . . Weiss, J. (2012,
December 6). Global sea level rise scenarios for the United States national climate
assessment. Retrieved from http://scenarios.globalchange.gov/sites/default/files
/NOAA_SLR_r3_0.pdf
Parry, M. L. (Ed.). (2007). Climate change 2007: Impacts, adaptation and vulnerability:
Working group II contribution to the fourth assessment report of the IPCC (Vol. 4).
Cambridge University Press. Retrieved from https://www.ipcc.ch/pdf/assessment-
report/ar4/wg2/ar4_wg2_full_report.pdf
Peduzzi, P., Dao, H., Herold, C., & Mouton, F. (2009). Assessing global exposure and
vulnerability towards natural hazards: the Disaster Risk Index. Natural Hazards and
Earth System Sciences, 9(4), 1149-1159. doi:10.5194/nhess-9-1149-2009
Petroleum Development Oman. (2014). PDO sustainability report. United Nation Global
Compacts. Retrieved from https://www.unglobalcompact.org/participation/report/cop
/create-and-submit/active/121541
Pfeffer, W. T., Harper, J. T., & O’Neel, S. (2008). Kinematic constraints on glacier contributions
to 21st-century sea level rise. Science, 321(5894), 1340-1343. doi:10.1126
/science.1159099
90
Plan council reviews steps for nine-year plan. (2015, March 26). Oman Tribune. Retrieved from
http://www.omantribune.com/files/pdfs/2015/MARCH/26-03-2015/20150326
_OT_15.pdf
Post, J. C., Lundin, C. G., & Mundial, B. (1996). Guidelines for integrated coastal zone
management. Washington, DC: World Bank.
Quaddus, M. A., & Siddique, M. A. B. (2001). Modelling sustainable development planning: a
multicriteria decision conferencing approach. Environment International, 27(2), 89-95.
doi:10.1016/S0160-4120(01)00066-6
Rabi, U. (2002). Majlis al-Shura and Majlis al-Dawla: Weaving old practices and new realities in
the process of state formation in Oman. Middle Eastern Studies, 38(4), 41-50.
doi:10.1080/714004484
Radke, J. D., G. S. Biging, M. Schmidt-Poolman, H. Foster, E. Roe, Y. Ju, O. Hoes, T. Beach, A.
Alruheili, L. Meier, W. Hsu, R. Neuhausler, W. Fourt, W. Lang, U. Garcia I. Reeves
(University of California, Berkeley). 2017. Assessment of Bay Area Natural Gas Pipeline
Vulnerability to Climate Change. California Energy Commission. Publication number:
CEC-500-2017-008
Rahmstorf, S. (2007). A semi-empirical approach to projecting future sea level rise. Science,
315(5810), 368-370. doi:10.1126/science.1135456
Rahmstorf, S., Foster, G., & Cazenave, A. (2012). Comparing climate projections to
observations up to 2011. Environmental Research Letters, 7(4). Retrieved from
http://iopscience.iop.org/article/10.1088/1748-9326/7/4/044035;jsessionid
=2AA64AC46F70033F12059C9C2C34B90E.c2.iopscience.cld.iop.org
Redclift, M. (2002). Sustainable development: Exploring the contradictions. London, UK:
Routledge.
Revi, A., Satterthwaite, D. E., Aragón-Durand, F., Corfee-Morlot, J., Kiunsi, R. B. R., Pelling,
M., Roberts, D. C., & Solecki, W. (2014). Urban areas. In C. B. Field, V. R. Barros, D. J.
Dokken, K. J. Mach, M. D. Mastrandrea, T. E. Bilir, . . . & L. L. White (Eds.), Climate
change 2014: Impacts, adaptation, and vulnerability. Part A: Global and sectoral
Aspects. Contribution of Working Group II to the Fifth Assessment Report of the
Intergovernmental Panel on Climate Change (pp. 535–612). Cambridge, UK: Cambridge
University Press. Retrieved from www.fao.org/docrep/s8684e/s8684e0a.htm
Rignot, E., Velicogna, I., Van den Broeke, M. R., Monaghan, A., & Lenaerts, J. T. M. (2011).
Acceleration of the contribution of the Greenland and Antarctic ice sheets to sea level
rise. Geophysical Research Letters, 38(5). doi:10.1029/2011GL046583.
Roads a priority in Oman’s $14.8bn infrastructure spend. (2013). World Highways. Retrieved
from http://www.worldhighways.com/sections/emergent/features/roads-a-priority-in-
omans-148bn-infrastructure-spend/
91
Rodriguez, P. B. (2015). Sustainable transportation in Al Buraimi, Sultanate of Oman. Analysis
and concepts for the city of Al Buraimi: Moving towards a more sustainable
transportation mode (Doctoral dissertation). Technische Universität Berlin Fak VI
Habitat Unit.
Sabatier, P. A. (1986). Top-down and bottom-up approaches to implementation research: A
critical analysis and suggested synthesis. Journal of Public Policy, 6(01), 21-48.
doi:10.1017/S0143814X00003846
Salm, R. V., & Jensen, R. A. C. (1989). Oman: coastal zone management plan: Dhofar
[Unpublished report]. Muscat Ministry of Commerce and Industry.
Santillo, D. (2007). Reclaiming the definition of sustainability. Environmental Science and
Pollution Research, 14(1), 60-66. doi:10.1065/espr2007.01.375
Schmitt, T. G., Thomas, M., & Ettrich, N. (2004). Analysis and modeling of flooding in urban
drainage systems. Journal of Hydrology, 299(3), 300-311. doi:10.1016
/j.jhydrol.2004.08.012
Senes, G., & Toccolini, A. (1998). Sustainable land use planning in protected rural areas in Italy.
Landscape and Urban Planning, 41(2), 107-117. doi:10.1016/S0169-2046(97)00064-9
Sharpley, R. (2000). Tourism and sustainable development: Exploring the theoretical divide.
Journal of Sustainable Tourism, 8(1), 1–19. doi:10.1080/09669580008667346
Sharpley, R. (2002). The challenges of economic diversification through tourism: the case of
Abu Dhabi. International Journal of Tourism Research, 4(3), pp. 221–235.
doi:10.1002/jtr.378
Slocombe, D. S. (1993). Environmental planning, ecosystem science, and ecosystem approaches
for integrating environment and development. Environmental Management, 17(3), 289–
303. Doi:10.1007/BF02394672
Small, C., & Nicholls, R. J. (2003). A global analysis of human settlement in coastal zones.
Journal of Coastal Research, 584-599. Retrieved from https://eprints.soton.ac.uk/cgi
/users/login?target=http%3A%2F%2Feprints.soton.ac.uk%2F39496%2F1%2F39496.pdf
Snoj, T.N. (2015, February 1). The new climate normal. Retrieved from: http://www.bq-
magazine.com/industries/other-sectors/2015/02/climate-change-in-the-middle-east
Snoussi, M., Ouchani, T., & Niazi, S. (2008). Vulnerability assessment of the impact of sea level
rise and flooding on the Moroccan coast: The case of the Mediterranean eastern zone.
Estuarine, Coastal and Shelf Science, 77(2), 206-213. doi:10.1016/j.ecss.2007.09.024
Sorensen, J. (1993). The international proliferation of integrated coastal zone management
efforts. Ocean & Coastal Management, 21(1–3), 45–80.
92
Stelling, G. S. (2012). Quadtree flood simulations with sub-grid digital elevation models.
Proceedings of the ICE-Water Management, 165(10), 567-580. doi:10.1680
/wama.12.00018
Subramoniam, S., Al-Essai, S. A. N., Al-Marashadi, A. A. M., & Al-Kindi, A. M. A. (2010).
SWOT analysis on Oman tourism: A case study. Journal of Economic Development,
Management, IT, Finance, and Marketing, 2(2), 1.
Subyani, A. M. (2011). Hydrologic behavior and flood probability for selected arid basins in
Makkah area, western Saudi Arabia. Arabian Journal of Geosciences, 4(5-6), 817-824.
doi:10.1007/s12517-009-0098-1
Sullivan, K. D., & Uccellini, L. W. (2013). Service assessment: Hurricane/post-tropical cyclone
Sandy, October 22–29, 2012. Silver Spring, Maryland: U.S. Department of Commerce.
Retrieved from http://www.nws.noaa.gov/os/assessments/pdfs/Sandy13.pdf
Supreme council for planning meets. (2015, April 19). Oman Observer. Retrieved from
http://omanobserver.om/supreme-council-for-planning-meets/
Tabari, H., Abghari, H., & Hosseinzadeh Talaee, P. (2012). Temporal trends and spatial
characteristics of drought and rainfall in arid and semiarid regions of Iran. Hydrological
Processes, 26(22), 3351-3361. doi:10.1002/hyp.8460
Taqa-Mirbat road to be ready by March 2018. (2016, June 20). Oman Daily Observer. Retrieved
from http://2016.omanobserver.om/taqa-mirbat-road-to-be-ready-by-march-2018/
Tear, T. H., & Forester, D. (1992). Role of social theory in reintroduction planning: A case study
of the Arabian oryx in Oman. Society and Natural Resources: An International Journal,
5(4), 359-374. doi:10.1080/08941929209380799
Tebaldi, C., Strauss, B. H., & Zervas, C. E. (2012). Modelling sea level rise impacts on storm
surges along US coasts. Environmental Research Letters, 7(1), 1-11. doi:10.1088/1748-
9326/7/1/014032
Tippett, J., Handley, J. F., & Ravetz, J. (2007). Meeting the challenges of sustainable
development—A conceptual appraisal of a new methodology for participatory ecological
planning. Progress in Planning, 67(1), 9-98. doi:10.1016/j.progress.2006.12.004
Tolba, M. K. (1987). Sustainable development: Constraints and opportunities. London, UK:
Butterworths.
Tress, B., & Tress, G. (2003). Scenario visualisation for participatory landscape planning—A
study from Denmark. Landscape and Urban Planning, 64(3), 161-178. doi:10.1016
/S0169-2046(02)00219-0
93
Tudhope, A. W., Lea, D. W., Shimmield, G. B., Chilcott, C. P., & Head, S. (1996). Monsoon
climate and Arabian Sea coastal upwelling recorded in massive corals from southern
Oman. Palaios, 11(4), 347-361. doi:10.2307/3515245
Tyler, S., & Moench, M. (2012). A framework for urban climate resilience. Climate and
Development, 4(4), 311–326.
Vafeidis, A. T., Nicholls, R. J., McFadden, L., Tol, R. S. J., Hinkel, J., Spencer, T., . . . Klein, R.
J. T. (2008). A new global coastal database for impact and vulnerability analysis to sea
level rise. Journal of Coastal Research, 24, 917-924. doi:10.2112/06-0725.1
Vale, L. J., & Campanella, T. J. (2005). The resilient city: How modern cities recover from
disaster. Oxford, UK: Oxford University Press.
Walker, B., & Salt, D. (2012). Resilience thinking: Sustaining ecosystems and people in a
changing world. Washington, DC: Island Press.
Wall, G. (1993). International collaboration in the search for sustainable tourism in Bali,
Indonesia. Journal of Sustainable Tourism, 1(1), 38–47. doi:10.1080
/09669589309450699
Watson, R. T., Zinyowera, M. C., & Moss, R. H. (1998). IPCC special report: The regional
impacts of climate change: An assessment of vulnerability. Cambridge, UK: Cambridge
University Press. Retrieved from https://www.ipcc.ch/pdf/special-reports/spm/region-
en.pdf
WCED. (1987). Report of the World Commission on environment and development: Our
common future. Retrieved from http://www.un-documents.net/our-common-future.pdf
Wiersum, K. F. (1995). 200 years of sustainability in forestry: Lessons from history.
Environmental Management, 19(3), 321–329. doi:10.1007/BF02471975
Wong, P. P. (1998). Coastal tourism development in Southeast Asia: relevance and lessons for
coastal zone management. Ocean & Coastal Management, 38(2), 89–109.
World Highway. (2013, May). Roads a priority in Oman’s $14.8bn infrastructure spend.
Retrieved from http://www.worldhighways.com/sections/emergent/features/roads-a-
priority-in-omans-148bn-infrastructure-spend/
Youssef, A. M., Pradhan, B., & Hassan, A. M. (2011). Flash flood risk estimation along the St.
Katherine road, southern Sinai, Egypt using GIS based morphometry and satellite
imagery. Environmental Earth Sciences, 62(3), 611-623. doi:10.1007/s12665-010-0551-1
Zeller, M. E. (1990). Precipitation on Arid or Semi-Arid Regions of the Southwestern United
States: Research Needs from a Consultant's Perspective. In R. French,
Hydraulics/Hydrology of arid lands (H²AL) (pp. 525-529). New York, NY: ASCE.

94
95
BIBLIOGRAPHY
Cazenave, A., & Llovel, W. (2010). Contemporary sea level rise. Annual Review of Marine
Science, 2, 145-173.
Füssel, H. M. (2007). Adaptation planning for climate change: Concepts, assessment approaches,
and key lessons. Sustainability Science, 2(2), 265–275. doi:10.1007/s11625-007-0032-y
Groves, C. R., Jensen, D. B., Valutis, L. L., Redford, K. H., Shaffer, M. L., Scott, J. M., …
Anderson, M. G. (2002). Planning for biodiversity conservation: Putting conservation
science into practice. BioScience, 52(6), 499–512. Doi:10.1641/0006-3568(2002)052
[0499:PFBCPC]2.0.CO;2
NIAC, National Infrastructure Advisory Council. (2009, September 8). Critical infrastructure
resilience: Final report and recommendations. Retrieved from
https://www.dhs.gov/xlibrary/assets/niac/niac_critical_infrastructure_resilience.pdf
Rolta awarded nationwide orthophoto/mapping project. (2011, February 3). Directions
Magazine. Retrieved from http://www.directionsmag.com/pressreleases/rolta-awarded-
nationwide-orthophoto-mapping-project-for-oman/154192