Embed Size (px)
Citation preview
AN APPLICATION OF LEAN PRINCIPLES TO PRODUCT DEVELOPMENT
Robert Scott Penner
B.A.Sc., University of British Columbia, 1994
MS., University of Arizona, 1 997
PhD., University of Arizona, 1999
PROJECT SUBMITTED IN PARTIAL FULFILLMENT OF THE REQUIREMENTS FOR THE DEGREE OF
MASTER OF BUSINESS ADMINISTRATION
In the Faculty
of Business Administration
Management of Technology
0 Robert Scott Penner 2005
SIMON FRASER UNIVERSITY
Fall 2005
All rights reserved. This work may not be reproduced in whole or in part, by photocopy or other means, without permission of the author.

APPROVAL
Name:
Degree:
Title of Project:
Robert Scott Penner
Master of Business Administration
An Application of Lean Principles to Product Development
1 Supervisory Committee:
Dr. Aidan Vining Senior Supervisor Professor of Business Administration
- - - - - - -
Dr. Michael Parent Second Reader Associate Professor and Academic Director MBA Programs
1 Date Approved:
SIMON FRASER UNIVERSITY
PARTIAL COPYRIGHT LICENCE
I hereby grant to Simon Fraser University the right to lend my thesis, project or extended essay (the title of which is shown below) to users of the Simon Fraser University Library, and to make partial or single copies only for such users or in response to a request from the library of any other university, or other educational institution, on its own behalf or for one of its users.
I further grant permission to Simon Fraser University to keep or make a digital copy for use in its circulating collection.
I further agree that permission for multiple copying of this work for scholarly purposes may be granted by me or the Dean of Graduate Studies. It is understood that copying, publication or public performance of this work for financial gain shall not be allowed without my written permission.
Public performance permitted: Multimedia materials that form part of this work are hereby licenced to Simon Fraser University for educational, non-theatrical public performance use only. This licence permits single copies to be made for libraries as for print material with this same limitation of use.
Public performance not permitted: Multimedia materials that form part of this work are hereby licenced to Simon Fraser University for private scholarly purposes only, and may not be used for any form of public performance. This licence permits single copies to be made for libraries as for print material with this same limitation of use.
d Multimedia licence not applicable to this work. No separate DVD or DC-ROM material is included in this work.
Title of Project: An Application of Lean Principles to Product Development
Author: Robert Scott Penner
November 15,2005
ABSTRACT
Product development is a catalyst, transforming ideas into products. This
commercialization process is critical to the long-term viability of the business by fuelling
revenue and earnings growth. Lean Manufacturing principles are core to Toyota's
productivity and have been successfully adopted by many North American
manufacturers. Toyota has also extended this methodology to its product development
process. Several other methodologies, ranging from Six Sigma to Stage-Gate, exist both
in manufacturing and product development. This analysis looks at applying these best
practices.
An understanding of the corporate and industry environments serves as the
foundation for this investigation. A review of best practices in manufacturing and
development provides the theoretical framework with which to undertake a specific
analysis at Creo. Three product development strategies are examined based on their
relevancy, implementation and impact. These include modified Stage-Gate, TPDS and a
hybrid approach. From this analysis, the report identifies commonalities and makes
several concluding recommendations.
ACKNOWLEDGEMENTS
First and foremost, I would like to thank the Creo organization. This transition
period as they become part of Eastman Kodak places many demands upon the employees,
yet they were all very generous with their time. This assistance was instrumental in my
successful completion of this project. In particular, I would like to thank Mike Jackson,
Tangyu Wang, and Calvin Osborne: my project supervisor.
I would also like to acknowledge the assistance that I received from the SFU
Business faculty. The material presented during the Management of Technology
program formed the foundation for this analysis. Additionally, I would like to thank my
faculty readers, Aidan Vining and Michael Parent, for their review and critique of this
material.
Finally, I would like to thank my wife, Denise, for her support during this entire
endeavour.
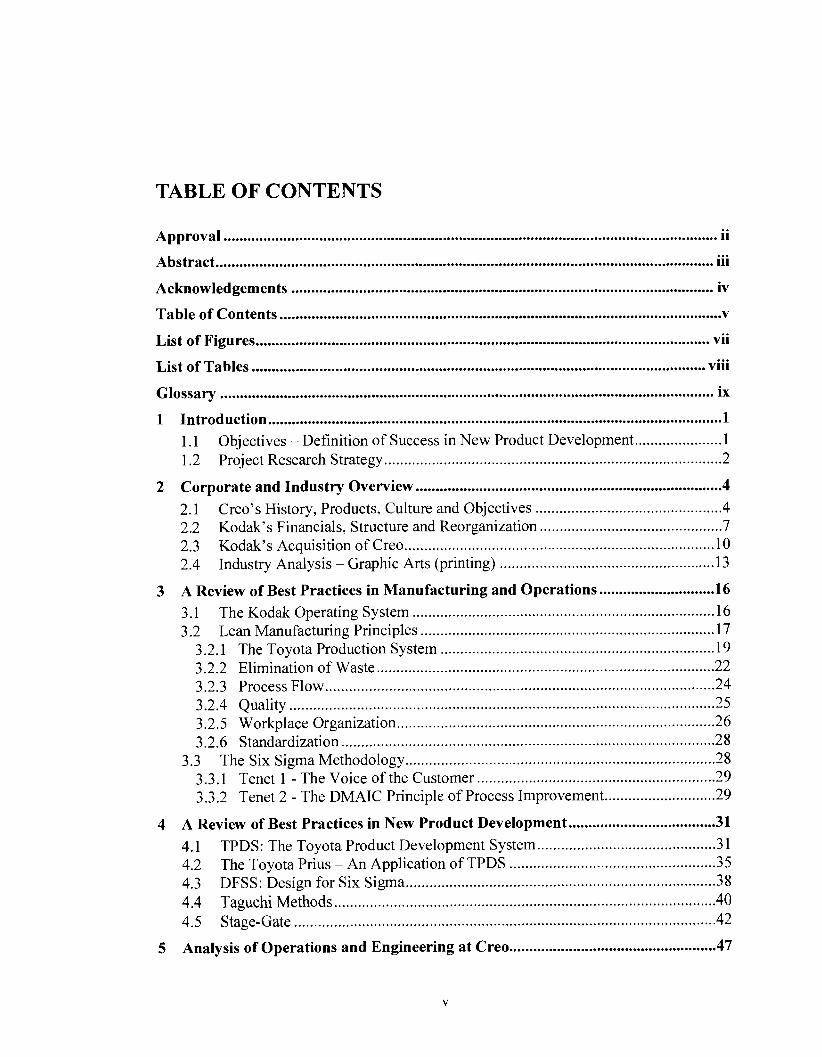
TABLE OF CONTENTS
. . Approval ............................................................................................................................ 11
... Abstract ............................................................................................................................ 111
Acknowledgements ......................................................................................................... iv
Table of Contents ............................................................................................................... v . . List of Figures .................................................................................................................. vll ... List of Tables .................................................................................................................. vui
Glossary ........................................................................................................................... ix
.................................................................................................................. Introduction 1 1.1 Objectives . Definition of Success in New Product Development ...................... 1
..................................................................................... 1.2 Project Research Strategy 2
Corporate and Industry Overview ............................................................................. 4 ............................................... 2.1 Creo's History. Products. Culture and Objectives 4 .............................................. 2.2 Kodak's Financials. Structure and Reorganization 7
.............................................................................. 2.3 Kodak's Acquisition of Creo 10 ...................................................... 2.4 Industry Analysis - Graphic Arts (printing) 13
A Review of Best Practices in Manufacturing and Operations ............................. 16 ........................................................................... 3.1 The Kodak Operating System -16 ......................................................................... 3.2 Lean Manufacturing Principles 1 7
3.2.1 The Toyota Production System ..................................................................... 19 ..................................................................................... 3.2.2 Elimination of Waste 22
3.2.3 Process Flow .................................................................................................. 24 ........................................................................................................... 3.2.4 Quality 25 . . ................................................................................ 3.2.5 Workplace Organization 26
.............................................................................................. 3.2.6 Standardization 28 .............................................................................. 3.3 The Six Sigma Methodology 28
............................................................ 3.3.1 Tenet 1 - The Voice of the Customer 29 ............................ 3.3.2 Tenet 2 - The DMAIC Principle of Process Improvement 29
..................................... A Review of Best Practices in New Product Development 31 ............................................. 4.1 TPDS: The Toyota Product Development System 31
4.2 The Toyota Prius - An Application of TPDS .................................................... 35 . . .............................................................................. 4.3 DFSS: Design for Six Sigma 38 ................................................................................................ 4.4 Taguchi Methods 40
.......................................................................................................... 4.5 Stage-Gate 42
Analysis of Operations and Engineering at Creo .................................................... 47
5.1 Analysis of Operations ....................................................................................... 47 .................................................................................... 5.2 The Matrix Organization 50
............................................................................................. 5.3 Stage-Gate at Creo 51
Alternatives and Application of Best Practices to Product Development at Creo ............................................................................................................................. 55
.......................................................................................... 6.1 Modified Stage-Gate 56 6.2 TPDS at Creo ..................................................................................................... 59
........................................................................................... 6.3 A Hybrid Approach -61 ................................................................................... 6.4 Summary of Alternatives 62
Recommendations ...................................................................................................... 63
........................................................................................................................ Appendices 67 Appendix A . Cree- 3 Year Statement of Operations ................................................... 67
................................................ . Appendix B Kodak- 3 Year Statement of Operations 68
Reference List ................................................................................................................... 69

LIST OF FIGURES
Figure 1 . Conceptual Project Outline .................................................................................. 3
Figure 2 . The Toyota Production System- House of Lean Production ............................. 21
............................... Figure 3 . Coordination of the Toyota Product Development System 32
Figure 4 . The standard 5 step Stage-Gate process coupled with the Technology Development process ....................................................................................... 43
vii
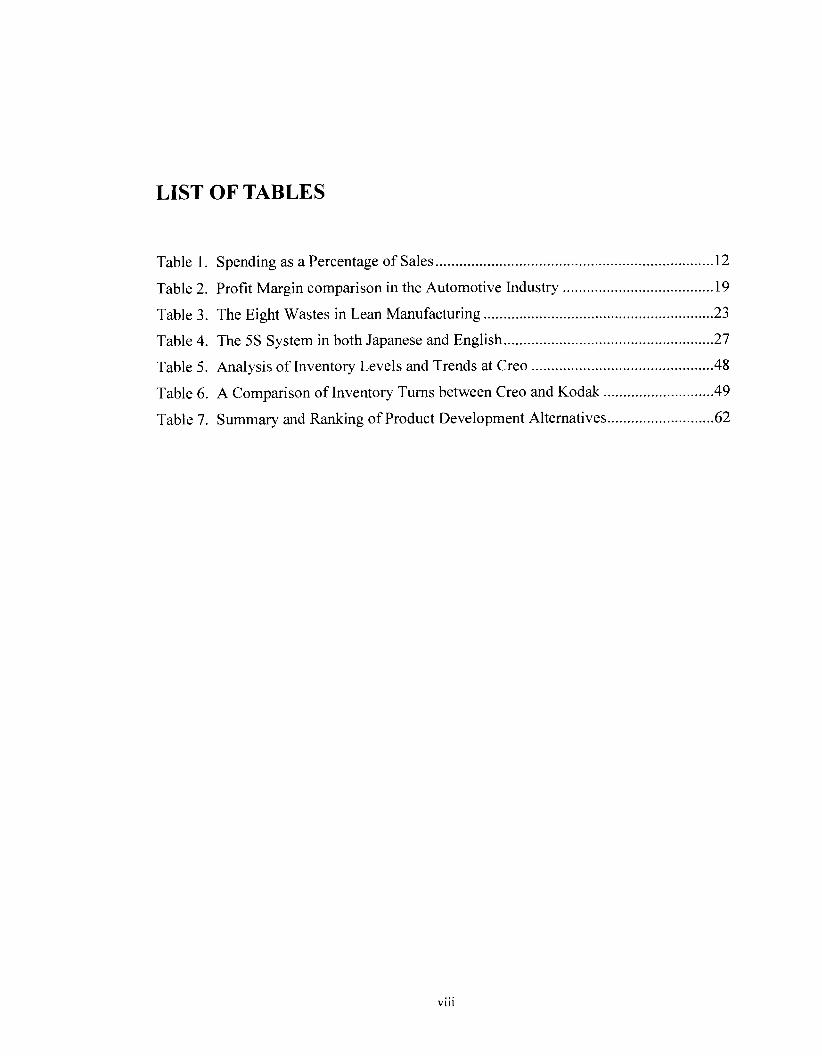
LIST OF TABLES
...................................................................... Table 1 . Spending as a Percentage of Sales 12
...................................... Table 2 . Profit Margin comparison in the Automotive Industry 19
.......................................................... Table 3 . The Eight Wastes in Lean Manufacturing 23
..................................................... Table 4 . The 5 s System in both Japanese and English 27
.............................................. . Table 5 Analysis of Inventory Levels and Trends at Creo 48
............................ Table 6 . A Comparison of Inventory Turns between Creo and Kodak 49
........................... . Table 7 Summary and Ranking of Product Development Alternatives 62

GLOSSARY
Term
CTP
CTQ
DCCDl
DFSS
DMADV
DMAlC
DMEDl
DOE
FMEA
Heijunka
IDOV
IS09001
IS01 4001
Jidoka
JIT
Definition
Computer-to-plate. The process of imaging printing plates directly with digital information as opposed to an analog process in which film is used as an intermediary
Critical to Quality. Elements which are critical to the customer's quality requirements.
A DFSS acronym: Define, Customer, Concept, Design, Implement.
Design for Six Sigma. A design methodology which attempts to create error-free processes from the start.
A DFSS acronym: Define, Measure, Analyze, Design, Verify.
A Six Sigma acronym outlining the improvement process: Define, Measure, Analyze, Improve, and Control.
A DFSS acronym: Define, Measure, Explore, Develop, Implement.
Design of Experiments.
Failure Modes and Effects Analysis. A process trouble-shooting methodology.
A Japanese term meaning production levelling, a key aspect of efficient flow in Lean Manufacturing.
A DFSS acronym: Identify, Design, Optimize, Validate.
A quality-based accreditation administered by the International Organization for Standardization.
An environmental management standard to ensure products and services have the lowest possible environmental impact.
A basis of the Toyota Production System which translates as "automation with a human touch."
Just-in-time: An inventory management methodology whereby the movement of parts is coordinated to smoothly flow through the supply chain to meet customer demand and minimize inventory levels.

Definition Term
Kaizen
KOS
LDS
Lean Principles
Muda
Poka- yoke
Six Sigma
SPC
TPDS
TPS
Value Stream Mapping
VOC
WIP
Continuous improvement. A key activity in the application of Lean Principles.
Kodak Operating System -the application of Lean Principles at Eastman Kodak.
Lean Development Systems - the application of Lean Principles to the new product development function within a company.
Lean Manufacturing - the traditional application of Lean Principles to a company's manufacturing processes.
Originally a customer-focused manufacturing philosophy which attempts to do more with less by eliminating waste. Lean principles have now extended to multiple functions within an organization.
Japanese term for waste. Identification and elimination of waste is a critical aspect of a Lean system.
A Japanese term which is translated as error proofing a process.
A quality focused manufacturing philosophy pioneered by Motorola in the 80's.
Statistical Process Control. A procedure used to monitor quality in a manufacturing environment.
Toyota Product Development System. The methodology used by Toyota in its new product development process.
Toyota Production System. The manufacturing principles of the Toyota Motor Corporation which are considered to be the practical foundation of Lean Manufacturing.
A visual representation of every process in the material and information flow associated with the production of an item. This is a key activity in application of Lean Principles.
Voice of the Customer. A Six Sigma principle which highlights the importance of focusing on customer needs.
Work In Progress or Work In Process. Unfinished goods which represent one type of inventory categorization.

1 INTRODUCTION
1.1 Objectives - Definition of Success in New Product Development
Lean Manufacturing principles are now well established in many manufacturing
operations and have demonstrated significant results in terms of cost savings, efficiency
improvements, and ultimately customer satisfaction (Womack and Jones, 1996;
Waurzyniak, 2005). However, the application of these practices to the product
development process is less well recognized. Even the definition of a successful
implementation is unclear. Although the application of Lean Manufacturing principles to
product development has a broad scope, this specific analysis focuses on engineering
operations at Creo, a subsidiary of Kodak. This report reviews current best practices in
Lean Manufacturing and Product Development, examines specific opportunities at Creo,
and makes appropriate recommendations as to how Creo can realize greater value from
its product development process.
The success of this analysis depends on both a solid foundation in manufacturing
best practices and a clear understanding of the objectives. Success in product
development can generally be defined as using resources more efficiently to deliver value
to the customer. Contributing factors and observable benefits include:
> shorter development times (reduced time to market)
> less capital expenditures and quicker payback periods
> product design manufacturability
> increased productivity and reduced cost of goods sold
> lower total cost of ownership for the customer

P product quality and reliability
b market acceptance
P a more competitive company
The specific objectives of this investigation into lean product development are as follows:
k Understand Lean Manufacturing principles and Product Development
methodologies.
k Understand how other best-practices organizations, such as Toyota,
apply Lean Principles in product development.
> Identify what opportunities exist to use Lean in Creo's product
development process. Identify what changes need to be made to the
current system.
k Comment on the implementation and estimate the impact of these
changes.
1.2 Project Research Strategy
The collection of information to support this investigation relied on a variety of
sources including academic journals, issued patents, corporate annual reports, filings
from the US Security and Exchange Commission (SEC), popular press and a review of
materials on the internet. A thorough knowledge of manufacturing best practices forms
the core of this analysis. Furthermore, a clear understanding of both Creo's and Kodak's
background, methodologies and objectives is necessary in order to arrive at coherent and
appropriate final recommendations. The manufacturing best practices foundation is
expanded by specifically applying the general findings to product development. Finally,
the ultimate goal is the direct application of lean product development strategies to
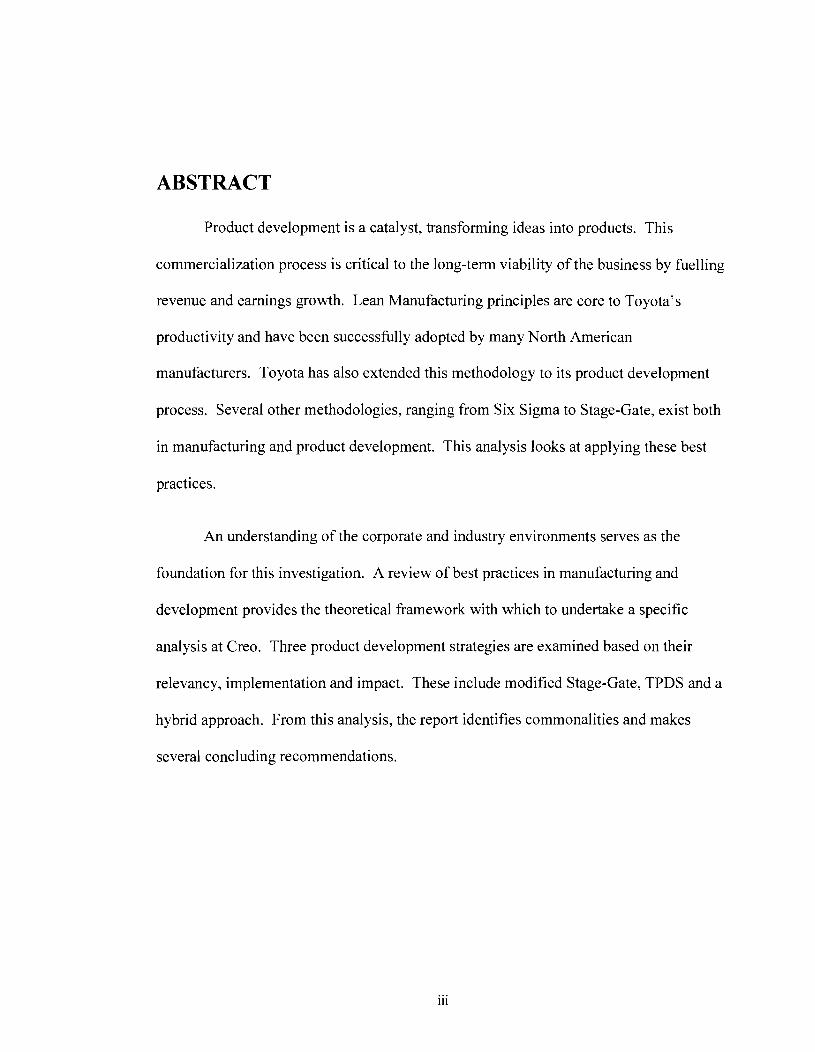
Creo's product development process. A conceptual representation of this framework is
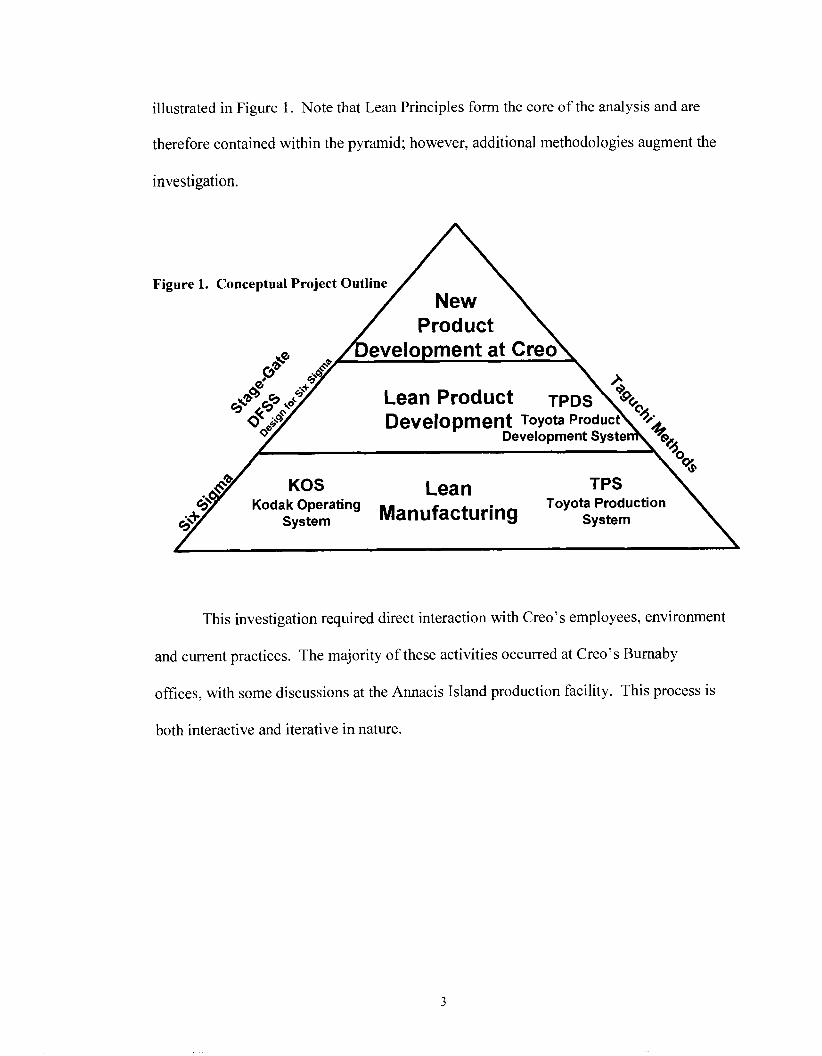
illustrated in Figure 1. Note that Lean Principles form the core of the analysis and are
therefore contained within the pyramid; however, additional methodologies augment the
investigation.
Figure 1. Conceptual Project Outline
evelopment at Creo
Kodak Operating Toyota Production
This investigation required direct interaction with Creo's employees, environment
and current practices. The majority of these activities occurred at Creo's Burnaby
offices, with some discussions at the Annacis Island production facility. This process is
both interactive and iterative in nature.

2 CORPORATE AND INDUSTRY OVERVIEW
Analysis of the industry, company and organizational dynamics forms the
contextual framework for this investigation. Although the general philosophy associated
with the application of lean principles to product development can be applied in a broad
sense, the finer contextual details are required for a successful implementation. This
chapter provides the necessary background with which to conduct our investigation.
The printing industry has grown immensely in the more than five centuries since
Johannes Gutenberg first invented the printing press. Today, graphic arts is a multi-
billion dollar industry employing millions of people. Printing press technology has
experienced a number of revolutionary advances with the industry itself having rather
interesting market dynamics. Consolidation, joint ventures and competition are all
common amongst the major players in the industry. This section provides an external
analysis of the organizations and industry. Consequently, all information represented
within this section was obtained from materials in the public domain.
2.1 Creo's History, Products, Culture and Objectives
Creo was founded in 1983 by Dan Gelbart and Ken Spencer. The company's
initial product focus was optical tape recorder devices for data storage. In the early 90's,
Creo pioneered thermal computer to plate (CTP) technology which revolutionized the
printing industry. Creo decided to provide a complete digital prepress system in order to
facilitate easier customer adoption of the new technology. This strategy included input

systems such as digital scanners, software providing workflow management solutions,
proofing systems and output devices which transfer data onto printing plates. At the
heart of the thermal CTP process is the S Q U A R E S ~ O ~ ~ ~ technology which precisely
replicates digital pixels by providing uniform irradiance across each pixel (Creo, 2000, p.
13).
Creo's growth has been fuelled by product innovation and the company's success
has been dependent on the generation and protection of its intellectual property (IP). The
company's philosophy pertaining to its IP is best outlined by the following recent SEC
filing (Creo AIF, 2005, p. 10).
Our success and ability to compete are dependent in part on our ability to develop
and protect our proprietary technology. Our practice is to file patents primarily in
the U.S. and to make corresponding applications elsewhere when considered
advisable to protect technology, inventions and improvements important to the
development of our business. We also rely on a combination of copyright,
trademark and trade secret rights, confidentiality agreements and licensing
arrangements. As of September 30, 2004, we held approximately 328 patents
worldwide, 21 1 of which were granted U.S. patents, and at that time we had 143
pending U.S. applications. In the past fiscal year, we were granted 33 U.S. patents
and filed approximately 59 new patent applications in the U.S.
Throughout its history, Creo has maintained a belief of valuing its employees by
providing a positive and challenging work environment. Since creativity and innovation
are core to Creo's success, the work environment and culture must encourage such
activities. By empowering its employees and decentralizing the decision-making process,
Creo achieves its goal. In 2004, Creo was named one of Canada's 50 Best Employers by
the Globe and Mail's Report on Business magazine. Creo was also the recipient of the
Overall Leadership Award for large business at the Ethics in Action Awards for British
Columbia. The company and its employees are guided by the following Creo Principles:
> We strive to be the best in the world in all that we do.
> We care about our customers, each other, our suppliers, partners and our shareholders.
> We do our absolute best to honour our commitments.
> We believe people are most effective and satisfied when self-managed and we will provide the tools, training and environment for this to occur.
> We strive to always act with integrity and fairness.
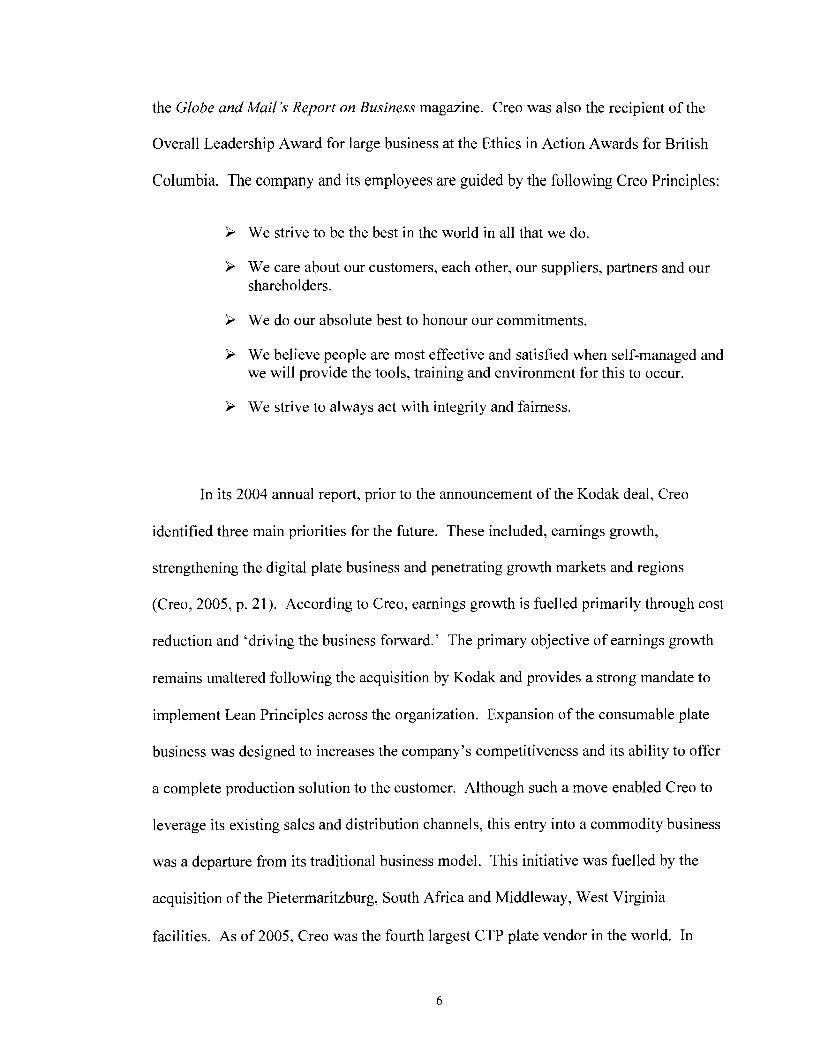
In its 2004 annual report, prior to the announcement of the Kodak deal, Creo
identified three main priorities for the future. These included, earnings growth,
strengthening the digital plate business and penetrating growth markets and regions
(Creo, 2005, p. 21). According to Creo, earnings growth is fuelled primarily through cost
reduction and 'driving the business forward.' The primary objective of earnings growth
remains unaltered following the acquisition by Kodak and provides a strong mandate to
implement Lean Principles across the organization. Expansion of the consumable plate
business was designed to increases the company's competitiveness and its ability to offer
a complete production solution to the customer. Although such a move enabled Creo to
leverage its existing sales and distribution channels, this entry into a commodity business
was a departure from its traditional business model. This initiative was fuelled by the
acquisition of the Pietermaritzburg, South Africa and Middleway, West Virginia
facilities. As of 2005, Creo was the fourth largest CTP plate vendor in the world. In
August 2005, Kodak announced that it would close the West Virginia facility as part of
its product rationalization activities (Print On Demand.Com, 2005). The final goal of
penetrating target growth markets and regions is complicated following the Kodak
merger. A complete discussion is found in section 2.3.
In summary, we see that Creo is an organization with a strong corporate culture, a
history of innovation, and a mandate for change. However, both the corporate direction
and environment have been recently altered with the acquisition by Kodak. It is within
this context that we will strive to recognize greater value for the company from the
product development process.
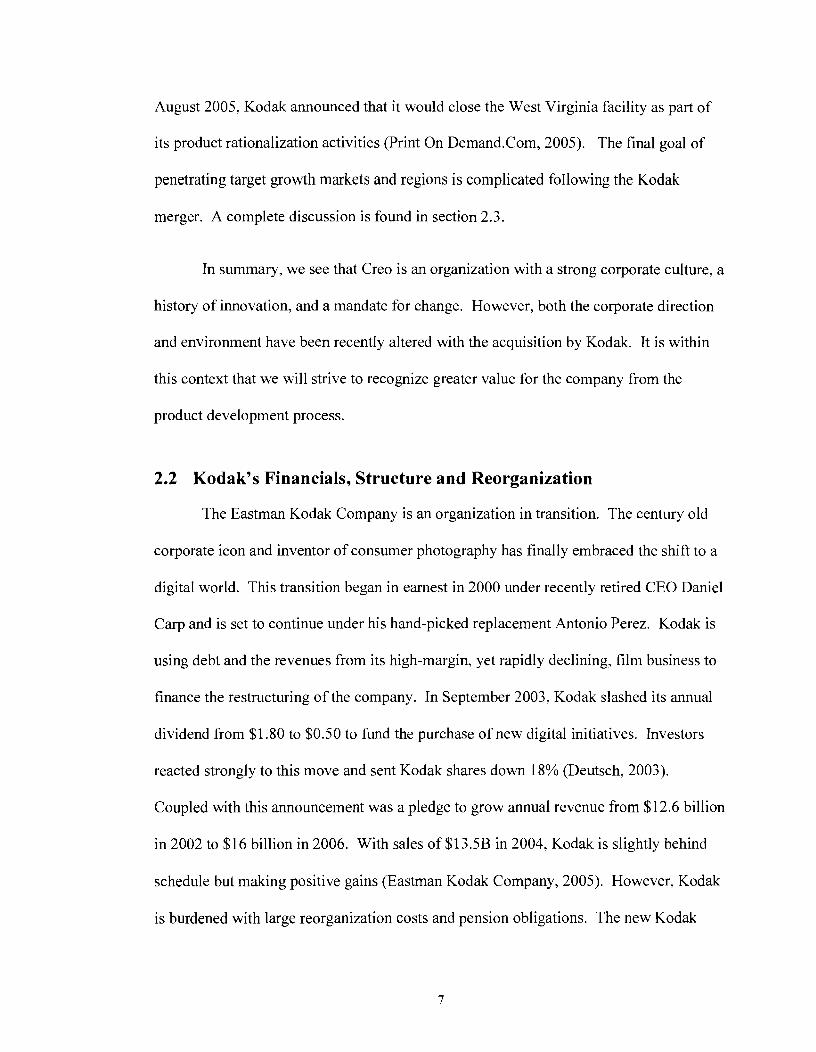
2.2 Kodak's Financials, Structure and Reorganization
The Eastman Kodak Company is an organization in transition. The century old
corporate icon and inventor of consumer photography has finally embraced the shift to a
digital world. This transition began in earnest in 2000 under recently retired CEO Daniel
Carp and is set to continue under his hand-picked replacement Antonio Perez. Kodak is
using debt and the revenues from its high-margin, yet rapidly declining, film business to
finance the restructuring of the company. In September 2003, Kodak slashed its annual
dividend from $1 .SO to $0.50 to fund the purchase of new digital initiatives. Investors
reacted strongly to this move and sent Kodak shares down 18% (Deutsch, 2003).
Coupled with this announcement was a pledge to grow annual revenue from $12.6 billion
in 2002 to $16 billion in 2006. With sales of $l3.5B in 2004, Kodak is slightly behind
schedule but making positive gains (Eastman Kodak Company, 2005). However, Kodak
is burdened with large reorganization costs and pension obligations. The new Kodak

must be more competitive and prepared to accept reduced profit margins. Former CEO
Daniel Carp acknowledges that the company's profit margin will drop from roughly 40%
to 30'36, but no further (Kher, 2005). The new Kodak will only faintly resemble the old
film giant. This metamorphosis results from establishing new markets in the area of
digital imaging technologies, known as infoimaging, and increasing productivity through
a number of corporate initiatives.
Kodak has a truly global presence and tremendous brand recognition based on the
success of its photography business. The new Kodak seeks to expand upon this base and
diversify into the broader imaging domain, especially digital technologies.
Consequently, Kodak's operations are divided into four main divisions (Eastman Kodak
Company, 2005):
P Digital and Film Imaging
P Health Imaging and Information
P Graphic Communications
P Display and Components
Digital and Film Imaging (D&FIS) includes the traditional photographic films and
papers, retail and wholesale photofinishing, in addition to digital cameras, printers and
online picture services for both consumer and professional photographers. D&FIS
accounted for 68% of revenue in 2004, as anticipated declines in the traditional film
segment were offset by strong gains in digital media. The year 2005 should represent a
significant milestone for Kodak as revenues from digital imaging (including the other
business units) should exceed that of traditional photography.
The Health Imaging and Information division supplies both the medical and
dental industries with traditional and digital imaging products and services. In addition to
being the long-established industry leader in dental X-ray films, Kodak has ascended to
the forefront in digital radiography. To complement equipment manufacturing, Kodak
also provides digital information management services to a number of healthcare
facilities. This business unit generated $2.686M or nearly 20% of net sales revenue in
2004.
Graphic Communications offers a variety of options to the printing industry as
well as document scanning, archiving and IT services. Although 2004 revenues for this
business unit are modest in comparison to other divisions, there is a tremendous potential
for growth thanks to a number of strategic acquisitions which will be discussed later in
this section. Kodak is well-positioned within the graphic communication market to
capitalize on the transition to digital solutions.
The Display and Components division designs and produces leading-edge organic
light-emitting diode (OLED) displays, imaging sensors and other specialty materials to
original equipment manufacturers. Kodak's initial research into OLEDs has continued
and resulted in the filing of over 150 patent applications in 2004. Kodak is well-
positioned to benefit from its commitment to what many consider to be the next
generation in display technology. In addition, Kodak's strong intellectual property
portfolio will be prominent in the development of new flexible, lightweight plastic-based
displays.
Massive re-organization is a consequence of Kodak's shift in strategy towards
digital imaging technologies. Included in this transition are several acquisitions and
divestitures. In addition to a change in dividend policy which increased retained
earnings, the sale of the Remote Sensing Systems unit generated $725 million in cash.
Much of this growth through acquisition strategy has been concentrated in the Graphic
Communications group. These acquisitions include Scitex Digital Printing in January
2004 for $252 million and a number of NexPress related entities from Heidelberg in May
2004. The Creo and Kodak Polychrome Graphics (KPG) acquisitions, announced on
January 3 1,2005, completed Kodak's immediate growth in the graphic communication
segment. Given the relevancy of the Creo acquisition to this report, it is discussed in
greater detail in section 2.3. Kodak will acquire complete control of KPG from Sun
Chemical Corporation in exchange for $8 17 million, payable over an eight year period.
Assuming full ownership of this formerly joint venture significantly strengthened
Kodak's position in the digital plate business. The acquisition of Practiceworks in
October, 2003 for $475 million bolstered Kodak's presence in digital radiography.
Finally, several arrangements, including a 20% stake in China Lucky Film Company,
have strengthened Kodak's position in emerging markets.
2.3 Kodak's Acquisition of Creo
Creo represents the final component of Kodak's growth through acquisition
strategy in its Graphic Communications group. When the $980 million deal closed on
June 15, 2005, Creo became a subsidiary of Kodak. As noted earlier, Creo fits nicely into
Kodak's overall digital growth strategy. However, Kodak was not the only active
participant in this transaction. On October 12, 2004 a group of dissident shareholders led
by Burton Capital Management and Goodwood Incorporated, a Toronto-based hedge
fund, began a proxy battle designed to unseat Creo's board of directors (Bolan, 2005, p.
16). This announcement led Creo, on October 15, to reveal that in July the board of
directors had established a special committee of independent directors. The mandate of
this committee was as follows (Creo, 2004)
... review strategic alternatives with the objective of enhancing shareholder value.
The committee, management, and its advisors are charged with the evaluation of
the company's business plan and the consideration of a full range of strategic
options, including acquisitions, alliances with strategic partners, resale
arrangements, business combinations, and the sale of all or a portion of the
company's assets.
These activities culminated with the announcement of the deal on January 3 1,2005.
In addition to silencing dissidents and rewarding shareholders, the Kodak-Creo
acquisition created a consolidated leader in the commercial printing and plate industry.
The complementary technologies and economies of scale should bring financial benefit to
the company. However, despite the many advantages of the deal, it is not without its
challenges. One of the most contentious aspects of the Kodak-Creo deal is Creo's
established OEM relationship with Kodak rival Xerox. Creo's Spire colour print servers
are a key component in Xerox's DocuColor printers and DocuColor iGen3 presses. As
noted in Creo's 2004 Annual Report, Creo sought to increase revenues by expanding its
digital printing business with Xerox (Creo, 2005, p. 5). Creo is also a major software
partner with Xerox and recipient of Xerox's Software Partner of the Year award. Creo
and DuPont have a worldwide strategic alliance in halftone and color proofing systems.
However, Jim Langley, President of Kodak's Graphic Communications Group, has

suggested that these relationships would continue as Kodak would establish a firewall
between its and Creo's operations (Sherburne, 2005).
In terms of operations, one of the biggest differences between Creo and Kodak is
profit margin. Summary financial statements for both Creo and Kodak are found in
Appendix A and B, respectively. In the 2004 fiscal year, Kodak reported a gross profit
margin of 29.4% while Creo enjoyed a 42.4% margin. However, despite this difference,
Kodak's net profit margin was 4.1 % compared to only 1.8% for Creo. Expenses were the
contributing factor for this difference. Table 1 compares operating expenses between the
two companies.
Table 1. Spending as a Percentage of Sales
Creo Kodak 2004 2003 2004 2003
Research and Development 13.3% 13.7% 6.3% 6.0% Sales and Marketing 17.7% 18.5% General and Administration 9.8% 11.0% Total Selling, General and Administrative 27.6% 29.5% 18.5Oh 20.3%
Data Source: Creo and Kodak Annual Reports
Following the acquisition, it is expected that consolidation should reduce some of
Creo's sales and administrative expenses. As a percentage of revenue, Creo spends more
than twice as much as Kodak on research and development (1 3.3% to 6.3% in 2004).
However, it should be noted that the two companies have adopted different rules
regarding what they classify as R&D, as opposed to operating expenses. In absolute
terms, Kodak spent $854M compared to Creo's net R&D spending of $84SM. In its

2004 annual report, Creo indicated that it aimed to reduce its percentage R&D expense to
9% of total sales (Creo, 2005, p. 4). Reducing expenses associated with development of
the consumable plate business is projected to help realize this goal. However, it also
highlights the need for greater productivity in association with R&D resources and new
product development.
The impact of the acquisition on Creo's stated objectives will be mixed. Earnings
growth should be helped by the synergies between Creo's and Kodak's product offerings
and greater economies of scale. Targeted growth should also be unhindered under Kodak
ownership, especially given Kodak's stated objective to honour Creo's existing OEM and
strategic alliances. Expansion of the digital plate business has been significantly altered
following the acquisition since this segment represented the area of greatest overlap
between the two companies.
Kodak's acquisition of Creo satisfied the immediate needs of both companies.
Creo represents a great fit into Kodak's digital mandate and creates a true leader in digital
pre-press technology. Product development plays a critical role in maintaining this
leadership position and fuelling earnings growth. Additionally, this transition period
provides an opportunity to reconcile best practices and implement change.
2.4 Industry Analysis - Graphic Arts (printing)
A 2002 report prepared for Trendwatch Graphic Arts estimated that in 2001 the
global printing industry was a $409 billion business. Commercial printing represents the
largest segment of this industry and the largest purchasers of prepress capital equipment.
In the United States, commercial and retail printing was a $90.6 billion industry in 2003

(Euromonitor, 2004). Although the United States represents the largest single printing
market, Creo's sales growth in Europe, the Middle East and Africa (EMEA) has been
strong and revenue in EMEA has exceeded the Americas in the last two fiscal years
(Creo, 2005, p. 24). The printing industry is dominated by small and medium sized
businesses. In the US, the five largest companies account for only 25.2% of total market
value (Euromonitor, 2004). The industry is very competitive with small margins.
Consequently, cost, quality and speed are critical parameters. Innovation and new
product development are key for Creo to be able to provide a sustainable competitive
advantage to its customers.
Thermal CTP technology was one such innovation which Creo used to deliver
value to its customers. Although there has been considerable growth in CTP installations
over the past decade, the majority of the printing industry still uses traditional analogue
imaging techniques. According to the August 2003 Vantage Strategic Marketing study,
"Developing Market Opportunities For 'Direct-To' Technologies 2003-2008", only 35%
of worldwide plate consumption was digitally imaged in the year 2003. This is projected
to rise to 58% in 2008. Even in North America, the most digitally progressive market,
CTP devices were used to produce about 60% of plates in 2003, and are projected to rise
to 82% in 2008. At the end of 2004, industry sources estimated that approximately
22,500 CTP units were installed worldwide over 65 times more than in 1995 (Creo AIF.
2005, p. 5).
Growth in the digital plate market is complementing and exceeding that of CTP
systems. According to industry sources, digital plate consumption is expected to increase
from roughly 162 million metres2 (1.75 billion ft2) in 2003 to about 322 million metres2

(3.46 billion ft2) in 2008. That represents a compound annual growth rate for digital
plates of approximately 15%. The digital plate business is a large and fast growing part
of the graphic arts market. Industry sources estimate that total digital plate sales in 2004
were $1.9 billion of a total plate market of approximately $4.0 billion (Creo AIF, 2005, p.
5). Despite these strong growth projections, Kodak has indicated that the digital plate
business will not be part of Creo's core growth strategy; hence, the importance of a lean
new product development system within Creo's core capabilities.
Although Creo maintains a dominant market share in the CTP segment, both Creo
and Kodak face heavy competition from Agfa and Fuji in the emerging visible
lightlphoto-polymer plate market. This rival technology again highlights the need for a
lean product development process and shortened development cycles.

3 A REVIEW OF BEST PRACTICES IN MANUFACTURING AND OPERATIONS
A solid understanding of manufacturing and operational best practices is
necessary before attempting to apply these principles to the product development process.
This section examines several particular methodologies including Lean Manufacturing
systems and Six Sigma. Given the objectives of this report, specific relevance to Creo
and Kodak will be noted.
3.1 The Kodak Operating System
Kodak has a well-defined corporate philosophy which seeks to increase
productivity and profitability through the elimination of waste and the use of a number of
best practices. This methodology is known as the Kodak Operating System (KOS). It
began in 1999 as a manufacturing based improvement effort utilizing the principles of
Lean Manufacturing. KOS is now being applied beyond manufacturing into areas such
as Legal, Purchasing, Finance, R&D, Sales and Marketing. According to Kodak's Chief
Administrative Officer and KOS creator, Charles Brown, "eventually all areas within
Kodak and its subsidiaries will operate using KOS" (Brown, 2005).
The KOS mandate to eliminate waste incorporates three key areas: the customer,
the process, and the worker. In order to deliver value to the company, KOS must
enhance customer loyalty and satisfaction. Processes must be optimized to eliminate
waste, provide superior quality and provide value to the customer. Finally, employees

must be motivated to continuously problem-solve, embrace the KOS philosophy and
deliver team-based results. These activities "enhance customer service, at the lowest
possible cost, by eliminating activities that don't add value. It involves every person, job
and place in the company" (Brown, 2005). The basic KOS philosophy is to do more
with less. This includes world class customer service, improved quality, higher material
velocity and an improved working environment. All of this is accomplished with less
equipment, space, human effort, inventory and time.
KOS has delivered impressive results at Kodak (Brown, 2005). Manufacturing
inventory reductions of 25% to 80% have been achieved. Product changeover times have
been reduced by 50% to 90%. Individual kaizen projects have generated $300k to $ l M
in annual savings. Specifically, application of KOS at Kodak's Colorado Finishing
facility, servicing the Health Imaging sector, has resulted in an 80% reduction in cycle
time coupled with an 80% reduction in WIP. The collection of kaizen events at this
facility has resulted in annual cost reductions of $7-8 million.
3.2 Lean Manufacturing Principles
The term Lean Manufacturing (LM) was actually coined at MIT in the mid 80's
as part of the International Motor Vehicle Program (IMVP): an investigation of
international manufacturing practices in the automotive industry. IMVP researcher, John
Krafcik, noted that many operational practices of the Toyota Motor Corporation were
"very lean". Although LM has only recently captured the attention of many western
organizations, its foundations of quality and efficiency date back over a half century to
the works of Edwards Deming and Walter Shewhart.
LM presents a different way of looking at one of the fundamental business
equations (Shingo, 198 1, p. 109):
Cost + Profit = Price
Using traditional thinking, one would determine a product's selling price based on
production costs plus a given profit margin. This cost plus model does not provide
incentives for operational efficiencies and quickly breaks down in highly competitive
environments with downward price pressures. The alternative point of view can be
expressed as:
Price (fixed) - Cost = Profit
This model clearly relates cost reduction to increased profits. Hence. there is a
strong incentive to reduce operational costs and embrace the Lean credo "doing more,
with less". However, one must not equate lean with just cost reduction (Hines, 2004. p.
995). Enhancing customer value is equally important to LM.
The financial impact LM is impressive. The Toyota Motor Corporation, through
judicious application of LM principles known as the Toyota Production System, has
ascended to become one of the world's pre-eminent automobile manufacturers. Table 2
shows a comparison of financial performance (net profit margin) for Toyota and other
automobile manufacturers. This data reflects both the last fiscal year and five year
averages. In both categories, Toyota has demonstrated far superior performance as
compared to its North American-based competition. Even when compared to fellow
Japanese automaker Honda, Toyota delivers better results. As a result of this success,
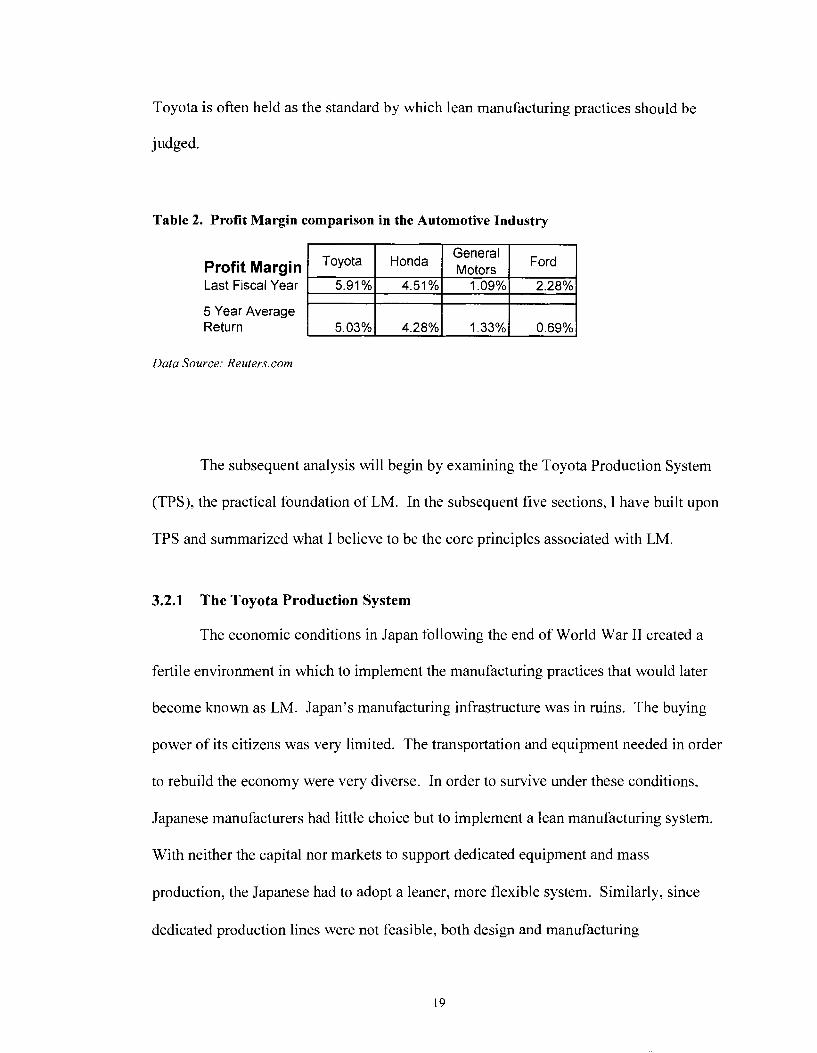
Toyota is often held as the standard by which lean manufacturing practices should be
judged.
Table 2. Profit Margin comparison in the Automotive Industry
Data Source: Reuters. corn
5 Year Average Return
The subsequent analysis will begin by examining the Toyota Production System
(TPS), the practical foundation of LM. In the subsequent five sections, I have built upon
TPS and summarized what I believe to be the core principles associated with LM.
3.2.1 The Toyota Production System
The economic conditions in Japan following the end of World War I1 created a
fertile environment in which to implement the manufacturing practices that would later
become known as LM. Japan's manufacturing infrastructure was in ruins. The buying
power of its citizens was very limited. The transportation and equipment needed in order
to rebuild the economy were very diverse. In order to survive under these conditions,
Japanese manufacturers had little choice but to implement a lean manufacturing system.
With neither the capital nor markets to support dedicated equipment and mass
production, the Japanese had to adopt a leaner, more flexible system. Similarly, since
dedicated production lines were not feasible, both design and manufacturing
5.03% 4.28% 1.33% 0.69%
implemented novel ideas such as common parts across several product lines, production
line capable of quick change-overs and smaller production batches.
Under the guidance of Eiji Toyoda, TPS was implemented and refined by Shigeo
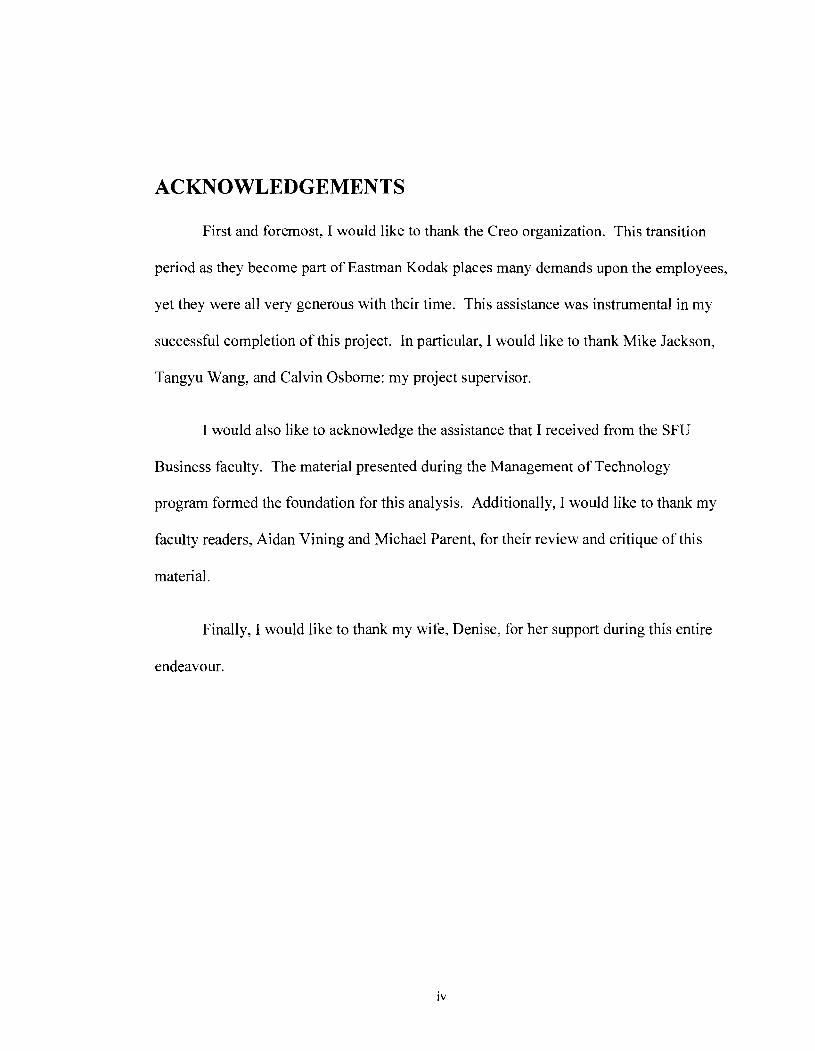
Shingo and Taiichi Ohno. A conceptual understanding of TPS can best be obtained by
considering what is known as the House of Lean Production (Dennis, 2002, p. 19).
Figure 2 illustrates that Standardization and Stability form the foundation of TPS while
Customer Focus serves as its apex. A company's core objective should be to provide the
highest quality product, at the lowest cost. in the shortest amount of time. This is done by
eliminating waste and implementing process cost reductions (Shingo, 1981, p. 145).

Figure 2. The Toyota Production System- House of Lcan Production
Goal: Customer Focus
I Highest quality, lowest cost, shortest lead time through shortening the I production flow by eliminating waste
c- . , ~~
I I -1 I Involvement I "Flexible, motivated
Continuous Flow Pull System Heijunka Takt time Kanban Visual Order (5s) Robust Process Involvement
Standardized Work Visual Order (5s) TPM Kaizen Circles - Suggestions Safety Activities
Heijunka, 5s Operational Stability Standardized Work Kanban Total Productive Maintenance
Source: urrrhor /wsec/ on Dennis. 2002
TPS relies on three principles: Just-in-time (SIT). Jidoka and Involvement. JIT is
a rather poor translation of the original Japanese phase which is more suitable defined as
"timely or well-timed" (Shingo, 1981. p. 98). Timely management of inventories and
production levels helps eliminate waste. Jidoka focuses on quality and loosely translates
as "automation with a human 111ind" (Dennis. 2002, p. 89). It also encompasses the final
TPS principle of involvement. If workers feel son~etl~ing is wrong, they are empowered
to act. As these factors also have a prominent role in LM, a more thorough discussion
will be provided in the subsequent sections.
The adaptation of LM beyond the high volume, repetitive environment of
automobile assembly requires careful analysis. Implementation of LM without an
understanding of the processes and the organization can be disastrous. Such scenarios
can often result when consultants or lean experts are mandated to make lean happen and
neglect the central "involvement" pillar in their attempt. Another common criticism of
LM is that it fails to cope with variability and has a limited role beyond high-volume
manufacturing (Hines, 2004, p. 998). One should keep these limitations in mind when
learning about LM and contemplating implementing it.
3.2.2 Elimination of Waste
Focusing on waste, or muda in Japanese, is a key aspect of LM. Any activity that
does not provide value to the customer is inherently defined as waste. Since, in a typical
operation, a remarkably small percentage of time actually contributes value to the
product, there is a tremendous opportunity for waste reduction. Some estimates place the
ratio of value to waste at 5/95. The original TPS defines seven types of waste (Shingo,
198 1, p. 287). However, more recent thinking includes the misappropriation of
knowledge or resources as an eight and even ninth waste.' Table 3 identifies and defines
the eight wastes.
At Kodak, within KOS, the acronym TIMWOOD is used as an aid in
remembering the seven types of wastes. Interestingly, these seven wastes are either
physical or quantifiable; whereas, the eighth waste (knowledge disconnection) is more
abstract. As noted previously, there is a huge opportunity for productivity gains within
these more easily identifiable categories. The eighth waste is much more subtle, but can
' Knowledge Disconnection can be listed as Untapped Resources and Misused Resources (McCarthy,2005)
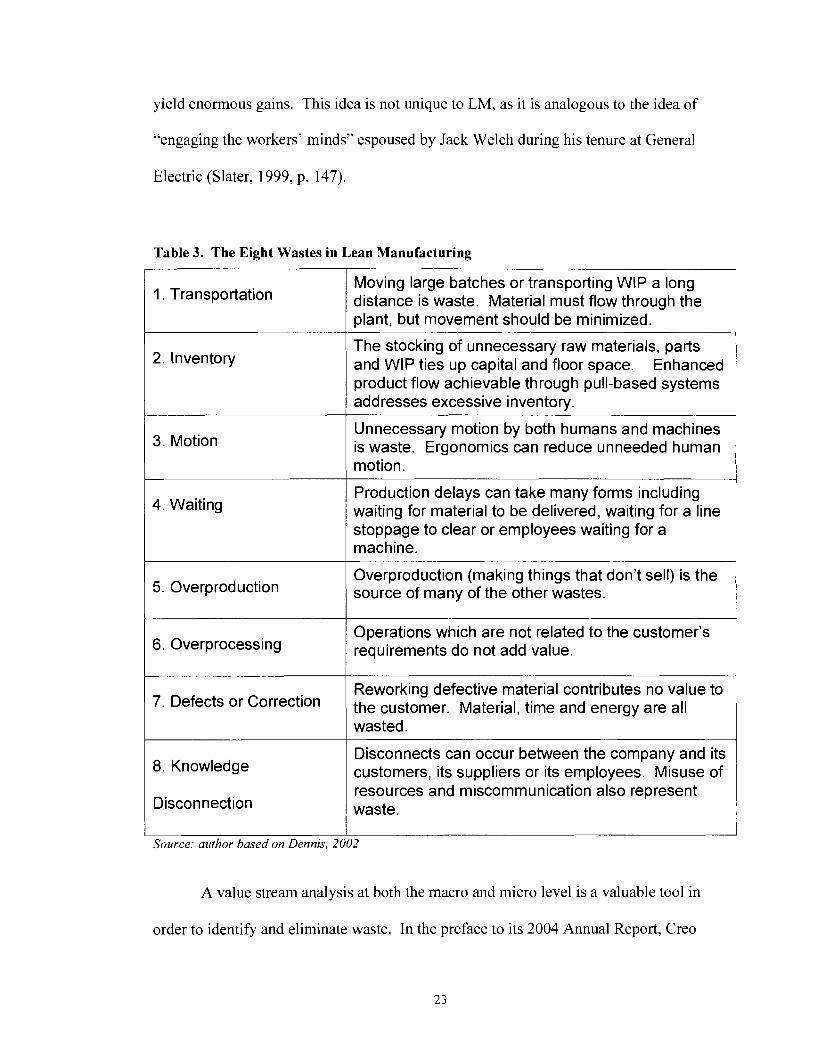
yield enormous gains. This idea is not unique to LM, as it is analogous to the idea of
"engaging the workers' minds" espoused by Jack Welch during his tenure at General
Electric (Slater, 1999, p. 147).
Table 3. The Eight Wastes in Lean Manufacturing
1. Transportation Moving large batches or transporting WIP a long distance is waste. Material must flow through the plant, but movement should be minimized.
2. Inventory The stocking of unnecessary raw materials, parts and WIP ties up capital and floor space. Enhanced product flow achievable through pull-based systems addresses excessive inventory.
3. Motion Unnecessary motion by both humans and machines is waste. Ergonomics can reduce unneeded human motion.
4. Waiting Production delays can take many forms including waiting for material to be delivered, waiting for a line stoppage to clear or employees waiting for a machine.
5. Overproduction Overproduction (making things that don't sell) is the source of many of the other wastes.
6. Overprocessing Operations which are not related to the customer's requirements do not add value.
8. Knowledge
Disconnection
7. Defects Or
Disconnects can occur between the company and its customers, its suppliers or its employees. Misuse of resources and miscommunication also represent waste.
Reworking defective material contributes no value to the customer. Material, time and energy are all wasted.
Source: author based on Dennis, 2002
A value stream analysis at both the macro and micro level is a valuable tool in
order to identify and eliminate waste. In the preface to its 2004 Annual Report, Creo

outlines a preliminary macro level value stream map for the printing process.
Interestingly, such analysis in the early 90's would have identified the wastefulness of the
intermediate imaging to film step and highlighted the opportunity for computer to plate.
A much more detailed analysis of an individual process step provides specific
opportunities for improvement. Value stream mapping can be a very rigorous process
with particular symbols used to identify processes, flows and opportunities; however, it
can also be adapted to individual situations. The main benefit of this tool is to create a
focus on improving the process.
3.2.3 Process Flow
Efficient process flow minimizes waste. The Just-in-Time (JIT) processing
methodology helps achieve this goal by delivering just what is needed, when it is needed.
The JIT philosophy follows a few simple rules (Dennis, 2002, p. 66).
k Don't produce something unless the customer has ordered it.
P Level demand so that work may proceed smoothly throughout the plant.
> Link all processes to customer demand through simple visual tools.
> Maximize the flexibility of people and machinery.
These ideas support the concept of "pulling" materials through the system rather
than the traditional philosophy of "pushing" material through the factory. "Pull" systems
are demand based rather than forecast driven. Such a system relies on the efficient flow
of material through the factory rather than large inventory levels. Two supporting
components of this system are levelled production or heijunka and a visual

synchronization known as kanhan. However, it is important to understand the dynamics
of the business and the order process. Pulling is not a replacement for planning.
Although LM may be at philosophical odds with forecast based planning, LM and ERP
(Enterprise Resource Planning) can, and do, coexist within an organization
(Bartholomew, 1999). Toyota still depends on a forecast plan in order to schedule its
annual production (Hines, 2004, p. 998). However, with its LM system it is able to
quickly adjust those forecasts based on pull signals from the dealerships.
3.2.4 Quality
Since defective products fails to provide any value to the customer, quality is one
of the main principles governing LM. The purpose of this objective is to drive the defect
rate to zero (Shingo, 198 1, p. 329). The jidoka concept, or automation with the human
touch, was advanced by Shigeo Shingo. It relies on reducing defects by improving
process capability, identifying defects and quickly rectifying the situation through a quick
feedback system. Prevention offers one of the easiest options to reduce errors. The
concept ofpoka-yoke or error-proofing is a simple, low-cost technique for preventing or
detecting error situations before they occur. In general, poka-yokes are designed for the
workplace, have high reliability, and provide immediate feedback with low maintenance
(Dennis, 2002, p. 92).
Manufacturing high quality products requires reliable equipment in addition to a
focused workforce. Total Productive Maintenance (TPM) moves ?he organization away
from the reactionary process of repairing broken down equipment into a preventive and
predictive mindset. While equipment downtime can be a major source of waste,
inefficient and defect-producing machines are even more sinister. A TPM system
enhances the stability foundation necessary in Lean Manufacturing.
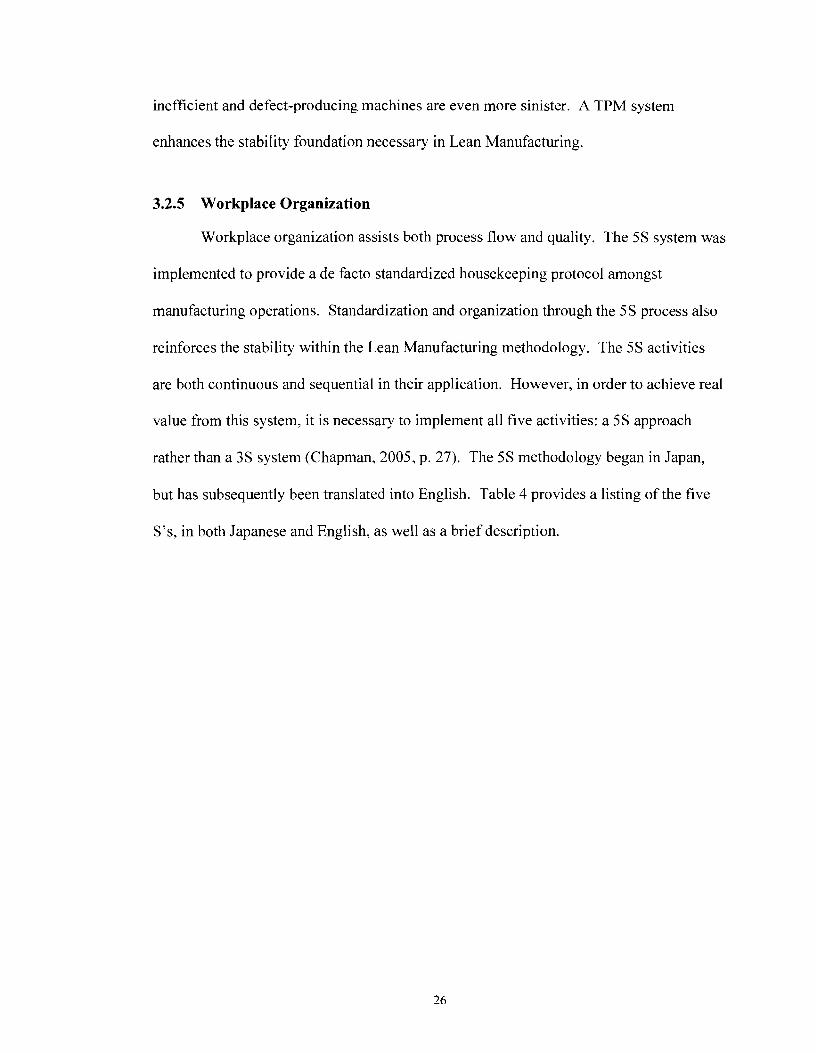
3.2.5 Workplace Organization
Workplace organization assists both process flow and quality. The 5 s system was
implemented to provide a de facto standardized housekeeping protocol amongst
manufacturing operations. Standardization and organization through the 5 s process also
reinforces the stability within the Lean Manufacturing methodology. The 5 s activities
are both continuous and sequential in their application. However, in order to achieve real
value from this system, it is necessary to implement all five activities: a 5 s approach
rather than a 3 s system (Chapman, 2005, p. 27). The 5 s methodology began in Japan,
but has subsequently been translated into English. Table 4 provides a listing of the five
S's, in both Japanese and English, as well as a brief description.
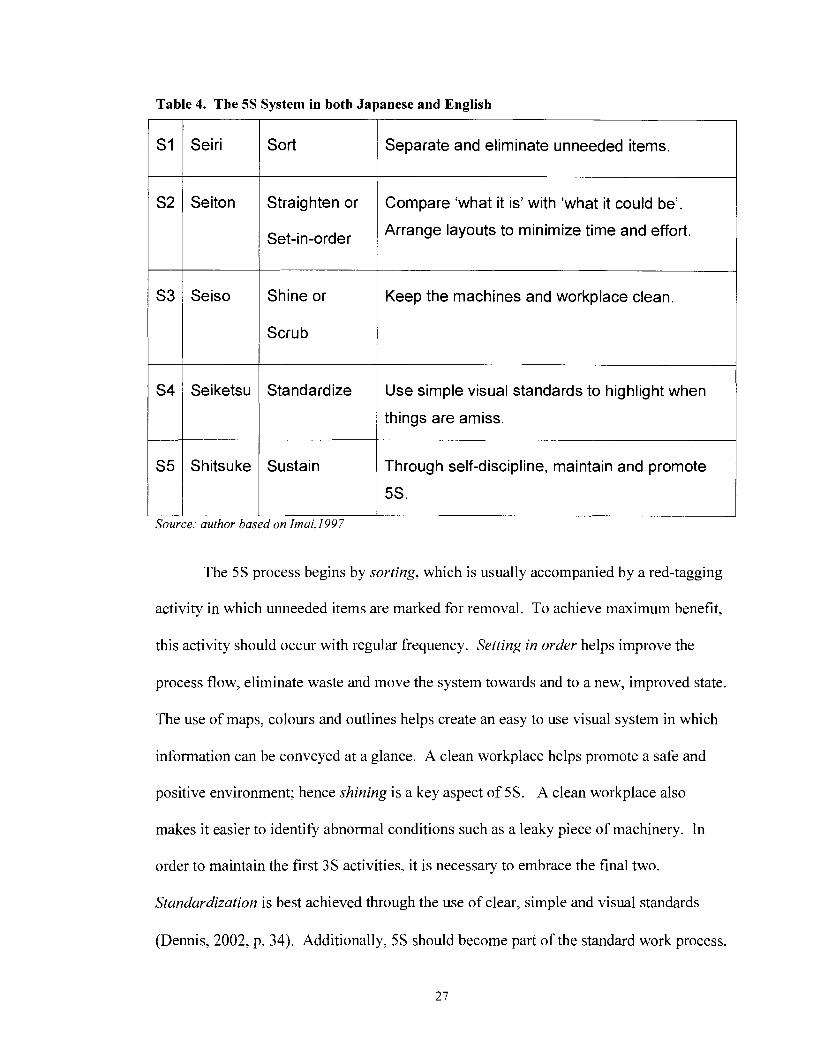
Table 4. The 5 s System in both Japanese and English
Seiri
Seiton
Seiso
Seiketsu
Shitsu ke
Sort
Straighten or
Set-in-order
Shine or
Scrub
Standardize
Sustain
I I
Source: author based on Imai, 1997
Separate and eliminate unneeded items.
Compare 'what it is' with 'what it could be'.
Arrange layouts to minimize time and effort.
Keep the machines and workplace clean.
Use simple visual standards to highlight when
things are amiss.
Through self-discipline, maintain and promote
5s.
The 5s process begins by sorting, which is usually accompanied by a red-tagging
activity in which unneeded items are marked for removal. To achieve maximum benefit,
this activity should occur with regular frequency. Setting in order helps improve the
process flow, eliminate waste and move the system towards and to a new, improved state.
The use of maps, colours and outlines helps create an easy to use visual system in which
information can be conveyed at a glance. A clean workplace helps promote a safe and
positive environment; hence shining is a key aspect of 5s. A clean workplace also
makes it easier to identify abnormal conditions such as a leaky piece of machinery. In
order to maintain the first 3s activities, it is necessary to embrace the final two.
Standardization is best achieved through the use of clear. simple and visual standards
(Dennis, 2002, p. 34). Additionally, 5s should become part of the standard work process.

This ties into the sustain aspect of 5S, which must be rooted within the corporate culture.
Just as involvement is key to Lean, it is also critical to 5s. Promotion, communication
and training are all activities that should be encouraged amongst team members in order
to accomplish this goal.
3.2.6 Standardization
A number of the previously described activities support the idea of standardizing
the manufacturing process. The idea of standardization goes back to Henry Ford and the
creation of the assembly line. In fact, in the early days of the westernization of LM, The
Economist identified several lean principles that can be attributed to Ford (anonymous,
1992, S5). However, Ford's concept of mass production represents a significant
divergence in the two philosophies. Process layout and product standardization can have
a significant impact on the overall efficiency of the organization. It is important to
optimize overall efficiency rather than individual efficiency. This "big picture" view
should be maintained throughout most Lean activities.
3.3 The Six Sigma Methodology
Although Motorola pioneered the Six Sigma initiative in the mid SO'S, Kodak was
an earlier adopter of this methodology. Lean and Six Sigma can harmoniously coexist
within an organization. Since 1992 Kodak has been an active participant in Six Sigma
and a charter member of the Motorola Six Sigma Consortium. Six Sigma is a quality-
focused approach with the objective of 'total customer satisfaction' through the reduction
of process variation. By strict definition, a six sigma process is one with a defect rate of
3.4 parts per million. However, Six Sigma as a methodology can be used to improve
process results by reducing variation. At Kodak, two main Six Sigma titles are used:
Black Belts and Champions. Black Belts are expert Six Sigma practitioners who have
completed extensive training and a major applied project. Champions are business
leaders who support the initiative and identify projects. In other organizations,
individuals who have received training in core Six Sigma principles and have completed
an applied project are given the title Green Belt. The following sub-sections examine
two key concepts associated with Six Sigma.
3.3.1 Tenet 1 - The Voice of the Customer
The customer focus associated with the Six Sigma methodology is highlighted by
the Voice of the Customer (VOC) principle. Process teams are reminded to understand
the needs and wants of their customers, be it internal or external. As simplistic as it may
sound, one of the most basic steps in process improvement is identifying customers and
their needs. This is often ignored in many manufacturing environments and can be
completely missed or overlooked in research and development labs. Once customer
needs are established, it is necessary to identify the most important attributes and
determine critical-to-quality (ctq) characteristics. Establishing specifications that define
customer expectations with respect to ctq's provides clearly identified goals for both
product and process improvement. The procedure by which to achieve these goals is
discussed in the following section.
3.3.2 Tenet 2 - The DMAIC Principle of Process Improvement
The DMAIC principle is a core tenet of Six Sigma. It can serve as a foundation of
the organization's quality program and the n~ethodology by which one can realize process
improvements. DMAIC is an acronym defining the steps by which one should
implement a quality-based process change: Defne, Measure, Analyze, Improve and
Control. One must begin by defining the problem and the desired outcome. This can be
applied at a rather high level to identify quality goals within the organization or much
more focused at the process level. Rather than immediately moving into the
improvement phase, one must have the diligence to both measure the associated variables
and carefully analyze the problem. A number of analysis tools are available within a Six
Sigma practitioner's toolbox, with templates and discussions available on the internet
(iSixSigma Quality Tools and Templates, 2005). With the appropriate data and analysis,
an improvement plan can be put into place. This must be followed up with continued
observation and control loops which create both an iterative process and a means to
monitor effective implementation of a successful process.

4 A REVIEW OF BEST PRACTICES IN NEW PRODUCT DEVELOPMENT
The importance of solid new product development to the sustainable long-term
success of the organization has been known for quite some time. In addition to lean-
based product development methodologies, a myriad of strategies exist with no one
practice identified as the clear choice. As with most sources of competitive advantage, a
successful strategy must be tailored to company resources and industry factors. Several
new product development schemes will be reviewed in this section. Notice that both the
Toyota Product Development System and the Design for Six Sigma methodologies are
extensions of the corresponding manufacturing practices. Taguchi methods can be
applied to both product development and manufacturing, whereas Stage-Gate serves as
both a methodology and a roadmap for the product development process.
4.1 TPDS: The Toyota Product Development System
The Toyota Production System (TPS) has been acknowledged as a source of
Toyota's competitive advantage; however, it is not the only reason for the company's
success. The Toyota Product Development System (TPDS) is perhaps an even greater
asset to the company (Sobek et al, 1998, p. 38). Researchers in the Japan Technology
Management Program at the University of Michigan spent over five years investigating
the product development practices at Toyota. The results of this study provide the most
thorough analysis of TPDS to date and form the foundation for this section. The Harvard
Business Review article by Sobek, Liker and Ward is the source for much of the material
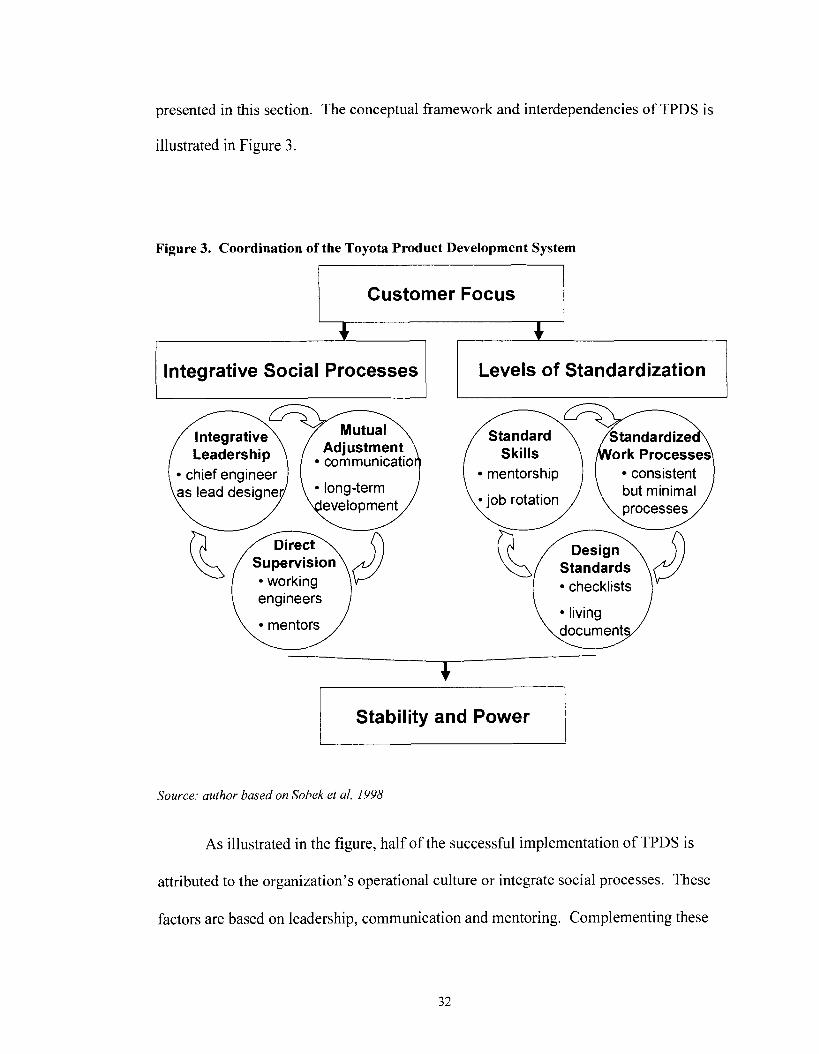
presented in this section. The conceptual framework and interdependencies of TPDS is
illustrated in Figure 3.
Figure 3. Coordination of the Toyota Product Development System
/ Customer Focus
/ lntegrative Social Processes
n- Integrative
/ Leadership \ chief engineer
Supervision
engineers
mentors u
Levels of Standardization
( mfn!!zhip 1 consistent but minimal processes
checklists
documents w Stability and Power
Source: author based on Sobek et al, 1998
As illustrated in the figure, half of the successful implementation of TPDS is
attributed to the organization's operational culture or integrate social processes. These
factors are based on leadership, communication and mentoring. Complementing these

social factors are standards-based protocols including skills, processes and design.
Although it must be acknowledged that it is the integration and coordination of these
factors which ultimately produces success, it is beneficial to examine each component
individually. This examination will begin with the cultural factors.
As in any organization, leadership has a tremendous influence on success. In
TPDS, the Chief Engineer has full responsibility for the particular project, but does not
have direct power over any one functional group. This is certainly not a new or
revolutionary concept as analysis of the automotive design process in the early 90's
identified the "heavy weight project manager'' as a key component in successful
organizations (Clark and Fujimoto, 1990, p. 114). However, a Chief Engineer assumes a
greater role as the project's lead designer. This organizational structure allows team
members from different functional groups to represent differing perspectives. Creative
conflict, if managed properly, can generate superior designs. The Chief Engineer must
recognize these localized issues while still seeing the complete picture, designing for
manufacturability and maintaining a customer focus.
Communication is a key success factor in any group dynamic. TPDS recognizes
the importance of face to face communication, but also does not downplay the role of
effective written communication. These options should be used in a complementary and
efficient manner. Meetings must be focused and participants must be prepared in
advance. Regularly scheduled meetings are discouraged. Instead, written
communication serves as the first step in problem solving. Standard forms, named A3's
after the paper size (roughly 1 1" by 17")' are used to encourage short and concise reports.
Standardization, a core principle of Lean, also enables report readers to quickly assess the
information.
Mentoring helps to disseminate knowledge through the organization and forces
those in supervisory roles to remain in touch with their technical expertise. Supervisors
and higher level managers are deeply involved in the engineering process. Functional
supervisors work closely with new hires and junior engineers. Although such a situation
runs counter to the notion of self empowerment, the TPDS relationship is closer to a
mentor-student relationship than that of boss-subordinate. The US norm of engineers
transitioning to managers and abandoning engineering work does not flourish in TPDS.
Specialized engineering skills are needed by all companies in order to bring new
products to market. Hence, training is an important aspect of an engineer's career
growth. Toyota places a heavy emphasis on internal training. An engineer's skills are
augmented by job rotations within his or her functional group. Unlike most North
American companies which provide broader job rotations, Toyota focuses on functional
excellence. However, at the senior level, engineers are given broad rotation which helps
create a big picture vision of the new product development process.
TPDS aims to standardize the process without creating an outdated and
unmanageable bureaucracy. Standards are consistent yet minimal. Toyota's vehicle
development process is highly consistent from model to model, with regular milestones.
Although the process has a high degree of standardization, the implementation is allowed
to vary based on individual project requirements. Flexibility, coupled with a common
understanding of the system and a desire for continuous improvement, enables the
process to work. Standards are kept simple and are maintained by the people who use
them. Development of the product and the process standards are considered to be
inseparable.
Like process standards, design standards are also considered living documents.
Outside of Toyota, design standards are often seen are being outdated or inhibiting to
innovation. However, TPDS maintains a thorough design checklist to serve a guide and
ensure manufacturability of the final product. Checklists also make it more likely that
components will meet expectations with respect to functionality. quality and reliability.
Since these lists are continually updated, they help facilitate continuous learning and
serve as a repository for engineering design knowledge.
TPDS is designed to operate as a multi-project strategy. This interdependency
creates a system in which best practices can be shared across projects and engineers gain
experience to differing products and teams. The success of TPDS is evidenced by
Toyota's product development times of 20 to 24 months from design to production.
Recently, Toyota announced that it intended to reduce this development time to just 12
months. This industry leading performance highlights the success of TPDS and provides
Toyota with a sustainable competitive advantage.
4.2 The Toyota Prius - An Application of TPDS
One of the historical criticisms of Japanese product development methodologies is
that they fail to foster true innovation. The nation's reputation is that of a fast-follower
rather than an innovative first mover (Teresko, 2004, p. 22). However, the Toyota Prius
not only breaks this stereotype, but also represents a departure from traditional product

development within TPDS. The Prius hybrid gas-electric vehicle represented
significantly more advanced product development process than that required for a model
redesign.
The concept model Prius was introduced at the Tokyo Motor Show on October
27, 1995 after being formally approved by corporate officials on June 30, 1995. In
December 1995, Toyota announced that its hybrid vehicle would be available for sale in
Japan in two years. Remarkably by North American standards, Toyota delivered on this
promise and shipped its first Prius on December 10, 1997 (Vasilash, 2003). The US
model was introduced in August 2000 after concerns about the car's ability to perform in
variable climates had been addressed. In 2004, Prius became the first ever hybrid to win
Motor Trend's Car of the Year award.
Prior to examining the product development process, it is enlightening to examine
Toyota's rationale for embarking on this endeavour. Toyota's corporate philosophy
includes environmental responsibility throughout the organization. In January 1992,
Toyota introduced its "Earth Charter" which created an environmental directive for the
company. This mandate is realized through the development of low emission vehicles
and environmentally sustainable manufacturing practices. All of Toyota's North
American facilities have received IS0 14001 Certification for superior Environmental
Management Systems. Higher gasoline prices, especially in Japan, coupled with
government mandates on emission standards created a market opportunity. Furthermore,
through market research Toyota established that consumers were willing to pay an
additional $5,000 to purchase an environmentally friendly car over a similar gas

alternative (Business Week, 2000). This clearly defined market need provides the
context for Toyota's development process.
The Prius was build upon a variety of fundamental research and development,
dating back to the mid 70s (Dawson, 2005, p. 20). Toyota's hybrid initiative can be
traced back to earlier work on electric vehicles. These vehicles were plagued by
prohibitively short battery lifetimes, but the experience provided Toyota engineers with a
core competency in power management and circuitry. This technology, now known as
Hybrid Synergy Drive, is the basis for the Prius and all of Toyota's future hybrid
vehicles. Hybrid development was just one of a collection of alternative energy, low
emission vehicle initiatives which included fuel cells, natural gas, direct injection diesel
technology and variable valve timing. This set of initiatives highlights the multiple
project approach of TPDS and created a sense of friendly competition within the
company.
The most notable TPDS principle which applies to the development of the Prius is
integrative leadership. Both Managing Director Hiroyuki Watanabe and Chief Engineer
Takehisa Yaegashi have over three decades of experience at Toyota. Additionally,
Toyota was able to draw upon its early work in alternative energy vehicles to create a
standardized skill-set. It also chose to keep the entire development project in-house, as it
was deemed to be in Toyota's long-term best interest to do so. At first glance, the Prius
appears to depart from the TPDS principle of standardization. Unlike many Toyota
vehicles, the Prius does not share any major components with other product lines. In fact,
when the first Prius was launched in Japan, it included more than 300 patents. The
second-generation vehicle has 370 patents (Vasilash, 2003). However, despite the
considerable amount of innovation, the Prius was designed to utilize the Camry assembly
line. Standardization and leveraging of the existing manufacturing process chopped
significant time off the product development cycle.
4.3 DFSS: Design for Six Sigma
A fundamental shortcoming of the Six Sigma methodology is that it is designed to
improve flawed processes rather than developing superior processes from the start. Six
Sigma is reactionary rather than proactive. In the words of Six Sigma expert Subir
Chowdhury, "Six Sigma can only take a company so far. To reach the next level,
companies need to Design for Six Sigma" (Chowdhury, 2003, 12). While Six Sigma
focuses on improving existing designs, DFSS concentrates on creating new and better
ones. Quite simply, DFSS is about getting it right the first time.
DFSS expands upon a number of Six Sigma principles and can be implemented
within an existing Six Sigma organization or adopted as a stand-alone product
development methodology (Ferryanto, 2005, 24). As with Six Sigma, focusing on the
customer, identifying needs and expectations are critical components of DFSS. The
DMAIC methodology is replaced by a design focused approach. A number of
customized acronyms are used by a variety of organizations. Some of the more common
of these include DMADV (Define, Measure, Analyze, Design, Verify), DCCDI (Define,
Customer, Concept, Design, Implement), IDOV (Identify, Design, Optimize, Validate)
and DMEDI (Define, Measure, Explore, Develop, Implement).

Given the similar nature of these DFSS approaches, it is only necessary to look at
one of these in more detail: DMADV, which has a number of parallels with DMAIC
(Simon, 2004).
Define the project goals and customer (internal and external) requirements.
Measure and determine customer needs and specifications; benchmark
competitors and industry.
Analyze the process options to meet the customer needs.
Design (detailed) the process to meet the customer needs.
Verify the design performance and ability to meet customer needs.
General Electric uses a modified DMADV approach called DMADOV, which includes
an Optimize step. These general philosophies are supported with the use of standard
design tools such as Failure Modes and Effects Analysis (FMEA), Design of
Experiments, and error-proofing among others.
Implementation of DFSS requires a company-wide commitment. A number of
subject matter experts are needed, while others within the organization must be
familiarized with the concepts. Formal DFSS certification typically requires an intensive
two to four week technical training program (Ferryanto, 2005, p. 26). Several DFSS
pitfalls can arise. Some of the most severe include a lack of focus or a refocus on cost-
savings and the politicization of the process. A successful DFSS implementation requires
a long-term vision and a commitment to address customer needs through robust design
and process optimization. Such steps encourage continuous improvement in all stages of
the product development process.

3M, a company known for its innovation, has adopted DFSS as part of its organic
growth strategy and 2 x 1 3 ~ initiative. The 2 x 1 3 ~ process is designed to double the number
of new ideas in the commercialization channel and triple the market impact of the
resulting new products. To successfully realize such an aggressive goal, a rigorous and
systematic framework such as DFSS was needed. At 3M, DFSS is used in conjunction
with their stage-gate system. As ideas progress through early gates, a series of tough,
DFSS-focused questions are asked. This strategy helps keep projects on track and
terminate those that will fail to meet objectives.
4.4 Taguchi Methods
Taguchi Methods, developed by Japanese engineer Genichi Taguchi, are a
strategy for quality engineering which focuses on design and the elimination of variation
in the manufacturing process. In the words of Taguchi, "Quality is a virtue of design."
An inherent lack of robustness in product design is the primary driver of superfluous
manufacturing expenses (Taguchi and Clausing, 1990, p. 65). Taguchi7s ideas are based
on two fundamental tenets (Karbhari, 1994).
1. Quality should be measured by the deviation from a specified target value, rather
than by conformance to preset tolerance limits
2. Quality cannot be ensured through inspection and rework, but must be built in
through the appropriate design of the process and product
Three concepts develop from these principles: Quality Loss Functions, Off-line Quality
Control and Experimental Design.
Rather than accept the premise that the cost of poor quality was just equal to the
cost of scrap or rework, Taguchi adopted a much broader cost to society. He identifies

three generic situations: the larger the better, the smaller the better and on-target or
minimum variation. Next, he assigned Quality Loss Functions to each scenario. In the
first two cases, a monotonic loss function is assumed, while in the final case a squared
error loss function was created. In a manufacturing environment a specified target is the
most prevalent situation. Taguchi's loss function in this case is the same as the statistical
concept of total variance. Minimization of this variance is equivalent to the least squares
principle. In a manufacturing context, this approach stresses the importance of hitting a
specified target rather than just falling within specification limits. Elimination of
variation starts with the design process.
Off-line quality control is used to denote the design phase. This nomenclature - distinguishes the process from on-line quality control methods, such as statistical process
control (SPC), which are reactionary methods. The off-line quality control process has
three stages: system design, parameter design and tolerance design. System design is the
conceptual framework involving creativity and innovation. Parameter design involves
determining the appropriate process and product parameters. Understanding parameter
interaction, variation and their impact on performance are key components in robust
design. Reducing and controlling variation is an important aspect of tolerance design.
The Taguchi method of experimental design is the key tool which is used to determine
parameters and tolerances.
Taguchi's experimental design represents a variation on the traditional Design of
Experiments (DOE) approach. The primary difference between the two methods is in
how they handle the interactions between inputs. When you keep in mind that DOE was
invented by scientists for scientists, and Taguchi Methods were invented by engineers for
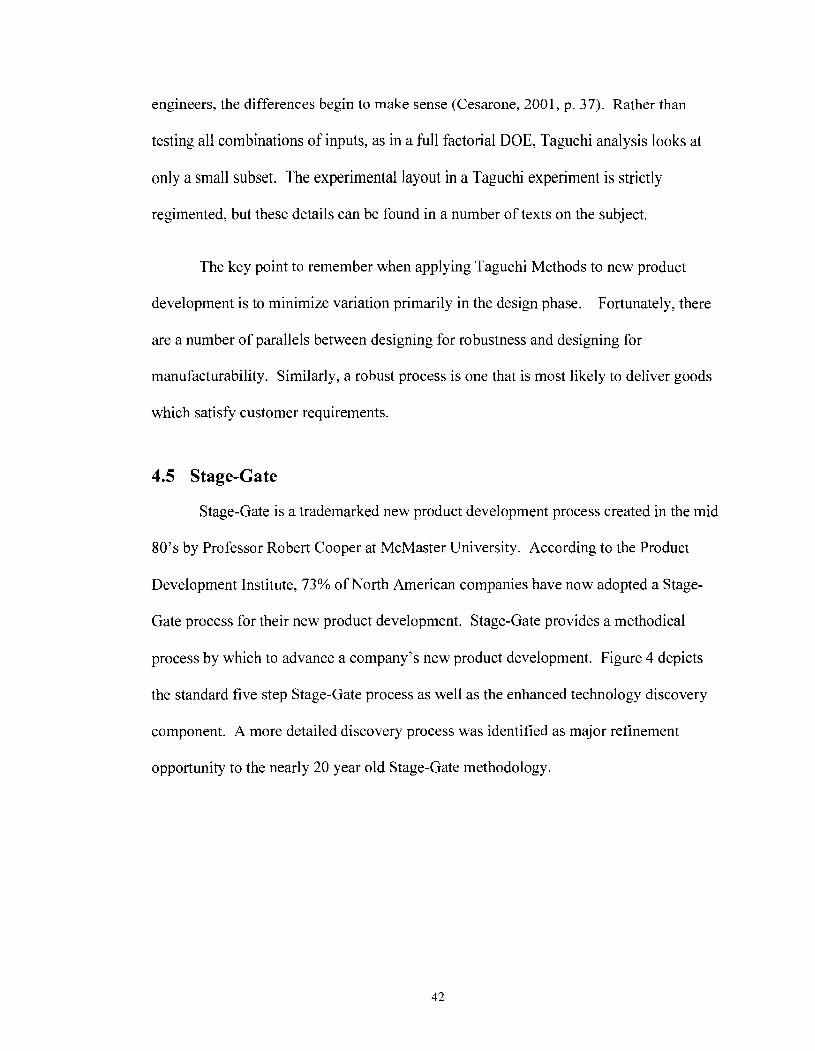
engineers, the differences begin to make sense (Cesarone, 2001, p. 37). Rather than
testing all combinations of inputs, as in a full factorial DOE, Taguchi analysis looks at
only a small subset. The experimental layout in a Taguchi experiment is strictly
regimented, but these details can be found in a number of texts on the subject.
The key point to remember when applying Taguchi Methods to new product
development is to minimize variation primarily in the design phase. Fortunately, there
are a number of parallels between designing for robustness and designing for
manufacturability. Similarly, a robust process is one that is most likely to deliver goods
which satisfy customer requirements.
4.5 Stage-Gate
Stage-Gate is a trademarked new product development process created in the mid
80's by Professor Robert Cooper at McMaster University. According to the Product
Development Institute, 73% of North American companies have now adopted a Stage-
Gate process for their new product development. Stage-Gate provides a methodical
process by which to advance a company's new product development. Figure 4 depicts
the standard five step Stage-Gate process as well as the enhanced technology discovery
component. A more detailed discovery process was identified as major refinement
opportunity to the nearly 20 year old Stage-Gate methodology.
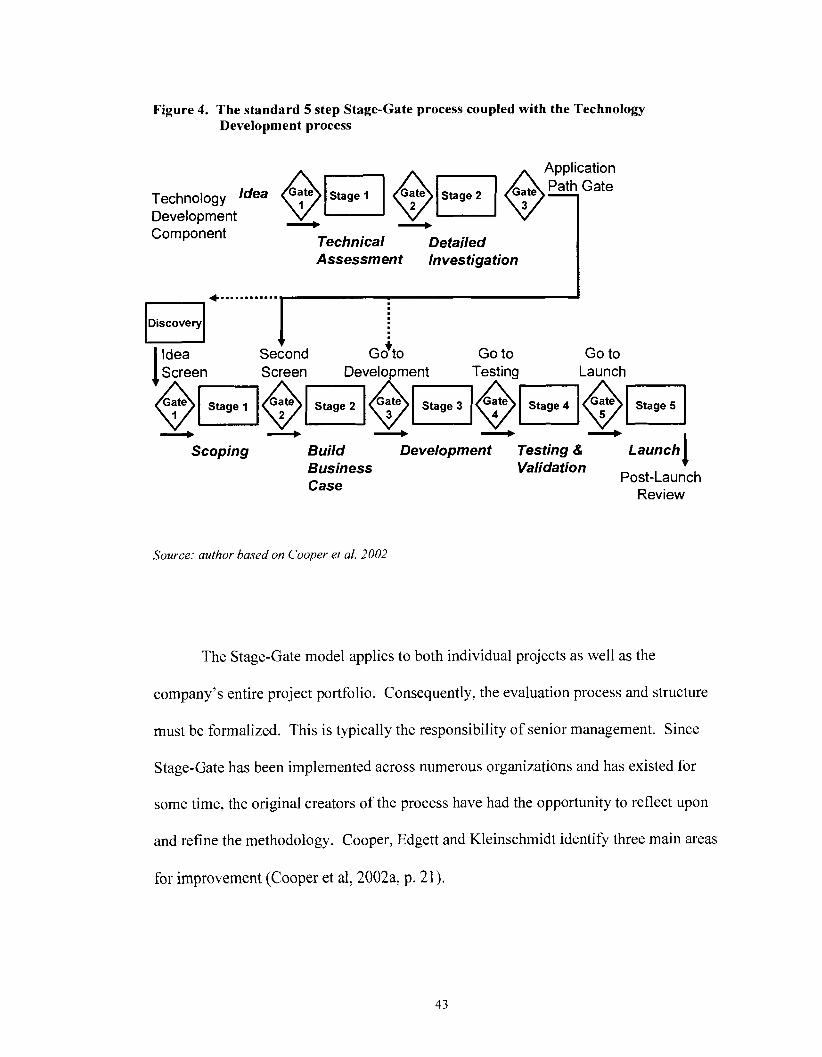
Figure 4. The standard 5 step Stage-Gate process coupled with the Technology Development process
Technology Idea 1 2
Development 4 P
Component Technical Detailed Assessment Investigation
+ . . . . . . . . . . . . . I
7 Discovery
r Second G&O Go to Go to
Screen !Idea Screen
Development Testing Launch
@ ~ @ ~ @ ~ @ ~ 1 @ ~ 1 II, d + 4 + I
Scoping Build Development Testing & Launch 1 -
Business Case
Validation t Post-Launch
Review
Source: author based on Cooper et al. 2002
The Stage-Gate model applies to both individual projects as well as the
company's entire project portfolio. Consequently, the evaluation process and structure
must be formalized. This is typically the responsibility of senior management. Since
Stage-Gate has been implemented across numerous organizations and has existed for
some time, the original creators of the process have had the opportunity to reflect upon
and refine the methodology. Cooper, Edgett and Kleinschrnidt identify three main areas
for improvement (Cooper et al, 2002a, p. 21).
1. Adding a Discovery stage at the front end of the process to generate
breakthrough product ideas.
2. Harnessing fundamental research more effectively.
3. Improving project selection and becoming more discriminating in the
projects undertaken- incorporating more effective gates.
Idea generation, the discovery phase, is critical to new product development.
Several refinements have been suggested to improve this process, including filtering all
ideas into a focal point or new product process manager. Idea generation is recognized as
originating from two primary sources: the customer and the entire organization.
Adopting a Voice of the Customer approach and working closely with lead customers can
lead to innovative new products. Companies such as Hewlett-Packard and Fluke use this
approach and have entitled it "camping out" with the customer. Harnessing the creative
potential of the entire organization can occur through both informal and formal routes.
An informal mechanism should be in place to encourage all employees to bring forward
ideas. Ideas that pass the initial screen should be paired with the appropriate resources
and a project champion to guide the concept through the subsequent stages. A formal
idea generation event can consist of a multi-day off-site conference with the intention of
identifying major revenue generating opportunities. The goal of this meeting is to
identify the major trends, shifts, changing customer needs and potential disruptions
taking place in the marketplace (Cooper et al, 2002a, p. 25).
Although in recent years numerous companies have been scaling back their
fundamental research, such activity can play an importance roll in idea generation and
ultimately product commercialization. The Stage-Gate process for Technology

Development, which is illustrated in the top half of Figure 4, attempts to address the
criticism that basic research is undirected, unfocused and unproductive. The gates in the
technical assessment and investigation phase are much more strategic in nature as
compared to the financial focus of the standard Stage-Gate process. Assessment includes
the degree of strategic fit, leverage, as well as the likelihood of technical and commercial
success. Once a project has cleared the final gate in the technology development phase, it
can enter the new product development Stage-Gate at any of the first three gates. Most
projects will typically enter at the second gate.
Within the standard Stage-Gate framework, it is necessary to implement effective
gates in order to properly assign scarce resources within the company. Most companies
have trouble killing projects or pruning the new-product portfolio (Cooper et al, 2002b, p.
43). The project gates must be used as real GoIKill decision points rather than merely
project review points. This is most applicable in large companies with large project
portfolios. Standardization of the evaluation process is key in creating fair, efficient and
effective decisions. A project evaluation scorecard should be created which contains
both "must meet" and "should meet" criteria. Suggested evaluation criteria include:
strategic, product advantage, market attractiveness, synergies, technical feasibility and
risk versus return (Cooper et al, 2002b, p. 46).
Adaptation of the Stage-Gate process to fit specific circumstances is common.
Most often this is based on project risk. One variation is the SCR Process which handles
Significant Customer Requests. In this case, the process is condensed into just two gates
(an initial screen and a decision based on the business case) and two stages (an analysis
of the business and a development and implementation phase). Another variant is the
Fast Track Project which is designed for lower-risk projects. In this three phase case,
stages one and two are combined as well as stages three and four.
Although Stage-Gate can provide the generic framework to guide a company's
product development strategy, one should customize the process to match the
organization's structure, resources and objectives. The incorporation of other product
development best practices can be included as part of the customization process.
Understanding the typical pitfalls of this methodology also helps a company utilize this
process more effectively.
5 ANALYSIS OF OPERATIONS AND ENGINEERING AT CREO
This investigation of applying lean principles to product development now moves
from a conceptual overview to the more specific tasks of application and implementation.
This section serves as the transition between general theory and specific application by
examining circumstances pertaining to Creo. The methodology used in this section is to
dig down from the external image, presented in annual reports and press releases, to the
internal realities of the organization obtained through internal documents, procedures and
interviews with employees.
5.1 Analysis of Operations
As noted earlier in section 2.1, Creo's operations focus on digital pre-press
systems including software, proofing, input and output systems. Creo also places a
significant emphasis on research and development. This activity has generated a sizeable
intellectual property portfolio. Both manufacturing and new product development play
important roles in Creo's success. Operational improvements are already underway at
Creo. The 2004 annual report recognized that in order to achieve its top priority of
delivering earnings growth, Creo needed to target "efficiency improvement programs to
reduce service and equipment manufacturing cost of sales" (Creo, 2005, p. 2 1). These
initiatives began in the fiscal fourth quarter of 2004 (third quarter of the calendar year)
and were targeted to realize $24 million in annualized savings (Creo, 2005, p. 67).
Although the subsequent acquisition by Kodak has created a period of transition, the
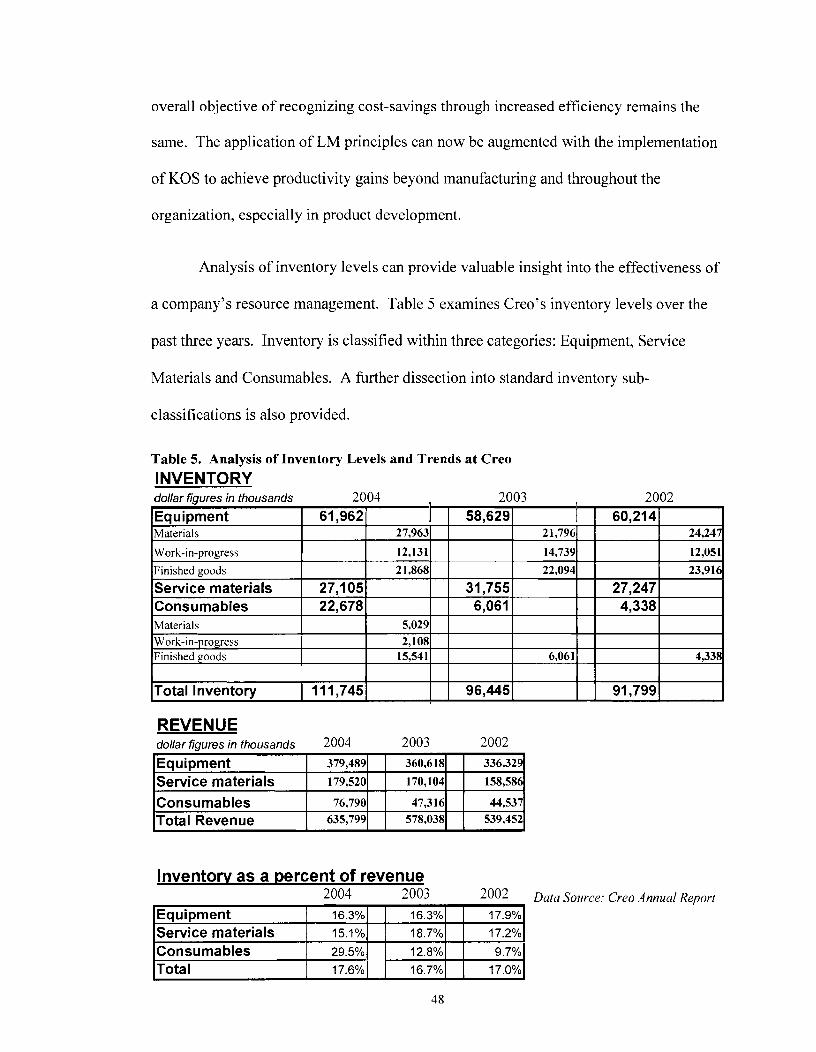
overall objective of recognizing cost-savings through increased efficiency remains the
same. The application of LM principles can now be augmented with the implementation
of KOS to achieve productivity gains beyond manufacturing and throughout the
organization, especially in product development.
Analysis of inventory levels can provide valuable insight into the effectiveness of
a company's resource management. Table 5 examines Creo's inventory levels over the
past three years. Inventory is classified within three categories: Equipment, Service
Materials and Consumables. A further dissection into standard inventory sub-
classifications is also provided.
Table 5. Analysis of Inventory Levels and Trends at Creo
INVENTORY dollar fiaures in thousands 2004 - Equipment 1 61,9621
Work-in-progress
Finished goods
Service materials Consumables Materials
l ~ o t a l lnventorv I I I 1 I I
I 111,7451 I 96,4451 I I 91,7991 I
Work-in-progress Finished goods
REVENUE
Material< I I 27.9631 1 I 21.7961 1 I 24.24 [ 58,6291
27,105 22,678
dollar figures in thousands 2004 2003 2002
1 60,2141
l~ervice materials 1 179,5201 1 170,1041 1 158,586
12,131
2 1,868
5,029
4,338 2,108
15,541 6,061
lnventorv as a percent of revenue
31,755 6,061
Consumables Total Revenue
14,739
22,094
76,790 635,799
2004 2003 2002 Data Source: Creo Annual Report
Equipment Service materials Consumables Total
27,247 4,338
47,316 578,038
12,051
23,916
44,537 539,452
17.9%
17.2%
9.7%
17.0%
16.3%
15.1%
29.5%
17.6%
16.3%
18.7%
12.8%
16.7%

The most illuminating insight is gained by examining inventory levels as a
percentage of revenue within each business segment. Manufacturing inventories,
represented under the equipment category, show a slow improvement. This is likely
attributable to the initial efforts to implement LM. The most notable figure is the
dramatic rise in consumables inventory. This can be explained by Creo's decision to
become a provider of digital plates. As a supplier of consumables, Creo must exhibit a
leaner operation and management of the distribution network. However, this fact may be
moot given Kodak's decisions regarding Creo's plate business.
An alternative perspective on Creo's inventory management can be gained by
examining inventory turns. Table 6 provides both trend information for the past three
fiscal years and a direct comparison to Kodak for the 2004 fiscal years.
Table 6. A Comparison of Inventory Turns between Creo and Kodak
Inventory Turns: COGSIlnventory dollar figures in millions C re0 Kodak
2004 2003 2002 2004
--
Data Source: Creo and Kodak Annual Reports
Creo's inventory turns are trending downwards- heading in the wrong direction.
This is most likely influenced by the increase of consumables inventory which has offset
any gains in manufacturing. Additionally, Creo's inventory management is significantly
worse than Kodak's. The fact that Kodak also generates a large portion of its revenue
from its consumables (film) business, suggests that Creo should adopt some of Kodak's
best practices regarding inventory management. Reducing inventory, increasing
inventory turns, is beneficial for a number of reasons: it frees up cash resources, reduces
holding costs and reduces the risk of inventory becoming obsolete.
Although the concepts of inventory and inventory turns are less applicable to the
product development process, the underlying message is not. The product development
process must be more efficient in its use of resources. Best practices have a tendency to
diffuse through an organization. Consequently, a company demonstrating lean practices
in its manufacturing and resource management is more likely to be utilizing lean
principles in its product development.
5.2 The Matrix Organization
Within Engineering, Creo organizes itself along project-lines with functional
capacities identified within each project. These project groups are headed by either
product or project managers. In general, the organization is relatively flat which is
consistent with Creo's philosophy of self-empowerment. Such an organizational
structure conforms to what is known as a "heavyweight team structure" (Clark and
Wheelwright, 1992, p. 13). Since work is organized around projects, it is necessary to
coordinate employee assignments at the beginning and end of the project. A variety of
functional pools exist within the company; these include electrical, mechanical and
optical engineering as well as firmware and software design. Supporting roles such as
technicians, layout and documentation are also drawn from functional pools.
There are both positives and negatives associated with the matrix-like
organization. A primary benefit is that resource allocation is flexible and can adapt to the
complexities and uncertainty of the environment (Nohria, 1995, p. 1). This structure also
enables employees to develop strong functional competencies while still gaining the
experience of working on a variety of projects. In order to avoid the dual reporting
structure that can plague a true matrix organization, Creo relies on section heads rather
than functional managers. One of the primary responsibilities of these individuals is
mentoring junior employees. Similarly, a strong team-based environment helps foster
knowledge transfer and group learning. A drawback of such an organizational structure
is the limited number of truly heavyweight managers. Creo's approach to this problem is
to utilize both project managers and project engineers. Finally, the resource allocation
question arises: Is this system effectively leveraging the knowledge of the functional
subgroups?
5.3 Stage-Gate at Creo
Creo uses a Stage-Gate like process known as the Product Development System
(PDS). This system is designed to serve as the framework for all new product
development and major revisions to existing products. Given that a sizable fraction of
North American firms are using a stage-gate process for their product development
activities, it becomes highly debatable whether or not such an activity actually provides a
significant competitive advantage to the individual organization. Taken to the extreme,
the generic application of a stage-gate system may lead to mediocrity in a company's new
product development process.
PDS is a linear process which maps a product from the idea phase to end-of-life.
Each step of the product life-cycle contains a number of key activities and deliverables.
These project steps are separated by series of milestones and governed by a number of
project review points. PDS is a structured process which is designed to create efficiency
through the use of a series of templates. Projects are guided by Project and Product
Managers, and reviewed by the Global Product Steering (GPS) committee. Although
PDS is intended as a guideline and not a standard, it is a very thorough, regimented
process. At its worst, the system could break down into a checklist-based activity.
Additionally, PDS is subject to the same criticisms that the original Stage-Gate creators
observed in their detailed review of Stage-Gate users. Most notably, PDS milestones and
the review process do not serve as strict gates by which to evaluate and potentially
terminate projects.
Killing projects is certainly one of the most difficult aspects of the new product
development process. As projects progress, considerable time and resources become
committed to the project. As difficult as it may be, these costs should be treated as sunk
costs and should not factor into decisions about future resource use. However. this
approach is most applicable to companies which have large project portfolios. This
strategy is not realistic for smaller firms or for projects on which the company has "bet
the business." Despite its rank as one of BC7s largest technology-focused companies
(Business in Vancouver, 2005. p. 54), Creo does not have a large project portfolio. This
reality suggests that Creo's product development process must contain an excellent initial
screen process. Under this scheme, a milestone and checklist approach is appropriate.
Hence, one must ask the question "Is the front-end of PDS effective?"
Creo has a generally good record with regard to idea generation. This is
evidenced by the company's strong intellectual property portfolio and its patent
generation rate as discussed in section 2.1. However, the conversion rate on these ideas
could be improved upon. In its over 20 year existence, Creo has not generated any spin-
off companies. Apart from the transition from optical data storage to digital pre-press
systems in the early 90's, Creo has not created any new business units outside of this core
focus. Creo has entered into a number of strategic partnerships, joint develop activities
and licensing agreements in order to take advantage of its innovation. Granted, such a
strategy enables the company to focus on its core segment and minimize or share product
development risk. All of these points bring to mind the following question: "Is PDS
effectively capitalizing on ideas?" In short, the answer is "no". Alternatives to rectify
this situation will be proposed in chapter 6.
Another criticism of PDS relates to the process cycle time. In any process
methodology, reducing development time is beneficial: effectively making the system
leaner. A major source of added cycle time is "hand-offs". Ineffective hand-offs from
development to manufacturing can result in significant project delays and considerable
rework. This creates duplication of effort and is an inefficient use of resources. This
issue will also be addressed in chapter 6.
In this chapter, we have seen that there is both a clear need and benefit in
implementing lean practices throughout the organization. In Creo's Engineering
department, the flexible matrix-like hierarchy could facilitate the TPDS system used at
Toyota or continue with a variation on the existing PDS strategy. Since we now have an

understanding of Creo's existing product development methodology, we can begin to
examine other possibilities.
6 ALTERNATIVES AND APPLICATION OF BEST PRACTICES TO PRODUCT DEVELOPMENT AT CREO
With a solid understanding of both new product development methodologies and
Creo's organization, we can start to investigate the application and integration of these
practices. Creo's existing Product Development System (PDS) has delivered adequate
results so far, but improvements to the system are certainly possible. The subsequent
analysis will attempt to determine if minor tweaks or radical adjustments are required.
Since continuous improvement, or kuizen, is a fundamental tenet of Lean
principles, it is only appropriate that the product development process be subject to a
kaizen event. Furthermore, the new ideas and organizational change which occurs
following an acquisition suggests that now is an appropriate time to modify the product
development process. There is however a delicate balance between harnessing the winds
of change and over-stressing the system to create turbulence and chaos.
Clearly, one cannot expect that the haphazard application of a generic product
development scheme will deliver superior results for the firm. The customization process
is not easy, yet it can be a source of competitive advantage for the firm. The appropriate
methodology must be tailored to the organization, its resources and its goals. The
relevancy of the process to the organization is a critical factor in its ultimate success.
Similarly, change within an organization is the impetus for productivity gains yet it can
also serve as a disruptive force. An understanding of the existing organization serves as
the basis from which to assess both the magnitude and impact of the proposed change.
Resistance to change, or alternatively, the ease with which a change can be implemented
impact the transition process and the end result. This challenge manifests itself as yet
another form of a riskheward analysis. Hence, the net benefit or rewards associated with
the change are closely tied to the implementation risk.
The remainder of this section will examine three alternatives: modified Stage-
Gate (or modified PDS), TPDS, and a hybrid approach. These methodologies will be
evaluated against three over-arching criteria: relevancy to the organization, ease of
implementation and impact. Each of these criteria contains more direct measures such as
the impact on competitiveness, manufacturability, quality, knowledge generation and
earnings growth. The sections will begin by examining the relevancy of the methodology
to Creo's organization and investigates what the system would look like. This will be
followed by a discussion on the implementation and conclude with an assessment of the
impact.
6.1 Modified Stage-Gate
Section 5.3 already examined the strengths and weaknesses of Creo's existing
PDS process. The main benefit of this system is that it provides a thorough, structured
process by which projects can be guided. However, the system can breakdown into a
series of checklists, fail to optimize resources and delay product release due to awkward
transitions to manufacturing. Additionally, since PDS is more of a guideline rather than a
standard, it has not been rigorously followed which has created a schism between theory
and practice. Almost by default, we can assign a high relevancy of this existing system to

Creo's operations. However, we must also acknowledge that limited deviations from this
system will offer only marginal gains and a limited ability to differentiate Creo from the
competition.
The challenge is not with maintaining the status quo, but with identifying and
implementing the appropriate changes to improve upon PDS. In the simplest of terms,
PDS must be made leaner. Since this alternative represents moderate rather than radical
change, a modified PDS should concentrate on the following three issues:
1. Greater adherence to the process standards.
2. Reducing cycle-time by minimizing hand-offs.
3. Improving the front-end of PDS.
There is a delicate balance between structure and flexibility in any product
development methodology. However, by creating a "living" process with defined, yet
continually refined, procedures, a new organizational mindset will be adopted. In order
to realize the benefits of PDS, the entire organization must believe in, and adhere to, the
system. The system is changeable, but people must work within the system. Clearly
defining expectations and adhering to protocols must be two requirements of a modified
PDS. Defining expectations means asking the tough questions relating to product cost
and profitability, reliability, serviceability, and technical specifications.
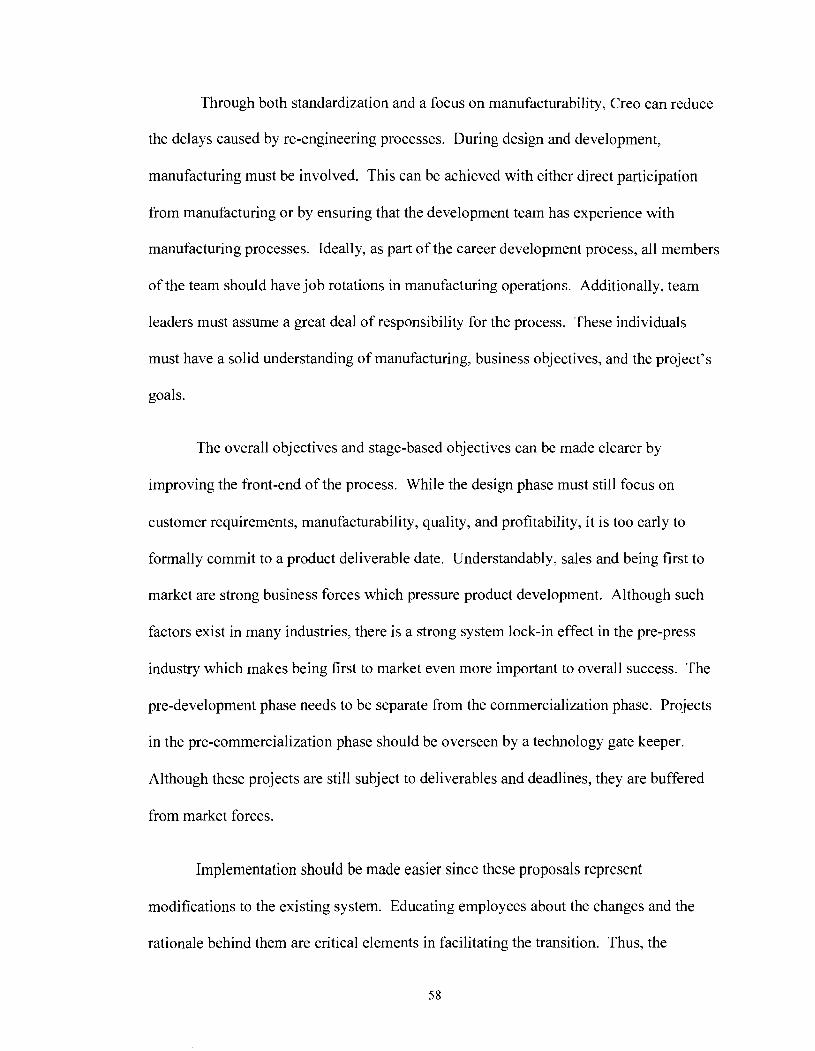
Through both standardization and a focus on manufacturability, Creo can reduce
the delays caused by re-engineering processes. During design and development,
manufacturing must be involved. This can be achieved with either direct participation
from manufacturing or by ensuring that the development team has experience with
manufacturing processes. Ideally, as part of the career development process, all members
of the team should have job rotations in manufacturing operations. Additionally, team
leaders must assume a great deal of responsibility for the process. These individuals
must have a solid understanding of manufacturing, business objectives, and the project's
goals.
The overall objectives and stage-based objectives can be made clearer by
improving the front-end of the process. While the design phase must still focus on
customer requirements, manufacturability, quality, and profitability, it is too early to
formally commit to a product deliverable date. Understandably, sales and being first to
market are strong business forces which pressure product development. Although such
factors exist in many industries, there is a strong system lock-in effect in the pre-press
industry which makes being first to market even more important to overall success. The
pre-development phase needs to be separate from the commercialization phase. Projects
in the pre-commercialization phase should be overseen by a technology gate keeper.
Although these projects are still subject to deliverables and deadlines, they are buffered
from market forces.
Implementation should be made easier since these proposals represent
modifications to the existing system. Educating employees about the changes and the
rationale behind them are critical elements in facilitating the transition. Thus, the

challenges associated with implementation are moderate and the impact of these changes
will also be moderate. The goal is to achieve incremental improvement rather than
radical change. The modified PDS should have a direct impact on manufacturability and
competitiveness. In turn, there should be a positive impact on earnings growth, quality
and knowledge transfer.
6.2 TPDS at Creo
The fundamental question that must be raised is: Can TPDS be implemented
successfully outside of Toyota? Arguably, a similar question was asked several decades
ago regarding TPS. The popularity of Lean Manufacturing has answered that question
with an emphatic "yes". However, this leaves us to ponder why Toyota would give
away the source of its competitive advantage. Two possible explanations are that their
competitors lack the flexibility and organizational culture needed to successfully
implement the system. Rigid union contracts hamper the integrative social processes
which are critical to TPDS. Additionally, the high barriers to entry in automobile
manufacturing prevent new competition. While these factors may hinder the adoption of
TPDS in the automotive sector, they do not preclude the successful implementation in
other industries.
The more directly applicable question is: Can TPDS be implemented successfully
at Creo? Creo's organizational culture and flexibility suggests that a TPDS-like system is
possible. Furthermore, the standardization aspects of TPDS are less company specific
and therefore can be applied to different settings. The remaining issue is the relevancy of
TPDS to Creo's product development. Competitive tear-downs, a regular occurrence at
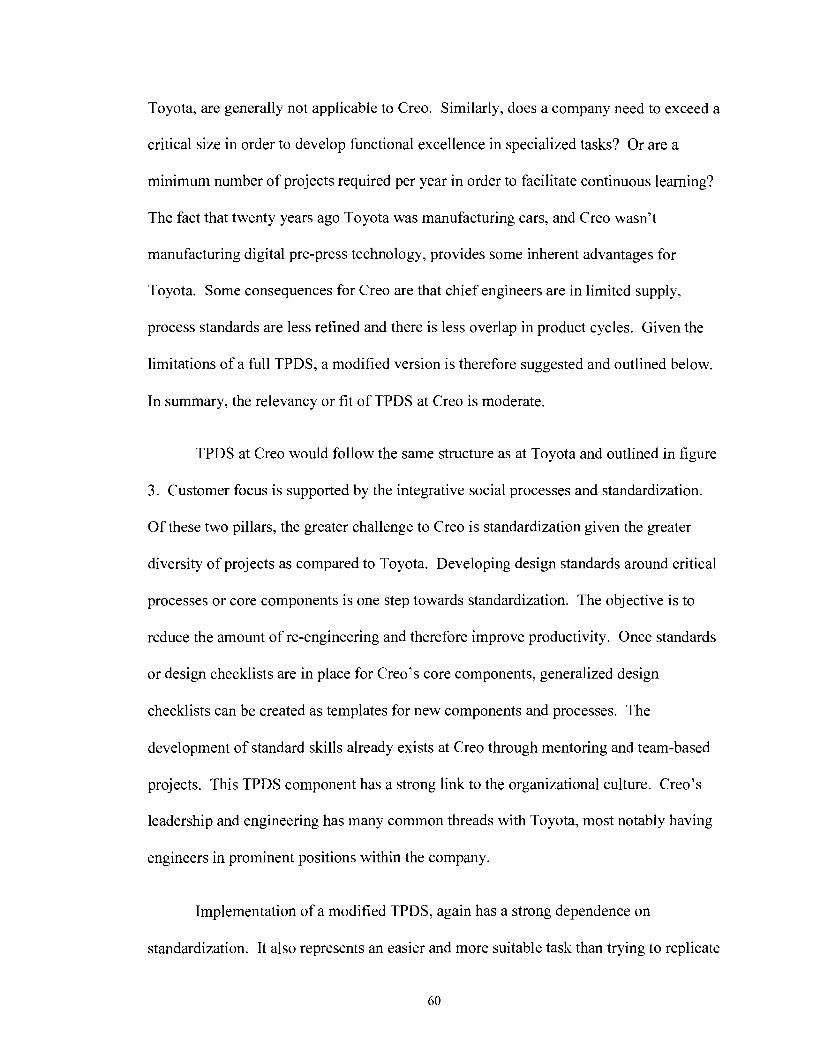
Toyota, are generally not applicable to Creo. Similarly, does a company need to exceed a
critical size in order to develop functional excellence in specialized tasks? Or are a
minimum number of projects required per year in order to facilitate continuous learning?
The fact that twenty years ago Toyota was manufacturing cars, and Creo wasn't
manufacturing digital pre-press technology, provides some inherent advantages for
Toyota. Some consequences for Creo are that chief engineers are in limited supply,
process standards are less refined and there is less overlap in product cycles. Given the
limitations of a full TPDS, a modified version is therefore suggested and outlined below.
In summary, the relevancy or fit of TPDS at Creo is moderate.
TPDS at Creo would follow the same structure as at Toyota and outlined in figure
3. Customer focus is supported by the integrative social processes and standardization.
Of these two pillars, the greater challenge to Creo is standardization given the greater
diversity of projects as compared to Toyota. Developing design standards around critical
processes or core components is one step towards standardization. The objective is to
reduce the amount of re-engineering and therefore improve productivity. Once standards
or design checklists are in place for Creo's core components, generalized design
checklists can be created as templates for new components and processes. The
development of standard skills already exists at Creo through mentoring and team-based
projects. This TPDS component has a strong link to the organizational culture. Creo's
leadership and engineering has many common threads with Toyota, most notably having
engineers in prominent positions within the company.
Implementation of a modified TPDS, again has a strong dependence on
standardization. It also represents an easier and more suitable task than trying to replicate

TPDS in its entirety. Thus, implementation ranks as moderate to difficult.
Communication is not only an important element within TPDS, but also during its
implementation. An understanding of the system and its goals are important on both the
global level and at the project level. A modified TPDS reduces some of the
implementation risk, but also reduces the impact.
6.3 A Hybrid Approach
Conceptually, a hybrid approach seems to address the limitations of both PDS and
TPDS while incorporating their benefits. The challenge is to determine what such a
hybrid system looks like. It can certainly be built upon a PDS framework, while
incorporating the standardization aspects of TPDS. Standardization and customer focus
are elements common to other development methodologies such as DFSS. Another
critical element is the emphasis on the Definition phase of the project. Clear definition
and communication of objectives requires a rigorous adherence to the methodology, but
helps prevent confusion later in the process. A further challenge is retaining enough
flexibility to keep design options open as late as possible.
Implementation of such a strategy should be incremental. Modifications to the
existing PDS would be followed by the incorporation of TPDS practices. A gradual roll-
out is consistent with a continuous improvement mindset and it maximizes the likelihood
of acceptance. A consequence of the reduced risk is that the benefits are delayed. The
implementation schedule serves as a tool with which to balance risk and reward.
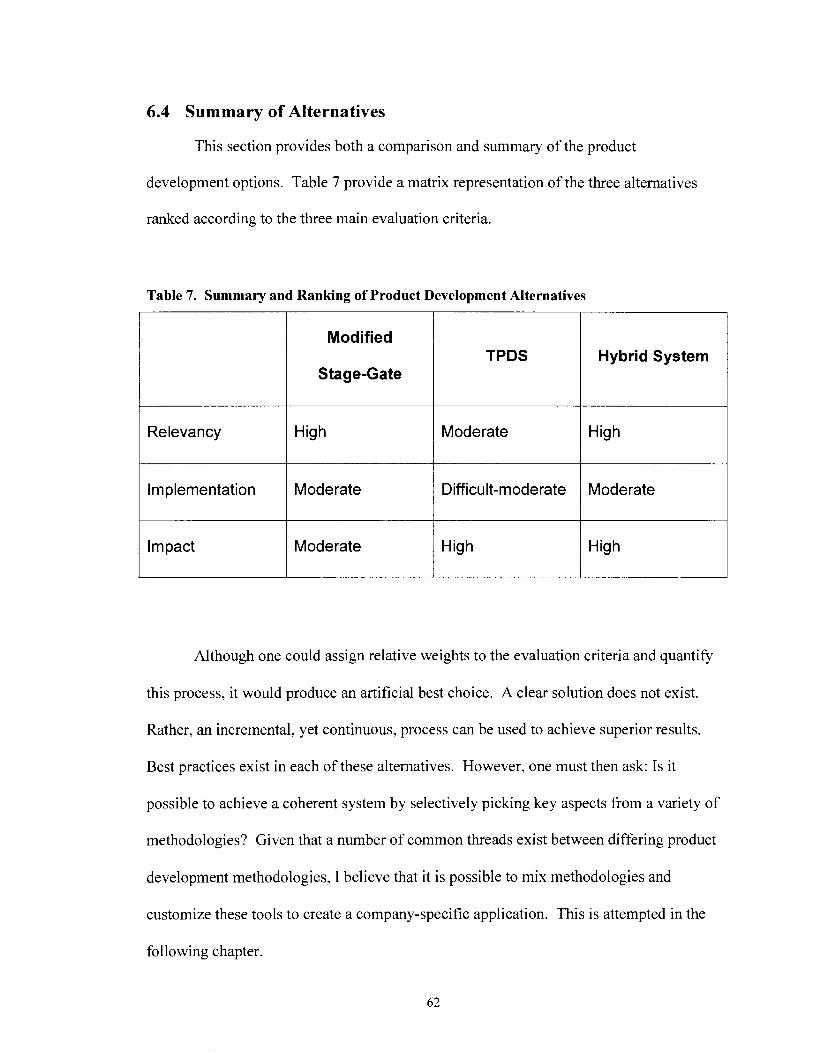
6.4 Summary of Alternatives
This section provides both a comparison and summary of the product
development options. Table 7 provide a matrix representation of the three alternatives
ranked according to the three main evaluation criteria.
Table 7. Summary and Ranking of Product Development Alternatives
Relevancy
Implementation
l m pact
Modified
Stage-Gate
High
Moderate
Moderate
TPDS
Moderate
Difficult-moderate
High
Hybrid System
High
Moderate
High
Although one could assign relative weights to the evaluation criteria and quantify
this process, it would produce an artificial best choice. A clear solution does not exist.
Rather, an incremental, yet continuous, process can be used to achieve superior results.
Best practices exist in each of these alternatives. However, one must then ask: Is it
possible to achieve a coherent system by selectively picking key aspects from a variety of
methodologies? Given that a number of common threads exist between differing product
development methodologies, I believe that it is possible to mix methodologies and
customize these tools to create a company-specific application. This is attempted in the
following chapter.
7 RECOMMENDATIONS
Unlike the majority of North American companies, Creo has a strong corporate
culture and an industry leading position upon which to build. This represents a fertile
environment in which to implement key elements of a lean product development strategy
such as TPDS with its strong social and culture component. Strong similarities exist
between the different methodologies and certain best practices in product development
are almost self-evident. No company will claim to lack a customer focus or be
disinterested in quality. However, focusing on the needs of the customer and product
manufacturability during the design and development phase is much more subtle.
In Chapter 6, three alternatives were presented. In addition to examining the
critical issues associated with each option, a discussion detailing what the system would
look like was offered. From this investigation, no one strategy emerged as the clear
choice; however, recurring themes did materialize. This insight forms the basis for
following core recommendations regarding the application of lean principles to the
product development process. They are presented below in order of importance.
1. Standardization of Processes - Standardization forms the foundation of lean
manufacturing and lean product development. It is a driving force for
productivity gains through cycle time reduction and the elimination of waste. To
achieve results from the product development process, Creo must create a more
formalized system rather than a set of guidelines. Adherence to the system is the
best way to integrate it into the company's culture.
2. Continuous Improvement - Although the creation of standard protocols may
remove flexibility from the process, this does not need to be the case. These
standards should be considered living documents that are continuously updated to
reflect the latest best practices. Following the completion of projects, Project
Post-Mortems should be conducted to determine both successes and failures. This
knowledge generating exercise must become a required part of the product
development system.
Design for Manufacturability and Quality - These are not inherent mandates of
the Stage-Gate process, yet they need to be included as part of a lean product
development strategy. Manufacturability includes not only the technical or
engineering concepts, but also the business requirements such as profitability and
deliverability. Involvement of the manufacturing organization in the design and
prototyping phases of product development can help achieve this goal.
Additionally, design team members should maintain a close relationship with
manufacturing, including spending time on the shop-floor, and keeping abreast of
the latest practices.
4. Separation of Pre-Development from Commercialization - Although
profitability and customer-focus must remain primary objectives during the pre-
development phase, this stage of the process should be unencumbered by the
constraint of a firm customer deliverable date. Firm commitments short-circuit

the design and exploration phase and can result in the abandonment of the "design
for manufacturability and quality" objective. The goal during this phase is to
minimize the technological and business risks.
5. Definition and Communication of Obiectives - This requirement is closely
related to the primary recommendation of process standardization. The definition
and communication of project objectives must be identified early in the project.
This practice helps create congruent goals amongst different functions within the
organization. Although objectives can change during the development process,
such events need to be formalized and communicated to the team members and
other effected parties.
6. A Learning-Focused Organization - Creo's culture already encourages the
sharing of knowledge through team-based activities and mentoring. This practice
can be further enhanced by recognizing the importance of creating and
formalizing new processes in conjunction with the creation of new products. In
order to see increased future returns on the product development process, best
practices, in addition to products, must be recognized as valuable outputs from the
system. As recommended earlier, these practices need to become part of the
standard product development process.
7. Flexibility - Although flexibility appears to be in direct conflict with
standardization, these two concepts co-exist within a lean manufacturing
environment and can do so within a lean product development system. It is
important to recognize that different projects will have differing requirements.

The system must have the flexibility to address this. An example of contrasting
needs would be a product update versus the commercialization of a new idea. In
the case of the former, a considerable amount of expertise will exist within the
company. For the latter, this knowledge will be harder to come by.
What has been presented here is not a quick-fix, but rather a slow, methodical
approach to realizing greater value from the product development process. Although a
list of recommendations makes the course of action appear straight-forward,
implementation is not easy. Creo is prepared to face these challenges, but the
organization must also push itself to create its own unique processes. The company
cannot be satisfied with an "as good as" mentality that can result from benchmarking, it
must strive for superior performance.
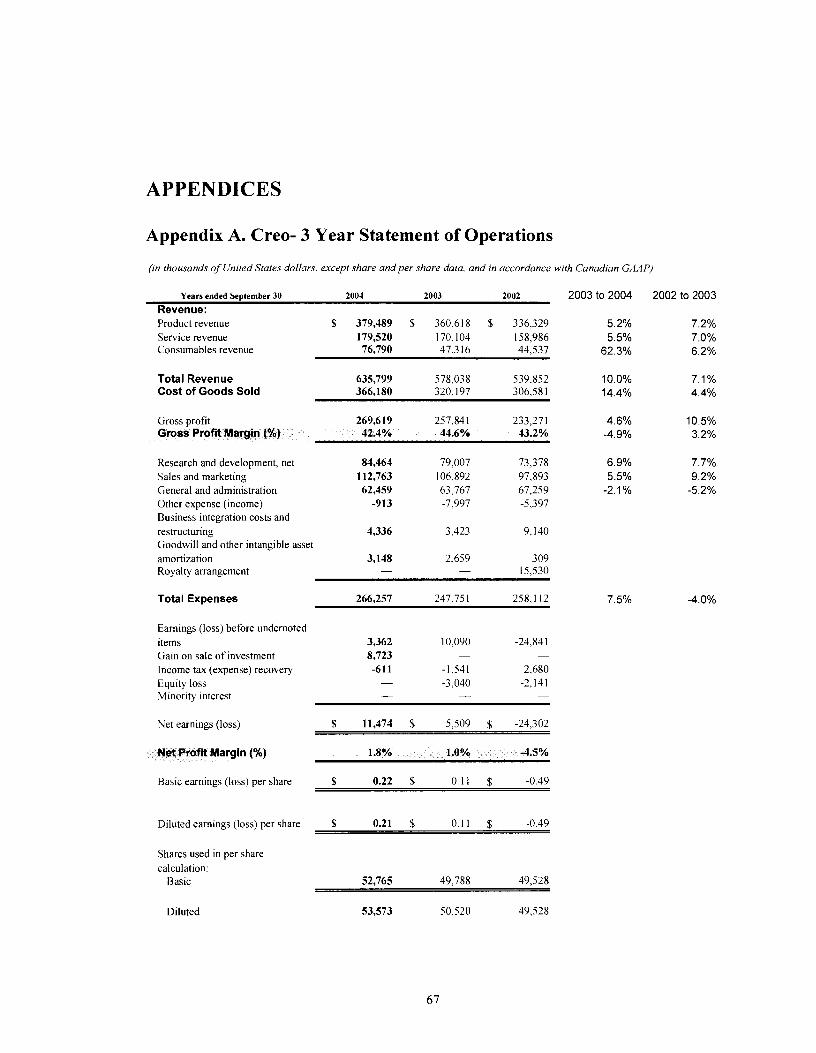
APPENDICES
Appendix A. Creo- 3 Year Statement of Operations
(rn thousands of United States dollars, except share and per share data, and in accordance w ~ t h Canadian GAAP)
Years ended September 30 2004 2003 2002 2003 to 2004 2002 to 2003 Revenue: Product revenue $ 379,489 $ 360,618 $ 336,329 5.2% 7.2% Service revenue 179,520 170,104 158,986 5.5% 7.0% Consumables revenue 76,790 47.3 16 44,537 62.3% 6.2%
Total Revenue 635,799 578,038 539,852 10.0% 7.1% Cost of Goods Sold 366,180 320,197 306,581 14.4% 4.4%
Gross profit 269,619 257,841 233,271 4 6% 10 5% Gross Profit Margin (%) 42.4% 44.6% 43.2% -4 9% 3 2%
Research and development, net 84,464 79,007 73,378 6.9% 7.7% Sales and marketing 112,763 106,892 97,893 5.5% 9.2% General and administration 62,459 63,767 67,259 -2.1% -5.2% Other expense (income) -913 -7,997 -5,397 Business integration costs and restructuring 4,336 3,423 9.140 Goodwill and other ~ntang~ble asset amortization 3,148 2,659 3 09 Royalty arrangement - - 15,530
Total Expenses 266,257 247,75 1 258,112 7.5% -4.0%
Earnmgs (loss) before undernoted items 3,362 10,090 -24,841 Gain on sale of investment 8,723 - -
Income tax (expense) recovery -611 -1.541 2,680 Equity loss - -3.040 -2,141 Minor~ty interest - - -
Net earnings (loss) $ 11,474 $ 5,509 $ -24,302
gin (%) 1.8% 1.0% -4.5%
Basic earnings (loss) per share $ 0.22 $ 0.11 $ -0.49
Diluted earnings (loss) per share $ 0.21 $ 0.11 $ -0.49
Shares used in per share calculation:
Basic 52,765 49.788 49,528
Diluted 53,573 50,520 49,528

Appendix B. Kodak- 3 Year Statement of Operations
(in millions, except per share data)
Total Revenue Cost of Goods Sold
Gross profit Gross Profit Margin (X)
Selling, general and administrative expenses
Research and development costs Restructuring costs and other
(Losses) earnings from continuing operations before interest, other income (charges), net and income taxes
Interest expense Other income (charges), net (Loss) earnings from continuing operations before income taxes (Benefit) prov~sion for income taxes Earnings from continuing operations Earnings from discontinued operations, net of income taxes
NET EARNINGS
Net Profit Margin (%)
Basic net earnings per share: Continuing operations Discontinued operations
Total
Diluted net earnings per share. Continuing operations Discontinued operations
Total
Cash dividends per share
For the Year Ended December 31.
2004 2003
(Restated)
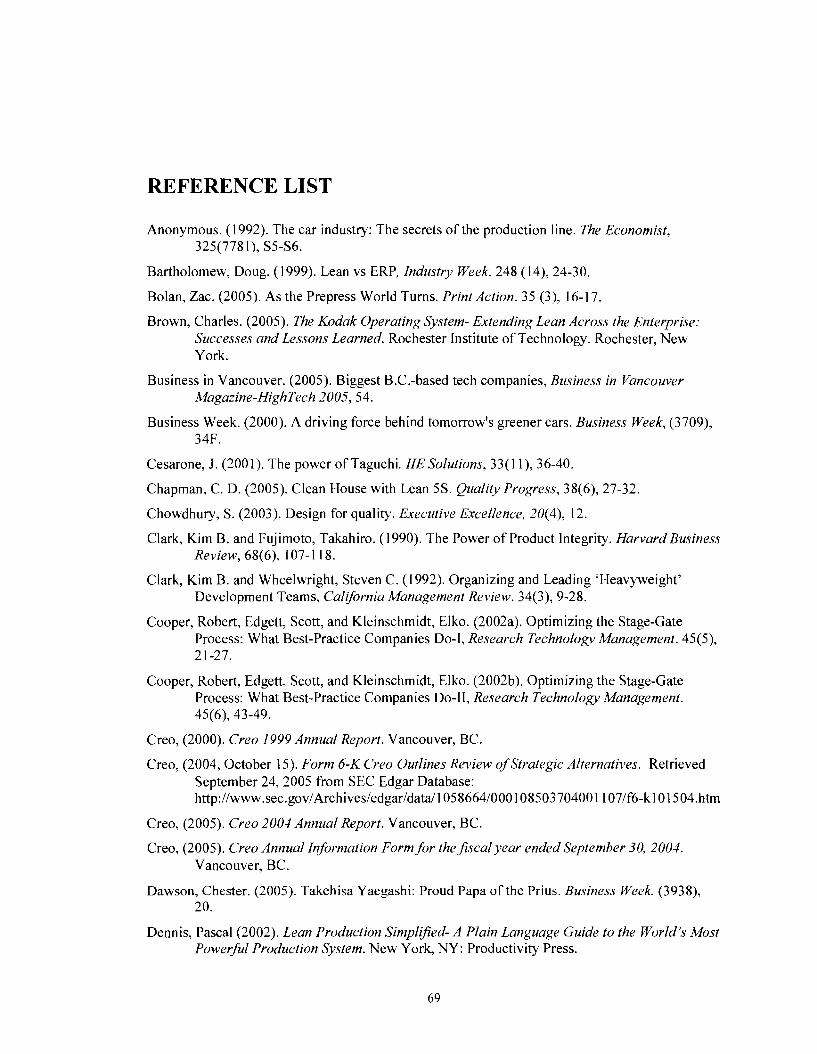
REFERENCE LIST
Anonymous. (1992). The car industry: The secrets of the production line. The Economist, 325(7781), S5-S6.
Bartholomew, Doug. (1999). Lean vs ERP, Industry Week. 248 (14), 24-30.
Bolan, Zac. (2005). As the Prepress World Turns. Print Action. 35 (3), 16-1 7.
Brown, Charles. (2005). The Kodak Operating System- Extending Lean Across the Enterprise: Successes and Lessons Learned. Rochester Institute of Technology. Rochester, New York.
Business in Vancouver. (2005). Biggest B.C.-based tech companies, Business in Vancouver Magazine-HighTech 200.5, 54.
Business Week. (2000). A driving force behind tomorrow's greener cars. Business Week, (3709), 34F.
Cesarone, J. (2001). The power of Taguchi. IIE Solutions, 33(1 1), 36-40.
Chapman, C. D. (2005). Clean House with Lean 5s . Quality Progress, 38(6), 27-32.
Chowdhury, S. (2003). Design for quality. Executive Excellence, 20(4), 12.
Clark, Kim B. and Fujimoto, Takahiro. (1990). The Power of Product Integrity. Harvard Business Review, 68(6), 107- 1 1 8.
Clark, Kim B. and Wheelwright, Steven C. (1992). Organizing and Leading 'Heavyweight' Development Teams, California Management Review. 34(3), 9-28.
Cooper, Robert, Edgett, Scott, and Kleinschmidt, Elko. (2002a). Optimizing the Stage-Gate Process: What Best-Practice Companies Do-I, Research Technology Management. 45(5), 21-27.
Cooper, Robert, Edgett, Scott, and Kleinschmidt, Elko. (2002b). Optimizing the Stage-Gate Process: What Best-Practice Companies Do-11, Research Technology Management. 45(6), 43-49.
Creo, (2000). Creo 1999 Annual Report. Vancouver, BC.
Creo, (2004, October 15). Form 6-K Creo Outlines Review of Strategic Alternatives. Retrieved September 24,2005 from SEC Edgar Database: http://www.sec.gov/Archives/edgar/data~1058664/00010850370400 1 107/f6-kl01504.htm
Creo, (2005). Creo 2001 Annual Report. Vancouver, BC.
Creo, (2005). Creo Annual Itformation Form for thejscal year ended September 30, 2004. Vancouver, BC.
Dawson, Chester. (2005). Takehisa Yaegashi: Proud Papa of the Prius. Business Week. (3938), 20.
Dennis, Pascal (2002). Lean Production Simplijied- A Plain Language Guide to the World's Most Powerful Production System. New York. NY: Productivity Press.
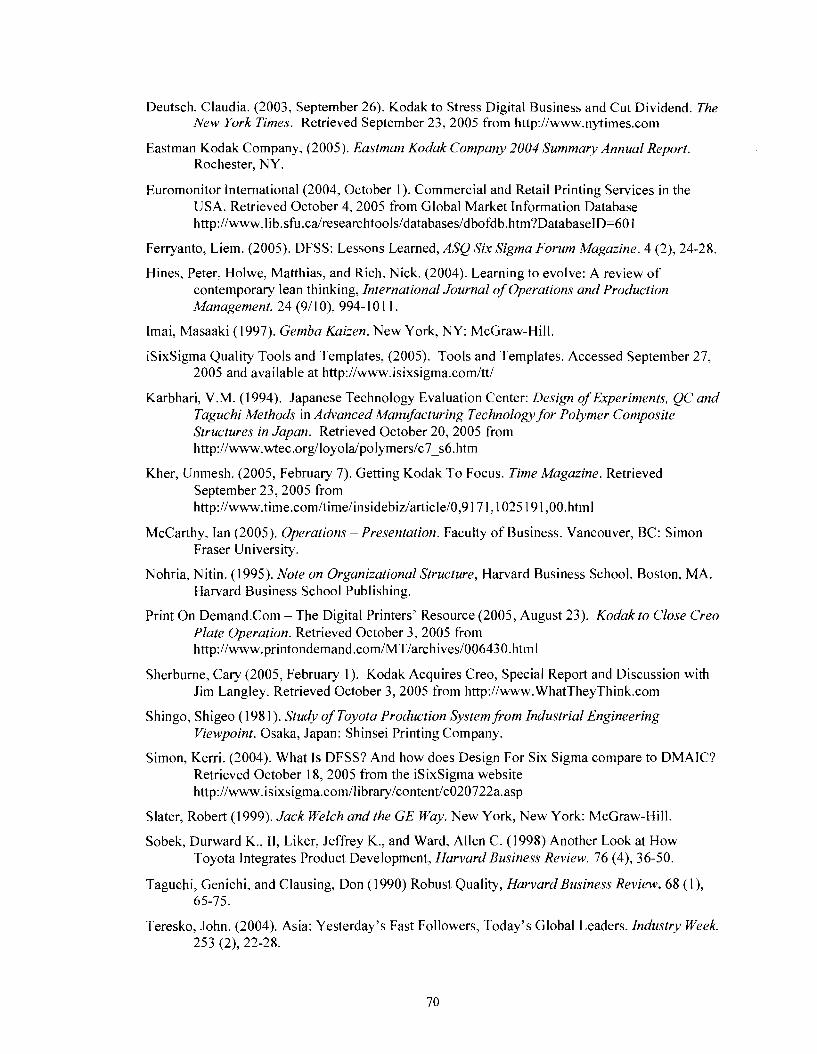
Deutsch, Claudia. (2003, September 26). Kodak to Stress Digital Business and Cut Dividend. The New York Times. Retrieved September 23, 2005 from http://www.nytimes.com
Eastman Kodak Company, (2005). Eastman Kodak Company 2004 Summary Annual Report. Rochester, NY.
Euromonitor International (2004, October 1). Commercial and Retail Printing Services in the USA. Retrieved October 4,2005 from Global Market Information Database http://www.lib.sfu.ca~researchtools/databases/dbofdb.htm?DatabaseID=60 I
Ferryanto, Liem. (2005). DFSS: Lessons Learned, ASQ Six Sigma Forum Magazine. 4 (2), 24-28.
Hines, Peter. Holwe, Matthias, and Rich. Nick. (2004). Learning to evolve: A review of contemporary lean thinking, International Journal of Operations and Production Management. 24 (911 0). 994- 10 1 1.
Imai, Masaaki (1997). Gemba Kaizen. New York, NY: McGraw-Hill.
iSixSigma Quality Tools and Templates, (2005). Tools and Templates. Accessed September 27, 2005 and available at http:Nwww.isixsigma.com/tt/
Karbhari, V.M. (1 994). Japanese Technology Evaluation Center: Design of Experiments, QC and Taguchi Methods in Advanced Manufacturing Technology for Polymer Composite Structures in Japan. Retrieved October 20, 2005 from http://www.wtec.org/loyola~polymers/c7~s6.htm
Kher, Unmesh. (2005, February 7). Getting Kodak To Focus. Time Magazine. Retrieved September 23,2005 from http://www.time.com/time/insidebiz/article/O,9 17 1,1025 191 ,OO.html
McCarthy, Ian (2005). Operations -Presentation. Faculty of Business. Vancouver, BC: Simon Fraser University.
Nohria. Nitin. (1995). Note on Organizational Structure, Harvard Business School. Boston, MA. Harvard Business School Publishing.
Print On Demand.Com - The Digital Printers' Resource (2005, August 23). Kodak to Close Creo Plate Operation. Retrieved October 3. 2005 from http://www.printondemand.com/MT/archives/OO643O.ht1nl
Sherburne, Cary (2005, February 1). Kodak Acquires Creo, Special Report and Discussion with Jim Langley. Retrieved October 3, 2005 from http://www.WhatTheyThink.com
Shingo, Shigeo (198 1 ). Study of Toyota Production Sy.~temfiom Industrial Engineering Viewpoint. Osaka, Japan: Shinsei Printing Company.
Simon, Kerri. (2004). What Is DFSS? And how does Design For Six Sigma compare to DMAIC? Retrieved October 18, 2005 from the iSixSigma website http://www.isixsigma.co1n/library/content/c020722a.asp
Slater, Robert (1999). Jack Welch and the GE Way. New York, New York: McGraw-Hill.
Sobek, Durward K., 11, Liker, Jeffrey K., and Ward, Allen C. (1998) Another Look at How Toyota Integrates Product Development, Harvard Business Review. 76 (4), 36-50.
Taguchi, Genichi, and Clausing, Don ( 1 990) Robust Quality, Harvard Business Review. 68 (I), 65-75.
Teresko, John. (2004). Asia: Yesterday's Fast Followers, Today's Global Leaders. Industry Week. 253 (2), 22-28.

Vasilash, Gary. (2003, November 1 1). Is Toyota Prius the Most Important 2004 Model?, Motor Trend. Retrieved October 18, 2005 from http://www.motortrend.com/roadtests/alternative/ I 12-news46
Waurzyniak, Patrick. (2005). Lean at Nummi, Manufacturing Engineering. 135 (3), 73-84.
Womack, James P. and Jones, Daniel T. (1 996). Beyond Toyota: How to root out waste and pursue perfection, Harvard Business Review. 74 (5), 140- 158.