Embed Size (px)
Citation preview
Federal Trade Commission
Staff Report on
An Analysis on Competitive Structure in the Uranium Supply Industry
Joseph P. Mulholland John Hering Steven Martin
Bureau of Economics August 1979
, I
I ] I I !
ECONOMIC REPORT
August 1979
An An al y sis 0 f Comp et i t i v eSt rue tu re in the Uranium Supply Industry
. .,.;;: . - .. -.
by
Jos eph P. Mulholland John Haring
Steven Ma rtin
Staff Report to the Federal Trade Commission
For sale by the Superintendent 01 Documents, U.S. Government Prlntlnc omce, WaahlnltoD, D.C. 20&02
FEDEkAL TRADE COMMISSION
MICHABL PERTSCHUK, Chairman PAUL RAND DIXON, Commissioner DAVID A. CLANTON, Commissioner ROBERT PITOFSKY, Commissioner
WILLIAM S. COMANOR, Director IP. DAVI D UUALLS, Deputy Di rec tor KEITH B. ANDERSON, Assistant to the Director JOHN P. 13ROON, Assistant Director for Consumer Protection MICHAEL w. KLAS~, Assistant Director for'~cohomic Evidence WILLIAM H. SPRUNK, Assistant Director for Financial Statistics STEVEN SALOP, Assistant Director for Industry Analysis MARILYN J. McDEfME'rT, Assistant Director for Hanagement and
Budget
THE FEDERAL TkADE COMMISSION HAS NOT ADOPTED ThIS kEPOk'l' A't:j I?S OWN Ii~ WHGL£ OR I N PART
. ,,..
ACKNOWLEIXiBENfS
This is a Staff Report to the Federal Trade Commission by the
Bureau of Economics, William S. Commanor, Director. Joseph P. MUlholland is the author of this report. It is based on an
mpub1ished study, "Report to the Federal Trade Conmis~ion en Competition
in the Nuclear Fuel Industry", to-authored by Jom Haring and Steven Martin
(The Haring-Martin study was completed in April, 1977 and is avai lab 1e- from
the Federal Trade Commissi~n's Public R~f~r~nGe Br.anch). Special thanks are extended to Cal Roush for his censtructive comment
on several drafts of this report. Valuable feedback was also provided by
Keith Anderson, Ernie Pantos, David Qualls, and Doug Webbink. Ntunerous
officials of the Department of Energy graciously extended both infonnation and advice that materially improved the content of this report. Barbara Robinson supplied excellent research assistance. Darence Wilson typed numerous drafts in her unique and efficient style .
-
Chapter
I II
IV
Interfuel'Competition, Petroleum Firms, and the Competitive Potential of the Uranium Supply Market
Page
84
A. Petroleum Firm Interest in the Uranium Industry "85
B. Uranium and Interfuel Competition 89
C. Evaluation: The Competitive Significance of Petroleum Firm Entry
D. Conclusions
Policy Recommendations • ~._ • _It_.
93
104
106
A. Antitrust Within the Uranium Production 106 Industry
B. Petroleum Firm Entry into Uranium Production 106
C. Backward Integration of Electric Utilities into Uranium Production • 107
Appendices
A
B
c
o
Supplementary Tables
Joint Venture Analysis
Mergers and Reserve Purchases in the Uranium Industry, 1955 -74
Data Production Procedures
109
114
133
141
An Analysis of Competitive Structure
in the Uranium Supply Study /
Chapter Page
Introduction 1
I The Nuclear Energy Sector: An Overview 6
A. The Nuclear Fuel Cycle 7
B. Industrial Organization 10
II The Economics of Uranium Supply 13
A. Characteristics of the Industry 14
1. The Production Process 14
2. Cos t Condi tions 19
3. Exchange Conditions 27
4 • Re sou rc e Me as ur es 29
5. Vertical Integration 34
6. International Aspects 39
B. Concentra tion Levels 43
C • Condi tion of En try 57
l. wng Ge s ta t ion Pe r iod 58
2 • Superior Resou rces 60
3. Economies of Scale 63
4. capital Requirements 67
5. Conclu sion 70
D. Record of en try: 1944 -77 71
1. Exploration Activity 71
l. OJ tpu t Concentra tion Levels 75
E. Summa ry and Conclus ions 81
-i-
TABLE I
I-I
1-2
11-1
11-2
11-3
11-4
11-5
II-Sa
11-6
11-7
11-8
11-9
11-10
II-II
11-12
11-13
II-13a
11-14
LIST OF TABLES
Estimated Cost Components of the Nuc~ear Fuel Cycle
Principal Companies' Operating in the Nuclear Energy Sector
Cost Estimates for Various Sizes and Types of Uranium concentrate Production Facilities ($/Lb. U3 0 8 Recovered)
Uranium Mill Construction Cos~'Rstimates
Uranium Reserve Estimates: 1974 and 1977
Potential Uranium Resources Estimates as of
PAGE
9
11
21
- 24
_ 31
January 1, 1978 33
Integrated Uranium Reserves Holders 37
Uranium Reserves Concentration Ratios 46
Identity of the Leading Holders of $30 Uranium Reserves: 1974 47
Percentage of $30 Reserves Uncommitted to Purchasers: 1974 48
Concentration Levels at the Milling Stage: 1974 48
Uranium Concentration Levels Based on Explora tory Ac t i vi ty : 19 74 50
Summary of Concentration Levels in the Uranium Supply Sector: 1974 50
Leading Eight Companies for Selected Categories of Uranium Activity: 1974
Market Shares for Selected Groups of Top Eight Companies: 1974
Changes in Exploration Activity: 1974-77
Uranium Exploration Effort, Selected Indicies: 1966-77
Acreage and Drilling Footage Concentration: 1972-76
-iii-
52
53
72
73
76
I~.,
..:::'
'~-~
TABLE
11-15
11-16
111-1 ,
111-2
111-3
111-4
111-5
111-6
A-I
A-2
A-3
A-4
8-1
B-2
B-3
B-4
C-l
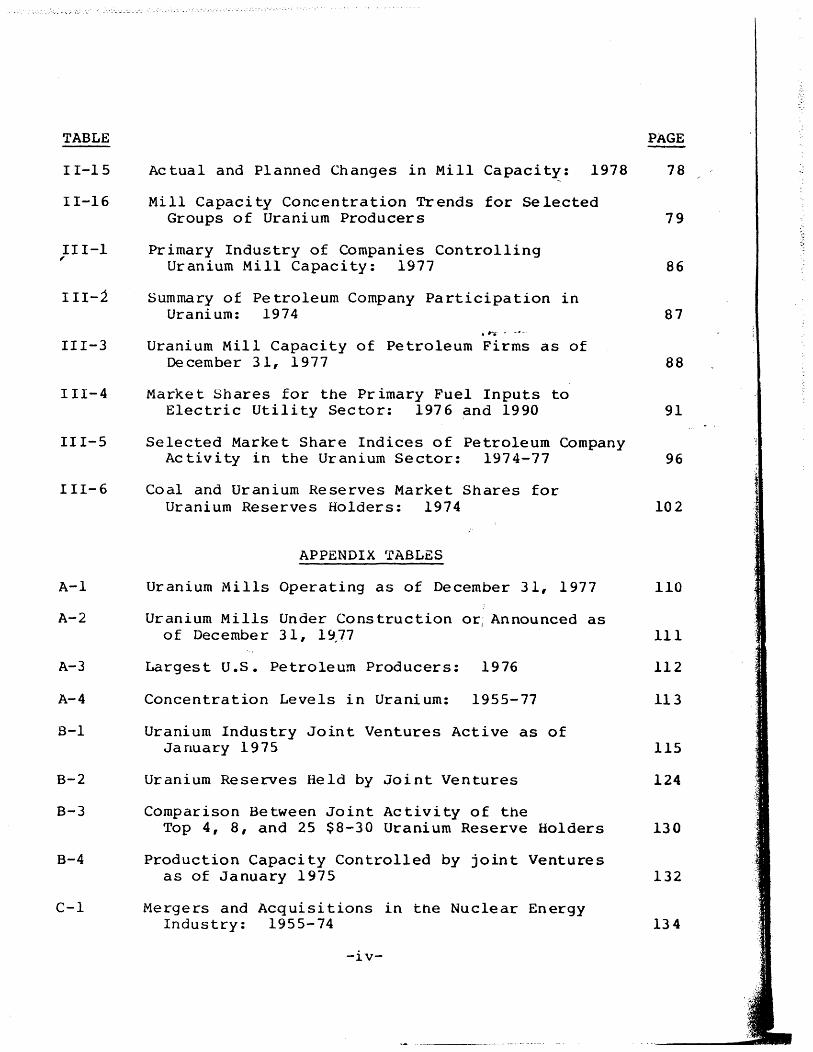
Actual and Planned Changes in Mill Capacity: 1978
Mill Capacity Concentration Trends for Selected Groups of Uranium Producers
Primary Industry of Companies Controlling Uranium Mill Capacity: 1977
Summary of Petroleum Company Participation in Uranium: 1974
'~fi- o. _ .. -.
Uranium Mill Capacity of Petroleum Firms as of December 31, 1977
Market Shares for the Primary Fuel Inputs to Electric Utility Sector: 1976 and 1990
Selected Market Share Indices of Petroleum Company Activity in the Uranium Sector: 1974-77
Coal and Uranium Reserves Market Shares for Uranium Reserves Holders: 1974
APPENDIX TABLES
Uranium Mills Operating as of December 31, 1977
Uranium Mills Under Construction or; Announced as of Decembe r 31, 19,17
Largest U.S. Petroleum Producers: 1976
Concentration Levels in Uranium: 1955-77
Uranium Industry Joint Ventures Active as of January 1975
Uranium Reserves Held by Joint Ventures
Comparison Between Joint Activity of the Top 4, 8, and 25 $8-30 Uranium Reserve Holders
Production Capacity Controlled by joint Ventures as of January 1975
Mergers and Acquisitions in the Nuclear Energy Industry: 1955-74
-iv-
PAGE
78
79
.~
86
87
88
91
96
102
110
III
112
113
115
124
130
132
134
FIGURE
11-1
11-2
C-1
LIST OF FIGURE!:)
~
Eight-firm Concentration Levels in Uranium: 1955-77
Principal Sedimentary· Basins in the United States
Average Number of Mergers and Acquisitions: 1955-74 (Three-year Average)
.#t'fi.- • -"-.
-vi-
44
136
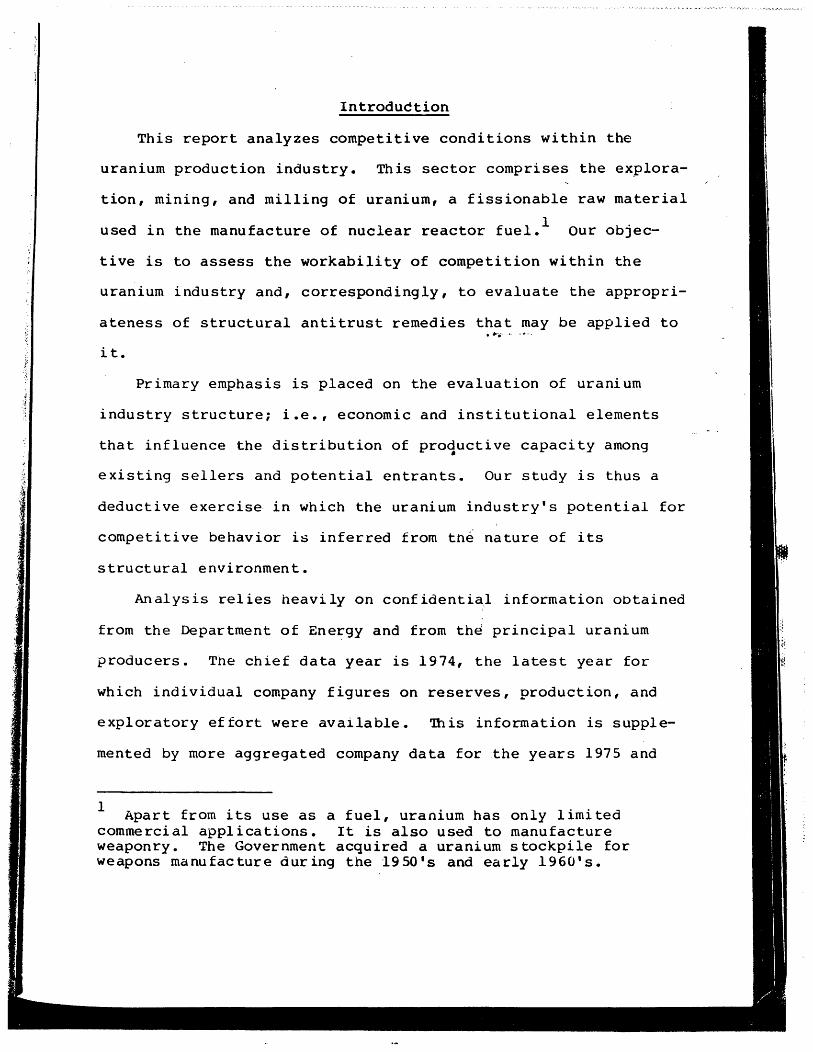
Introduction
This report analyzes competitive conditions within the
uranium production industry. This sector comprises the eX91ora-
tion, mining, and milling of uranium, a fissionable raw material
used in the manufacture of nuclear reactor fuel. l our objec-
tive is to assess the workability of competition within the
uranium industry and, correspondingly, to evaluate the appropri-
ateness of structural antitrust remedies that may be applied to '~ •... - .. -.
it.
Primary emphasis is placed on the evaluation of uranium
industry structure; i.e., economic and institutional elements
that influence the distribution of productive capacity among • existing sellers and potential entrants. Our study is thus a
deductive exercise in which the uranium industry's potential for
competitive behavior is inferred from tne nature of its
structural environment.
An alys is reI ies heavi lyon conf identia,l information obtained
from the Department of Energy and from th~ principal uranium
producers. The chief data year is 1974, the latest year for
which individual company figures on reserves, production, and
exploratory effort were available. This information is supple-
mented by more aggregated company data for the years 1975 and
I Apart from its use as a fuel, uranium has only limited commercial applications. It is also used to manufacture weaponry. The Government acquired a uranium stockpile for weapons manufacture during the 1950's and early 1960's.
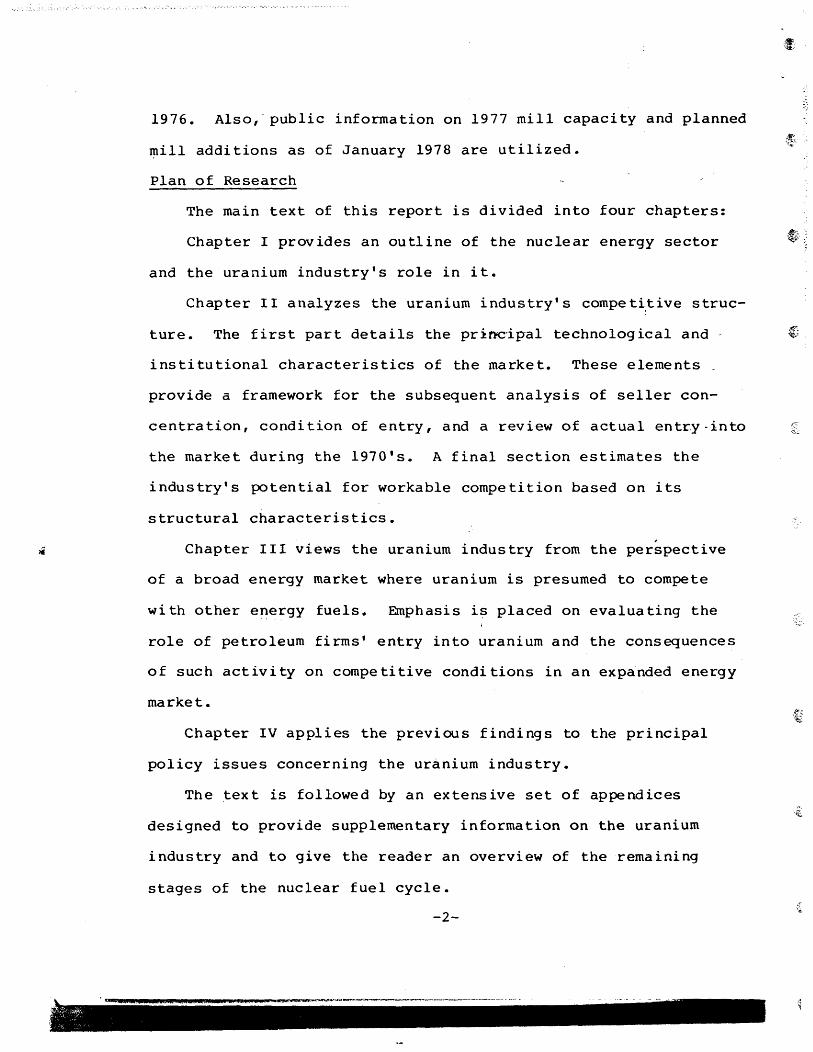
1976. Also,' public information on 1977 mill capacity and planned
mill additions as of January 1978 are utilized. ~.
Plan of Research
The main text of this report is divided into four chapters:
Chapter I provides an outline of the nuclear energy sector
and the uranium industry's role in it.
Chapter II analyzes the uranium industry's competi,tive struc-
ture. The first part details the princip-al technolog ical and -
institutional characteristics of the market. These elements _
provide a framework for the subsequent analysis of seller con-
centration, condition of entry, and a review of actual entr.y -into
the market during the 1970's. A final section estimates the
industry's potential for workable competition based on its
structural characteristics.
Chapter III views the uranium industry from the perspective
of a broad energy market where uranium is presumed to compete
with other energy fuels. Emphasis i~ placed on evaluating the
role of petroleum firms' entry into uranium and the consequences
of such activity on competitive conditions in an expanded energy
market.
Chapter IV applies the previous findings to the principal
policy issues concerning the uranium industry.
The text is followed by an extensive set of appendices
designed to provide supplementary information on the uranium
industry and to give the reader an overview of the remaining
stages of the nuclear fuel cycle.
-2-
Appendix A contains a set of statistical tables that supple-
ment information presented in the text.
Appendix B analyzes the competitive implications of joint
venture activity within the uranium industry.
Appendix C provides a summary of mergers and acquisitions in
the uranium industry since 1955 and discusses integration across
the various stages of the nuclear fuel industry. • ,1>".'. ---.
Appendix D describes the data collect1on procedures utilized
in this study.
A Note on the Identity of Government Regulatory Agencies
The identity of Government agencies involved in the nuclear
energy sector has changed a number of times during the period
this report was in preparation. In 1975 the Atomic Energy
Commission (AEC) was divided into the Energy 'Research and
Development Administration (ERDA), to develop and promote all
forms of energy; and- the Nuclear Regulatory Commission (NCR), to
oversee aspects of nuclea~ power dealing wi~h safety. In 1977,
ERDA was subsumed under the newly created Department of Energy
(DOE). In the interest of chronological consistency, this report
will refer to each of these agencies in its relevant historical
context.
-3-
l I
Summary of Findings l
1. Analysis indicates that the uranium industry is
currently structured in a workably competitive manner. In ~ .-
particular, the uranium market exhibits neither high concen-
tra tion nor impeded entry, two necessary cond i tions for mono-'
polistic performance. In regard to concentration, there exists a
sufficiently large and diverse group of producers with supply
capacity necessary to satisfy the needs of electric utilities " ...... -.-.
(the chief purchasE!rs of uranium). Investigation of the
principal sources of entry barriers--economies of scale, capital
requirements, and potential resource monopolization--indicates
that they do not constitute significant impediments to entry' into
uranium supply. This latter finding is supported by the record
of extensive entry that has recently taken place in response to
the marked rise in uranium price over the 1973-74 period.
2. Petroleum firm entry into uranium, while high, does not,
at present, represent a significant threat to competition. This
conclusion follows irrespective of:whether competition is viewed
from the perspective of the uranium market or a wider energy
market where a number of energy fuels are presumed to compete
with each other. Overall energy diversification efforts by
petroleum firms have been of such a relatively diverse nature
that concentration in relevant energy submarkets has remained
low. In the absence of identifiable anti-competitive effects
1 More detailed summaries are presented in chapters II and I II.
-4-
from energy diversification efforts, petroleum firm entryinto~ uranium ,seems
best viewed in a pro-competitive light since this activity has led to
considerable enlargement of the industry's productive capacity.
3. The above findings suggest that the most appropriate antitrust posture
at present is one of sunveillance rather than attempts at modification of
the industry's structure. Those competitive difficuf .. ti~s._that do arise
in the uranium sector will most likely stern fram lower than expected demand
levels (leading to seller exit)rather than to correctable structural defects.
-5-
't'f' "~'I
I
Chapt~r I
The Nuclear Energy Sector: An Overview
Nuclear energy is utilized to generate electricity through
the nuclear fission of uranium. Fission is a nuclear reaction in
which the nucl~us of the fuel atom is split by a neutron, thereby $,
releasing the energy that binds the nucleus together. During
fission, additional neutrons are released that continue the
energy-liberating process in a "cha·tnoreaction." If nuclear_fuel
is concentrated in sufficient quantity, known as the "critical
mass," the fission process can be sustained at controlled levels
of power.
Uranium-235 is the only naturally occurring, readily
fissionable material, and it is currently the primary nuclear
fuel commercially utilized in the, United States. This isotope is
relatively rare, constituting less than 1 percent of natural
uranium. Virtually all of the remainder is uranium-238. During
the fuel produc tion process, na tur~l ur an ium is tIe nriched" to
increase the concentration of uranium-235 atoms. The final fuel
product still contains considerable amounts of uranium-238 and
some thorium-232. These are both "fertile" materials that may be
converted into fissionable isotopes (plutonium-239 and
uranium-233, respectively) upon capture of an additional neutron.
Each time a fuel atom is split an average of 2.43 neutrons are
released. Since only one additional neutron is required to
sustain a chain reaction, extra neutrons are available to convert
fertile atoms present in the fuel into fissionable atoms.
-6-
,~ '4;:;'
.+
In present vintage reactors, many of these extra neutrons are
absorbed in other reactor materials (fission products, control
rod material, and structural parts of the reactor). These
reactors are known as "converters," meaning that they operate
with a net loss of fissionable material. About six atoms of new
fissionable material are formed for every ten atoms of original
fissionable material consumed. This is referred to as a "con-t ~ •.• ---.
version ratio" of 0.6. As the uranium-235 fuel is periodically
depleted below the critical concentration in a converter reactor,
the reactor plant is reloaded with new fuel. The unused portion
of the old fuel may then be "recycled."
Two potential improvements in the utilization of nuclear
power are the breeder reactor ~nd fusion. In the breeder
reactor, neutron losses are minimized to the extent that it
becomes possible .to operate wi th a net gain in fissionable
material. The generation of energy through fusion would do away
completely with the need for uranium since it entails the
combination of two atoms of hydrogen, one of the earth's most
abundant elements. Neither of these processes is commercially
viable at present, a situation that is expected to continue
throughout the remainder of this century.
A. The Nuclear Fuel Cycle
To be capable of fission, uranium must undergo a series of
changes from raw ore to the finished fuel element that is loaded
into the core of a nuclear reactor. Once mined, raw ore is
-7-
"
:;"1"" , '
milled to separate the uranium (in a form commonly referred to a:
"yellowcake") from waste material. To increase its U-235 con-
tent, the yellowcake is converted into uranium hexafluoride gas
(UF6) and shipped to an enrichment plant where the concentra-
tion of U-235 atoms is increased by a gaseous diffusion process.
The enriched gas is converted into solid pellets of uranium
dioxide (U02) and inserted into the zirconium tubing that com-
prises the individual fuel elements. These tubes are then
bundled and loaded into the reactor plant. After a period 'of
reactor operation, the expended fuel elements are removed from
the reactor and processed to remove both unused uranium and any
plutonium that has been created from U-238 atoms during the
fission process. These recycled fuels may be utilized in-the
,I manufacture of new fuel elements', and the nonusable waste
disposed of in underground burial sites. 2 The nuclear fuel
cycle thus encompasses all of the activities related to reactor
fuel manufacturing, reprocessing,:transportation, and waste dis-
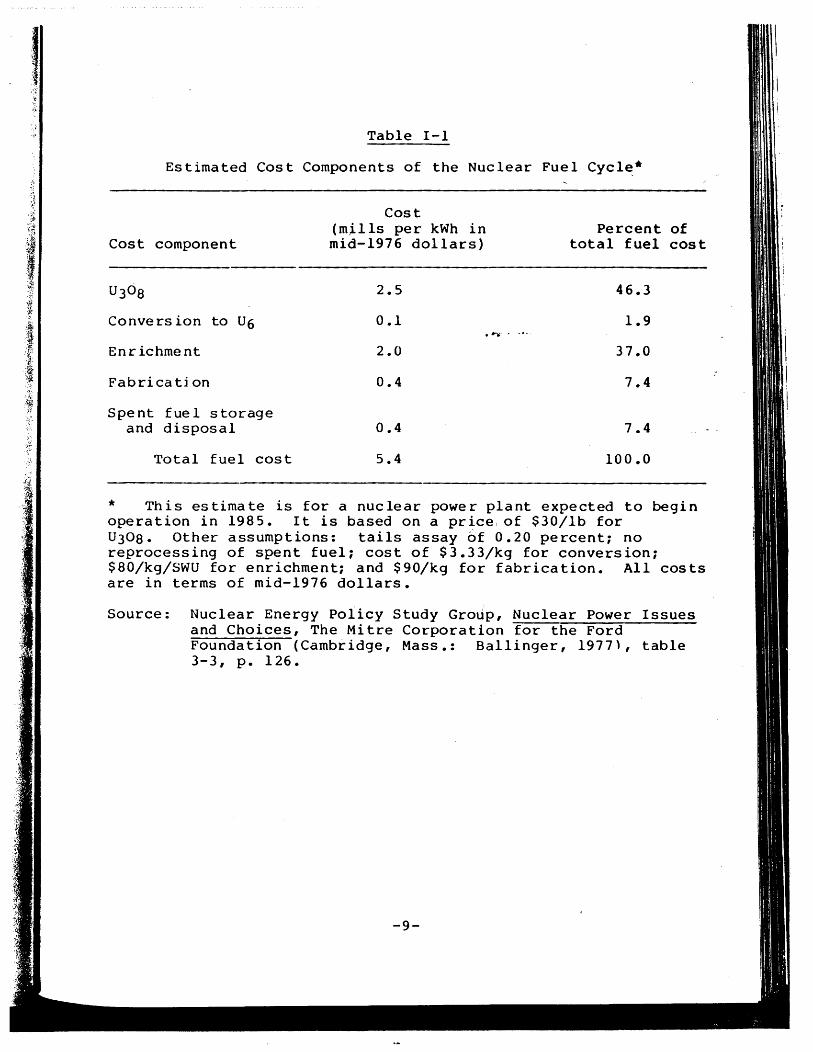
posal. An estimate of the relative costs entailed in each stage
of the cycle is presented in table I-I.
1 No recycling plants are currently in operation in the Un i ted Sta tes. Spent fue 1 is being stored in large cooli ng bath!
f:"
at reactor si tes and other locations pending Nuclear Regula tory ~:',
Commission (NRC) decisions with respect to the licensing of proposed facilities.
2 As with recycling, radioactive waste burial awaits the 1 icens ing of appropr ia te si tes by the NRC.
-8-
•... -~
Table I-I
Estimated Cost Components of the Nuclear Fuel Cycl~*
Cost component
Convers ion to U6
Enr ichment
Fabrica ti on
Spent fuel storage and disposal
Total fuel cost
Cost (mjlls per kWh in mid-1976 dollars)
2.5
0.1 . /j>l-., . -.-.
2.0
0.4
0.4
5.4
Percent of total fuel cost
46.3
1.9
37.0
7.4
7.4
100.0
* This estimate is for a nuclear power plant expected to begin operation in 1985. It is based on a price, of $30/1b for U308. Other assumptions: tails assay of 0.20 percent; no reprocessing of spent fuel; cost of $3.33/kg for conversion; $80/kg/SWU for enrichment; and $90/kg for fabrication. All costs are in terms of mid-1976 dollars.
Source: Nuclear Energy Policy Study Group, Nuclear Power Issues and Choices, The Mitre Corporation for the Ford Foundation (Cambridge, Mass.: Ballinger, 1977), table 3-3, p. 126.
-9-
""l i
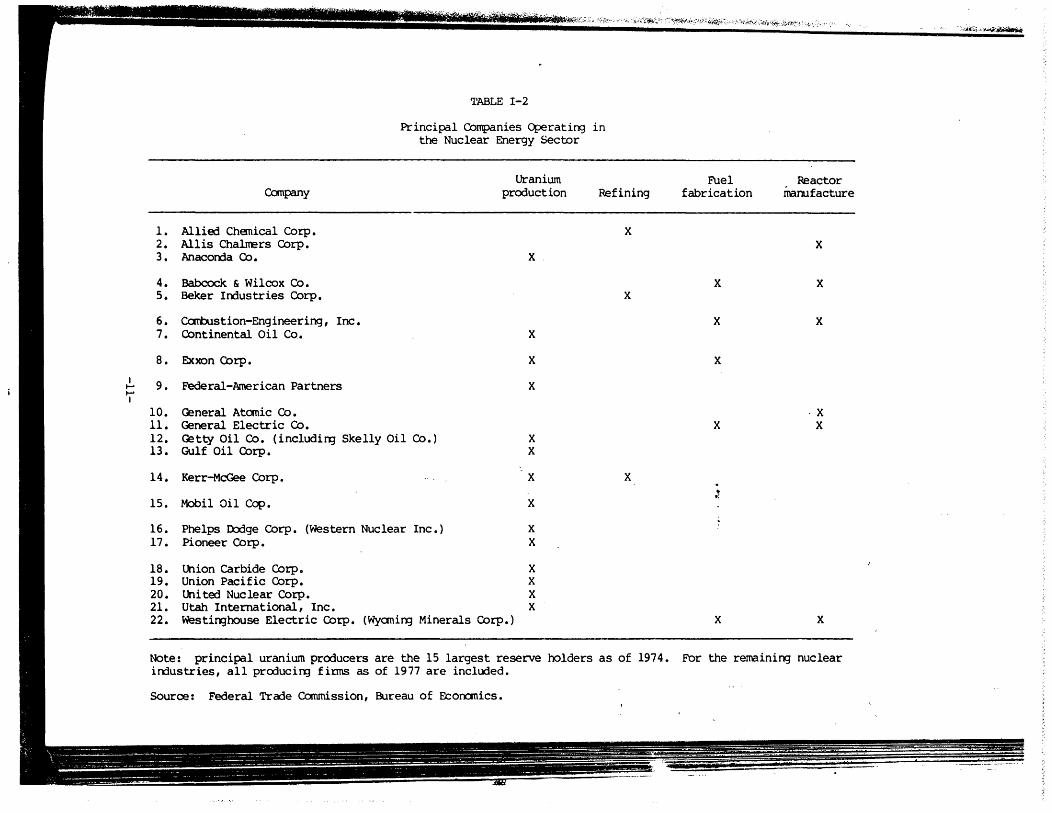
B. Industrial Organization
The nuclear energy sector encompasses two principal sub~
sectors: the nuclear fuel cycle and reactor manufacture. Five
distinct industries comprise the fuel cycle: uranium production,
refining, enrichment, fabrication, and reprocessing of spent
fuel. At present, the enrichment stage: is a Government monopoly
and no reprocessing activi ty is curr&h'tly being undertaken.
Table 1-2 lists the principal producers in the remaining segments
of the fuel cycle along with those engaged in reactor manu-
facture.
The chief focus of this report is the uranium production
industry. It is composed of three segments, exploration, mining,
and milling. The final product is ,a uranium concentrate
(U308) which is shipped to refining plants. The industry is
relatively young. Its history as a separate sector begins in
1946. As sole purchaser of mill output during the 1956-66
period, the u.s. Government played a significant role in
determining the industry's structure and performance. After that
time, the uranium industry gradually made the transition to a
private market with relatively little Government intervention.
During most of the 1966-72 period, the industry was in a dormant
state as low prices and an uncertain future di~couraged the
expansion of productive capacity. This situation began to change
in 1972 when rising oil prices significantly increased the
-10-" ~;
I ...... ...... I
TABLE 1-2
Principal OOmpanies Operating in the Nuclear Energy Sector
Uranium canpany production Refining
1. Allied Chanical Corp. X 2. Allis Chalrrers OOrp. 3. Anacon::1a 00. X
4. Babccx:k & Wilcox 00. 5. Beker In::1ustries Corp. X
6. Combustion-Engineering, Inc. 7. Continental Oil Co. X
8. Exxon Corp. X
9. Federal-American Partners X
10. Ceneral Atonic 00. 11. Ceneral Electric Co. 12. Cetty Oil Co. (including Skelly Oil Co.) X 13. Gulf Oil Corp. X
14. Kerr-McGee Corp. X X
15. Mobil Oil Ccp. X
16. Phelps n:rlge Corp. (Western Nuclear Inc.) X 17. Pioneer Corp. X
18. union carbide Corp. X 19. Union Pacific Corp. X 20. united Nuclear Corp. X 21. Utah International, Inc. X 22. Westirghouse Electric OOrp. (Wyaning Minerals Corp.)
Note: principal uranium producers are the 15 largest reserve holders as of 1974. in::1ustries, all prcrlucing firms as of 1977 are included.
Source: Federal Trade Commission, Bureau of Econ:rnics.
'~·''''~''''4~
Fuel Reactor fabrication manufacture
X
X X
X X
X
·X X X
t 0:
X X
For the remaining nuclear
T
•
economic attractiveness of nuclear generated electricity which
in turn led to an upsurge in uranium demand. The general
expectation is that the demand for uranium ~wi11 remain high
1 through the end of this ·century.
. ..... -.- .
1 See U. S. Department of Energy, Energy Information Administration, Annual Report to Congress, vol. II, 1977, DOE/EIA-0036/2, pp. 191-203.
-12-
--~;.
~.
Chapter II
The Economics of Uranium Supply
This chapter analyzes the economic structure of,the uranium
supply sector. Our aim is to evaluate the industry's potential
for workably competitive performance. We begin with a descrip-
tion of the uranium production process, focusing on the primary
factors that influence seller structure. Seller concentration
levels are then tabulated. Next, the chief ·sources of entry
barriers are described and their importance evaluated. We then
examine the actual record of entry by analyzing the response of
producers and new entrants to the upsurge in uranium prices that
took place during the 1973-76 period. The final section sum-
marizes the evidence on structure and the conclusions that can be
drawn from it.
-13-
J , I
A. Characteristics of the Industry
1 1. The Production Process
The uranium production process involves three principal
activities:
a. exploration, encompassing the search for uranium deposits and the determination of their commercial value;
b. mining of the uranium ore; and
c. milling of the raw ore into uranium concentrate~
In the sections which follow, each of these activities is des-...... ---. cribed in greater detail.
a. Exploration. The first step in a successful mining ven-
ture is the discovery of a mineral deposit worth mining. Uranium
makes up only about two parts per million of the earth's crust,
and while traces of it are found almost everywhere, economically
recoverable deposits in the United States have been discovered
mainly in veins and in flat, irreguiar, tabular, sandst~ne
bodies. Discovered deposits generally range in thickness from a
few feet to about 100 feet, and in depth from surface outcrop-
pings to about 4,000 feet below ground. The physical property
commonly associated with uranium, its radioactivity, provides an
important aid in exploration. Geiger and scintillation counters
can detect the rays and particles emitted by uranium at con-
siderable distances, thereby enabling aerial as well as ground
reconnaissance.
1 Much of the information discussed in this section is based on J. F. Hogerton, Atomic Fuel (New York: Reinhold, 1963) and Electric Power Research Institute (EPRI), Uranium Price Formation (Palo Alto, 1977) (hereinafter cited as Uran1um Pr1ce Format10n).
-14-
~-
Uranium exploration is a protracted and risky undertaking.
Based on past prices and considering all firms collectively,
there is evidence that suggests four to six years as representa-
tive of the average time period necessary to discover a commer
cial ore body.l During this period, the nature of explora-
tory activity varies. At first, a general reconnaissance of many
different potential prospects is undertaken. Usirtg existing
geological information and data gathered from air and ground
surveys, prospective areas of mineralization are delineated • . ~ ... -.-.
The most promising of these areas is then investigated more
thoroughly. Land acquisition usually precedes this intensive
survey. If the discovery is on land in the public domain, a
claim is staked, and a record of the claim and its location is
filed at the county courthouse. If the discovery is on privately
owned land, the property is leased if possible. Detailed
geologic studies are then unqertaken. These include surface
mapping, sample taking and the preparation of subsurface maps by
projecting data that have been obtained from, examination of the :
surface and exploratory penetrations of the ground.
The value of a deposit is estimated by taking samples at
enough points to reflect the size and grade of the deposit.
Exploratory penetrations are made by drilling small holes or by
excavating underground workings large enough for men and
1 A. E. Jones, Manager, Grand Junction Office, AEC, Remarks to the Ninth Annual Minerals Symposium, Moab, Utah, May 1964, reprinted in Private Ownership of Special Nuclear Materials, 1964, p. 180.
-15-
equipm~nt to enter. The latter method is more expensive, but ,
often yields higher quality information. Drilling is usually
done with core, rotary, pneumatic percussion, and churn drills.
Core drilling is the most expensive but often is the most '
informative type of drilling. The drilling strategy used in
exploration depends upon the type of deposit. For deposits
located near the surface of the ground, sample drilling can be
closely spaced ,at low cost. For deep, subterranean deposits,-
fewer, more selectively chosen hol~gare drilled.
After evaluating data from gamma-ray logs, drill hole and
channel sample assays, and descriptions of the logged or sampled
areas, a decision is reached regarding which of the deposits (if
any) are worth developing. The exploration cycle is thus charac-
terized by increasingly intensive examination of an increasingly
diminishing number of prospects until a decision is reached
regarding development.
Having settled upon an area to be developed, additional
drilling is undertaken to determine the best method for removing (
the ore. The topography, elevation, climate, availability of
water, and the general geologic environment must be considered in
determining the kind and extent of effort to be expended. The
extractive technique adopted will differ depending upon the
characteristics of the property. If the ore is to' be removed
using open-pit methods, a large volume of over-burden must then
be removed~ In the case of subterranean deposits, shafts and
adits must be dug. Additional facilities (roads, buildings,
etc.) must also be constructed.
-16-
{.
The time frame during which these activities occur exhibits
considerable variation. One survey showed periods of two to
seven years betwe~n the beginning of development work and the
first commercial productfon. Based on historical experience and
.~ thus reflecting past price expectations, the AEC estimated
,.
between four and six years as the average development period for
a uranium mining operation. l
b. Mining. Uranium ore is mined in much the same way as
¥. other minerals, although there are variations to fit the unusual
~ characteristics of uranium deposits in sandstone, the kind of
deposit from which most domestic production has been drawn. Coal
mining technology is not directly applicable, for example,
because uranium ore. bodies, although similar to coal deposits in
their flat-lying attitude ar~ harder, smaller, and more irregu-
lar. In addition, because the uranium at anyone site is often
quickly depleted, mining operations must be highly mobile,
designed to permi t an inexpens ive and rapid: conclusion of
digging.
The principal mining methods are open-pit and underground
with open-pit accounting for a slight majority (55 percent) of
2 total mine output. Open-pit mines are generally limited to
1 A. E. Jones, Private Ownership of Special Nuclear Materials, OPe cit., p. 181.
2 Uranium Price Formation, ~. cit., pp. 6-12.
-17-
a depth of 300 feet while underground mines have gone to depths
of greater than 5,000 feet. Solution mining, principally in the
forms of in-situ and heap leaching, is a third form of uranium
extraction. It is a relatively minor operation (accounting for
approximately 2 percent of total uranium output) that is
generally applied to low grade ore deposits that may not be
economically mined using conventional methods.
c. Milling. From the mine, raw .... o·r~-· is shipped by ore
carrier or rail to a mill where the uranium content is extracted
in the form of a concentrate called "yellowcake." Uranium
milling is basically a leaching process in which crushed raw ore
is subjected to the action of percolating sulfuric acid in a
series of perforated vessels to dissolve out gangue minerals.
Because raw uranium ore is bulky and has a high density (65 . 1 percent heavier than lead), it is expensive to transport.
Furthermore, only about .02 percent of tfie raw ore is recovered
.as yellowcake. For these reasons, processing mills are generally .-<.
located no more than 20 to 25 miles from mine sites. 2
1 See U. S. Bureau of Mines, "Uranium," Mineral Facts and Problems, 1970, p. 222.
2 For an extended discussion of uranium milling processes, see U.S. Department of the Interior, "Availability of Uranium at Various Prices from Resources in the United States," Bureau of Mines Information Circular (1971), pp. 76-81.
-18-
.~ 1 2. Cost Conditions l
~.
The nature of cost conditions differs significantly between
the exploration and mining-milling stages. Scale economies as
well as the required initial capital investment are substantially'
more important in mining-milling than in exploration. We briefly
review cost characteristics for each sector below.
Scale economies appear to be minor in the~exploration stage. '~ .... ---.
This situation largely reflects the relative unimportance of
f fixed investment in exploratory activity. Neither research and
development expenditures nor capital equipment, the two most com-
mon sources of scale related efficiencies, is a significant com-
ponent of the typical exploratory budget. Rather, drilling costs
constitute the most important expense component, accounting for
over 40 percent of total exploration expenditures. f As a con-
sequence, the minimum investment outlay necessary for efficient
exploration effort is considered to be relatively low. Recent
estimates of a "reasoRable" minimum exploration budget range from
$3 to $8 million. 3
1 This section utilizes cost information presented in Uranium Price Formation, ~. cit., chapters 5 through 7.
2 Ibid., table 5-6, pp. 5-25.
3 Ibid., pp. 5-41.
-19-
i •
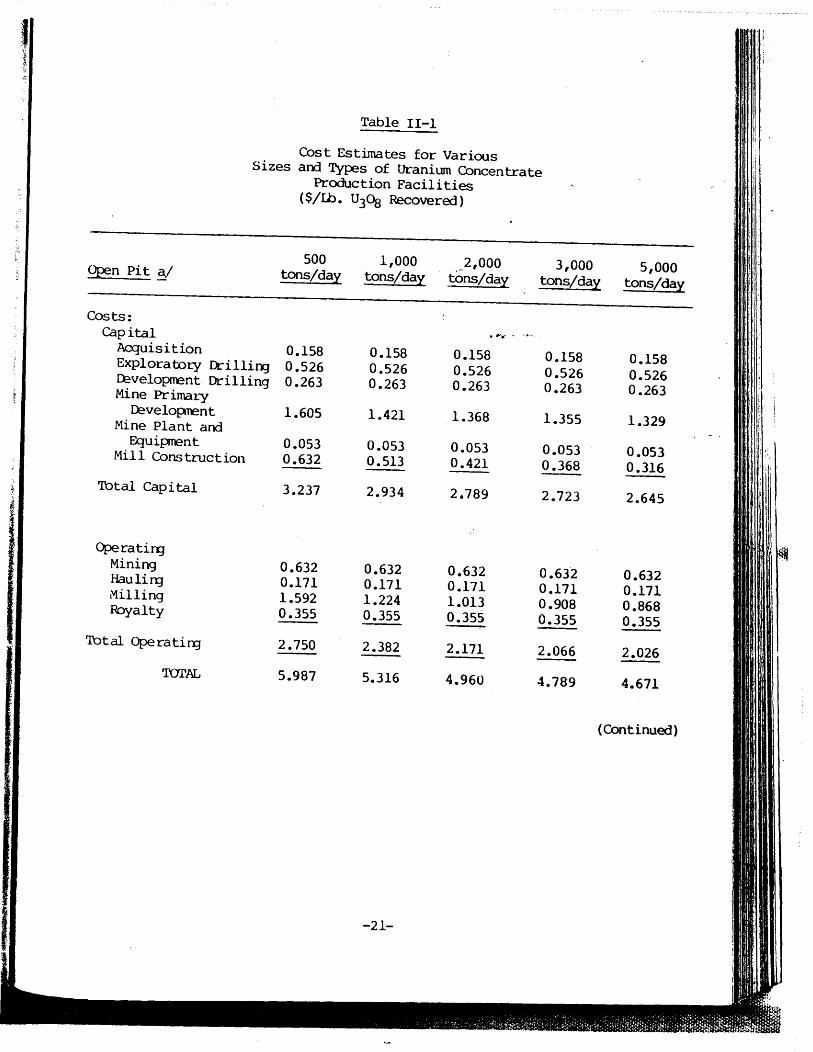
On the other hand, cost factors potentially constitute an
important determinant of seller structure in the mining and
milling stages. Cost estimates developed by ERDA suggest that
there may be significant economies of scale at the plant level in
uranium mining and milling. l ERDA defines a plant as a
processing mill plus a set of mines supplying the mill with ore.
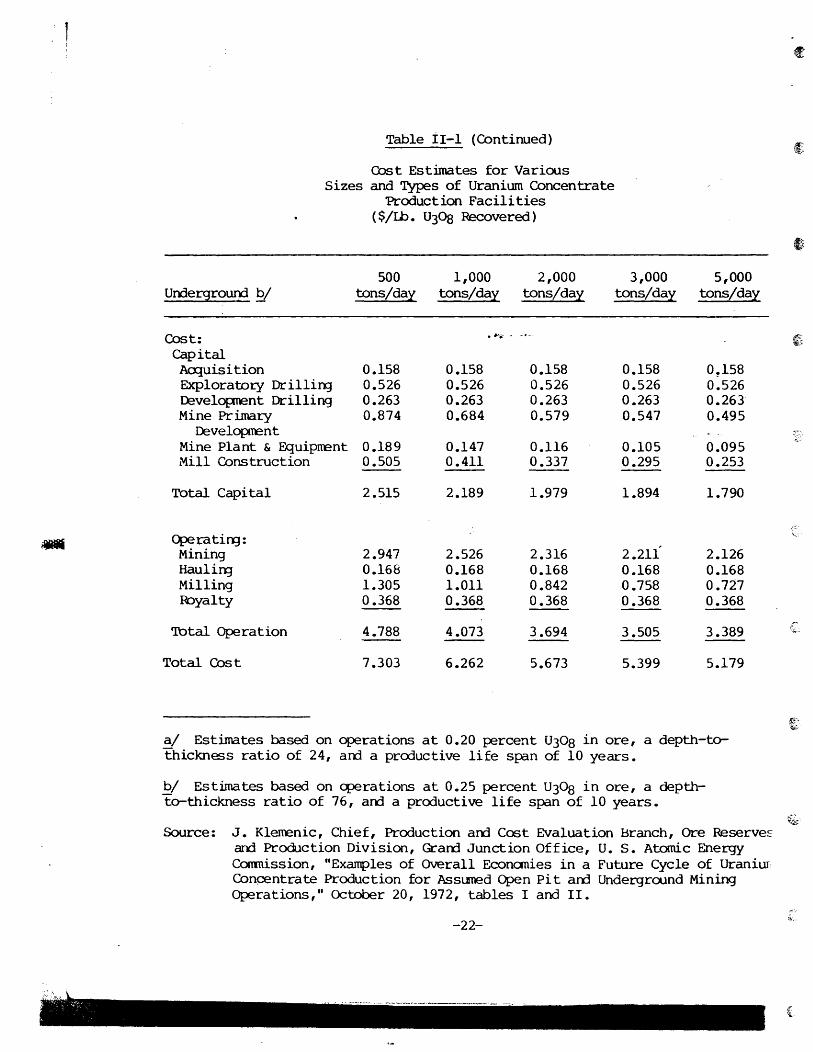
Table 11.1 presents ERDA's estimates of the capital and operating . ..... . -.~.
costs (per pound of U308 recovered) associated with various
planned rates of output for open-pit and underground mining -and
milling operations. These estimates indicate that the average
cost of producing yellowcake declines at a decreasing rate -with
the size of the venture, regardless of the type of mining
operation. Three factors account for declining average cost:
the costs associated with mine de-velopment; equipment costs in
underground mining operations; and, most importantly, the costs
of constructing and operating a mill.
Scherer has described t'he basis of scale economies in a
"process" operation like uranium milling in the following terms:
1 We focus exclusively on individual plant economies in this discussion. Multiple-plant, or firm, economies are not a significant factor in the uranium sector. As of 12/31/77, only three milling companies maintained more than one plant: Union Carbide and General Electric had two plants each; United Nuclear owned one plant outright and possessed a joint venture interest in another. The combined market share of these multi-plant companies was 28.6 percent of total mill capacity. [Mill capacity ownership is presented in appendix table 1, American Petroleum Institute, The Structure of the U. S. Uranium Industry and the Role of Petroleum Firms (Washington, 1978), table 6, p. 24.]
-20-
~.:
tr;:. ~;.
t·
,"
Table 11-1
Cost Estimates for Various Sizes and Types of Uranium Concentrate
Production Facilities ($/Ib. U3Ds Recovered)
500 1,000 ,~2,000 3,000 5,000 Open Pit ~/ tons/da~ tons/da~ tons/day tons/day tons/da~
Costs: Capital , ...... -.-.
Acquisition 0.158 0.158 0.158 0.158 0.158 Exploratory ~illing 0.526 0.526 0.526 0.526 0.526 Development Drilling 0.263 0.263 0.263 0.263 0.263 Mine Primary Developrent 1.605 1.421 1.368 1.355 1.329 Mine Plant and Equiptl'ent 0.053 0.053 0.053 0.053 0.053 Mill Construction 0.632 0.513 0.421 0.368 0.316
'lbtal Cap i tal 3.237 2.934 2.789 2.723 2.645
Operatirg Mining 0.632 0.632 0.632 0.632 0.632 Haulirg 0.171 0.171 0.171 0.171 0.171 Milling 1.592 1.224 1.013 0.908 0.868 Royalty 0.355 0.355 0.355 0.355 0.355 -
'lbtal Ope rati l'l3 2.750 2.382 2.171 2.066 2.026 Tal'AL 5.987 5.316 4.960 4.789 4.671
(Continued)
..
Table iI-l (Continued)
Cost Estimates for Various Sizes and Types of Uranium Concentrate
Production Facilities ($/Ib. U30s Recovered)
500 1,000 2,000 3,000 5,000 UrrlergrouOO !?/ tons/dal tons/dal tons/dal tons/dal tons/dal
Cost: ...... capital AexIuisition 0.158 0.158 0.158 0.158 0!158 Exploratory Drilling 0.526 0.526 0.526 0.526 0.526 Development Drilling 0.263 0.263 0.263 0.263 0.263 Mine Pr imary 0.874 0.684 0.579 0.547 0.495
Developnent Mine Plant & Equipment 0.189 0.147 0.116 0.105 0.095 Mill Construction 0.505 0.411 0.337 0.295 0.253
Total Capital 2.515 2.189 1.979 1.894 1.790
Cl>e ra ting : 2.211 Mining 2.947 2.526 2.316 2.126
HauliI'l3 0.168 0.168 0.168 0.168 0.168 Milling 1.305 1.011 0.842 0.758 0.727 lbyalty 0.368 0.368 0.368 0.368 0.368
'lbtal Operation 4.788 4.073 3.694 3.505 3.389
Total Cost 7.303 6.262 5.673 5.399 5.179
a/ Estimates based on operations at 0.20 percent U308 in ore, a depth-tothickness ratio of 24, am a prcrluctive life sp:ln of 10 years •
.!y Estimates based on cperations at 0.25 percent U308 in ore, a depthto-thickness ratio of 76, arrl a prcrluctive life span of 10 years.
Source: J. Klerrenic, Chief, Production arrl Cost Evaluation Branch, Ore ReserveE and Production Division, Grarrl Junction Office, U. S. Atomic Energy Corrmission, "Examples of OVerall Econanies in a Future Cycle of Uraniur ConGentra te Production for Assuned Open Pi t arrl Underground Mining Operations," October 20, 1972, tables I and II.
-22-
(f
f}
f; ,',
I~~ ,
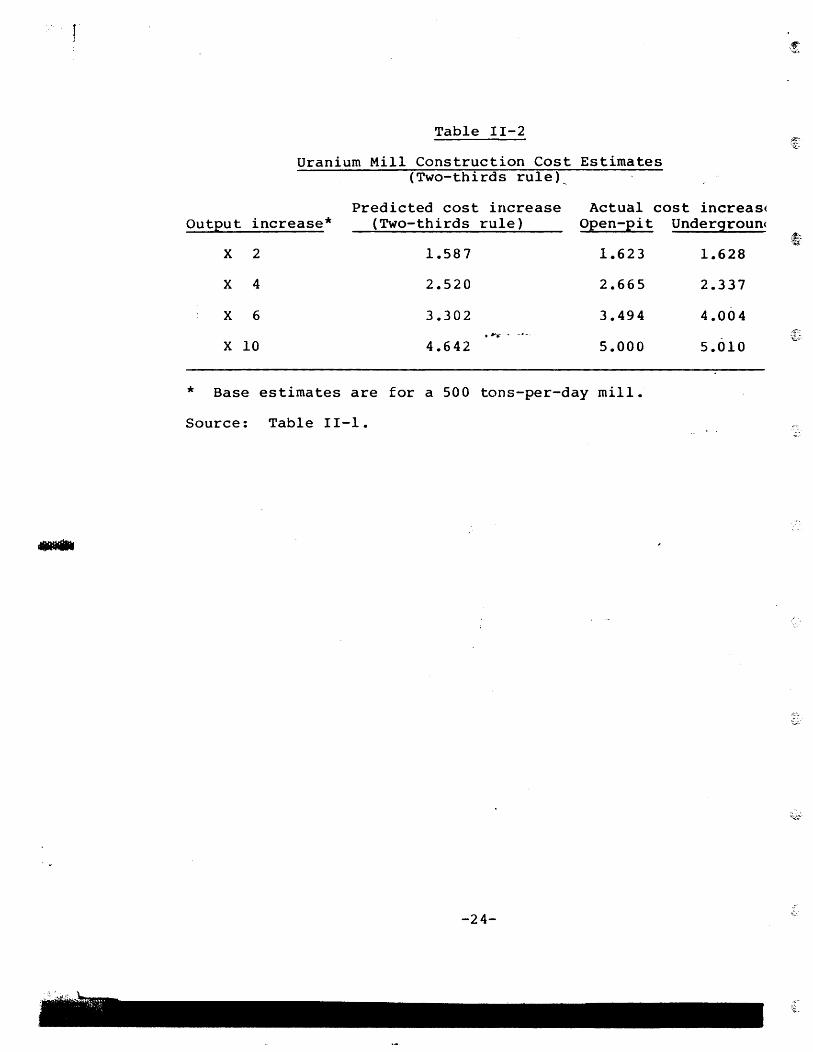
The output of a processing unit tends within certain physical limits to be roughly proportional to the volume of the unit, other things being equal, while the amount of materials and fabrication effort (and hence investment cost) required to construct the unit is more apt to be proportional to the surface area of the unit·s reaction chambers, storage tanks, connecting pipes, etc. Since the area of a sphere or cylinder of constant proportions varies as the two-thirds power of volume, the cost of constructing process industry plants can be expected to rise as the two-thirds power of their outp~t capacity, at least up to the point where they become""s'o-'large that extra structural reinforcement and special fabrication techniques are required. There is considerable empirical support for the existence of this two-thirds rule, which is used by engin~ers inlestimating the cost of new process equlpment.
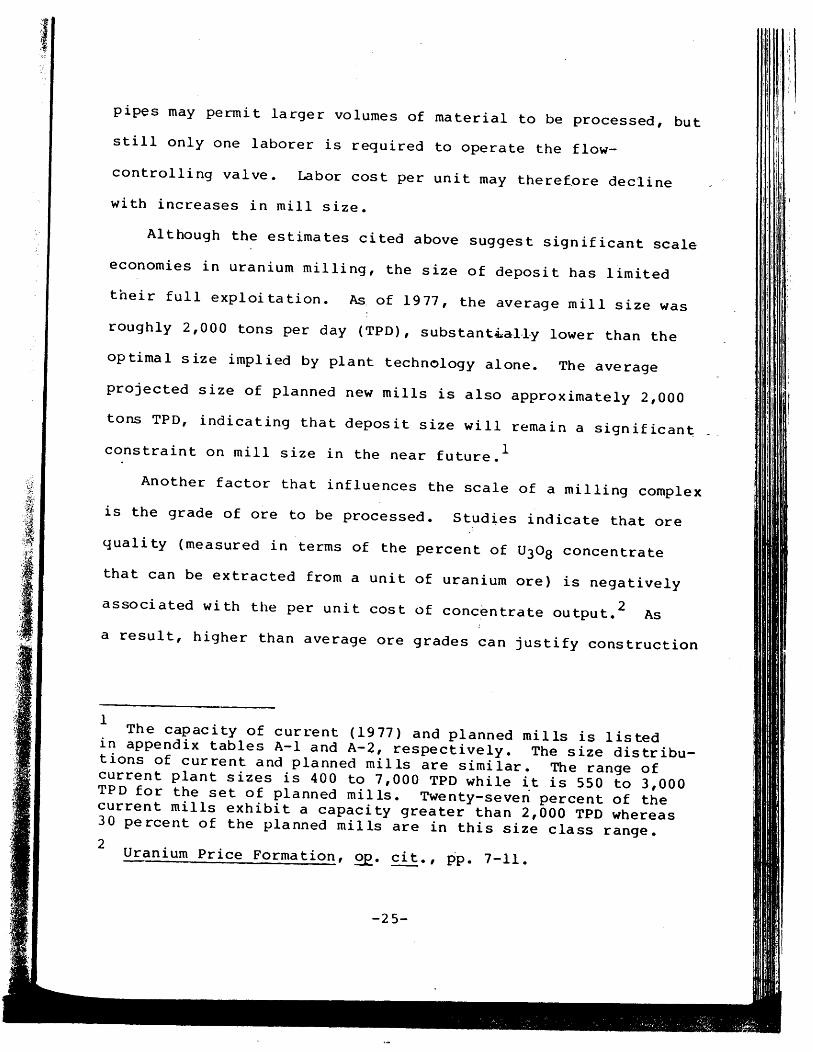
Table 11-2 presents estimates of the increase in total mill con-
struction costs associated with various output increases based on
the two-th irds rule, along wi th the actua.1 total mill cons truc-
tion cost increases derived from the estimates in table II-I.
The mill construction cost estimates in table 11-1 conform fairly
closely to the two-thirds rule.
The costs of operating a mill also decline with increases in
size according to the estimates in table II-I. These economies
derive from spreading fixed amounts of labor over larger volumes
of output. Consider the following representative illustration:
The flow of material between the leaching vessels is controlled
by a laborer operating a valve~ Larger vessels and connecting
1 F. M. Scherer, Industrial Market Structure and Economic Performance (Chicago: Rand McNally, 1970), p. 73.
-23-
,;1 I:
- .-
Table 11-2
Uranium Mill Construction Cost Estimates (Two-thirds rule),
Predicted cost increase Actual cost increas( Output increase* (Two-thirds rule) Open-pit Undergroun(
X 2 1.587 1.623 1.628
X 4 2.520 2.665 2.337
X 6 3.302 3.494 4.004 '~ .... -.-.
X 10 4.642 5.000 5.010
* Base estimates are for a 500 tons-per-day mill.
Source: Table II-I.
-24-
~
'.'. "j .1
pipes may permit larger volumes of material to be processed, but
still only one laborer is required to operate the flow-
controlling valve. Labor cost per unit may therefore decline
with increases in mill size.
Although the estimates cited above suggest significant scale
economies in uranium milling, the size of deposit has limited
thei r full exploi ta tion. As of 1977, the average mill size was
roughly 2,000 tons per day (TPD), sUbstanti.a1-I-y lower than the
optimal size implied by plant technology alone. The average
projected size of planned new mills is also approximately 2,000
tons TPD, indicating that deposit size will remain a significant _.
constraint on mill size in the near future. l
Another factor that influences the scale of a milling complex
is the grade of ore to be processed. Studies indicate that ore
quality (measured in terms of the percent of U3 0 8 concentrate
that can be extracted from a unit of uranium ore) is negatively
2 associated with the per unit cost of conc~ntrate output. As
a result, higher than average ore grades can justify construction
I The capacity of current (1977) and planned mills is listed
in appendix tables A-I and A-2, respectively. The size distributions of current and planned mills are similar. The range of current plant sizes is 400 to 7,000 TPD while it is 550 to 3,000 TPD for the set of planned mills. Twenty-seven percent of the current mills exhibit a capacity greater than 2,000 TPD whereas 30 percent of the planned mills are in this size class range. 2
Uranium Price Formation, £2. cit., pp. 7-11.
-25-
of relatively small mills. l Alternatively, the recent
increase in concentrate prices has encouraged producers to
utilize increasingly lower ore grades which in turn induces them
to build relatively large milling facilities.
Due primarily to the nature of the technology involved,
capital investment necessary for participation in the mining-
miliing stage is significantly higher than for exploration •. The
required investment expenditure for opening a 1,~00 TPD mine •
(including costs incurred for land acquisition, drilling and
associated mining plant and equipment) was estimated in 1972 at
$34 million for an open-pit mine and $31 million for an under-
d . 2 groun mlne. A 1974 cost estimate for mill construction
ranged from $18.6 million for 1,500 TPD capacity to $38.3 million
for 5,000 TPD capacity.3 Combining these estimates apd
adjusting them in terms of 1977 dollars,4 the minimum cost of
full scale entry into uranium concentrate production ranges from
$68.9 to $~8.2 million.
1 One example is the Cotter mill in Canon City, Colorado. This mill has a relatively low ore capacity of 450 TPD yet the quality of ore it processes is far above average. (Personal correspondence with DOE official John Klemenic, September 24, 1978. )
2 Uranium Price Formation, ~. cit., pp. 6-37.
3 Ibid., pp. 7~13.
4 The price defla tor for fixed, non-residential investment was used to adjust for inflation, Economic Report of the President (Washington, 1978), table B-3, p. 260.
-26-
~.
3 h d o ° 1 • Exc ange Con 1t1ons
Since the only non-military 'use for uranium is fuel for
nuclear power reactors, utilities constitute the sole group of
final private buyers. Sales of uranium concentrate by millers to
utilities are conducted either directly or through brokers and
2 reactor manufacturers. At present, utilities purchase prac-
tically all of their supplies directly. The earlier impor-• "'t;." • -" ~.
tance of reactor manufacturers as uranium purchasers declined
sharply as the utilities became experienced in the uranium
market. Due to the 10- to II-year leadtime between the decision
to build a reactor and its initial operation, utilities have con-
siderable flexibility in the timing of their uranium orders.
The bulk of contracts are long-term agreements for the
delivery of concentrate at some future date. Approximately 75
percent of uranium sales are of such a long-term nature while the
remainder are spot market transactions in which the uranium con-
centrate is delivered within a year of the:contract agreement.
Although a nuclear power reactor requires uranium for at least 30
years, contract terms typically are written for considerably
1 This section is based on the discussion in Uranium Price Formation, OPe cit., chapters 4 and 8; u.S. Dept. of Energy, Survey of UnItea-5tates Uranium Marketing Activity, May 1978, DOE/RA-0006; George White, Jr., "Procurement Mechanisms," Address at the ANS Sponsored Executive Conference on Uranium Fuel Supply, Montere~Calif., January 24, 1977.
2 Also, a relatively small amount of concentrate is sold to foreign buyers.
-27-
,!
I
'i
, .' '
~\~;~.:\:.~~~~::\~. ~4' ~~~''''~''''~ ,,co.
shorter periods. At present, the bulk of non-spot contracts are
f 5 10 . d . 1 rom to years 1n urat10n.
Uranium is sold under a variety of pricing provisions. / In
contrast to earlier periods when fixed price contracts were the
norm, most agreements now contain provisions for subsequent price
modifications keyed to changes in specified cost or price
indices. Coincident with this development has been an increase
in pre-production advances by purcha!:;~rs·-to millers as an aid -in
the financing of mine-mill complexes. Utilities have also begun
to enter more directly into the production stage through devel-
opment of exploration and production operations. At the begin-
ning of 1978, 30 utilities were identified as being directly
involved in uranium raw material activities. 2
1 Interview with DOE marketing specialist Jeff Coombs, July 25, 1978.
2 DOE, Survey of U.s. Uranium Marketing Activity, ~. cit., p. 15.
-28-
4. Resource Measures
DOE annually reports estimates of domestic "reserves" and
"potential resources" at various cost cutoffs. These estimates
are derived from information provided voluntarily by all known
uranium exploration and mining companies. DOE believes that its
total reserve universe figures include approximately 99 percent
of all existing reserves. "Reserves" are defined as:
the quantity of uranium {n known deposits which it is calcula ted can be economically pr~duc-ed within the stated cost. The quantity, grade and physical characteristics have been established with reasonable certainty by detailed sampling, usually by surface drilling initially, and later supplemented by underground drilling and sampling. l .
"Potential resources" are:
estimates of the quantity of uranium in addition to reserves that may exist in unexplored extensions of known deposits or in undiscovered deposits within or near known uranium areas. The estimates are based on extrapolations from explored to unexplored or incompletely studied areas applying favorability factors based on geologic evaluations. 2 ,
DOE's resources estimates indicate th~ quantity of uranium
which could be produced at or below a given cost per pound of
U30a. For purposes of estimation, these "forward costs
encompass operating and capital expenditures yet to be incurred
at the time an estimate is made. Excluded are profit, cost of
money, and sunk costs. In effect, forward costs primarily
1 U.S. Atomic Energy Commission, "Nuclear Fuel Resources and Requirements," WASH-1234,April 1973, p. 12.
2 Ibid., p. 15.
-29-
: i
:i !, '!
!I
, \
I ,\
I
, i I
r ,
reflect .. the shortrun variable costs of reproducing from a
developed facility ... l Thus, market prices higher than a
given forward cost level would be required to produce the
reserves at that cost level.
Table 11-3 shows reserves estimates for 1974, the latest
year for which reserves concentration ratios are. available, and
for 1977. The cumulative totals of reserves are listed for each
relevant forward cost category. These~cost groups ranged from $8
to $30 in .1974 and from $15 to $50 in 1977. Rising costs served
to eliminate the $8 reserves category for 1977 while the addition
of the $ 5U group reflects substantial rises in the price of. -.
uranium. Most of the higher cost reserves are adjacent to or
within areas of lower cost reserves. In 1974, for example, less
than 10 perc~nt of the $30 reserves were contained on deposits
2 h a v i ng 0 nl y $ 3 0 r e se rv e s •
DOE's "potential resources" category re~resents an estimate
of the amount of undiscovered uranium ore in areas about which
enough geological information exists to indicate the nature and
extent of the environmental conditions favorable for the
occurrence of uranium. The amount, specific location, and nature
of potential resources are inherently much less known than those
1 Paul Joskow, nComnercial Impossibility, the Uranium Market
' ... i.,"
and the Westinghouse Case," Journal of Legal Studies (Jan. 1977), € p. 124.
2 R. J. Meehan, "Uranium Reserves and Exploration Activity," U.S. Energy Research and Development Administration, Uranium Industry ~eminar, October 7-8, 1975, GJO-108 (75), p. 123.
-30-
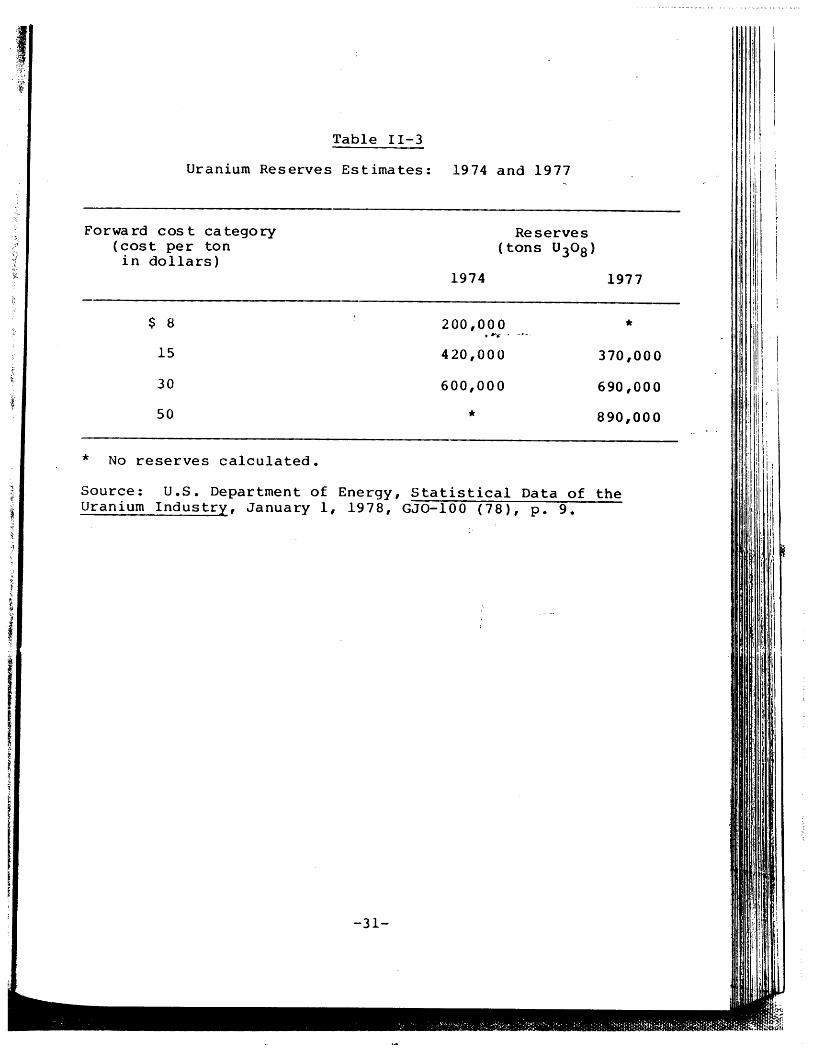
Table 11-3
Uranium Reserves Estimates: 1974 and 1977
Forwa rd cos t ca tegory (cost per ton in dollars)
$ 8
15
30
50
* No reserves calculated.
Reserves (tons U30 8 )
1974 1977
200,000 ,,.. ... 420,000
600,000
*
* 370,000
690,000
890,000
Source: U.S. Department of Energy, Statistical Data of the Uranium Industry, January 1, 1978, GJO-100 (78), p. 9.
-31-
of reserves. Table 11-4 lists potential resources estimates for
1977, distr~buted according to "probable," ~"possibte," and
"speculative" categories. Probable resources are those containe
within favorable trends largely delineated by drilling data
-within productive uranium districts. Possible resources are out
side of identified mineral trends but are in geologic provinces
and formations that have been prodtt'ctiv"e. Speculative resourcef ~.
are those estimated to occur in formations or geologic provinces
which have not been productive but which, based on the evaluatic
of available geologic data, are considered to be favorable- for
the occurrence of uranium deposits.
-32-
~"';;sr.~""" . .';"",,--.
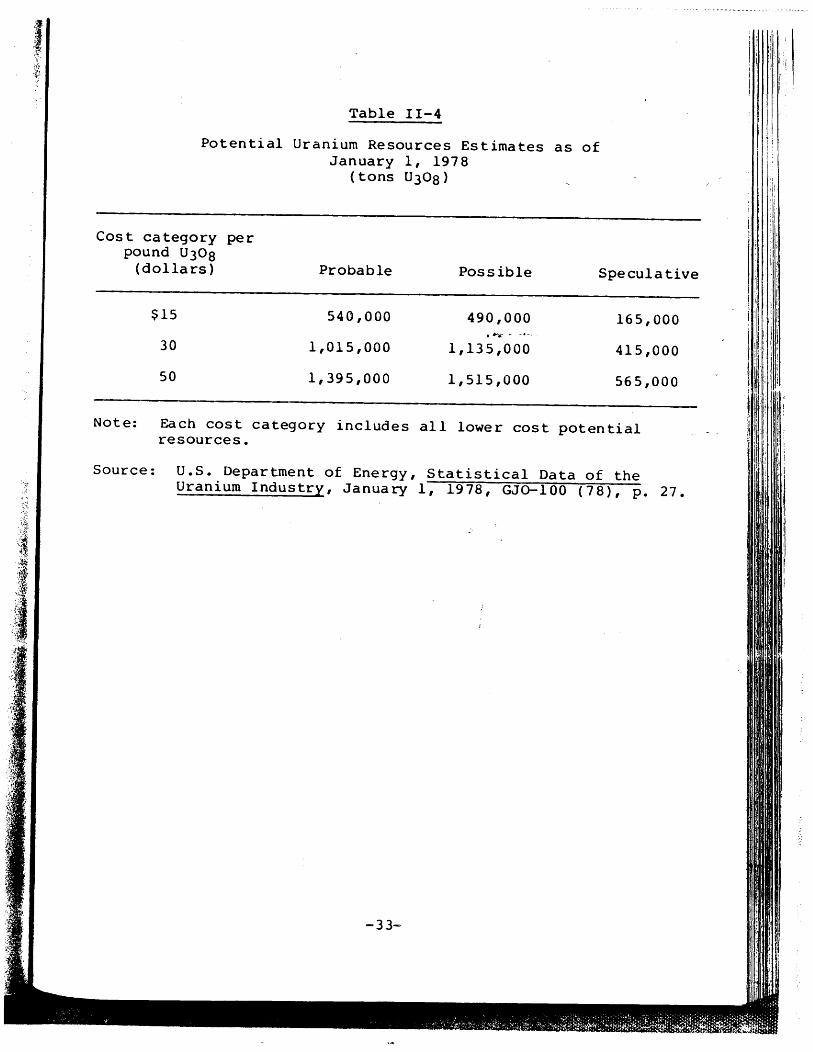
Table 11-4
Potential Uranium Resources Estimates as of January 1, 1978
(tons U308)
Cost category per pound U30 S
(dollars) Probable Possible Specula tive
$15 540,000 490,000 165,000 ,~-..- .. ---.
30 1,015,000 1,135,000 415,000
50 1,395,000 1,515,000 565,000
Note: Each cost category includes all lower cost potential resources.
Source: U.S. Department of Energy, Statistical Data of the Uranium Industry, January 1, 1978, GJo-lOO (7S), p. 27.
-33-
'i', ': : i
5. Vertical Integration
It is useful to distinguish among the following three types ~
of vertical integration in connection with the uranium sector:
integration within the production sector (i.e., vertical links
between the exploration, mining, and milling stages); forward
int~gration between the production sector and the downstream
stages of the fuel cycle, including reactor manufacture; and
production activities by electric ut~ljties. We examine each of
these elements in turn.
a. Vertical Integration Within the Production Sector. Integra--
tion between the mining and milling stages is high. As of 1970
(the latest year for which data are available), approximately 96
percent of uranium ore was captively mined by milling companies.
This level represents a sharp rise from earlier periods: Captive
production by milling companies was equivalent to 35 percent of
ore receipts in 1955, 64 percent in 1960, and 73 percent in
1965. 1 The causes of this pattern are governmental, geo-
logical, and economic.
A number of Goverrunent policies, operative during the 1950's
and early 1960's, which were designed to help small explorers and
producers also led to artificially low integration levels. In
addition to overall price guarantees for the ore, particularly
important were a transp:>rtation allowance for the haulage of raw
1 J. P. Mulholland and D. W. Webbink, Concentration Levels and Trends in the Energy Sector of the U.S. Economy, Staff Report to the Federal Trade Commission (March 1974), pp. 164, 219.
-34-
ore to the mill and a regulation that each mill save a portion of
its capacity for independent miners. The termination of these
programs led to the exit of a number of smaller independent
miners and a subsequent rise in vertical integration.
A significant rise in the size of uranium deposits dis-
covered during the late 1950's stimulated gre~ter emphasis on the
development of integrated ,mine-mill complexes. Previously,
millers were forced to acquire ore from a number'of different
small mines, many owned by independents, in order to operate at
efficient scale. As the size of deposit increased, there was
less need for such purchases. l
Complementing the first two factors is the ability of verti-
cal integration to avoid costs of market transactions entailed in
the interactions between the mining and mill~ng' stages. Scherer
lists the potential efficiencies associated with integrated
operations vis-a-vis reliance on the market:
1
Integration may permit significant real ~conomies in transferring goods from one stage to another-i.e., minimizing of sales representation and contracting functions, better coordination of production with requirements, streamlining of distribution channels, lower spoilage, etc. It can also be a means of ensuring the availability of supplies in boom periods, or when suppliers are struck by labor union disputes. And given that transfer prices under bilateral oligopoly must be established through bargaining, vertical
Uranium Price Formation, ~. cit., pp. 8-35.
-35-
'.'1~ ~
integration may be a way of avoiding the stalemates (with consequent sUP~ly interruptions) otherwise likely to arise.
: " .. - ... ~ ~. ~.- - - - ~ ... ~
Notwithstanding the above, there are~recent signs t~at
independent mining operations are increasing in importance. 2
If so, this development reflects the influence of an important
economic law: The division of labor is limited by the extent of
the market. As the size of the uranium sector grows, the scope
for specialized operation, such as,.."ind.ependent mines and mills,
may also increase. Such a development is not inevitable;
rather, it occurs only if the efficiency gains from independent
operations outweigh the market associated transactions costs
noted by Scherer.
b. Forward Integration. Table 11-5 outlines the vertical links
that currently exist between uranium producers and downstream
stages of the nuclear fuel cycle (including reactor manufacture)
The most prevalent contacts are made in the fuel fabrication
sector where six uranium producers maintain productive capacity.
Two producers are engaged in reactor manufacture and one
participates in the uranium refining stage. In addition, a
number of producers have expressed interest in expanding into
these downstream sectors and also into uranium enrichment if the ~
Government decides to allow private operations. 1
1 Scherer, OPe cit., p. 247.
2 uranium Price Formation, £E. cit., pp. 8-36.
3 See appendix C, table C-3.
-36-
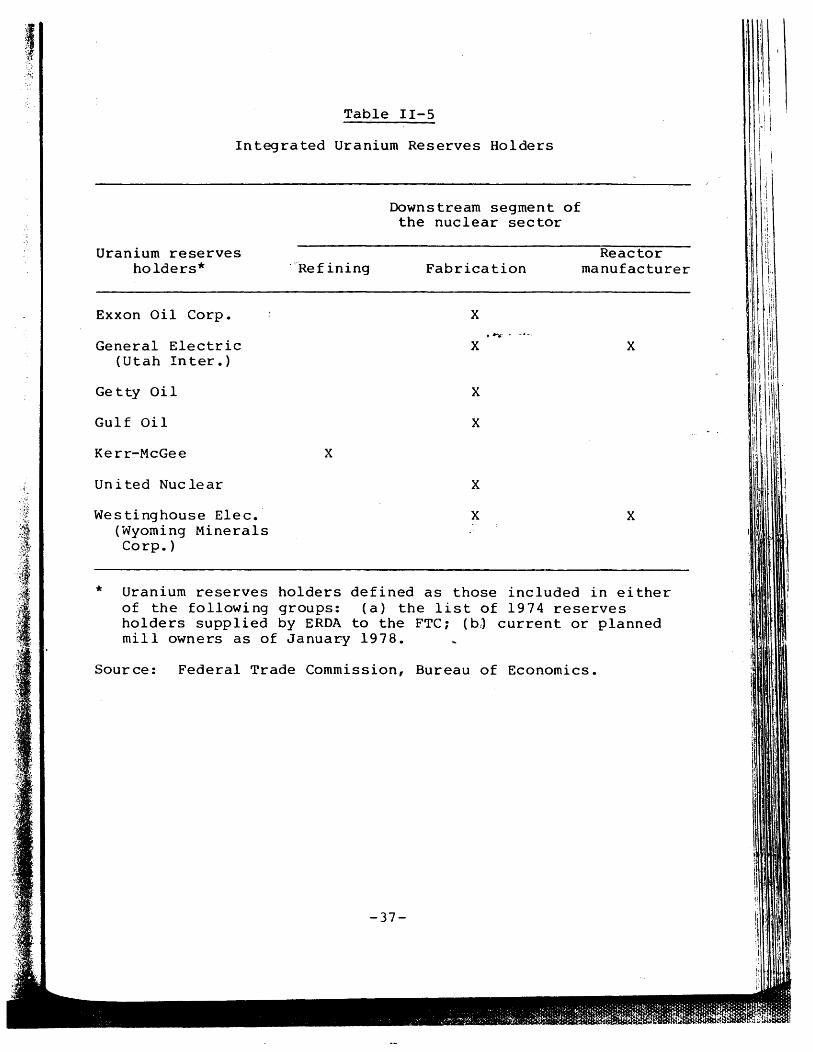
Table 11-5
Integrated Uranium Reserves Holders
Uranium reserves holders*
Exxon Oil Corp.
General Electric (Utah In ter. )
Getty Oil
Gulf Oil
Kerr-McGee
Un i ted Nuc Ie ar
Westinghouse Elec.' (Wyoming Minerals Corp. )
'-Ref ining
x
Downstream segment of the nuclear sector
Fabrication
x ...... X
X
X
X
X
Reactor manufacturer
X
x
* Uranium reserves holders defined as those included in either of the following groups: (a) the list of 1974 reserves holders supplied by ERDA to the FTC: (bJ current or planned mill owners as of January 1978.
Source: Federal Trade Commission, Bureau of Economics.
-37-
.:
!
I·
I I! !
ii, '
At present,the vertical links maintained by producers have no
effect on the organization of the uranium production industry. ~
.There are no technological interrela tionships betwe,en sectors
that would give integrated producers a cost advantage over non-
integrated producers. Moreover, current marketing practices
serve to isolate the production phase from downstream sectors
since utilities purchase the bulk of their uranium supplies from
the mill, contracting independently for the remaining stages of
the nuclear fuel cycle. Reactor manufacturers, once important
marketers of nuclear fuel, now playa minor role.
It is possible that future institutional arrangements may
result in an environment where vertical integration may influence
structure in the production sector. For example, "privatization"
of the enrichment sector would allow companies to process their
raw ore through the entire fuel cycle. If ,utilities found it
economically advantageous to purchase the final nuclear fuel
product from such integrated producers (instead of separately·
contracting at each stage of the fuel cycle), then full integra-
tion over the fuel cycle might become a necessary condition for
participation in the production sector. At present, the chance
of such a development is remote since privatization of the
enrichment sector appears unlikely.
c. Uranium Production Activities by Electric Utilities.
Electric utilities are becoming an important element in
uranium production. Currently there are 30 utilities engaged in
one or more aspects of the uranium supply stage (i.e.,
-38-
exploration, reserves ownership, involve.ment in mine development,
and production).l As of January 1,1978, approximately 30
percent of uranium commitments scheduled for 1985 delivery are to
be produced by utilities. 2
Since utilities are not among the major reserves holders,
their participation in the production sector serves a pro-
competitive purpose by further diffusing seller structure. Also,
the demonstrated ability of utilities to enter production gives • #>'-.- • _.-.
them significant bargaining leverage in their dealings with
independent producers. The chief negative aspect of utility
integration concerns the added burden it places on regulators who
attempt to price electricity services at a competitive level.
This problem is discussed in chapter IV.
6. International Aspects
The domestic uranium market has been relatively unaffected by
international factors. Thro~ghout most of the commercial period
(i.e., after 1966), imports were proscribed by law while domestic
producers had a relatively small market for their output among
foreign buyers. International influences have become more
important since 1974, but it is unclear how important they will
be in the future.
1 DOE, Survey of United States Uranium Marketing Activity,
op. cit., p. 15.
2 Ibid., pp. 12, 13. Captive production is not listed directly. Rather, it is subsumed in the "Other" category of fuel procurement for which no price is specified (table V, p. 13). DOE estimates that 80 percent of the arrangements l~sted in this category are captive production (p. 12).
-39-
~:;''''ft'r . > I -r.
The AEC implemented a ban on uranium imports in 1964. Under
this ruling, foreign uranium destined for domestic use could not
be processed at U.S. enrichment facilities.~ The Commission's aim
was to protect the domestic uranium industry during the transi-
tion to a commercial market. The depressed state of the uranium
market led to continuation of the ban until 1974 when the·AEC
announced a phased withdrawal beginning in 1977 and lasting
through 1983 (after which an unlimit;'~d-'~mount of foreign uranium
could be processed for U.S. consumption).l
In reaction to the Government's intention to relax the import
ban, utilit~es immediately began to purchase foreign uraniti~ for
future enrichment in U.S. facilities. As of January 1, 1978,
domestic buyers had made purchase commitments for 36,400 tons of
foreign U308 for delivery from 1~75 through 1990. Imports in
1977 amounted to 2,800 tons, which is approximately 17 percent of
2 total purchases made by domestic buyers in that year. The
principal foreign sources of uranium are Canada and the Union of
South Africa.
Exports of uranium concentrate were relatively insignificant
through 1973. Since that time foreign market sales have
increased largely due to the expansion of foreign demand and,
recently, the declining exchange value of the dollar. Uranium
1 Uranium Price Formation, ££. cit., pp. 3-35 and 3-36.
2 U.S. Department of Energy, Survey of United States Uranium Marketing Act·ivity, ~. cit., p. 16.
-40-
\:..-
exports in 1977 amounted to approximately 13 percent of total
1 concentrate production in that year.
Since transportation costs of uranium concentrate make up a
small portion of its total value, the impending removal of'import /
constraints may sign1fy the emergence of a world market where
u.s. producers would compete with suppliers of other non-
Comaunist countries. 'rhe likelihood of such a development is
clouded, however, by indications that foreign supplies may be
restricted. It is now well established that ... -t·he- uranium producers
from Australia, Canada, France, South Africa, and England formed
a cartel in 1972 to raise the price of uranium by establishing
production shares and rigging bids. Although sales to the U.S.
were, os tens ibly, not a target of the cartel, the potential for
. 2 affecting u.s. sales did eX1st. The cartel may now be dis-
banded or dormant but it may reappear in th~ future. At present,
Canada sets a minimum price for uranium exported from that coun-
try.
1 u.s. Department of Energy, Survey of United btates Uranium Marketing Acti vi ty, 2E.. ci t., p. 1 7.
2 The Justice Department successfully prosecuted Gulf Oil Corp. for taking part in the cartel but did not have sufficient evidence to charge that the conspiracy extended beyond 1974. (The Washington Post, May 10, 1978, p. A2.) Also, several private antitrust suits include a11egations'thdt the cartel had or conspired to have direct or indirect effects on uranium sales to u.s. buyers. (rrhose cases also involve allegations of a conspiracy within the domestic uranium industry.) See In re Uranium Industry Antitrust Litigation (Homestake Minlng Corp. v. Enerdyne Corp.), 466 F. tiupp. 958 (Judicial Panel on Multidistrict Litigation, Feb. 27, 1979); In re Uranium Industry Antitrust Litigation, 458 F. Supp. 1223 (J.P.M.L. 1978).
-41-
[I
I I
ii
To conclude, the removal of restrictions on imports of
uranium concentrate may increase the supply al~ernatives open- to
domestic buyers. The likelihood of this development is
uncertain, however, due to recent attempts by foreign governments
to restrict the supply of uranium available in the U.S. market •
. ~ ... _.-.
-~ ..
-42-
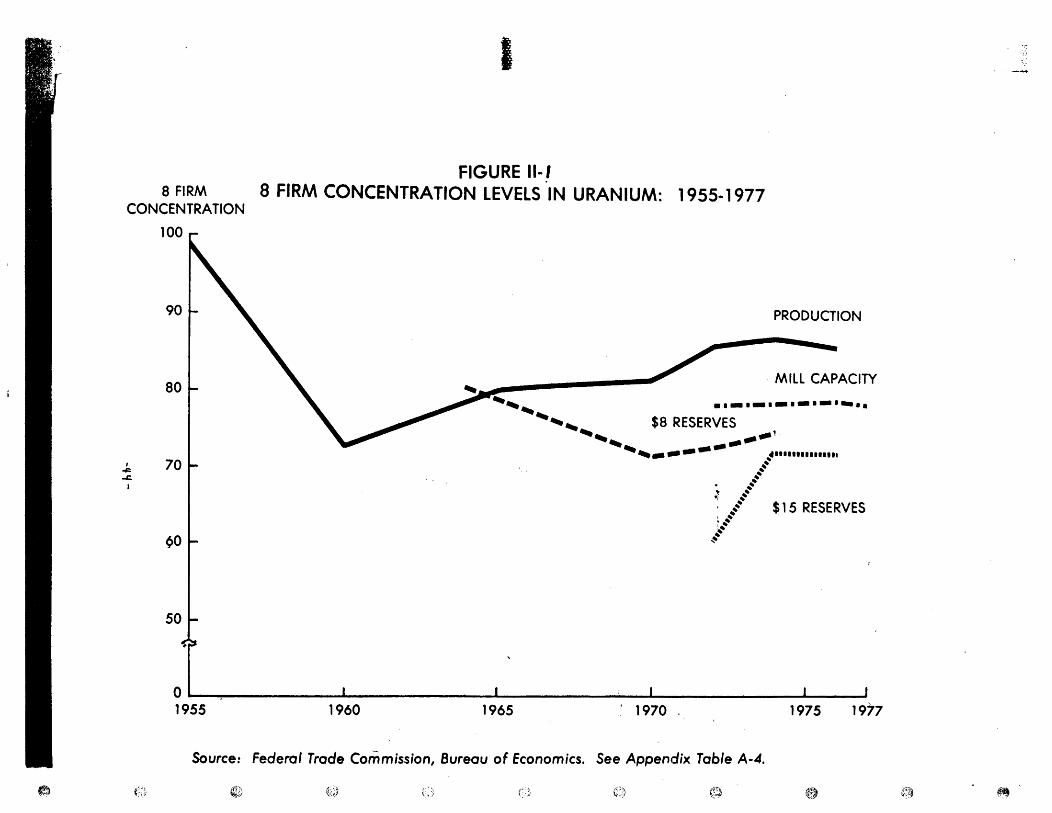
B. Concentration Levels
As illustrated in figure II-I, concentration levels in
uranium are diverse and have undergone a number of different
trends during the 1955-77 period. The most continuous series
available is for production 'where concentration initially
declined and then, starting in 1960, began a steady increase
until 1971, after which a slight reduction has taken place • . ~ ... _.-.
Indices based on mill capacity and proved reserves are only
available in more recent periods. While mill capacity concen-
tration has remained relatively constant during the post-l972
period, reserves concentration increased significantly between
1973 and 1974 and then fell slightly during the next two years.
We now take a more detailed l'ook at concentration levels in
,1974, the latest year for which individual company data are
available. Market share ratios based on actual and potential
output (proved reserves, mill capacity, and mill production) and
e'xploratory effort (acreage held for explorat'ion and exploratory
drilling footage) are tabulated and aggregated for selected
groups of companies. Since confidentiality restrictions prevent
identification of each company's market share, we list the 4-,
8-, and IS-firm concentration ratios. l
1 The one exception is mill capacity where individual company figures are publicly available.
-43-
~
I
FIGURE II-! 8 FIRM 8 FIRM CONCENTRATION LEVELS IN URANIUM: 1955-1977
CONCENTRA TION
, ~ ..c.
I
()
100
90
80 ....
70
~o
50
PRODUCTION
MILL CAPACITY
........ .'-'-'-'-'-'-'. ................ $8 RESERVES
......... ... ...... ' ........ _---- ................ , .... .... .... ....
.r .... ~ ........ $15 RESERVES
~~ :". .... ~ ..
O~'--~ __________ ~ ______________ ~ __________ ~ __ ~ __________________ __
1955 1960 1965 ' 1970 , 1975 1977
Source: Federal Trade Commission, Bureau of Economics. See Appendix Table A-4.
~D ~~J ~~> ~} @ ~
I,
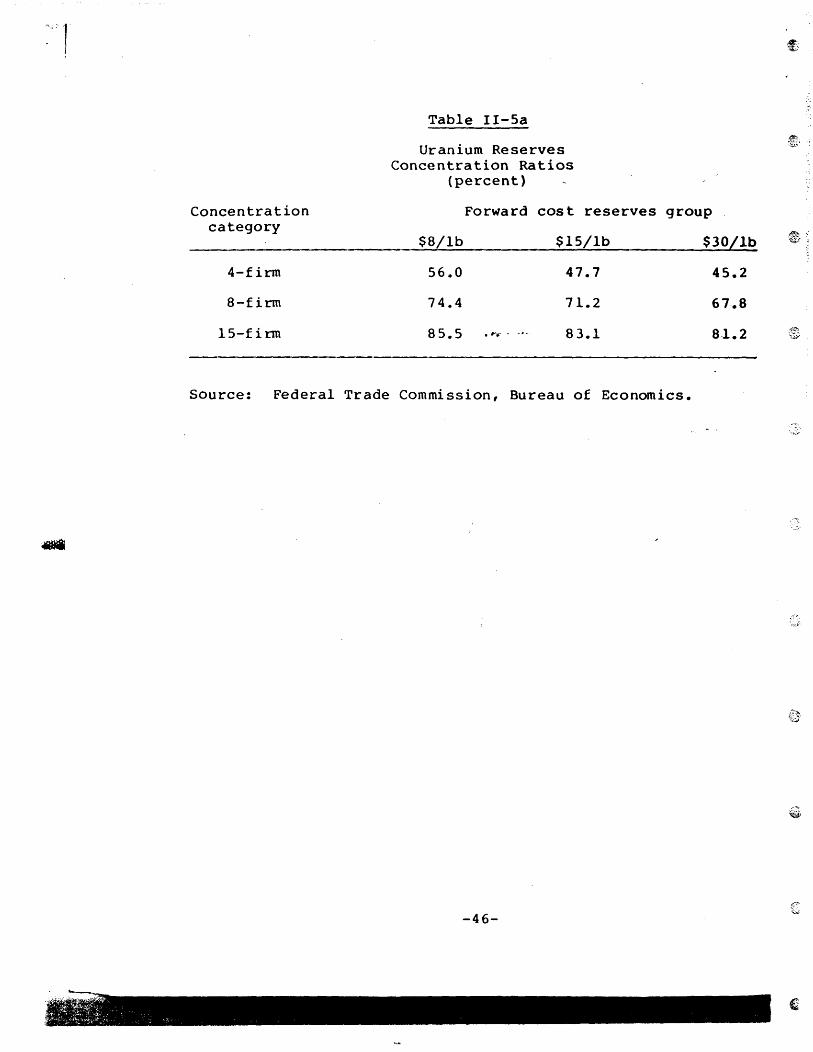
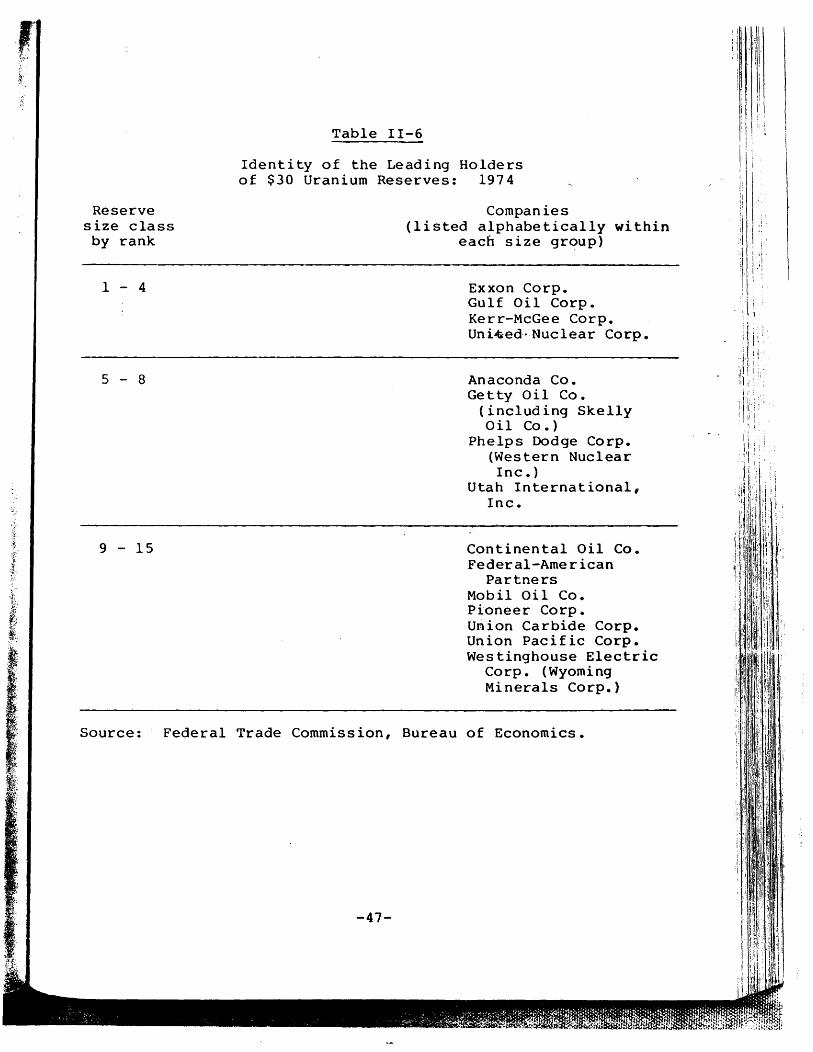
Table II-Sa presents concentration levels based on the stock
of proved reserves, measured at each principal forward cost
category. Concentration levels are similar among each of the
respective forward cost categories, ranging from 67 to 74 percent
at the a-firm level. Table 11-6 lists the identity of com-
panies within each size group for the $30 forward cost category.
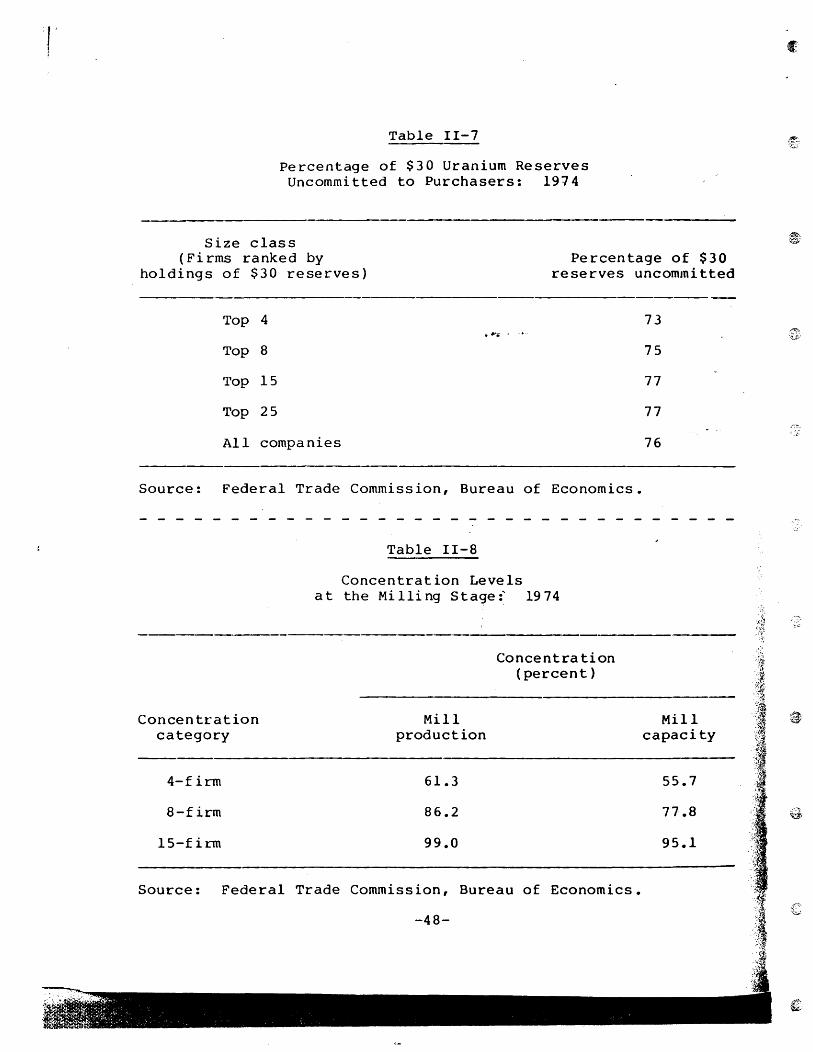
The reserves tabulated in table II-Sa include those already
committed to sellers as well as those not ~e~·committed. Since
significant amounts of reserves are typically dedicated to
buyers, there is the possibility that seller structure for uncom-
mitted reserves differs significantly from that based on total
reserves. Tabulations supplied by DOE suggest that this is not
the case, however. For $30 reserves, the relative importance of
uncommitted reserves differs little among, size classes. Uncom-
mitted reserves as a percentage of the total ranged from 73 per-
cent for the top 4 firms to 77 percent for all companies (table
11-7) • i'
Table 11-8 presents information on concentration at the
milling stage. Concentration levels are tabulated for both mill
production of uranium concentrate (U30 a ), and mill capacity ,I (
as measured by a company I s potential to process uranium ore. Not i 'I,
surprisingly, concentration levels are similar for the two
measures. Those variations that exist are due to different
levels of capacity utilization among plants and to variations in
the grade of ores utilized. The overall level of concentration
is higher than that found for proved reserves. At the 8-firm
-45-
".' .",.".' "!"
Table II-Sa
Uranium Reserves Concentration Ratios
(percent)
Concentration category
Forward cost reserves group
$8/lb $15/lb $30/1b
4-firm 56.0 47.7 45.2
8-firm 74.4 71.2 67·.8
lS-f i rm 8 S. S . ~~ .... 83.1 8.1.2
Source: Federal Trade Commission, Bureau of Economics.
-46-
Reserve size class
by rank
1 - 4
5 - 8
9 - 15
Table 11-6
Identity of the Leading Holders of $30 Uranium Reserves: 1974
Companies (listed alphabetically within
each size group)
Exxon Corp. Gulf Oil Corp. Kerr-McGee Corp. Uni~ed·-Nuclear Corp.
Anaconda Co. Get ty Oil Co.
(including Skelly Oil Co.)
Phelps Dodge Corp. (Western Nuclear Inc. )
Utah International, Inc.
Continental Oil Co. Federal-American
Partners Mobil Oil Co. Pioneer Corp. Union Carbide Corp. Union Pacific Corp. Westinghouse Electric
Corp. (Wyoming Mi nerals Corp.)
Source: Federal Trade Commission, Bureau of Economics.
-47-
IJ
"1' I
Table 11-7
Percentage of $30 Uranium Reserves Uncommitted to Purchasers: 1974
Size class (Firms ranked by
holdings of $30 reserves) Percentage of $30
reserves uncommitted
Top 4 ....... -.-Top 8
Top 15
Top 25
All compa nies
Source: Federal Trade Commission, Bureau of Economics.
Concentration category
4-f irm
8-firm
IS-firm
Table 11-8
Concentration Levels a t the Mi IIi ng Stage:' 1974
Mill production
61.3
86.2
99.0
Concentration (percent)
Source: Federal Trade Commission, Bureau of Economics.
-48-
73
75
77
77
76
Mill capacity
55.7
77.8
95.1
level, mill production concentration is 86.2 percent whereas that
based on mill capacity is 77.8 percent.
Finally, table 11-9 lists concentration levels for two
indices of exploratory effort: acreage held for explorat~on and
exploratory drilling footage. Concentration levels for these two
measures are similar to each other and are significantly lower
than the output measures listed above. Eight-firm concentration
is 50 percent for acreage and 52 percent for drilling footage • . ,... .... -.-Table 11-10 summarizes the range of concentration ratios for
the principal areas of uranium supply activity. Concentration
levels for proved reserves and at the milling stage are rela-
tively high: the 8-firm concentrations range from 71.2 percent
for proved reserves to 86.2 percent for mill production. These
figures are higher than the manufacturing sector average and are . . 1
above corresponding indices for other energy fuel markets.
'rhe limited nature of the concentration ratio along with the
disparate nature of the uranium market makes s~ch comparisons
misleading, however. This is so because reliance on the concen-
tration ratio obscures significant variations in ownership
rankings among firms in different stages of the uranium supply
sector. A less concentrated picture of t~e uranium sector
emerges when these differences are taken into account.
1 The weighted average 8-firm concentration ratio in manufacturing for 1966 was 39.0. Eight-firm concentration levels for energy production in 1974 are: natural gas, 42.6; crude oil, 49.6; coal, 34.8. See Joseph P. Mulholland, Economic Structure and Behavior in the Natural Gas Production Industry (Washington: ~), table 111-19, p. 66.
-49-
. 'i I. ; l: j
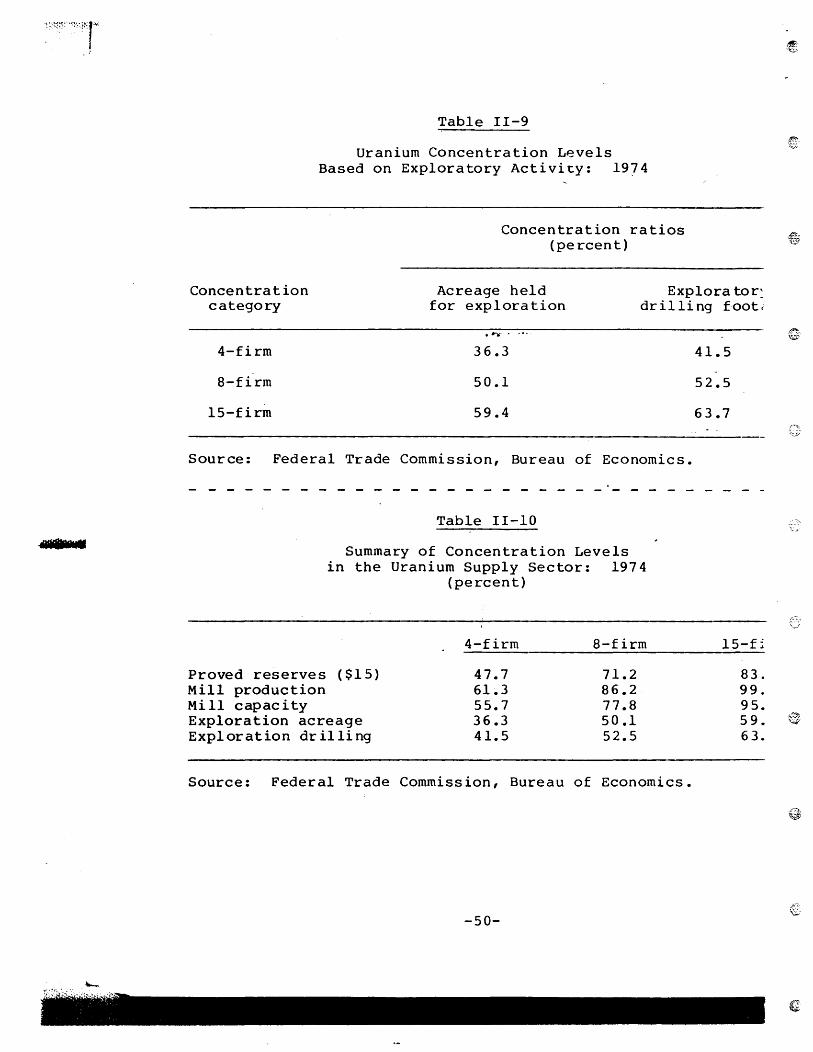
Table 11-9
Uranium Concentration L~vels Based on Exploratory Activity: 1974
Concentration ratios (percent)
Concentration category
Acreage held for exploration
Explora tor~ drilling f-oot.:
4-firm 36.3
8-firm 50.1
15-firm 59.4
Source: Federal Trade Commission, Bureau of Economics.
Proved reserves Mill production Mill capacity
Table 11-10
Summary of Concentration Levels in the Uranium Supply Sector: 1974
(percent)
4-firm 8-firm
($15 ) 47.7 71.2 61.3 86.2 55.7 77.8
Exploration acreage 36.3 50.1 Exploration drilling 41.5 52.5
Source: Federal Trade Commission, Bureau of Economics.
-50-
41.5
52.5
63.7
l5-f~
83. 99. 95. 59. 63.
f,.~ ~'
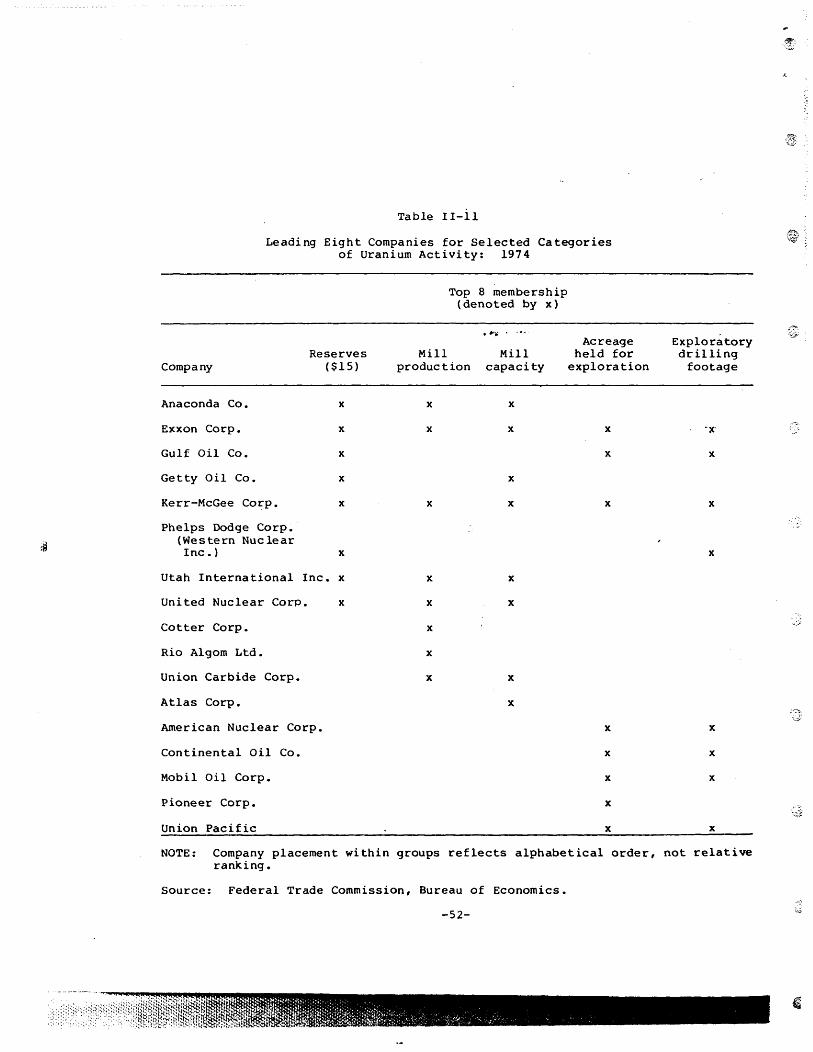
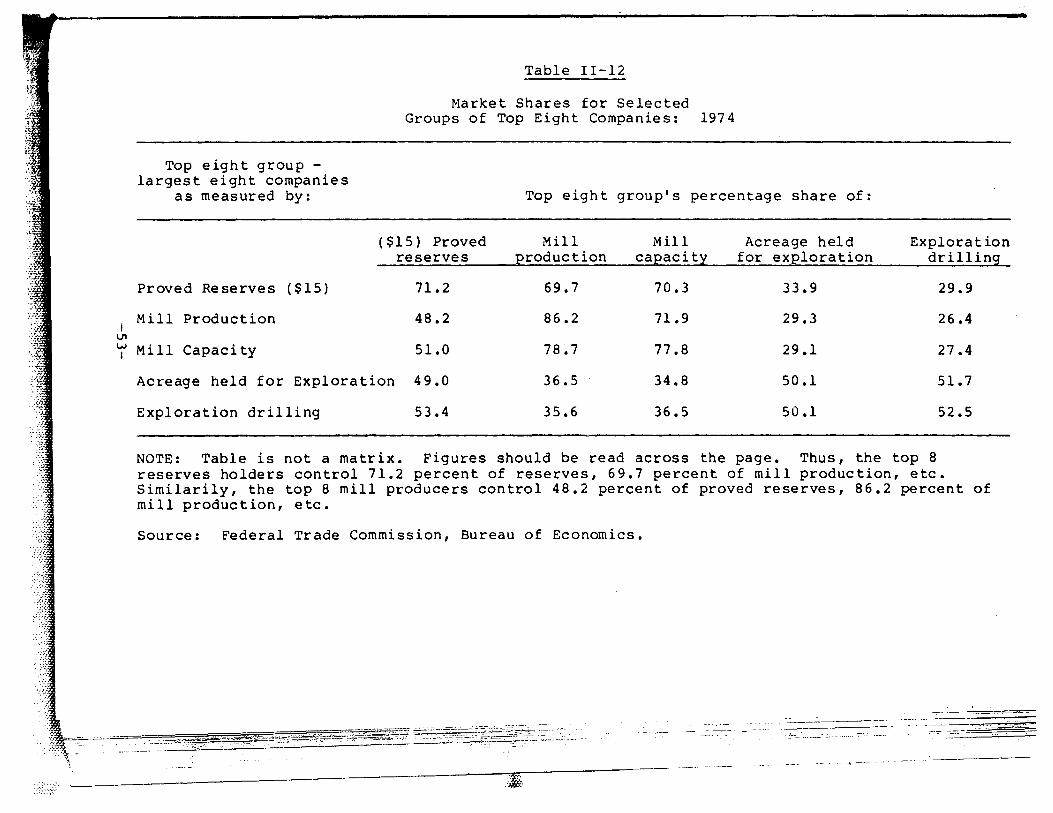
To gauge the extent of ownership divergence within the major
producer groups, we compare the identities and market shares of
the. top 8 producers in each phase of uranium activity analyzed
above. Table II-II identifies the top 8 producers in each
activity; table 11-12 tabulates their respective market shares
for each of the categories listed (e.g., for the top 8 producers,
table 11-12 lists their aggregate market shares of reserves,
exploratory effort, mill capacity, and mill"-"'production).
Analyses of these two tables indicate a significant variety in
ownership among the chief areas of uranium activity. In regard
to the first comparison, there are 12 firms among the top 8 in at -.
least one of the output categOries (i.e., among the top 8 ranked
by proved reserves, mill production, or mill capacity.) As
~ displayed in table 11-12, this pattern l~ads to significant
variations in the respective market shares of the top reserves
holders anp millers. For example, although the top 8 mill
producers control 86 percent of mill produ6tion, their share of i
proved reserves is only 48 ·percent. A similar pattern is found
when the dominant proved reserves holders are compared to the
leaders in exploratory effort. There are 14 companies included
within at least one top 8 producer group as measured by proved
reserves, acreage held for exploration, and exploratory drilling
footage. Thus, although the top 8 reserves holders control 71
percent of total reserves, their share of exploration acreage is
-51-
iH
Table II-II
Leading Eight Companies for Selected Categories of Uranium Activity: 1974
Reserves Company ($15 )
Anaconda Co. x
Exxon Corp. x
Gulf Oil Co. x
Getty Oil Co. x
Kerr-McGee Corp. x
Phelps Dodge Corp. (Western Nuc lear Inc. ) x
Utah International Inc. x
United Nuclear Corp. x
Cotter Corp.
Rio Algom Ltd.
Union Carbide Corp.
Atlas Corp.
American Nuclear Corp.
Continental Oil Co.
Mobil Oil Corp.
Pioneer Corp.
Union Pacific
Top 8 membership (denoted by x)
. ~ ... _.-.
Mill Mill production capacity
x x
x x
x
x x
x x
x x
x
x
x x
x
Acreage held for
exploration
x
x
x
x
x
x
x
x
Exploratory drilling
footage
x
x
x
x
x
x
x
NOTE: Company placement within groups reflects alphabetical order, not relative ranking.
Source: Federal Trade Commission, Bureau of Economics.
-52-
I VI
Top eight group -largest eight companies
as measured by:
Proved Reserves ($15)
Mill Production
Table 11-12
Market Shares for Selected Groups of Top Eight Companies: 1974
Top eight group's percentage share of:
($15) Proved Mill Mill Acreage held reserves Eroduction caEacity for exploration
71.2 69.7 70.3 33.9
48.2 86.2 71.9 29.3
Exploration drilling
29.9
26.4
~ Mill Capacity 51.0 78~7 77.8 29.1 27.4
Acreage held for Exploration 49.0 36.5 34.8 50.1 51.7
Exploration drilling 53.4 35.6 36.5 50.1 52.5
NOTE: Table is not a matrix. Figures should be read across the page. Thus, the top 8 reserves holders control 71.2 percent of reserves, 69.7 percent of mill production, etc. Similarily, the top 8 mill producers control 48.2 percent of proved reserves, 86.2 percent of mill production, etc.
Source: Federal Trade Commission, Bureau of Economics •
.. ---. _.- .. _" -----_. __ .-
._~_~~~&~~'i--:;~'~~~"":';:~ . . ~~: . - .~~::-'.:-.:' ~ --'~:~':~~~~~=-~~~-="'~:~>,~_~~~-~._~:-.~ .. _-------- --
~----------------------~-:.~
34 percent and their market share of exploratory drilling is
approximately 30 percent. Overall, 17 companies are included in
at least one top 8 output or exploration categqry.
The above ownership variations reflect past and ongoing
structural changes within the industry. Differences in market
shares among the dominant reserves holders and millers are a con-
sequence of earlier variations in "exploratory effort that allowed
smaller millers and new entrants to in~~ease significantly thei~
proved reserves position vis-a-vis more establisted producers.
Such a development originally manifests itself in differences
between reserves and mill ownership since many of the successful
new entrants have yet to develop mill capacity commensurate with
their reserves holdings.
Similarly, ownership differences between reserves and
exploratory effort may presage subsequent shifts in the identity . \~;,.
t"~ of the top reserves holders. Such a development is not inevit- 1
able, it should be noted, since the correspondence between
ex~loratory effort and subsequent reserves formation is inexact.
Of particular relevance, differences in the quality of laI~
holdings (a factor we cannot observe) can alter the prospects for
discovery of commercial deposits. Nevertheless, the past rela-
tionship between the exploratory effort measures and subsequent
-54-
reserves discoveries,l plus the significant financial
resources of the top explorers not included among the major
reserve holders (for example, Union Pacific, Continental Oil, and
Mobil), lead to an expectation that some movement in subsequent
reserve market shares will take place.
To conclude, uranium concentration in 1974 displays a mixed
pattern. While concentration ratios for the individual output ...... ---. sectors are high, differences in the identities of the dominant
companies among the principal phases of the uranium sector sug-
gest a more expanded range of prospective suppliers than the
separate concentration indic-es would indicate. This is espe-
cially true considering the long leadtimes involved in nuclear
plant construction which allow purchasers a number of years to
search for prospective sellers before actual supplies are needed.
As a result, the relevant focus of competition in uranium per-
tains to the distribution of current explorator~ capacity, rather
than a single, narrowly defined, index of ex post capacity such
as production. Concentration from this perspective appears to be
low since there is a large nucleus of companies that maintain a
leading position in one or more of the major areas of uranium
supply. The validity of this assessment is further considered
1 Uranium Price Formation, £e. cit., notes that: "[I]n the past, when exploration activities have increased, they have been successful in the sense that rapid increases in reserves followed rapid increases in exploration activity" (p. 5-1). The report goes on to note that the apparent productivity of exploration effort has been declining (pp. 5-51 to 53).
-55-
!' :
,I
! I i.,
.' !
\( I ~
"
~ I .i
in the next section where we analyze ·the uranium industry's con-
dition of entry; i.e., the ability of smaller producers and new
entrants to expand supply in response to favorable demand
signals.
. ..... -.-.
,--;;:-... ,','-:-
C. Condition of Entry
We now examine entry conditions within the uranium industry.
Our aim is to ascertain the existence and importance of
institutional and technological factors that can hinder the
supply expansion potential of small producers and potential
entrants. l Such factors, termed "barriers to entry," may
increase the likelihood of monopoly performance (in an industry
with a sufficiently small number of dominant prod~ers) by i i
removing. the threat of competition created by potential entrants. I.
Alternatively, a condition of "easy" entry makes adoption of
monopoly pricing unlikely since the dominant producers are
confronted by the threat of a competitive supply expansion by new
entrants in response to attempts at raising price above longrun
marginal cost.
The following factors, considered to be the most likely
sources of entry barriers into the uranium supply sector, will be
evaluated: long gestation period, control of superior resources
by existing firms, economies of scale, and capital requirements
for new entry.
1 For economy of style, most references in this section will be to "new entrants" only. This term should be interpreted as including smaller existing uranium companies who may desire to enlarge considerably their scale of operation.
-57-
11
I
1. Long Gestation Period
The estimates cited earlier in this chapter indicate a lead
time for uranium exploration and mine development 6f somewhere
between 8 and 12 years. If firms could sell uranium only after
production capacity has been established, the existence: of a
relatively lengthy gestation period might be construed as an
entry barrier. In particular, if a small group of firms were
able to raise prices above margina}~~ogts of production and new
entrants could bring competitive pressure to bear only afte~ a
lO-year period of exploration and development, there is at least
the potential for short-term monopoly abuse. The 10ng-te,rIIl,
nature of exchange in the uranium market tends to mitigate this
poss ibil i ty, howeve r.
Uranium is traded in two markets, a short-term "spot" market
and a long-term or "futures" market. Contracting in the long-
term market currently accounts for approximately 75 percent of
total sales (measured annually by weight) and this percentage has
been increasing as 'the commercial market for uranium has grown.
Reliance on long-term contracts tends to be pro-competitive since
the result is a flexible system of exchange from the standpoint \";~'
of both buyer and seller. While a producer must have reserves
producible for immediate delivery in order to compete in the spot
market, it need not possess extant production capacity in order
to secure a long-term contract for future delivery. What is
required in the latter case is exploration and development
activity sufficient to persuade a buyer of the potential
-58-
I :' seller's s~bsequent ability to meet the contract commitment. I I
I I , \
This situation is preferable from the buyer's point o~ view since
it gives him access to a larger number of potential~suppliers
than would be the case under an exclusively spot market situa-
tion.
. ...... -.-.
2. Superior Resources
One way in which entry into the uranium industry coul~ be
. prevented is if all potential uranium-bearing lands were ~eld by
a small group of existing producers. This situation appears
unlikely, however, since vast areas of potential uranium land in
the United States remain unexplored and unclaimed. Virtually all
of the uranium discovered thus far in the United States is in ..... - . - .~.
sedimentary rocks. "Most of the deposits are found in a 450,000
square mile region in the West (See figure 11-2). According to
T. B. Cochran, "the majority of the exploration effort today is
still concentrated in the vicinity of the producing districts,
with less than 15 percent of that effort directed toward new
prospects in non-producing areas." 1
In addition, vast areas outside of the western region con-
sidered by the National Petroleum Council as potentially favor-
able for the discovery of uranium remain unexplored. One indus-
try figure estimates that "50 perdent of the United States is
prospective territory and only a small part of this area has been
explored to any appreciable extent.,,2 This 50 percent figure
includes much of the southeastern United States and Alaska.
1 T. B. Cochran, The Liquid Metal Fast Breeder Reactor, An Environmental and Economic Critique (Resources for the Future, 1974), p. 84.
2 George Hardin, Jr., "Outlook for Nuclear Fuels," Quarterly of the Colorado School of Mines, vol. 68, no. 2 (April 1973), pp • 1 7 2 , I 7 3 •
-60-
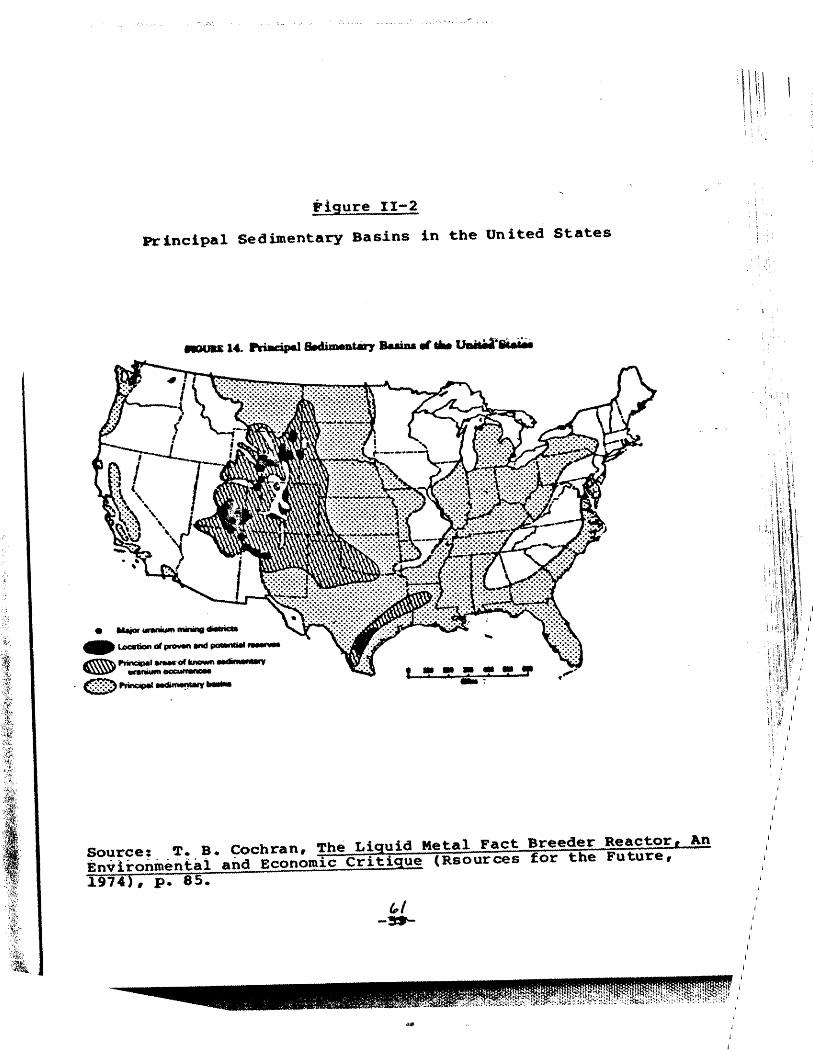
Figure 11-2
Principal Sedimentary Basins in the United States
• IIa;or ~ mining ~
_ L.oartion tJ proven lind ~ ......
~~I"""ofknown"" .... -r ~ .... NUm~
('Z)PrinQpIIt~""'"
Source: ~. B. Cochran, The Liquid Metal Fact Breeder Reactor, An Environmental and Economic Criti ue (Rsources for the Future, 1.974 , p. 85.
i.
. \
I I
... -
Knowledge of uranium resources is also incomplete in other
respects. Uranium deposits that are rich enough to exploit exi~
at over 4,000 feet, yet the average depth of drilling for uranit
in 1973 was less than 500 feet. To date the search for uranium
has also been limited in terms of knowledge of depositional
phenomena and environments. An Electric Power Research Lnstitut
study notes that ."fi." . -.-.
Most of the uranium found in the United States so far has been in sandstones and the bulk of exploration has been directed at this type of deposit. In Canada and South Africa, on the other hand, Pre-Cambrian quartz pebble conglomerates have been dominant, whereas black shales have been productive in Sweden and Alaskatic segmatites are entering production in SouthWest Africa. Knowledge is still increasing as to the manner in which uranium deposits are for~ed and new knowledge will inevitably lead to new discoveries. Uranium also occurs in many mineral forms. Forms pres-ently unimportant in some areas may playa large role in other areas. l
To summarize, the scope of unexplored uranium land is so
extensive that prospects of resource monopolization appear
remote. Such a conclusion is necessarily tentative, however,
since no one can tell whether in fact significant quantities of
uranium will be found in such non-established areas until
extensive exploration actually takes place.
1 "Uranium Resources to Meet Long Term Uranium Hequirements," Electric Power Research Institute, Special Report (November 1974), pp. 23, 24.
-62-
3. Economies of Scale
When economies of scale make the efficient-sized firm large
relative to the size of the market, it is possible for existing
firms to set a price above the long-run marginal cost of produc-
1 tion without attracting new entry. This situation arises if
a new firm is forced to enter at a scale that possibly will
result in a perceptible decline in price and, thus, in pro-
fitabilityexpectations. In deciding whe~er·-·or not to enter,
the new firm will estimate what price will prevail after its
entry. If this price is below the competitive level, the firm
will not enter even though the price prevailing before entry is.
in excess of the competitive level. Scale economies in this
instance act as a barrier to entry by creating a significant
divergence between pre- and post-entry price levels. Such a
difference is greatest in an industry where initial output of a
new entrant is large relative to the market as a whole and where
growth in market demand is relatively lo\o? The latter condition
is important since a significant rise in market demand can offset
the increase in supply created by new entry, ~eaving price unaf-
fected _
1 For a more thorough analysis of scale economies as a barrier to entry, see Scherer, £2- cit., pp. 72-103. In addition to the factors noted below, tnc gap between pre- and post-entry price as perceived by the potential entrant depends on the expected supply response of the established sellers, the shape of the cost curve, and the price elasticity of demand.
-63-
In the case of uranium, a number of factors point to a
relatively insignificant role for the scale economy barrier~ Of
particular relevance, DOE projections indicate that supply and
demand condi t'ions will allow for the entry of a large number of
mine-mill production centers in the near future. By 1990 there
are expected to be 49 production centers in operation, q gain of
29 over the mid-1977 total. l Prominent among these new ..... - . -.-. '?i. facilities are those utilizing non-conventional milling methods
that can operate on a relatively small scale. 2 Overall, the
average size of the projected new plants relative to total output
should be significantly lower than the relative size of current
facilities since the average market share of new plants expected
to be in operation by 1990 is 2 percent vis-a-vis a
1 This estimate is derived from the DOE supply projec-tion for production centers classified as classes 1, 2, and 3. The total concentrate output for these plants, ~6,000 tons, roughly coincides with the projected uranium requirements (at .25 percent tails assay·) of 47,006 tons uranium concentrate production for 1990. Both demand and supply analyses are derived from reports contained in DOE, Uranium Industry Seminar, October 26-27, 1977, GJO-I08(77). The demand projection is from R. Brown 'and R. Williamson, "Domestic Uranium Requirements," p. 63. The supply analysis is from J. Klemenic and D. Blanchfield, "Production Capability and Supply," pp. 195-226. In regard to the latter, the number of plants is presented in figure 8 (p. 206) while production is listed in figure 12 (p. 210).
2 Six of the new mills are expected to be of non-conventional design, raising to 12 the number of such facilities anticipated in 1990. The number of non-conventional mills are provided by DOE staff specialist John Klemenic in personal correspondence. The distinction between conventional and nonconventional milling methods is described in J. Q. Jones, "Uranium Pro'cessing Developments," in DOE, Uranium Industry Seminar, OPe cit., p. 193.
-64-
-:.r
corresponding market share figure of approximately 4 percent for
current plants.
The uranium industry's reliance on long-term contracts also
tends to mitigate the impact of potential scale-related entry
effects. This is so because entrants have the option of selling
all or part of their planned output before plant construction
actually takes place. The latter approach has been used with
increasing frequency, especially by smaller p?oducers desirous of
outside financing. In such cases, the relevant stage of entry
becomes the exploration phase where competition takes the form of
rivalry for long-term contracts. Here the potential entrant is
not concerned with the price depressing effects of his entry but,
rather, has to deal with the less troublesome concern over the
extent to which his entry into exploration .will have on the price
he must pay for potential uranium bearin9 lands. Since the
minimum efficient scale for uranium exploration is quite low (see
section II-b, above), the latter concern should not be of
significant import. l
To conclude, expected demand and supply conditions, along
with reliance of the industry on long-term contracts, point to an
insignificant role for scale economies as an entry deterrent in
1 This line of analysis is used in the Department of Justice report on the coal industry where the dedication of output before mine construction is common. u.S. Department of Justice, Competition in the Coal Industry (Washington: U. S. Government Printing Office, 1978), p. 74.
'i'
. 1
i'
: !: I
i
the uranium sector. It should be stres.sed, however, that this
evaluation depends to a large degree on the attainment of the
uranium demand levels projected by DOE. A sizable shortf~ll fr~
these levels could create a more concentrated selier structure
and an attendant scale-induced barrier problem. Such a develop-
ment can be ascribed as well to deficient demand as to scale
economies since the two are different sides of the same coin •
. ~.- . _.-.
-66-
,~ ,.~
4. Capital Requirements
Investment expenditures required for establishment of an
efficient scale of operation in an industry can form a barrier to
entry if most of .potential entrants are incapable of accumulating
the requisite tunds. In the case of uranium, capital req~ire
ments vary significantly with the extent of entry considered.
Initial costs at the exploration stage are low, with most esti
mates being below $10 million. Initial expe~alt~res necessary to
produce uranium concentrate, however, are significantly higher.
Minimum startup costs at this level, including expenditures for
exploration, mining, and milling, have been estimated to range
from 70 to $100 million (see section A.2).
While no convenient formula exists for determining the
extent to which capital expenditure levels ~onstitute a barrier
to entry, the following factors suggest that initial capital
requirements in uranium are not a formidable entry deterrent:
(a) In relative terms, the expenditure; necessary for full
scale entry (i.e., through the mill production stage) does not
appear high. The $70 to $100 million range for full scale entry
into uranium is equal to or below that required in eight of the
twelve industcies studied by F. M. Scherer et al., for example.
(These industries are: Beer, Cigarettes, Petroleum Refining,
-67-
---,
Glass Bottles., Cement, Steel, Refrigeration, and Storage
Batteries).l On the other hand, full entry into the uranium
industry tends to be more expensive than establishment of coal
production capability, which is estimated~to··range from ~2l
million to $84 million. 2 These latter values, it should be
noted, have been characterized as presenting no entry
obs tacles .3
(b) Institutional arrangements within the uranium sector
considerably reduce the capital e]{'penditure (and associated
uncertainty) burden borne by potential entrants. The nature of
the contracting process is such tha t an entrant does not en te·r
immediately at all stages but, rather, begins only at the
exploration level, where capital expenditures are modest. It is
1 F. {\l.Scherer, A. Beckens tein, E. Kaufer, R. M.urphy, The Economics of Mu1ti-Plant Operation (Cambridge: Harvard U:-Press, 1975). 'lhe minimum capital requirement for each industry was calculated by the authors of the present report in the following manner: The minimum capital expenditure necessary to equate a minimum optimal scale (MaS) plant in 1965 was obtained from appendix table 3.7 (p. 426). This value was then multiplied by the smallest number of MaS plaqt~ deemed necessary for efficient operation by a firm (table 7.6, p. 336). The reSUlting capital expenditure figure was then adjusted for inflation by multiplyin~ it by a' factor of 1.96, the ratio of the 1977 implicit price deflator for total non-residential fixed investment to the corresponding figure for 1965 (Economic Report of the President, 2£. cit., table B-3, p. 260). Estimated capital expenditures for ~ the lflndustries ranked above uranium ranged from $78 mi Ilion fOl storage batteries to $2.4 billion for stee~.
2 E. Pantos and H. Smith, Report to the Federal Trade Commission on the Structure of the Nation's Coal Industry, 1964-74 (Washington: u.~. Government Printing Office, 1978), p. 145.
3 Ibid., p. 125; Department of Justice, Competition in the Coar-Industry, 2£. cit., pp. 74, 75; Electric Power Research Institute, Coal Price Formation, EPRI EA-497, pp. 3-11.
-08-
only after a commercial uranium deposit is found that decisions
concerning the funding of a mine-mill complex must b~ confronted.
At this juncture, the task of raising the necessary funds is
considerably eased since documentation of the uranium deposit
acts as confirmation to the capital market of the proposed
project's viability. Firms also have the alternative of selling
options on their yet unexploi ted reserves tQ .... p.ur-chasers in return
for financing of the mine-mill complex. The latter form of
fundraising has been utilized in a number of recent long-term
contracts.
To summarize, the capital required for participation in the
uranium production cycle does not, per se, appear to raise a
formidable entry barrier. The necessary ~un~s are of such a mag
nitude as to permit participation by a large variety of companies
through internal financing or via capital markets. In addition,
purchaser financing of a mine-mill complex is available to new
entrants with the requisite uranium deposit.
5. Conclusion
The above analysis suggests that technological and
institutional factors within the uranium seGtor do 'not pose a
significant deterrent to supply expansion by potential entrants.
The key elements in determining future supply appear to be
expectations of future demand subject to technological and
geological constraints that are faced more or less equally by
existing and potential suppliers al':tke ;'- Hence, the abili ty of
one or a set of large producers to monopolistically restrict
supply appears remote. This conclusion is necessarily tentative
since it is based largely on deductive analysis, influenced .by
projections of ·future demand and supply patterns. As a useful
complement to this approach, we now study the actual record of
entry that has taken place in response to the post-l973 rise in
uranium concentrate prices.
-70-
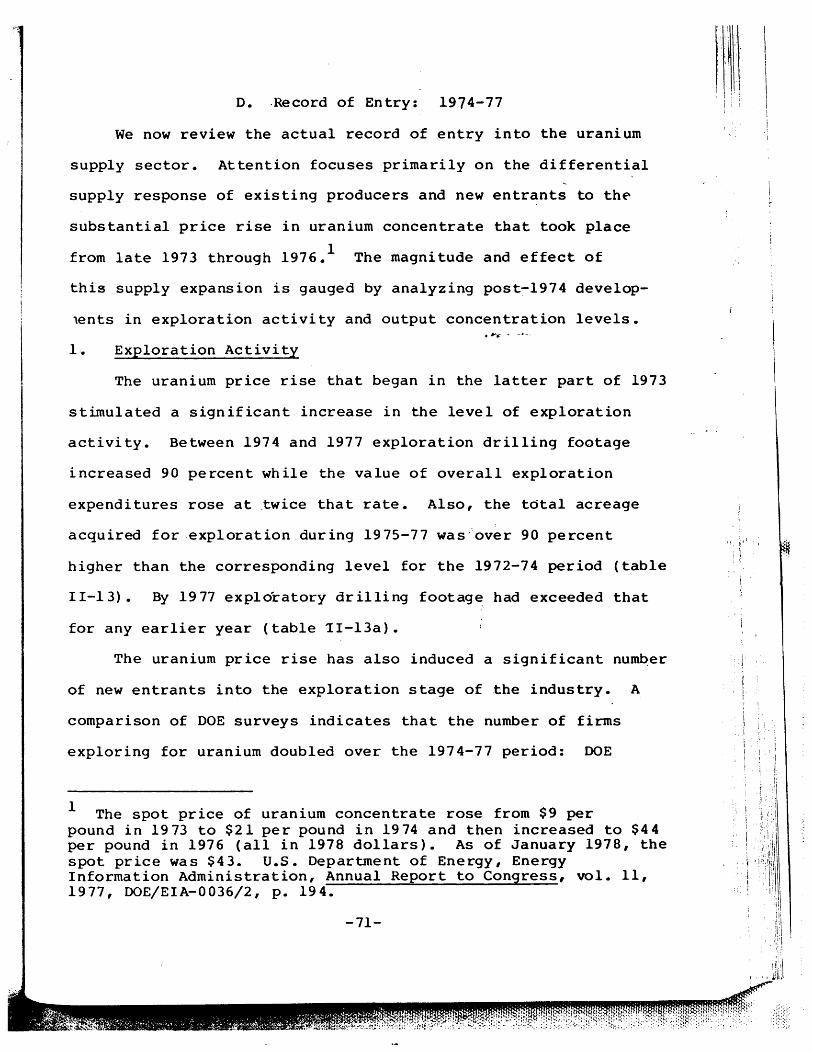
D. .Record of Entry: 1974-77
We now review the actual record of entry into the uranium
supply sector. Attention focuses primarily on the differential
supply response of existing producers and new entrants to th~
substantial price rise in uranium concentrate that took place
from late 1973 through 1976. 1 The magnitude and effect of
this supply expansion is gauged by analyzing post-:-1974 develop-
lents in exploration activity and output concentration levels • . ..... . -.-.
1. Exploration Activity
The uranium price rise that began in the latter part of 1973
stimulated a significant increase in the level of exploration
activity. Between 1974 and 1977 exploration drilling footage
increased 90 percent while the value of overall exploration
expenditures rose at ,twice that rate. Also, the total acreage
acquired for ,exploration during 1975-77 was' over 90 percent
higher than the corresponding level for the 1972-74 period (table
11-13). By 1977 exploratory drilling footage had exceeded that
for any earlier year (table TI-13a).
The uranium price rise has also induced a significant num~er
of new entrants into the exploration stage of the industry. A
comparison of DOE surveys indicates that the number of firms
exploring for uranium doubled over the 1974-77 period: DOE
1 The spot price of uranium concentrate rose from $9 per pound in 1973 to $21 per pound in 1974 and then increased to $44 per pound in 1976 (all in 1978 dollars). As of January 1978, the spot price was $43. U.S. Department of Energy, Energy Information Administration, Annual Report to Congress, vol. 11, 1977, DOE/EIA-0036/2, p. 194.
-71-
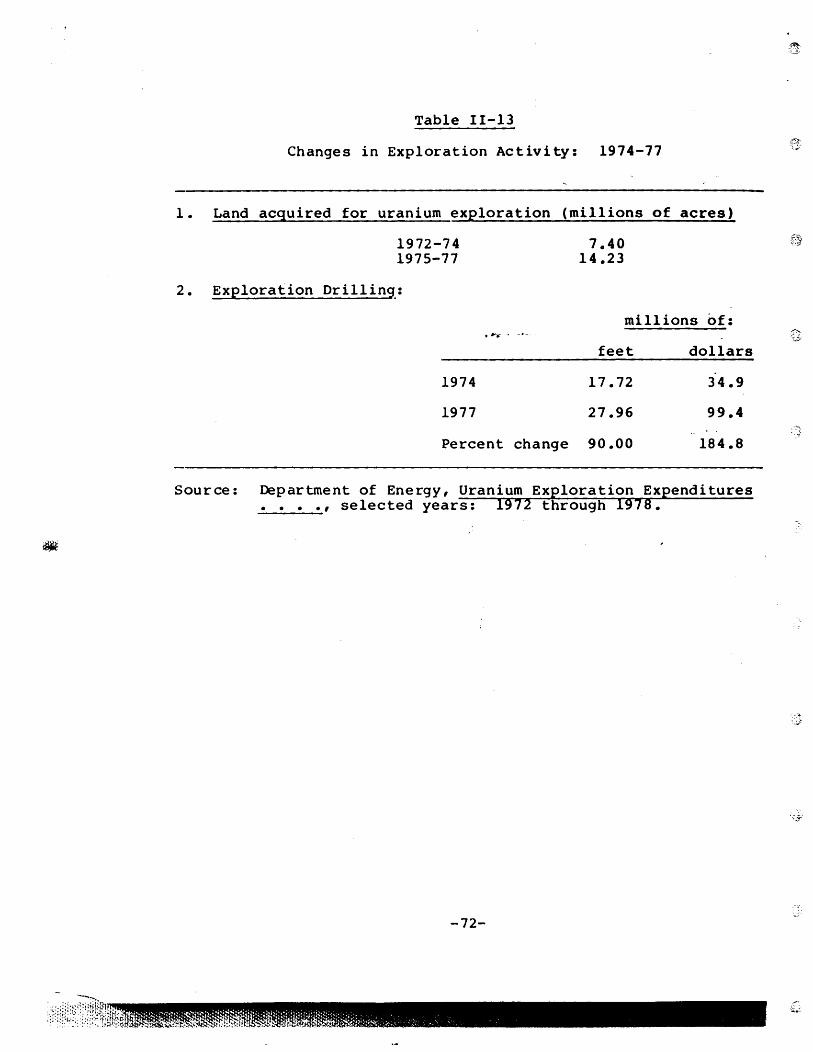
Table 11-13
Changes in Exploration Activity: 1974-77
1. Land acquired for uranium exploration (millions of acres)
1972-74 1975-77
2. Exploration Drillin~:
1974
1977
• /j>I-.- • -.-.
Percent change
7.40 14.23
millions of:
feet dollars
17.72 34.9
27.96 99.4
90.00 184.8
Source: Department of Energy, Uranium Exploration Expenditures •••• , selected years: 1972 through 1978.
-72-
~ . Q
. ~~'
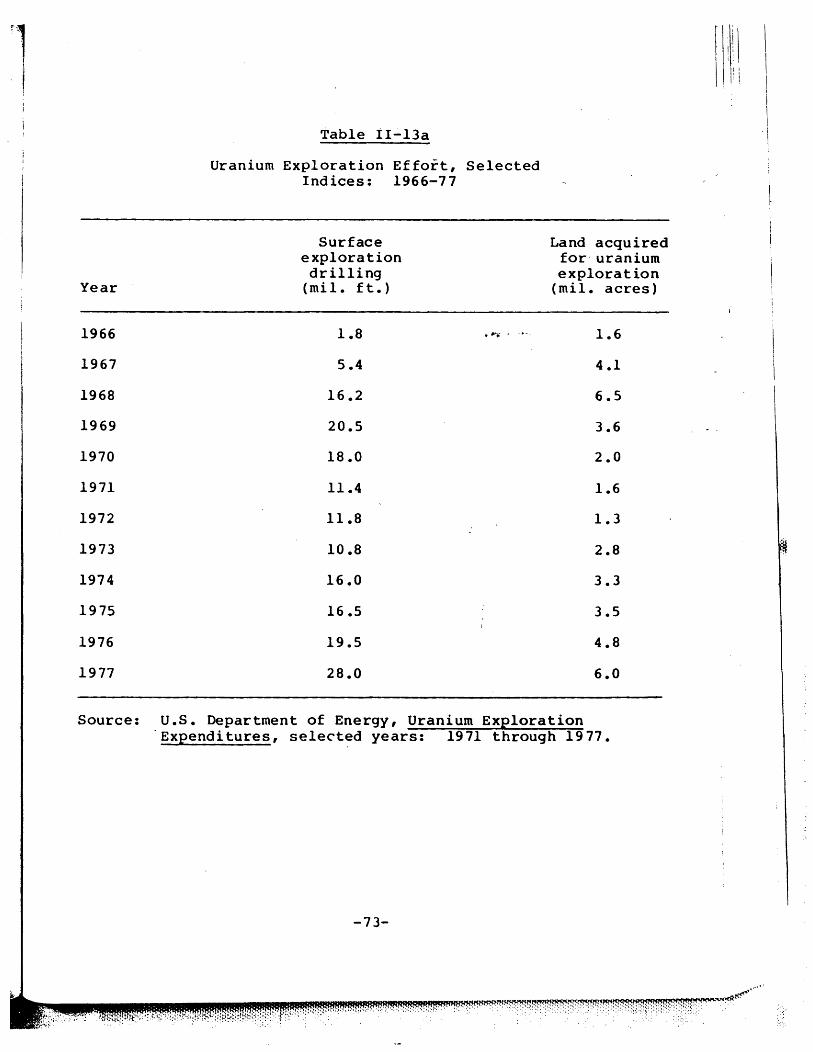
'1 I
Year
1966
1967
1968
1969
1970
1971
1972
1973
1974
1975
1976
1977
Table iI";'13a
Uranium Exploration Effort, Selected Indices: 1966-77
Surface exploration drilling
(mil. ft. )
1.8 ..... - . -.-.
5.4
16.2
20.5
18.0
11.4
11.8
10.8
16.0
16.5
19.5
28.0
Land acquired for- uranium exploration
(mil. acres)
1.6
4.1
6.5
3.6
2.0
1.6
1.3
2.8
3.3
3.5
4.8
6.0
Source: U.S. Department of Energy, Uranium Exploration "Expenditures, selected years: 1971 through 1977.
-73-
[ ! \
\ I Ii: Ii
: ~
.~
surveyed 83 companies for its 1974 report vis-a-vis 168 in
1978.1 Although the list of new entrants includes many small
minerals concerns, it also contains firms of substantial size as
well. For example, 8 of the new entrants are listed among the
Fortune 500 Industrials, including u.s. Steel, Bethlehem Steel,
International Paper, and a number of large petroleum con-
2 cerns. In addition, utilities have begun entering the
production stage in increasi ng ly gre~~e.r_._numbers. Whereas less
than 5 utilities were participants in the producti~n sector in
1974, 30 were so identified in 1977. 3 As of January 1, 1978,
approximately 30 percent of the uranium scheduled for delivery in
1985 was controlled by utilities, vis-a-vis less than 5 percent
for 1978 de Ii very. 4
Not surprisingly, the combination of new entry and increased
exploration activity has led to a significant diffusion'of
exploratory effort. Between 1974 and 1976, 8-firm concentration
levels based on drilling footage decreased 19 percent and the
1 u.s. Department of Energy, Uranium Exploration Expenditures in 1977, and Plans for 1978-79 (Grand Junction Office, 1978); u.s. Energy Research and Development Administration, Uranium Exploration Expenditures in 1974, and Plans for 1975-76, GJD-I03 (75).
2 The possible anti-competitive effects of petroleum firm entry are discussed in chapter III.
3 The 1974 figure is an estimate supplied by DOE officials. The 1977 figure is reported in U.S. Department of Energy, Survey of United States Marketing Activity, May 1978, DOE/RA-0006, p. 15. 4 Ibid., pp. 12,13.
-74-
1 I 1.1
: I
corresponding acreage-held-for-exploratioh measure declined 14
percent (table 11-14).
2~ Output Concentration Levels
Entry into the exploration stage is important chiefly to the
extent that it results in increased ownership diffusion in the
production phase. In this regard, the most important output
measure is proved reserves, the successful end product of an
exploration program. No direct link between recent entry and . ~;;- .. ---. reserve ownership is possible, however, since insufficient time
has elapsed between the onset of increased exploration activity
in 1974 and the latest available year for reserve concentration
data, which is 1976. Observation of the pattern of reserve
concentration levels for the 1972-76 period indicates a rise in
concentration through 1974, followed by a slight decline (see
figure II-I, above). This later pattern may indicate the ~ I ;
fruition,of earlier (pre-1974) entry activity discussed in
section B.
Effects of recent exploration activity are best ascertained
through analysis of projected mill ownership patterns since a :1
company's mill construction decision reflects its existing and
anticipated reserves position. At the beginning of 1978, the
volume of actual and planned capacity initiated since 1974
totaled 19,210 tons--55 percent of the 1974 mill capacity. This
expansion should materially alter future ownership patterns since
a significant amount is accounted for by new entrants and
previously smaller millers. Thirty-nine percent of new capacity,
-75-
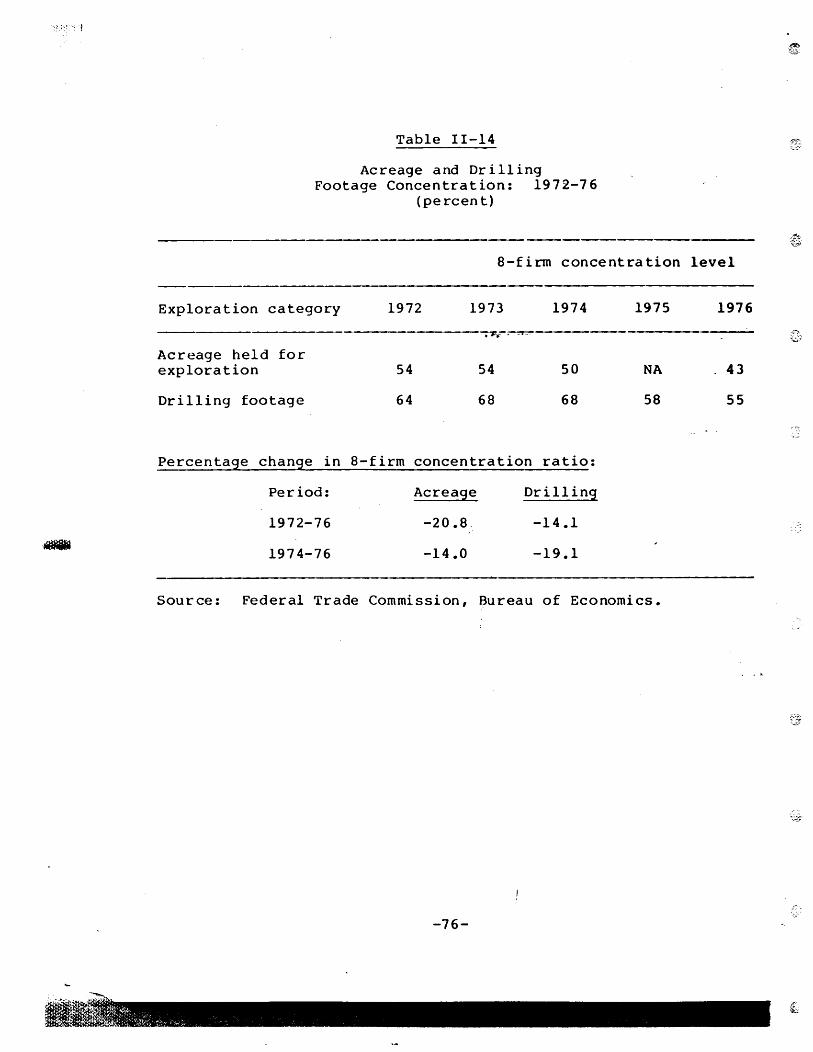
Table 11-14
Acreage and Drilling Footage Concentration: 1972-76
(percent)
8-f i rm concentra tion
Exploration category
Acreage held for exploration
Drilling footage
1972
54
64
1973 1974
."'.'~
54 50
68 68
Percentage change in 8-firm concentration ratio:
Period: Acreage Drilling
1972-76 -20.8. -14.1
1974-76 -14.0 -19.1
1975
NA
58
Source: Federal Trade Commission, Bureau of Economics.
-76-
~t:~. """
level
1976
""" .;;~~
43
55
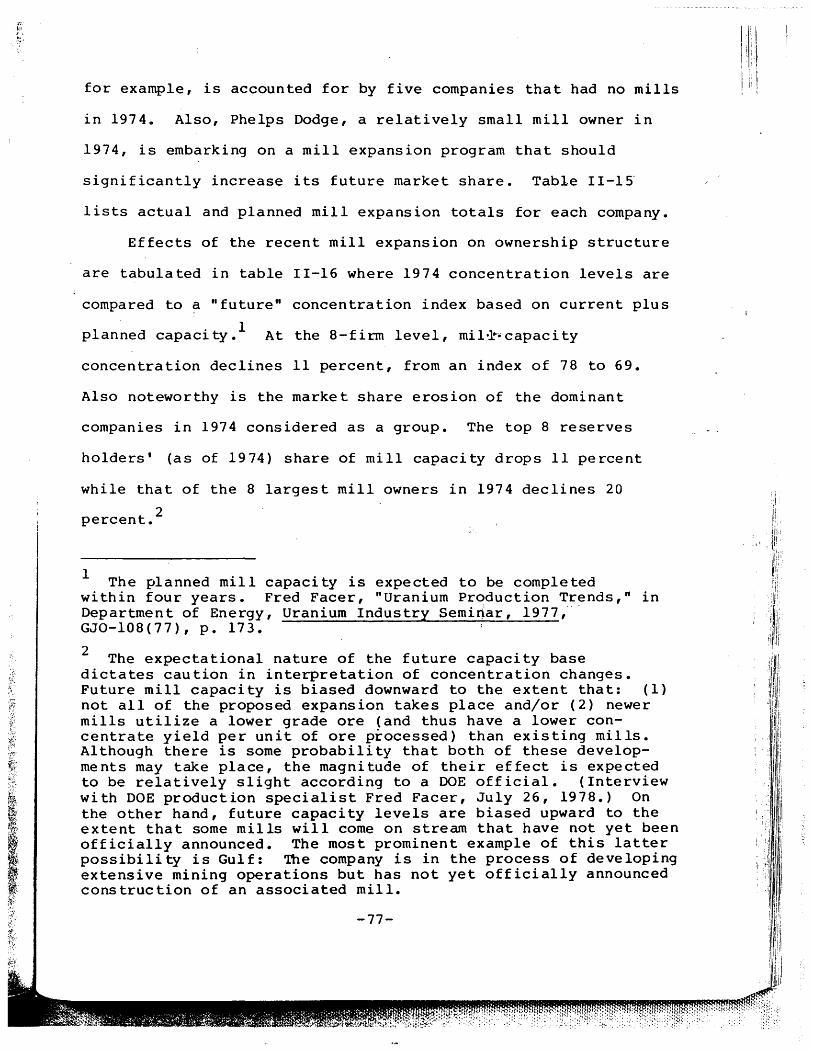
: ... , ~.
for example, is accounted for by five companies that had no mills
in 1974. Also, Phelps Dodge, a relatively small mill owner in
1974, is embarking on a mill expansion program that should
significantly increase its future market share. Table 11-15'
lists actual and planned mill expansion totals for each company.
Effects of the recent mill expansion on ownership structure
are tabulated in table 11-16 where 1974 concentration levels are
compared to ~ "future" concentration index based on current plus
planned capacity. 1 At the 8-firm level, milol-'''capacity
concentration declines 11 percent, from an index of 78 to 69.
Also noteworthy is the market share erosion of the dominant
companies in 1974 considered as a group. The top 8 reserves
holders' (as of 1974) share of mill capacity drops 11 percent
while that of the 8 largest mill owners in 1974 declines 20
2 percent.
1 The planned mill capacity is expected to be completed within four years. Fred Facer, "Uranium Production Trends," in Department of Energy, Uranium Industry Semiriar, 1977,' GJO-l08(77), p. 173.
2 The expectational nature of the future capacity base dictates caution in interpretation of concentration changes. Future mill capacity is biased downward to the extent that: (1) not all of the proposed expansion takes place and/or (2) newer mills utilize a lower grade ore (and thus have a lower concentrate yield per unit of ore processed) than existing mills. Although there is some probability that both of these developments may take place, the magnitude of their effect is expected to be relatively slight according to a DOE official. (Interview with DOE production specialist Fred Facer, July 26, 1978.) On the other hand, future capacity levels are biased upward to the extent that some mills will come on stream that have not yet been officially announced. The most prominent example of this latter possibility is Gulf: The company is in the process of developing extensive mining operations but has not yet officially announced construction of an associated mill.
-77-
.'
; II , i !!
'.1 I:
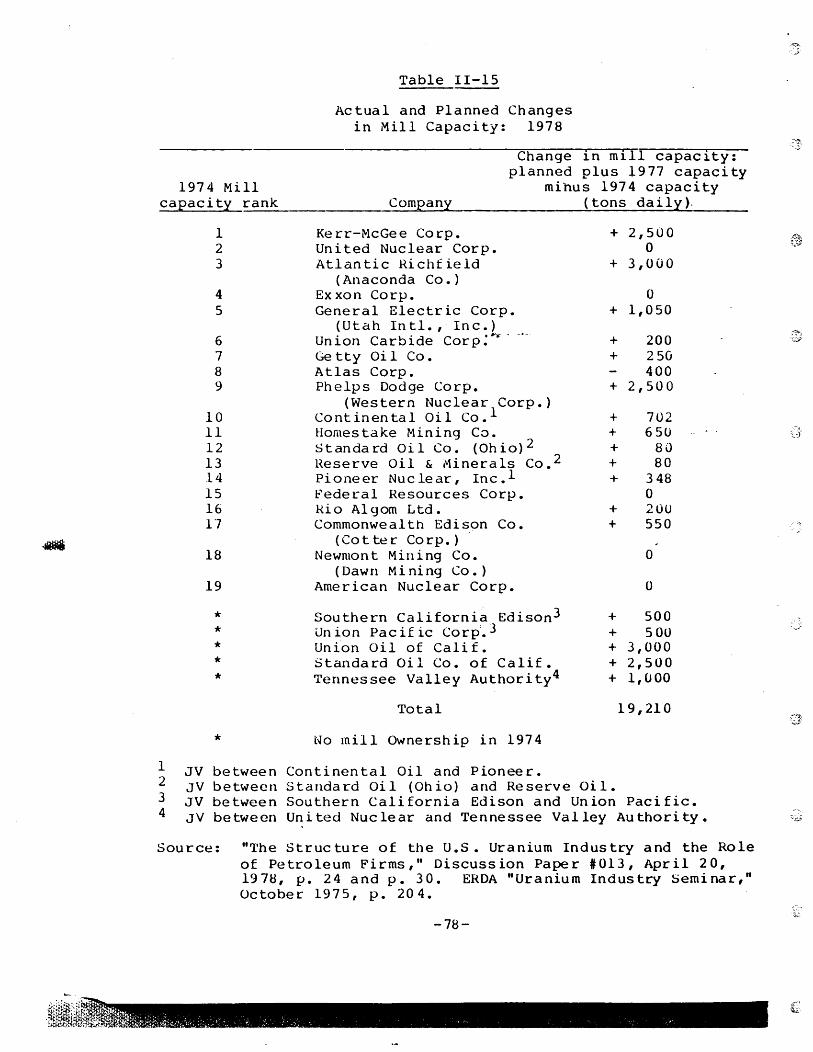
'.
1974 Mill
Table II-IS
Actual and Planned Changes in Mill Capacity: 1978
capacity rank Company
Change in mill capacity: planned plus 1977 capacity
mihus 1974 capacity (tons daily).
1 2 3
4 5
6 7 8 9
10 11 12 13 14 15 16 17
18
19
* * * * *
* 1 JV between 2 JV between 3 JV between 4 JV between
Kerr-McGee Corp. United Nuclear Corp. Atlantic Richfield
(Anaconda Co.) Exxon Corp. General Electric Corp.
(Uta.h IntI., Inc.) Union Carbide Corp:~'" -.-Ge tty Oi 1 Co. Atlas Corp. Phelps Dodge Corp.
(Western Nuclear Corp.) Continental Oil Co. l Homestake Mining Co. Standa rd Oi 1 Co. (Oh io) 2 Reserve Oil & Minerals Co.2 Pioneer Nuclear, Inc. l Federal Resources Corp. kio Algom Ltd. Commonwealth Edison Co.
(Co t te r Co rp. ) Newmont Mining Co.
(Dawn Mining Co.) American Nuclear Corp.
Southern California Edison 3 Union Pacific Cor~.3 Union Oil of Calif. Sta.ndard Oil Co. of Calif. Tennessee Valley Authori ty4
Total
No mill Ownership in 1974
+
+
+
+ +
+
+ + + + +
+ +
+ + + + +
Continental Oil and Pioneer. Standard Oil (Ohio) and Reserve Oil.
2,500 0
3,000
0 1,050
200 250 400
2,500
702 650
80 80
348 0 20U 550
0
0
500 SOU
3,000 2,500 1, (J 00
19,210
Southern California Edison and Union Pacific. U~ited Nuclear and Tennessee Valley Authority.
Source: "'l'he Structure of the U.S. Uranium Industry and the Role of Petroleum Firms," Discussion Paper #013, April 20, 197H, p. 24 and p. 30. ERDA "Uranium Industry Seminar," October 1975, p. 204.
-78-
(Jg ": .. ~ ..
~~
::.,;;
.--~
,;:";1) ..:.~'
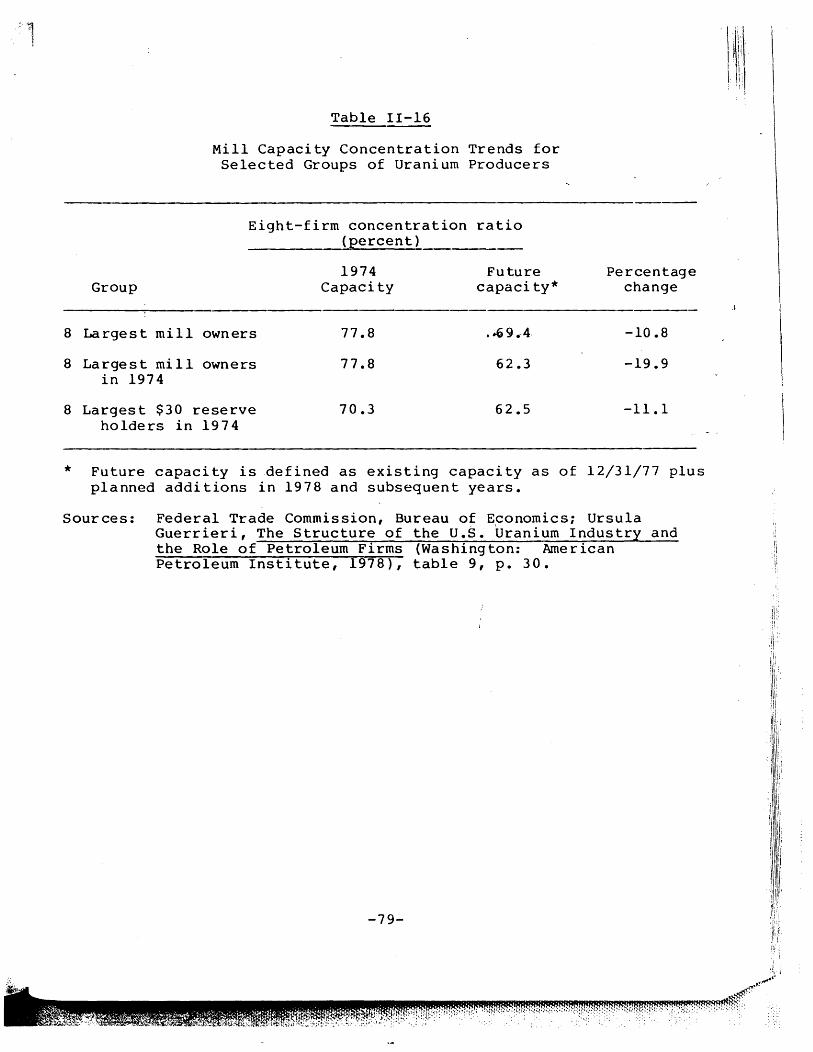
8
8
8
*
Group
Largest mill
Largest mi 11 in 1974
Largest $30
Table 11-16
Mill Capacity Concentration Trends for Selected Groups of Uranium Producers
Eight-firm concentration ratio (percent)
1974 Future Capacity capacity*
owners 77.8 • .0 9 .-4
owners 77.8 62.3
reserve 70.3 62.5 holders in 1974
Percentage change
-10.8
-19.9
-11.1
Future capacity is defined as existing capacity as of 12/31/77 plus planned additions in 1978 and subsequent years.
Sources: Federal Trade Commission, Bureau of Economics; Ursula Guerrieri, The Structure of the U.s. Uranium Industry and the Role of Petroleum Firms (Washington: American Petroleum Institute, 1978), table 9, p. 30.
To summarize, the level and diversity of the recent upsurge ~
in exploration activity appears to be significant. Although its
full effect cannot yet be delineated, it appears tha~ this ri~e
in exploratory effort is creating a greater diffusion in seller
structure than that observed in 1974. Appreciable mill expansion
efforts have been undertaken by relatively small existing millers
as well as by new entrants. Such a development tends to confirm
the a priori analysis in section 3 wRer-e-·-it was concluded that
entry barriers in the uranium supply sector are not high. Th~
events reviewed in this section suggest that smaller producers
and new entrants can in fact successfully expand output in.
response to favorable demand conditions.
-80-
-it~~t~~~
E. Summary and Conclusions
The salient characteristics of the uranium supply sector
reviewed in this chapter can be summarized as follows: ~
(1) The production cycle consists of four stages:
exploration, development, mining, and milling. The discovery of
a commercial ore deposit through exploration and development
leads to construction of a mine, followed by erection of a mill
for transformation of the ore into uranium concentrate. The
mining and milling stages are closely linked since high trans-
portation costs dictate that the mill be located close to the
mi"ne site. At present a high degree of integration exists
between mining and milling: The bulk ot ore milled by a company
is also mined by it.
(2) Appro> .. _nately 7.5 percent of uraniu~ concentrate is sold
under long-term contracts. Most sales are made by mill owners to
utilities. The distinction between seller and purchaser sectors
is becoming increasingly less clearcut as uti~ities become more
involved in the production stage. Such backward integration has
taken place through exploration financing agreements with
independent producers and, more directly, through the establish-
ment of production subsidiaries by utilities. Forty-seven per-
cent of all uranium concentrate committed for delivery in 1985 is
characterized by some form of purchaser control at the produc-
tion stage.
(3) Scale economies are relatively minor at the explora-
tion stage where technology permits efficient search activity by
-81-
a large number of companies. Although scale related efficienciE
are potentially more significant at the mining and milling
stages, their effect has been limited by the typical deposit siz
which dictates a smaller scale of plant than the theoretical
maximum.
(4) Capital costs necessary for entry into the exploration
stage are not substantial. CapitCiT' ·e-X-penditures are signifi-
cantly higher at the mining and milling stages where combined
initial investment is currently estimated at upward of $70
million. Such investment expenditures do not constitute an
important impediment to entry, however, since a company's demon-
stration of a commercial ore deposit (the possession of which
leads it to require a mine-mill complex in the first place)
allows it to obtain adequate financing from either the capital
market or purchasers of the final concentrate output.
(5) As conventionally defined, seller concentration based
on output measures is relatively high. Based on various output
and capacity indices, the 8-firm concentration ranged from 71 to
86 percent in 1974. These levels are significantly higher than
corresponding levels in other energy sectors and greater than th'
average 8-firm index for the manufactur.ing sector. Yet the con-
centration of current productive capacity (i.e., the relative
domination over future uranium supply generation by a specified
number of firms) appears much lower than output concentration
levels would indicate. For example, 17 firms in 1974 were
-82-
included in at least one top 8 uranium activity (reserves,
production, acreage holdings, drilling footage). Since that
time, a numb er of othe r produc ers "have shown, th rough mi 11 con-
struction plans, significant supply generation ability. Five
such companies had no mill facilities at all in 1974. The down-
ward trend in exploratory effort concentration levels (i.e.,
those based on exploratory drilling and acreage held for
exploration) may presage a further diffusion"o{-productive
capacity in the future.
The above characteristics lead us to conclude that the
uranium supply sector is organized in a workably competitive
manner. The principal area of competition takes place at the
exploration stage where producers vie for the right to supply
uranium to utilities under long-term contracts. There exists
within this market a large and diverse set of potential
suppliers, including the utilities themselves. In addition, the
lack of significant entry barriers into urqnium production
suggests t~at the distribution of productive capacity is capable
of further diffusion in response to the anticipated growth in
uranium demand. We thus observe that the two necessary
conditions for a non-competitive structure, control of productive
capacity by a few producers and the existence of significant
barriers to entry, are absent from the uranium supply market.
-83-
""'j
: I
Chapter III
Interfuel Competition, Petroleum Firms, and the Competitive Potential of the Uranium Supply Mark'et
Chapter II evaluated the uranium industry in the context of
a separate market. We now consider the competitive potential of
the industry from the perspective of a ~ider energy market where
uranium is presumed to compete with other fuels. From this
viewpoint the key issue to be analyzed CGncerns the effect of
petroleum firm entry on the industry's competitive potential.
Since these firms produce fuels that may compete with uranium, a
possibility exists that their emphasis on uranium supply
expansion will be less than that of an independent firm with no
such conflicting interests to consider.
The first section reviews the role of petroleum firms in the
uranium sector. The second section summarizes the nature" and
extent of interfuel competition. In the third section we analyze
the competitive implications of petroleum firm entry into
uranium.
.~
A. 1 Petroleum Firm Interest in the Uranium Industry
The uranium sector is dominated by firms whose primary source
of revenue lies in other sectors of the economy. Measured by
1977 mill capacity, petroleum firms are the most important
industry group, accounting for over 42 percent of productive
capacity. Independent uranium firms, in contrast, account for
less than 20 percent of mill capacity. Among other industries
reRresented are Electrical Equipment, Electric Otilities, and
miscellaneous mineral and mining industries (tablg"rtI-l).
Petroleum company interests extend to all facets of the
uranium sector. As a group they account for approximately 55 per-
cent of 1974 reserves and smaller, but significant, portions of
drilling effort, acreage, and production (table 111-2). This
reflects a significant" increase from 1965 "~hen the petroleum
2 group's share of reserves totaled 31 percent. ; Signs point
to a continued rise in petroleum sector interest since firms
primarily classified as petroleum companies account for over 60
percent of the mill expansion planned as of the beginning of I
1978. 3 Table 111-3 lists those p"etroleum firms with mill
capacity as of the end of 1977.
1 The petroleum group totals in this section include Anaconda's interests under those of Atlantic Richfield. Anaconda was officially acquired by Atlantic Richfield on January 12, 1977, pursuant to an agreement reached on July 26, 1976. Atlantic Richfield had earlier purchased 27 percent of Anaconda common stock on March 31, 1976.
2 Thomas Duchesneau, Competition on the U.S. Energy Industry (Cambridge, Mass: Ballinger, 1975), p. 19.
3 See table II-IS, above.
-85-
;":I~~{>~m83: ~ .•. ~~
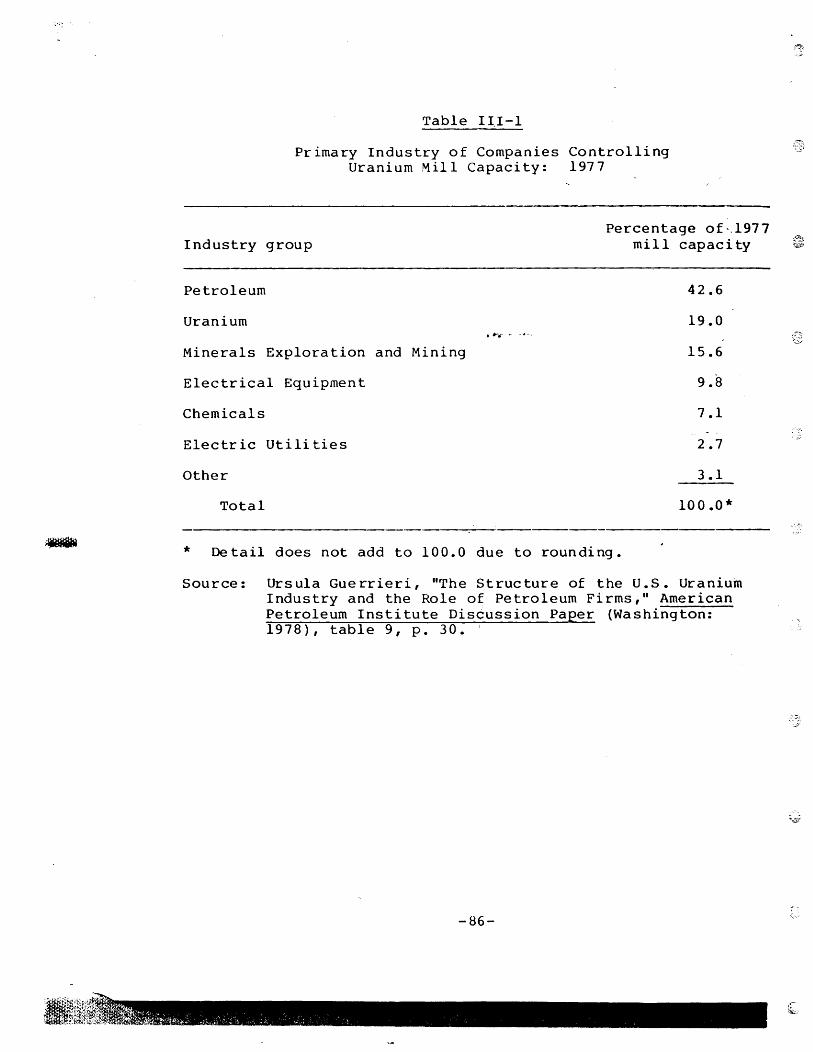
Table 111-1
Primary Industry of Companies Controlling Uranium Mill Capacity: 1977
Percentage of'.1977 mill capacity ~ Industry group
Petroleum
Uranium ,"'t;- o. - .. -
Minerals Exploration and Mining
Electrical Equipment
Chemicals
Electric Utilities
Other
Total
* Detail does not add to 100.0 due to rounding.
42.6
19.0
15.6
9.8
7.1
2.7
3.1
100.0 *
Source: Ursula Guerrieri, "The Structure of the U.S. Uranium Industry and the Role of Petroleum Fi rms," American Petroleum Institute Discussion Paper (Washington: 1978), table 9, p. 30. '
-86-
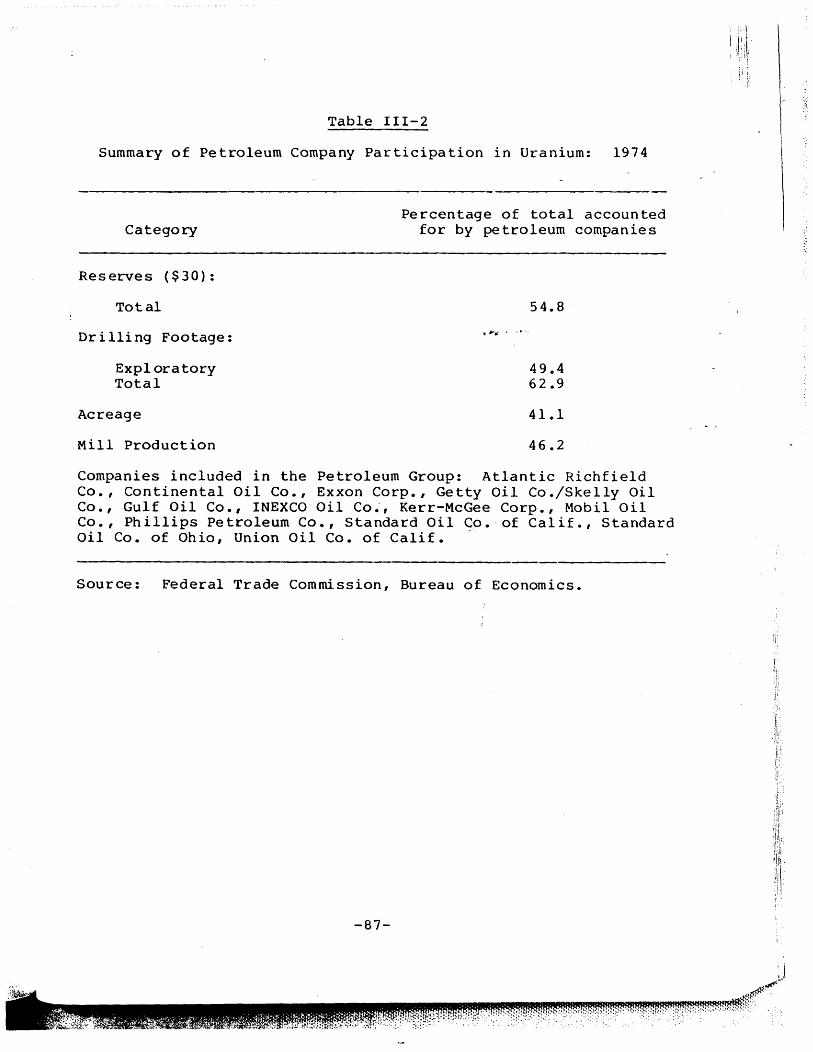
Table 111-2
Summary of Petroleum Company Participation in Uranium: 1974
Category
Reserves ($30):
Total
Drilling Footage:
Exploratory Total
Acreage
Mill Production
Percentage of total accounted for by petroleum companies
• #-'.- •
54.8
49.4 62.9
41.1
46.2
Companies included in the Petroleum Group: Atlantic Richfield Co., Continental Oil Co., Exxon Corp., Getty Oil Co./Skelly Oil Co., Gulf Oil Co., INEXCO Oil Co~, Kerr-McGee Corp., Mobil Oil Co., Phillips Petroleum Co., Standard Oil Co. 'of Calif., Standard Oil Co. of Ohio, Union Oil Co. of Calif. -
Source: Federal Trade Commission, Bureau of Economics.
-87-
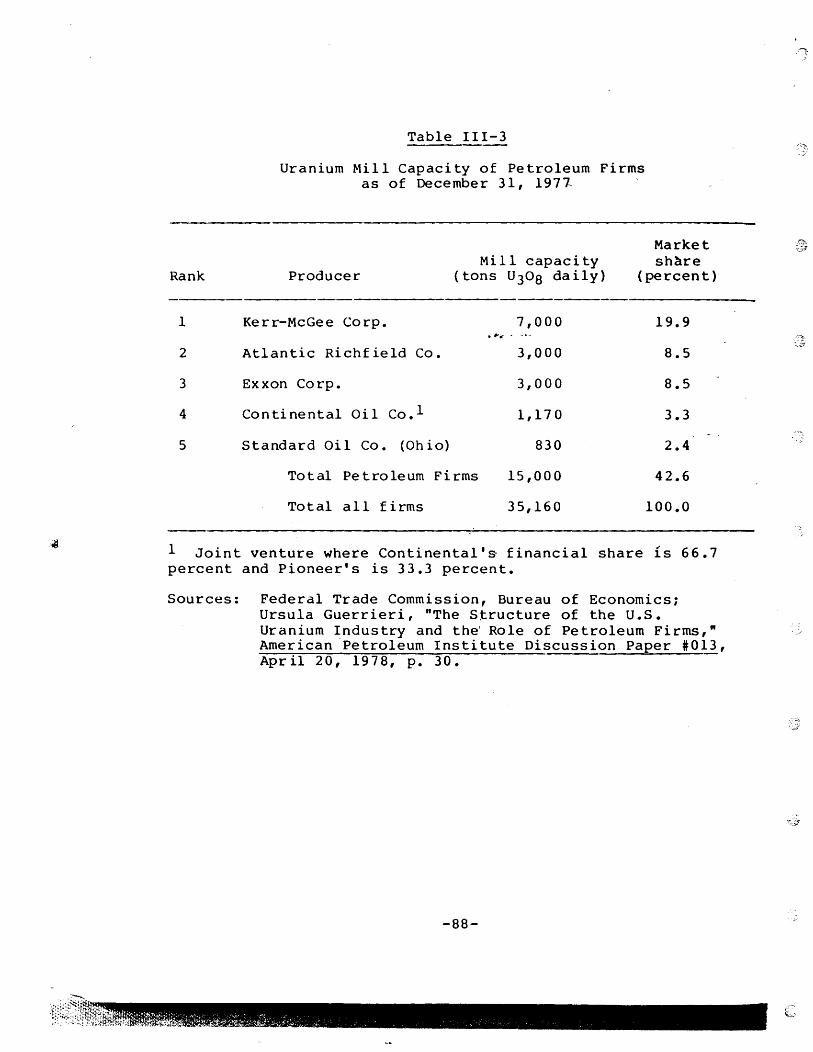
" ...
Rank
1
2
3
4
5
Table 111-3
Uranium Mill Capacity of Petroleum Firms as of December 31, 197~
Producer
Kerr-McGee Corp.
Atlantic Richfield Co.
Exxon Corp.
Continental Oil Co.l
Standard Oi 1 Co. (Oh io)
Mill capacity (tons U308 daily)
7,000 . ...... -.-. 3,000
3,000
1,170
830
Total Petroleum Firms 15,000
Total all firms 35,160
Market sh~re
(percent)
19.9
8.5
8.5
3.3
2.4
42.6
100.0
1 Joint venture where Continental's financial share is 66.7 percent and Pioneer's is 33.3 percent.
Sources: Federal Trade Commission, Bureau of Economics; Ursula Guerrieri, "The Structure of the U.S. Uranium Industry and the' Role of Petroleum Firms," American Petroleum Institute Discussion Paper #013, Ap r i 1 2 0 , 19 7 8 , P • 3 0 •
-88-
~'~fF~~~:~}f~~~"'i;' '·*,~;~;:, .. ~.-'i1 ..• ~;-;:,;.;~~J.':'l" ;~:"'.''- " . "
B. Uranium and Interfuel Competition
The demand for uranium is derived from the demand for
nuclear fuel which in turn is derived from the demand,for nuclear
reactors by utilities. In addition to nuclear fuel, utilities
also purchase oil, natural gas, and coal for their generating
facilities. The degree of competition among these fuels in the
utility market is far from uniform, however. In the short run,
where utili ties purchase fuel to supply exist)..pg -.facili ties,
relatively little competition takes place since most plants are
not equipped to switch profitably from one fuel to another. l
Uranium is particularly immune from such shortrun competition
since the relatively low operating costs of nuclear reactors
dictate that they be fully utilized within a wide range of
2· nuclear fuel costs.
The most significant potential for interfuel competition
takes place in a longrun context via competition between rival
generating systems. Fuels compete with each :other to the extent
that their costs represent a component in the overall cost of the
generating facilities. In this market, the principal competitors
are nuclear and coal plants. Petroleum fuel products, in
contrast, are a relatively insignificant element due to a series
1 U.s. Department of Jvstice, Competition in the Coal Industry (Washington: U.s. Government Printing Office, 1978), pp. 37-38.
2 U.S. Department of Energy, Energy Information Administration, Annual Report to Congress, vol. II, 1977, DOE/EIA-0036/2, p. 205.
-89-
of economic and regulatory developments that have severely eroded
their viability in the electric utility market. The OPEC
stimulated rise in oil prices has practicall~ eliminated that
fuel from consideration in the choice of new power plants. l
In addition, Government policy has attempted to ~iscourage the
use of both oil and natural gas as boiler fuels for new power
2 plants. As a result, projections indicate a significant
drop in the share of the utili ty mark~t· -s-upplied by oil and gas.
Comparison between 1976 and DOE's "mid" (middle) case for 1990
indicates a drop of 50 percent in oil's share and a 64 percent
decline in that of natural gas (table III-4)~3
The principal area of interfuel competition in the electric
utility market takes place between nuclear and coal power
generating plants. These two systems are close substitutes from
the view of utilities desirous of expanding their electrical
1 For example u.s. Department of Justice calculations indi-cate that the price of oil would have to fall from 35 to 75 per- 'v
cent for it to prove 'competitive with coal in the relevant elec-tric utility regional markets. U.S. Department of Justice, OPe
cit., p. 34. See also, Department of Energy, Annual Report to congress ••• , OPe cit., p. 214.
2 U.S. Department of Energy, Annual Report to Congress Ji ••• , ~. cit., p. 205.
3 Another possible uranium-petroleum link is through the transformation of coal into synthetic forms of crude oil and natural gas. These processes would allow coal to compete with
,oil in non-utility markets such as transportation. This development would indirectly link uranium to petroleum through the former's competition with coal. The near term outlook for synthetic is not optimistic, however. DOE's estimates place 1990 output of such products at well under 1 percent of total projected energy supply. (Ibid., p. 229.)
-90-
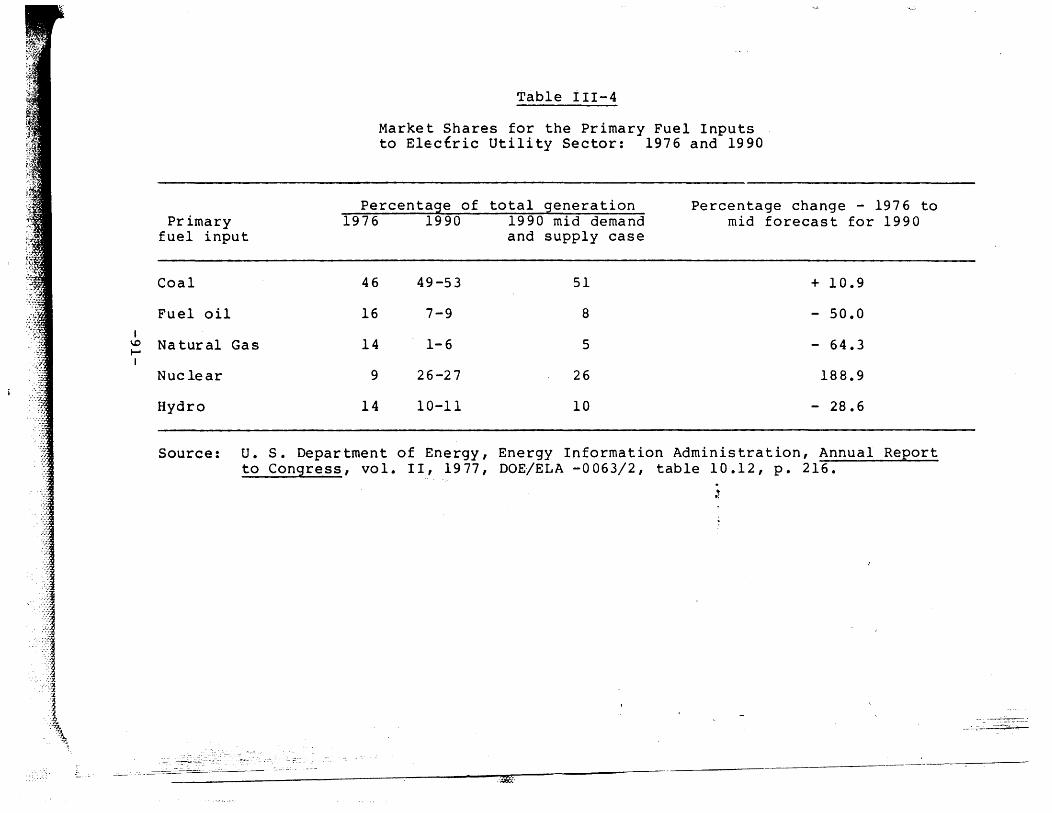
I \0 ...... I
Primary fuel input
Coal
Fuel oil
Na tura1 Gas
Nuc lear
Hydro
Table iII-4
Market Shares for the Primary Fuel Inputs to Electric Utility Sector: 1976 and 1990
Percentage of total generation Percentage change - 1976 to 1976 1990 1990 mid demand mid forecast for 1990
and supply case
46 49-53 51 + 10.9
16 7-9 8 - 50.0
14 1-6 5 - 64.3
9 26-27 26 188.9
14 10-11 10 - 28.6
Source: U. S. Department of Energy, Energy Information Administration, Annual Report to Congress, vol. II, 1977, DOE/ELA -0063/2, table 10.12, p. 216 • .
• j
-:::-
-~-
- -- ~-~.-::...: --:..,;~-:.. ..... --:.-::-- - -",
'-'~
:,!iJi~4{~:'
· . t 1 generatlon capacl y. It is as necessary inputs for such
systems that coal and uranium compete with each other. Uranium's
influence in this competition is somewhat muted, however,
because it represents a relatively small portion of total nuclear
power costs. According to a recent study, the cost of ~canium
concentrate accounts for only 10 percent of total costs at tbe
b b f 1 . 1 2 us ar or a nuc ear generatlon pant. As a result, changes
in the price of uranium concentrate generate a proportionately
lower change in the cost of a nucl~a~.power plant. For example,
a 50 percent increase in the price of uranium would, cet. p~r.,
increase the cost of a nuclear power plant by approximately 5
percent.
To conclude, uranium's competition for utility sales comes
chiefly from coal, primarily in the market for new generating
systems. Little competition is expecte9 to take place between
uranium and petroleum products due to a series of economic and
regulatory developments that have severely constrained the abil-
ity of the latter to compete effectively in the market for
utility purchases.
1 Electric Power Research Institute (EPRI), Coal and Nuclear Generating Costs (Palo Alto, Calif., 1977). This study finds that coal and nuclear power generation are "economically attractive" in all regions of the country (p. 6).
2 Nuclear Energy Policy Study Group, Nuclear Power Issues and Choices, The Mitre Corporation for the Ford Foundation (Cambridge, Mass.: Ballinger, 1977), table 3-3, p. 126. This estimate is for a midwestern plant expected to begin operation in 1985. It is based on a price of $30/1b for U308. Other assumptions: tails assay of 0.20 percent; no reprocessing of spent fuel; costs of $3.33/kg for conversion, $80/kg/SWU for enrichment, and $90/kg for fabrication. All costs are in terms of mid-1976.
-92-
C. Eva luation
To restate the issue: Does the growing influence of petro-
leum fi rms in the uranium supply sector crea te a ser,ious anti-
competitive situation? An affirmative answer to this que~~ion
is based on either (or both) of two potential monopolistic
scenarios. Under the first, the withholding theory, petroleum
ficms restrict uranium supply in order to support the price of
petroleum and thus maintain the value of the~r petroleum
investments. The second entails a straigh tforward monopoly
maneuver where entry into uranium is part of an overall plan to
control a relevant portion of the energy market. Under this
latter scenario, the objective is not to "protect" one fuel
vis-a-vis another but, rather, to obtain a dominant position in
both so as to pursue a monopolistic supply strategy aimed at the
combined fuel market. The uature of interfuel competi tion
suggests that the most likely target in this context would be a
combined coal-uranium market. We now evalu:ate the plausibility
of these two scenarios from "the standpoint of the uranium market.
1. Uranium Entry as a Means of Protecting Petroleum Investments
The withholding theory imputes to petroleum entrants into
uranium both the incentive and the abi Ii ty "to set the supply of
uranium at a level below that desired by an independent uranium
producer. The aim of this strategy is not to make supernQrmal
profits in uranium but to protect returns to investments in the
petroleum sector. This story is unconvincing since current
supply and demand conditions within the relevant energy sectors
-93-
suggest that a withholding action by petroleum companies is
unlikely. The following factors are particularly relevant:"
a. A key element in the withholding theory is the presumed
sensitivity of petroleum demand to changes in uranium supply. It
is this link that creates the incentive for petroleum firms to
restrict uranium supply. In fact, analysis suggests that move-
ments in uranium supply will have l±ftlEf" influence on .the marke t
for petroleum products. As noted in section ~, the principal
area of competi tion invol vi ng uranium takes place in the rna rket "
for new generating systems. Due to a series of economic and"
gove rnme ntal developments, petroleum produc t~ are not expe cted to
playa significant role in this market. The uranium-petroleum
linkage is further reduced by the rela tive insensi tivi ty of the
cost of nuclear powe~ to changes in uranium price. The estimates
presented earlier suggest that to create a 5 percent increase in
nuclear power cost, uranium price would have to rise by 50
percen t.
b. The withholding scenario necessarily imputes to the
petroleum firms the ability to raise the price of uranium by
restricting its supply. Analysis indicates that the structure of
the" uranium supply marke t is not conduci ve to such action. 'fue
industry's relatively low entry barriers act as a constraint on
a ttempts a t monopolistic supply control in the long run since
there exists a large nucleus of smaller producers and potential
entrants, often financed by utilities, that appear capable of
-94-
expanding supply to the competi"tive level. Similarly unlikely is
a noncollusive withholding maneuver where an individual petro-
leum firm attempts to raise price, by sitting on uraniqm reserves
so as to force development of less efficient deposits. This
notion implies a deterministic schedule of steeply rising
resource extraction costs from which a producer can calculate his
effect on price. In fact, supply studies indicate a highly
uncertain supply response where a large varie~ ·of. poss ible price
scenerios are possible. l
c. Although the period of observatioti an~ the available
data are inadequate to serve as a conclusive test, the petroleum
firms' behavior in the uranium sector cannot be utilized to sup-
port allegations that they have attempted to restrict supply_ A
likely withholding pattern would be one where petroleum firms
amass sizable stocks of acreage and, possibly, reserves but
engage in relatively little mill capacity expansion. As
indicated by the figures summarized in table 111-5, such a
development has not taken place. While the reserves position of
the petroleum firms is significant, they have pursued a sub-
stantial mill capacity expansion program, accounting for over 60
percent of mill tonnage additions executed or planned as of
1 For example, see the discussion in Electric Power Research Institute, Uranium Price Formation (Palo Alto, California, 1977), pp. 10-1 to 10-37. The study concludes by noting that "it is unwise to underestimate the supply response of U308 to rising prices" (p. 10-37).
-95-
I'
i,i I[
Ii
i:, II, II: '.\:
iij: I· '
iii: Iii' .\\
II" Ill: 1'1 Iii
ill!' 11" qid I\I\!" \,\ii
q\: '\
I Ii . 1\
iii , ,
t \1 II \ Ii' II'!: 1'\ ~ \ \ \,
:::[ 'I
ill
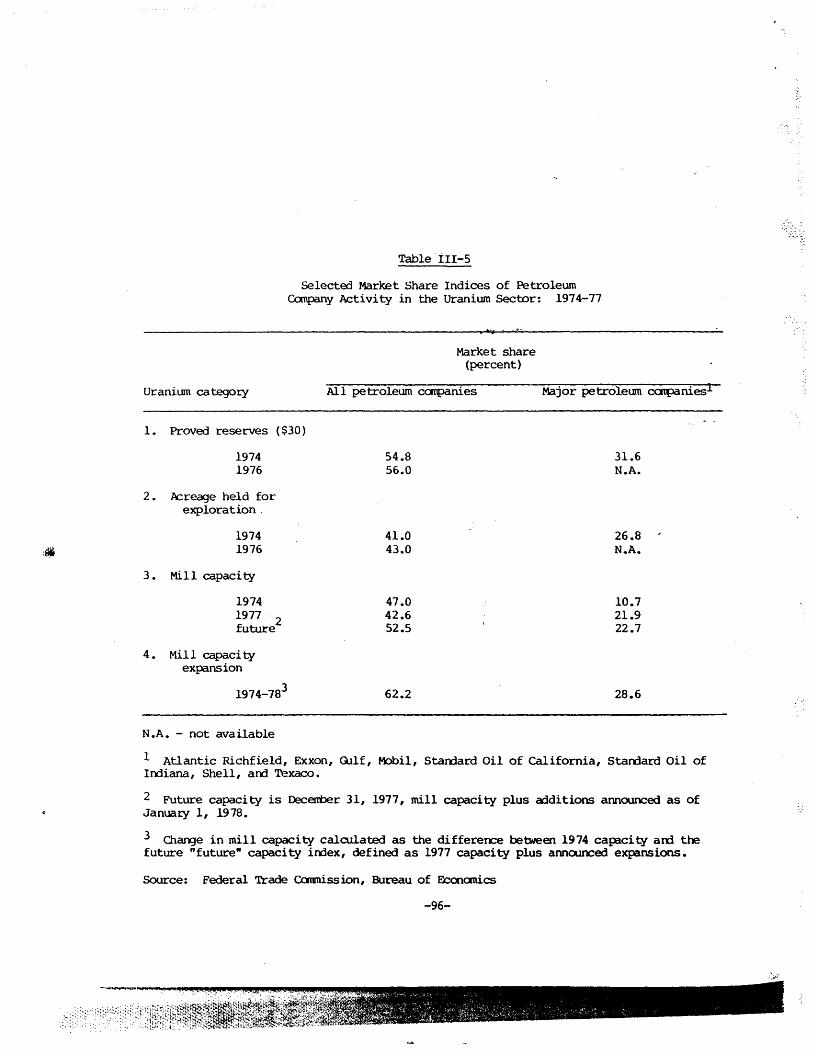
:~
Table 111-5
Selected Market Share Indices of Petroleum Canpany Activity in the Uraniwn Sector: 1974-77
• iii
Market share (percent)
Uranium category All petrolewn carpanies Major petroleum carpanies1
1. Proved reserves ($30)
1974 1976
2. Acreage held for exploration .
1974 1976
3. Mill capacity
1974 1977 . 2 future
4. Mill capacity expansion
1974-783
N.A. - not available
54.8 56.0
41.0 43.0
47.0 42.6 52.5
62.2
31.6 N.A.
26.8 N.A.
10.7 21.9 22.7
28.6
1 Atlantic Richfield, EXXon, Gllf, foDbil, Starrlard Oil of California, Starrlard oil of Irrliana, Shell, arrl Texaco.
2 Future capacity is Deceneer 31, 1977, mill capacity plus additions annourx:ed as of January 1, 1978.
3 Ch~e in mill capacity calculated as the differeoce beboJeen 1974 capicity arrl the future "future" capacity irrlex, defined as 1977 capacity plus annourx:ed expansions.
Source: Federal Trade camri.ssion, Bureau of Econanics
-96-
January l, 1978. Firms within the major producer group have
accounted for approximately 28 percent of mill expansion. l
Also of note, most petroleum firm entry has taken place de
novo rather than via the acquisition of existing companies. 2
Thus, the initial entry movements of petroleum companies have not
represented a corporate transfer of productive capacity but,
rather, additions to it. • /J>l-., • _.-.
To conclude, the withholding theory of petroleum firm entry
into uranium does not appear likely. Under present conditions
petroleum companies possess neither the incentive nor the ability
to pursue such a strategy. Furthermore, the available evidence
indicates that they have not attempted to do so.
2. Domination of the Coal-Uranium Ma~ket
Since coal is uranium's principal effective competitor,
joint ownership of coal and uranium interests becomes the more
important antitrust issue. From this viewpoint, the diversifica-
tion efforts of petroleum firms a.re relevant priinarily because of
the apparently greater tendency of such firms to enter both coal
and uranium marke ts. (For example, 7 of the 10 companies sur-
veyed by the FTC that maintained both coal and uranium reserves
I As commonly defined, thes~ are: Atlantic Hichfield, ~xxon, Gulf, Mobil, and Standard Oil of California. The remaining members of the major group for which no milling activity was recorded are Shell Oil, Standard of Indiana, and Texaco.
2 The principal exception is the 1977 acquisition of Anaconda by Atlantic Richfield.
-97-
1~~;,iS;i#A:,1 A&¥bNf;!I¥¥¥$.Mf.1if§t#ffl¥hiiR··X.?fMpt~!'H~f"""*¥ffl¥&i'~X~Hl~X'~'{,~~':-~~'~~~'~~~'~'''~'N.~(~~~'~~~(~~!.p~~!;~~('(~''f'~~~':'!'~~:"";" ::i~~·\~·~I.~{~;' .,' -,' .
~'.
were classified as petroleum companies.)l Objections to such
energy diversification efforts stern from the fear that they will
lead to higher prices in one or both of the coal and u~anium
markets. From this viewpoint, the concern is that energy con-'.
glomerates will minimize the effect of interfuel competition by
pursuing a joint fuel supply strategy. At the extreme, this posi-
tion is based on the pren,ise that coal and uranium trade in the
same market so that simultaneous entry into both fuel sectors . ~ ... ---. represents a horizontal expansion movement leading eventually to
monopolistic domin&tion by a few petroleum firms.
The degree to which the concern over multi-fuel ownership is
valid depends on the susceptibility of the coal and uranium
sectors considered individually to monopolization. The undesir-
ability of cross ownership is greatest when each sector is cap-
able of being organized in a monopolistic fashion since such a
pattern negates the deconcentrating effects of a widening market.
Alternatively, multi-fuel ownership cannot create a monopolistic
environment where each sector is competitively structured. The
following simplified example illustrates the nature of these con-
siderations.
Consider an industry with two regionally distinct production
centers, A and B. Due to minimal transportation costs, the goods
1 This finding probably overstates the relative importance of petroleum firm multi-fuel ownership, however, since the FTC coal survey placed a special emphasis on obtaining returns from coal owning petroleum companies. See, E. Pantos, R. Smith, Structure of the Nation's Coal Industry, 1964-74, FTC Staff Re po r t ( Was h • : U • S. Go v t. Pr i n t i ng Off ice, 19 7 8 ), p • 9.
-98-
'~l(;;l'i~ ,,'·i;;.~; J" !c~:- >.: :1 .... ~ ,:.~~: <,' ,,",,~..:f.,.. " -
from each center trade in the same market. An antitrust policy
issue that arises is whether companies should be allowed to own
production facilities in both geographic areas. Polar situations
of high and low anti-competitive potential stemming from multi-
area ownership are the following:
a. High anti-competitive potential. Each area can be clas
sified as a "natural monopoly" where technology· .... afc'tates a single
seller. In this case, dual ownership implies that the same
seller will prevail in both areas, leading to a single firm
monopoly for the industry as a whole. A ban on such ownership is
clearly preferable here since it doubles the number of sellers,
from one to two.
b. Low anti-competitive potential. Stru~tural conditions in
A and B are such that a large number of sellers can be accommo-
dated in each. Specifically, consider a case where 30 sellers
can be accommodated in each area, each with th~ same share of
productive capacity. In this situation, chances of anti-
competitive effects from dual area ownership become remote.
Since concentration in each area is low, the concentration in the
combined national market must be low also. In the "worst" case,
where the 30 firms in one area have identical positions in the
other, concentration in the aggregate market remains at the same
level as each area considered individually. Since the latter
were deemed competitive, a similar organization for the aggregate
rna rke t must be judged likewise.
-99-
The coal-uranium case obviously does not precisely fit either
of the above examples. The situation does appear much closer to
the second case than to the first. However, .structural condi..-;
tions within the two sectors, as well as the actual pattern of
multi-fuel ownership, suggest that the anti-competitive potential
of petroleum firm entry into coal and uranium is quite low.
In regard to structure, neither coal nor uranium appear sus-
ceptible to monopolization--through ei .. the-r internal expans ion or
new entry by petroleum firms. Both sectors exhibit relatively
moderate entry barriers and are expected to experience high
growth rates in demand over the near term.future. l The trend.
in production concentration levels has followed a similar pattern
in both sectors: significant increases during the 1960's when
demand was slack, followed by slight declines in the 1970's as
supply expanded in response to more optimistic market conditions.
This latter development reflects in part the record of entry,
1 Th~ nature of seller structure in the uranium market is descr1bed in chapter II of this report. '!he following studies have found the coal industry to be structured in a workable competitive manner: u.s. ~partment of Justice, Competition in the Coal Industry, ~. cit.; Electric Power Research Institute, Coal Price Formation (Palo Alto, Calif.: 1977) EPRI/EA - 497, esp. pp. 3-11; General Accounting Office (GAO), The State of Competition in the Coal Industry (December 30, 1977) EMD -78-22; E. Pantos, R. Smith, The Structure of the Nation's Coal Industry, OPe cit. A number of the above reports point out the possibilitY-of-ruture problems in the western coal market if Federal leasing does not resume. For a view holding that the coal sector is susceptible to monopolization, especially by petroleum firms, see H. Sanger and W. Mason, The Structure of the Energy Markets: A Report of TVA's Antitrust Invest1gation of the Coal and Uranium Industries (Tennessee Valley Authority: February 1979).
-100-
which has been significant. Based on projected supply and demand
conditions, scale economies in both sectors appear to allow for
the coexistence of a large and diverse population of firms.
In addition to the competitive structure of the coal and
uranium sectors, the effect of dual fuel ownership on aggregate
concentration levels for a composite energy market has so far
Deen minimal. 'l'h is can be inferred from table 111-6 which tabu-..... - . ---. lates 1974 coal and uranium reserves for groups of companies
ranked by their $30 uranium holdings. 1 In addi tion reserves
to the nationwide coal market, coal reserves indices for the
2 western region are also presented since it is in this area
that coal and uranium compete most closely in the market for new
3 power generating systems. The resulting pdttern shows
little ownership overlap between the two fuel; sectors. The top 8
uranium reserves holders control less than 8 percent of either
national or western coal reserves. Overall, firms with uranium
reserves holdings account for less than 15 percent of national
coal reserves and approximately 20 percent of western coal
reserves. Only one company ranked within the top 8 uranium
I Coal reserves ffiarket shares are tabulated from responses to the FTC Coal Reserves Survey. The base utilized in deriving company market share is the Geological Survey estima te of total coal reserves less those on unleased Federal lands.
2 The western region includes the following States: North Dakota, South Dakota, Montana, Wyoming, Idaho, Colorado, Utah, Arizona, New Mexico, Alaska, Washington, Oregon, and California.
3 EPRI, Coal and Nuclear Generating Costs, £E. cit., p. 6.
-101-
,\ i 1
•
.~-
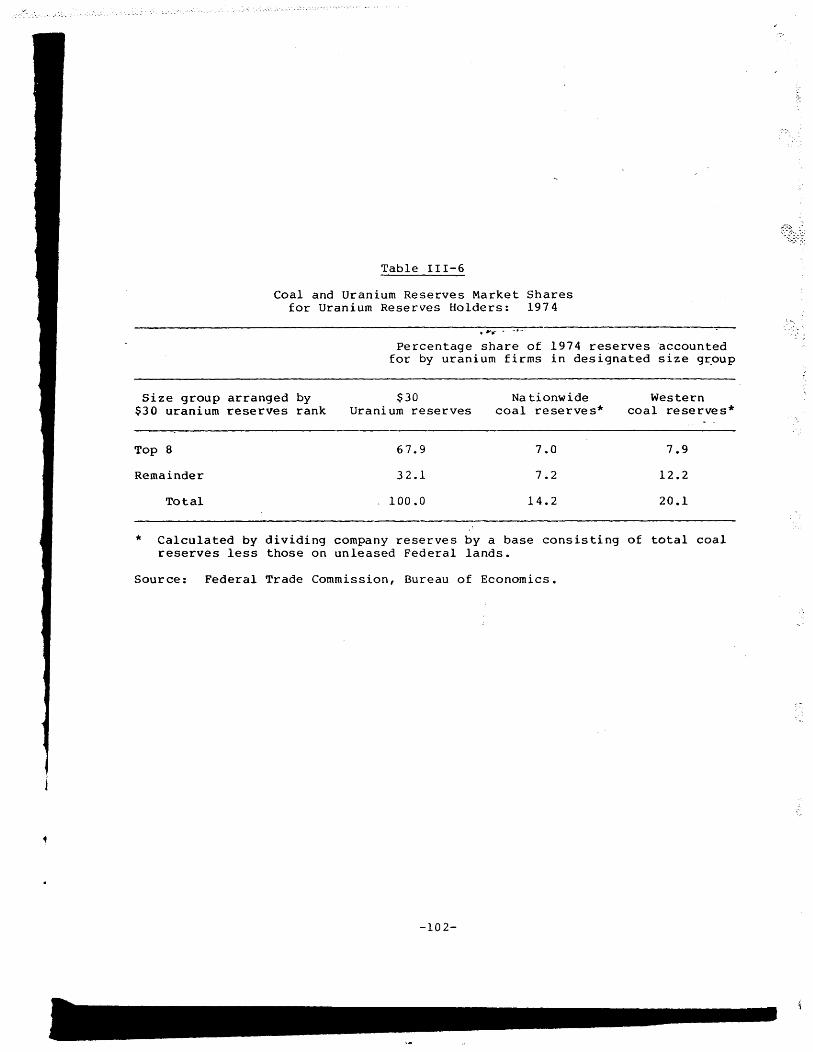
Table 111-6
Coal and Uranium Reserves Market Shares for Uranium Reserves Holders: 1974
.1/>1-.. - • -.-.
Percentage share of 1974 reserves accounted for by uranium firms in designated size g~oup
Size group arranged by $30 uranium reserves rank
Top 8
Remainder
Total
$30 Uranium reserves
67.9
32.1
100.0
Na tionwide coal reserves*
7.0
7.2
14.2
Western coal reserves*
7.9
12.2
20.1
* Calculated by dividing company reserves by a base consisting of total coal reserves less those on unleased Federal lands.
Source: Federal Trade Commission, Bureau of Economics.
-102-
reserves holders has a similar position in the national and
western coal sectors.
The above analysis casts considerable doubt on fears that
energy conglomerates will dominate a combined coal-uranium
market. Viewed separately, neither sector appears susceptible to
domination by a small group of firms, whatever their interests in
other energy markets. In addition, the diversity of multi-fuel . ~ ... -.-.
investments indicates no tendency for the relevant fuel markets
to be controlled by a similar set of firms.
-103-
D. Co nc lu sions
The analysis of this chapter indicates that petroleum firm
entry into uranium does not pose a competitive ~threat.' Two
theories of monopoly effects from such entry were examined. The
first viewed the petroleum firms' interest in uranium as a means
of protecting the value of their oil and gas properties. The
second viewed the petroleum firms' participation in uranium as
part of a strategy designed to dominat&~a-eombined coal-uranium
market. Both of these theories were tound to be unconvincing.
Four principal factors led to this conclusion:
Firs t, t he mod er ate lld tu re of en try ba rr ie cs into ur an ium_ .
make it difficult for any group of companies to set supply levels
rnonopo Ii stically. Structural condi tions are such tha"t a large
and diverse set of companies have sufficient supply capability to
frustrate attempts at monopoly pricing.
Second, the diverse nature of interfuel diversification
contradicts the view of a monoli thic hlovement lcadin~ to uomina-
tion of relevant energy markets by a few petroleum based energy
conglomerates. The top 8 uranium reserves holders, for exam-
pIe, control only 20 percent of petroleum production and less
than 8 percent of coal ceserves. Only one company is ranked
within the top 8 group of petroleum, coal, and uranium reserves
holde rs.
Third, the monopoly theories seriously overstate the current
and expected "degree of interaction between the petroleum, coal,
and uranium markets. Very little interfuel competition takes
-104-
place between petroleum and uran-ium. Uranium and coal do compete
via the rivalry between nuclear and coal powered generating
systems, yet this competition is ~ndirect since each fu~l
comprises a relatively small portion of total generating system
cos ts.
Fourth, petroleum firms have added significantly to produc-
tive c3pacity in the uranium sector. Contrary to the expec-
tations of the monopoly models, they have not si~ply amassed
reserves and acre~ge but are in the process of significantly
expanding the industry's mill capacity. They also have tended to
avoid entry by merger in favor of developing supply capabil ity
through intern~l expansion.
'rhes2: findings L-eCOHll."tcud a~ainst proposals to limit the
participation of petroleum firms in the urani~m ,sector. Con
s ide ring the general importance of unrestricted entry as d
pro-competitive element, attempts to limit such activity should
be undertaken only where a strong case can be made that the net
effect will be positive. In our view, the position in favor of
restrictions on petroleum firm entry into uranium fails to meet
this test at the present time.
-105-
. "
Chapter IV
Policy Hecommendations
A. Antitrust within the Uranium Production Industry
No need for structural antitrust action in the uranium
production sector is apparent at this time. Evidence developed
in this report favors the view that the industry is organiz~d in
a workably competitive manner. Of prime importance, institu-
tional and technological factors proviae' ~in environment of
relatively easy entry. Also, ownership patterns suggest the
development of a relatively unconcentrated seller structure that
shoul d become more di ffuse as the uranium marke t grows.
This finding docs not necessarily imply that monopolistic
activity within the industry cannot occur. A combination of the
uranium market's emphasis on long-t~rm contracts and the some-
times erratic nature of demand may create situations where
short-term, noncompetitive displacements exist. What the
analysis does suggest is that such oc.currences are best
approached through surveillance of the industry's behavior,
rather than by attempts at modification of its structure.
B. Petroleum Firm Entry into Uranium Production
No economic justification for the limitation of petroleum
firm entry into uranium is apparent at this time. The worKably
canpetitive nature of the uranium market, along with the diver-
sity of multi-fuel petroleum company holdings and the limited
nature of interfuel competition (especially between uranium and
petroleum), suggest no significant anti-competitive effects from
-lU6-
"M~~, ,,;~~\;'01:~.;,.~~;~ :j"'"'' , ,". ",' , .
petroleum firm participation. In the absence of such effects,
petroleum firm entry should be viewed as a pro-competitive
development since this activity has generally taken pla?e de novo
and has contributed significantly to the expansion of uranium
milling capacity.
c. Backward Integration of Electric Utilities into Uranium Produc tion
Electric utilities have displayed an increasing preference
for dit"ect participation in the uranium producti"o"n-·stage. This
development raises a difficult policy issue since positive as
well as negative elements are involved.
On the positive side, utility entry into uranium production
can strengthen competition by providing a well-financed, alterna-
tive source of productive capacity., Even the po·tential for such
action can give utilities important leverage.in'their dealings
with producers. Also, control of uranium supply by utilities may
result in efficiency gains due to their ability to avoid certain
transactions costs involved in long-term cont~acts with
1 producers.
On the other hand, u til ity ownership of production facili ties
may create regulatory difficulties. As natural monopolies, the
price charged by a utility for its electricity is regulated on a
cost of service basis in an attempt to approximate competitive
1 A discussion of the efficiency gains from integration is contained in o. E. williamson, "The EcoI~mies of Anti-trust: Transaction Costs Considerations," University of Pennsylvania Law keview (May 1974), pp. 1439-1496.
-107-
'I.;·'.·:·
,', ,'.',
; ii' , ~: ! 'i
I' \ ':'
levels. Such a procedure is frustrated if a backwardly inte-
grated ut~lity can shift monopoly profits to its production
subsidiary by charging an inflated price to itself ~for the ura
nium fuel input. Attempts by regulators to control the input
transfer price charged by integrated utilities may exacerbate the
situation by creating additional distortions. l
Information sufficient to support an opinion on the likely
net effect of the above tendencies is not a~at.1-able. The poten-
tial distortions from utility integration are significant enough,
however, to warrant further investigation into the matter. Such
a probe might be usefully linked with a study' of utility inte-
gration into coal production, such as that recently announced by
the Department of Justice. 2
1 For example, attempts at rate of return regulation can induce firms to seek an inefficiently large base of physical capital. See W. Baumol and A. Klevorick, "Input Choices and Rate of Return Regulation: An Overview of the Discussion," Bell Journal of Economics and Management Science (Autumn, 19tOT; p. 162. ~
2 U. S. Department of Justice, Competition in the Coal Industry, (Washington: U. S. Government Printing Office, 1978) p. 118.
-108-
>;;~~""1i4:.:- .. . ::. . • ". : ... -
APPENDIX A
supplementary Tables
-109-
, --'~~~'''fI!!I'"i' •. ) _________ •
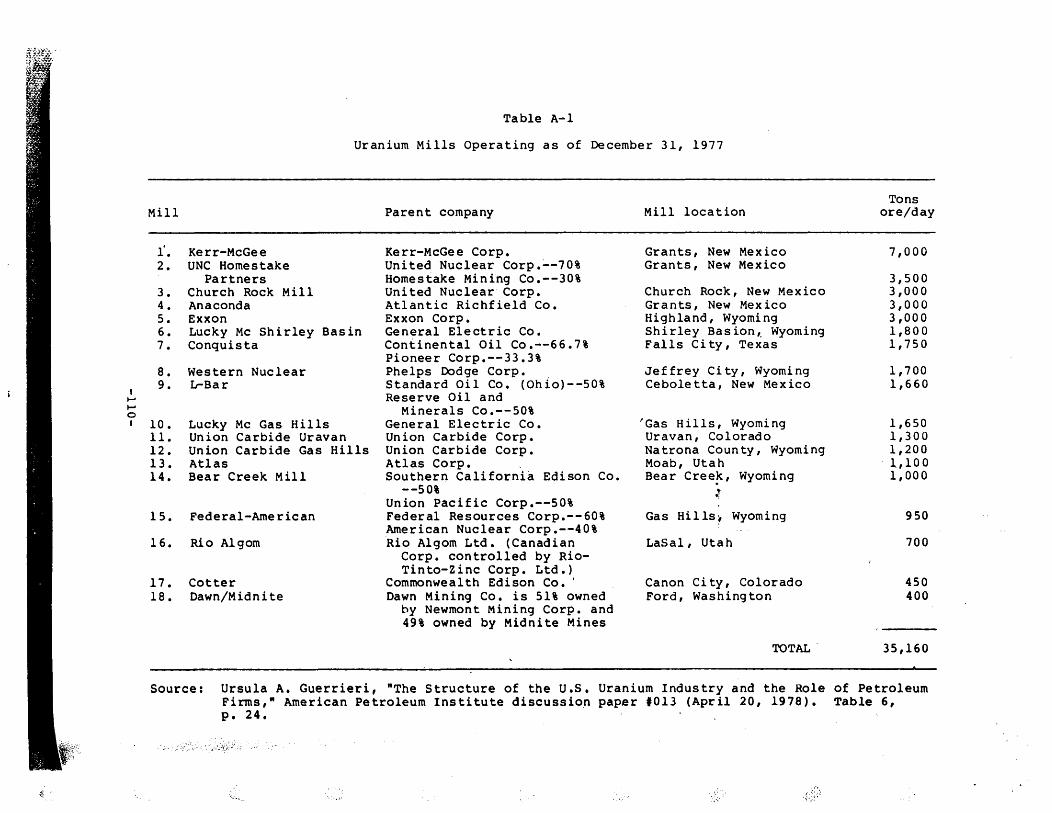
I .... .... 0 I
~~
Mill
1'. 2.
3. 4. 5. 6. 7.
8. 9.
10. 11. 12. 13. 14.
15.
16.
17. 18.
Table A-I
Uranium Mills Operating as of December 31, 1977
Kerr-McGee UNC Homestake
Partners Church Rock Mill Anaconda Exxon Lucky Me Shirley Basin Conquista
Western Nuclear L-Bar
Lucky Me Gas Hills Union Carbide Uravan Union Carbide Gas Hills Atlas Bear Creek Mill
Federal-American
Rio Algom
Cotter Dawn/Midnite
Parent company
Kerr-McGee Corp. United Nuclear Corp.~-70% Homestake Mining Co.--30% United Nuclear Corp. Atlantic Richfield Co. Exxon Corp. General Electric Co. Continental Oil Co.--66.7% Pioneer Corp.--33.3% Phelps Dodge Corp. , Standard Oil Co. (Ohio)--50% Reserve Oil and
Minerals Co.--50% General Electric Co. Union Carbide Corp. Union Carbide Corp. Atlas Corp. , Southern California Edison Co.
--50% Union Pacific Corp.--50% Federal Resources Corp.--60% American Nuclear Corp.--40% Rio Algom Ltd. (Canadian
Corp. controlled by RioTinto-Zinc Corp. Ltd.)
Commonwealth Edison Co •. Dawn Mining Co. is 51% owned
by Newmont Mining Corp. and 49% owned by Midnite Mines
Mill location
Grants, New Mexico Grants, New Mexico
Church Rock, New Mexico Grants, New Mexico Highland, Wyoming Shirley Basion~ Wyoming Falls City, Texas
Jeffrey City, Wyoming Ceboletta, New Mexico
'Gas Hills, Wyoming Uravan, Colorado Natrona County, Wyoming Moab, Utah Bear Cree~, Wyoming
,r Gas Hills~ Wyoming
LaSal, Utah
Canon City, Colorado Ford, Washington
TOTAL .
Tons ore/day
7,000
3,500 3,000 3,000 3,000 1,800 1,750
1,700 1,660
1,650 1,300 1,200 1,100 1,000
950
700
450 400
35,160
Source: Ursula A. Guerrieri, "The Structure of the U.S. Uranium Industry and the Role of Petroleum Firms," American Petroleum Institute discussio,n paper '013 (April 20, 1978). Table 6, p. 24.
.~': ,:;.; ~
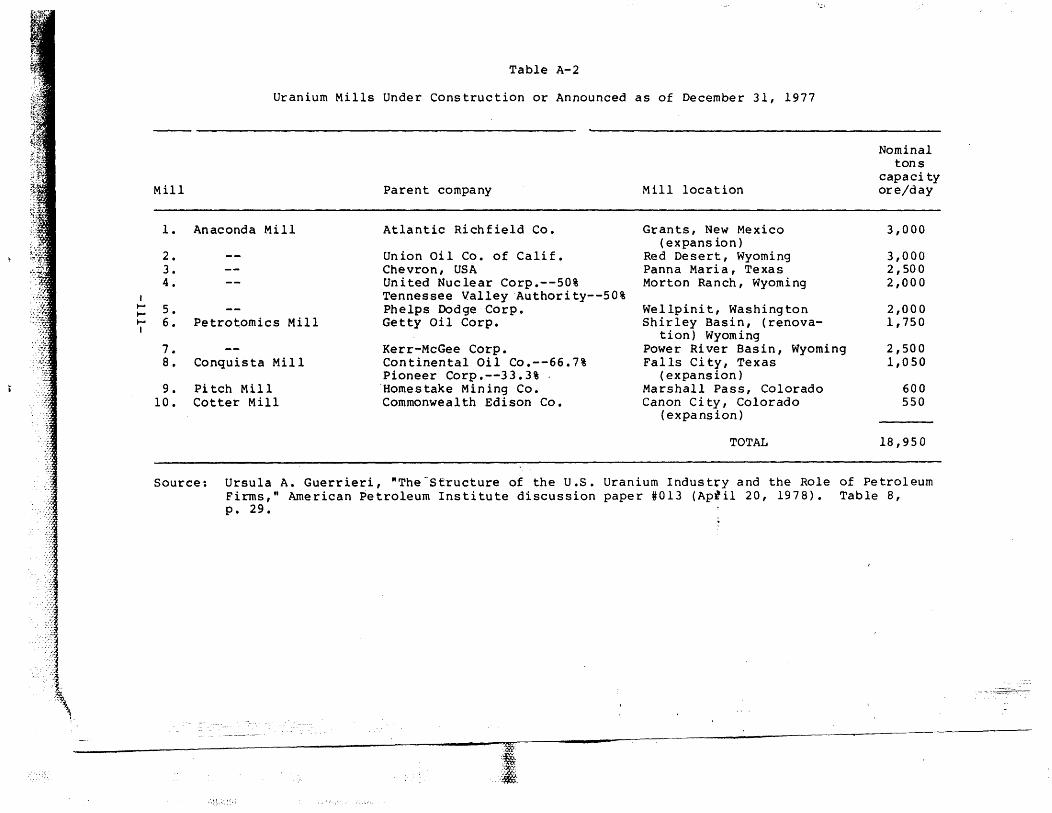
I .... .... .... I
Mill
1.
2. 3. 4.
5. 6 •
7. 8.
9. 10.
Table A-2
Uranium Mills Under Construction or Announced as of December 31, 1977
Anaconda Mill
Petrotomics Mill
Conquista Mill
Pitch Mill Cotter Mill
Parent company
Atlantic Richfield Co.
Union Oil Co. of Calif. Chevron, USA United Nuclear Corp.--50% Tennessee Valley Authority--50% Phelps Dodge Corp • Getty Oil Corp.
Kerr-McGee Corp. Continental Oil Co.--66.7% Pioneer Corp.--33.3% ' ·Homestake Mining Co. Commonwealth Edison Co.
Mill location
Grants, New Mexico (expansion)
Red Desert, Wyoming Panna Maria, Texas Morton Ranch, Wyoming
Wellpinit, Washington Shirley Basin, (renova
tion) Wyoming Power River Basin, Wyoming Falls City, Texas
(expansion) Marshall Pass, Colorado Canon City, Colorado
( ex pa ns ion)
TOTAL
Nominal tons
capaci ty ore/day
3,000
3,000 2,500 2,000
2,000 1,750
2,500 1,050
600 550
18,950
Source: Ursula A. Guerrieri, "The-Structure of the U.S. Uranium Industry and the Role of Petroleum Firms," American Petroleum Institute discussion paper #013 (Ap#il 20, 1978). Table 8, p. 29.
.:'W :~
·:1: ,~:,~,~",~~, .
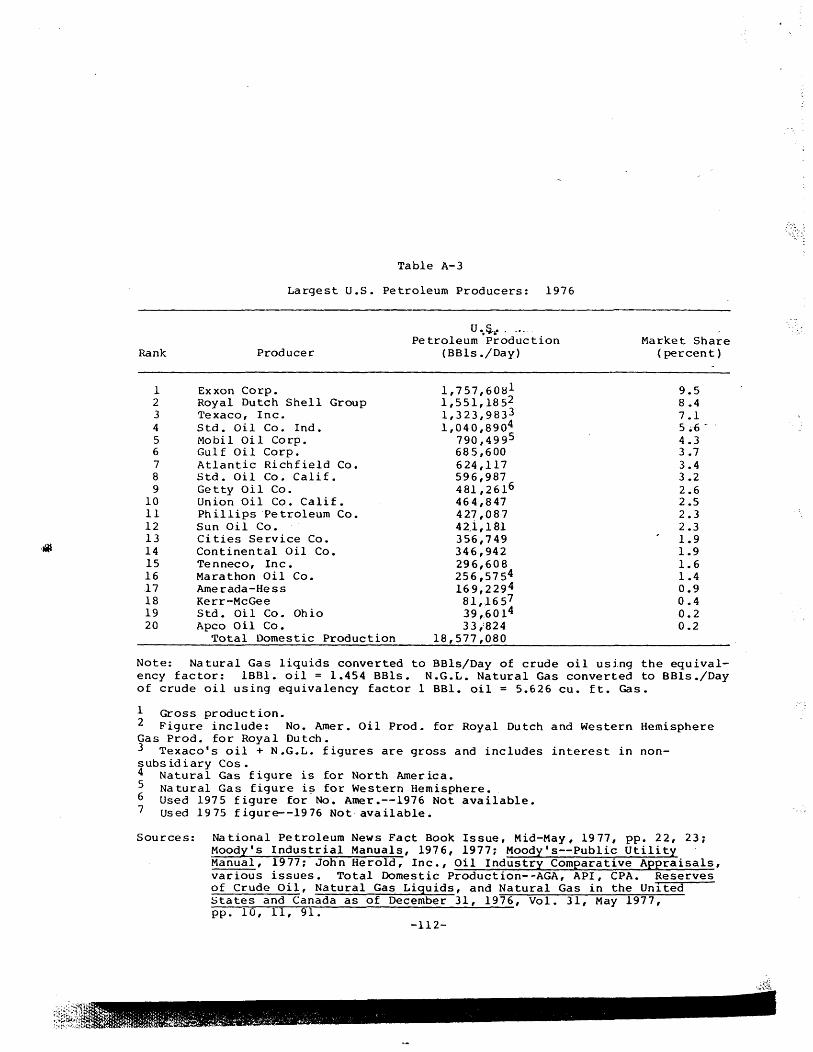
.~
' .
Rank
1 2 3 4 5 6 7 8 9
10 11 12 13 14 15 16 17 18 19 20
Table A-3
Largest U.S. Petroleum Producers: 1976
Producer
Exxon Corp. Royal Dutch Shell Group Texaco, Inc. Std. Oil Co. Ind. Mobil Oi 1 Corp. Gulf Oil Corp. Atlantic Richfield Co. Std. Oil Co. Calif. Getty Oil Co. Union Oil Co. Calif. Phillips Petroleum Co. Sun Oil Co. Cities Service Co. Continental Oil Co. Tenneco, Inc. Marathon Oil Co. Amerada-Hess Kerr-McGee Std. Oil Co. Ohio Apco Oil Co.
Total Domestic Production
U "~ ••...•.. Petroleum Production
(BBls ./Day)
1,757,60ti1 1,551,1852 1,323,9833 1,040,8904
790,499 5 685,600 624,117 596,987 481,2616 464,847 427,087 42.i,181 356,749 346,942 296,608 256,5754 169,2294 81,1657 39,.6014 33,'824
18,577,080
Market Share (percen t)
9.5 8.4 7.1 5.6 -4.3 3.7 3.4 3.2 2.6 2.5 2.3 2.3 1.9 1.9 1.6 1.4 0.9 0.4 0.2 0.2
Note: Natural Gas liquids converted to BBls/Day of crude oil using the equivalency factor: IBBI. oil = 1.454 BBls. N.G.L. Natural Gas converted to BBls./Day of crude oil using equivalency factor I BBl. oil = 5.626 cu. ft. Gas.
1 Gross production. 2 Figure include: No. Amer. Oil Prod. for Royal Dutch and Western Hemisphere Gas Prod. for Royal Dutch. 3 Texaco's oil + N.G.L. figures are gross and includes interest in nonsubs id iary Cos. 4 Natural Gas figure is for North America. 5 Natural Gas figure i? for Western Hemisphere. 6 Used 1975 figure for No. Amer.--1976 Not available. 7 Used 1975 figure--1976 Not available.
Sources: National Petroleum News Fact Book Issue, Mid-May, 1977, pp. 22, 23; Moody's Industrial Manuals, 1976, 1977; Moody's--Public Utility Manual, 1977; John Herold, Inc., Oil Industry Comparative Appraisals, various issues. Total Domestic Production--AGA, API, CPA. Reserves of Crude Oil, Natural Gas Liquids, and Natural Gas in the Unlted States and Canada as of December 31, 1976, Vol. 31, May 1977, pp. 10, 11, 91.
-112-
. ~~~·{:;~;;h\;~:.il~l~;~.:'';~~;'/_;·.;·{'·M< ~:;..!'r:,~,. ,,:' "<" '. .
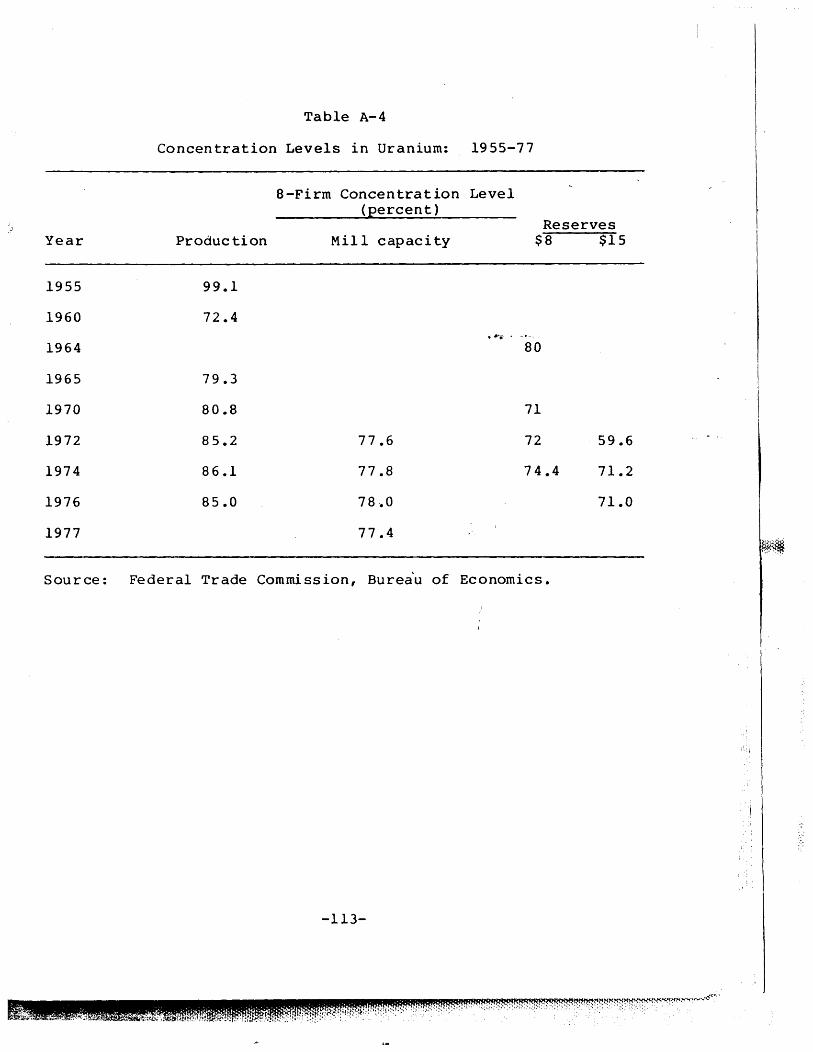
Table A-4 I . I
Concentration Levels in Uranium: 1955-77 I
8-Firm Concentration Level (Eercent)
~J Reserves Year Production Mill capaci ty $8 $15
1955 99.1
1960 72.4 , ..... - . -.-.
1964 80
1965 79.3
1970 80.8 71
1972 85.2 77.6 72 59.6
1974 86.1 77.8 74.4 71.2
1976 85.0 78 .. 0 71.0
1977 77.4 ~~~ ..... :. ~ ,
Source: Federal Trade Commi ss ion, Burea'u of Economics.
-113-
APPENDIX B: JOINT VENTURE ANALYSIS·
Joint venture activity in the nuclear industry is extensive,
with approximately 106 on-going agreements as of January 1, 1975.
Of these agreements, 96 involved uranium exploration, mining, and
milling (See table B-1), while the remaining l~ involved the
development of new mining techniques, reactor systems, and
components and materials, as well as the construction and ...... -.-. operation of reactor systems and fuel reprocessing plants. This
discussion focuses on those nuclear joint ventures involving
domestic uranium exploration, mining and milling. l
• This section was written by Steven C. Martin. It was completed in April 1977 and is based on information derived from FTC subpoenas issued in 1975.
1 While there are a significant numoer of foreign joint ventures involving domestic corporations, such ventures are primarily conducted with foreign partners and are not considered here.
-114-
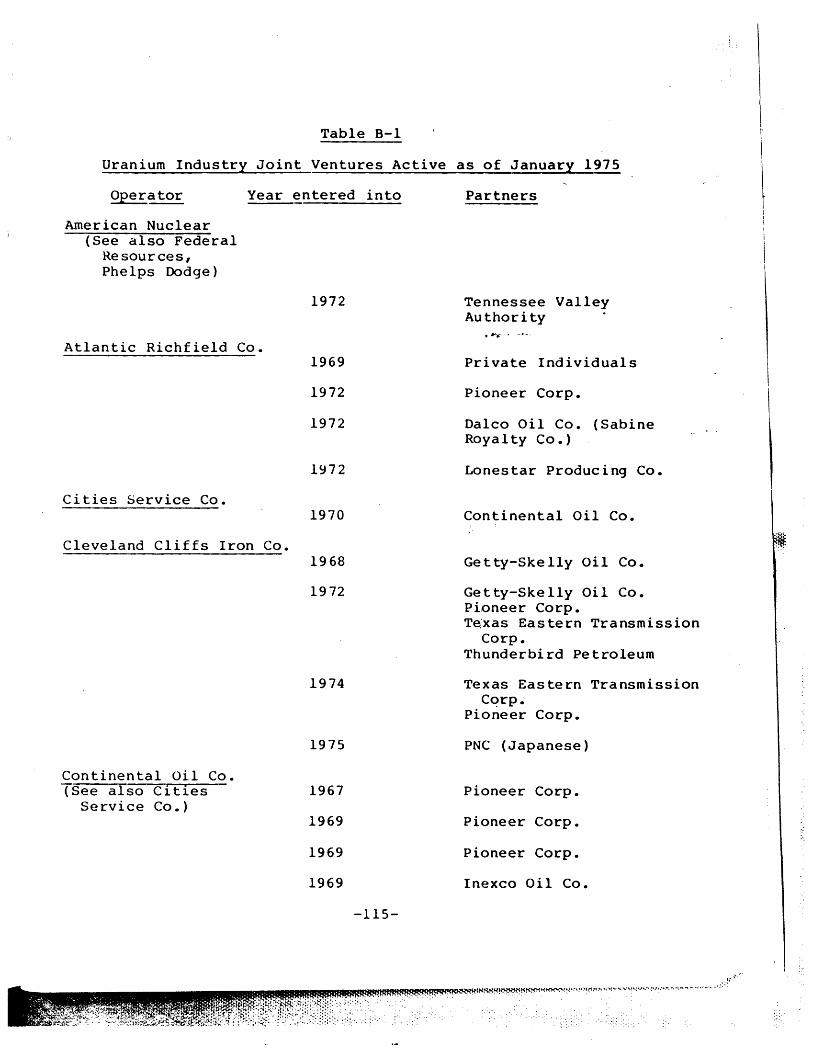
Table 8-1
Uranium Industry Joint Ventures Active as of January 1975
Year entered into
American Nuclear (See also Federal
Resources, Phe Ips Dodge)
Atlantic Richfield Co.
Cities Service Co.
Cleveland Cliffs Iron Co.
Continental Oil Co. (See also Cities
Service Co.)
1972
1969
1972
1972
lY72
1970
1968
1972
1974
1975
1967
1969
1969
1969
-115-
Partners
Tennessee Valley Authority ....... -.-.
Private Individuals
Pioneer Corp.
Dalco Oil Co. (Sabine Royal ty Co.)
Lonestar Producing Co.
Continental Oil Co.
Getty-Skelly Oil Co.
Getty-Skelly Oil Co. Pioneer Corp. Texas Eastern Transmission
Corp. Thunderbird Petroleum
Texas Eastern Transmission Cqrp.
Pioneer Corp.
PNC (Japanese)
Pioneer Corp.
Pioneer Corp.
Pioneer Corp.
Inexco Oil Co.
.~' .
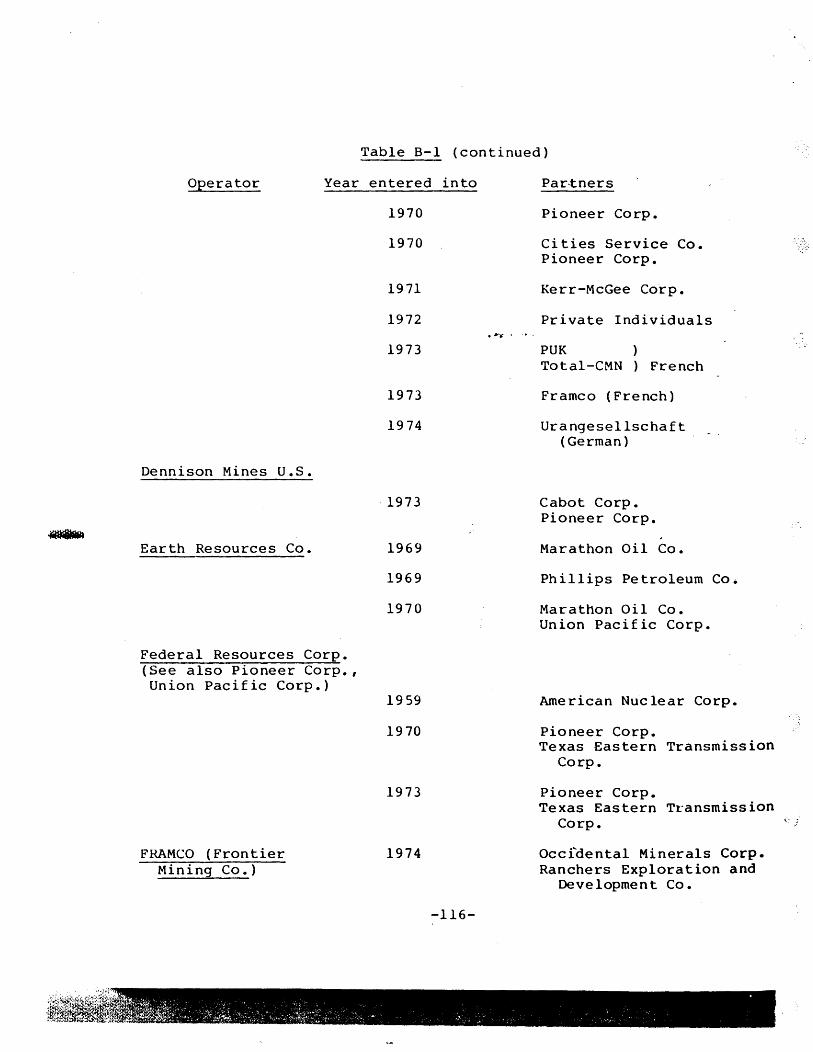
Operator Year
Dennison Mines U.S.
Earth Resources Co.
Federal Resources Corp. (See also Pioneer Corp., Union Pacific Corp.)
FRAMeo (Frontier Mining Co.)
Table 8-1 (continued)
entered into
1970
1970
1971
1972 . ..... . -.~.
1973
1973
1974
-1973
1969
1969
1970
1959
1970
1973
1974
-116-
Par.tners
Pioneer Corp.
Cities Service Co. Pioneer Corp.
Kerr-McGee Corp.
Private Individuals
PUK ) Total-CMN ) French
Framco (French)
Urangesellschaft (German)
Cabot Corp. Pioneer Corp.
Marathon Oil Co.
Phillips Petroleum Co.
Marathon Oil Co. Union Pacific Corp.
American Nuclear Corp.
Pioneer Corp. Texas Eastern Transmission
Corp.
Pioneer Corp. Texas Eastern Transmission
Corp.
Occiaental Minerals Corp. Ranchers Exploration and
Development Co.
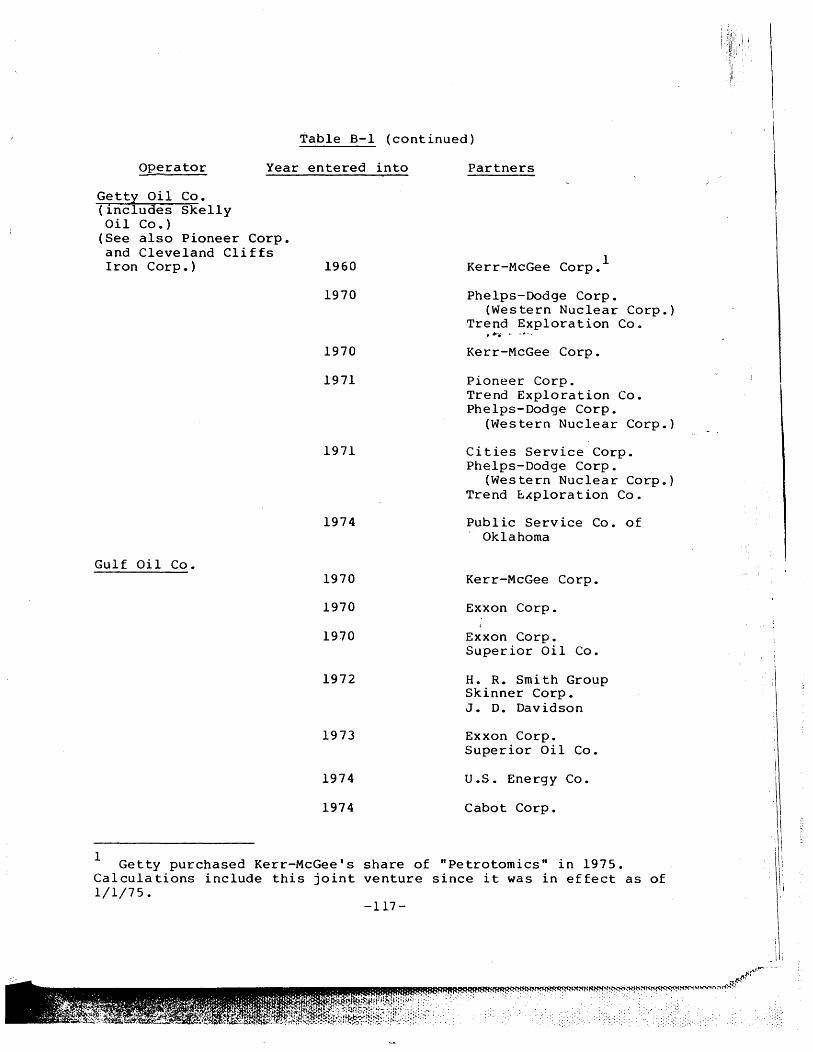
Table 8-1 (continued)
operator Year entered into
Getty Oil Co. (includes Skelly Oil Co.)
(See also Pioneer Corp. and Cleveland Cliffs Iron Corp.)
Gulf Oil Co.
1960
1970
1970
1971
1971
1974
1970
1970
1970
1972
1973
1974
1974
Partners
1 Kerr-McGee Corp.
Phelps-Dodge Corp. (Western Nuclear Corp.)
Trend Exploration COe . .,. ... - . -.-.
Kerr-McGee Corp.
Pioneer Corp. Trend Exploration Co. Phelps-Dodge Corp.
(Western Nuclear Corp.)
Cities Service Corpe Phelps-Dodge Corp.
(Western Nuclear Corp.) Trend ~~ploration Co.
Public Service Co. of - Oklahoma
Kerr-McGee Corp.
Ex-xon Corp.
Exxon Corp. Superior oil Co.
H. R. Smith Group Skinner Corp. J. D. Davidson
Exxon Corp. Superior Oil Co.
U.S. Energy Co.
Cabot Corp.
1 Getty purchased Kerr-McGee's share of "Petrotomics" in 1975. Calculations include this joint venture since it was in effect as of 1/1/75.
-117-
\
:\ Iii
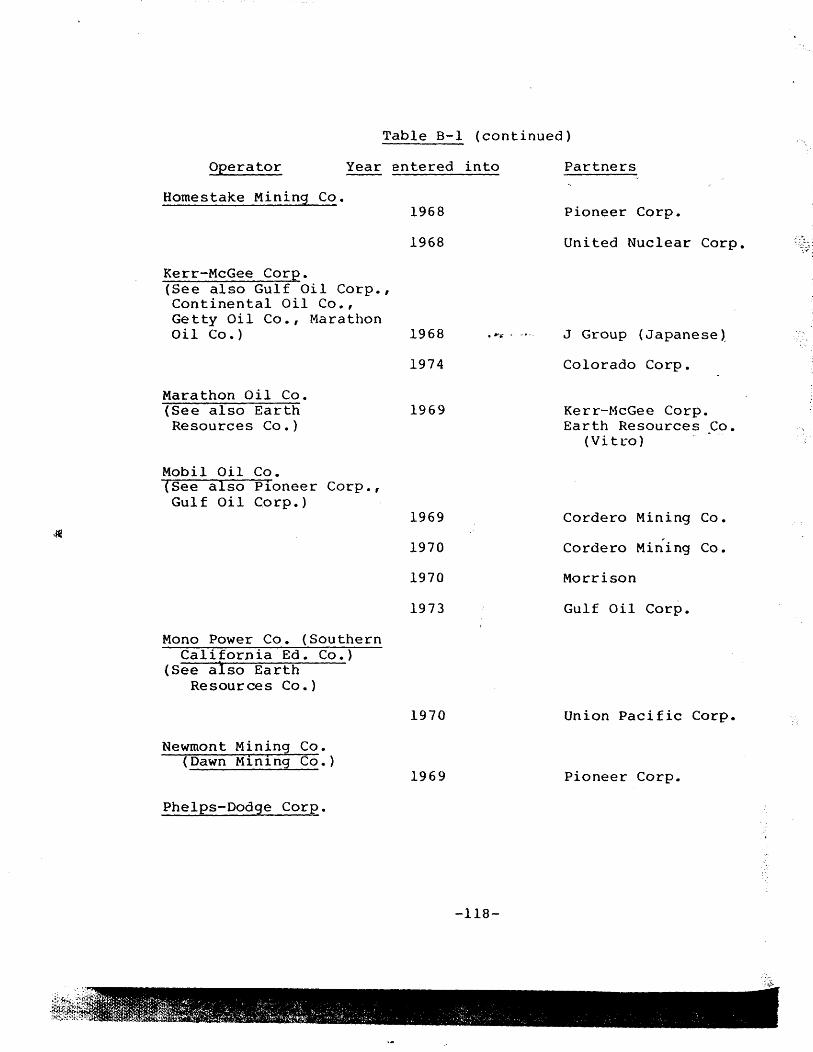
Table B-1 (continued)
Operator Year entered into
Homestake Mining Co.
Kerr-McGee Corp. (See also Gulf Oil Corp., Continental Oil Co., Getty Oil Co., Marathon
1968
1968
Oil Co.) 1968
Marathon Oil Co. (See also Earth Resources Co.)
Mobil Oil Co. (See also P10neer Corp., Gulf Oil corp.)
Mono Power Co. (Southern California Ed. Co.)
(See also Earth Resources Co.)
Newmont Mining Co. (Dawn Min1ng Co.)
Phelps-Dodge Corp.
1974
1969
1969
1970
1970
1973
1970
1969
-118-
Partners
Pioneer Corp.
United Nuclear Corp.
J Group (Japanesel
Colorado Corp.
Kerr-McGee Corp. Earth Resources Co.
(Vitro) - .
Cordero Mining Co.
Cordero Mining Co.
Morrison
Gulf Oil Corp.
Union Pacific Corp.
Pioneer Corp.
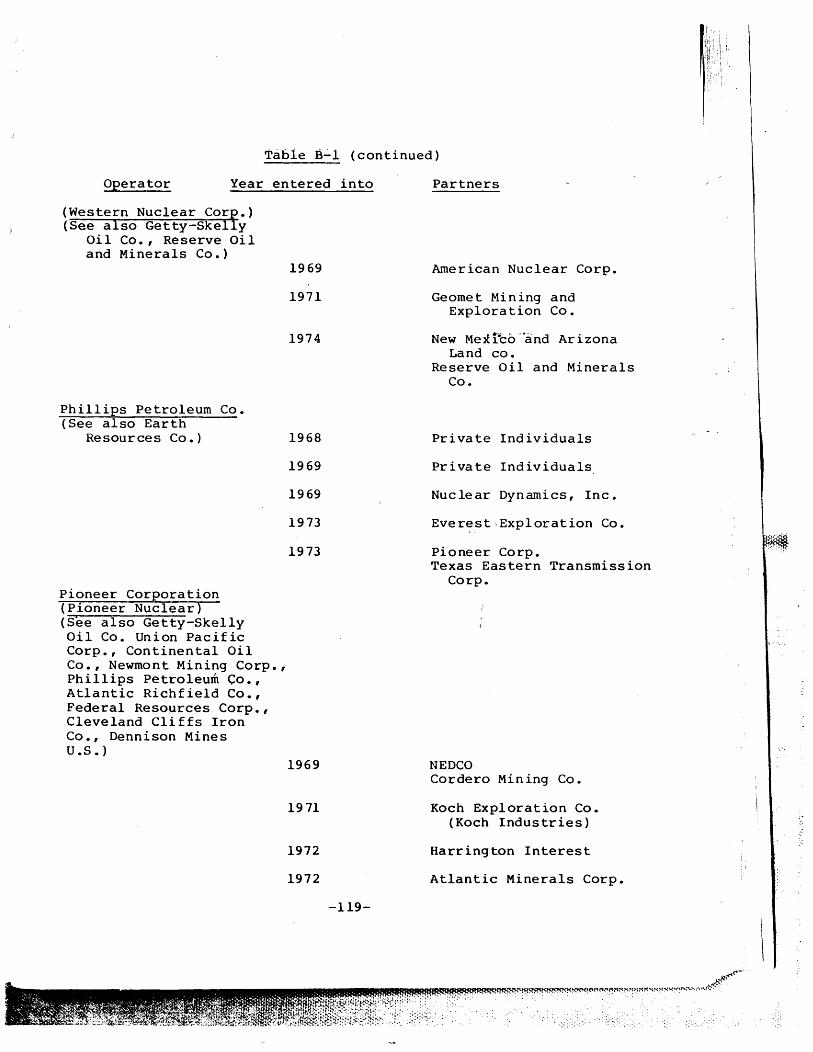
Table B~l (continued)
Operator Year entered into
(Western Nuclear cori.) (See also Getty-Skel y
Oil Co., Reserve Oil and Minerals Co.)
Phillips Petroleum Co. (See also Earth
Resources Co.)
Pioneer Corporation (Pioneer Nuclear) (See also Getty-Skelly Oil Co. Union Pacific Corp., Continental Oil Co., Newmont Mining Corp., Phillips Petroleum Co., Atlantic Richfield Co., Federal Res6urces Corp., Cleveland Cliffs Iron Co., Dennison Mines U.S. )
1969
1971
1974
1968
1969
1969
1973
1973
1969
1971
1972
1972
-119-
Partners
American Nuclear Corp.
Geomet Mining and Exploration Co.
New Mexi"co -"and Arizona Land co.
Reserve Oil and Minerals Co.
Private Individuals
Private Individuals
Nuc Ie ar Dynamics, Inc.
EverestlExploration Co.
Pioneer Corp. Texas Eastern Transmission
Corp.
NEDCO Cordero Mining Co.
Koch Exploration Co. (Koch Industries)
Harrington Interest
Atlantic Minerals Corp.
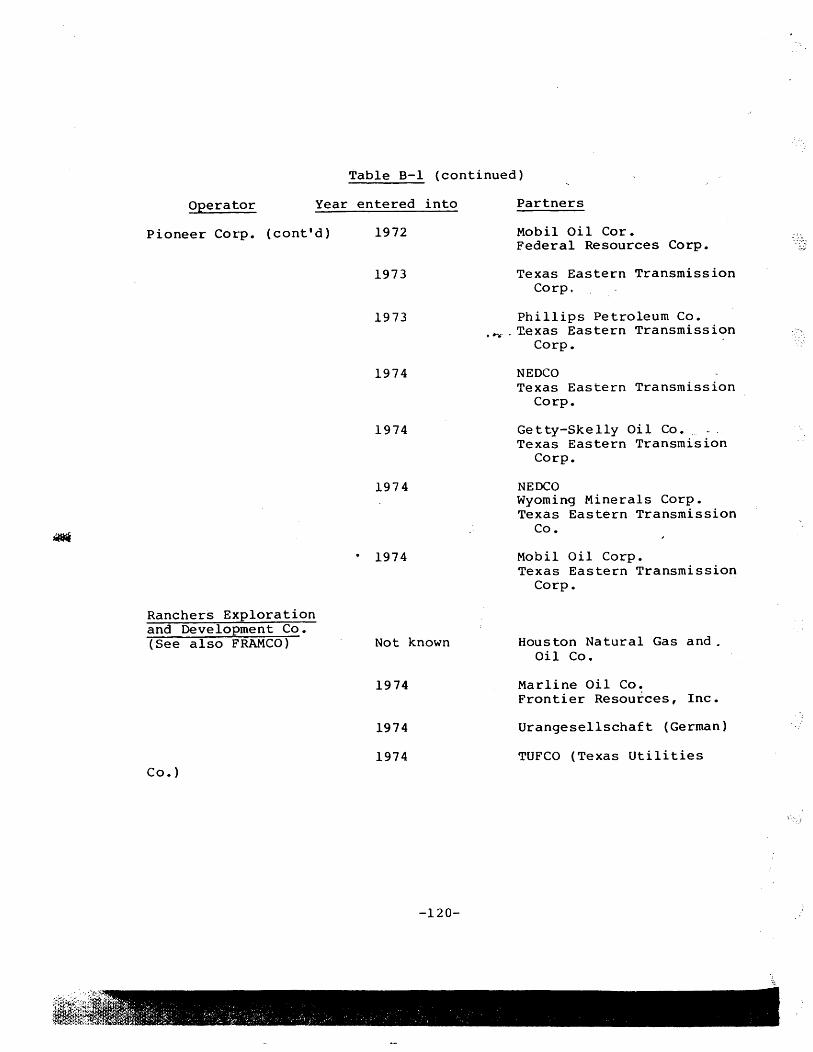
Table B-1 (continued)
Operator Year entered into
Pioneer Corp. (cont'd)
Ranchers Exploration and Development Co. (See also FRAMCO)
Co. )
1972
1973
1973
1974
1974
1974
1974
Not known
1974
1974
1974
-120-
Partners
Mobil Oil Cor. Federal Resources Corp.
Texas Eastern Transmission Corp.
Phillips Petroleum Co. .~ .~exas Eastern Transmission
Corp.
NEDCO Texas Eastern Transmission
Corp.
Getty-Skelly Oil Co. Texas Eastern Transmision
Corp.
NEDCO Wyoming Minerals Corp. Texas Eastern Transmission
Co.
Mobil Oil Corp. Texas Eastern Transmission
Corp.
Houston Natural Gas and. Oil Co.
Marline Oil Co. Frontier Resources, Inc.
Urangesellschaft (German)
TUFCO (Texas Utilities
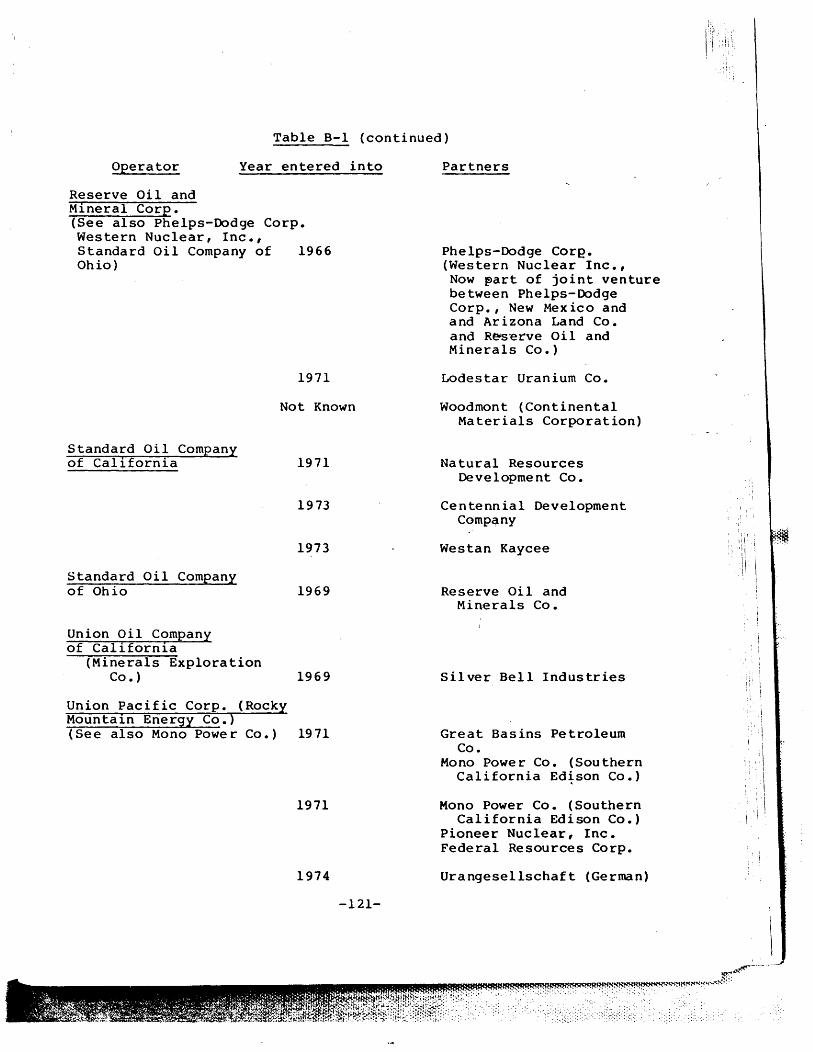
Table B-1 (continued)
Operator Year entered into
Reserve Oil and Mineral Corp. (See also Phelps-Dodge Corp. Western Nuclear, Inc., Standard Oil Company of 1966 Ohio)
1971
Not Known
Standard Oil Company of California
Standard Oil Company
1971
1973
1973
of Ohio 1969
Union Oil Company of California
(Minerals Exploration Co.) 1969
Union Pacific Corp. (Rocky Mountaln Energy Co.) (See also Mono Power Co.) 1971
1971
1974
-121-
Partners
Phelps-Dodge Core. (Western Nuclear Inc.,
Now ~art of joint venture between Phelps-Dodge Corp., New Mex ico and and Arizona Land Co. and R~s~rve oil and Minerals Co.)
Lodestar Uranium Co.
Woodmont (Continental Materials Corporation)
Natural Resources Development Co.
Centennial Development Company
Westan Kaycee
Reserve Oil and Minerals Co.
Silver Bell Industries
Great Basins Petroleum Co.
Mono Power Co. (Southern California Ed~son Co.)
Mono Power Co. (Southern California Edison Co.)
Pioneer Nuclear, Inc. Federal Resources Corp.
Urangesellschaft (German)
l,i,;,.,
\ :
~ i '
I
I'i
, I
I
~ ~~
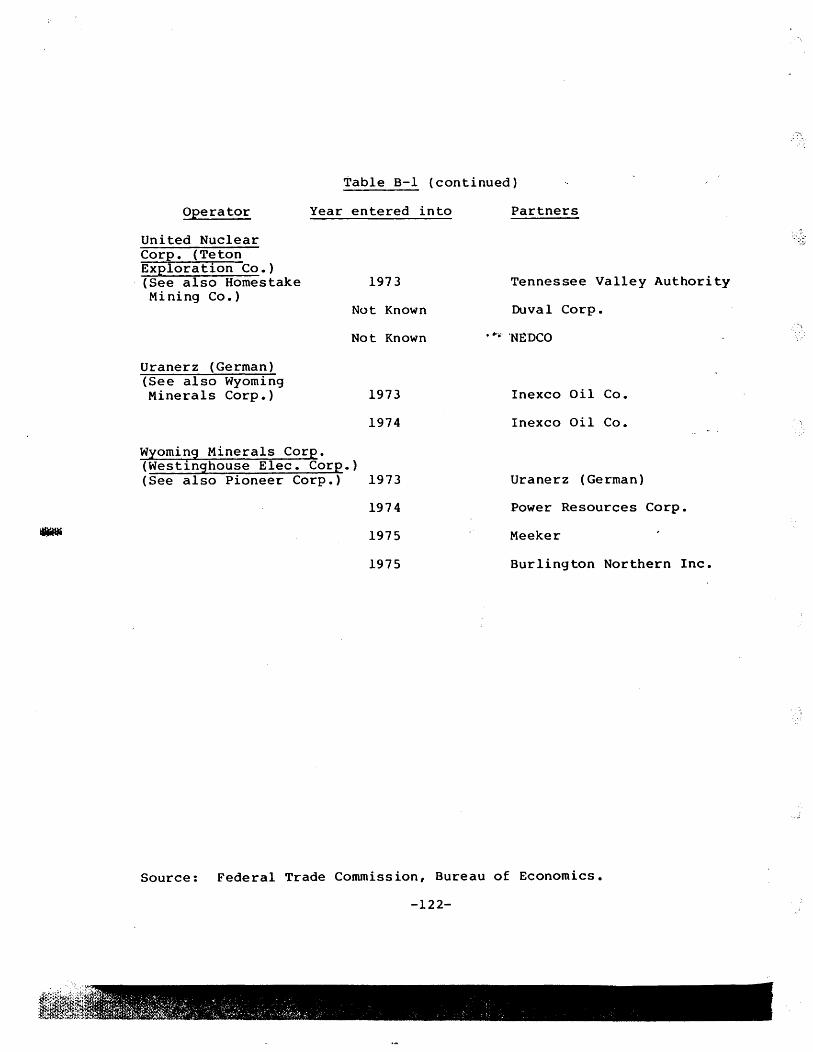
Table B-1 (continued)
Operator Year entered into
United Nuclear Corp. ( Te ton Explora tion Co.) (See also Homestake 1973 Mining Co.)
Not Known
Not Known
Uranerz (German) (See also Wyoming Minerals Corp.)
Wyoming Minerals Corp. (Westinghouse Elec. Corp.)
1973
1974
(See also Pioneer Corp.) 1973
1974
1975
1975
Partners
Tennessee Valley Authority
Duval Corp •
. ~. "NEDCO
Inexco Oil Co.
Inexco Oil Co.
Uranerz (German)
Power Resources Corp.
Meeker
Burlington Northern Inc.
Source: Federal Trade Commission, Bureau of Economics.
-122-
,.
~~l:;~i~t~~~;~ki~;:~<~ -,' ~- :'~':;'", " ... > ".'.;"~:,~ ~- ~ ~ : ..
Joint ventures may have both pro- and anti-competitive
1 effects. These effects must be carefully analyzed and
balanced before any action is considered to restrict the freedom
to enter into such ventures.
Joint ventures in uranium exploration and development can be
pro-competitive in several ways. The first of these involves
reducing the risk of uneven corporate performance which is .*"';;- • ---.
associated with a natural resource industry. Every uranium
project carries with it a certain probability that no exploitable
uranium will be discovered. Since corporate managers desire to
present their shareholders with a picture of steadily improving
performance, they may seek to reduce the risk of uneven perform-
ance by spreading the funds they are willing to invest over a
1 Joint ventures also create difficulties in the measurement and analysis of reserve concentration. Specifically, where reserves are controlled in joint ventu~es, the significance of concentration ratios becomes clouded by the inability to ascertain what portion of jointly-held reserves is actually controlled by each of the parties to the vent~re. A straight apportionment of reserves by percent interest may not take into accoun t var ious forces of size and economic power wh ich in .fact place control of all of tile reserves in the hands of one or a limited number of partners. Various formulae have been proposed to allocate jointly-held reserves. Some have assumed that in natural resource joint ventures involving major producers, control of reserves is shared according to actual percent interests, while in ventures involving large and small producers, a majority or plurality interest controls 100 percent of the reserves. In the uranium industry approximately 90 percent of all reserves are held by individual companies, while only 9 percent are held in joint ventures (See table 8-2). Due to the small role played by jointly held reserves it was decided that application of an allocation formula would have limited benefits. Thus, in calculating concentration ratios, reserves were allocated on a percent interest basis.
-123-
~~ .)~
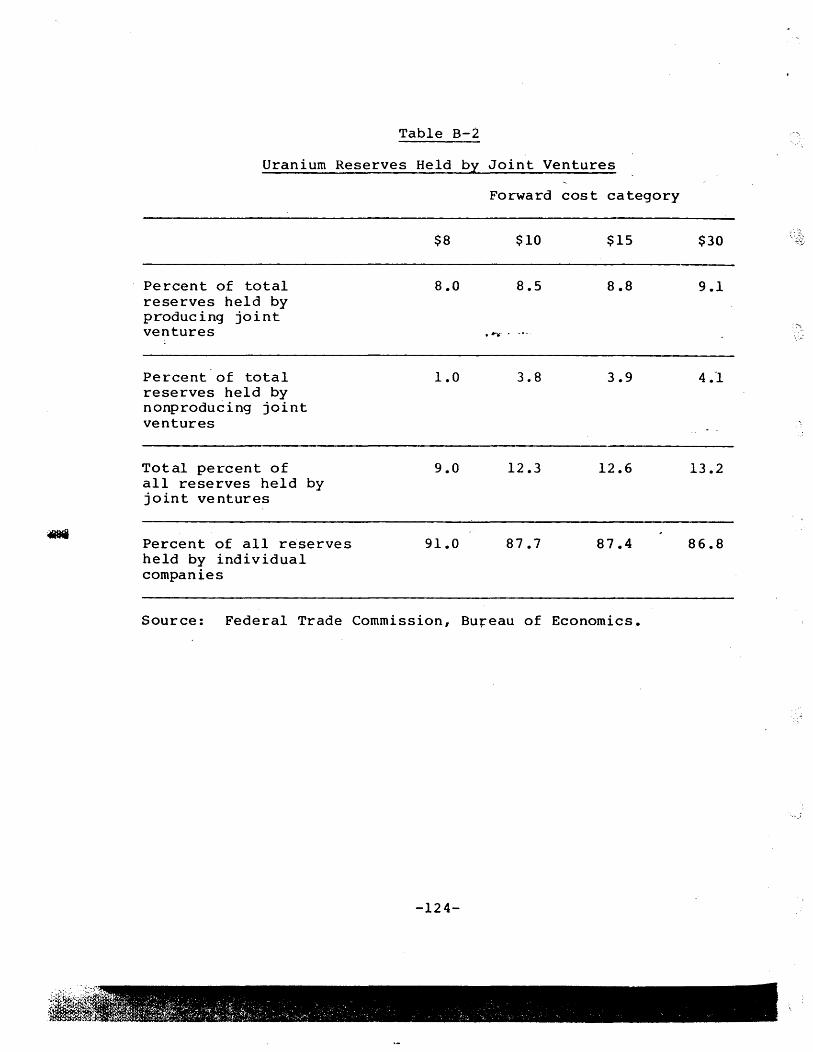
Table B-2
Uranium Reserves Held by Joint Ventures
Forward cost category
$8 $10 $15 $30
Percent of total 8.0 8.5 8.8 9.1 reserves held by producing joint
:". ventures ..... - . -.~.
Percent of total 1.0 3.8 3.9 4.1 reserves held by nonproducing joint ventures
Total percent of 9.0 12.3 12.6 13.2 all reserves held by joint ventures
- Percent of all reserves 91.0 87.7 87.4 86.8 held by individual companies
Source: Federal Trade Commission, Bureau of Economics.
-124-
number of projects. Since the amount of exploration undertaken
in any given location and the size of any production c~mplex '
ultimately constructed are dictated by· such factors as geologic
conditions and economies of scale, the size of uranium projects
cannot be made arbitrarily small. Thus, the desire to achieve
steady performance is likely to manifest itself in joint
ventures. For small firms who have limi ted fl}1\d.s_._to invest,
joint ventures may be the only way of achieving this goal.
Joint ventures may also allow firms to take advantage of any
economies of scale which may exist in the industry. Small
individual land holdings may be pooled into parcels susceptible
to more efficient large scale drilling operations. The need for
such joint venture activity is particularly prevalent in the
uranium industry, where much of the public land available for
exploration is splintered under the claim staking system of the
General Mining Law of 1872. 1 Joint ventures ~lso enable
owners of reserves to join together to build lone large mill, with
its attendant economies of scale. However, less use is made of
joint ventures solely for production, perhaps in part because
once uranium is discovered the value of the property is more
easily determined, making it more susceptible to sale or
exchange.
1 Report to the Federal Trade Commission on Federal Energy Land Policy: Efficiency, Revenue, and com1etition, Bureau of Competition, Bureau of Economics, October 975, Chapter VII.
-125-
Finally, joint ventures provide a means whereby small firms
can join together or with a large capital rich firm to obtain
.financing for the construction of a mine and mill complex.
'The basic problem raised by joint ventures is the potential
for contractual relationships among participants to lead to par-
allel behavior with respect to control and disposition of
reserves held by the venture or the individual partners. l
This concern is of particular importana~.i.n a mining industry
where the production process is of such technical complexity as
to warrant extensive coordination and cooperation among the
partners. Such cooperation may provide a suitable environmen~.
for explicit actions designed to restrict or otherwise control
production and prices. Short of explicit conspiracy, the mere
exchange of information and the development of interpersonal ties
among management may indirectly lead joint venturers to be less
than effective competitors in the market place. For example,
knowledge of each other's costs or pricing policies may allow
partners to coordinate their bidding strategies. Given a choice,
management may choose not to compete as vigorously against a
partner as against an unrelated corporation.
1 To date uranium joint ventures have been on a project-byproject basis, with the individual partners continuing to compete against each other in the sale of uranium. Thus, unlike the joint venture of the type held illegal in u.S. v. Penn-Olin Chemical Co., 378 U.S. 158 (1964), the joint ventures in the uranium industry have not substituted one enterprise (the joint venture) for two or more (the partners).
-126-
-.. :3-
. -j
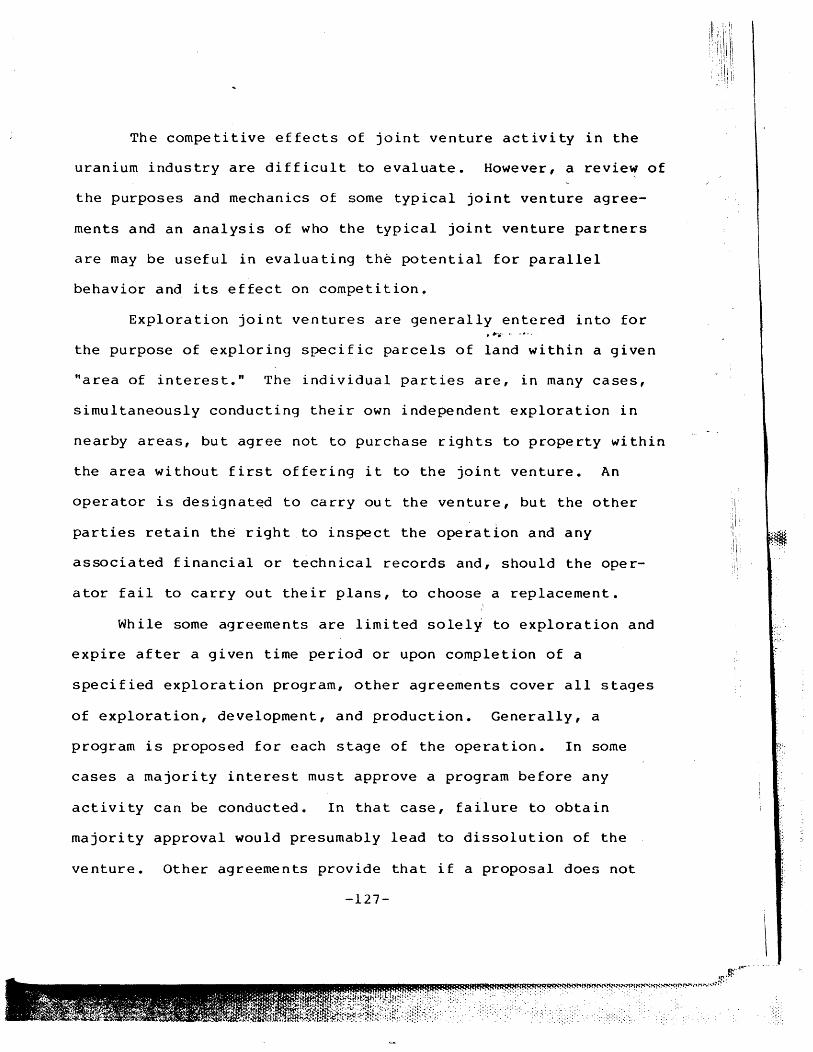
The competitive effects of joint venture activity in the
uranium industry are difficult to evaluate. However, a review of
the purposes and mechanics of some typical joint venture agree-
ments and an analysis of who the typical joint venture partners
are may be useful in evaluating the potential for parallel
behavior and its effect on competition.
Exploration joint ventures are generally entered into for
the purpose of exploring specific parcels of land within a given
"area of interest." The individual parties are, in many cases,
simultaneously conducting their own independent exploration in
nearby areas, but agree not to purchase rights to property within
the area without first offering it to the joint venture. An
operator is designated to carry out the venture, but the other
parties retain the right to inspect the operation and any
associated financial or technical records and, should the oper-
ator fail to carry out their plans, to choose a replacement.
While some agreements are limited solely to exploration and
expire after a given time period or upon completion of a
specified exploration program, other agreements cover all stages
of exploration, development, and production. Generally, a
program is proposed for each stage of the operation. In some
cases a majority interest must approve a program before any
activity can be conducted. In that case, failure to obtain
majority approval would presumably lead to dissolution of the
venture. Other agreements provide that if a proposal does not
-127-
.~ .. ..,..---
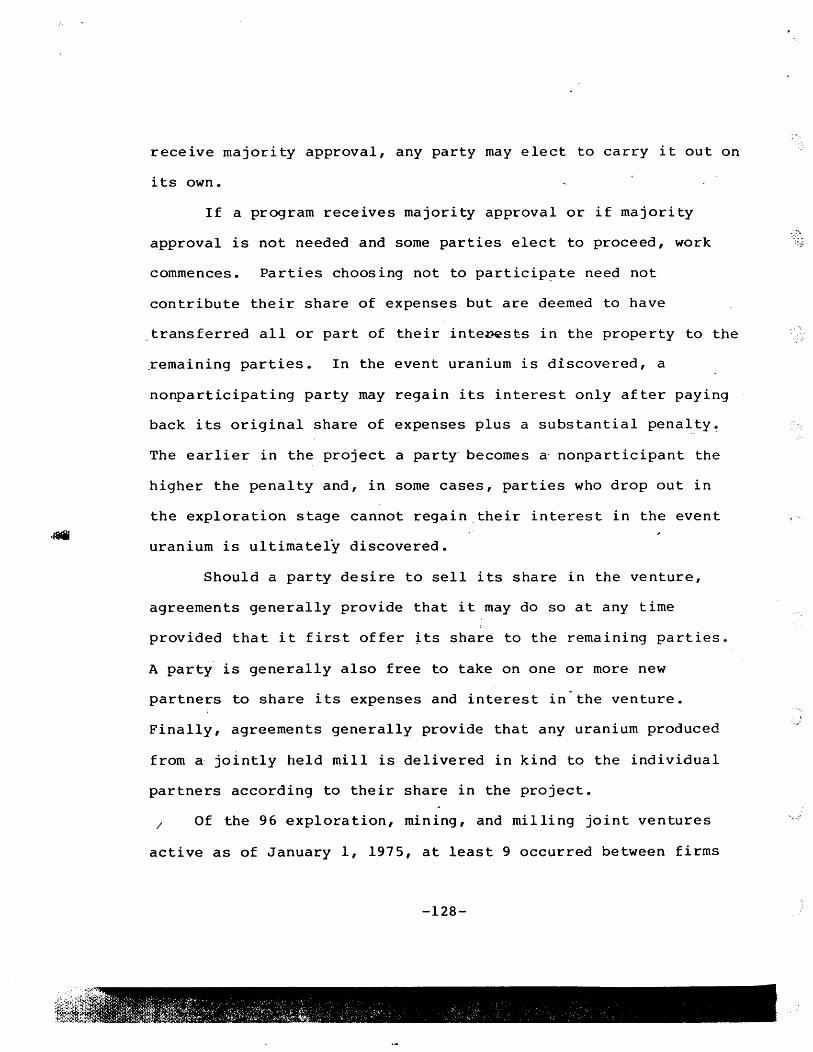
'.
receive majority approval, any party may elect to carry it out on
its own.
If a program receives majority approval or if majority
approval is not needed and some parties elect to proceed, work
commences. Parties choosing not to particip?te need not
contribute their share of expenses but are deemed to have
transferred all or part of their inte~sts in the property to the
;remaining parties. In the event uranium is discovered, a
nonparticipating party may regain its interest only after paying
back its original share of expenses plus a substantial penalty~
The earlier in the project a party· becomes a' nonparticipant the
higher the penalty and, in some cases, parties who drop out in
the exploration stage cannot regain.their interest in the event
uranium is ultimately discovered.
Should a party desire to sell its share in the venture,
agreements generally provide that it may do so at any time
provided that it firs.t offer ~ts share to the remaining parties.
A party is generally also free to take on one or more new
partners to share its expenses and interest in the venture.
Finally, agreements generally provide that any uranium produced
from a- jointly held mill is delivered in kind to the individual
partners according to their share in the project.
/ Of the 96 exploration, mining, and milling joint ventures
active as of January 1, 1975, at least 9 occurred between firms
-128-
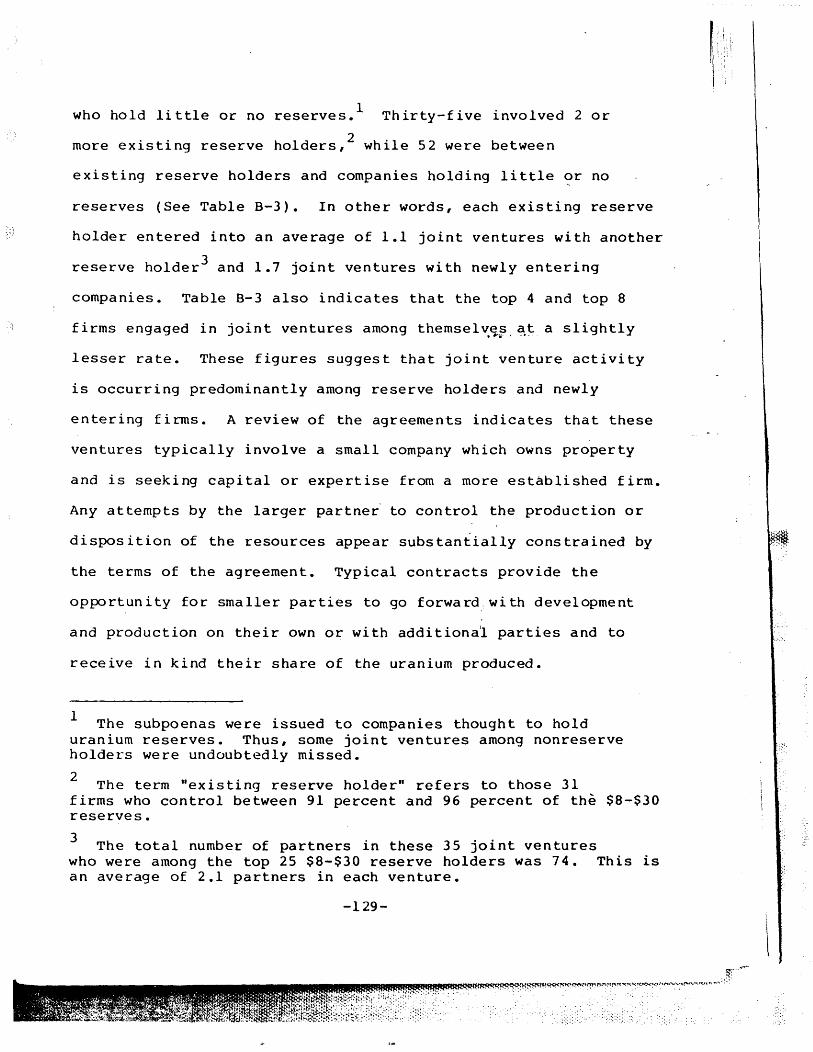
1 who hold little or no reserves. Thirty-five involved 2 or
more existing reserve holders,2 while 52 were between
existing reserve holders and companies holding little or no
reserves (See Table B-3). In other words, each existing reserve
holder entered into an average of 1.1 joint ventures with another
reserve holder 3 and 1.7 joint ventures with newly entering
companies. Table B-3 also indicates that the top 4 and top 8
firms engaged in joint ventures among themsel~~~.~t a slightly
lesser rate. These figures suggest that joint venture activity
is occurring predominantly among reserve holders and newly
entering firms. A review of the agreements indicates that these
ventures typically involve a small company which owns property
and is seeking capital or expertise from a more established firm.
Any attempts by the larger partner' to control the production or
disposition of the resources appear substantially constrained by
the terms of the agreement. Typical contracts provide the
opportunity for smaller parties to go forward, wi th development
and production on their own or with additiona~ parties and to
receive in kind their share of the uranium produced.
1 The subpoenas were issued to companies thought to hold uranium reserves. Thus, some joint ventures among nonreserve holders were undoubtedly missed.
2 The term "existing reserve holder" refers to those 31 firms who control between 91 percent and 96 percent of the $8-$30 reserves.
3 The total number of partners in these 35 joint ventures who were among the top 25 $8-$30 reserve holders was 74. This is an average of 2.1 partners in each venture.
-129-
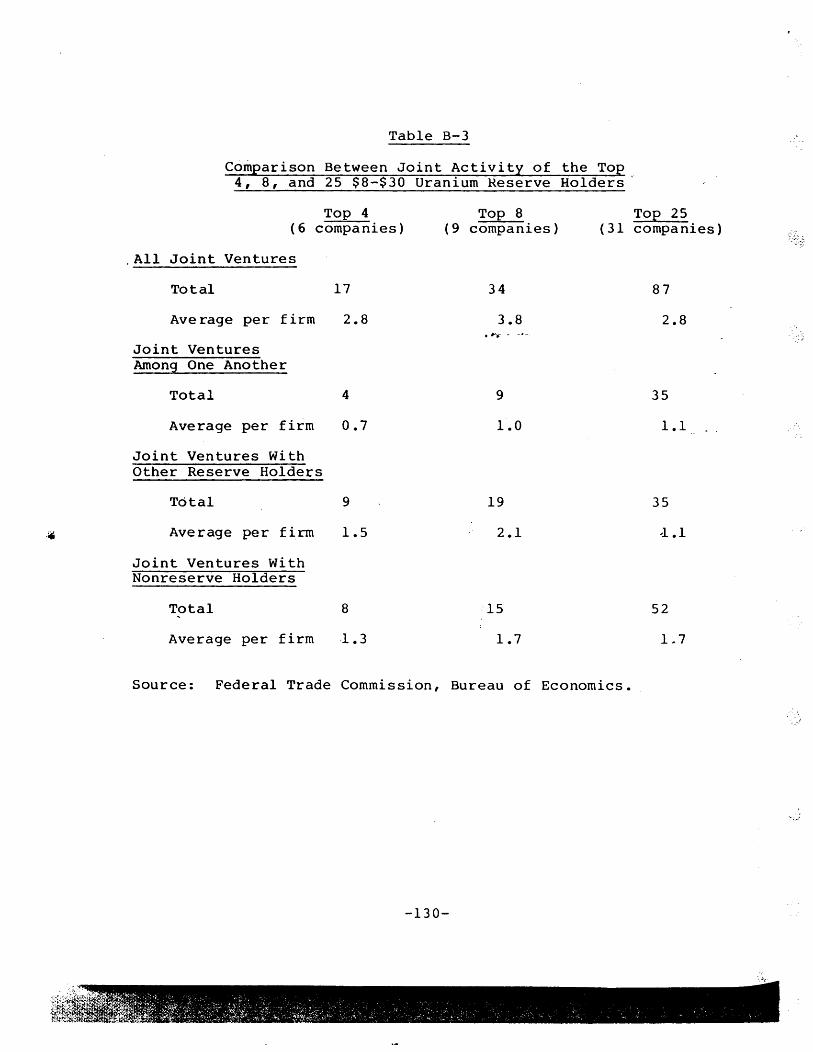
.~
Table B-3
Comparison Between Joint Activity of the Top 4, 8, and 25 $8-$30 Uranium Heserve Holders'
Top 4 Top 8 Top 25 (6 companies) (9 companies) (31 compa nies)
.All Joint Ventures
Total 17 34 87
Average per firm 2.8 3.8 2.8 ... .,._ o. - .. -
Joint Ventures Amon9 One Another
Total 4 9 35
Average per firm 0.7 1.0 1.1
Joint Ventures With Other Reserve Holders
Total 9 19 35
Average per firm 1.5 2.1 -1.1
Joint Ventures With Nonreserve Holders
Total 8 15 52
Average per firm 1.3 1.7 lA7
Source: Federal Trade Commission, Bureau of Economics.
-130-
The technology, personnel and expertise associated with
uranium exploration and development are substantially unrelated
to those involved in the production and marketing of uranium. Of
the 96 existing ventures active as of January 1975, only 4 had
evolved to the production stage, and these accounted for 22
percent of total 1975 domestic productive capacity (table 8-4).
Each of these production ventures consisted of two existing
reserve holders. . ... - . ---.
-131-
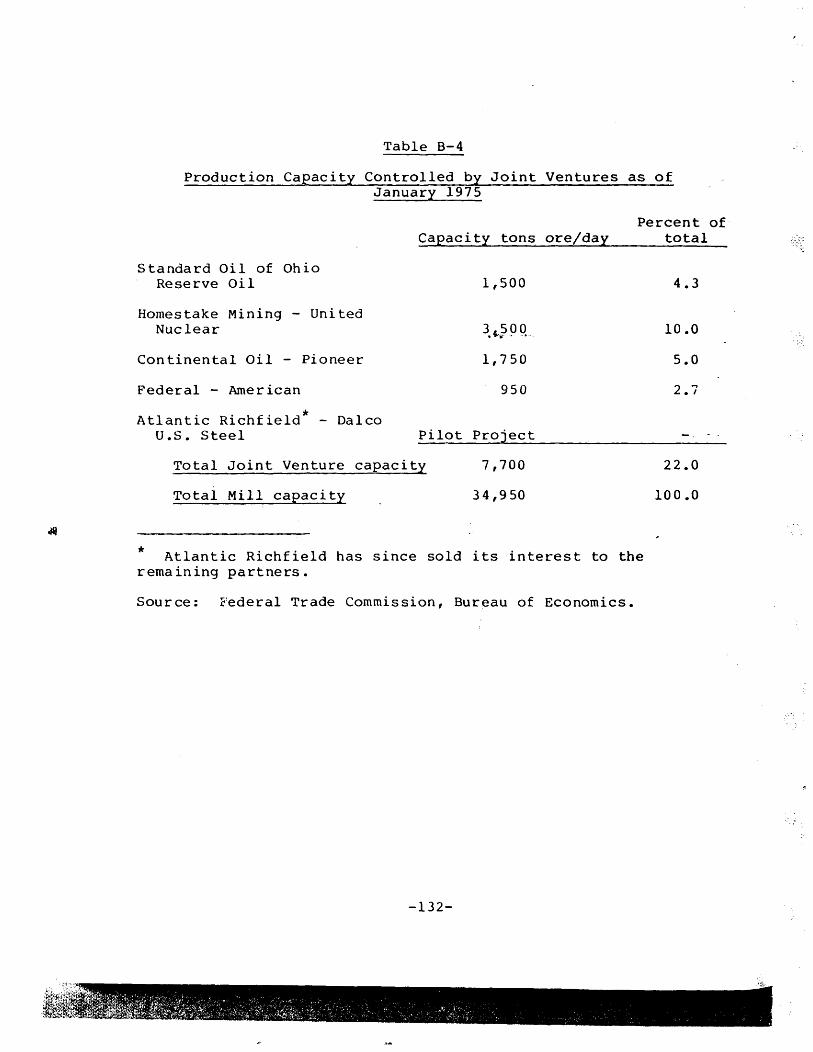
:,'1'
;~~if;~;;
Table B-4
Production Capacity Controlled by Joint Ventures as of January 1975
Capacity tons ore/day
Standard Oil of Ohio Reserve Oil
Homestake Mining - United Nuclear
Continental Oil - Pioneer
Federal - American
1,500
3.~?9~L
1,750
950
Atlantic Richfield* - Daleo U.S. Steel Pilot Project
Total Joint Venture capacity
Total Mill capacity
7,700
34,950
Percent of total
4.3
10.0
5.0
2.7
22.0
100.0
* Atlantic Richfield has since sold its interest to the remaining partners.
Source: Federal Trade Commission, Bureau of Economics.
-132-
APPENDIX C: MERGERS AND RESERVE PURCHA~ES IN THE URANIUM
INDUSTRY, 1955 - 1974*
Since 1955, there have been approximately 40 mergers or
acquisitions in the nuclear energy industry (See table C-l). In
36 of these cases, both the acquiring and acquired companies were
involved in uranium exploration, development, mining, or milling.
Figure C-l plots the number of mergers and acquisitions for each
of the years 1955-1974, averaged over a three-ye~~' period. The
graph indicates that merger activity has decreased slightly over
the years.
Table C-2 provides a breakdown of acquisitions and mergers
among the top 4, 8, 15, and 25 holders of $30 :ranium reserves
as of Januarx 1, 1975. According to table C-2, the top 4 reserve
holders in 197~ were involved in one-third of ·the 36 acquisitions
in the uranium industry since 1955, while the top 8 accounted for
more than half of these acquisitions.
Table C-3 lists the companies which enter~d the uranium
industry through the acquisition of on-going uranium firms. It
is significant to note that no petroleum company entered the
uranium business through merger or acquisition.
* This section was written by Steven Martin and Anthony Majewski. It was completed in April 1977 and reflects material collected until that time. Its chief source of information was material obtained through the FTC uranium investigation.
-133-
. : ... ' .... J, \: .:'
"
.
__ ~M~~~~~~{~~:c~t(~~~~~~I".~:'m"~""""' .. ' '' .. '''''.''''.''~,,~:~ __ ''' .. ,.,., .•.• , ....... J~. ;;.'
\ ,I
\
\1
I . '
i ,I ,I
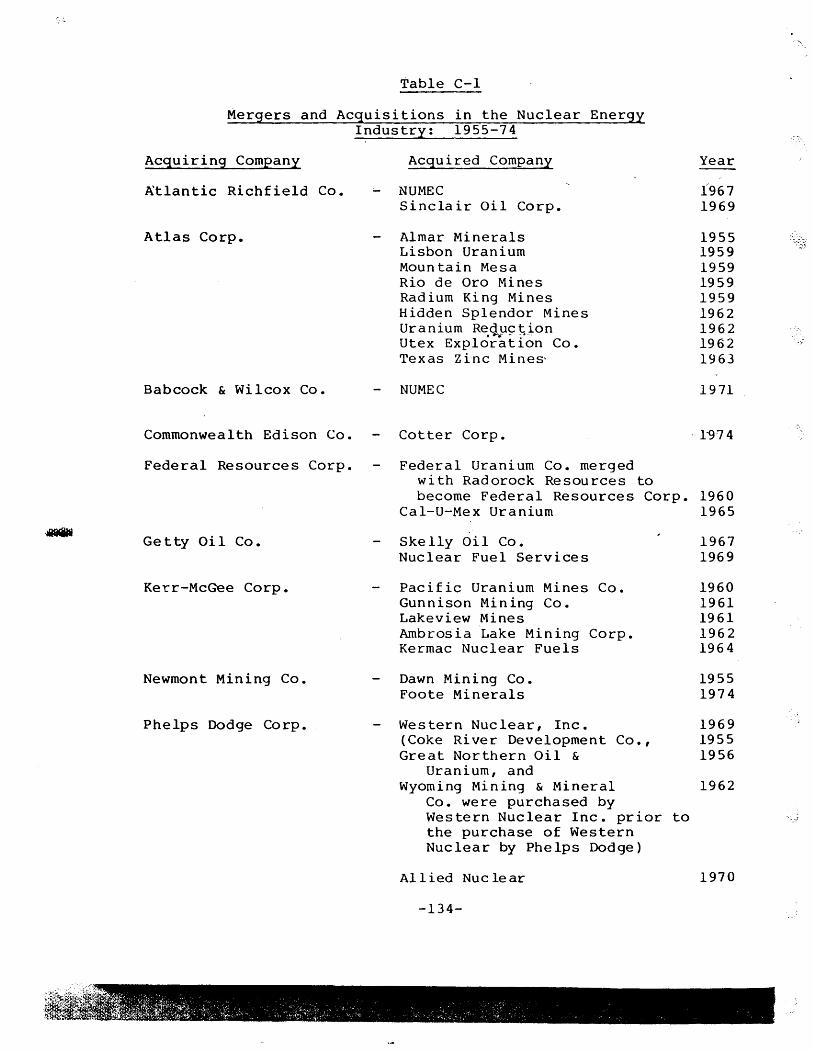
.~
Table C-l
Mergers and Acquisitions in the Nuclear Energy Industry: 1955-74
Acquiring Company
~tlantic Richfield Co.
Atlas Corp.
Babcock & Wilcox Co.
Commonwealth Edison Co.
Federal Resources Corp.
Ge tty Oi 1 Co.
Kerr-McGee Corp.
Newmont Mining Co.
Phelps Dodge Corp.
Acquired Company
NUMEC Sinclair Oil Corp.
Almar Minerals Lisbon Uranium Moun tain Mesa Rio de Oro Mines Radium King Mines Hidden Splendor Mines Uranium Reduction ..... - . ~.-.
Utex ExploratIon Co. Texas Zinc Mines
NUMEC
Cotter Corp.
Federal Uranium Co. merged with Radorock Resources to
Year
1967 1969
1955 1959 1959 1959 1959 1962 1962 1962 1963
1971
'1"974
become Federal Resources Corp. 1960 Cal-U-Mex Uranium 1965
Skelly Oil Co. Nuclear Fuel Services
Pacific Uranium Mines Co. Gunnison Mining Co. Lakeview Mines Ambrosia Lake Mining Corp. Kermac Nuclear Fuels
Dawn Mining Co. Foote Minerals
Western Nuclear, Inc. (Coke River Development Co., Great Northern Oil &
Uranium, and Wyoming Mining & Mineral
Co. were purchased by Western Nuclear Inc. prior to the purchase of Western Nuclear by Phelps Dodge)
1967 1969
1960 1961 1961 1962 1964
1955 1974
1969 1955 1956
1962
Allied Nuclear 1970
-134-
. ;
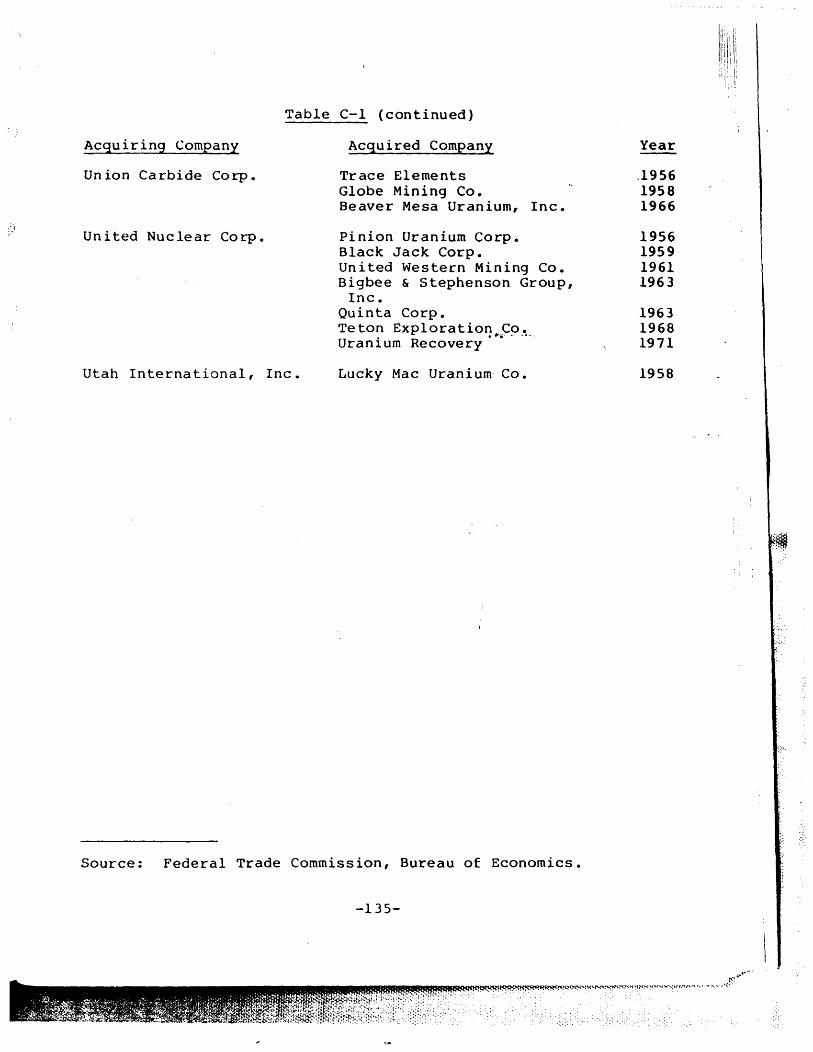
Table C-l (continued)
Acquiring Company
Union Carbide Corp.
United Nuclear Corp.
Utah International, Inc.
Acquired Company
Trace Elements Globe Mining Co. Beaver Mesa Uranium, Inc.
Pinion Uranium Corp. Black Jack Corp. United Western Mining Co. Bigbee & Stephenson Group,
Inc. Quinta Corp. Teton Exploration Co. .""'.- . ---. Uranium Recovery
Lucky Mac Uranium· Co.
Source: Federal Trade Commission, Bureau of Economics.
-135-
Year
,1956 1958 1966
1956 1959 1961 1963
1963 1968 1971
1958
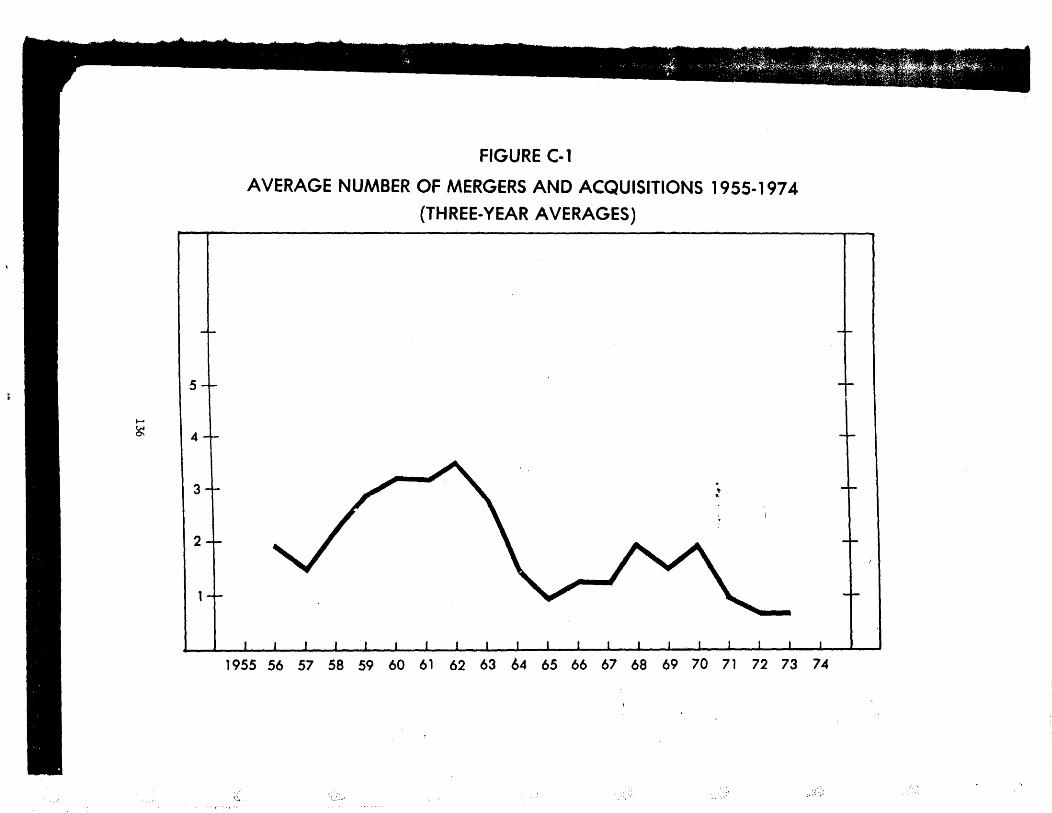
5
~
~ 14
3
2
FIGURE C-1
AVERAGE NUMBER OF MERGERS AND ACQUISITIONS 1955-1974 (THREE-YEAR AVERAGES)
1955 56 57 58 59 60 61 62 63 64 65 66 67 68 69 70 71 72 73 74
\.'"
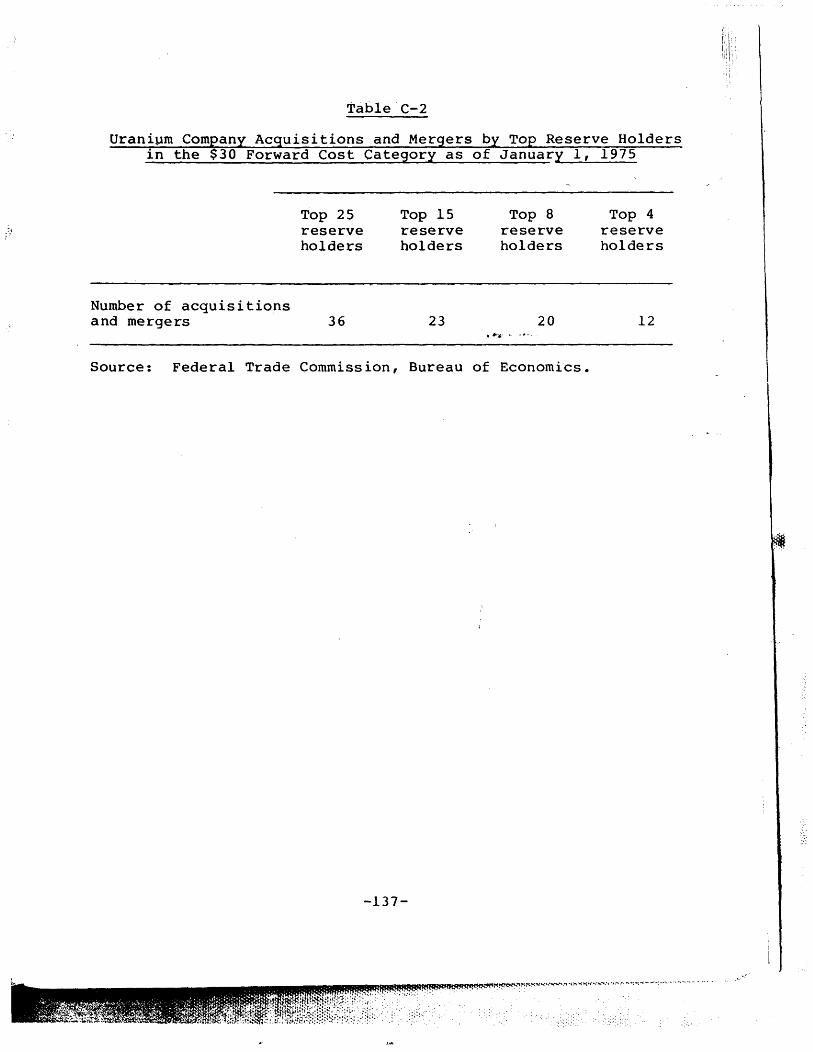
Uranium Company Acquisitions and Mergers by Top Reserve Holders in the $30 Forward Cost Category as of January 1, 1975
Top 25 ~ reserve
holders
Number of acquisitions and mergers 36
Top 15 reserve holders
23
Top 8 reserve holders
20 ,1/>1-... • -.-.
Source: Federal Trade Commission, Bureau of Economics.
-137-
Top 4 reserve holders
12
...... ~
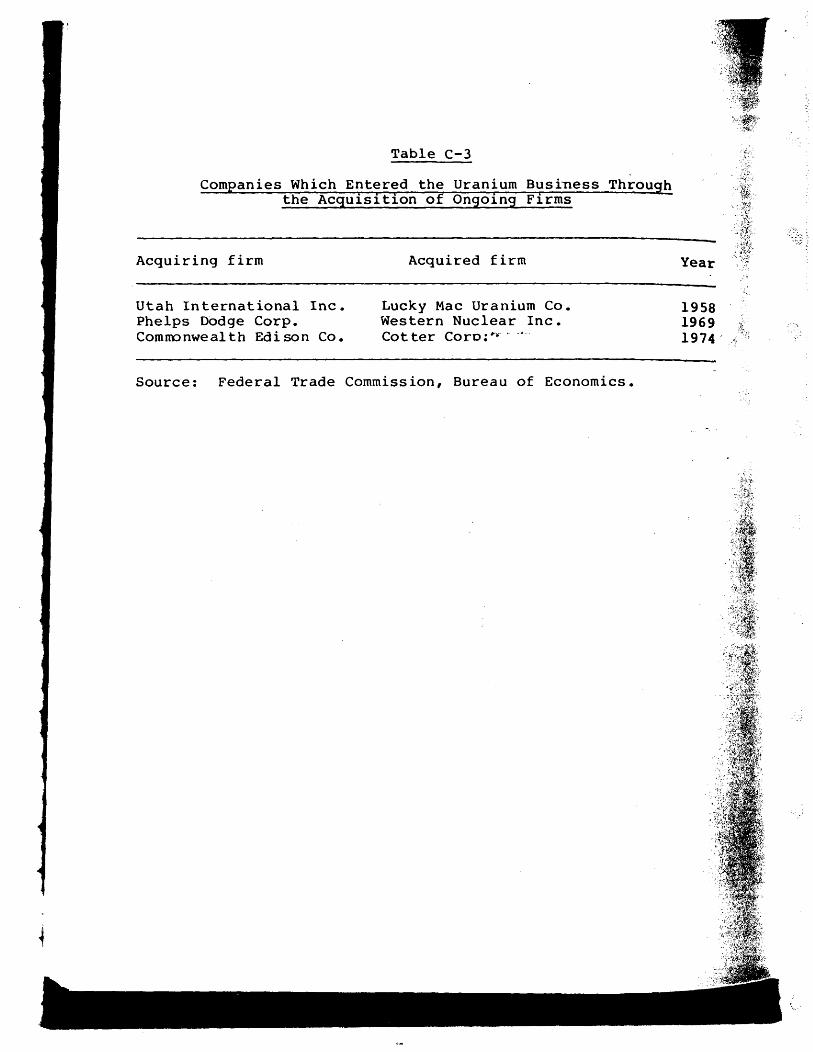
Table C-3
Companies Which Entered the Uranium Business Through the Acquisition of Ongoing Firms
Acquiring firm
Utah International Inc. Phelps Dodge Corp. Com 110 nwe a1 th Edi son Co.
Acquired firm
Lucky Mac Uranium Co. Western Nuclear Inc. Cot ter Core: r • . _.-
Source: Federal Trade Commission, Bureau of Economics.
Year
1958 1969 1974-
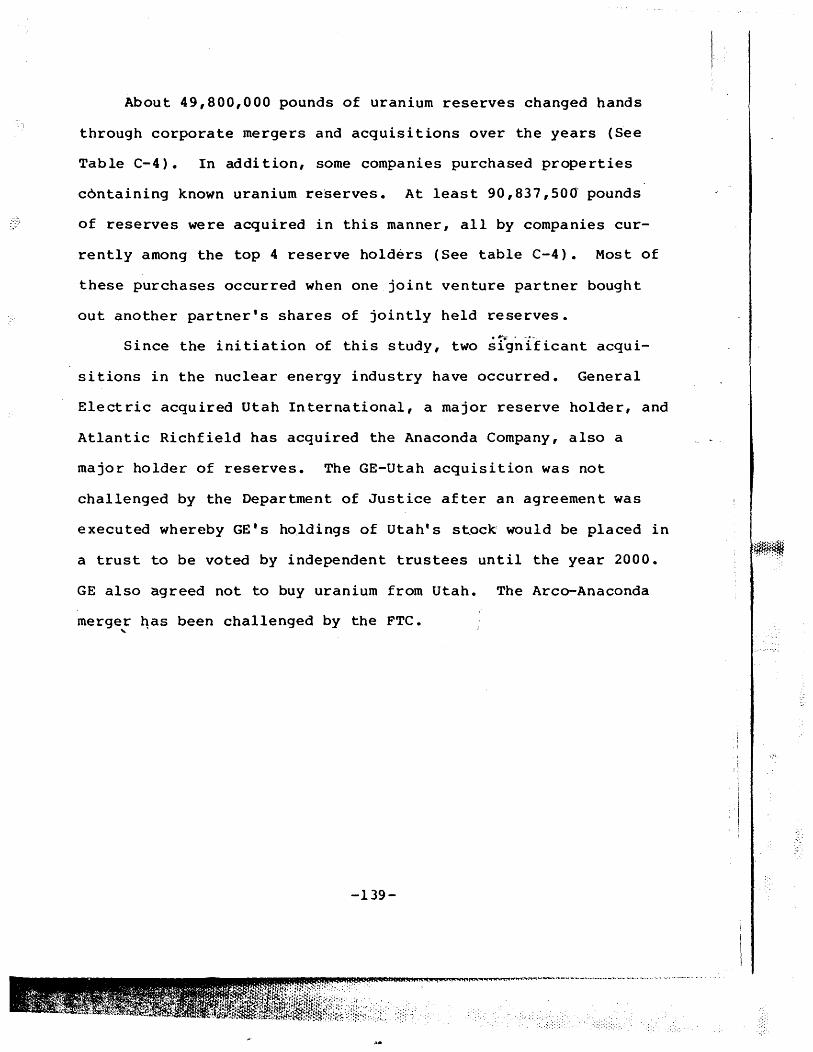
I
About 49,800,000 pounds of uranium reserves changed hands
through corporate mergers and acquisitions over the years (See
Table C-4). In addition, some companies purchased properties
c6ntaining known uranium reserves. At least 90,837,SOcr pounds
of reserves were acquired in this manner, all by companies cur-
rently among the top 4 reserve holders (See table C-4). Most of
these purchases occurred when one joint venture partner bought
out another partner's shares of jointly held reserves.
Since the initiation of this study, two significant acqui-
sitions in the nuclear energy industry have occurred. General
Electric acquired Utah International, a major reserve holder, and
Atlantic Richfield has acquired the Anaconda Company, also a
major holder of reserves. The GE-Utah acquisition was not
challenged by the Department of Justice after an agreement was
executed whereby GE' s holdings of Utah's st.ock' would be placed in
a trust to be voted by independent trustees until the year 2000. 'my~~ '"',., .... ::.:. ~
GE also agreed not to buy uranium from Utah. The Arco-Anaconda
merger qas been challenged by the FTC. "
i .,
-139-
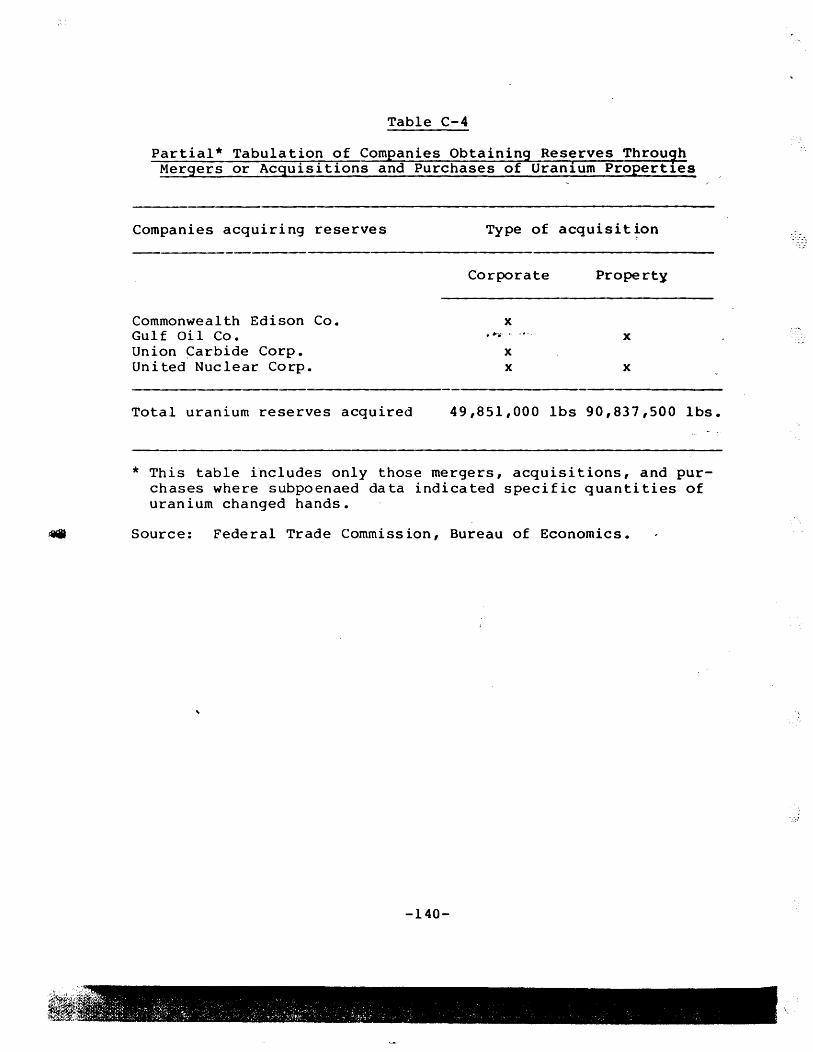
Table C-4
Partial* Tabulation of Companies Obtaining Reserves Throu~h Mergers or Acquisitions and Purchases of Uranium Propertles
Companies acquiring reserves
Commonwealth Edison Co. Gulf Oil Co. Union ~arbide Corp. United Nuclear Corp.
Total uranium reserves acquired
Type of acquisit~on
Corporate
x
x x
Property
x
x
49,851,000 lbs 90,837,500 lbs.
* This table ihcludes only those mergers, acquisitions, and purchases where subpoenaed data indicated specific quantities of uranium changed hands.
Source: Federal Trade Commission, Bureau of Economics.
-140-
-:,1
APPENDIX D: DATA PRODUCTION PROCEDURES
At the outset of the study, it was necessary to determine
the identity of the firms which make up the uranium industry.
ERDA supplied the staff \{ith a list of the 31 top reserve hold
ers. The major domestic oil producers and large western land
holding railroads were added to this list, bringing the total to
50 firms. Subpoenas were issued to each of these companies (See
table 0-1).
Midway through the study, a check was made to ensure that no
firms had been overlooked. A list was compiled using prior ,.,. .... ---.
studies, ERDA information and publications, subpoenaed documents,
Moody's and Standard & Poor's Industrial i~anual s, and Atomi c
Industrial Foruml membership lists of all companies wQich the
staff had reason to believe might have been or presently were
involved in the uranium industry. Using such sources as Dunn &
Bradstreet and the Engineering arid Mining Journal directories,
addresses were sought for those companies Still in existence and
inquiries sent to each, asking the extent of their involvement
in the industry. Eighteen companies responded (see table 0-2).
While some reported that they held up to a total· of several
million pounds of uranium and were actively ~xploring for ura-
nium, none appeared to constitute a major member of the indus~ry.
* This section was written by Steven F. Martin. Except for the concluding section, all governmental references are to ERDA (Energy Hesearch and Development Administration), the agency in charge of uranium information at the time this section was written April 1977, EHDA was subsequently subsumed under the newly created Department of Energy.
1 The Atomic Industrial Forum is the trade association for
the nuc lear i nd us try •
-141-
·Ii
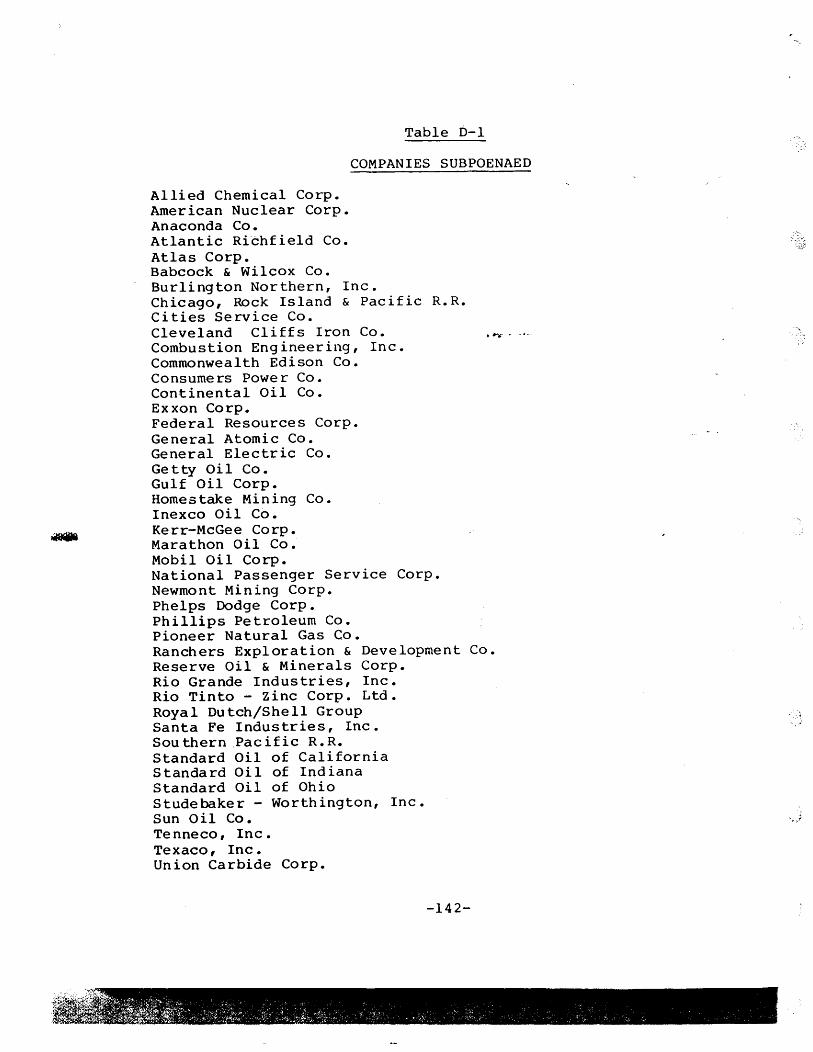
"
Table D-l
COMPANIES SUBPOENAED
Allied Chemical Corp. American Nuclear Corp. Anaconda Co. Atlantic Ri~hfield Co. Atlas Corp. Babcock & Wilcox Co. Burlington Northern, Inc. Chicago, Rock Island & Pacific R.R. Cities Service Co. Cleveland Cliffs Iron Co. Combustion Engineering, Inc. Commonwealth Edison Co. Consumers Power Co. Continental Oil Co. Exxon Corp. Federal Resources Corp. General Atomic Co. General Electric Co. Getty Oil Co. Gulf Oil Corp. Homestake Mining Co. Inexco Oil Co. Kerr-McGee Corp. Marathon Oil Co. Mobil Oil Corp. National Passenger Service Corp. Newmont Mining Corp. Phelps Dodge Corp. Phillips Petroleum Co. Pioneer Natural Gas Co.
. .... ,.- . -.-.
Ranchers Exploration & Development Co. Reserve Oil & Minerals Corp. Rio Grande Industries, Inc. Rio Tinto - Zinc Corp. Ltd. Royal Dutch/Shell Group Santa Fe Industries, Inc. Southern .Pacific R.R. Standard Oil of California Standard Oil of Indiana Standard Oil of Ohio Studebaker - Worthington, Inc. Sun Oil Co. Te nneco, Inc. Te xaco, Inc. Union Carbide Corp.
-142-
:·I~' .. )'~£:i~~~~~£~t: ... ,.,-;-::{;;;;:~~" .::~'~."<l, .. :~" .. "<i!'>, : :>, . .'::."., ',: .. ' " /" . . . .
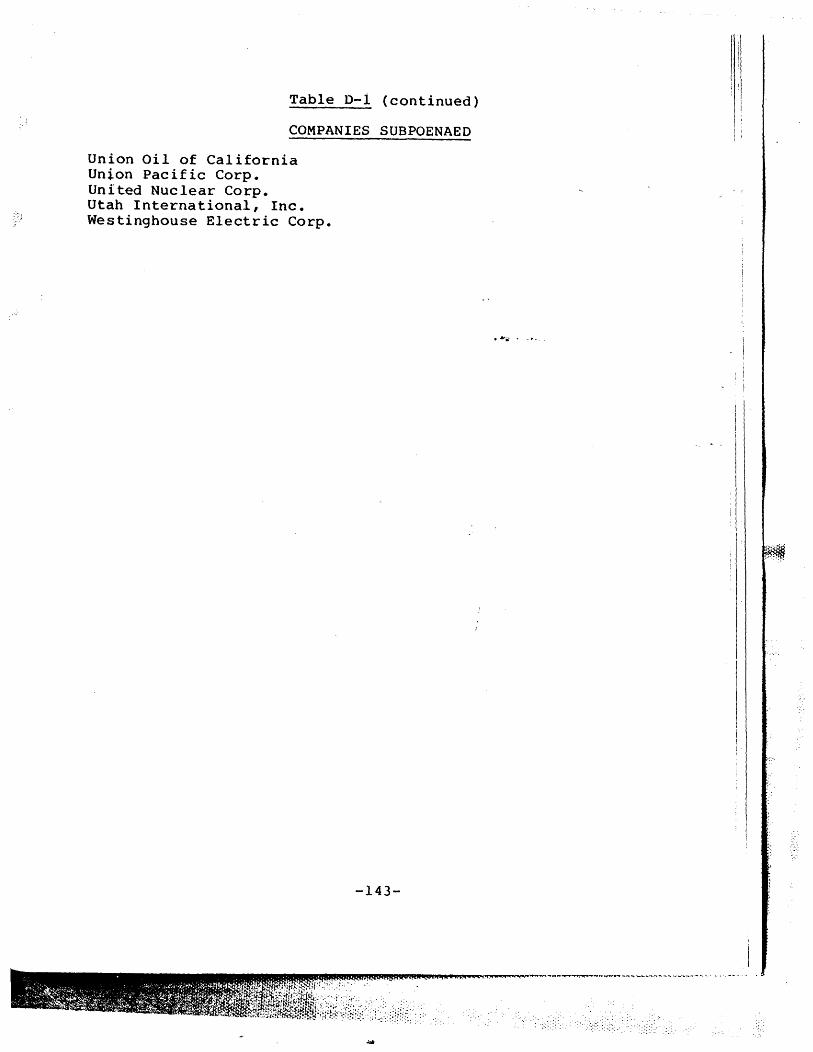
Table D-l (continued)
COMPANIES SUBPOENAED
Union Oil of California Union Pacific Corp. United Nuclear Corp. Utah International, Inc. Westinghouse Electric Corp.
-143-
. .... - . -.-.
i' I'
; I ! , ,
!
I·
~~ .. ,,~~
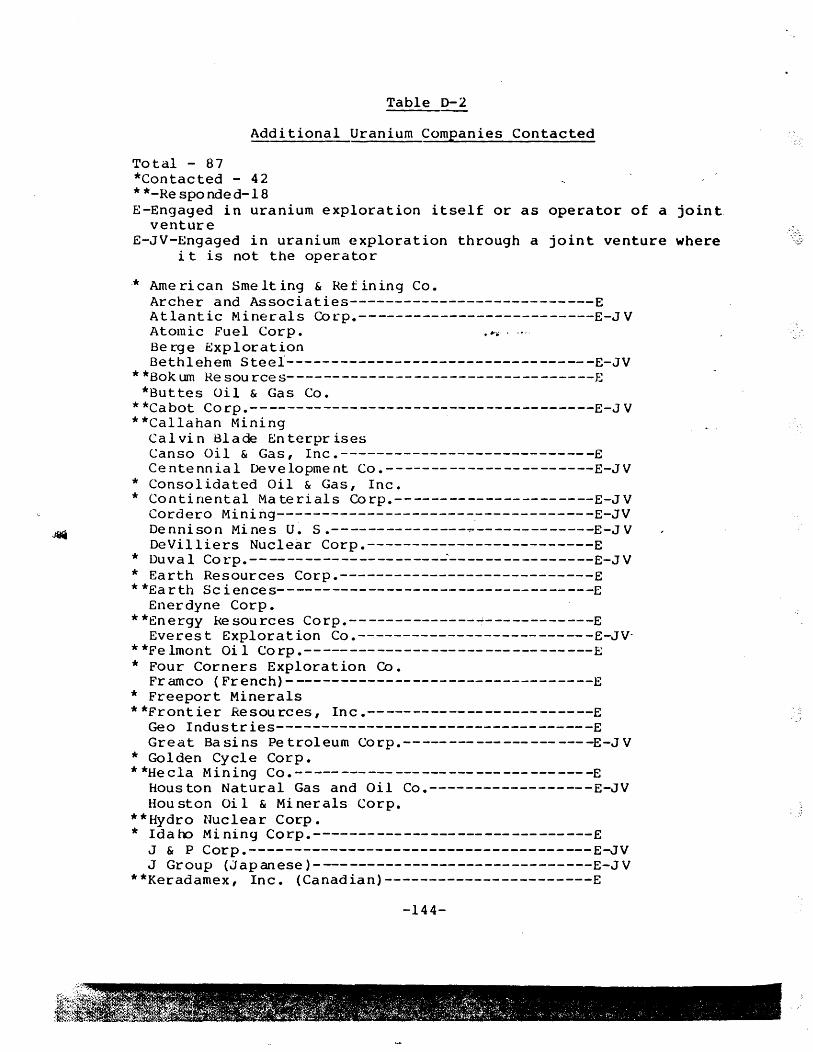
,~;:'
.f~
Table D-2
Additional Uranium Companies Contacted
Total - 87 *Contacted - 42 * * - Re s po nde d-18 E-Engaged in uranium exploration itself or as operator of a joint
venture E-JV-Engaged in uranium exploration through a joint venture where
it is not the operator
* Arne ri can Sme It ing & Re f in ing Co. Archer and Associaties---------------------------E Atlantic Minerals COrp.--------------------------E-JV Atomic Fuel Corp. . ~ii • -.-
Be rge Exploration Bethlehem Steel----------------------------------E-JV
**Bokum Resources----------------------------------E *Buttes Oil & Gas Co.
**Cabot Corp.--------------------------------------E-JV **Callahan Mining
Cal vi n Blade En terpr ises Canso Oil & Gas, Inc.----------------------------E Centennial Development Co.-----------------------E-JV
* Consolidated Oil & Gas, Inc. * Continental Ma terials COrp.----------------------E-JV
Cordero Minirig----------------------~------------E-JV Dennison Mines U. S .---------------.,..-------------E-JV DeVilliers Nuclear Corp.-------------------------E
* Duval Corp.---------------------~----------------E-JV * Earth Resources Corp.----------------------------E **Earth Sciences-----------------------------------E
Enerdyne Corp. **energy ~sources Corp.--------------~------------E
Everest Exploration Co.--------------------------E-JV**Felmont Oil Corp.--------------------------------E * Four Corners Exploration Co.
Framco (French)----------------------------------E * Freeport Minerals **Frontier Resources, Inc.-------------------------E
Geo Industries-----------------------------------E Great Basins Petroleum Corp.---------------------E-JV
* Golden Cycle Corp. * *Hecla Mining Co.---------------------------------E
Houston Natural Gas and Oil Co.------------------E-JV Hou ston Oi 1 & Mi nerals Corp.
**Hydro Nuclear Corp. * Idaoo Mining Corp.-------------------------------E
J & P Corp.--------------------------------------E-JV J Group (Japanese)-------------------------------E-JV
**Keradamex, Inc. (Canadian)-----------------------E
-144-
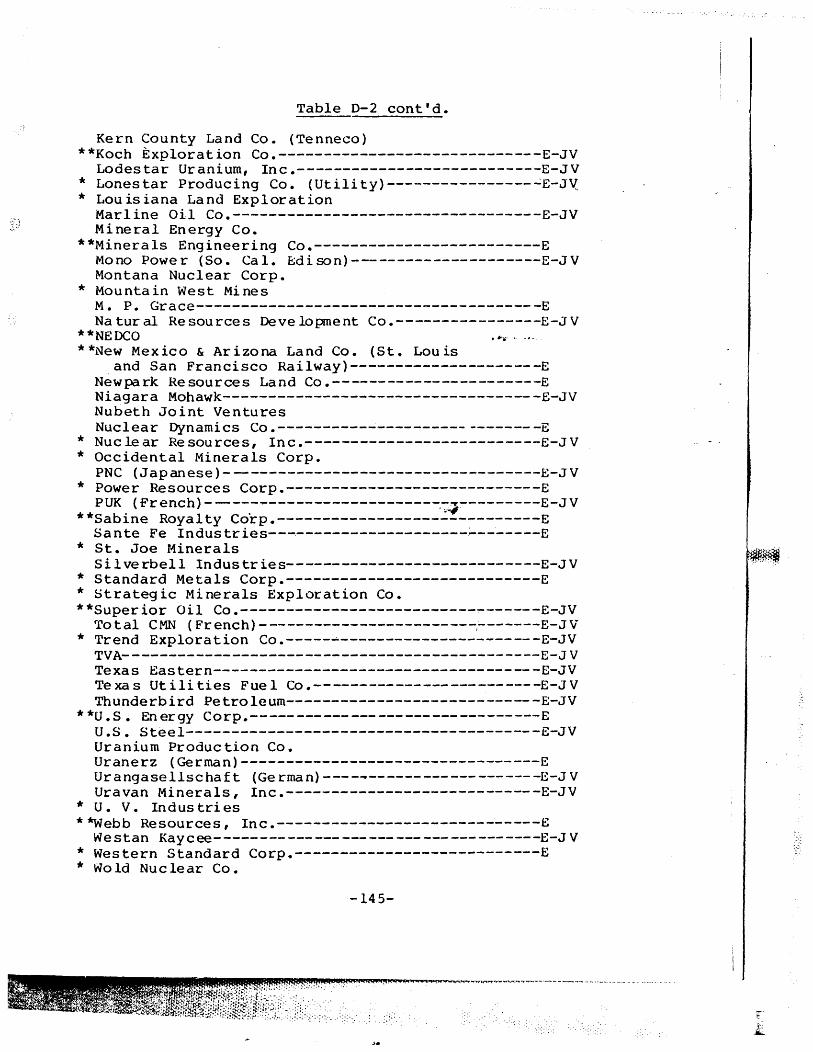
Table D-2 cont'd.
Kern County Land Co. (Tenneco) **Koch Exploration Co.-----------------------------E-Jv
Lodestar Uranium, Inc .---------------------------E-JV * Lonestar Producing Co. (Utility)----------------~E-J~ * Louisiana Land Exploration
Marline Oil Co.----------------------------------E-JV Mineral Energy Co.
**Minerals Engineering Co.-------------------------E Mono Power (So. Cal. Bdison)---------------------E-JV Montana Nuclear Corp.
* Mountain West Mines M. P. Grace--------------------------------------E Natural Resources Development Co.----------------E-JV
* *NE DCO . .,. ... -.-* *New Mex ico & Ar izona Land Co. (St. Lou is
,and San Francisco Railway)---------------------E Newpark Resources Land Co.-----------------------E Niagara Mohawk-----------------------------------E-JV Nubeth Joint Ventures Nuclear Dynamics Co.----------~------------------E
* Nuclear Resources, Inc.--------------------------E-JV * Occidental Minerals Corp.
PNC (Japanese)-----------------------------------E-JV * Power Resources Corp.----------------------------E
PUK (French) - ----.,..-------------------.~---------E-JV **Sabine Royalty Corp.------------------~----------E
Sante Fe Industries--.,..-------------------~-------E * St. Joe Minerals
Silverbell Industries----------------------------E-JV * Standard Metals Corp.----------------------------E * Strategic Minerals Exploration Co. **Superior Oil Co.--------------------------~------E-JV
Total CMN (French) ------------------------/-------E-JV * Trend Exploration Co.-----~----------------------E-JV
TVA----------------------------------------------E-JV Texas Eastern------------------------------------E-JV Te xa s Ut iIi ties Fue 1 Co .-------------------------E-J V Thunderbird Petroleum----------------------------E-JV
* *U. S. En ergy Corp.----- ------ --- ------------------E U.S. Steel---------------------------------------E-JV Uranium Produc tion Co. Uranerz (German)---------------------------------E Urangasellschaft (Ge rman) ------------------------E-J V Uravan Minerals, Inc.----------------------------E-JV
* U. V. In d us tr i es **Webb Resources, Inc.-----------------------------E
Westan Kaycee------------------------------------E-J V * Western Standard Corp.---------------------------E * Wold Nuclear Co.
-145-
,f##~ ..... ~~
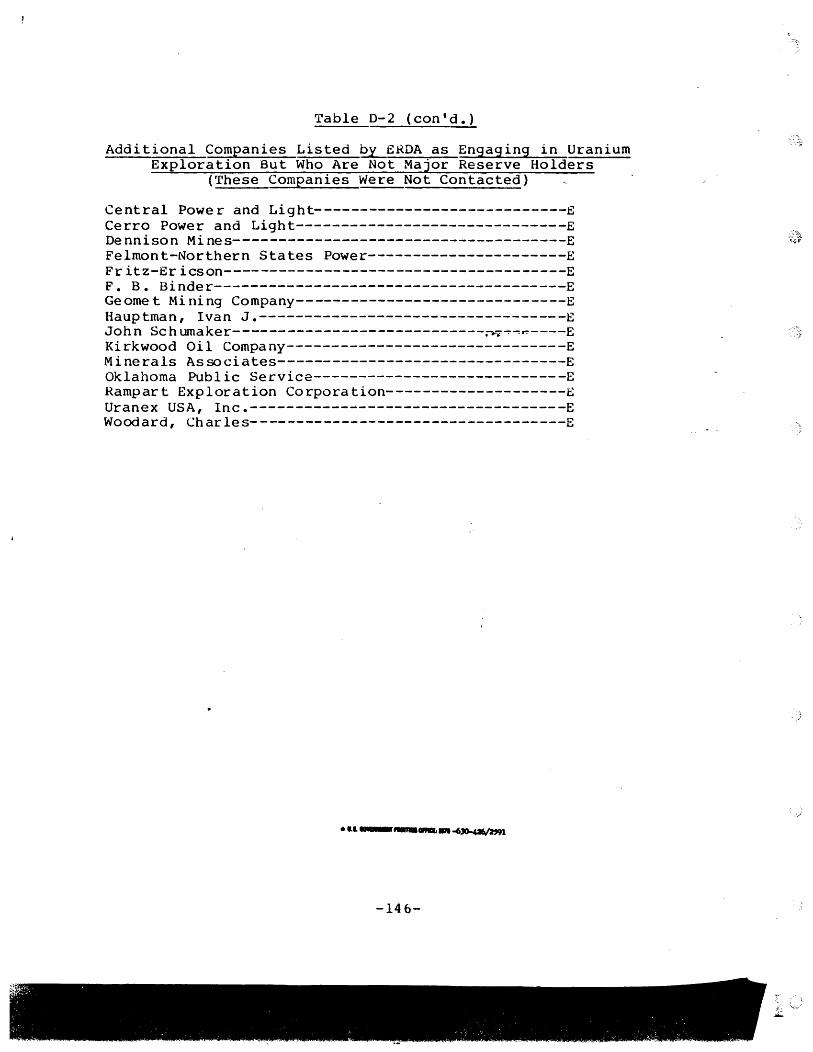
I. 1'~1'~ •
Table 0-2 (con'd.)
Additional Companies Listed by EKDA as Engaging in Uranium Exploration But Who Are Not Major Reserve Holders
(These Companies Were Not Contacted)
Central Powe rand Light----------------------------E Cerro Power and Light------------------------------E Dennison Mines-------------------------------------E Felmont-Northern States Power----------------------E Fritz-Ericson--------------------------------------E F. B. Binder---------------------------------------E Geomet Mining Company------------------------------E Hauptman, Ivan J.----------------------------------E Joh n Sc h umaker----------------------------.-..7~~~----E Kirkwood Oil Company-------------------------------E Minerals Associates--------------------------------E Oklahoma Public Service----------------------------E Rampart Exploration Corporation--------------------E Uranex USA, Inc.-----------------------------------E Woodard, Charles---------------------~-------------E
-146-
, .
;, ~ ) ,I • • • ~ , • " J ~ .. '" ..... ". :'I.
- .!

![LONG-TERM URANIUM SUPPLY-DEMAND ANALYSES · 2003-04-15 · A long-term uranium supply-demand study has been made using an improved version of the RAPP 3 computer model [2]. Supply](https://img.pdfslide.us/doc/110x75/5e4ac77e03ebb250b014bbc6/long-term-uranium-supply-demand-analyses-2003-04-15-a-long-term-uranium-supply-demand.jpg)