Embed Size (px)
Citation preview


Competitive Supply Chains


Competitive Supply ChainsA Value-Based Management Perspective
2nd edition
Enver YücesanINSEAD, France

© Enver Yücesan 2007, 2016
All rights reserved. No reproduction, copy or transmission of thispublication may be made without written permission.
No portion of this publication may be reproduced, copied or transmittedsave with written permission or in accordance with the provisions of the Copyright, Designs and Patents Act 1988, or under the terms of any licence permitting limited copying issued by the Copyright Licensing Agency, Saffron House, 6–10 Kirby Street, London EC1N 8TS.
Any person who does any unauthorized act in relation to this publicationmay be liable to criminal prosecution and civil claims for damages.
The author has asserted his rights to be identified as the author of this work in accordance with the Copyright, Designs and Patents Act 1988.
First published 2007This edition published 2016 byPALGRAVE MACMILLAN
Palgrave Macmillan in the UK is an imprint of Macmillan Publishers Limited, registered in England, company number 785998, of Houndmills, Basingstoke,Hampshire RG21 6XS.
Palgrave Macmillan in the US is a division of St Martin’s Press LLC, 175 Fifth Avenue, New York, NY 10010.
Palgrave Macmillan is the global academic imprint of the above companies and has companies and representatives throughout the world.
Palgrave® and Macmillan® are registered trademarks in the United States, the United Kingdom, Europe and other countries.
This book is printed on paper suitable for recycling and made from fullymanaged and sustained forest sources. Logging, pulping and manufacturing processes are expected to conform to the environmental regulations of the country of origin.
A catalogue record for this book is available from the British Library.
A catalog record for this book is available from the Library of Congress.
Typeset by MPS Limited, Chennai, India.
ISBN 978-1-349-55679-3 ISBN 978-1-137-53267-1 (eBook)DOI 10.1057/9781137532671
Softcover reprint of the hardcover 2nd edition 2016 978-1-137-53265-7

To the loving memory of my dear mother, Dr. Mürüvvet Aydin Yücesan


vii
List of Figures and Tables viii
Preface xi
Introduction: End-to-End Supply Chain Design 1
1 Working Definitions 11
2 Value-Based Management: The Guiding Principle for SCM 24
3 Value Creation: Dynamic Supply Chain Design 38
4 Value Creation: Assessing the Cost-Service Trade-off 67
5 Value Capture: Aligning Supply Chain Partners 91
6 Impact of Technology on SCM: A Brief History of IT for SCM 116
7 Service Supply Chains 135
8 Concluding Comments 149
Appendix 157
Notes 159
References 162
Index 165
Contents

viii
List of Figures and Tables
Figures
P.1 Value-based SCM framework for Coloplast xiiiP.2 Modeling approaches used in the book xivI.1 Global seeds market 3I.2 Demand–supply mismatch costs 5I.3 The R&D cycle 6I.4 Field production in the northern hemisphere 7I.5 Generation of a production, processing,
and distribution plan 7I.6 Seed processing 8I.7 Forecast volatility 9I.8 Summary of key planning steps 101.1 Manufacturing as the locomotive of growth 121.2 Top manufacturers around the globe 131.3 Global technologies and innovators 141.4 Labor-intensive tradables 151.5 Global trade routes (1990–2010) 161.6 Defining value as [willingness-to-pay – cost] 181.7 The interaction between value creation and value capture 181.8 Working definition of a supply chain 191.9 Matching demand and supply in a supply chain 212.1 Value-based management as the guiding principle for SCM 252.2 Cascading EP across the organization 312.3 Creating value by higher capital turns 322.4 Deploying the invested capital 332.5 The operating cycle 332.6 Economic profit in SCM 363.1 Xerox’s European distribution network in 1990s 393.2 Vertical industry structure and integral product
architecture in the computer industry, 1975–1985 403.3 Vertical industry structure and integral product
architecture in the computer industry, 1985–1995 403.4 Fine’s double Helix model of industry evolution 423.5 The rhythm of development activity in the electronics
industry (Mendelson and Pillai 1999) 44

List of Figures and Tables ix
3.6 Product life cycle compression: 1988–1995 (Mendelson and Pillai 1999) 45
3.7 SCM drivers of value from a SCOR perspective 463.8 Supply chain design 463.9 The LP formulation for network configuration 483.10 Three-dimensional concurrent engineering (Fine 1999) 503.11 Mapping for organizational, technology,
and capability chains 563.12 Value-based supply chain management 583.13 Globalizing ecosystems 593.14 Distribution of disasters over time 593.15 Monitoring corporate social responsibility 613.16 Risk management framework 633.17 The risk matrix 654.1 A simple supply chain 694.2 A base stock inventory system 704.3 The cost-service trade-off curve for HP deskjet printers 754.4 The impact of seasonal demand for toys: seasonal stocks 814.5 Cycle stocks and the economic order quantity 824.6 Coordinating production and assembly through
decoupling stocks 844.7 Working capital of various agri-business companies 864.8 Supplier financing 895.1 The bullwhip phenomenon 925.2 An integrated production–distribution system 985.3 Decision tree for the Newsvendor problem 1005.4 A decentralized production–distribution system 1015.5 Decision tree for the retailer 1015.6 A decentralized production–distribution
system with buyback 1035.7 Decision tree for the retailer 1055.8 Emerging markets for pharmaceuticals
(Huybrecht et al., 2012) 1125.9 Strategic outsourcing in the pharmaceutical
supply chain 1136.1 Upton and McAfee’s framework for electronic
connectivity 1206.2 Canceling an order in the three-tier
client-server architecture 1266.3 SAP’s HANA platform 1276.4 Business-to-business digital transaction models 128

x List of Figures and Tables
6.5 Kaplan and Sawhney’s B2B trading matrix 1306.6 Reach versus richness trade-off in supplier certification 1317.1 Evolution of different sectors in a developed economy 1367.2 The product–process matrix 1387.3 Service–intensity matrix 1387.4 Waiting for an elevator 1417.5 Interfacing the front office and the back office
for CIBA vision 1457.6 The Eurologistics solution 1467.7 Managing capacity at Lufthansa (Huchzermeier, ’02) 1478.1 Major initiatives along the supply chain 1508.2 HP’s BDD supply chain in mid-1990s 1518.3 HP’s customer orientation 1518.4 Material, information, and cash flows 1528.5 The new HP supply chain 1538.6 Planting rice 1548.7 The Tegra offer 1548.8 Bottle blowing 156
Tables
2.1 WCR for 1,000 large European corporations 352.2 Operational drivers of economic profit 353.1 Product offerings of leading mountain
bike manufacturers 513.2 Characteristics of functional vs. innovative products 523.3 Supply chain characteristics 523.4 The matrix of organizational dependency and
product modularity 554.1 Drivers of inventory 865.1 Supply chain costs 1075.2 Characteristics of the supply base 1085.3 Channel relationships 1095.4 Logistics services 1105.5 Process characteristics 1105.6 New requirements in pharmaceuticals 1136.1 Key trends in supply chain management (Top 12 of 22) 1196.2 Shortcomings of current ERP systems for SCM 1237.1 Product and service characteristics 136
xi
Preface
It is generally accepted that Supply Chain Management (SCM) started gathering steam in the early 1990s when a Kurt Solomon and Associates study concluded that the demand–supply mismatches were costing the US grocery industry $30 billion a year.1 Up until then, SCM was consid-ered to be an obscure back office activity, typically labeled as “warehous-ing and distribution” or, a bit more gloriously, “logistics.” A ruthless wake-up call, $30 billion represents a shocking number when one real-izes that low-margin products such as toothpaste, broccoli, and flour are at stake in this industry. On the one hand, keeping additional stock to provide high levels of customer service is risky in this setting due to enor-mous variety in products and their short shelf-life. On the other hand, stock-outs, which are typically around 7% of sales for better managed companies, lead to lost sales not only for the grocery store but ultimately for the overall industry, including the retailer and the manufacturer, should the customer abandon the purchase altogether. It was quickly dis-covered that other industries were also facing similar challenges. Under such difficult circumstances, many industries have undertaken revolu-tionary initiatives in streamlining their go-to-market strategies. Over the past decade, a flurry of research, development, and deployment has transformed SCM into a mature discipline in its own right.
Within that period, numerous books and thousands of articles have appeared on the topic, contributing to the rapid advancement of the field. However, two gaps in the literature still persist. First, activities within the realm of SCM are typically viewed as cost centers, whereby cost minimization remains the key focus of most SCM streamlining efforts. To compound the problem, the divide between the performance metrics typically used in the trenches (such as inventory turns, order fulfillment rates, and order turnaround times) and the financial indica-tors typically monitored by the upper management and the investors (such as economic profit, return on invested capital (ROIC), and return on net assets (RONA)) remains wide. This book adopts a value-based management (VBM) perspective, in which SCM’s key mission is value creation and capture. SCM solutions are developed and deployed to create value for everyone who comes into contact with a company’s products and services. In this setting, “value” could be created by sim-ply minimizing costs. On the other hand, there are situations in which

xii Preface
cost minimization simply destroys value for the stakeholders, neces-sitating alternative strategies. VBM therefore enables the adoption of a wider business perspective for SCM. Furthermore, such a perspective also allows us to map operational performance metrics to the finan-cial performance indicators in a straightforward fashion, enabling the evaluation of whether or not the proposed supply chain solutions are ultimately value enhancing or value destroying.
While necessary, value creation, however, is not sufficient for value capture. There are many examples in which an innovative design introduced by one company has been successfully commercialized by another, leaving the original inventor with little profits. This, in turn, brings us to the second gap in the literature based on the popular adage that “competition is no longer between companies but between sup-ply chains.” Implicit in this statement is the assumption that modern supply chains operate as a single well-coordinated entity, like a bas-ketball team, with a clearly defined command-and-control structures. This might have been true in the early 20th century where many industries exhibited full vertical integration. Today’s supply chains, however, are ecosystems, with no clear governance—or command-and-control structure, consisting of independent organizations. As these “economically rational agents” interact with each other, there might be serious misalignments within the ecosystem due to diverging local priorities, which might hinder the performance of the overall supply chain. In other words, having a star player in each position does not necessarily guarantee victory as a team. The performance of the Dream Team representing the United States at the 2006 World Basketball Championships in Japan is a relevant benchmark for modern SCM. In many industries ranging from personal computers to airlines, different supply chain members display widely different profitability levels. This book therefore adopts a decentralized view of the supply chain and puts an emphasis on economic mechanisms to promote coordination and collaboration within this ecosystem, so that the value created by the supply chain is captured in an equitable fashion by all its members. In other words, we would not only like our basketball team to win but also make sure that all the players are recognized—and rewarded—for their contribution to the team effort.
Finally, it is important to realize that the supply chain solution, which achieves the desired targets in value creation and value capture, is neces-sarily temporary. As products have expiration dates and as processes become obsolete, supply chain solutions also have limited shelf lives. Changes in competitive forces, in customer preferences, in technology,

Preface xiii
and even in legislature may render the existing supply chain solution inadequate. One must therefore keep an eye on these key drivers and not hesitate to go back to the drawing board when the existing supply chain solution can no longer support the changing business strategy. After all, supply chains deploy an organization’s go-to-market strategy. As that strategy evolves, the supply chain solution must evolve with it.
Another novelty embodied in this book is the framework through which the material is presented. This framework is summarized in Figure P.1. The horizontal axis represents the scope of the book. It starts with a vision: VBM, the challenge of providing value to anyone who comes in contact with a company’s products and services. This vision is operationalized through strategy formulation, which defines the com-pany’s business model, its affinity for product and process innovation, and its investment in developing and acquiring resources. The strategy is then deployed through key processes that are at the heart of supply chain management. These processes represent the concrete enablers of VBM. The focus is then on deployment with an explicit discussion of the technologies, structures, and skills required for the roll-out of effective supply chain solutions. The adoption of such a broad scope has a dual purpose. First, we wish to draw the attention of top decision-makers to the strategic role of SCM in value creation and capture, and put SCM on the CEO’s agenda. Conversely, we would like to broaden the
Vision Strategy Enablers
VBM InnovationResourcesPeople
Go to marketKey processesTechnology DeploymentPerformancemanagement
Better quality of life
Product and process innovation, product
Accelerate ideas to market,closed loop distribution
Multiple sourcing,Cross-functional developmentCentralized planning and scheduling
Context
Illustration
Technicalities
Figure P.1 Value-based SCM framework for Coloplast

xiv Preface
perspective of supply chain professionals by demonstrating explicitly the contributions they make to the firm’s overall strategy through the initiatives they undertake in designing, coordinating, and managing supply chains.
The vertical axis represents the scale of the book. It starts with the motivation by establishing the context of the problem to be addressed. An illustration in the form of a mini case study is then provided to render the discussion concrete. It is worth emphasizing that these illustrations will not come from frequently cited (and often abused) examples, but from companies such as ASML, Coloplast, CIBA Vision, PSA, PPR, Firmenich, Nissan, Syngenta, and Mattel, all best-in-class exam-ples deserving broader exposure. Finally, we not only present alternative solutions to the problem at hand but also provide the technical details through models that provide the basis of the proposed solution. Such an approach guarantees both the relevance of the topics addressed in this book and the rigor underlying the proposed supply chain solution. The wide range of models we will use throughout this book is listed in Figure P.2. While models are necessarily simplifications of reality that allow us to focus on the key parameters of the decision at hand, they have one big advantage: they enable clear articulation of all the assump-tions made in building the model. The discussion should then focus on the validation of those assumptions. Once this is done, models provide us with an objective platform for conducting our analysis. We have, however, paid particular attention so that the technical developments throughout the text do not distract attention from the main discussion.
Figure P.2 Modeling approaches used in the book
Model Application
Little’s Law Pipeline inventory
EOQ (Wilson) Batch sizing
Newsvendor Safety stocksSupply chain coordination/contracting
Base stock policies Cost-service trade-off
- Loss function Expected lost sales
Linear programming Supply chain configuration
Queueing Service systems, capacity management
Poisson process Failure events/rare events
Free cash flow Value definition and cascading

Preface xv
Hence, the reader can enter into the technicalities only when he/she feels necessary to do so.
Figure P.1 is an illustration from Coloplast, a Danish wound care company, whose vision is to be the preferred source of medical devices and associated services contributing to a better quality of life. Coloplast operationalizes this vision through innovation both in products (which provide improved functionality, hence higher comfort levels, to patients) and in processes (which develops not only efficient manufac-turing capabilities but also an agile supply chain for quick deliveries). To this end, processes have been put in place to accelerate new product development and market introduction as well as to have a balanced product distribution on a global scale. All of these processes are based on sound materials management principles.
Introduction in this book is meant to provide the reader with a sneak preview of the topics that will be further developed in the book. It describes the end-to-end supply chain design challenges in agri-business with the aim of painting the big picture before drilling down into its many fascinating facets.
Chapter 1 makes the case for supply chain management as an enabler to deploy and execute an organization’s go-to-market strategy. It also furnishes some of the working definitions.
Chapter 2 offers a concise definition of “value” from a financial per-spective. Operational drivers of “value” are then determined with the objective of identifying those SCM initiatives that contribute to the value creation challenge of an organization. Chapter 3 then focuses on value creation by emphasizing the product, process, and supply chain design in a concurrent fashion. In particular, we emphasize the tem-porary nature of competitive advantage and the resulting necessity of continuously developing new supply chain solutions in the face of a constantly evolving competitive landscape. Many value-creating initia-tives, however, entail a cost-service trade-off. To assess the magnitude of this trade-off, Chapter 4 introduces a materials management model. This model can be deployed not only to guide the positioning of a com-pany’s goods or services in the short run, but also to assess the impact of investments in new product, process, and supply chain design in the long run to mitigate the cost-service trade-off.
Chapter 5 focuses on value capture. In particular, it describes both short-term and long-term initiatives to encourage collaboration in a decentralized supply chain. SCM is an information-intensive discipline. Chapter 6 therefore summarizes the impact of information and com-munication technologies (ICTs) on SCM practices; it also highlights the

xvi Preface
enhancing role of emerging technologies in SCM. Just like products, services are also conceived, produced, and delivered through supply chains. There are nevertheless significant differences between product and service supply chains. These differences are discussed in Chapter 7 along with guidelines of coordinating the two types of ecosystems. Chapter 8 offers some concluding comments.
A television advertisement for UPS at the height of the dot-com boom clearly showed the importance of effective supply chain strategies. The advertisement starts with a group of young entrepreneurs sitting in front of a computer terminal and counting down for the launch of their new web-based business. Once they go live, they start waiting for customer orders. The first customer order, signaled with a “bing” on their com-puter, is greeted with a wild cheer by all the entrepreneurs. The cheers grow wilder as the second, the fifth, the tenth, and the fiftieth order trickles in. However, as the trickling soon turns into a shower of orders, which cross the threshold of the thousandth customer order, their cheer quickly turns into deep anxiety: how are they going to deliver all these orders? This book therefore adopts the perspective that SCM should be viewed as the effective deployment of value-based business strategies.
Changes in the second edition
Supply chain management is a dynamic field where we are faced with new challenges and opportunities every day. The additions to the sec-ond edition reflect some of the key developments that have taken place since 2007. In particular, I start the book with an end-to-end supply chain design scenario that provides the reader with an overview of the challenges that will be addressed in detail later in the book. I have updated our statistics. I also have a crisper discussion on the opera-tional drivers of value, one of the key pillars of our discussion. I have incorporated new topics such as risk management, contracting in the early stages of a product’s life cycle, and corporate social responsibility. I offer many new illustrations and examples that have been generated through repeated interactions with numerous supply chain profession-als. I would like to thank them for making me part of their supply chain journey. Let me conclude by thanking Ms. Liz Barlow, who rekindled this project.

1
Introduction: End-to-End Supply Chain Design
Before we dive into the detailed discussions of the key themes of the book, I provide below a complete end-to-end overview of the challenges associated with supply chain design and management with a concrete illustration from agri-business. We can then keep this big picture in mind as we analyze the different dimensions of SCM.
Nowhere is the need for effective supply chain design and manage-ment more crucial than in agriculture, to ensure efficient service to the consumer in the presence of shrinking resources. Even though food production has significantly grown over the past 50 years due to wider adoption of technology, 870 million people still suffer from hunger; even more are malnourished. With the global population projected to reach 9 billion by 2050, the United Nations estimates that the world will need 30% more fresh water, 50% more energy, and 70% more food. Only about 3% of the Earth’s water is fresh. While 70% of fresh water is consumed by agriculture, less than a third of the available quantity is economically accessible for human use in an environmentally responsi-ble way. Yet, water use has tripled over the past 50 years. Use of water to support agriculture is expected to grow further by around 11% globally.
Similarly, only 12% of the 13 billion hectares of total land is under farming. In the last 50 years, there has been a gradual expansion in agri-cultural areas; luckily, yield has increased at a much faster pace as farmers have adopted more technology. For example, in the 1980s, one hectare of arable land produced 2.3 tons of grain annually; today, it produces 3.4 tons.
Population growth coupled with greater economic prosperity in emerg-ing markets will continue driving future demand for food and feed pro-duction. Since 1980, demand for field crops has increased almost 90%, from 1.2 billion to almost 2.3 billion tons, with the increased demand

2 Competitive Supply Chains
for food and feed being the key driver. In addition, biofuels have increas-ingly played a role to meet our energy needs in ways that mitigate the growing problem of greenhouse emissions. Demand for grain is expected to increase approximately by 30% by 2025, representing an additional 600 million tons.
Agriculture must meet the rising demand for food, feed, and fuel while protecting the planet’s natural resources. In 2020, one hectare will be required to feed more than five people compared to 1960 when it only had to feed two people. Farmers will need to produce around 1.4% more grain every year, representing an increase of 70% by 2050.1
I.1 From farm to fork
There are eight major crops grown globally: corn, cereals, soybean, vege-tables, rice, diverse field crops, sugar cane, and specialty crops, which represent the majority of global food production and planted area worldwide. Figure I.1 reflects the resulting global market for seeds. Currently, we consume 2.3 billion tons of grain per year for food, feed, and fuel with four crops—corn and soybean (primarily for feed), and wheat and rice (primarily for food). Most grain is locally produced and consumed. Only a few countries, such as the United States, Brazil, and Argentina, have sufficient industrial-scale grain production to contribute significantly to global trade.
Around 22% of wheat and 38% of soybean are traded globally. Only 12% of corn, 8% of rice, 5% of sunflower, and less than 3% of vegetables are traded globally, with the rest being consumed locally. In sugar cane, the level of export of raw cane is minimal, but the exports of processed sugar account for 33% of total production. In an alarming concentra-tion of market power, the top 10 agri-business companies control 67% of the global proprietary (hybrid) seed market.
Let us focus on corn. SCM starts with the customer—in this case, the farmer. It is therefore necessary to first understand the key buying factors driving the farmer’s purchasing behavior. Some of the reasons why a farmer would be willing to buy corn seeds from Monsanto, Bayer, or Pioneer include production and yield characteristics, biologi-cal attributes such as disease or drought resistance, quality such as the size, shape, freshness, and integrity of the seed, availability or speed of delivery since the planting season has a short and uncertain window, and, naturally, price.
SCM must then focus on designing a high-performance network to create value by delivering on the farmer’s key buying factors in the most

3
Figu
re I
.1
Glo
bal
seed
s m
arke
t
EA
ME
22%
US
$9 b
illio
n20
11 g
lob
al s
eed
s m
arke
t by
reg
ion
US
$ bi
llion
s
NA
FTA
34%
US
$14
billi
on
LATA
M 1
5%U
S$6
bill
ion
APA
C 2
9%U
S$1
2 bi
llion

4 Competitive Supply Chains
efficient fashion. Matching supply with demand is particularly challeng-ing in seeds for various reasons. First and foremost, production lead times are long. In the northern hemisphere, the lead time for corn seed can be as long as 16 months! Second, the demand is not only uncertain but also highly seasonal. It is correlated across years. To make matters worse, the production lead times are significantly longer than the sales window, the planting season. Third, production yields are also highly uncertain. For instance, following the excruciating drought that struck the Midwestern region of the United States cutting the corn crop by 30% in 2012, the same region experienced 120% yield for two years in a row in 2013 and 2014. (Also note that when there is a shortage of corn, the price of corn goes up in the commodity markets, making it more attractive for the farmer, hence driving the demand up for corn seeds. On the other hand, a surplus in the market drives the corn prices down, making it unattractive for the farmer; the demand for corn seeds decreases immediately. This is another reason why matching supply with demand is virtually impossible.) Mid-season production is not an option in many regions. Nor is transshipping seeds from one hemi-sphere to the other economically viable. Finally, there is huge product proliferation as companies introduce 15 to 30 new varieties every year.
To guide the supply chain design process, the supply chain manager must also assess the cost of supply–demand mismatch. Overproduction leads to holding costs, including physical costs of storage and repack-aging as well as the opportunity cost of capital due to increased levels of inventory. Ultimately, as the germination rates of the corn seeds deteriorate across the years, write-offs lead to obsolescence costs. Underproduction is not pretty either, leading immediately to lost sales. What is even more difficult to assess is the loss of goodwill: will the farmer who defected to the competition due to a stockout return the following year? Did the firm lose his entire business, that is, did it lose sales not only of seeds but also of chemicals for crop protection, ferti-lizer, and support services? Figure I.2 shows the inventory burden of Syngenta as well as the cost of write-offs for obsolete inventory over the past decade. To effectively manage such risks, a firm must have three key capabilities: innovation through research and development (R&D), effective field production, and efficient SCM.
I.1.1 Research and development (R&D)
It is quite common for agri-business companies to invest around 10% of their revenues in R&D in an effort to discover new hybrid seeds with superior biological properties such as enhanced resistance to disease

Introduction 5
and higher yields. This discovery process is a highly complex combina-torial challenge relying on cross-pollinating different varieties seeking specific traits. Cross-pollination occurs when the pollen from one plant lands on the silks of another plant. Given the combinatorial nature of the process, it is natural for these organizations to maintain “libraries” of hundreds of thousands of potential hybrids, leading to millions of promising combinations. Extensive field testing over a 10-year horizon will then uncover tens of hybrids with the desired traits that can be reli-ably produced in different geographies. These are the varieties that are ultimately launched into the market. This long, expensive, and rigorous process is summarized in Figure I.3.
I.1.2 Field production
Field production is not for the faint-hearted. As reflected in Figure I.4, the process starts in December with sales planning whereby demand for corn seed must be forecast 16 months out! Such long-term sales projections are unfortunately notoriously unreliable. A forecast accu-racy of 60% is considered phenomenal! Once the Sales and Operations Planning (S&OP) process converges to a given number, the next challenge is sourcing. None of the seed companies own any significant amount of land for growing (“multiplying”) seeds; the limited land holdings are typically used for R&D purposes or for growing parent seeds. As a con-sequence, the seed company needs to identify and contract “capable farmers” who would be willing to grow corn on its behalf. A capable farmer is one with rich land and the willingness to adopt the seed company’s ways of working. Unfortunately, capable farmers are like
Figure I.2 Demand–supply mismatch costs
0.000
0.050
0.100
0.150
0.200
0.250
0.300
0.350
0.400
2003 2004 2005 2006 2007 2008 2009 2010 2011 2012 2013 2014
INV/SALES OFF/INV

6
Figu
re I
.3
Th
e R
&D
cyc
le
Dis
cove
ry a
nd
dev
elo
pm
ent
of
a b
iote
ch c
rop
pro
du
ct
Res
earc
h
Co
st (
US
$ m
)18
Ear
lydi
scov
ery
Late
disc
over
yC
onst
ruct
optim
izat
ion
Com
mer
cial
even
t pro
duct
ion
and
sele
ctio
n
Intr
ogre
ssio
nbr
eedi
ng &
wid
ear
ea te
stin
gR
egul
ator
ysc
ienc
e
Reg
istr
atio
nan
d re
gula
tory
affa
irs
1,63
86,
204
38 26
* E
stim
ate
excl
udes
cos
t of f
ailu
res
Not
e: ti
me
take
n is
not
con
secu
tive,
man
y ac
tiviti
es c
an o
verla
pS
ourc
e: P
hilip
s M
cDou
gall
for
Cro
pLife
Inte
rnat
iona
l
13 302
4,00
5
17 21
28 135
511
18 33
14 2,85
31,
302
24 34
28 4 2 40 42
18 2 1 51 47
17 1 1 44 66
US
$136
m*
13 y
ears
Dur
atio
n(m
onth
s)P
re-2
002
2011
Uni
ts e
valu
ated
Pre
-200
220
08–2
012
Dev
elop
men
tR
egul
ator
y au
thor
izat
ion
Tota
l

Introduction 7
franchise basketball players who can play in any team. In other words, while such farmers are extremely strategic for the seed company, none of them would be willing to enter into a long-term contract with the company. The real challenge is therefore to enlist a sufficient number of the capable farmers by March to ensure adequate supply.
Once the capable farmers are contracted, a complex planning process is launched to assign varieties to fields, harvested corn to seed- processing sites, and final products to channels. As illustrated in Figure I.5, this is another combinatorial problem. In a typical season, the combination of 33 varieties, 22 fields, 20 processing sites, and 16 channels lead to some 232,320 possible production, processing, and distribution plans. The good news is that optimization approaches are readily accessible to generate good, if not optimal, production and distribution plans.
In April, once a good plan is constructed, agronomists take over. Parent seeds are shipped in April; they are planted in carefully con-trolled patterns; plant growth is carefully monitored. This is also an extremely labor-intensive process as corn stalks need to be detassled—typically manually—several weeks into the growing period to ensure genetic purity of the hybrid seed variety. Then Mother Nature takes
Figure I.4 Field production in the northern hemisphere
DEC JAN FEB MAR APR MAY JUN JUL AUG SEP OCT NOV DEC JAN FEB MAR APR MAY JUN
Salesprojections:Sales planning
Contractingseed growers
Shipment ofparent seedsto contractedgrowers
Growing seasonin northernhemisphere
Start of harvestingPossible winterproduction insouthern hemisphere
Start ofpost-harvestprocessing
Shipment ofcorn seedsto channeland farmers
PLANNING GROWING PROCESSING DISTRIBUTION
Figure I.5 Generation of a production, processing, and distribution plan
FIELD j PLANT k MARKET m
PRODUCT iDEMAND dim

8 Competitive Supply Chains
over with sufficient rain and plenty of sunshine to grow the corn until September when harvesting starts.
I.1.3 Supply chain management
Harvesting typically starts in September. Ears of corn, which contain a certain level of humidity to ensure freshness, are transported to the pro-cessing facilities. As illustrated in Figure I.6, yellow corn seeds of vari-ous sizes are obtained through husking, drying, shelling, and cleaning. A single seed variety can generate up to 30 different end products or stock keeping units (SKUs) as seeds may be treated with five different crop protection chemicals and packed into six different formats.
As the incoming harvest is being processed, sales forecasts trickle in. Early sales projections (typically in September or October) are highly unreliable. Sales projections are usually updated on a monthly basis. As the growing season approaches, these projections turn into (almost) firm commitments for specific SKUs (variety–treatment–pack combination). Evolution of the forecast volatility ahead of the shipments is shown in Figure I.7. While it may be possible to forecast the demand for a specific variety, forecast accuracy deteriorates dramatically at the SKU level. Shipments to the channel peak in February ahead of the planting season.
Figure I.6 Seed processing
Receive Extract Husk Dry Shell Clean Size
Sort 1 Sort 2 Priming Pellet &Coat
Treat Pack
Pack, store, shipSeeds processing (cont.) Seeds enhancement
Seeds processing
Store

Introduction 9
The channel returns bags of unsold seeds in July. The returned seeds are tested for quality (e.g., germination rates). If the desired qualities have been preserved, the seeds are put in inventory for sale the fol-lowing year. Transshipping corn seeds to the southern hemisphere is possible but extremely costly. As a result, such shipments occur under extraordinary circumstances such as severe shortage in a given market. It should therefore come as no surprise that only 12% of corn is traded globally. The seeds that fail the germination tests are destroyed in an environmentally responsible fashion as treated seeds are considered as chemical products.
With long production lead times, a short selling season, and wide product variety leading to highly unreliable forecasts, matching supply with demand is a herculean challenge. Even though big data and advanced analytics may improve forecasting, operational initiatives such as postponement or delayed customization are necessary for mitigating the demand-supply mismatch risk.
Figure I.7 Forecast volatility
forecast error Oct forecast error Decforecast error Nov
forecast error Jan forecast error Feb forecast error March

10 Competitive Supply Chains
Every year seed companies go through the planning steps that are summarized in Figure I.8 for every crop they have in their portfolio. In the remainder of the book, we will have a deep dive into these steps that constitute the backbone of supply chain design and management along with a discussion of the modeling and analysis tools that are found to be useful in taming the challenge of delighting the customer while mas-tering the cost to serve and a wealth of examples from other industries. These are the key enablers of value creation and value capture.
Figure I.8 Summary of key planning steps
I. Estimating demand—long-term forecasting
II. Reserving supply capacity: selecting capable growers—newsvendor with supply uncertainty
III. Allocating “production”— optimization
IV. Scheduling processing and distribution—optimization
V. Stress testing the plan—sensitivity analysis

11
1Working Definitions
1.1 Motivation
For nearly three centuries, manufacturing industries have been driving economic growth and rising living standards across the globe. As illus-trated in Figures 1.1 and 1.2, building a successful manufacturing sector is a prerequisite in national development as manufacturing makes significant contributions not only to individual countries by raising incomes and enabling the construction of modern infrastructure and housing, but also to the world economy by driving global trade, research and development (R&D), and productivity. According to a recent study by the McKinsey Global Institute,1 manufacturing generates 70% of exports and up to 90% of business spending in R&D. Manufacturing, however, is not monolithic as there are fundamental differences across industries. McKinsey segments manufacturing into five broad buckets based on their sources of competitive advantage and their requirements: the segment of global innovation for local markets, which includes chemi-cals, pharmaceuticals, transport equipment, machinery and appliances, accounts for 34% of the global manufacturing value added in 2010. Regional processing industries, which include food processing, rubber and plastics, fabricated metal products, and printing and publishing, contribute 28% of value added. Energy and resource-intensive commodi-ties, making up 22% of value added, include wood products, paper and pulp, basic metals, and mineral-based products. Global technology indus-tries such as computers and office machinery, semiconductors, medical, precision and optical devices depend on global R&D and production networks to contribute 9% to the global manufacturing value added. Finally, labor intensive tradables such as textile, apparel, furniture, and toys make up 7% of value added. The evolution of these manufacturing

12 Competitive Supply Chains
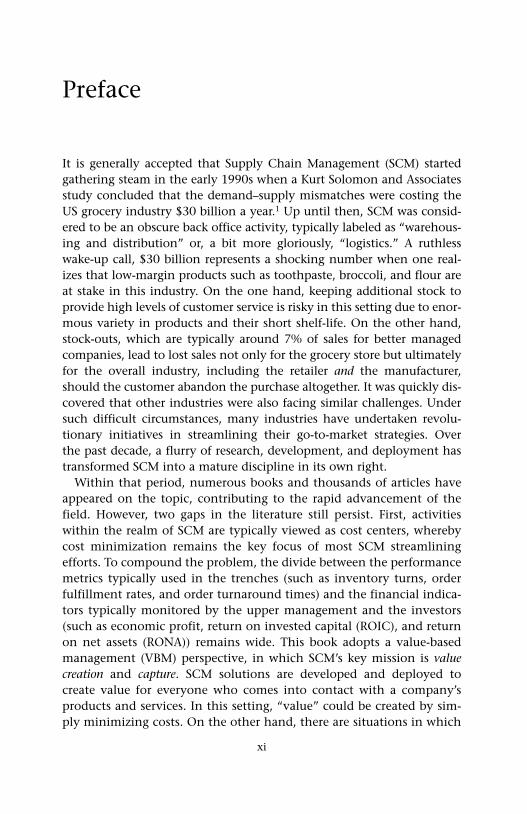
segments has resulted in some specialization across different types of economies, creating different centers of gravity (see Figures 1.3 and 1.4) and reshaping the material flows (see Figure 1.5) around the globe.
Supply chain management (SCM) therefore plays a significant role in maintaining this value-creating global ecosystem. In supporting such sustained economic activity, supply chain costs in developed economies are estimated to be around 10% of the gross domestic product (GDP), surpassing, for example, $1.3 trillion in the United States in 2009. In developing countries, on the other hand, supply chain costs may represent up to 30% of GDP. This is due to both the lower value-added products and services produced by these economies and the higher transaction costs engendered by poorer infrastructure in communication and transportation. Supply chain costs typically consist of:
• 58% for transportation,• 30% for inventory carrying,• 8% for warehousing, and• 4% for logistics administration.
Figure 1.1 Manufacturing as the locomotive of growthSource: “Manufacturing the future: The next era of global growth and innovation,” November 2012, McKinsey Global Institute, www.mckinsey.com/mgi. Copyright (c) McKinsey & Company. All rights reserved. Reprinted by permission.
Real value added in manufacturingConstant 2000 $ trillion
8
7
6
5
4
3
2
1
0
–11998 992000 01 02 03 04 05 06 07 08 09 2010
Low income
Middle income
High income
WorldCompound
annual growthrate 3%

Working Definitions 13
On the other hand, average selling price of a personal computer has been decreasing by 10–15% per year over the past decade. In the auto-motive industry, a 5% price reduction is not even negotiated between a manufacturer and its suppliers. With margins rapidly shrinking, there is growing pressure on supply chain managers to minimize procurement, production, and distribution costs. Such a focus on cost reduction in SCM has been typical in many industries facing global competition.
While one cannot (and should not) ignore costs, we believe that an exclusive focus on cost minimization is a myopic perspective, which may cause the organization to miss many promising opportunities. In
Figure 1.2 Top manufacturers around the globeSource: “Manufacturing the future: The next era of global growth and innovation,” November 2012, McKinsey Global Institute, www.mckinsey.com/mgi. Copyright (c) McKinsey & Company. All rights reserved. Reprinted by permission.

14
Figu
re 1
.3
Glo
bal
tech
nol
ogie
s an
d i
nn
ovat
ors
Sour
ce:
“Man
ufa
ctu
rin
g th
e fu
ture
: T
he
nex
t er
a of
glo
bal
grow
th a
nd
in
nov
atio
n,”
Nov
embe
r 20
12,
McK
inse
y G
loba
l In
stit
ute
, w
ww
.mck
inse
y.co
m/
mgi
. C
opyr
igh
t (c
) M
cKin
sey
& C
omp
any.
All
rig
hts
res
erve
d.
Rep
rin
ted
by
per
mis
sion
.
27
2
2
2
25
23
5
5
12Ja
pan
Sou
th K
orea
Taiw
an
Chi
na
Ger
man
yU
nite
d K
ingd
om
Sw
itzer
land
Italy
Bra
zil
NO
TE
: Cal
cula
tions
com
pile
d bo
ttom
up
from
all
two-
digi
t IS
IC m
anuf
actu
ring
indu
strie
s fr
om IH
S G
loba
l Ins
ight
, exc
ludi
ng(D
37)
Rec
yclin
g, a
s w
ell a
s 75
of t
he la
rges
t eco
nom
ies,
of w
hich
28
are
adva
nced
and
47
are
deve
lopi
ng.
SO
UR
CE
: IH
S G
loba
l Ins
ight
; McK
inse
y G
loba
l Ins
titut
e an
alys
is
Un
ited
Sta
tes
In t
he
glo
bal
tec
hn
olo
gie
s/in
nov
ato
rs g
rou
p, t
he
Un
ited
Sta
tes
lead
s in
valu
e ad
ded
, wit
h a
27%
sh
are
Glo
bal
mar
ket
shar
e o
f to
p t
en c
ou
ntr
ies
(bas
ed o
n g
ross
val
ue
add
ed),
2010
%

15
Figu
re 1
.4
Labo
r-in
ten
sive
tra
dab
les
Sour
ce:
“Man
ufa
ctu
rin
g th
e fu
ture
: T
he
nex
t er
a of
glo
bal
grow
th a
nd
in
nov
atio
n,”
Nov
embe
r 20
12,
McK
inse
y G
loba
l In
stit
ute
, w
ww
.mck
inse
y.co
m/
mgi
. C
opyr
igh
t (c
) M
cKin
sey
& C
omp
any.
All
rig
hts
res
erve
d.
Rep
rin
ted
by
per
mis
sion
.
11
4
7
223
36
5
22
4Ja
pan
Sou
th K
orea
Ch
ina
Ger
man
y
Uni
ted
Kin
gdom
Fran
ce Italy
Indi
a
Bra
zil
NO
TE
: Cal
cula
tions
com
pile
d bo
ttom
up
from
all
two-
digi
t IS
IC m
anuf
actu
ring
indu
strie
s fr
om IH
S G
loba
l Ins
ight
, exc
ludi
ng(D
37)
Rec
yclin
g, a
s w
ell a
s 75
of t
he la
rges
t eco
nom
ies,
of w
hich
28
are
adva
nced
and
47
are
deve
lopi
ng.
SO
UR
CE
: IH
S G
loba
l Ins
ight
; McK
inse
y G
loba
l Ins
titut
e an
alys
is
Uni
ted
Sta
tes
In t
he
lab
or-
inte
nsi
ve t
rad
able
s g
rou
p, C
hin
a le
ads
in v
alu
e ad
ded
,ac
cou
nti
ng
for
36%
Glo
bal
mar
ket
shar
e o
f to
p t
en c
ou
ntr
ies
(bas
ed o
n g
ross
val
ue
add
ed),
2010
%
16
Figu
re 1
.5
Glo
bal
trad
e ro
ute
s (1
990–
2010
)So
urce
: “M
anu
fact
uri
ng
the
futu
re:
Th
e n
ext
era
of g
loba
l gr
owth
an
d i
nn
ovat
ion
,” N
ovem
ber
2012
, M
cKin
sey
Glo
bal
Inst
itu
te,
ww
w.m
ckin
sey.
com
/m
gi.
Cop
yrig
ht
(c)
McK
inse
y &
Com
pan
y. A
ll r
igh
ts r
eser
ved
. R
epri
nte
d b
y p
erm
issi
on.
$50
billi
on–1
00 b
illio
n
In 1
990,
th
e U
nit
ed S
tate
s an
dW
este
rn E
uro
pe
wer
e th
e m
ain
hu
bs
for
trad
e fl
ow
s
By
2010
, tra
de
flo
ws
had
bec
om
e a
com
ple
x w
eb, w
ith
th
e ad
dit
ion
of
Asi
a an
d t
he
Mid
dle
Eas
t
Trad
e ro
ute
s h
ave
exp
and
ed, a
nd
tra
de
pat
tern
sh
ave
bec
om
e in
crea
sin
gly
co
mp
lex
Lin
es s
ho
w t
ota
l tra
de
flo
ws1
bet
wee
n r
egio
ns
$ b
illio
n
$100
bill
ion–
500
billi
on
$500
bill
ion
or m
ore

Working Definitions 17
this book, I have therefore chosen to emphasize the enabling role of supply chains in value creation and value capture. In fact, a recent survey of supply chain managers in France by the industry magazine L’Usine Nouvelle has revealed that the responsibilities of these professionals have a scope that largely surpasses cost minimization.2 In particular, supply chain professionals cite among their responsibilities sales fore-casting, quality management, strategy development, customer service, internal logistics, external logistics, and systems analysis. In the same survey, supply chain professionals reported that some of their current projects include reduction of product complexity, supply base manage-ment, agile manufacturing, production planning, distribution network design, cost analysis, introduction of Electronic Data Interchange (EDI) and Efficient Consumer Response (ECR), change management, and IT systems definition.
Both of these lists indicate that the impact of effective SCM is felt beyond mere cost minimization with strategic ramifications for both value creation and value capture through better customer service, reduc-tion of product complexity, and change management. Perhaps a better Profit and Loss (P&L) does indeed mean better production and logistics. We therefore adopt a value-based management perspective for SCM.
1.2 Working definitions
To discuss the role a supply chain plays in value creation and value capture, we first need to define these terms. Scholars in Strategy and Economics relate “value” to the customer’s willingness to pay (WTP), which reflects the benefits perceived by the customer. As illustrated with the “value stick” in Figure 1.6, WTP is the maximum amount that a customer would pay for a firm’s products or services; it is different from price. The value created by a product, a service, or a product–service bundle is then equal to the difference between the customer’s WTP for that offer and the landed cost of the offer. The landed cost includes both procurement costs and internal conversion costs, and the opportunity cost of not being able to undertake some other activity. This definition implicitly captures the fact that a firm can only create value by operating together with its suppliers and customers.
As stated above, the difference between WTP and cost is equal to the value created in a supply chain. While the difference between price and cost determines the margin earned by the firm, the difference between WTP and price (the value captured by the customer or the consumer sur-plus, as economists would refer to it) drives the sales volume. The product

18 Competitive Supply Chains
Buyers
Firm
WTP
COST
PRICE
Figure 1.6 Defining value as [willingness-to-pay – cost]
of margin and volume thus yields the profit, the value captured by the fi rm. Figure 1.7 reflects an interesting trade-off. Value created by a firm is an upper bound on the value it can capture. If the firm sets a higher price (increasing its margin), it may drive down the volume of sales. Alternatively, if the firm lowers its price (reducing its margin), it may increase its sales volume, achieving the same level of profitability. This is why management scholars3 advocate that a firm might adopt either a cost leadership position (low margin and high volume) or a differentia-tor (niche) position (high margin and low volume) to be profitable. One of the key challenges in SCM is to increase a customer’s WTP without increasing cost. This challenge of mitigating the cost-service trade-off is the main topic of Chapter 4.
Now that we have a conceptual definition of “value” that will be fur-ther refined and operationalized in Chapter 2, we turn to the definition
WTP
Value
Margin * Volume = Profit
Value capture
Cost
Price
Figure 1.7 The interaction between value creation and value capture

Working Definitions 19
of a supply chain. A supply chain is a network consisting of suppliers, manufacturers, distributors, retailers, and customers (Figure 1.8). The network supports three types of flows that require careful planning and close coordination:
(i) material fl ows, which represent physical product flows from sup-pliers to customers as well as the reverse flows for product returns, servicing, remanufacturing, and recycling;
(ii) information fl ows, which represent order transmission and order tracking, coordinating the physical flows; and
(iii) fi nancial fl ows, which represent credit terms, payment schedules, and consignment arrangements.
Note that all three flows are bi-directional. Traditionally, one used to think that goods and services would go from upstream suppliers to down-stream customers through a series of value-adding steps all the way to the final consumer. However, for manufactured products, the manufac-turers are now legally accountable for taking back their product at the end of the product’s life cycle and dispose of it in an environmentally
Figure 1.8 Working definition of a supply chain

20 Competitive Supply Chains
responsible fashion.4 We therefore talk about bi-directional or closed-loop supply chains. Similarly, information was thought to flow exclusively from the market to all the tiers upstream in a supply chain. Innovative organizations like UPS, Dell, or Amazon have shown the value of pro-viding the customer with real-time information about the status of their package or their order, respectively. In the seed business, which was discussed in the previous chapter, Syngenta would deploy a large number of sales representatives to communicate key characteristics of their offerings to the growers before generating orders. Finally, financial flows are no longer simply based on trade credit with, say, 30-day payment terms. Facilities ranging from consignment stocks to various risk-sharing arrangements have also made financial flows bi-directional.
The supply chain, a platform to coordinate these three flows, is supported by three key building blocks:
(a) processes, which encompass such value-adding activities as logistics, new product development, order fulfillment, and after-sales service;
(b) organizational structures, which encompass not only a range of rela-tionships from total vertical integration to networked companies, but also performance measurement and incentive schemes to make such relationships sustainable; and
(c) enabling technologies, which encompass both process and information technologies.
The above definition hides some important subtleties. First and fore-most, modern SCM has deeply benefited from a series of improvement initiatives. Over the past few decades, the waves of just-in-time (JIT), total quality management (TQM), and business process reengineering (BPR) produced a significant impact on the individual components of supply chains, eliminating non-value-adding activities, enhancing productivity, and streamlining workflows, ultimately enabling us to step out from our own organization or function and to focus on the interfaces among these individual stages of the chain. Second, advances in communication and computation technologies have made it pos-sible to collect, analyze, transmit, and deploy huge amounts of data necessary to run operations on a global scale. Finally, infrastructure investments along with developments in global transportation and logistics have greatly facilitated the movement of goods on a global scale (Figure 1.5).
One big challenge, however, remains. Industry structures, which used to be dominated by vertically integrated organizations, have largely

Working Definitions 21
disappeared, replaced by networked organizations or loosely coupled ecosystems. In the absence of a clear command-and-control structure, coordination among the members of a supply chain is not trivial, neces-sitating the implementation of explicit incentive schemes for aligning the divergent and often conflicting economic interests of its members. In other words, while the challenge of value creation is shared by the members of an ecosystem, value capture remains a contentious issue.
Supply chains perform two principal functions: the physical function of transformation, storage, and transportation as well as the market mediation function of matching demand and supply in a highly vola-tile and uncertain environment. While the physical function has been extensively studied within the Production Control and Inventory Management literature,5 innovative approaches have recently been emerging to the market mediation function. These approaches, which are classified in Figure 1.9, will be the focus of this book.
The key reason for our focus on market mediation is the drastic con-sequences of a potential demand–supply mismatch. In 1996, a retail study by the Voluntary Inter-industry Commerce Standards (VICS) Association found that stock-outs occurred at an average rate of 8.2%, corresponding to 6.5% of all retail sales.6 For a retailer, part of this stock-out situation (3.4% of the 6.5%) was offset by alternative sales at the store while the remainder (3.1% of the 6.5%) represented a lost sale. For manufacturers, the implications were even worse: out of the 6.5% of stock-outs, only 1.5% was recouped in alternative purchases from the same manufacturer.
On the other hand, holding inventory provides limited relief in spite of its high price tag. According to the US Department of Commerce,
MARKET MEDIATION
Supply Chain Design
Capacity Design
• Size
• Timing
• Type
• Location
Capability Design
• 3D-CE
• Risk management
• Ecosystem Innovation
Information Sharing
• POS data
• Joint forecasting
• Schedule sharing
Alignment
• VMI
• ECR
• Contracting
Agility
• Postponement
• ATO, MTO
Supply Chain Coordination
Figure 1.9 Matching demand and supply in a supply chain

22 Competitive Supply Chains
retail sales in the United States reached $3.2 trillion in 2000. To support this volume of sales, it was estimated that retailers held approximately $372 billion in inventory. Wholesalers held an additional $307 billion to supply the retailers, while the combined tiers of manufacturers held about $472 billion in inventory. Thus, it was estimated that total inventory across the value chain added up to around $1.1 trillion.
Market mediation has two key enablers. Supply chain coordination is concerned with the synchronization of the three types of flows over the network. Effective coordination strategies combine a range of approaches for enhancing supply chain transparency through informa-tion sharing (e.g., sharing point-of-sales (POS) data with the manufac-turer) and information deployment (e.g., vendor-managed inventories (VMI), ECR movement, and collaborative planning, forecasting, and replenishment (CPFR) initiatives) as well as for operational flexibility (e.g., assemble-to-order (ATO) and make-to-order (MTO) systems) to be able to capitalize on timely information. These approaches may facili-tate new forms of organizational structures (e.g., process orientation) and new forms of interorganizational collaboration (e.g., outsourcing via third-party service providers). Information and communication technologies facilitating closer collaboration and promoting supply chain transparency are crucial for effective coordination. Innovative product, process, and network designs are a prerequisite for operational flexibility.
Most of the innovative supply chain coordination practices (e.g., postponement) are indeed enabled by innovative product, process, and supply chain design. One of the most visible examples of innovative supply chain practices can be found at the Italian garment manufac-turer Benetton. Benetton has been one of the first manufacturers in the industry collecting POS data from key retail stores to determine product mix. More specifically, Benetton adjusted the assortment of colors to be produced by closely tracking retail sales. Such operational flexibility, in turn, was enabled through a product and process redesign, where sweat-ers were first knit in gray and then dyed to the desired color. Further volume flexibility was achieved by subcontracting the knitting opera-tions to a network of small textile labs.
Supply chain design, therefore, is concerned not only with the con-figuration of a network, namely, the specification of customer zones, selection of manufacturing and distribution facilities, and allocation of product families to these sites, but also with the prioritization of the capabilities to be developed and retained internally, and the forg-ing of new partnerships with other entities along a supply network.

Working Definitions 23
According to Fine,7 supply chain design ought to be thought of as “the capability to design and assemble assets, organizations, skill sets, and competencies for a series of competitive advantages, rather than a set of activities held together by low transaction costs.” This dynamic view is necessary in a fast-evolving world where new products and emerging distribution channels necessitate a continuous review of supply chain design decisions. Just like product design has an enormous impact on manufacturing performance, superior supply chain design offers significant payoffs in supply chain coordination.
In the next chapter, we will first introduce the value-based manage-ment framework that will help us not only to operationalize the con-cept of value but also to derive performance metrics and cascade them throughout the supply chain. We will then establish how the market mediation function of supply chains can help in value creation and value capture through design and coordination, respectively. In particular, we will discuss supply chain design for value creation while the focus of supply chain coordination will be on value capture.

24
2.1 The role of supply chain management
Value-based management (VBM) is playing an increasingly significant role in shaping corporate strategies. Since the key mission of supply chain management (SCM) is to develop and deploy effective solutions to enable the flawless execution of corporate strategies, SCM should also adopt a VBM perspective. VBM-based SCM has therefore two intertwined dimensions, as depicted in Figure 2.1. On the one hand, VBM should enable value creation through product and/or process innovation, both of which should drive a customer’s willingness to pay (WTP). While product innovation may enable the deployment of niche strategies, process innovation may lead to new business models.1 In both cases, however, innovation plays a key role in differentiating a firm from its competitors and/or in avoiding the commoditization of its products and services.
While value creation by a firm is necessary, it does not automatically ensure value capture by the same firm. For example, the Internet has undeniably created tremendous value for the business world. Researchers who conceived this global network, however, did cer-tainly not capture this value. Similarly, air travel provides a significant amount of value for business and leisure travelers. While aircraft manufacturers or airport operators may capture the lion’s share of value along with business travelers, airline companies in Europe are trying very hard to simply survive in the face of stiff competition from low-cost carriers. There are plenty of other examples where an inno-vation introduced by one firm has been turned into a runaway com-mercial success by another member of the network. VBM-based SCM should therefore also focus on value capture through a more effective
2Value-Based Management: The Guiding Principle for SCM

Value-Based Management 25
Figure 2.1 Value-based management as the guiding principle for SCM
Value-Based Management
Value Creation Value Capture
Product Innovation Customer Focus
Management of EcosystemValue Innovation
Process Innovation
management of the relationships with the partners within the firm’s ecosystem.
As we will discuss in greater detail in Chapter 3, value creation starts with three-dimensional concurrent engineering (3D-CE): the simul-taneous design of the product, the process, and the supply chain.2 Product design decisions are concerned with the adoption of an ade-quate architecture ranging from a fully modular to totally integrated designs. Process design, on the other hand, is concerned with the selection of resources that are either dedicated (favoring economies of scale) or flexible (favoring economies of scope). Finally, supply chain design not only considers the configuration of the supply network but also focuses on the key make-or-buy (outsourcing vs. insourcing) decisions.
Value capture, on the other hand, focuses on the coordination of the firms within the supply chain. This is an inherently difficult task as verti cally integrated industries with clear command-and-control struc-tures have been replaced by network structures where each echelon is owned and operated by an independent (and economically rational) firm. Alignment of independent players in such decentralized eco-systems is the main challenge in supply chain coordination, including the design and implementation of collaborative practices. In other words, incentives should be designed to enable value capture by a firm that is commensurate with the value it adds to the ecosystem. Put more plainly, the “most valuable player” award should not automatically go to the highest-scoring player; those who grab rebounds, force turnovers,

26 Competitive Supply Chains
and make incredible assists should also receive adequate recognition for their contributions to the team’s victory.
While we have identified value creation and value capture as the two principal missions of SCM, we have only defined “value” within the context of the “value stick,” which is an elegant model to identify the key buying factors of the customer and the key drivers of the cost to serve. For supply chain design and coordination, however, such a concept has to be operationalized in a way that maps the operational metrics under the daily control of a supply chain professional to the financial metrics monitored by higher levels of management. We pro-vide such a definition in the next section.
2.2 Operationalizing the definition of value
Businesses should have one paramount goal: the creation of shareholder value. Such a bold statement may, at first, appear to reflect a cold view of the world as seen from Wall Street. Some might argue that customers should always come first. Without customer satisfaction, a company may not survive. Others may advocate that without dedicated employ-ees, it is not even possible to bring goods and services to markets. What about the suppliers? The community? The environment? And, the shareholders? In fact, in its 1995 annual report, Coca Cola states that it “provides value to everyone who touches it.” Whether it is custom-ers who enjoy the soft drinks, employees who work in a stimulating environment, bottlers who enjoy attractive profit margins, youth teams they sponsor, or shareholders who are wealthier because of the com-pany’s strong financial performance, everyone is supposedly better off. How can one simultaneously satisfy all these stakeholders? Ultimately, one can delight customers by providing goods and services for free. One can make the employees happy through attractive pay packages and extremely flexible working conditions. Similarly, the suppliers or the channel members always welcome generous payment terms. Sponsorship of local activities is deeply appreciated by local communi-ties. These demands are diverging and often conflicting requirements on a company’s limited resources.
Yet, there needs to be a balanced approach to providing value. The concept of shareholder value provides this necessary balance. Shareholder value is not necessarily all about shareholders; it is simply a mathemati-cal construct that strives to establish a balance among all stakeholders. Let us first define concisely what we mean by “value” before discussing

Value-Based Management 27
whose value we are talking about. Consider the calculation of the free cash fl ow (or the residual cash flow) for a company:
SALES REVENUES– COST OF GOODS SOLD
– SELLING, GENERAL, and ADMINISTRATIVE (SG&A) EXPENSES
– DEPRECIATION
= EBIT (Earnings Before Interest and Tax)– TAXES on EBIT
= NOPAT (Net Operating Profit After Tax)+ DEPRECIATION
– CHANGES IN WORKING CAPITAL
– CAPITAL EXPENDITURES
= FREE CASH FLOW.
This calculation shows that once the company has satisfied its custom-ers and therefore generated revenues, it has to compensate its employ-ees and its suppliers. Depreciation is not a cash flow but a tax shield; we therefore subtract it first from the revenues to calculate the tax base. The company must then comply with its tax obligations. This gives us NOPAT (Net Operating Profit After Tax). As depreciation is simply a tax shield, it is added back to calculate the free cash flow after allow-ing for potential increases in the working capital and for other capital investments. Effective working capital management is necessary for orchestrating upstream suppliers and downstream customers through-out the operating cycle, while capital investments are necessary for ensuring sustainable competitive advantage. Once all of the strategic and tactical decisions are made, the free cash flow is what enables the firm to return cash to its shareholders in the form of dividends and/or share buybacks.
As Frank W. Abrams, the legendary chairman of Standard Oil of New Jersey, commented in 1944 on “stakeholder capitalism,” “the job of management is to maintain an equitable and working balance among the claims of the various directly affected interest groups, stockholders, employees, customers, and the public at large.”
Note that shareholders come last in this calculation, staking a claim to what is left on the table: free (or residual) cash flow. While there is a legal obligation toward employees, suppliers, channel partners, and

28 Competitive Supply Chains
creditors, there is no such contract with the shareholders. The latter invest in your company with the belief in your managerial capabilities and, thanks to them, the expectation of earning higher returns than in other investment opportunities. (The reality, however, is slightly differ-ent. When economists compare the returns of capital and labor, capital typically wins. In 2014, for example, S&P 500 payouts to shareholders increased by 15% while wages rose by just 1.7%. Since 2010, the trail-ing three-year average for shareholders is up 66% and workers 5.8%.3) Hence, as the residual claim, only shareholder value can reflect how well all the complex relationships within the ecosystem of a firm are man-aged simultaneously. Put another way, shareholder value is the only measure whose calculation requires complete information. By focusing on shareholder value, one can be sure to properly manage the diverse and often conflicting interests of the other stakeholders of the firm. From a technical perspective, shareholder view is equivalent to the max-imization of the residual cash flow in an optimization setting, which would dynamically strike a balance among its individual components. By managing for shareholder value, Coca Cola does indeed satisfy all of its key stakeholders, namely its customers, its employees, its suppliers, and, of course, its shareholders.
We can then define value as the present value of all the future free cash flows generated by a company discounted at the company’s opportunity cost of capital. Mathematically, it is captured as:
=0
=(1+ )
tt
t
FCFVALUE
OCC∑`
.
This is indeed the gauge market analysts use in evaluating publicly traded firms. Value-driven businesses have also adopted this model for capital investment appraisal (i.e., supply chain design) and performance measurement (i.e., incentive design for supply chain coordination).
While the maximization of shareholder value, the paramount goal of a firm, is intrinsically able to align the requirements of the various constituencies of a firm, we still need to operationalize this concept. In particular, we need a performance metric that would continuously monitor, encourage, and reward value creation. Finance professionals have been proposing various such metrics. We will, however, focus on an intuitive one: economic profi t.4 For a company to create value, it is necessary for that company to cover not only its operating expenses

Value-Based Management 29
but also its capital charges. In other words, a company has to generate economic profi t, which is defined as:
Assets Liabilities & owners’ equity
CASH SHORT-TERM DEBTRECEIVABLES SHORT-TERM NIBLINVENTORY LONG-TERM DEBTPRE-PAYMENTS OTHER LONG-TERM LIABILITIESFIXED ASSETS SHAREHOLDER EQUITY
NET SALES– OPERATING EXPENSES
= OPERATING PROFIT (EBIT)– TAXES on EBIT
= NOPAT (Net Operating Profit After Tax)– CAPITAL CHARGES (INVESTED CAPITAL * WACC)
= ECONOMIC PROFIT (ECONOMIC VALUE ADDED®),
where WACC is the weighted average cost of capital for the firm. Economic Profit (EP), also referred to as EVA®, forms the basis of VBM.
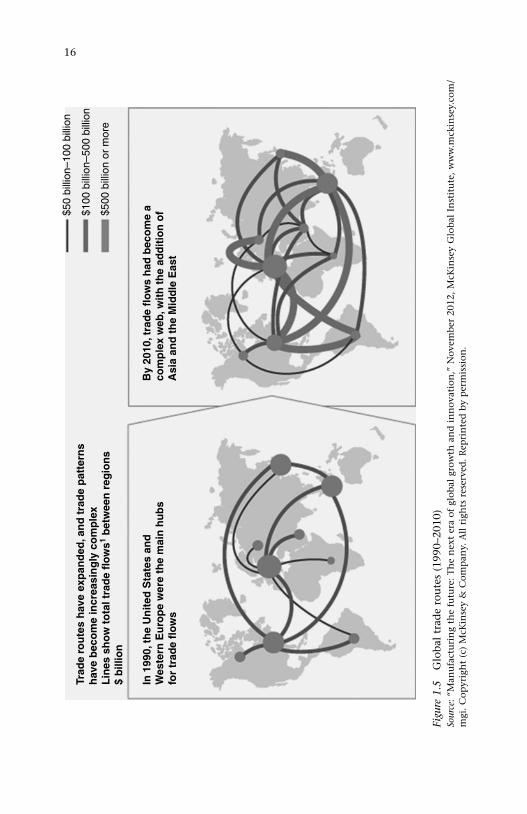
Note that EP is different from accounting profit. Accountants focus on NET INCOME (=EBIT – INTEREST – TAX), where interest expense is based solely on a firm’s debt. On the other hand, economic profit (EP = EBIT – TAXES – CAPITAL CHARGES = NOPAT – CAPITAL CHARGES) takes into consideration all capital employed in running the business. In that sense, it measures the effectiveness with which companies manage all the resources (human, intellectual, material, and financial) invested in them.
As it is defined, however, EP may not necessarily be within the line of sight of a supply chain professional. In other words, in her day-to-day decision-making responsibilities, a supply chain manager may not necessarily have a direct impact on EP. A supply chain manager should therefore focus on both strategic and operational drivers that directly influence EP. To this end, first note that, EP = NOPAT – Capital Charges, where NOPAT is reflected within the Profit and Loss (P&L) statement, whereas the Capital Charges are found in the Balance Sheet. Let us then consider a balance sheet in further detail:

30 Competitive Supply Chains
The balance sheet reflects what a firm owns (assets) and what it owes (liabilities), typically starting with the most liquid items (e.g., cash) and ending with least liquid ones (e.g., fixed assets). In other words, liabilities show the source of financing for the assets. We will convert this traditional balance sheet into a managerial balance sheet by netting the nonfinancial accounts labeled SHORT-TERM NIBL (non-interest-bearing liabilities) against short-term operating assets (RECEIVABLES + INVENTORIES + PRE-PAYMENTS). The left-hand side of this managerial balance sheet is referred to as “invested capital”; “ capital employed” appears on the right-hand side. This yields:
Invested capital Capital employed
CASH ST DEBTWCR LT DEBT
OTHER LT LIABILITIESFIXED ASSETS SHAREHOLDER EQUITY
Net assets (or capital employed) are investments for which the firm’s capital providers expect, and managers—including supply chain managers—must deliver a competitive return. For a supply chain man-ager, fixed assets typically represent strategic supply chain design decisions normally associated with network configuration. Recall that as long as the return generated from the use of “net” assets (the sum of cash, working capital requirements (WCR), and fixed assets) exceeds the cost of invested capital, EP is positive. We calculate the return on net assets—or return on capital employed (ROCE) —as follows:
RONA = NOPAT/(NET ASSETS) ⇔ ROCE = NOPAT/(CAPITAL EMPLOYED)
Since EP = [(ROCE – WACC) * Invested Capital], EP is positive when ROCE is greater than WACC, and when ROCE is less than WACC, EP is negative. This relationship immediately suggests a value-creating rule of thumb for the supply chain manager: invest only in value-creating projects, namely in those with a positive net present value (NPV), where NPV is the present value of all future free cash flows generated by the project and discounted at the firm’s WACC.
From an operational perspective, however, it is necessary to break these high-level financial metrics into their operational drivers and
Value-Based Management 31
cascade them throughout the organization. Figure 2.2 illustrates such a cascading exercise. ROCE, taken as a level-1 performance metric, can be written as the ratio of NOPAT and Capital Employed. By multiplying and dividing this ratio by sales, we obtain two key drivers of ROCE as level-2 metrics: Operating Margin (= NOPAT/Sales) and Capital Turnover (=Sales/Capital Employed). One can then continue this casca ding exercise by identifying the key drivers of Operating Margin (e.g., COGS, SG&A, etc.) and Capital Turnover (e.g., Working Capital Turnover, Days of Inventory, Days of Receivables, etc.).
First and foremost, such cascading of value drivers helps the adoption of a single and consistent definition of value throughout the company. Second, it solves the line of sight problem: as lower-level metrics are defined, supply chain professionals would recognize those value levers that are within their sphere of responsibility (hence, accountability). A procurement officer, for example, would readily recognize the impact of her decisions on COGS (through purchase price), on inventory, and on accounts payable in a contract she is negotiating with a supplier—hence, on the value creation challenge of her company. As such, she may choose to insist on just-in-time (JIT) deliveries and longer payment terms rather than deadlocking on purchase price.
Figure 2.3 shows the critical role of Capital Turnover in generating superior returns on Capital Employed. Such an exercise must also be done for a supply chain professional by first identifying the key value
Figure 2.2 Cascading EP across the organization
OperatingMargin
COGS %SG&A %Salaries %Etc…
Capital Turnover
Fixed asset turnoverWorking capital turnoverDays inventoryDays receivablesDays payables
Level 1
Level 2
Level 3
NOPATROCE =
Capital Employed
NOPAT Sales= ×
Sales Capital Employed

32 Competitive Supply Chains
drivers within her sphere of responsibility and by designing adequate performance measures that promote value-creating decisions. Figure 2.4 shows how some leading companies invest their capital. Dell compares quite favorably with both IBM and HP in terms of not only Net Fixed Assets (NFA), but also for its negative WCR. As a trading company, this chart also shows the effective SCM at Li & Fung.
To get another perspective on ROCE, let us revisit our managerial bal-ance sheet and consider the column of invested capital (or net assets). A supply chain manager does not (and should not) manage cash. This is the task of Corporate Treasury. A supply chain manager, however, should carefully manage the other two components of net assets, namely the WCR and the fixed assets.
While the fixed assets are impacted by the supply chain design deci-sions, WCR is directly concerned with supply chain coordination. To see the importance of managing WCR, consider the operating cycle of a firm, sometimes referred to as the cash-to-cash cycle, as illustrated in Figure 2.5.
For a typical manufacturing company, the operating cycle starts when the firm purchases materials, parts, and components. These materials
Figure 2.3 Creating value by higher capital turns
Capital Turns(Capital efficiency)
Operating Margin(Sales effectiveness)
8% 1.0
ROCE(Returns to Capital)
8%
1.
12%
Operating Margin(Sales effectiveness)
8%
Capital Turns(Capital efficiency)
ROCE(Returns to Capital)

Value-Based Management 33
are then transformed into finished products. We refer to the time it takes from the acquisition of input materials to the production of fin-ished goods as the manufacturing period. Products are then sold, which typically requires a sales period, which may include warehousing, trans-portation, and delivery. Since the product remains within the company as inventory until it is sold, the sum of the manufacturing period and
Figure 2.4 Deploying the invested capital
–100.0
–50.0
0.0
50.0
100.0
150.0
200.0
250.0
300.0
350.0
IBM
Dell
NFA Cash WCR
Hewlett Packard
Li & Fung
Figure 2.5 The operating cycle
CASH
PROCUREMENT
PRODUCTION
SALES

34 Competitive Supply Chains
sales period equals the inventory period. Customers, however, do not pay for the product immediately after delivery. The length of time for the firm to collect cash from customers after a sale has taken place is called the receivables period.
Within such an operating cycle, a firm must therefore invest in inven-tory and receivables. Moreover, the firm might have pre-paid expenses such as the rental of extra warehouse space as well as operating cash for day-to-day operations. The total investment necessary in an operating cycle therefore includes:
INVENTORIES + RECEIVABLES + PRE-PAID EXPENSES AND OTHER CURRENT ASSETS + OPERATING CASH.
The firm, however, is not the only entity that invests into an operat-ing cycle. Suppliers, employees, customers, and even the government contribute. WCR is therefore defined as the net investment a firm has to make in an operating cycle, namely:
WCR = (INVENTORIES + RECEIVABLES + OTHER CURRENT ASSETS + OPERATING CASH) – (ACCOUNTS PAYABLE + ACCRUED EXPENSES
+ ADVANCES FROM CUSTOMERS).
Accounts payable include the money you owe to your suppliers, repre-senting their investment into your operating cycle. Accrued expenses include salaries that are only paid at the end of the month—hence, the employees’ contribution—and the taxes that will be paid at their due date—hence, the government’s contribution to your operating cycle. If customers also prepay for their purchases, that money also reduces WCR for the firm.
To emphasize the importance of effective WCR management, consider Table 2.1. REL Consultancy (now the Hackett Group) estimates that, if the top 1,000 European corporations manage their WCR—that is, their relations with the customers and suppliers as well as their stocks—more efficiently, they may be able to generate 580 billion euros of cash. In fact, between 2001 and 2003, these corporations were able to reduce their WCR by 9%, which enabled a 6% reduction in their net debt.
The EP perspective therefore compels supply chain managers (in fact, all managers) to generate competitive returns on WCR, just as it does for cash and fixed assets. Table 2.2 summarizes the operational drivers that create EP, while Figure 2.6 depicts those EP drivers that are within a supply chain manager’s line of sight. From a strategic perspective, the

Value-Based Management 35
Table 2.1 WCR for 1,000 large European corporations
Country No of days for customer payments
D in one year
Stocks D in one year
No of days for paying suppliers
D in one year
WCR D in one year
B 47.1 –1.4 40.1 –5.4 43.7 2.3 43.4 –8.2DK 49.0 –2.4 39.1 8.7 30.2 –0.1 57.8 3.5F 68.6 0.4 35.5 –5.2 59.7 1.9 44.4 –6.0 – auto 60.0 –106 34.7 –6.2 59.0 1.9 35.6 –11D 73.1 1.6 38.2 –0.7 33.3 2.6 78.0 0.1 – auto 46.4 –3.5 36.7 –2.8 33.9 2.0 49.2 –6.5I 94.4 –3.7 43.2 6.9 69.0 –3.1 68.6 2.1 – auto 78.8 –5.8 40.6 5.9 63.6 –3.9 55.8 –0.1NL 42.5 –0.9 27.2 1.0 32.5 –0.7 37.2 0.3N 49.0 –4.2 22.1 –8.6 32.9 2.6 38.2 –12SE 64.8 5.7 27.0 –1.2 68.3 9.1 23.5 –9.7SW 67.3 –0.3 37.0 –1.8 33.1 0 71.1 –1.2 – auto 55.8 –1.6 34.1 –1.2 31.5 –1.9 58.4 –1.2CH 60.5 2.6 49.3 –0.6 29.6 6.7 74.2 –0.8UK 40.5 –0.4 30.9 –5.5 32.8 –0.6 38.5 –4.4Total Europe 59.9 –0.4 35.1 –2.6 41.7 1.1 53.3 –3.0 – auto 59.1 –1.9 34.2 –3.4 41.3 0.9 43.9 –5.5
Source: REL Consultancy Group (Le Figaro, September 19, 2004).
Table 2.2 Operational drivers of economic profit
Increase ROIC Cut costsImprove working capital efficiencyCut throughput timesTake pricing initiativesBetter scrutinize capital investment proposals
Decrease WACC Use debt optimallyBuyback sharesPromote transparency
Increase Invested Capital Undertake positive NPV investmentsAdopt profitable growth strategies
Decrease Invested Capital Sell assets that are worth more to othersRestructure unprofitable businesses
Extend the competitive advantage period through
Product innovationProcess innovationBrand equityIntellectual capital
supply chain manager should be responsible for customer service levels, which, in turn, are driven by product, process, and supply chain design choices. The choices made in configuring the supply chain will have a direct impact on fixed assets. The product and process design choices,

36 Competitive Supply Chains
in turn, will become constraints on operational drivers that will impact both expenses and working capital requirements.
In other words, Figure 2.6 depicts the operational drivers of economic profit, which promotes the generation of cash from operations that cover not only the operating expenses but also the financing charges. NOPAT can be enhanced by increasing revenues and reducing expenses; the operational drivers here typically represent strategic decisions on customer service as well as innovative product, process, and supply chain design initiatives to contain cost-to-serve. The capital charges, on the other hand, can be contained through effective working capital and fixed asset management; the operational drivers here represent tactical initiatives such as materials management, management of receivables and payables, and effective use of capacity.
2.3 Summary
It should come as no surprise that the share price of the Airbus Group, the parent of Airbus, sank by 26% in a single day after Airbus announced delays of up to two years in delivering the company’s newest jumbo jet, the A380. Such a delay caused by complications related to the wiring of A380 would limit deliveries to just seven airplanes in 2007 rather than 25, as was originally planned, pushing the breakeven point for the entire project beyond 2010. The Group further disclosed that the Airbus delays were likely to reduce the parent company’s operating
Figure 2.6 Economic profit in SCM
Equipment/facilities (leased)
Warehousing costs
Lot quantity costs
Information systems costs
Non cost of money components
Inventory
Accounts receivable
Customer service levels
Equipment/vehicles
Land/facilities (owned)
Transportation costs
Fixedassets
Workingcapital
+XCost ofcapital=Capital
charge
Expenses
Revenue
–Net operatingprofit after
–Economicprofit
Value-Based Management 37
profit by around 500 million euros per year between 2007 and 2010.5 Ultimately, A380 delays led to an executive shake-up at the company with the resignations of the co-CEO of EADS and the CEO of Airbus.6 In fact, in a large-scale study of 519 supply chain glitches announced by publicly held organizations between 1989 and 2000, Hendricks and Singhal found that the public announcement of an operational mishap led to an abnormal decrease of 10.3% in shareholder value.7
Supported by such strong empirical evidence, the linkage between a company’s supply chain performance and its ability to create share-holder value is succinctly captured by the EP framework. In this chapter, we have therefore focused on the following key points:
• “Shareholder value” is a framework to balance the (often diver-gent and conflicting) requirements of the stakeholders in a firm’s ecosystem.
• EP is an effective metric to monitor and promote the creation of shareholder value.
• EP represents a “line of sight” problem for supply chain managers.• Supply chain managers should therefore focus on the operational
drivers of EP to design a lean and agile supply chain.
38
3Value Creation: Dynamic Supply Chain Design
3.1 Motivation
Xerox spent most of the 1980s painfully regaining, inch by inch, the market share it had lost so dramatically to new entrants from its dominant position in the market in the 1970s. In Europe, for instance, Xerox’s market share tumbled from 18% in the early 1980s to 4% in 1986, stabilizing around 15% in 1989. Central to this comeback was an obsessive dedication to quality, and the introduction of just-in-time (JIT) manufacturing and distribution. In fact, Xerox spent the second half of the 1980s implementing the JIT philosophy in its European manufacturing operations. In this process, Xerox rationalized its supply base, reducing it from 5,000 suppliers to 300, enabled direct delivery into the production lines, and closed down all of its national ware-houses, centralizing the distribution activities through a European logistics center in Holland.1 As emphasized in Figure 3.1, this supply chain rationalization effort was accompanied by a reclassification of the product offerings, ranging from built-to-order high-end products to make-to-stock low-end products with different decoupling points.
While Xerox was redesigning its supply chain over a five-year period, a quiet technological revolution was changing the landscape in the copier industry with digital copiers replacing analog ones. This transformation had deep implications for Xerox’s supply chain solution: first, the core of its supply base had shifted toward suppliers of electronic components. Second, with the changing product characteristics, a different distribu-tion channel was emerging. Finally, as the digital copier was integrated into the local area network in an office, the customer was no longer an Maintenance, Repair and Operations (MRO) procurement officer, but an IT specialist. In short, a new supply chain solution had become necessary.

Value Creation 39
Figure 3.1 Xerox’s European distribution network in 1990s
Suppliers
JIT Transport
Manufacturing
European LogisticsCenter
JIT Transport
Installation
Customers Low-Volume
Copiers and
Systems
Mid-Range
Copiers and
Systems
High-End
Complex
Products
Delivered to Order
Configured to Order
Built to Order
Book publishing is another industry that has experienced a simi-lar transformation—though at a slower pace of change or clockspeed. Arguably, book publishing was initially a make-to-order (MTO) busi-ness, a king or a queen commissioning the writing of the book. An artist with excellent calligraphy skills would then complete and deliver the manuscript. A technological breakthrough, the invention of the print-ing press, along with the higher tolerance levels of the Renaissance, has led to the creation of a make-to-stock (MTS) industry spanning authors, publishing houses, printers, distributors, and corner book stores. Mega book stores reinforced the MTS practices. Another technological break-through, e-commerce powered by the Internet, has drastically altered the architecture of the print supply chain, rendering the retail outlet less significant. With the recent advances in hardware, including Amazon’s Kindle or Apple’s iPad coupled with powerful publishing software such

40 Competitive Supply Chains
as LaTeX, on-demand publishing will turn this industry into MTO once again. In fact, Amazon started contracting authors directly, eliminating publishers from the value chain.
Another colossal industry transformation is depicted in Figures 3.2 and 3.3, which are taken from a book by Andrew Grove, Intel’s cofounder and ex-chairman.2 Figure 3.2 depicts the vertically integrated industry structure and the integral product architecture in the computer
Figure 3.2 Vertical industry structure and integral product architecture in the computer industry, 1975–1985
IBM DEC Others
Microprocessors
Operating systems
Peripherals
Applications software
Network services
Assembled hardware
Figure 3.3 Vertical industry structure and integral product architecture in the computer industry, 1985–1995
Microprocessors
Operating systems
Peripherals
Applications software
Network services
Assembled hardware
Intel Moto AMD etc
Microsoft Apple Unix
HP Epson Seagate etc. etc
Microsoft Lotus Novell etc.
DEC HP IBM EDS etc.
etc.HP Compaq IBM Dell

Value Creation 41
industry from 1975 to 1985. This period was indeed the era of not only the mainframe computers manufactured by IBM, DEC, Burroughs, Univac, NEC among others, but also the closed and proprietary archi-tectures. In this environment, if a customer purchased an operating system from a particular manufacturer, he was obliged to procure all the hardware and software from the same manufacturer as interoperability was inexistent among these manufacturers. In other words, once you chose your camp, you were obliged to stay with it throughout the entire portfolio with no mix-and-match capability. The birth of the personal computer, however, has drastically modified this industry structure. IBM, which defined the industry in spite of its late entry, made two strategic choices. In 1980, it outsourced the manufacturing of the microprocessor to a young organization, Intel, and the writing of the operating system to another start-up, Microsoft. Moreover, to facili-tate coordination within these outsourced relationships, IBM deviated from its tradition of closed and proprietary architectures by adopting an open and modular product architecture for the PC.
As illustrated in Figure 3.3, these economically rational decisions had drastically altered the landscape in the computer industry over the subsequent decade: full vertical integration has been replaced by horizontal fragmentation with many organizations striving to dominate individual segments within the industry. Supply chain professionals would readily recognize that the supply chain solution that must be deployed to support a vertically integrated industry structure (Figure 3.2) is drastically different from the one needed to support a horizontally fragmented industry structure (Figure 3.3). The key question, however, is whether the supply chain professional’s job would be completed once we recognize this transformation in the industry structure and deploy the adequate supply chain solution for the horizontally fragmented indus-try structure. As we have seen in the previous two examples, industry structures do not remain frozen in a particular state, but evolve from one state to another according to their own clockspeed. This is exactly what we have been observing in the computer industry as well. Consider, for instance, the path taken by Intel. After establishing its dominance in the segment for microprocessors, Intel has widened its footprint by not only incorporating computation and graphics capabilities into its own products but also influencing the decisions of hardware design-ers and application developers on their product lines. Similarly, after dominating the operating system segment, Microsoft has forayed into various other segments ranging from databases to web browsers, from enterprise applications to office productivity tools. One may think that

42 Competitive Supply Chains
the industry is swinging back to its original vertically integrated structure with an integral product architecture—with a different set of players.
This is indeed the thesis of Charles Fine with his “double helix” model, illustrated in Figure 3.4,3 whereby various forces are driving the evolution of industry structure, rendering the existing supply chain solutions inadequate.
Consider, for example, IBM in the mid-1970s, whose products were designed following a closed and proprietary architecture within a ver-tically integrated industry. On the one hand, to maintain its leading position, IBM had to be at the forefront in all its offerings. On the other hand, due to its own organizational rigidities and high-dimensional complexity, the company was slow in responding to challenges by niche players, both increasing the pressure to disintegrate. Once the industry has crossed the threshold and swung to the other side of the double helix to become modular, horizontal, and fragmented, a fierce battle followed for the domination of each segment. Once a dominant player emerged in a particular segment, that player typically started exert-ing its influence in shaping other segments, as illustrated by Intel and Microsoft examples. This, in turn, built further pressure to integrate—perhaps around a different set of players.
The Enterprise Resource Planning (ERP) industry provides another example of the double helix. Once the client–server architecture became the accepted standard of computing, this industry’s ecosystem was based on a modular product and horizontally fragmented industry structure.
Figure 3.4 Fine’s double Helix model of industry evolution
Pressure to integrate
Modularproduct,horizontalindustry
Proprietary system profitability
Integralproduct, verticalindustry
Highdimensionalcomplexity
Niche competitors
Organizational rigidities
Pressure todisintegrate
Supplier market power
Technical advances

Value Creation 43
Software vendors such as SAP and Oracle focused on the transactional backbone, while specialty applications such as scheduling, supply chain management (SCM), and Customer Relationship Management (CRM) have been addressed by specialists such as i2 Technologies, Manugistics, and Siebel, respectively. Implementation was left to consultancies. This co-habitation, however, did not last long. As application vendors grew stronger, their footprints expanded from the transactional backbone into the areas of specialty applications and deployment. In the indus-try’s parlance, there was a transition from “best of breed” to “best of suite” with an integral product architecture, leading to the extinction of the specialty players. At this point, another technological develop-ment may reshape the industry again: Web Services and the Service Oriented Architecture (SOA) may provide sufficient impetus to return to the modular/horizontal setting under the platform leadership of SAP and Oracle. (This evolution is discussed in greater detail in Chapter 6.)
Similar transformations are observed in the pharmaceutical industry, where every stage of the pharmaceutical supply chain, research, devel-opment, clinical trials, manufacturing, distribution, and sales may now be outsourced to a specialty service provider. This phenomenon is discussed in further detail in Chapter 5.
What drives the pace of change—or the clockspeed—in an industry? Some drivers are quite obvious: competition, technology, and power structure in the channel. Others may be less so: organizational culture, government regulations, globalization, and economic conditions. More important, however, is the question of how one measures an industry’s clockspeed. Fine proposes three categories of clockspeed metrics: product-based (e.g., frequency with which new products are introduced), process-based (e.g., frequency with which process technologies get renewed), and and organization-based (e.g., frequency with which organizational initia-tives such as lean and six-sigma are launched). From that perspective, brewing would be considered as a slow clockspeed industry (on average, a new brewing process every 200 years), while airframe manufacturing for passenger aircraft would be a medium clockspeed industry (on aver-age, one new plane program every decade), personal computers and cell phones would be a fast clockspeed industry (on average, a new product every six to nine months). While this is not a concise measurement scheme, an empirical study4 within the electronics industry provides strategic support to the argument. Figure 3.5 shows the average time in months between product redesigns while the shaded areas represent the average duration of development projects in this industry in the early 1990s. Based on this product-based clockspeed metric, one can then classify the PC industry as a high clockspeed industry with an average of

44 Competitive Supply Chains
24 months for new product introductions (with an average of 12 months of development cycle). Medical systems, on the other hand, have a slower clockspeed with a new product introduced on average every 76 months (with a development cycle of 24 weeks). The same study shows that prod-uct life cycles are indeed getting shorter. Figure 3.6 illustrates the life cycle compression over 1988–1995 in all the segments of this industry.
3.2 Value creation through supply chain design
As a result of these industry dynamics, the discomforting news for the supply chain professional is that just like products and processes, supply chain solutions also have a limited shelf-life. Driven by their clockspeed, industries are in constant evolution, ultimately render-ing existing supply chain designs obsolete. Supply chain professionals should therefore monitor their industry clockspeed closely and be ready to generate alternative solutions as industry structures evolve. In other words, they should view supply chain design as a dynamic process.
This “race with no finish line” perspective is consistent with our ear-lier definition
( )=0= .
1+t
tt
FCFVALUEOCC
∞
∑
Figure 3.5 The rhythm of development activity in the electronics industry (Mendelson and Pillai 1999)
months0 1 2 3 4 5 6 7 8
PC
TV
Minicomputers
Measurement
PABX/Telcom
Industrial
Medical Controls
Systems

Value Creation 45
The challenge in value creation is to consistently generate free cash flow indefinitely into the future, which is only possible by regularly redesigning one’s business model, including the product, the process, and the supply chain. Supply chain design, defined by Fine as “the capability to design and assemble assets, organizations, skill sets, and competencies for a series of competitive advantages, rather than a set of activities held together by low transaction costs,” is the key enabler for value creation. This is depicted in Figure 3.7 where the impact of sup-ply chain drivers on free cash flow is shown within the Supply-chain Operational Reference-model (SCOR) framework.5
We will address supply chain design along two complementary dimensions, as reflected in Figure 3.8. Under the heading of capacity design, we will focus on the configuration of a supply chain network to offer differentiated supply chain solutions to various customer seg-ments. We will view this network design problem as the deployment of a portfolio of assets which differ in size, type, timing, and location. Our approach will be algorithmic. Under the heading of capability design, on the other hand, we will address more strategic issues of identifying
Figure 3.6 Product life cycle compression: 1988–1995 (Mendelson and Pillai 1999)
0
2
4
6
8
10
12
MedicalSystems
Measurement PABX/Telecom
IndustrialControl Systems
Mid-Range Computers
TV Sets PersonalComputers
1988 1991 1993 1995

46 Competitive Supply Chains
Figure 3.7 SCM drivers of value from a SCOR perspective
Deliver
EBIT (1 − Tax Rate)
+ DEPRECIATION AND AMORTIZATION
− CAPITAL EXPENDITURES
− CHANGES IN WCR
= FREE CASH FLOW
Make Source
Plan
Enable
Make
Source
Capacity Design Size Timing Type Location
Capability Design 3D-CE Risk management Ecosystem innovation
Supply Chain Design
Figure 3.8 Supply chain design
and managing potential risks and opportunities for value creation. In particular, we will discuss Fine’s three-dimensional concurrent engineer-ing (3D-CE) framework and risk management. We will also view the supply chain as a source of complementary innovations.
3.2.1 Capacity design
Capacity strategy is the long-term plan for developing resources. It involves decisions on sizing, timing, type, and location of real assets or resources. Structuring the portfolio of real assets is a key pillar of supply chain design.6
Supply chain design is risky as the associated investments are partially or completely irreversible. As the commitments span long planning horizons, there exists nonnegligible uncertainty over the future rewards from these investments. Fortunately, there is also some leeway about the timing or dynamics of the investments. Typically, a firm invests in mul-tiple types of resources with different financial and operating properties to mitigate the inherent risks.
As we view network design as structuring a portfolio of real assets, let us briefly discuss key characteristics of these assets. Sizing, deciding on

Value Creation 47
the nominal capacity of a facility, is a difficult decision as it requires the forecast of not only the demand several years into the future (a time horizon driven by the construction and commissioning lead times), but also the potential trends in demand. This is analogous to the problem of determining the adequate number of farmers to contract for multiplying seeds, as discussed in our opening chapter. A second input to the sizing decision is the entailed risk: if the facility’s capacity is unnecessarily large (or the realized demand is much smaller than what was originally anticipated), there is the opportunity cost of idle capacity. On the other hand, if the facility’s capacity is insufficient (or the realized demand is much bigger than what was originally anticipated), then there is the cost of lost demand. We will refer to the former outcome as the cost of overage and the latter outcome as the cost of underage, and analyze this decision problem within the newsvendor framework in Chapter 5.
The timing of capacity investment (green field or expansion) typically reflects an organization’s risk appetite. As we will see in Chapter 5, while the mitigation of the bullwhip phenomenon requires counter-cyclical investments, not many boards of directors would authorize significant capital investment under anaemic market conditions in anticipation of better days. Most would follow a demand-chasing or lagging capacity investment strategy. We should, however, emphasize two important points: first, timing decisions are also driven by macro-economic parameters such as interest rates, technological constraints such as discrete increments in a process technology, and the impact of irrevers-ibility. Second, new capacity investments should be considered only after the current assets are fully sweated through process improvements such as debottlenecking, tactical adjustments such as overtime or inven-tory build-up, and external capacity provisioning such as outsourcing or subcontracting.
With type, we differentiate between dedicated and flexible resources. While the former achieves economies of scale, the latter provides better hedging against inherent uncertainties. A dedicated facility for process-ing cranberries would indeed achieve the lowest cost of goods produced, but would also sit idle for nine months out of the year since it cannot be used to process any other (counter-seasonal) fruits. A flexible facility, on the other hand, may be able to shift production as market demand shifts. Note that product and process design should also contribute to flexibility. Modular design or part commonality are popular approaches to build flexibility into product designs. Postponement or late customi-zation are enablers of process flexibility. Consider a fluid milk-process-ing plant. After the milk, which has been collected from the farms, is

48 Competitive Supply Chains
tested for bacteria and antibiotics, it is immediately put in a centrifuge to be separated into raw skim milk and raw cream. With the resetting of a dial, it is then remixed into a wide variety of homogeneous end products, including skim milk, 2%, full fat, vitamin D, flavored, etc. As we will discuss shortly under the theme of capability building, this is the 3D-CE approach.
Location decisions are typically driven by demand and supply con-ditions. Most of the BRIC (Brazil, Russia, India, and China) countries require some local production and/or local content as a pre-condition to access local distribution channels. Similarly, availability of key resources such as skilled labor, technology, or rare materials may be the determining factor in the choice of the location.
All of these characteristics can be brought together in an optimization framework. This framework is a necessary, but not sufficient, first step in supply chain design. It is necessary as it provides a methodological way of evaluating the design alternatives. It is not sufficient as it fails to capture other strategic issues that will be addressed under the heading of capability building. As an illustrative example, consider the network configuration challenge depicted in Figure 1.5 of the opening chapter. With 33 varieties of corn, 22 potential growing locations, 20 processing plants, and 16 market channels, Pioneer has to identify the lowest-cost network from a list of 232,320 potential configurations. The good news is that it is possible to solve this problem and obtain robust solutions through linear programming and sensitivity analysis. Pioneer’s optimi-zation problem is shown in Figure 3.9, where the decision variable Xijkm represents the bushels of corn of variety i, grown in field j, processed at plant k for market m. The objective is to minimize the total cost of pro-duction, transportation, and processing under the constraints of market
Minimize
i j
subject to Total demand
Yield in the field
Processing capacity of the plant
∑
i∑
k∑
m∑
i∑
j∑
m∑
j∑∑
k∑
m
Cjk Ckm XijkmCij
Xijkm ≤ bij
Xijkm ≥ dim
Xijkm ≤ bk
∑
Figure 3.9 The LP formulation for network configuration

Value Creation 49
demand, crop yields in the fields, and the capacity of the processing sites. A problem of this size is easily solved by commercially available off-the-shelf software packages.7
3.2.2 Capability design
Capacity design is a necessary first step in supply chain design. This step must be complemented by capability design where strategic issues such as 3D-CE and risk management are taken into account. A broader perspective on the supply chain partners as sources of complementary innovations is also adopted in capability design.
Three-dimensional concurrent engineering (3D-CE) is a framework for dynamic supply chain design. As illustrated in Figure 3.10, 3D-CE encourages the concurrent design of products, processes, and sup-ply chains, and explicitly considers the interfaces among these three dimensions. The objective is to render the transition from the current—but obsolete—supply chain solution to the next supply chain design as smooth and painless as possible by taking the decisions on product, process, and supply chain design simultaneously.
In other words, 3D-CE encourages the simultaneous consideration of these interfaces. Such concurrent engineering is, in turn, enabled by the architecture of the products, processes, and supply chains. Products can be integral, embodying multiple functionalities (e.g., an aircraft wing), or modular (decomposable), enabling independent design, maintenance, diagnostics, and upgrading (e.g., a personal computer). Processes can be dedicated (e.g., catalytic crackers) or flexible (e.g., a job shop). Supply chains can be integral with tightly coupled processes (e.g., Smartville in Hambach, France, where all key automotive system suppliers for the Smart car are on the same campus with the final assembly line) or modu-lar with highly standardized interfaces (e.g., PC manufacturing with global sourcing and channel assembly). In the long run, these choices may support or hinder the dynamic evolution of supply chain designs, as one faces new competition, new technologies, or new legislation. Let us see how 3D-CE aims to achieve a smoother transition by considering the key interfaces.
Concurrent product/process design is now a well-accepted idea with a vast design-for-X literature, where X could stand for manufacturability, assembly, disassembly, or localization. Intel’s development of succes-sive generations of microprocessors (386, 486, Pentium, etc.) along with evolving photolithography technology (1 micron, 0.8 micron, 0.6 micron, etc.) is a classic example of concurrent product and pro-cess design. Intel launched its first product in the x86 generation, the

50 Competitive Supply Chains
Figure 3.10 Three-dimensional concurrent engineering (Fine 1999)
PRODUCT
Performancespecifications
PROCESS
Technology and process planning
SUPPLY CHAIN
Time, space, and availability
Recipe, unit process
Details, strategy
Manufacturing system,make/buyProduct
architecture, and make/buy
386 processor, on a proven 1-micron process technology. Once all the product glitches had been resolved, the next generation of the 386 processor was then launched on a new 0.8-micron process technol-ogy. Once the process technology was mastered, it was used as a basis to launch the new product, the 486 microprocessor. In this fashion, Intel was able to dynamically coordinate the improvements in both the product and the process designs.
A low-tech example of the product–process interface is captured in Table 3.1, which shows the product portfolio of leading mountain bike manufacturers.8 If these manufacturers compete on product variety, National should have a considerable advantage over Cannondale. However, the key question at the product–process interface is how this breadth of product portfolio is achieved. National certainly does not have the different frame geometries that Cannondale offers. Nor does it have the variety in materials adopted by Specialized. National achieves variety through colors per model. From a process design per-spective, this reliance on colors necessitates a relatively low investment in a scheduling algorithm for the painting process. For Cannondale, however, process design requires quick changeovers and consistently

Value Creation 51
high-quality welding for all frame geometries. In addition, if bicycles are offered in different materials such as steel, aluminum, and carbon fiber, separate processes need to be developed; as one cannot weld carbon, an injection molding process must be developed. This simple example thus illustrates the importance of making product and process decisions simultaneously.
The product–supply chain interface has recently been highlighted through the market mediation role of supply chains.9 Following Fisher’s classification, a “functional product” with a stable demand pattern but thin margins would necessitate a cost-efficient supply chain, while an “innovative product” with a highly volatile demand pattern, but attrac-tive margins, would require a responsive supply chain. Fast-moving consumer goods are a good example of functional products. For a bar of soap, a tube of toothpaste, or a razor blade, consumers’ WTP is typically driven by availability at stable prices. A bar of soap with moisturizing cream, a tube of toothpaste with tartar control, and a disposable razor with four blades, however, can be classified as innovative products. Similarly, fashion products, such as ski parkas or designer eyewear, are examples of innovative products. There is much uncertainty about cus-tomer acceptance and their WTP; however, if the product is a success, there are significant margins to be made. While cost reduction is the overriding concern in the former family of products, agility is vital for the latter. Key characteristics of these products are summarized in Table 3.2, while key channel characteristics are listed in Table 3.3.
While the product–supply chain interface is well understood in a static sense, mismatches creep up as markets evolve. Consider, for example, a manufacturer selling a commoditized product through a physically efficient supply chain. Suppose that the manufacturer no longer wishes to compete on cost and decides to seek ways for differen-tiating its product offering by incorporating several innovative features. While he hopes to afford higher margins through this repositioning, he is also faced with increased uncertainty associated with the market’s
Table 3.1 Product offerings of leading mountain bike manufacturers
Cannondale Specialized VooDoo National
End items 110 134 1726 6240Frame geometry 12 6 2 3Materials 1 6 3 2Components per Frame 2 1.4 48 6Colors per model 1.25 1.25 1 104

52 Competitive Supply Chains
Table 3.2 Characteristics of functional vs. innovative products
Functional product Innovative product
Demand Predictable VariableLife cycle > 2 years ¼–1 yearMargin 5–20% 20–60%Variety Low HighForecast error 10% 40–100%Stockout rate 1–2% 10–40%Average markdown 0% 10–25%
Table 3.3 Supply chain characteristics
Physically efficient Market responsive
Purpose Lowest cost AgilityManufacturing focus High utilization Excess capacityInventory strategy High turns Stock deploymentLead time focus Shorten as long as cost
does not increaseInvest to reduce lead time
Product design Max performance at minimum cost
Modular design
reaction to the new offering. In other words, the manufacturer has just transformed his product from a functional one into an innovative one. What we typically observe in practice is that such a product transfor-mation is rarely accompanied by a transformation in the supply chain. Frequently, companies try to push innovative products through supply chains designed for physical efficiency, incurring huge losses due to demand–supply mismatches.
The product–supply chain interface is concerned with outsourcing decisions. While such decisions are mostly based on an economic make-versus-buy analysis, one typically ignores their long-term ramifications. Outsourcing the production of an item typically entails the loss of the associated design and manufacturing capabilities. While the positive financial impact of buying an item at a cheaper rate than in-house manufacturing is felt immediately, the strategic trap, namely the loss of technological edge and/or manufacturing capability associated with that item, is only revealed at a much later stage when the firm tries to launch the next generation of the product only to find out that it no longer possesses some of the critical capabilities it needs in house.
In fact, Van Weele (2005) states that “outsourcing means that the company divests itself of the resources to fulfill a particular activity to

Value Creation 53
another company to focus more effectively on its own competence. The difference with subcontracting is the divestment of assets, infrastruc-ture, people, and competencies.”
To avoid such a trap, one should determine whether outsourcing deci-sions are driven by a shortage of manufacturing capacity or manufactur-ing capability. For example, it may be rational for a toy manufacturer to outsource the production of figurines associated with a movie that is currently breaking all records at the box office, while a machine tool manufacturer may wish to keep the production of a component in-house in order not to lose its own tight-tolerance machining capability even if cheaper external alternatives exist.
Outsourcing risks became evident in 2001 with the crash of the electron-ics market.10 Electronics Manufacturing Services (EMS) had experienced stellar growth in the late 1990s with massive outsourcing of production by traditional cell phone manufacturers such as Motorola, Ericsson, Nokia, and Siemens to EMS giants such as Solectron, SCI Sanmina, and Flextronics. Given that, with shelf lives of around six months, cell phones represented a high clockspeed industry, such outsourcing decisions were quite reasonable. The hiccup occurred when the original equipment manufacturers (OEM) thought that the forecasted downturn in this market would only affect their competitors with a limited impact on their own sales. OEMs had therefore told their contract manufacturers (CM) to continue buying the necessary components and manufacturing cell phones. When the market bottomed out in 2001 for all OEMs, there was $7 billion worth of inventory in that supply chain, corresponding to six months’ worth of sales. Such a surplus led to a long and unpleasant discussion on finding a solution to this demand–supply mismatch. CMs argued that, with a clearer picture of the marketplace due to their close relationship with the final customer, OEMs should have anticipated the downturn in the market and told them to slow down the procurement and production. OEMs, on the other hand, argued that the CMs should be in a better position to use the electronics components in stock given that CMs had a diversified customer base across the electronics industry ranging from PCs to medical devices. In an industry where inventory does not age gracefully, each party had to write off a sizeable chunk of the supply chain inventories. Ülkü et al. (2006)11 identify conditions under which an OEM with better market information or a CM with better pool-ing capabilities should indeed bear the demand–supply mismatch risk.
In addition to such coordination risks due to the lack of clear gov-ernance structures, there are also longer-term strategic risks. Access to latest technology is arguably at the top of the list of such strategic risks.

54 Competitive Supply Chains
Imagine, for example, the inability of Intel to introduce a new Pentium processor on the 0.13 micron technology, as ASML is slow in investing in the next generation of wafer steppers with higher photolithography capabilities. Similarly, imagine the inability of automobile manufactur-ers to launch a hybrid car as investment in hydrogen refueling stations is lagging behind. There is no point in building Ferraris if there are no highways to drive them. Such technology risks are analyzed by Ülkü et al. (2005)12 who also provide guidelines for designing appropriate incentives to mitigate such risks.
Potential risks in outsourcing can be further limited through judicious choices in product design. A modular architecture that enables plug and play capability also provides significant safeguards against outsourcing risks. In a fully decomposable product, individual components can be designed, maintained, and upgraded in isolation. Within this context, outsourced manufacturing of individual components presents limited risk. This, however, cannot be said for products with an integral architec-ture. Key trade-offs in organizational dependency and product decom-posability are summarized in Table 3.4.13 In the light of these trade-offs, a portfolio of buyer–supplier relationships should be developed.
While one cannot fully anticipate the path of the evolution in an industry or the emergence of disruptive technologies, explicitly moni-toring industry trends may provide valuable leading indicators. To this end, a three-dimensional supply chain mapping provides a coherent framework to monitor organizational dependencies. In this analysis, three maps of a business’s value chain are constructed as follows14:
1. Organizational Supply Chain: Taking either a product or a process view of your organization, enumerate first-tier suppliers who provide components or raw materials that your company uses to provide its products and services. Next, trace any connections that these suppli-ers may have with each other. Continue with the subsequent tiers.
2. Technology Supply Chain: This map is aimed at tracing the lines of dependency from your organization upstream and downstream to the suppliers and customers, respectively, who provide and use the technologies that lie out of your immediate site. Drawing a map of key technologies deployed in the company’s value chain helps you not only to visualize the connections between the technologies and your company’s capabilities but also to plan for alternatives if tech-nologies fail or become unavailable.
3. Business Capability Chain: Identify and map key business process capa-bilities along the chain. This is the most conceptually challenging map.

Value Creation 55
Table 3.4 The matrix of organizational dependency and product modularity
Dependent for knowledge and capacity
Dependent for capacity only
Item is modular(Decomposable)
A potential outsourcing trap
Your partners could supplant you. They have as much or more knowledge and can obtain the same elements you can.
Best outsourcing opportunity
You understand it, you can plug it into your process or product, and it probably can be obtained from several sources.It probably does not represent competitive advantage in and of itself. Buying it means you save attention to put into areas where you have competitive advantage.
Item is integral(Not decomposable)
Worst outsourcing situation
You do not understand what you are buying or how to integrate it.
The result could be failure since you will spend so much time on rework and rethinking.
Can live with outsourcing
You know how to integrate the item so you may retain competitive advantage even if others have access to the same item.
Figure 3.11 shows a high-level mapping for the PC industry. HP, which designs and sells PCs and servers as part of their complete IT solution offerings, purchases the microprocessors from the Intel Corporation. In turn, Intel procures the photolithography equipment from ASML. At the heart of these wafer steppers are high-precision lenses produced by Carl Zeiss. Hence, these four organizations are not only members in an organizational supply chain, but they also participate in a technology and capability ecosystem. These ecosystems are complicated further by two-way dependencies. For example, ASML is not only a key supplier to Intel, but it also relies on Intel chips for the computer control of the equipment they design and build.
Using these three maps, the following questions for each element of the chain would provide valuable insights:
1. What is the clockspeed of this chain element and the industry in which it is embedded?

56 Competitive Supply Chains
2. What factors (e.g., competition, technological innovation, regula-tions, etc.) are driving the clockspeed of this element?
3. What are the prospects for a change in clockspeed in this chain ele-ment as a result of expected changes in competitive intensity or in rates of innovation?
4. Where is the industry located on the double helix?5. What are the current power dynamics for this element in the chain?
Referring back to the mapping in Figure 3.11, one can obtain further insights on this ecosystem by considering the varying clockspeeds across this chain. For instance, HP introduces a new PC every six months and a new server every nine months. Moore’s Law, which asserts that the density (hence, the processing power) of a chip would double every 18 months, is pushing the physical limits of materials science, signaling a slowdown in the introduction of ever more powerful microprocessors. A new process technology in chip making might totally change the con-figuration of this industry. Further upstream, the rate at which ASML introduces more advanced equipment that can produce chips with finer line width, which is largely driven by the availability of higher-precision lenses, is definitely measured in years. On the other hand, the availability of a handful of photolithography equipment manufacturers and lens crafters should be a source of worry for all downstream consum-ers of these products.
An interesting complementary perspective on technology and busi-ness capability chains has recently been offered by Adner15 within
HP Intel ASML Carl Zeiss
Technology Supply Chain
Business Capability Chain
PCs and Servers
Microprocessors
Wafer Steppers
Precision Lenses
IT Solutions
Hardware Design
Equipment Design
Precision Optics
Organizational Supply Chain
Figure 3.11 Mapping for organizational, technology, and capability chains

Value Creation 57
the context of innovation in ecosystems. In addition to the familiar “initiative risk,” which reflects the likelihood of failing to reach the performance targets in internal projects undertaken by a company, Adner highlights two other complications in the supply chain: interde-pendence risks, the uncertainties of coordinating with complementary innovators; and integration risks, the uncertainties presented by the adoption process across the value chain. Suppose that, in Figure 3.11, HP wishes to develop a new server based on a newly designed Intel microprocessor. To be able to manufacture the processor, Intel would, in turn, depend on a new generation of photolithography equipment, developed by ASML, which would necessitate a sharper lens from Zeiss. Imagine that, based on the significant market potential, all four companies allocate significant resources to their individual projects, putting the likelihood of success for each stage at 90%. The likelihood that the new server would be successfully developed, however, is only (0.90*0.90*0.90*0.90 = 0.66) 66%. In addition, if at any one stage, further complications arise and reduce the chance of successful devel-opment of that stage, the likelihood that the overall system succeeds becomes drastically lower. For example, if ASML encounters complica-tions decreasing the likelihood of its success to 20%, the chances of success in developing the server sinks to 15%. As Adner emphasizes, rather than judging whether or not this is too low of a number, one must focus on recognizing the interdependence risk and setting the correct expectations.
While the interdependence risk is multiplicative, the integration risk is additive. If Zeiss takes two years to develop the sharper lens, while ASML, Intel, and HP have five, four, and three years of design cycles, respectively, it would then take, at least, 2 + 5 + 4 + 3 = 14 years to get the new server to the market. One should not forget that adoption is viable at each stage only if the total cost of integrating the innovative components is smaller than the potential benefits at every stage. Both Adner and Yoffie and Kwak16 suggest risk-mitigating strategies. Let us then focus on risk and opportunity management in further detail.
3.3 Managing supply chain risk
The key to value-based SCM is in making value-creating investments and in ensuring effective execution that harvests the cash flows from these investments. Cash flows can be disrupted by movements in external fac-tors such as exchange rates, commodity prices, natural disasters, poten-tially compromising the stability of plans and, in worst case scenarios,

58 Competitive Supply Chains
undermining the company’s ability to invest in otherwise good oppor-tunities. Risk management is therefore directed at providing increased stability of plans, increased fidelity to strategic budgets, and, in the pro-cess, at enabling a company to understand better the environment and markets within which it operates.17 As such, risk management should be considered as a double-sided pro-active initiative: on the one hand, it is aimed at identifying and mitigating potential sources of disruption. On the other hand, it should serve to identify and capitalize on potential opportunities as one scans the horizon.
There are several reasons why risk management should be one of the key pillars of value-based management for supply chains (Figure 3.12). First, modern supply chains span the globe, reflected by the components of the Dreamliner in Figure 3.13. As supply chains stretch over 40,000 kilometers with suppliers around the world, they become more complex and more vulnerable. Risk management has therefore become increas-ingly vital to mitigate the devastating disruptions caused by disasters. According to the Center for Research on the Epidemiology of Disasters18 (Figure 3.14), whether they are natural or man-made, disasters have increased both in number and in intensity over the past decades.
Figure 3.12 Value-based supply chain management
Key Performance Indicators (KPI’s)
Supply Chain Management
Intangibles
CredibilityConfidenceReputation
Consistency
Valuation Drivers
RevenueOperating Margins
Asset utilizationInventory turnover
Valuation Methods
FCFPrice to Sales Ratio
EVA/ROA
Value-Based Management
Efficiency Responsiveness Reliability

59
Movabletrailing edge(U.S., Canada,Australia)Wingtips
KAA (Korea)
Fixed & movableleading edgeSpirit (U.S.)
WingMitsubishi(Japan)
Centre fuselageAlenia (Italy)
Forward fuselageSpirit (U.S.)Kawasaki (Japan)Centre wing boxFuji (Japan)
Landing gear structureMessier-Dowty (France)
Lithium-ion batteriesGS Yuasa (Japan)
EnginenacellesGoodrich (U.S.)
EngineRolls-Royce (U.K.)GeneralElectric (U.S.)
Fixed trailing edgeKawasaki (Japan)
Main landing gearwheel well
Kawasaki (Japan)
Lithium-ion batteriesGS Yuasa (Japan)
Passengerentry doors
Latecoere (France)
OTHERS
Wing/body fairingBoeing (Canada)
Cargo access doorsSaab (Sweden)
787 Dreamliner Structure Supply Chain SuppliersSelected components and system suppliers
HorizontalstabilizerAlenia(Italy)
Rear fuselageBoeing (U.S.)
Wing-to-bodyfairingBoeing (U.S.)
Tail finBoeing(U.S.)
Part nameCompany (country)
Figure 3.13 Globalizing ecosystems
Figure 3.14 Distribution of disasters over time
3000Natural disasters Man-made disasters
2500
2000
1500
1000
500
0
3000
2500
2000
1500
1000
500
01940-1950-1960-1970-1980-1990-2000-1949 1959 1969 1979 1989 1999 2005
1940-1950-1960-1970-1980-1990-2000-1949 1959 1969 1979 1989 1999 2008

60 Competitive Supply Chains
Moreover, MunichRe, the world’s largest re-insurer, reports that the aver-age cost of these disasters has increased by a factor of ten since the 1960s.
Second, in an effort to boost financial performance (for instance, return on assets), many supply chain executives have undertaken ini-tiatives to increase revenue (by increasing product variety, accelerating new product introductions), to reduce cost (by adopting just-in-time inventory management), and to reduce assets (by outsourcing manu-facturing). While such efficiency-driven, lean perspectives make perfect sense in stable environments, they also render supply chains more prone to disruptions.
Third, a tragic fire at a garment factory and the spectacular collapse of a building housing many apparel workshops in Bangladesh have increased consumer awareness on responsible sourcing and sustainable supply chains. Consumer groups, including nongovernmental organizations, are putting extra pressure on supply chains for better corporate social respon-sibility. As shown in Figure 3.15, Fair Labor Association monitors the work-ing conditions at Foxconn, Apple’s manufacturing subcontractor, along a broad set of criteria ranging from health and safety to grievance systems. Trade coalitions such as the Sustainable Apparel Coalition,19 are aiming at creating “an apparel and footwear industry that produces no unnecessary environmental harm and has a positive impact on the people and com-munities associated with its activities.” Web sites like the Good Guide20 promote “safe, healthy, green, and ethical” fast-moving consumer goods.
In spite of these compelling arguments, most companies invest lit-tle time and effort in managing supply chain risks even though they conduct risk assessment exercises. According to a study by Computer Sciences Corporation,21 43% of 142 companies surveyed across a broad spectrum of industries reported that their supply chains are vulnerable to disruptions; yet, 55% of these organizations have no documented con-tingency plans. Similarly, in another study conducted by CFO research services, 38% of the 247 companies surveyed acknowledged that they have too much unmanaged supply chain risk.22 Tang (2006) explains this “apprehension without action” by the fact that “with inaccurate estimates of the probability that a major disruption would occur, many firms find it difficult to perform cost/benefit or return on investment analysis to justify certain risk reduction programs of contingency plans.” This phenomenon is particularly pervasive when “nobody gets credit for fixing problems that never happened.” Tang therefore argues that robust strategies should have a dual purpose: helping a firm to reduce cost and/or improve customer satisfaction under normal circumstances while ena-bling it to sustain operations during and after a disruption.

61
Impr
ovin
g W
orki
ng C
ondi
tions
at F
oxco
nnT
he F
air
Labo
r A
ssoc
iatio
n as
sess
es a
nd m
onito
rs la
bor
prac
tices
at m
anuf
actu
ring
plan
ts a
nd r
ecom
men
ds im
prov
emen
ts. A
fter
App
le jo
ined
in
Janu
ary,
the
F.L.
A. i
nspe
cted
thre
e hu
ge F
oxco
nn fa
ctor
ies
in C
hina
that
mak
e iP
ods,
iPho
nes,
and
oth
er d
evic
es. I
nspe
ctor
s id
entif
ied
360
spec
ific
rem
edia
tions
to a
ddre
ss a
hos
t of i
ssue
s. In
an
Aug
ust r
epor
t, th
e F.
L.A
sai
d F
oxco
nn h
ad c
arrie
d ou
t 284
of t
hose
impr
ovem
ents
. Rel
ated
Art
icle
»
24 o
f the
sere
com
men
datio
ns fo
cus
on e
mpl
oyee
s do
ing
wor
kth
ey’re
not
pai
d fo
r.
Hea
lth
and
saf
ety
Env
iro
nm
enta
lp
rote
ctio
nC
om
pen
sati
on
Ho
urs
of
wo
rkR
ecru
itm
ent,
hir
ing
an
dp
erso
nn
eld
evel
op
men
t
Ind
ust
rial
rela
tio
ns
Gri
evan
cesy
stem
Wo
rkp
lace
con
du
ct a
nd
dis
cip
line
Term
inat
ion
and
retr
ench
men
t
VE
RIF
IED
FU
TU
RE
DE
AD
LIN
E
Ear
lier
this
yea
r, F
oxco
nn a
nnou
nced
that
by
next
sum
mer
no
empl
oyee
wou
ld b
e al
low
ed to
wor
k m
ore
than
an
aver
age
of 4
9 ho
urs
a w
eek.
Pre
viou
sly
som
e em
ploy
ees
wor
ked
sche
dule
sth
at a
ppro
ache
d 10
0 ho
urs
a w
eek.
Man
y F
oxco
nn w
orke
rsw
ere
unaw
are
that
they
wer
e re
pres
ente
d by
aun
ion,
and
uni
onco
mm
ittee
s w
ere
ofte
nst
affe
d by
fact
ory
man
ager
s.
Wor
kers
’ nam
es a
ndtim
e sp
ent i
n th
e to
ilet
wer
e po
sted
in p
ublic
.A
lso,
nam
es o
fdi
scip
lined
wor
kers
wer
e po
sted
.
Sev
en o
f the
se r
ecom
men
ded
chan
ges
call
for
16-
to 1
7-ye
ar-o
ld
wor
kers
to b
e re
loca
ted
to lo
wer
-ris
k jo
bs a
nd n
ot w
ork
at n
ight
,
rela
ted
trai
ning
of m
anag
ers
and
cont
inue
d m
onito
ring.
Ano
ther
15
rela
te to
cha
ngin
g fir
e al
arm
but
tons
that
are
not
in th
e lo
cal
lang
uage
.
FO
XC
ON
N F
AC
TOR
Y IM
PR
OV
EM
EN
TS
The
sta
tus
of 3
60 s
peci
fic r
emed
iatio
ns r
egar
ding
wor
king
con
ditio
ns
at th
ree
Fox
conn
fact
orie
s th
at s
uppl
y A
pple
, as
of J
une
30.
Pub
lishe
d D
ecem
ber
26, 2
012
161
TOTA
L36
3530
3022
2115
10
Figu
re 3
.15
Mon
itor
ing
corp
orat
e so
cial
res
pon
sibi
lity

62 Competitive Supply Chains
Risk analysis can be conducted at various levels of granularity: an entire economy, an industry, an entire supply chain, or a company. Strikes at key ports, disruptions in freight traffic, or agricultural com-modity price swings due to ethanol content requirements are examples of macro drivers of supply chain vulnerabilities. A better understand-ing of these vulnerabilities on the national economy should result in better-informed decisions by policy makers in making the necessary investments in mitigation policies.
Shortages of key commodities, loss of key skills, and disruptive tech-nological developments like e-books are drivers of vulnerabilities at the industry level. Swatch is not only the world’s largest watchmaker, but it also produces more than half of the watch movements made in Switzerland and sells them to makers of some of the world’s most expensive timepieces. That is why a December 2013 fire at one of the watchmaker’s workshops created delays in the production of some watch components for as long as two months disrupting not only its own pro-duction but also that of many players in the Swiss watch industry.
Hendricks and Singhal (2005) empirically show that disruptions have different financial implications for different industries. Supplier insol-vency, faulty subsystems that ground a particular passenger aircraft model, and regulations authorizing deliveries in city centers only to zero-emission vehicles represent vulnerabilities at the supply chain level. At the company level, vulnerability analysis typically leads to business con-tinuity plans (BCP)s. Our risk management discussion will be anchored at the company level. Inside the organization, however, the over-arching risk management approaches have to be cascaded throughout the organi-zation and customized to the requirements of individual functions (R&D, procurement, manufacturing, warehousing) in a consistent fashion.
Before discussing the risk management framework shown in Figure 3.16, we will define “risk” more concisely as the combination of the probability or likelihood of an event occurring and its impact or con-sequences for an individual organization. In fact, risk encompasses any potential source that generates a negative impact on the flow of infor-mation, goods, and cash in one’s operations. Financial and operational risks are therefore not mutually exclusive. The natural starting point of any risk management initiative is the articulation of a crisp risk strategy and appetite. Firms in the oil and gas, pharmaceutical, or airline indus-tries would logically have a different risk appetite than those in office cleaning services. However, for most organizations formulating a risk strategy and creating a governance structure does not come naturally. Harrington and Niehaus (2003) report the risk management journey

63
Ris
k S
trat
egy
and
Ap
pet
ite
Ris
k M
on
ito
rin
g
Ris
kM
anag
emen
t
1
2
3
4
5
Ris
k Tr
eatm
ent
Ris
k Id
enti
fica
tio
n
Ris
k A
sses
smen
t
Str
ateg
y an
d po
licie
s
Esc
alat
ion
and
thre
shol
ds
Cre
atin
g sc
enar
ios
Und
erst
andi
ng T
rigge
rs
Cap
turin
g th
e C
onse
quen
ce
Qua
litat
ive
(indi
cato
rs)
Qua
ntita
tive
(fin
anci
al im
pact
)
Ris
k C
ontr
ols
Tole
ranc
e bo
unda
ryR
isk
Trea
tmen
t
Ris
kA
sses
smen
t
Ris
kM
onito
ring
Ris
kId
entif
icat
ion
Ris
kS
trat
egy
and
App
etiteR
isk
Mgt
org
aniz
atio
n &
pro
cess
esM
easu
ring
curr
ent r
isk
stat
us
Act
ion
to:
Term
inat
e
Tole
rate
Miti
gate
Tran
sferTr
acki
ng in
cide
nts
and
near
mis
ses
2 3
4
5
1
Figu
re 3
.16
Ris
k m
anag
emen
t fr
amew
ork
64 Competitive Supply Chains
undertaken by a Canadian grain trader where the wake-up call came with the refusal of the financial institutions to extend the credit the firm needed to deploy its differentiation strategy of becoming a trusted advisor to the grain farmers in Western Canada. In fact, compliance requirements have been the main trigger in this domain. For instance, the Sarbanes-Oxley Act of 2002 requires US companies to inform their shareholders of their risk profile and their approach to managing risk.
In an effort to discover vulnerabilities, the second step involves the identification of the potential threats facing a business. Risk identifica-tion necessitates understanding triggers of disruptive events, creating scenarios through extensive brainstorming, and capturing the conse-quences. For the Canadian grain trader, the list of potential sources of disruption was long and broad, and included events such as dis-ease spoilage, product performance, weather, separatist movements, transport strikes, environmental liabilities, commodity prices, etc. Unfortunately, organizations do not have the resources to address all of the sources of disruptions that were identified in the risk identification exercise; some prioritization scheme is necessary. This is done in risk assessment by estimating both the quantitative and qualitative impact of a disruptive event. The grain trader used the earnings at risk (EaR) metric in this assessment. Note that EaR bounds the likelihood that the loss triggered by a disruptive event would exceed a given financial threshold. The ultimate goal of this assessment is to position all the identified disruptive events on a risk matrix along the dimensions of likelihood (e.g., once a day, once a month, once a year, etc.) and impact or consequence (e.g., expected loss or EaR), as reflected in Figure 3.17.
Risk treatment refers to the portfolio of actions that must be under-taken in the face of disruptive events. The activities that may lead to those events appearing in the red zone must be terminated regardless of the likelihood. Coal mining without deploying adequate safety pre-cautions is one such example. At the other extreme, the activities that may lead to events appearing in the green zone are the ones that we may tolerate. For instance, a parcel delivery company chooses to reflect a provision in its budget for parking tickets its drivers would gener-ate during their deliveries in Manhattan. For this company, it is more efficient to park illegally and get a ticket than drive a number of times around the delivery point until a legal parking spot becomes available. Most risk mitigation efforts are then targeted at the middle zone in an effort to render the residual risk acceptable. For the Canadian grain trader, weather, which affects crop yields, constituted a major risk. The company simply transferred the risk to a financial institution, which was willing to underwrite a weather insurance policy.

Value Creation 65
Mitigation plans are worthless if no one checks to make sure that they are carried out. An effective risk monitoring and review process will determine whether the measures adopted resulted in what was intended, monitor for changes in operation, finance, and strategy, ensures a regular reporting structure, both up and down the line man-agement, and looks out for new and changed risks. It tracks not only incidents, but also near misses.
This is an ongoing process where learnings from the previous iteration are incorporated into the next iteration to increase the effectiveness of risk management. In spite of Herculean efforts, dis-ruptive events do occur. At that point, the organization must shift into a crisis management mode with two key activities: crisis com-munication and business recovery. To ensure effective crisis manage-ment, there is no shortcut; organizations must have a BCP, which clearly identifies the roles and responsibilities of various individuals and departments, allocates adequate levels of resources, and conducts dress rehearsals. Only then a swift restoration of normal operations can be envisaged. Communication to all the stakeholders (workers, families, community members, authorities) must be explicitly incor-porated into the BCP.
Harrington and O’Conner (2009) describe the multi-dimensional approach to BCP at Cisco, which provides a strong focus on Cisco’s suppliers, manufacturing partners, and transportation and logistics
Figure 3.17 The risk matrix
Risk Reduction
Risk Acceptance(Baseline Protection)
Unacceptable Consequences(Eliminate Unacceptable Risk Factors)
Probability/Likelihood
Cat
astr
ophi
c C
onse
quen
ces/
Mag
nitu
de

66 Competitive Supply Chains
providers to document recovery plans and recovery times, and drive resiliency standards. Cisco’s BCP consists of blueprints for:
• Crisis Management. Cisco’s global crisis management team is responsible for monitoring and responding to disruptions globally on a 24/7 basis.
• Product Resiliency. SCRM teams partner to address three key issues: (i) Helping business units make informed and strategic decisions that address vulnerabilities in product design decisions; (ii) translating long-term risk mitigation strategies into short-term priorities; (iii) reducing the cost of risk mitigation strategies and programs.
• Supply Chain Resiliency. SCRM works closely with Manufacturing Operations, EMS partners, and transportation and logistics providers to identify nodes in the supply chain with recovery times that are outside of Cisco’s established tolerances and to develop correspond-ing resiliency plans.
At the end of the day, risk management is about moving from a cloud of uncertainty and rear-view mirror driving to a more detailed under-standing of the “road ahead” and the possible deep holes in it—and preparing for a few of these!
3.4 Summary
• Supply chain design has two main pillars: capacity design and capa-bility design.
• Just like products and processes, supply chain solutions have limited shelf-life, where the life cycle is determined by an industry’s clock-speed, the rate with which the industry’s structure evolves.
• An industry’s clockspeed may be measured based on the rate at which new products are introduced, based on the rate at which new processes are developed, or based on the rate at which new organiza-tional relationships emerge.
• To avoid any unpleasant surprises, supply chain design should be viewed as a dynamic process, as “the capability to design and assem-ble assets, organizations, skill sets, and competencies for a series of competitive advantages, rather than a set of activities held together by low transaction costs.”
• A 3-D supply chain mapping would prove valuable in signaling potential threats as well as new opportunities.
• Risk management would enable a company to identify both poten-tial risks and opportunities for maintaining its ability to create value.

67
4.1 Motivation
In the previous chapter, I emphasized the importance of simultaneous product, process, and supply chain design in a dynamic environment where industry structures evolve continuously. In adopting a concurrent design approach along these three dimensions, one must resolve key cost-service trade-offs in each of those dimensions. In other words, one must assess whether investing in a product, process, or supply chain redesign initiative is a value-creating or value-destroying proposition. For instance, if the additional cash flow generated by a new product design due to an increase in the customer’s Wllingness to Pay (WTP) does not lead to a positive net present value to justify an investment of four man-months of additional Research and Development (R&D), this is a value-destroying proposal. To assess these trade-offs in an objective fashion, supply chain professionals need a simple but rich modelling tool. In this chapter, I will formalize t he cost-service trade-off, which affects supply chains, through a materials management framework. Such an inventory policy will not only allow us to quantify the cost-service trade-off, but also identify (and cost out) principal levers that one can deploy for mitigating such a trade-off.
4.1.1 Example: FNAC
FNAC is a leading French retailer of cultural products such as books, CDs, and DVDs as well as electronics such as tablets, smartphones, MP3 players, and plasma TVs. On the one hand, FNAC’s marketing strategy is strongly anchored on the wide portfolio of cultural products it offers to its customers. On the other hand, FNAC operates stores in urban loca-tions where real estate is extremely expensive, necessitating the efficient use of every square meter. This, in turn, puts a tight constraint on the
4Value Creation: Assessing the Cost-Service Trade-off

68 Competitive Supply Chains
amount of inventory each retail outlet can hold. In guiding its decisions on store assortment, the retailer must carefully assess the consequences of satisfying the following four business criteria:
1. Criticality of the product availability:a. Product appealb. Product contribution
2. Ease of demand forecasting:a. Average demand rateb. Demand volatility
3. Supplier capability:a. Operational flexibility (production lead time)b. Logistical flexibility (delivery lead time)
4. Risk in stocking the product:a. Obsolescenceb. Physical characteristics
FNAC takes pride in offering a wide selection of products. It would be unthinkable for the retailer not to have a great French classic novel, a current bestseller, or a popular video game on its shelves. This is the first dimension of the criticality of product availability. The second dimension is about margins; hardbound books, video games, and latest electronic gadgets certainly have more attractive margins com-pared to paperbacks. The second criterion is focused on assessing sales volumes and sales volatility. It is relatively easier to forecast sales of Victor Hugo’s classic books; however, sales of a new book might flare up after the announcement of a literary prize and die down as rapidly within days. The third criterion focuses on the ease of replenishment. An out-of-stock book in French can be replenished within 24 hours if the publisher has the book in inventory (high logistical flexibility); however, if the publisher is also stocked out, then long replenishment lead times are to be expected as the publisher may not immediately print another batch of the popular book (low operational flexibility). On the other hand, if the out-of-stock product is a video game, it would be a matter of minutes to burn new CDs (high operational flexibility). However, if the supplier is in Japan, this would necessitate a shipping delay of six weeks (low logistical flexibility). The last criterion is about the “cube” that occupies expensive shelf space. A cell phone, which may become obsolete in a few weeks, has a relatively small footprint. A plasma television set, on the other hand, not only becomes obsolete in a few months but also takes up a lot of expensive real estate. FNAC

Value Creation 69
must therefore design and deploy affordable supply chain solutions to support the above four business criteria. As a prerequisite, FNAC must be able to assess the associated cost-service trade-off in managing its store inventories.
4.2 Base stock policies
To formally define an inventory policy, consider the scenario depicted in Figure 4.1, where on-hand inventory is used to meet customer demand that occurs in a random fashion. Inventory is replenished by placing orders with the supplier, who produces and delivers the requested quan-tity after a given lead time. In this scenario, we need to answer three questions:
• How frequently do we review the inventory levels?• How frequently do we place a replenishment order?• What is the replenishment quantity?
The answer to these three questions constitutes an inventory policy. Note that we distinguish on-hand inventory from inventory position. The latter is the sum of on-hand inventory and the pipeline inventory, material ordered but not yet delivered, less any outstanding backorders. Inventory position will be our unit of analysis.
In the absence of any fixed ordering (transaction) costs, a base stock (or order-up-to-S) policy has been shown to be optimal. Base stock policies are easy to define and implement: every p period, place an order for a sufficient number of units so as to bring the inventory position up to the base stock level, S. Note that our objective is not to determine an order quantity; this is a pure pull system that simply replenishes what has been consumed. We are therefore determining a target inventory position to ensure the desired service level.
Figure 4.1 A simple supply chain
Pipelinestock
Supply
On-hand inventory
Inventory position

70 Competitive Supply Chains
In this setting, the frequency with which we review the on-hand inventory and the frequency with which we place orders are fixed. This assumption may represent a situation whereby the supplier’s own plan-ning cycle is imposing a constraint on the frequency of replenishment orders that can be placed by the customer. There is, however, flexibility in the order quantity, which reflects the intensity of the demand during the replenishment cycle.
Assume that the demand distribution, along with its mean and variance, is known. The replenishment lead time, say l, is a known constant. As shown in Figure 4.2, every p period, we will review the inventory level and place an order for a quantity that would restore the inventory position up to the base stock level, S. What is then the optimal base stock level?
Note that, if there was no variability in the demand, one would place an order for the quantity that would satisfy the total demand during the replenishment cycle, namely m×(p+l). In other words, if we reviewed our inventory position every week with a replenishment lead time of two days and a daily demand of ten units, we would need 10×(7+2) = 90 units to fully satisfy the (deterministic) demand during the replen-ishment cycle. Hence, we would set our order-up-to level to 90. When demand is random, our short-term solution is to place some safety
Figure 4.2 A base stock inventory system
Inventory position
μp+ss
ss
time
μp+μI+ss
p 2p 3p 4p0
μI+ss
p+I 2p+I 3p+II
Inventory position On-hand

Value Creation 71
stock to absorb any fluctuations; that is, buffer or suffer (from fluctua-tions). For example, in the first replenishment cycle in Figure 4.2, the observed demand exceeded the expected demand; there was, however, a sufficient amount of safety stock to satisfy this additional demand. In the second cycle, the observed demand was so high that, not only had we used up all the safety stock, but we ended up backordering the excess demand or losing sales. In the third cycle, on the other hand, the observed demand was way below our expectations. In such a sce-nario, where we had to accommodate demand fluctuations, we set the order-up-to level to
S = expected demand during replenishment cycle + safety stock
S = m( p+l ) + safety stock.
We then need to determine the right level of safety stock. Before we develop an adequate expression, let us focus on the drivers of safety stock. There are four key drivers:
• The volatility of demand, s.• The length of the replenishment lead time, l.• The length of the review period, p.• The desired customer service level, z.
Putting these drivers together, the order-up-to level is given by:
( )= + + +p l z p lm ss
where the first part of the equation represents the expected demand during the replenishment cycle, and the second part is the safety stock kept to accommodate demand fluctuations during that cycle.
In the expression for base stock S, the average demand as well as its volatility can be estimated from historical data. Similarly, the length of the review period and replenishment lead time are typically dictated by the production and distribution constraints. It therefore remains to determine the multiplier, z, that reflects the desired customer service level. Here, we have two possibilities. One can invoke the newsvendor scenario,1 if a good estimate of the overage and underage costs (co and cu, respectively) exists. In that case, the ratio of the overage cost to the

72 Competitive Supply Chains
total cost of demand supply mismatch yields the critical fractile, and z is determined by inverting the demand distribution:
1= u
u o
cz F
c c− ⎛ ⎞⎜ ⎟
+⎝ ⎠.
If we are willing to assume that demand is distributed according to a Normal distribution with mean m and standard deviation s, we can use the F(z) column in the table in the Appendix to obtain the correspond-ing z value. Alternatively, the Excel function NORMSINV provides the necessary multiplier:
z = NORMSINV(cu/cu+co).
The newsvendor scenario will be formally introduced in the next chapter. In this scenario, the cost of overage is typically easy to estimate reflecting the cost of holding excess stock, the opportunity cost of money tied up to excess stock, or the risk of obsolescence. The cost of underage, on the other hand, is harder to obtain as it reflects not only the foregone mar-gin at present but also the loss of customer goodwill in the long run. In those settings where it is difficult or impossible to estimate the overage and underage costs, we need an alternative approach to determine the multiplier, z. One alternative is to start with a targeted customer service level, measured by, say, fill rate, f, and then determine the multiplier that would achieve the desired fill rate. To this end, the supply chain specialist would benchmark competing firms with respect to the ser-vice levels they offer or would consult with their marketing colleagues regarding the service levels demanded by their customers. For example, Hewlett-Packard requires relatively high fill rates for its laser printers as the installed product base is the primary driver of sales for high-margin consumables such as replacement cartridges, paper, and service con-tracts. Similarly, Coloplast, a Danish wound-care products manufacturer, requires that fill rates for hospitals be nearly 100%, as they discover that a patient, who leaves the hospital with a Coloplast product, is highly likely to remain loyal by continuing to purchase the same brand throughout his treatment.
How do we then translate the desired service level, expressed in terms of the fill rate f, into the multiplier z? Technically, we choose z such that
( ) += 1
L z p lf
p
sm
− ,

Value Creation 73
where the quantity L(z) is called the standard loss function. The standard loss function is also provided in the Appendix under the assumption of normally distributed demand. In technical terms, this is a conditional expectation: the average demand during the replenishment cycle given that the demand exceeds the safety stock. This quantity therefore repre-sents the average lost sales (or backlog) during the replenishment cycle. The denominator, on the other hand, reflects the average demand dur-ing a review period. The ratio then yields the proportion of lost sales during this cycle; one minus that ratio is therefore equal to the fill rate.
Rearranging the terms, we obtain
( ) = (1 )+
pL z f
p lm
s− .
If we further assume that the demand follows a Normal distribution, we can use the L(z) column of the table in the Appendix to determine the corresponding z value. Note that, in this setting, there is no simple Excel function that is analogous to the one that enabled us to evaluate the critical fractile of the newsvendor. We then compute the order-up-to level through
( + ) + +m s=S p l z p l .
4.2.1 Example continued: FNAC
Before we run some numbers, let us revisit the FNAC example and see how the retailer’s customer service criteria can be mapped onto the base stock model to assess the associated cost-service trade-off. The first criterion, criticality of product availability, is directly related to the fill rate, f, that must be set in accordance with the marketing goals. The second criterion, ease of demand forecasting, is reflected by μ and σ in the model. The third criterion on supplier capability is illustrated by p, which, as the review frequency, reflects its operational flexibility, and by l, which, as the replenishment lead time, reflects its logistical flexibility. Finally, the risk of obsolescence and the stockability of the “cube” can be reflected through the selected fill rate, f. FNAC can then assess the cost-service trade-off inherent in various possible supply chain solu-tions (e.g., centralizing the inventory of a certain product family at a distribution center vs. pushing the product to the shelves of a retail outlet).

74 Competitive Supply Chains
4.2.2 Running the numbers
Consider the following scenario. Suppose that you are selling a product whose forecast calls for an average demand level of 150 units per week with a standard deviation of 50 units per week, representing the volatil-ity of demand. As an internal policy, inventory is reviewed every other week ( p = 2 weeks). The supplier quotes a production and delivery lead time of 1 one week (l = 1 week). The marketing strategy calls for a high level of customer service, expressed in terms of the desired fill rate: f = 0.99. The base stock level that achieves the desired service level can be calculated as follows:
Cycle stock = μp/2 = 150·2/2 = 150 units.Pipeline stock = μl = 150·1 = 150 units.We can then calculate the base stock level through:
150.2( ) = (1 0.99) = 0.01 = 0.173.
+ 10 2 +1p
L zp l
ms
−
From the table in the Appendix, we read off the (approximately) cor-responding value of z = 0.58. We can then determine the base stock level as:
m s == ( + ) + + 150 ×(2 +1) + (0.58)(10) 2 +1 = 460.S p l z p l
This simple framework provides an objective and transparent platform to quantify the cost-service trade-off. Note that, in this expression, the key drivers of inventory are the following:
• the review frequency, p,• the production and distribution lead time, l,• the expected demand rate, m,• the volatility of the demand, s, and• the service requirements expressed through the multiplier, z.
In supply chain design, each of these drivers can be the subject of nego-tiations among the involved stakeholders. For example, a manufacturer might ask its supplier to modify the frequency with which he can place replenishment orders, that is, p. As such added flexibility will decrease the required inventory investment (hence, the Working Capital Requirement (WCR))) by the manufacturer in a quantifiable fashion; some of those savings can be passed along to the supplier as an incentive to provide

Value Creation 75
such flexibility. In a similar fashion, the value of reducing the lead time, l, can be assessed. For example, such a calculation would help us to assess whether shipping by airfreight overnight makes sense compared to ship-ping by sea over six weeks. Or, if the firm is considering alternative invest-ments to reduce demand volatility, this expression enables a quick cost/benefit analysis between the investments required to reduce volatility and the reduced reliance on safety stocks due to lower volatility. Finally, if the Marketing Department insists on a certain service level, this expres-sion provides the cost of providing the desired service.
In fact, by considering different service levels, one can generate a cost-service trade-off curve, as illustrated in Figure 4.3. Such a curve would provide further help in segmenting the target market by offering premium (and more costly) service to top customers.
Supply chain professionals can make a sustainable difference, however, by designing products, processes, and supply chains that would shift the trade-off curve, hence mitigating the cost-service trade-off. Postponement strategies represent one such instrument that would mitigate the cost- service trade-off. In fact, Figure 4.3 is based on the HP Deskjet Printer Supply Chain.2 The case illustrates an inventory-service crisis, where product variety driven by localization requirements (e.g., power supply, software, and manuals in the appropriate language) overwhelms the
Figure 4.3 The cost-service trade-off curve for HP deskjet printers
97.00% 97.50% 98.00% 98.50% 99.00% 99.50% 100.00%
Saf
ety
stoc
k
Fill rate
Vancouver Postponement
13,000
18,000
23,000
28,000

76 Competitive Supply Chains
capabilities of the HP Deskjet printer supply chain. Despite a state-of-the art Just in Time (JIT) factory in Vancouver, Washington, HP was not able to forecast the product demand accurately, resulting in severe stock-outs in some markets while inventory built up in others. Within the base stock framework, supply chain experts at HP were able to assess the cost-service trade-off among various supply chain solutions such as shipping products through air freight (reducing l but drastically increasing transportation costs), building another factory in Europe (reducing both p and l but necessitating a major capital investment), or boosting safety stock levels (increasing WCR while hoping to achieve higher fill rates).
The solution that has been ultimately adopted (and become a bench-mark in many other industries) is delayed customization or postponement, whereby the Vancouver plant would produce the hardware based on forecasts, which would ultimately be customized in a distribution center close to the customer (preferably after a firm customer order has been received). The cost-service trade-off curve under the postpone-ment strategy is also reflected in Figure 4.3 with the broken line. HP managers were then able to quantify the savings due to postponement and assess whether the investment in product and supply chain rede-sign to enable the delayed customization capability was indeed a value-creating proposal. Once adopted, postponement was deployed through a third-party logistics service provider for HP in Europe. Today, as deskjet printers have become commodity products, they are produced in a make-to-stock fashion—another example of Fine’s double helix model in Figure 4.4 of Chapter 3.
4.3 An extended example
“Best Buy Won’t Sell iMac Computers” AP Headlines—Monday, 19 April
CUPERTINO, Calif. (AP) – Some customers want blue, and some want green. But customers who head to Best Buy Co. stores looking for an iMac computer won’t find any at all. Best Buy hasn’t stocked the iMac since early this year because it disagrees with Apple Computer’s requirement that retail-ers stock all five colors. “We are not carrying the iMacs right now because there isn’t exactly a match between Apple’s purchase requirements and our inventory management,” Best Buy spokeswoman Joy Harris said Monday.
The $1,199 computers, on store shelves in five colors since January, have been most popular in blueberry and grape. The lime, tangerine and

Value Creation 77
strawberry models have been less popular. Apple recently shifted its policy, shipping four blues with one of each of the other colors. “We’re definitely trying to work this out,” said Apple spokeswoman Rhona Hamilton. So far, the adjustments aren’t working for Best Buy. The company did not specify which colors it does not want to stock.
Other computer stores said Monday they do not have a problem with Apple’s policy. Suzanne Shelton at Dallas-based CompUSA, said the purple models, dubbed “grape,” have been very popular. But she said that when those run out on store shelves, customers are content to buy whatever is in stock. “Some of them are faster sellers than others,” she said, “but so far that hasn’t proven to be a real problem for us.” A clerk at one California Fry’s Electronics chain, where the shelves held plenty of blueberries and no tangerine, straw-berry, lime or grape models, said customers will take what they can get.
Best Buy, which has 300 stores in 36 states, may eventually stock the iMacs, Harris said. “It’s just taking a lot of negotiation,” she said.
We assume the following if Best Buy were to purchase iMac from Apple Computer:
• Average demand for a Blueberry (Blue) iMac at a typical Best Buy store would be 40 units per week with a standard deviation demand of 10 units per week.
• Average demand for a Tangerine (Orange) iMac at a typical Best Buy store would be 10 units per week with a standard deviation demand of 5 units per week.
• Best Buy would place weekly orders for iMacs to Apple.• Shipments would arrive from Apple two weeks after the orders were
placed by Best Buy.• Best Buy has a target line item fill rate of 99%.• Best Buy would purchase iMacs (all colors) from Apple for $1100
per unit.• Best Buy’s inventory carrying cost for computers is 50% of product
cost per year.
Consider the inventory levels for Blueberry iMacs at a typical store if Best Buy uses the periodic review, order-up-to policy.
Inventory levels for Blueberry iMACs can be calculated as follows:
a. Cycle stock=μp/2=40*1/2=20b. Pipeline stock=μl=40*2=80

78 Competitive Supply Chains
c. Safety stock=zσ√p+l in which z is determined by using the Standard Loss Function/Standard Normal table using formula: L(z)=(1–ƒ)* (μp/σ√p+l).
Thus,
L(z) = (10.99)*(40*1/10√2+1) = 0.01*(40/10√3) = 0.02309.
From the table, the z value is 1.6. Hence, the safety stock level is given by:
SS = zσ√p+l = 1.6*10√2+1 = 27.7 ≈ 28.
The base stock level is then given by
S = ( + ) + +p l z p lm s = 40 + 80 + 28 = 148 units.
Consider the inventory levels for Tangerine iMacs at a typical store if Best Buy uses the periodic review, order-up-to policy.
Inventory levels for Tangerine iMACs can be calculated as follows:
a. Cycle stock=μp/2=10*1/2=5b. Pipeline stock=μl=10*2=20c. Safety stock=zσ√p+l in which z is determined by using the Standard Loss
Function/Standard Normal Table using formula: L(z)=(1–ƒ)* (μp/σ√p+l). Thus,
L(z) = (1–0.99)*(10*1/5√2+1) = 0.01*(10/5√3) = 0.01155
From the table the z value is 1.9. Hence, the safety stock level is given by:
SS = zσ√p+l = 1.9*5√2+1 = 16.45 ≈ 17.
The base stock level is then given by
S = ( + ) + +p l z p lm s = 10 + 20 + 17 = 47 units.
A marketing executive suggests that Best Buy might carry the iMac in all colors if Apple would offer a per unit discount on less popular colors to offset the higher effective inventory carrying cost per unit sold for less popular colors. Based on your results from parts (a) & (b), what per unit discount should Apple offer to Best Buy for Tangerine computers in order to make them indifferent to selling computers in Tangerine and Blueberry? (Assume that Blueberry computers will be sold to Best Buy at $1100/unit. You may also assume that Best Buy does not take ownership of computers until they arrive at the retail stores.)
To calculate the appropriate level of compensation, we need to first determine the inventory carrying costs for the two computers. For Blueberry, the average annual inventory carrying cost is given by
(20 + 28 units) *($1100/unit) * 0.50 = $24,600 per annum.

Value Creation 79
For Tangerine, the average annual inventory carrying cost is given by
(5 + 17) * ($1100/unit) * 0.50 = $12,100 per annum.
These numbers, however, are not directly comparable as the two com-puters have different annual sales volumes. We could use the annual sales volume to normalize the numbers and make them directly compa-rable. Assuming a 50-week year, the sales volume for Blueberry is 40*50 = 2000 units/year whereas the sales volume for Tangerine is 10*50 = 500 units/year.
The inventory carrying charge per unit sold is then given by:
Blueberry: $24,600/2000 = $13.20
Tangerine: $12,100/500 = $24.20
The compensation should then be based on the extra cost of carrying Tangerines in inventory, Δ = $24.20 – $13.20 = $11.
4.4 Long-term solutions
The base stock model that was introduced to quantify the cost-service trade-off can also be viewed as one short-term solution to inventory management challenges. From this materials management perspective, it is worthwhile to open a parenthesis here to seek longer-term solu-tions. A long-term orientation, in return, requires the identification of inventory drivers, business conditions, and/or constraints that neces-sitate inventory holding. Unless these drivers are tamed through better product, process, or supply chain design, stockless production and dis-tribution are not possible. To this end, there are several ways of classify-ing inventories. Frustrated supply chain professionals may classify them as slow moving or obsolete stocks (SLOBS) or as first in still here (FISH). Accountants classify inventories as raw materials, work-in-process, or finished goods for reporting purposes. However, instead of using any of the above classifications, I introduce here a dynamic classification scheme that highlights the underlying drivers. One should note that the purpose of this classification is not to walk through a manufacturing facility or a warehouse and label the various kinds of stocks encountered along the way. The idea is to simply highlight the principal operating condition that necessitates inventory holding. One should also note that while I describe the key drivers individually, they typically occur

80 Competitive Supply Chains
simultaneously with a compounding effect on the business. My purpose in introducing them individually, however, is to emphasize the trade-offs they each induce on the operations of a supply chain.
The most obvious reason why inventories cannot be avoided is that production and distribution are not instantaneous (pipeline stocks). Seasonal inventories are built to absorb variations in supply and/or demand. Due to transaction costs, it is more economical to order or produce more than one unit of any particular item at a time (cycle stocks). Safety stocks are built as a hedge against uncertainty in demand or supply. Decoupling stocks are held between two stages of production in order to absorb variations in the production rates of the two stages. I therefore classify inventories into the following categories:
• Pipeline stocks• Seasonal stocks• Cycle stocks• Safety stocks• Decoupling stocks
For a more detailed discussion, consider the following simple scenarios.
4.4.1 Pipeline stocks
A pharmaceutical company sells on average 1000 vials of insulin per month. The company, however, is faced with a manufacturing lead time of four months. To sustain its sales volume of 1000 vials per month, how much of a pipeline inventory must the company maintain?
This scenario is best described by one of the key models in Operations Management: Little’s Law,3 which states:
SYSTEM STOCK (L) = SYSTEM THROUGHPUT (λ) × SYSTEM LEAD TIME (W)
In our case, since the desired throughput is sales of 1000 vials per month and because the manufacturing lead time is four months, the company must then carry, at any given point in time, a pipeline stock of 4000 vials (=1000 vials/months × 4 months).
Disciples of the JIT movement would readily recognize Little’s Law as the keystone of pull control. In pull systems, to achieve a predictable production lead time, manufacturing engineers design a production process with a certain throughput rate and then limit system stock by

Value Creation 81
controlling the number of kanban cards in circulation. In other words, by fixing L and λ, they determine the lead time, W, as W = L / λ.
4.4.2 Seasonal stocks
Consider a toy manufacturer who sells 12,000 toy trucks a year. The manufacturer has a plant with a capacity of 1000 trucks per month. Unfortunately, sales are slow during the first 11 months of the year and peak during the Christmas season. More specifically, the manufacturer sells 100 trucks/month in January through November, while the sales peak at 10,900 trucks in December. There are two basic possibilities to match supply with demand. The first one requires a highly flex-ible manufacturing process that can produce 100 trucks per month for 11 months out of the year and then increase the production rate to 10,900 trucks/month for one month. Not many production processes offer such levels of flexibility. The remaining possibility is therefore to build ahead and accumulate stock ahead of the sales season by steadily producing at capacity. This is depicted in Figure 4.4 for the production capacity of 1000 trucks per month. At any given point in time, the vertical difference between cumulative production and cumulative sales corresponds to seasonal stock.
This phenomenon is quite common in services as well. A seaside resort with 500 rooms may experience an occupancy rate of 100% during the summer months (high season) and even refuse reservation requests, but may only be 40% full during the winter months. The dif-ference between the maximum capacity and the occupancy rate may then be viewed as seasonal stock (of guest rooms).
Q12,000
Cumulative production
Cumulative sales
Time (months)
Seasonal stock
Figure 4.4 The impact of seasonal demand for toys: seasonal stocks

82 Competitive Supply Chains
Perhaps the most appropriate use of this label is in agriculture. For example, in the Northern Hemisphere, apples are harvested in August and September, placed in climate-controlled sealed rooms, and sold throughout the year. The content of the sealed rooms at any point during the year represents seasonal stocks.
4.4.3 Cycle stocks
A chocolate lover devours one chocolate bar a day. She has the following choices: she can go to a grocery store every morning and purchase a bar of chocolate to eat that afternoon or she can visit the grocery store on Monday morning and get seven bars of chocolate to last her the entire week. What is her optimal policy?
Our chocolate lover faces a basic trade-off between the cost of visit-ing the grocery store (gasoline consumption and the wear and tear on the car due to driving, the opportunity cost of her time, etc.) and the cost of holding seven chocolate bars in inventory. As illustrated in Figure 4.5, if she stops by the grocery store every day and purchases just one bar for immediate consumption, she will incur this “set-up cost” every day while holding no inventory. On the other hand, if she only goes shop-ping once and purchases all seven chocolate bars, she will end up incur-ring the set-up cost once but will have to hold inventory throughout the week. This trade-off is addressed by one of the classical models in Operations Management, Wilson’s square root formula4 (also known as the Economic Order Quantity (EOQ)). EOQ yields the optimal order quan-tity in the presence of a fixed set-up and a linear holding cost as follows:
* 2DSQ
h= ,
where D is the (known and constant) demand rate (7 seven bars per week), S is the set-up cost, and h is the holding cost.
The EOQ reflects the optimal purchase (or production) quantity when faced with a trade-off between set-up cost and inventory holding cost. Q* is the quantity that minimizes the sum of these two conflicting cost
Figure 4.5 Cycle stocks and the economic order quantity
Q
time

Value Creation 83
drivers. While myopic, EOQ has several desirable characteristics that make it a widely used inventory model in practice. First, it is a very robust model: for example, if one commits a 100% error in forecasting the demand, the resulting error in the purchase quantity is only 40% due to the square root. Second, it clearly depicts intuitive economic relationships. For instance, if machine set-ups are long, creating a lot of costly downtime in a manufacturing facility, EOQ advocates large production batch sizes. It is therefore not surprising that a key pillar of the JIT philosophy is on reducing set-up times, making it economi-cally feasible to produce in small quantities and to switch frequently among different product families. This is indeed a recent phenomenon in the pharmaceutical industry. The manufacturing of active product ingredients (API) is a critical activity that is tightly regulated and closely monitored. Avoiding any cross contamination between two APIs that are produced sequentially in a production facility necessitates a long set-up time (typically in the order of weeks) during which the produc-tion is stopped, the facility is cleaned, and the equipment is relaid out, sterilized, and recertified. If this is a multi purpose facility, the break in production translates into a halt in cash flows. In this setting, the typical practice is to incur the set-up cost once a year and manufac-ture the API in a single batch that corresponds to that year’s projected consumption—leading to significant holding costs. API manufacturing has recently started using disposable equipment to eliminate the long cleaning and sterilization steps—hence, to drastically reduce the set-up time (and cost) enabling the production of multiple batches during the year. On the other hand, if holding cost is very large (say, due to high obsolescence risk), EOQ advocates production or procurement in small quantities.
4.4.4 Safety stocks
You are planning a birthday party for your seven-year-old. The key ques-tion is how big a birthday cake to make. In the past, ten school friends showed up, on average, for the festivities. Last year, however, 15 kids were at the party. If you make a cake for 15 and only 10 kids show up, that would be a waste. If, on the other hand, you make a cake for 10 and all 15 kids show up, that would be an embarrassment. What should you do?
To be able to answer this question, one has to estimate the eco-nomic impact of the demand–supply mismatch. In case, demand exceeds supply, we end up incurring an “underage” cost. In the reverse case, where supply exceeds demand, we have an “overage” cost. The

84 Competitive Supply Chains
former may include not only the foregone margin but also some loss in customer goodwill. The latter may include the production or purchase cost as well as any cost associated with disposing of excess stock. The framework that determines a quantity, which maximizes the expected profit in this uncertain environment, is once again the newsvendor model. This model is introduced in detail in the next chap-ter and deployed in the context of value capture.
4.4.5 Decoupling stocks
In a factory producing washing machines, an automated manufacturing cell produces eight shells per shift. Further downstream, these shells are assembled manually into washing machines at a rate of 12 machines per shift. Driven by technological constraints, production and assembly therefore require careful coordination. As illustrated in Figure 4.6, the out-put from the automated manufacturing cell overnight (during the grave-yard shift) has to be stored in a buffer between production and manual assembly. In the absence of such decoupling stock, either the automated manufacturing cell may be blocked or the manual assembly process may be starved, resulting in throughput loss for the overall production facility.
A fruit-processing plant cleans and sorts freshly picked apples that farmers bring from their orchards. It is the plant’s policy to start receiv-ing the fruit at 7a.m., but not to start the processing until 9a.m.. This policy attempts to decouple a very stable processing operation inside the plant from a highly volatile external arrival process through the accu-mulation of fresh fruit over a two-hour period. Such decoupling stocks
12AM 8AM 4PM
Q
Cumulative production
Cumulative assembly
Decoupling stock
shifts
Figure 4.6 Coordinating production and assembly through decoupling stocks

Value Creation 85
play a crucial role in petrochemical complex where starving operations due to a disruption in feedstock have huge economic consequences due to high restart costs.
Just like fever is a symptom of an underlying infection, inventories are symptoms of underlying operational constraints. For example, pipeline stocks are needed since there is a nonnegligible lead time for production and distribution. In our pharmaceutical example, the only way to cut pipeline stock is to reduce the manufacturing lead time for insulin. Similarly, seasonal stocks are needed as capacity is too rigid to catch up with demand. Demand management aimed at increasing the demand during the low season (e.g., preferential pricing) is a possible remedy. Conversely, charging a high price during the peak season (e.g., the toll paid to drive downtown Singapore during business hours) is an effective deterrent in shaping consumer behavior. This topic is further discussed in Chapter 7, where service supply chains are analyzed.
Cycle stocks are carried as set-up costs are non-negligible. One of the key ingredients of the JIT movement is to reduce set-up times, so that batch sizes (hence, cycle stocks) can be reduced. Safety stocks will be indispensable as long as uncertainty cannot be eliminated. In certain cases, it may be more economical to simply hold safety stocks than to try to eliminate uncertainty—say, through “better” forecasting. Decoupling stocks are necessitated by variability and demand–supply imbalance. Synchronization through better process design is a long-term remedy.
The bottom line is that unless one is capable of addressing the drivers of inventory, zero inventories will be neither desirable nor achievable. Our dynamic classification of inventories along with the short-term trade-offs, underlying causes, and potential long-term remedies are summarized in Table 4.1.
4.5 Financing the inventory
Like the base stock model I introduced earlier, the objective of inven-tory management models is to determine effective policies for manag-ing the trade-off between customer service and the cost of service. Over the years, these models have become increasingly sophisticated, incor-porating many complicating factors that are relevant in practice such as demand uncertainty, finite supplier capacity, and yield losses. Curiously absent from these models are the financial considerations that may impact the management of the operating cycle.
Figure 4.7 shows the WCR of various companies in agri-business. Working capital refers to the difference between current assets, which

86 Competitive Supply Chains
Table 4.1 Drivers of inventory
Type of stock
Short-term trade-offs
Underlying causes
Suggested remedies
Pipeline stocks None Lead time Re-layoutCo-location
Seasonal stocks Capacity utilizationLost sales
Seasonal demandRigid capacity
Demand managementFlexible capacity
Cycle stocks Set-up costsFixed ordering costs
Lack of flexibilityProduct variety
Quick set-upsFocused product lines
Safety stocks BackordersLost sales
UncertaintyLead time
POS dataExpress delivery
Decoupling stocks
Capacity utilizationThroughput
VariabilityImbalance
ReliabilitySynchronization
Figure 4.7 Working capital of various agri-business companies
Syngenta 2008 est.
Year-end trade working capital—% of sales
–30% –20% –10% 0% 10% 20% 30% 40% 50% 60% 70%
34%
30%
43%
20%
26%
Total as % sales
–13%
–10%
–21%
–6%
–7% 17% 16%
11% 15%
37% 27%
22% 18%
28% 19%
Monsanto 2008
MA 2007
Basf 2007
Bayer 2007
Trade A/P Inventory Trade A/R
include cash, inventory, and accounts receivable (A/R), and current liabilities, which include accounts payable (A/P) and short-term loans. The objective of working capital management is to increase the prof-itability of a firm by investing in long-term, high-return assets while ensuring sufficient liquidity during the operating cycle.5 In particular, efficient working capital management is necessary to manage the inherent trade-off between profitability and liquidity since keeping too much cash for operations may lead to a smaller return from long-term

Value Creation 87
investments, while too little cash may increase the likelihood of pay-ment default.
Little overlap exists between cash management and inventory manage-ment literature. This phenomenon is driven by the fundamental Modigliani and Miller result6 in corporate finance theory, whereby in perfect and competitive markets, financing decisions can be made independenty of investment and production decisions. This is further reinforced by the organizational silos where financing decisions are the responsibility of the Treasury department, whereas inventory decisions are taken by Operations.
In reality, however, markets are neither perfect nor fully com-petitive; many firms are therefore self-financing, that is, their ability to replenish their own inventories is directly affected not only by their current inventory levels, but also by their receivables (trade credit they have extended to their customers) and payables (trade credit they have received from their suppliers). Such constraints have gained added significance during the lingering economic crisis, which has made external financing increasingly difficult to secure. Materials management practices of a self-financing firm whose replenishment decisions are constrained by cash flows, which are updated periodi-cally following purchases and sales in each period, must therefore be carefully analyzed. In particular, the interaction between the financial and operational parameters, that is, the impact of the constraints on the working capital on the long-run average costs deserves further scrutiny.
The traditional approach for modeling inventory management chal-lenges in the face of demand uncertainty is the newsvendor framework. While our modeling efforts are anchored in this framework, we will extend it by incorporating cash flows that might constrain replenish-ment decisions.7 We also explicitly consider the lead times within the operating cycle (i.e., replenishment lead time, holding period for on-hand inventory, payment period for accounts payable, and collection period for accounts receivable). In addition, instead of setting a known, exogenously determined budgetary constraint as some models do, we model the available cash in each period as a function of assets and liabilities that are updated through the procurement and sales activities. The key messages of our study can be summarized as follows:
1. The imposition of a myopic constraint on working capital renders an otherwise stable operating cycle unstable by leading to shortfalls that become increasingly difficult to eliminate.
88 Competitive Supply Chains
2. An arbitrarily imposed constraint on the working capital not only fails to prevent any undesired violations but also significantly dis-torts operational decisions. The distortions are driven by the fact that while a hard constraint on working capital may be strictly enforced in procurement, sales decisions are typically made without considering the constraint.
3. The unintended consequences of the myopic WCR constraint mentioned before lead us to define a second, more flexible, and forward-looking approach, which is implemented in the form of a spend-at-risk model. This model not only eliminates this instabil-ity but also lowers the average total cost per period. Unfortunately, it does not eliminate all the violations on the working capital constraint.
4. While effective management of working capital tries to balance the profitability-liquidity trade-off from a financial perspective, it fails to offer adequate operational guidance. One way to eliminate the distorting effect of the working capital constraint on operational decisions would be to value both inventory and accounts receivable at costs exclusively for operational decision-making.
There exist other forms of external financing for the operating cycle. For example, in asset-based financing, loans are offered based on 90% of accounts receivable and 60% of inventory.8 However, such loans are not always available. In fact, fast-growing firms or start-ups do not have sufficient assets to qualify for such loans. This leaves trade credit as the most important source of external finance.9 In fact, in 2007, 90% of the global merchandise trade ($25 trillion) was financed through trade credit.
Given that financial institutions are more efficient lenders, clients could be made better off by taking up a loan from a bank and paying the suppliers in cash.10 One should therefore question the motivations that lead nonfinancial firms, whose competitive advantage is not in extending credit, for acting as financial intermediaries. In fact, some studies find that the total supply chain profit with bank financing is higher than that with trade credit financing—naturally leading to the question of why specialized financial institutions are not willing to enter into this potentially profitable business. There are, however, several explanations for the existence of trade credit, including the pres-ence of taxes, transaction costs, imperfect market competition, informa-tion asymmetries, and moral hazard problems. Moreover, a number of financial institutions have indeed started offering “supplier finance” to

Value Creation 89
provide some relief for the constraint on working capital. As illustrated in Figure 4.8, the cycle starts as the retailer sends the shipment along with an invoice to the client with a payment due date, say of 60 days [1]. Once the invoice is approved, the client instructs the financial insti-tution to pay the supplier at the future due date [2, 3]. At this point, the supplier may choose to sell the invoice to the financial institution at a discount and get paid immediately, reducing its own A/R and thereby obtaining additional slack in its working capital constraint [4]. The client ultimately pays the financial institution the full amount of the invoice on the scheduled payment date closing the loop [5]. As such, supplier financing schemes remove the constraints on working capital (at a cost) from the supply chains and enable the implementation of optimal materials management policies.
4.6 Summary
• A base stock policy is not just an easy-to-define-and-implement materials management system but also a transparent way of quanti-fying the cost-service trade-off.
• The immediate use of the trade-off curve is in segmenting the target customer base with platinum customers receiving higher levels of service (measured in this case by the fill rate), naturally at a higher cost. For gold customers, one can then reduce both the service levels and the corresponding cost to serve.
Figure 4.8 Supplier financingSource: Wells Fargo.
1. Shipment and invoice presentation (Day 1)
Supplier finance: the basics
Supplier1
Supplier2
SupplierX
Client
WELLSFARGO
Supplier3
3. Supplier is notified of approved invoice from buyer4. Invoice sale
to Wells Fargo capital finance (day 5)
2. Approved invoice file (day 5)
5. Payment on invoice due date (day 60)
Together we’ll go far
90 Competitive Supply Chains
• The real value that supply chain professionals add, however, is in redesigning products, processes, and supply chain interfaces so that the trade-off curve shifts out to the left, representing a mitigation of the cost-service trade-off. The model is then useful in quantifying the resulting savings and assessing whether the investment necessary in generating this shift makes financial sense (i.e., has a positive net present value).
• Our long-term goal should be to identify those operational drivers that are forcing us to carry inventory and reduce or eradicate those drivers so as to eliminate the need to carry stocks.
• An arbitrarily imposed constraint on the working capital not only fails to prevent any undesired violations but also significantly dis-torts operational decisions. The distortions are driven by the fact that while a hard constraint on working capital may be strictly enforced in procurement, sales decisions are typically made without considering the constraint.

91
5.1 Motivation
In the personal computer industry, it is customary to talk about the “smi-ley curve.” The x-axis for the curve shows the various players in this sup-ply chain, namely equipment makers, manufacturers of microprocessors and other components, PC assemblers, distributors, value-added resellers, and service providers. The y-axis reflects the margins made (i.e., the value captured) by each of these players. The “smiley curve” asserts that, while both the upstream (e.g., equipment and microprocessor manufac-turers) and downstream players (e.g., service providers) make healthy margins, PC assemblers’ margins are relatively thin. A similar challenge is also present in service industries. Consider, for example, the airline industry. Over the past few years, while full-service European airlines have been struggling to avoid bankruptcy or trying to climb back out of the red zone, aircraft manufacturers, aircraft leasing companies, reserva-tion systems, and airport operators have achieved respectable financial results. Hence, the value captured by different players varies drastically along this supply chain as well. There are many other examples where the value created by the entire supply chain is captured in an uneven fashion by the different players in that ecosystem.
Value capture was less of a challenge when vertical integration was the dominant industry structure. As an extreme example, one can consider the Ford Corporation in the early 20th century, where Henry Ford owned and operated every echelon of their supply chain from iron mines to car dealerships. In such a setting, a single “control tower” used to manage both value creation and value capture for the entire ecosystem. Current industry structure, however, is anything but vertically integrated. From
5Value Capture: Aligning Supply Chain Partners

92 Competitive Supply Chains
cars to computers, airplanes to consumer goods, entertainment to elec-tronics, every echelon of these supply chains is owned and operated by independent organizations. In other words, a single system-wide management structure with clear command-and-control responsibilities has been replaced by multiple rational economic agents with possibly divergent—even conflicting—interests and priorities. The challenge has therefore become the alignment and coordination of these independent agents.
I address this challenge in this chapter. I first introduce some work-ing definitions. I then discuss the consequences of misalignment. Both long-term and short-term initiatives to achieve coordination will be introduced; implementation challenges will be discussed.
5.2 Challenges in supply chain coordination
The key consequence of the lack of supply chain coordination is the bull-whip phenomenon. As depicted in Figure 5.1, this is the amplification of volatility along the network, that is, the increase in demand variability as one moves upstream farther and farther away from the market. The key drivers of the bullwhip phenomenon include the lack of informa-tion sharing, communication, and collaboration among the supply
Figure 5.1 The bullwhip phenomenon
140%
120%
100%
80%
60%
40%
Year
-on-
year
gro
wth
20%
–20%
–40%
–60%
1985
1986
1987
1988
1989
1990
1991
1992
1993
1994
1995
1996
1997
1998
1999
2000
2001
2002
2003
2004
2005
2006
2007
2008
2009
2010
0%
Electronics revenueGDP IC revenue Lithography revenue

Value Capture: Aligning Supply Chain Partners 93
chain entities as well as physical delays in information and material flows. In other words, any change in the marketplace, when coupled with information distortions, and information and physical delays, results in increasing levels of volatility as we travel upstream along the supply chain.
Recall ASML, the Dutch manufacturer of photolithography equipment, featured in Figure 3.11 of Chapter 3. Figure 5.1 shows the year-on-year (YoY) growth in revenues of all the manufacturers in ASML’s ecosystem. The bullwhip manifests itself as the amplification in the volatility of the YoY revenue growth experienced by the players in the ecosystem. A tiny increase in the global GDP translates into more disposable income trig-gering consumption—including the purchase of consumer electronics. The increased consumption has a knock-on effect on the sales by manu-facturers of consumer electronics, which, in turn, purchase a larger number of microprocessors to power their products, ultimately resulting in higher orders (hence, revenues) for ASML’s wafer steppers. The farther one is away from the market, the worst the fluctuation becomes!
To mitigate the bullwhip, rather than trying to boost forecast accu-racy or to reduce market volatility, any initiative that promotes higher supply chain transparency by eliminating information delays and dis-tortions through information sharing and achieves enhanced agility by shortening physical delays would come a long way in mitigating the bullwhip. With the ubiquity of the Internet, information delays are easier to eliminate—provided that there is a willingness to share information (Fiala, 2005). Physical delays, however, are more difficult to overcome, both in the manufacturing and in the service domains, as discussed within the context of pipeline inventories in the previous chapter. For example, a key component in ASML’s photolithography equipment is the high-precision lens manufactured by Carl Zeiss with a lead time of 16 months! Similarly, it takes around 10–12 years to become a competent neurosurgeon.
Coordination is further hampered by structural constraints that favor local optimization.1 Consider the practices of order batching, shortage gaming, forward buying, and demand forecast updating. Order batching distorts and delays information. For example, a retailer observing daily sales typically places replenishment orders on a weekly or monthly basis. In this case, the orders that the supplier receives are both aggre-gated and hence, distorted and delayed. However, there are some economic reasons for batching orders. First, it is costly to process orders. (Recall the discussion at the end of the previous chapter on the ordering or set-up costs within the context of the Wilson’s square root formula.)
94 Competitive Supply Chains
An organization or information infrastructure must be maintained to receive and process the requirements. Second, there are economies of scale in transportation: a full truckload is cheaper than partial ship-ments. Hence, even if the retailer wishes to replenish what was sold on a given day, the supplier may not be willing to send an LTL truck to that outlet. Finally, there may be some sales incentives for purchasing in larger quantities. Given these (local) constraints, it may be more economical to simply batch orders.
Shortage gaming is another big driver of the bullwhip, plaguing par-ticularly electronics and toy manufacturers. For example, toy retailers, who achieve the biggest proportion of their annual sales during the Christmas season, tend to overstate their forecasts to ensure sufficient inventory for this vital sales season. This, in turn, sends an exaggerated signal to manufacturers, who may choose to (erroneously) increase pro-duction thinking that there is great market demand for their products.
Forward buying is a prevalent practice in the grocery industry, where margins are razor thin. Some studies point out that 80% of the transac-tions between manufacturers and distributors are done on a forward buying basis, where items are bought in advance of actual requirements to take advantage of reduced purchase prices. Since this inventory is pushed on to the channel ahead of the actual demand realization, the market picture is further distorted.
Demand forecast updating is also commonplace: the manufacturing department receives a demand forecast from the marketing depart-ment. Just to be on the safe side, they inflate the forecast by 10% before sending it to their suppliers. To be further on the safe side, the supplier revises the forecast upward by another 10%. As the updated forecast travels upstream along the supply chain, the figures that the last sup-plier sees are totally detached from the market realities that the marketing department tried to capture in their original forecast. Even the best Sales and Operations Planning (S&OP) processes appear to be incapable of stopping this second guessing.
In each of these cases, the local decision-maker has acted in an econom-ically rational fashion, managing his/her own risk, ultimately making a locally optimal decision. In the absence of a clear command-and-control structure, however, simply collating these locally optimal deci-sions together along the supply chain does not yield a globally optimal solution for the entire chain. Instead it leads to chaos, which is labelled as “the bullwhip phenomenon” by Procter and Gamble. The key chal-lenge is therefore to promote such collaborative practices that would minimize supply chain disruptions and maximize supply chain profits.

Value Capture: Aligning Supply Chain Partners 95
5.3 Achieving supply chain collaboration
As discussed in the previous chapter, Hewlett-Packard introduced the DeskJet printer two decades ago. Combining the quality of laser printers with the affordability of dot matrix printers, the product was a stellar success with sales volumes exceeding even the most optimistic forecasts around the world. There was, however, a simple problem. Based on the initial assessments of the market potential, HP had decided to dedicate a single production facility for manufacturing DeskJet printers. HP sales organizations around the world would send their forecasts to the single factory at Vancouver and the factory would produce the printers just-in-time based on these forecasts. But the forecasts were never accurate, leading into an inventory-service crisis. While one country was over-flowing with inventory, another one was experiencing severe shortages. A task force, that was put together to defuse the crisis, considered sev-eral options, including shipments through airfreight, a second factory, and higher levels of channel inventory. Ultimately, the postponement idea was adopted based on the calculations illustrated in Figure 4.3 of Chapter 4. Under postponement, the factory would produce and ship the hardware based on forecasts. The hardware would then be custom-ized upon the receipt of a customer order. To enable this postponement strategy, several modifications had to be made to the product and to the supply chain (think 3D-CE). The product design had to be modified so that the power unit could be taken out of the printer so as to enable plug and play. As for the supply chain, the loading of the software in the correct language as well as the final testing would be done in a field warehouse instead of the manufacturing site. While the cost-service trade-off associated with postponement was clearly quantified, the roll-out of the idea that necessitated the buy-in from all the stakeholders turned out to be a completely different challenge.
In their effort to launch the postponement initiative, when the task force visited the Engineering Department to ask for the modification of the product design, the engineers did not understand why they were being bothered. After all, they had done their job in creating one of the most successful products in HP history. Moreover, they did not have any time to allocate to the old product as they were working on the next generation of the DeskJet printer. In any case, this was a materials and information problem: Get the forecast right and have more flexibility in manufacturing, and the problem would be resolved.
When the task force visited the manufacturing site, the reaction was similar. It was not their fault since they were running a just-in-time

96 Competitive Supply Chains
(JIT) operation. If only they could receive the correct forecasts, they would ship the correct material at the right time. Moreover, one should be careful to do the final quality checks in the field as the company’s reputation rode on the performance of its products.
The logistics organization was equally reluctant. Their productivity was measured by the number of orders they filled each day. Under the postponement strategy, they would have to open each box, load the appropriate software, conduct the final tests, repack the product with all the required peripherals, and ship it. This would kill their productivity. If only manufacturing were a bit more agile!
Unfortunately, one cannot blame any of these departments for their reluctance to embrace the postponement strategy. They were given a task and a set of local performance metrics to assess whether they were doing the task properly. As rational decision-makers, these departments were indeed optimizing their own operations in a local fashion. They were not required to think about the impact of their local decisions on other stakeholders along the supply chain. They were not incentivized to do so. Why should they incur extra cost or walk the extra mile to make someone else a hero?
To achieve the elusive alignment, supply chain management (SCM) involves thinking like an engineer (“people are dumb but honest”) with a focus on streamlining processes and educating employees, and like an economist (“people are dishonest but smart”) with a focus on implementing the appropriate incentive structures. While a trust-based relationship is always advertised as the ultimate solution, trust has two very concrete dimensions in the SCM context: proof of concept and risks/benefits. Proof of concept is required to establish the capabilities of the parties aiming to construct a collaborative relationship. Risks and benefits represent the quantification of the potential losses and gains, respectively, that each party should expect from such a relationship over and above what exists in a transactional relationship. In short, the challenge is to devise incentive structures that would produce win–win situations.
This was the challenge undertaken by Barilla in rolling out a vendor-managed inventory (VMI) management initiative in Italy with its distributors serving the small independent supermarkets.2 In a con-servative and highly fragmented channel, which traditionally relied on product push strategies through special promotions, discounts, and sales force incentives, the logistics organization of Barilla tried to per-suade the distributors to adopt VMI. Under the new scheme, instead of placing a replenishment order, the distributor would simply report its

Value Capture: Aligning Supply Chain Partners 97
own sales data to Barilla, which would then automatically provide him with the right replenishment quantities. With its strong brand name and leading market position, Barilla never expected any resistance from the distributors, typically small family-owned businesses. Distributors, however, felt quite uncomfortable to report sales data to Barilla. They saw in VMI a potential threat of disintermediation in this supply chain. Some even proposed to sell the sales data to Barilla. Others took it personally telling Barilla to manage its own manufacturing operations and leave the distribution to them. They saw no additional economic benefits in the new scheme, but plenty of potential risks for themselves. To add insult to injury, Barilla’s own sales force did not believe that the company’s logistics department had the capability to run a VMI pro-gram. The rollout collapsed: Barilla was all dressed up but had no one to go dancing with.
It was not until Barilla generated a proof of concept through pilot runs at its own depots quantifying the potential benefits and risks of VMI, that dis-tributors started paying attention. According to these early results, the VMI initiative had mitigated the cost-service trade-off through a reduction of up to 50% in inventories concurrently with a significant increase in order fill rates. The distributors were then willing to adopt the VMI initiative once they were presented with some quantification of such risks and benefits.
In fact, the wide success of collaborative initiatives such as Efficient Consumer Response (ECR) and Collaborative Planning, Forecasting and Replenishment (CPFR) within the grocery industry is largely based on jointly agreed and adopted voluntary business standards that provide win–win solutions for all the stakeholders, including manufacturers, retailers, logistics service providers, and software vendors.3 Such practices are quite pragmatic as in the standardization of pallet sizes (drastically reducing the time trucks wait to be discharged at a retailer’s warehouse) or as in the adoption of a common data definitions and an Electronic Data Interchange (EDI) standard (eliminating the need to duplicate infrastruc-ture investments). Rolling out such initiatives by bringing all the parties on board, however, is still a long process. One therefore needs to con-struct an objective business case, which not only quantifies the potential risks and benefits of such collaborative practices but also incorporates adequate incentives for all parties to participate in such initiatives.
5.3.1 A simple framework to quantify the loss
To this end, let us assess the loss incurred in a supply chain in the absence of any collaboration through a simple supply chain model. Consider the following supply chain with a single manufacturer and

98 Competitive Supply Chains
a single retailer. As depicted in Figure 5.2, a single product is manufac-tured at the retailer and sold in the market through the retailer. As the base case, let us assume that this is a vertically integrated setting with both the manufacturer and the retailer belonging to the same firm.
The product demand in the market is uncertain. We reflect this uncer-tainty in my forecast by specifying an average demand level (m) as well as the volatility of demand expressed by its standard deviation (s). The product, which incurs a variable manufacturing cost of c €, can be sold in the market for a price of p € (with p>c). For the time being, let us ignore the fixed costs; as they will not affect the decision process, we will sweep them under the carpet for now. Once the optimal quantity has been determined, one can then check whether the expected profits are sufficiently high to cover such fixed costs. Given the lead times in the procurement of raw materials and in the production process, the firm has to commit to a certain production level, Q, before observing the actual demand. In other words, the optimal batch size to produce, Q*, must be determined before the market uncertainty is resolved.
In this setting, the firm is running two types of risk: risk of under-age and risk of overage. The underage risk is the risk of not producing a sufficient number of units, leading to lost sales, while the overage risk is the risk of producing too many units, ending with extra stock at the end of the selling season. The challenge is to produce the lot size that maximizes the expected profit before observing the actual demand. Equivalently, the challenge is to produce the lot size that minimizes the total supply–demand mismatch cost before observing the actual demand.
This problem is so pertinent that it has been given a name of its own: the newsvendor problem. As a newsvendor, you have to print a certain number of papers the night before so as to sell them the following day. If you print very few copies, you will lose sales; if you print too few copies, you may end up stuck with many unsold newspapers at the end of the day. For simplicity, let us also assume that yesterday’s papers are
Q*=?
DEMAND(m, s)
p mfg cost, c
Manufacturer Retailer
Figure 5.2 An integrated production–distribution system

Value Capture: Aligning Supply Chain Partners 99
worthless; hence, there is no salvage value. The newsvendor problem applies to all one-shot commitments before the associated uncertainty is resolved. The number of calendars to print for the following year, the amount of raw materials to procure for the upcoming production cycle, the level of capacity to invest in, and type of aircraft (number of seats) to assign to a certain route are all examples of the newsvendor problem.
The following story from the Straights Times4 further illustrates the pertinence of the challenge: “It has been dubbed SS Santa. And some have gone as far as to say Christmas in Europe might have to be cancelled if anything should happen to it. On Saturday, the world’s largest ship, the 390m-long Emma Maersk, arrived at Felixstowe, Suffolk, and discharged some 3,000 containers of Christmas goodies and other products.”
With a capacity of 11,000 containers, Emma Maersk was delivering on the 4th of November 9000 pairs of gym shoes, 12,800 MP3 players, 61,800 calendars, 5170 hand bags, 33,400 cocktail shakers, 11,500 TV sets, and 1,886,000 Christmas decorations, all to be sold during the hol-iday season. All this merchandise had been ordered and paid for before the demand could be observed. As a result, for some items, the actual demand will surpass the delivered quantity, while for others the unsold items would be deeply discounted in the hopes that someone would still buy them after the holidays are over.
As a side comment, note that Emma Maersk is no longer the world’s biggest container ship. MSC Oscar with a capacity of over 19,000 containers has been commissioned in 2015.
Returning to our problem, we need to determine the optimal lot size, Q*, the one that maximizes the expected profit. We follow a marginal analysis approach to solve the problem. Suppose that you have decided to produce Q units; should you produce one more unit, Q+1? In that case, you have to assess what happens to the additional unit. There are two possibilities: either the additional unit would sell (with probability that demand exceeds Q units, Prob{D>Q}) in which case the firm earns a margin of (p-c) € or the additional unit remains unsold (with probability that demand is no more than Q units, Prob{D≤Q}) in which case the firm has to absorb the variable manufacturing cost, c€. These outcomes are summarized in the decision tree of Figure 5.3.
The rule of thumb is to continue producing more units as long as the expected payoff from that additional unit exceeds the expected loss. In other words, continue producing as long as
[( p-c) * Prob{D>Q}] − [c * Prob{D≤Q}] > 0.

100 Competitive Supply Chains
Pushing this rule of thumb to its logical limit tells us to stop as soon as the expected payoff equals the expected loss, which yields the opti-mal production quantity, Q*. To obtain the optimal lot size, we note that the above equation reduces to
Prob{D≤Q}] = ( p−c)/p.
Technically, the quantity (p−c)/p represents the critical fractile of the demand distribution, which allows us to compute the optimal lot size, Q*. For example, if one assumes that the demand process follows a normal distribution with mean, m, and standard deviation, s, then the Excel function NORMINV can be used to obtain the optimal quantity:
Q* = NORMINV [( p−c)/p, m, s,].
Note that the optimal quantity that maximizes the expected profit depends on the average demand, the volatility of the demand, and the financial risk associated with the demand–supply mismatch.
Consider a specific example. Suppose that you would like to bake and sell croissants. You have to get up at 5 a.m. to bake a batch of croissants. Past experience shows that your daily sales are distributed normally with a mean of 500 and a standard deviation of 100. You can bake a single croissant for 20 cents and sell it for 1 euro. The question is therefore to determine your optimal batch size, that is, the quantity that maximizes your daily expected profit. Following the above logic, I compute:
Q* = NORMINV[(1.00−0.20)/1.00, 500, 100] = 584.
Figure 5.3 Decision tree for the Newsvendor problem
Q
Q+1
Q
sale
no sale
p – c
c

Value Capture: Aligning Supply Chain Partners 101
This is the optimal quantity for the entire “production–distribution” system. Let us now embellish our base model shown in Figure 5.2. Suppose that we no longer have a vertically integrated setting, but an independent manufacturer (e.g., a baker) and an independent retailer. The retailer places orders with the manufacturer. The manufacturer pro-duces exactly the quantity ordered by the retailer and delivers it to him, who will later sell them in the market. In other words, the newsvendor problem is solved exclusively by the retailer who will fully bear the demand–supply mismatch risk. Further note that the retailer does not necessarily know the manufacturer’s variable production cost (c €); this is private information. Instead, the retailer knows the wholesale price, w €, published by the manufacturer. The new scenario is summarized in Figure 5.4, where we need to determine the optimal order quantity for the retailer.
The retailer applies the newsvendor logic to solve the problem, as illustrated in Figure 5.5.
Figure 5.4 A decentralized production–distribution system
Q*=?
DEMAND(m, s)
p(manufacturing cost, c )wholesale price, w
Manufacturer Retailer
Figure 5.5 Decision tree for the retailer
Q
Q+1
Q
sale
no sale
p – w
w

102 Competitive Supply Chains
The optimal order quantity for the retailer is therefore given by
Q* = NORMINV [( p−w)/p, m, s,].
Note that the only difference between the two scenarios is the replace-ment of the variable production cost, c, by the wholesale price, w, in the critical fractile. Returning to our example, suppose that you are too tired after baking all the croissants at 5 a.m. and are looking for someone to sell them for you. You make the following proposal to a friend. She will decide on how many croissants she orders from you based on the available historical data. You will bake those crois-sants and sell them to her at a wholesale price of 80 cents; she can then sell them on the market for 1 euro each. She therefore needs to determine her optimal order quantity given the market demand and her own demand–supply mismatch risk. Her optimal order quantity is given by:
Q* = NORMINV[(1.00−0.80)/1.00, 500, 100] = 415.
Yet, you thought you had provided her with an attractive business proposal. What happened? You simply tried to capture the lion’s share of the supply chain profits while forcing her to fully carry the demand–supply mismatch risk. Upon considering her upside potential (1.00–0.80=0.20 euros of margin) and downside risk (0.80 euros of wholesale purchase price), she took a very rational decision and ordered only 415 croissants—even less than the expected demand. Who lost as a result of her economically rational decision? Everyone. In your quest to hijack the supply chain profits, you hurt everyone: the retailer could have sold more, but, given the risk, she chose not to order even the average demand. You, the manufacturer, could have sold more, but did not get the orders. Given that both parties end up getting hurt, I refer to this phenomenon as double marginalization. As a result, the entire market pie (i.e., the total value created) got smaller. Note that the customer suffers as well since there will be a higher level of stock-outs in this decentralized setting.
This is the direct consequence of the lack of collaboration in the sup-ply chain: double marginalization, which implies that profits shrink for all involved parties. How can we then restore the profits to the level of a centralized system without having to actually vertically integrate? This is possible only by allowing returns to supply chain partners that are commensurate with the risk they carry.

Value Capture: Aligning Supply Chain Partners 103
5.3.2 Promoting collaboration
While working toward a long-term trust-based relationship, one can design and implement contractable incentives. These are incentives that can be observed, verified, and enforced. They include:
• Quantity discounts• Buyback schemes• Two-part tariffs (selling at cost plus charging a flat fee)• Revenue or cost sharing• Volume guarantees• Multi-year business guarantees• Joint marketing initiatives
These schemes and their variants are easy-to-implement mechanisms to align the divergent priorities of the supply chain partners. For example, offering quantity discounts is equivalent, for a manufacturer, to pub-lishing a matrix of wholesale prices. A buyback scheme is a risk-sharing initiative that enables the retailer to return to the manufacturer unsold units at the end of the selling season. Consider the above example where the manufacturer pledges to accept returns at the end of the sea-son at a buyback price of b €. The resulting scenario is summarized in Figure 5.6 with the corresponding decision tree shown in Figure 5.7. To make the scenario more concrete, suppose that you agree to buy back the unsold croissants for 0.50€. What is her optimal order quantity under the buyback scheme? The optimal quantity is given by:
Q* = NORMINV [(p−w)/(p−b), m, s,].
Q* = NORMINV [0.40, 500, 100] = 475.
Q*=?
DEMAND(m, s)
p(manufacturing cost, c )wholesale price, w buyback price, b
Manufacturer Retailer
Figure 5.6 A decentralized production–distribution system with buyback

104 Competitive Supply Chains
This is still far from the original (centralized) optimal quantity of 585, but the optimal quantity is moving in the right direction; coordination is working! This quick calculation shows that a buyback policy makes perfect mathematical sense. Does it, however, make any business sense? Why would a manufacturer want to buy back his products? There are several business reasons for that. First, it is a strong signal to the retailer that the manufacturer is sharing some of the demand–supply mismatch risk. In so doing, he would be encouraging the retailer to order more, thereby increasing the size of the market pie. Second, the manufacturer may have better alternatives than the retailer for salvaging the unsold units. He may have access to other channels. He may be able to recycle or remanufacture the product. Finally, he may not wish the retailer to discount the products deeply. A designer would rather take back his styl-ish handbags rather than witness the retailer offering deep discounts on them in a desperate attempt to liquidate the left-over stock; that would deeply hurt the designer’s image.
One quick way to restore the centralized profits would be for the manufacturer to sell at cost, that is, to set w = c. While this would math-ematically resolve the issue (i.e., restore the system profit to the original level), it makes no business sense for two reasons. First, in this setting, all the supply chain profits are transferred to (captured by) the retailer. Second, the manufacturer receives nothing, which makes it impossible for him to cover his fixed costs, hence stay in business. One way to get around this problem is to use what economists call a two-part tariff: selling at cost plus imposing a flat fee. Most franchising arrangements follow this practice. Suppose that you operate in a hamburger chain. To sell French fries, you purchase a bag of potatoes from the parent com-pany at cost. At the end of the year, however, you write a check, the franchising fee, to the parent company to cover his costs.
Revenue sharing may also represent a coordinating contract, as illus-trated by the following example. The second largest source of revenue for movie studios in the United States turns out to be movie rentals. Hence, once a film completes its primary run in the movie theaters, the studio produces DVDs and sells them to video rental shops. Until a few years ago, such DVDs were priced quite high, making it virtually impos-sible for the rental shops to make any profit unless they rented the DVD out numerous times. This practice ultimately led to double marginaliza-tion. Under the current scheme, the movie studios have drastically cut their sales prices, encouraging the rental shops to order a large number of DVDs to rent out. At the end of the year, however, the studios claim 45% of the rental profits.5

Value Capture: Aligning Supply Chain Partners 105
These initiatives aim at distributing risks and rewards among the sup-ply chain partners in an equitable fashion. While they are necessary for promoting collaboration, they may not—in and of themselves—be sufficient. Suppose that you are a bicycle manufacturer and you offer your retailer a buyback program. Suppose further that the retailer also carries bicycles from another manufacturer that does not offer buyback. It is the last week of August, the last few days of the sales season. Whose products would you expect the retailer to push for sale? Your competi-tor’s bikes, of course, as you have provided him with a safety net. One should therefore design the incentives carefully. For example, the buy-back scheme would kick in once the retailer has achieved a certain sales volume.
5.4 Collaboration in practice
Collaboration is enabled by sharing information, resources, profits, and risk. Although the ultimate goal in supply chain collaboration is to achieve a win–win proposition for all participating members, there is often a large discrepancy between the potential and the practice. There are no guidelines or standard protocols to manage and control the col-laborative efforts of the partners. Trust is an important element in a collaborative relationship but might take a backseat when precedence is given to a company’s revenue making goal. Furthermore, trust cannot be built overnight; it is achieved after a lengthy process of quantifying the risks and the benefits as well as assessing the capabilities of the part-ners, as was illustrated by the Barilla example.
Figure 5.7 Decision tree for the retailer
Q
Q+1
Q
sale
no sale
p – w
w – b

106 Competitive Supply Chains
While the virtues of collaboration among partners comprising the supply network are constantly promoted in trade press, in seminars, in textbooks, and in classrooms, there exist very few successful examples of supply chain collaboration. The battle between Amazon and the publisher Hachette is still fresh in everyone’s mind.6 This is in part because collabora-tive practices are only achieved through explicit and persistent infrastruc-ture investments in design, organizational structures, and technology.
I conducted a survey to identify the current practices and initiatives aimed at creating such an organizational and technological infrastruc-ture to facilitate collaboration among the players in a supply network, and assess the cost and benefits of such practices to each of the players.
The survey was composed of six parts:
• Company characteristics, reflecting the organization’s key param-eters such as its products, markets, size, and financial performance.
• Supply chain design, reflecting the sourcing relationships with the upstream players.
• Channel management, reflecting the distribution relationships with the downstream players.
• Logistics management, reflecting the logistics practices within the organization.
• Process management, reflecting the process characteristics with a view of the organization’s operational flexibility.
• Technology deployment, reflecting the organization’s investments and use of infrastructure technologies.
5.4.1 Company characteristics
The participants in the survey span a wide range of sectors, including:
• Agriculture• Apparel and footwear• Chemicals• Consumer electronics• Eye care• Fast-moving consumer goods• Information technology• Medical devices• Precision metal products• Precision plastic components• Retail• Steel making

Value Capture: Aligning Supply Chain Partners 107
The annual turnover of the companies in our sample varies from a mini-mum of 4.47 million euros to a maximum of 3766 million euros. Their cash-to-cash cycle ranges from 14 days minimum to 288 days maximum. The average product life cycle over all the sectors is approximately 12 years, ranging from half a year to 100 years. From a value-based manage-ment perspective, companies report an average of 12% for Return on Capital Employed (ROCE) (with a maximum of 23%) or 11.2% for return on net assets (RONA) (with a maximum of 20%). The breakdown of supply chain costs as a percentage of total landed cost is presented in Table 5.1.
5.4.2 Supply chain design
The current supply base management practices are reflected in Table 5.2, where companies report a maximum of 75% of dual sourcing. Companies, on average, certify 45.7% of their suppliers and only 18.7% of them have developmental programs with them. Joint initiatives account for 25% on average. Only 5% of the suppliers have access to the compa-nies’ planning and control system. The average value of all the contract terms also seems to be very low: only 5% of the respondents use VMI, while only 21% receive deliveries on a JIT basis. On average, 15% of the procurement occurs through the web.
Supplier relations are managed through “traditional” contract terms including quantity discounts, convenient payment terms, price protec-tion, and multi-year commitments. Policies promoting further align-ment such as cost sharing, profit sharing, two-part tariff, or buyback policies are not yet as popular.
5.4.3 Channel management
Table 5.3 summarizes current practices in the downstream channel. Material flows are mainly triggered through a direct order by channel partners; only a very small percentage is attributable to continuous replenishment, short-term forecasts. There is no joint forecast in this
Table 5.1 Supply chain costs
SUPPLY CHAIN COSTS AVG
• Inbound Logistics 9.3%• Raw Materials and Components 46.2%• Manufacturing and Assembly 30.1%• Warehousing 6.3%• Outbound Logistics 8.1%

108 Competitive Supply Chains
Table 5.2 Characteristics of the supply base
SOURCING MIN AVG MAX
SINGLE 0% 57% 100%DUAL 0% 25% 75%CERTIFICATION (AVG) 45.7%DEVL PROG 0% 18% 90%JOINT INITIATIVES 0% 25% 100%ORDER TRIGGERS• direct order 15% 48% 100%• continuous replenishment 0% 48% 60%• short-term forecast 0% 48% 70%• customer’s orders 0% 40% 60%• joint forecast 0% 30% 37%• Other 0% 2.5% 25%
ACCESS TO PLANNING 0% 14% 100%
VMI 0% 5% 30%
CONTRACT TERMS (MIN, MAX, AVG FOR EACH CATEGORY)
• Quantity discounts 0% 34% 100%• Convenient payment terms 0% 43% 90%• Price protection 0% 41% 100%• Consignment stocks 0% 2% 10%• Buyback policies 0% 1% 20%• Profit sharing 0% 0% 5%• Cost sharing 0% 5% 50%• Two-part tariff (at cost + flat fee) 0% 4% 30%• Volume guarantees 0% 14% 100%• Multi-year commitment 0% 23% 100%• Other 0% 1% 10%
case. On average, 35% of deliveries are done on a JIT basis; VMI is used only by 7% of the respondents.
Only 10.3% of the channel partners have access to the planning and control system of their partners. 19.5% of the companies report joint marketing initiatives. Quantity discounts seem to be the most favored policy along with convenient payment terms.
In addition to traditional contract terms such as quantity discounts, convenient payment terms, multi-year, or volume guarantees, more progressive alignment policies such as buyback, consignment, or cost sharing have started taking root in the relationships with the channel members.

Value Capture: Aligning Supply Chain Partners 109
5.4.4 Logistics management
From Table 5.4, it can be seen that all the companies use external logistics providers for outbound transportation, whereas 80% of the companies use them for inbound transportation as well. However, none of the companies use the external service providers for order entry and customer services, making sure that direct customer contact is not lost. Most of the companies have “cost sharing” relationship with their partners.
5.4.5 Process management
Table 5.5 summarizes some key process characteristics. Production schedules are revised at least once a month and at most every day of the month. Average Customer Order Lead Time is approximately nine days. The average inventory level for the raw materials is the highest with approximately 18 days, while that for the WIP is nine days and for the finished goods is 12.5 days.
Table 5.3 Channel relationships
CHANNEL MIN AVG MAX
ORDER TRIGGERS • their direct order 0% 75% 100%• continuous replenishment 0% 11% 80%• their short-term forecast 0% 7% 50%• their customer’s orders 0% 6% 50%• joint forecast 0% 1% 10%• Other 0% 0% 0%
ACCESS TO PLANNING 0% 6.3% 100%
JOINT MKTG 0% 19.5% 60%
POST SALES SUPPORT 0% 38.6% 100%
CONTRACT TERMS
• Quantity discounts 0% 40.3% 100%• Convenient payment terms 0% 41% 100%• Price protection 0% 21.8% 100%• Consignment stocks 0% 11.4% 75%• Buyback policies 0% 13.5% 90%• Profit sharing 0% 1.5% 20%• Cost sharing 0% 10% 80%• Two-part tariff (at cost + flat fee) 0% 1% 10%• Volume guarantees 0% 23.3% 100%• Multi-year commitment 0% 21.4% 100%• Other 0% 2% 20%
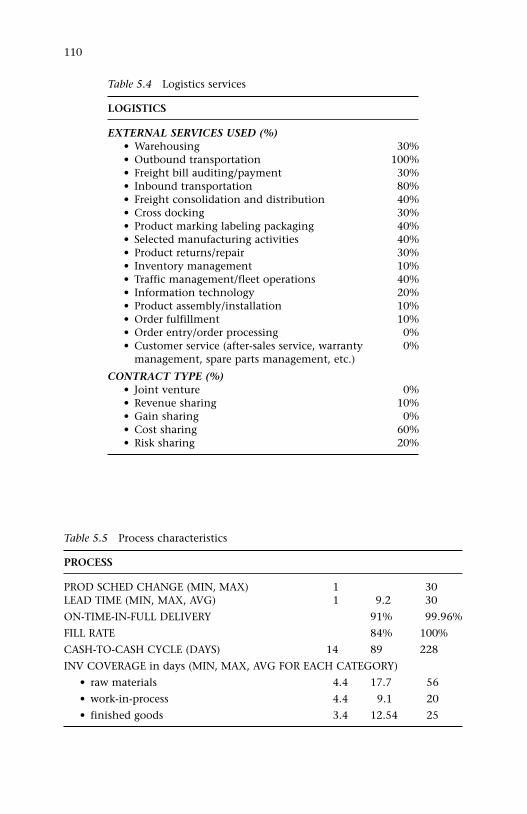
110
Table 5.4 Logistics services
LOGISTICS
EXTERNAL SERVICES USED (%)• Warehousing 30%• Outbound transportation 100%• Freight bill auditing/payment 30%• Inbound transportation 80%• Freight consolidation and distribution 40%• Cross docking 30%• Product marking labeling packaging 40%• Selected manufacturing activities 40%• Product returns/repair 30%• Inventory management 10%• Traffic management/fleet operations 40%• Information technology 20%• Product assembly/installation 10%• Order fulfillment 10%• Order entry/order processing 0%• Customer service (after-sales service, warranty
management, spare parts management, etc.)0%
CONTRACT TYPE (%)• Joint venture 0%• Revenue sharing 10%• Gain sharing 0%• Cost sharing 60%• Risk sharing 20%
Table 5.5 Process characteristics
PROCESS
PROD SCHED CHANGE (MIN, MAX) 1 30LEAD TIME (MIN, MAX, AVG) 1 9.2 30
ON-TIME-IN-FULL DELIVERY 91% 99.96%
FILL RATE 84% 100%
CASH-TO-CASH CYCLE (DAYS) 14 89 228
INV COVERAGE in days (MIN, MAX, AVG FOR EACH CATEGORY)
• raw materials 4.4 17.7 56
• work-in-process 4.4 9.1 20
• finished goods 3.4 12.54 25

Value Capture: Aligning Supply Chain Partners 111
The on-time-in-full delivery performance is on average 91% with a maximum of 99.96%, while fill rates hover around 84% with a maxi-mum of 100%. The cash-to-cash cycle is 89 days on average with a minimum of 14 days and a maximum of 228 days.
5.4.6 Information technology
SCM is an information-intensive process. It is therefore natural that companies in my sample invest up to 4% of their annual sales in IT.
IT MIN AVG MAX
IT SPEND 0.40% 1.85% 4.00%
On the software side, the emphasis has shifted on planning tools as well as more advanced web-based technologies once the Y2K craze had blown over. The percentage of companies that deploy the different IT solutions is as follows:
EDI – 70%ERP – 90%Supply chain planning – 70%E Procurement – 60%CRM – 40%Web Services – 80%
These systems are used by 17% to 54% of the total workforce.
5.5 Contracting in the early stages of a product’s lifecycle
We have seen that incentive design is a non-trivial activity. Incentive design becomes an even bigger challenge when contracting must be done in the early stages of a product’s life cycle. For a concrete illustra-tion, let us anchor our discussion in the pharmaceutical industry, which has undergone several significant changes over the past decade. First and foremost, while the United States, the European Union, and Japan remain the largest markets, growth comes from the emerging markets as reflected in Figure 5.8.
Second, blockbuster drugs are becoming harder to come by. In fact, there is a significant shift from the traditional chemical synthesis-based

112 Competitive Supply Chains
Figure 5.8 Emerging markets for pharmaceuticals (Huybrecht et al., 2012)
160
140
120
100
80
60
40
20
02008
19
19
11
11
10
107
$90B
$155-185B
10-20
15-25
15-25
15-25
12-22
22-32
65-75
2013(f)
CAGR 2008–2013:~13–16%
All of the “pharmerging” markets will continue to showsignificant growth in the next years
2008–2013
Russia* 14-17%
South Korea 7-10%
India 11-14%
Turkey 11-14%
Mexico 4-7%
Brazil 7-10%
China 20-33%
pharmaceuticals toward biologicals (vaccines, blood products, and biotherapeutics) with drastically different research, production, and delivery requirements. These are summarized in Table 5.6. Most of the traditional pharmaceutical organizations, however, do not have the necessary capabilities to compete in the world of biologicals. As a result, all of the large pharmaceutical companies are acquiring or investing in biotech companies to increase their presence in biologicals, where the expected growth is spectacular: over the next few years, 50% of the top 100 molecules are projected to contain biologicals.
Finally, there is an increased level of strategic outsourcing in an effort to establish a truly global presence and geographically diversified business based on a highly diversified portfolio. As illustrated in Figure 5.9, outsourcing is observed at every stage of the product’s life cycle, including research (through biotech firms or academia), development (through Contract Research Organizations), manufacturing (through

Value Capture: Aligning Supply Chain Partners 113
Biotech PE
Med-techAcademia
PharmaOwnership
30% 51%
PartnerOwnership
70% 49%
0%
100%
0%
100%
50%
50%
CRO CMO LogisticsProvider CSO
Research Development Manufacturing Distribution M&S
Figure 5.9 Strategic outsourcing in the pharmaceutical supply chain
Table 5.6 New requirements in pharmaceuticals
Pharmaceutical Biotechnology
Discovery Chemical synthesis and biological extracts
Design, modify, and synthesize biological compounds
Molecule size Small LargeDelivery Oral (tablets, capsules),
Injectable (sterile), topical
Injectable (sterile), skin patches, inhalation Targeted application (specific cells)
General applicationManufacturing Chemical processes Biological processesValue ($/g) ~$s $100 – $1000+
Contract Manufacturing Organizations), distribution (through Third-Party Logistics (3PLs)), and marketing and sales (through Contract Sales Organizations). Further details on these trends can be found in Huybrecht et al. (2012).
For the sake of illustration of the difficulties in contracting in the early stages of a product’s life cycle, consider the scenario where a pharma-ceutical organization (P) is trying to collaborate with a biotech (B). The latter organization has a promising biological that is still in the research and development phase. The former organization has the capability of conducting clinical trials, manufacturing, marketing, and distributing the product once it receives the necessary approvals from the healthcare authorities.

114 Competitive Supply Chains
To simplify the analysis, assume that there are two levels of effort each organization can invest into making this product successful in the marketplace. The biotech can invest either $10M (in monetary resources, manpower, etc.) or $5M. Similarly, the pharmaceutical com-pany can make a sizeable investment ($10M) or a relatively modest investment ($5M) to promote the product. Based on the level of effort invested into the project by the two parties, the expected revenues are shown in the following payoff matrix:
Pharma (P)
$10M $5MBiotech (B) $10M $30M $23M
$5M $23M $15M
In particular, if both parties invest their maximum effort (i.e., $10M), the expected revenues would be $30M, whereas if both parties invest modestly (i.e., $5M), the expected revenues would be $15M. The chal-lenge then is to devise a revenue-sharing contract that would incen-tivize both parties to invest at a significant level. It turns out that no revenue-sharing contract that achieves the highest revenue can be built. Imagine, for example, that the parties signed a 50–50 revenue sharing contract. The resulting (expected) payoff matrix is given by:
Pharma (P)
$10M $5M
Biotech (B) $10M $5M$5M
$6.5M$1.5M
$5M $1.5M$6.5M
$2.5M$2.5M
If the biotech invests $10M, the pharma would be better off investing only $5M, collecting a net revenue of $6.5M rather than $5M. Similarly, if the biotech invests $5M, once again the pharma is better off investing only $5M. Hence, regardless of what the biotech invests, the pharma is always better off investing only $5M. On the other hand, if the pharma invests $10M, the biotech is better off investing $5M, collecting a net

Value Capture: Aligning Supply Chain Partners 115
revenue of $6.5M rather than $5M. Similarly, if the pharma invests $5M, the biotech is once again better off investing $5M. Hence, regard-less of what the pharma invests, the biotech is always better off invest-ing only $5M. This level of modest investment is certainly sub-optimal, leading to expected total revenues of $15M, whereas significant invest-ment from both parties would have led to the supply chain optimal payoff of $30M.
I therefore conclude that revenue sharing contracts fail to coordinate the supply chain in that they fail to achieve the best possible solution. Other incentive mechanisms are therefore required. For example, a contract whereby the biotech receives a one-time payment of $12.5M, leaving all the generated revenue to the pharma (hence, a payoff of revenue—$12.5), leads to a better (but not optimal) overall outcome. In practice, one observes various licensing arrangements and milestone payments to achieve a better overall outcome. The interested reader is referred to Bhattacharya et al. (2014).
5.6 Summary
• The key challenge in modern supply chains is the coordination of the players in the ecosystem without the presence of a clear command-and-control structure. The lack of coordination contrib-utes to the bullwhip phenomenon driven by delays and distortions in material and information flows, respectively.
• The bullwhip phenomenon is driven by delays in information and material flows as well as by information distortions. Transparency and agility are therefore the key remedies for mitigating the bullwhip.
• Good SCM involves thinking like an engineer (“people are dumb but honest”) with a focus on streamlining processes and educating employees, and like an economist (“people are dishonest but smart”) with a focus on implementing the appropriate incentive structures. While a trust-based relationship is always advertised as the ultimate solution, the challenge is to devise incentive structures that would produce win–win situations.
• The deployment of such incentives remains limited.
116
6.1 Introduction
The 1986 Annual Report of the Digital Equipment Corporation (DEC) was setting an ambitious goal: “Our goal is to connect all parts of an organization—the office, the factory floor, the laboratory, the engi-neering department—from desktop to data center. We can connect everything within a building; we can connect a group of buildings on the same site or at remote sites; we can connect an entire organization around the world. We propose to connect a company from top to bot-tom with a single network that includes the shipping clerk, the secretary, the manager, the vice president, even the president.1” More importantly, this goal was not based on some “vaporware” but on a concrete enabling technology, namely a new generation of super minicomputers based on a single computer architecture, VAX. From small desktop machines to computer clusters, VAX-based machines would be fully compatible, use a uniform operating system, and communicate across shared networks.
While DEC was working on the hardware, the operating system, and the infrastructure, a relatively young German company, SAP AG, was taking on a big gamble by transitioning its mainframe-based Enterprise Resource Planning (ERP) software, the R/2, into the client-server architecture, the R/3, making the software accessible to thousands of organizations that did not necessarily want to invest in mainframe computers.
However, it has taken almost two decades during which the comput-ing power has tremendously increased and the Internet has become ubiquitous for DEC’s 1986 vision of creating a networked organization to become a reality. In fact, scholars of strategic management increas-ingly recognize that the source of value creation may lie in networks of
6Impact of Technology on SCM: A Brief History of IT for SCM

Impact of Technology on SCM 117
firms (Dyer and Nobeoka 2000, Gulati et al. 2000). Amit and Zott (2001) further build on this line of thinking by suggesting that value is created by the way in which transactions are enabled. Enabling such transac-tions requires a network of capabilities drawn from multiple stakehold-ers such as customers, suppliers, and complementors.
Information plays a crucial role in enabling transactions in supply chains. Creating an adequate information infrastructure to interface the members of a supply network has always been challenging. Such an infrastructure must be able to satisfy simultaneously the following needs (Upton and McAfee 1996): first, it must be able to accommodate mem-bers with varying degrees of IT sophistication. Second, it must provide a wide range of functionality ranging from simple data transmission to capability of accessing remote applications. Finally, it must be able to accommodate a constantly changing ecosystem of suppliers and customers within varying stages of relationships.
In a recent workshop, supply chain professionals highlighted four shortcomings in current ERP systems2: (1) extended enterprise (EE) functionality, (2) flexibility in adapting to changes in the environment, (3) more advanced decision support functionality, and (4) lack of (web-enabled) modularity. While Internet-based technologies enable the management of a portfolio of relationships in an effective and efficient manner by drastically reducing transaction costs, the cost of establish-ing such relationships remains. Furthermore, while the developments in the computing and telecommunications industries made the transfer of information almost instantaneous, manufacturing, warehousing, and distribution technologies could not accelerate the movement of mate-rial to such phenomenal levels. The coordination of information, cash, and material flows has thus assumed increased importance for effective supply chain management (SCM).
The transition from the mainframe to the client-server architecture was the key technological breakthrough that unleashed the first ERP revolution. The adoption of the Service Oriented Architecture (SOA) is triggering the second wave by enabling the dynamic reconfiguration of supply chains, making them readily adaptable to changing business models, growing competition and globalization, tighter regulations, and increased mergers and acquisition activities.
The enabling technology is web services. A web service is a self-contained, self-describing piece of application functionality that can be found and accessed by other applications using open standards. By using highly standardized interfaces to hide the implementation of the underlying functionality, web services enable interoperability

118 Competitive Supply Chains
and compatibility among various heterogeneous applications. In fact, ERP vendors are extending web services standards and SOA principles to develop composite applications to support new business processes or scenarios. For example, SAP’s Enterprise Services Architecture (ESA) aggregates web services into business-level enterprise services, providing more meaningful building blocks for the task of dynamically adapting the IT infrastructure to evolving business conditions. Under a pro-gram of business continuity, Cisco has the capability of dynamically reconfiguring its supply chain in response to a disruption at a given node (say, a supplier).3 Li & Fung is famous for configuring a new supply chain from scratch for each new customer program.4
In this chapter, I review the impact of the ERP revolution, the Internet, and other web-based technologies on supply chain strate-gies. While the impact of the information technology on supply chain coordination has been undeniably positive, some reservations remain regarding its impact on supply chain design. The remainder of the chapter is organized as follows. Section 2 briefly introduces key trends in SCM. Section 3 illustrates the role of IT in SCM and IT’s ability in keeping up with these trends. Section 4 discusses the challenges of dynamic supply chain design. Section 5 concludes the chapter with practical guidelines.
6.2 Key trends in SCM
Akkermans et al. (2003) report a ranked list of key SCM trends generated by a group of European SCM professionals. As summarized in Table 6.1, the panel of experts sees further integration of activities between sup-pliers and customers across the entire chain as one of the three biggest trends in SCM. This view coincides with a strong trend toward mass cus-tomization. Both trends may have a similar root cause, that is, increased competition driven by growing consumer power helped by an increas-ing transparency of the global market place. Rapidly changing customer requirements not only tolerate very little inventory in the supply chain but also require drastic modifications in supply chain topologies. This requirement poses a tough challenge to ERP systems for maintaining sufficient flexibility as supply chain needs keep evolving.
SCM experts recognize the difficulty of a single organization in satis-fying the changing requirements of consumers. They expect that supply chains will consist of several enterprises and that non-core activities such as physical distribution and facilities and administration (F&A)will be increasingly outsourced. An important issue for the panel then

Impact of Technology on SCM 119
Table 6.1 Key trends in supply chain management (Top 12 of 22)
Key issues in SCM % votes
1. Further integration of activities between suppliers and customers across the entire chain
87
2. How to maintain flexibility in ERP systems to deal with changing supply chain needs?
57
3. Mass customization: complex assortments, shorter cycle times, less inventory
39
4. Who will be in the driver’s seat in supply chain co-ordination? 35
5. Supply chains consisting of several enterprises 35
6. Full exchange of information with all the players in the chain 35
7. Further outsourcing of activities such as physical distribution, finance & administration
30
8. Enhancements of IT tools required to integrate the different parties in the supply chain
30
9. Globalization: how to build worldwide ERP systems? 26
10. Greater transparency of the global market place 26
11. Internet technology will be the backbone to connect systems of partners in the chain
26
12. Standardization of processes and information definitions, the rest is IT infrastructure
22
becomes the determination of who will be sitting in the “driver’s seat” in this chain, since conventional command-and-control structures no longer apply in a network of independent firms.
Greater and faster-changing demands from customers will need to lead to faster and more comprehensive information exchanges among all the players in the chain. In terms of technology, this will not just mean better ERP systems but, in general, enhanced IT tools to integrate the different parties in the supply chain. Internet, coupled with mobile technology, provides the technological means for doing so. This will make distributed architectures possible, in which standardization takes place mainly at the level of information definitions and processes, so that local flexibility in information usage can be maintained. Needless to say, all these develop-ments are taking place on a global scale. Hence, IT for SCM in general, and ERP systems in particular, will have to be developed on a global basis.
6.3 IT in supply chain coordination
Information is said to be the glue that holds supply chains together. In fact, the bullwhip phenomenon, the key challenge in supply chain

120 Competitive Supply Chains
coordination, is driven by delayed and distorted information as well as by transaction costs promoting local optimization (Lee et al. 1997). Information technologies (IT) have the greatest impact on supply chain coordination through the elimination of information delays and distortions, and through the reduction of transaction costs.
As indicated in the previous section, creating an adequate informa-tion infrastructure to interface the members of a supply chain has always been challenging. According to Upton and McAfee (1996), such an infrastructure must be able to deliver electronic connectivity: first, it must be able to accommodate members with varying degrees of IT sophistication. Second, it must provide a wide range of functionality ranging from simple data transmission to access for remote applica-tions. Finally, it must be able to accommodate a constantly changing pool of suppliers and customers within varying stages of relationships. Web EDI,5 on the other hand, moves the desired functionalities to the Internet, thereby eliminating costly investments that may be hard to justify to achieve connectivity.
Figure 6.1 depicts these three dimensions of electronic connectivity. The utility of potential infrastructure technologies can then be assessed by how well these technologies “fill the cube.” For example, electronic data interchange (EDI) has been the most widely used tool for connect-ing players in a supply chain such as manufacturers and their suppliers. From a functionality perspective, EDI affords simple data transmission
Figure 6.1 Upton and McAfee’s framework for electronic connectivity
1. Stage of relationship between any two companies
integrated collaborative exploratory
2. Lowest commondenominator of ITsophisticationamong partners
naive
experienced
3. L
evel
of f
unct
iona
litytelepresence/access
to applications
data access
simple datatransmission
Least Difficult
Most Difficult

Impact of Technology on SCM 121
under a particular file format over a dedicated communication channel. Rudimentary computer skills are required for maintaining EDI con-nectivity. Given the dedicated communications infrastructure and the proprietary standards, however, EDI necessitates significant up-front investment and considerable expense for maintenance. Such an invest-ment is difficult to justify at the early stages of a buyer–supplier relation, where the buyer is in the process of assessing supplier capability and, therefore, is unwilling to provide any long-term commitment.
Groupware extends the limited information transmission functional-ity of EDI into a (limited) collaborative platform. However, the required computer skills to take full advantage of groupware’s capabilities are even higher. Furthermore, groupware requires even a higher initial investment than EDI, which, once again, makes the tool more appro-priate at more advanced stages of a supply chain relationship. One can obtain further IT functionality by establishing a wide-area network. Such a platform can be used not only for information transmission but also for collaboration, and granting access to application programs, that is, telepresence, for the suppliers. Unfortunately, the increased function-ality comes at a higher level of initial investment. One can also envis-age such an infrastructure only among close partners along the supply chain. In summary, traditional technologies always entail a trade-off: improvements in one dimension (e.g., enhanced functionality) come at the expense of further complications in at least one of the other two dimensions (e.g., higher initial investments).
Recent developments, including Web 2.0, which emphasize user-generated content, usability and interoperability, and cloud comput-ing, represent significant steps in both functionality and affordability. Google Docs, SharePoint, or Amazon Web Services are among the most popular platforms to implement collaborative initiatives with little initial investment. In addition, QR codes and RFID tags facilitate the collection and communication of real-time data to render the analytics capabilities provided in these platforms significantly more attractive.
ERP systems, which arguably had the most significant impact on SCM, could not initially break this trade-off. On the functionality dimension, ERP systems offer the opportunity for unparalleled transparency across the organization, making a single database visible for all the (at least, internal) stakeholders. This visibility may, in turn, enable closer coop-eration. These capabilities, however, can be deployed through long and expensive implementation processes, which typically require advanced levels of IT sophistication. Furthermore, best-practice templates that often guide ERP implementations limit the scope of applicability of

122 Competitive Supply Chains
these systems to advanced stages of relationships among collaborating organizations. In short, ERP systems fail to fully “fill the cube” as well. This failure is discussed in further depth in the next section.
6.3.1 SCM shortcomings of current ERP systems
Akkermans et al. (2003) report that industry experts highlighted four shortcomings in ERP systems: (1) EE functionality, (2) flexibility in adapting to changes in the environment, (3) more advanced decision support functionality, and (4) lack of (web-enabled) modularity. These shortcomings are listed in Table 6.2 along with a pointer to the key SCM trends summarized in Table 6.1.
LACK OF EE FUNCTIONALITY
EE functionality entails the ability to share internal data efficiently with supply chain partners and to accommodate the data made available by the partners. Data sharing can be deployed either for operational decision-making or for calculating supply chain-wide performance measures. Moreover, EE functionality enables business processes to be distributed over multiple organizational entities. For instance, in a classical order capturing process, this would mean doing a distributed available-to-promise (ATP) check, delegating the credit check to a finan-cial service provider, and relying on a logistic service provider to be able to promise a specific delivery time window.
LACK OF FLEXIBILITY IN ADAPTING TO CHANGING SUPPLY CHAIN NEEDS
A single organization might have different types of relationships with its supplier and customer base. Its ERP system should be sufficiently flexible to accommodate a multitude of relationships. Some suppliers may have adopted vendor-managed inventories (VMI), while others may still be engaged in a classical vendor–buyer relation. The ERP system should be able to accommodate all these different modes of collaboration simul-taneously and be able to change efficiently from one mode to another. Gartner Institute emphasizes that the ability to engage into—and disen-gage from—collaborative relationships is of critical importance.
Another type of flexibility is the possibility to redesign business pro-cesses. Supply chain design is facilitated not only by a set of enabling information technologies but also by a set of new and/or redesigned processes. On the one hand, IT cannot enhance supply chain perfor-mance unless processes and organizational structures are redesigned. On the other hand, process re-engineering relies heavily on the use of IT to create innovative processes for enhancing supply chain performance.

123
Table 6.2 Shortcomings of current ERP systems for SCM
Shortcomings of current ERP systems mentioned, grouped by common threads
Key SCM trends from Table 6.1
1. Lack of extended enterprise functionality: the ability to support operations across multiple organizations• Extended enterprise functionality 1. (Integration)• Extended enterprise functionality 4. (Driver seat)• ERP systems miss linking across the boundaries
of enterprises7. (Transparency)
• ERP systems don’t interconnect easily with other than partner systems
7. (Transparency)
• Information exchange between parties is under developed
1. (Integration)
• Ability to support multiple coding systems to enable cross-company implementations
1. (Integration)
2. Lack of flexibility in adapting to ever-changing supply chain needs• Flexibility to adapt to changing business
models3. (Customization)
• Flexibility to adapt to changes in business processes
7. (Transparency)
3. Lack of more advanced supporting functionality beyond transaction management• Flow-based information exchange instead
of ordering-based1. (Integration)
• MRP-based instead of finite capacity; ERP+ required
1. (Integration)
• Advanced planning systems with proven functionality
3. (Customization)
• Connections with tactical decisions 4. (Driver seat)• From transactions to information for
decision support4. (Driver seat)
4. Lack of open, modular, Internet-like system architectures• Modular set of systems 4. (Driver seat)• Module manager for the supply chain 4. (Driver seat)• Connectivity 3. (Customization)• Web-enabled ERP 6. (Info exchange)
5. Various• IT (network technology, big, shared
databases, XML, …)6. (Info exchange)
• Customization will remain necessary 1. (Integration)• Identification of barriers and developing
business cases to overcome these6. (Info exchange)

124 Competitive Supply Chains
Here, ERP offers indeed a considerable opportunity: when implement-ing an ERP system, which will change the way people work, it seems logical to combine this effort with business process reengineering along the supply chain.
LACK OF ADVANCED DECISION SUPPORT CAPABILITIES
A recent trend in ERP is the emergence of Advanced Planning and Scheduling (APS) systems. In itself, planning with longer time horizons and across different business units is nothing new for ERP. However, as it becomes increasingly apparent that supply chains, rather than individual organizations, compete, there is an increasing demand for collaborative architectures in decision support software.
LACK OF OPEN, MODULAR SYSTEM ARCHITECTURE
Current ERP systems lack a modular, open, and Internet-like system architecture. Basically, this shortcoming is the reverse side of some of the generic advantages of ERP, whereby ERP was originally intended to replace a multitude of local legacy systems; a great deal of emphasis was therefore placed on its integrated architecture. In the new, networked economy, this former strength has rapidly become a weakness.
6.3.2 Web Services and Service-Oriented Architecture
The incorporation of web-based technologies into ERP systems not only addresses these shortcomings but also eliminates the electronic connec-tivity trade-off (Figure 6.1). TCP/IP provides a universal communication standard over the Internet for connecting diverse computer systems. A universal communication standard, in turn, significantly reduces the up-front investment needed to connect various players along the supply chain regardless of the type of hardware they possess. Low entry and exit costs make the Internet and web-based applications affordable at any stage of a supply chain relationship. Given the flexibility to custom-ize the interface over the web, one can customize the communication channels for each supplier. Web-based technologies also provide a full portfolio of functionality ranging from simple information transmis-sion to telepresence. Standardized interfaces and application develop-ment software make it easy even for the uninitiated to start using the system quickly, further reducing the lowest common denominator of IT sophistication among the supply chain entities.
In short, web-based technologies fi ll the cube. Wider acceptance of open standards, cheap and powerful computing, increased bandwidth, enhanced security, and accumulated expertise and higher familiarity

Impact of Technology on SCM 125
with the technology are bound to increase the utility of web-based tech-nologies in supply chain coordination. With increased connectivity, the web provides a virtually free platform for enhancing transparency, elim-inating information delays and distortions, and reducing transaction costs, ultimately mitigating the bullwhip phenomenon.
The transition from the mainframe to the client-server architecture was the key technological breakthrough that unleashed the first ERP revolution. The adoption of web services and the SOA holds the prom-ise of unleashing the second wave by enabling the dynamic reconfigura-tion of supply chains. The enabling technology is web services, which denote a group of technologies that allow business processes or informa-tion to be accessed over the Internet through application-to-application interaction (Moitra and Ganesh 2005). Web services are loosely coupled, dynamically bound, accessible over the Web, and standards based. In fact, the W3C Architecture Working Group defines web services as “software applications identified by a Universal Resource Indicator, whose interfaces and bindings are capable of being defined, described, and discovered as XML artifacts.” In layman’s terms, web services can be published, located, and invoked by other applications over the Internet, thereby integrating applications written in different languages and operating on disparate platforms.
A web service is thus a self-contained, self-describing piece of applica-tion functionality that can be found and accessed by other applications using open standards. A web service is self-contained in that the applica-tion using the web service does not have to depend on anything other than the service itself. It is self-describing in that all the information on how to use the service can be obtained from the service itself. The descrip-tions are centrally stored and accessible through web-standards-based mechanisms to all applications that wish to invoke the service. By using highly standardized interfaces to hide the implementation of the underlying functionality, web services enable interoperability and compatibility among various heterogeneous applications.
Web services make available open and standardized interfaces, allow-ing for the encapsulation and the componentization of software and applications. Hence, they enable easy configuration and reconfigura-tion of software applications. In other words, instead of requiring pro-grammers to establish and maintain links between applications, web services are loosely coupled, enhancing flexibility and promoting reuse. Changes can be made in the underlying implementation or in the pro-gram calling the web service as long as the behavior of the web service stays the same.

126 Competitive Supply Chains
The underlying philosophy behind web services is based on SOA. SOA would allow service providers (such as ERP vendors and their com-plementors) to publish services, which may be accessed by the service consumers (such as members of a supply network) resulting in a high degree of service reuse.
Consider, for example, the functionality “delete order” that may neces-sitate cross-application activities, including sending a confirmation to the customer, removing the order from the production plan, releasing materials allocated to the order, notifying the invoicing department, and changing the order status and deleting it from various systems. Instead of the hard wiring illustrated in Figure 6.2, each of these activi-ties may be a web service offered by different systems. The ability to build a complex end-to-end solution to cancel an order would be a pow-erful enterprise-level business service. Web services, however, are too granular to be used as efficient building blocks for enterprise business scenarios. In fact, ERP vendors are extending web services standards and SOA principles to develop composite applications to support new business processes or scenarios.
Over the past decade, the domain in which ERP systems have developed and deployed the most significant capabilities is advanced decision sup-port to fully exploit big data, a catch-all term that is used to describe the explosion of the available data in terms of its volume, variety, velocity,
Figure 6.2 Canceling an order in the three-tier client-server architecture
Presentation logic
Order cancellation process
Database
Userinterface
Userinterface
Userinterface
Userinterface
CRM
ERP SRM
ERP
CRM

Impact of Technology on SCM 127
variability, veracity, and complexity. The challenge with big data is therefore not limited only to its capture, storage, curation, search, visu-alization, protection, and sharing; it also includes efficient analysis of the data, that is, predictive analytics for supporting real-time decision-making. This is an extremely active domain in both methodology and technology. For example, SAP HANA converges database and application platform capabilities in-memory to transform transactions, analytics, text analy-sis, predictive and spatial processing to enable businesses to operate in real time. A high-level depiction is shown in Figure 6.3.
6.4 IT in supply chain design
The impact of web-based technologies is less convincing for supply chain design. I have discussed three-dimensional concurrent engineer-ing (3D-CE) as a novel framework for dynamically guiding supply chain design. As introduced by Fine (1998), 3D-CE encourages the simultaneous design of products, processes, and supply chains, and explicitly considers the interfaces among these three dimensions. Some of these interfaces are well understood. For instance, the DFx (e.g., design for manufacturability or design for localization) captures the interdependence of product and process design decisions (Stoll 1986).
Figure 6.3 SAP’s HANA platformSource: SAP.com.
DeveloperExperience
ApplicationServices
Mobile
Transactions Streaming Predictive Text MiningSpatial &GraphsAnalytics
Portal
Application Management Systems Management Administration & Monitoring
Analytics Collaboration Security Integration
EnablementServices
Native (HANA/XS) Open (JAVA)
SAP HANA AppServices
SAP HANA DBServices
SAP HANA Cloud Platform
Integrated

128 Competitive Supply Chains
Similarly, the interface between product and supply chain design is well understood by trying to match agile supply chains with innovative products and efficient supply chains with functional products (Fisher 1997). One of the key but less-well-understood interfaces in 3D-CE is between process design and supply chain design, where the principal decision is what to produce in-house and what to outsource. The out-sourcing decision, which is based on a company’s competitive capabili-ties, is thus based on a company’s needs for additional manufacturing capacity or for external capability (and/or technology). While a toy manufacturer like Mattel relies on outsourcing for additional capacity, a pharmaceutical company may rely on biotechs for biologicals.
To appreciate the impact of web-based technologies on the make-vs-buy decisions, hence, on the procurement process, consider Forrester’s B2B digital transaction models reproduced in Figure 6.4. Web-based technol-ogies enable different formats of relationships among potential buyers and vendors (Van Weele 2005). This is indeed consistent with my earlier assessment that the web provides a platform that simultaneously satis-fies all three dimensions of the electronic connectivity requirements (Figure 6.1), including the stage of relationship between any two com-panies, the lowest common denominator of IT sophistication among partners, and the desired level of functionality.
B
U
Y
E
R
S
SELLERSOne Many
Many AUCTIONIngram Micro
E-Chemicals
Poultry First
Fast Parts
AGGREGATORSSciQuest
Chemdex
PlasticNet
EXCHANGESE-Steel
Paper Exchange
One EDI/EXTRANET
Dell
Cisco
Walmart Retail Link
BIDDING
ProcurePort
Silent Auction Pro
OnSale
Figure 6.4 Business-to-business digital transaction models

Impact of Technology on SCM 129
At the one-to-one level, the web provides a platform for electronic col-laboration, as exemplified by the relationship between Walmart and its suppliers through Retail Link. Web-based technologies also offer alter-native transaction models for one-to-many and many-to-many environ-ments. In fact, the real power of the web-based technologies is in their ability to bring together a large number of buyers and sellers in frag-mented markets, creating electronic marketplaces. Malone et al. (1987) broadly define e-markets as information-technology-based governance or coordination mechanisms. According to Jupiter Communications, in 2004, e-markets produced an online transaction volume of $6 billion in the United States. Based on transaction cost theory, Malone et al. (1987) suggest that IT reduces transaction and coordination costs, and will therefore lead to an overall shift from hierarchical coordination to market coordination. In fact, total savings in web-based procure-ment can reach 13% to 28%. Most of these savings come from reduced costs of search (need identification 11%, vendor selection 27%, and vendor approval 23%) and coordination (order processing, billing, and payment processing 18%; tracking and logistics administration 21%).
E-markets then pose a dilemma for buyers and vendors. Most manufac-turers spent the past two decades establishing close relationships with their suppliers under such different initiatives as strategic sourcing and supply-based rationalization. E-markets, on the other hand, signal a dramatic shift toward an arm’s length relationship solely focusing on cost reduction. Within this shift, the promised transaction cost reductions associated with vendor selection and vendor approval necessitate closer scrutiny.
From this perspective, the items purchased by a manufacturer can be classified into two broad categories: manufacturing inputs (direct inputs), goods that go directly into a product or a process, and operating inputs (indirect inputs), usually referred to as MRO (maintenance, repair, and operations). While manufacturing inputs vary widely from industry to industry and hence purchased from industry-specific suppliers, MRO is not necessarily industry specific and can therefore be purchased from vendors serving many industries. Similarly, procurement practices can be classified under two broad categories: systematic sourcing, where long-term contracts are negotiated with pre-qualified suppliers, and spot sourcing, where an immediate need is fulfilled at the lowest possible cost perhaps from anonymous parties. Putting these two dimensions of what to purchase and how to purchase on a B2B matrix (Figure 6.5) offers some interesting insights (Kaplan and Sawhney 2000).
W.W. Grainger is a distributor of MRO supplies in the United States, offering over 200,000 products ranging from nuts and bolts to machine

130 Competitive Supply Chains
lubricants through its website. Such websites can be further extended into hubs with multiple suppliers greatly expanding the number of items offered. MRO hubs constitute an example where the Internet is ideally suited for eliminating the inefficiencies of the current channel by lowering transaction costs, integrating lower-tier suppliers, eliminat-ing the duplication of data entry, and expanding the product portfolio.
MRO procurement can be further extended by yield managers. While buyers are seeking further cost reductions, e-markets are providing the necessary IT infrastructure for conducting online auctions. For exam-ple, FreeMarkets6 has conducted some 30 “competitive bidding events” (CBE) for United Technologies (UTC) in 1999, totaling just under $250 million of purchase volume. UTC reports cost reductions of 10% to 70% on such diverse categories as rivets and studs, logistics services, telephone services, and tax preparation.
For manufacturing inputs, e-markets provide two key benefits. First, catalog hubs offer the possibility of bringing together a virtually unlim-ited number of offers from different suppliers on a global scale. Such an infrastructure would greatly reduce the search cost for the buyer. For the supplier—in particular, for the small supplier—the platform offers unparalleled access to potential buyers. This is indeed the first step in systematic sourcing. As for spot sourcing, web-based technologies pro-vide, for the first time, yield management capabilities for manufactured products. A manufacturer stuck with low capacity utilization in a par-ticular month can bid for orders to fill up its fixed production capacity or a buyer with an unexpected shortage of a manufacturing input can bid for the material available on the market in the same way airlines price their seats or hotels price their rooms (McAfee and McMillan 1987).
Unlike MRO procurement, however, manufacturing inputs are indus-try specific, where longer-term contracts are negotiated with specific,
Figure 6.5 Kaplan and Sawhney’s B2B trading matrix
Operating inputs Manufacturing inputs
Systematic sourcing
MRO HUBSwww.grainger.comwww.mro.com
CATALOG HUBSwww.chemconnect.comwww.plasticsnet.com
Spot sourcing YIELD MANAGERSwww.employease.comwww.capacityweb.com
EXCHANGESwww.e-steel.comwww.paperexchange.com
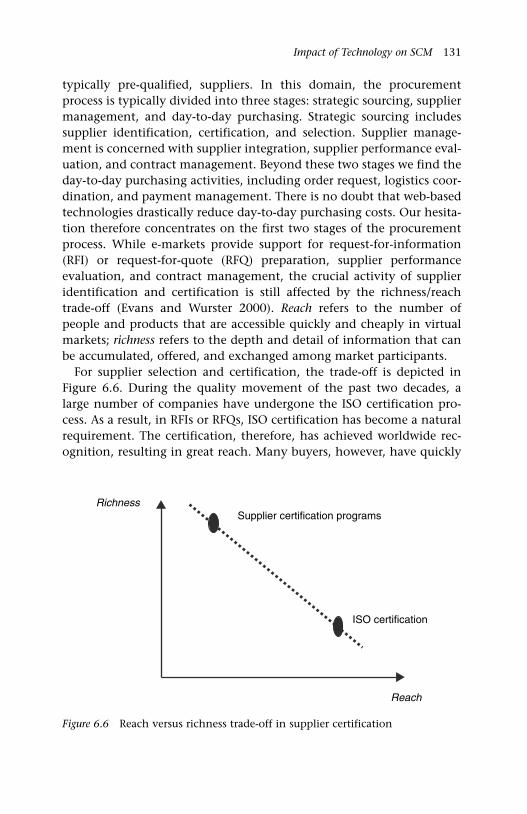
Impact of Technology on SCM 131
typically pre-qualified, suppliers. In this domain, the procurement process is typically divided into three stages: strategic sourcing, supplier management, and day-to-day purchasing. Strategic sourcing includes supplier identification, certification, and selection. Supplier manage-ment is concerned with supplier integration, supplier performance eval-uation, and contract management. Beyond these two stages we find the day-to-day purchasing activities, including order request, logistics coor-dination, and payment management. There is no doubt that web-based technologies drastically reduce day-to-day purchasing costs. Our hesita-tion therefore concentrates on the first two stages of the procurement process. While e-markets provide support for request-for-information (RFI) or request-for-quote (RFQ) preparation, supplier performance evaluation, and contract management, the crucial activity of supplier identification and certification is still affected by the richness/reach trade-off (Evans and Wurster 2000). Reach refers to the number of people and products that are accessible quickly and cheaply in virtual markets; richness refers to the depth and detail of information that can be accumulated, offered, and exchanged among market participants.
For supplier selection and certification, the trade-off is depicted in Figure 6.6. During the quality movement of the past two decades, a large number of companies have undergone the ISO certification pro-cess. As a result, in RFIs or RFQs, ISO certification has become a natural requirement. The certification, therefore, has achieved worldwide rec-ognition, resulting in great reach. Many buyers, however, have quickly
Figure 6.6 Reach versus richness trade-off in supplier certification
RichnessSupplier certification programs
ISO certification
Reach

132 Competitive Supply Chains
discovered that ISO certification is a necessary but not suffi cient assess-ment of process capability of a potential supplier. In the automotive and aerospace industries, in particular, manufacturers launched their own certification processes ensuring critical process capability at poten-tial suppliers. While these supplier certification programs possess the desired depth, they have limited reach due to their intensive resource requirements. In most cases, companies have been devising multi-year strategic sourcing programs to reduce and certify their supply base.
While web-based technologies greatly increase the reach, it is not evident whether they are currently providing the necessary richness for effective supplier selection—hence, the configuration of the supply chain. We observe two approaches to mitigate this trade-off. The mar-ket-making process heavily relies on preliminary fieldwork of identify-ing, assessing, and certifying suppliers prior to inviting them to join the CBE. There is also considerable effort in defining the “lots” for bidding to create a bundle of products and/or services that make sense from a manufacturing and logistics perspective. Hence, market makers, owners of e-markets, are becoming certifying bodies in the supplier selection process (or navigators in the supply space) with the same credibility challenge faced by previous certifying bodies. A second approach is the creation of vertical markets (or exchanges) managed by industry-specific professionals. Alternatively, incumbents opening a web-based channel do not face such a credibility challenge. For example, while ChemConnect brings together a large number of manufacturers in the chemical sector, Chemsinglesource.com launched by Solvay offers not only the commodity products but also the specialty chemicals and the engineering services offered by the company. The challenge for incum-bents, however, is the scalability of such a channel (or reach) and the logistics infrastructure needed to support the virtual channel.
While necessary, technology is thus not sufficient in and of itself for dynamic supply chain design. Many researchers have suggested that it is not sufficient that web-based technologies and e-markets provide the potential for higher transaction volumes, lower transaction costs, and better market mediation. Other factors such as transaction complexity and frequency, decision powers, existing market structure, and incom-plete contracts may impact the formation and sustainability of markets or hierarchies (Wang and Benaroch 2004).
However, one big challenge remains. The shift from hierarchical coor-dination to market coordination replaces industry structures dominated by vertical integration with networked organizations or loosely coupled ecosystems. In the absence of a clear command-and-control structure,

Impact of Technology on SCM 133
coordination among the members of a supply chain is not trivial, necessitating the implementation of incentive schemes for aligning the divergent economic interests of the members (Tsay et al. 1999). To ren-der electronic markets attractive and sustainable, Wang and Benaroch (2004) propose not only coordinating contracts between buyers and vendors, but also economic incentives to encourage supplier participa-tion in the form of a cap on the transaction fees imposed by the market maker and/or the payment of a premium by the buyer.
Similarly, Bailey and Bakos (1997) suggest four particular roles for electronic intermediaries: facilitation of transactions, trust building to prevent opportunistic behavior, matching of buyers and sellers, and aggregation of supply and demand. Others propose additional new roles such as designing innovative procurement practices and providing novel types of transactions. Such innovative procurement practices and novel types of transactions should therefore include contractible initia-tives (e.g., buyback policies, quantity flexibility, price protection, and options contracts) to ensure Pareto improving supply chain designs by aligning the economic incentives of buyers and suppliers.
6.5 Summary
• Web-based technologies have a significant impact on supply chain strategies. Swaminathan and Tayur (2003) provide an overview of analytical research models developed to address critical issues such as procurement and supplier management, visibility and information sharing, pricing and distribution, customization and postponement, and enterprise software and real-time decision technologies within the context of e-business. Sodhi (2001) emphasizes the opportunity to further improve planning and execution by extending the deci-sion horizon for planning within the enterprise, by broadening the physical scope beyond the enterprise to customers and suppliers, and by expanding the functional scope to include product design, marketing, and customer relationship management through the deployment of operations research techniques in web-enabled supply chains.
• On the coordination side, the web provides a virtually free platform for enhancing transparency, eliminating information delays and distortions, and significantly reducing transaction costs. As a result, the web makes it easier to mitigate the bullwhip phenomenon. On the design side, current technology does not yet permit the mitiga-tion of the trade-off between richness and reach in the crucial task

134 Competitive Supply Chains
of dynamically reconfiguring the IT infrastructure. The deployment of web services and SOA principles constitutes a big step toward dynamic supply chain design by enabling the IT infrastructure to evolve with the changing business conditions, making them read-ily adaptable to changing business models, growing competition and globalization, tighter regulations, and increased mergers and acquisition activities.
• More technology (i.e., higher levels of technology adoption), how-ever, should not automatically be equated to higher business per-formance. In a study of the adoption of the Quick Response (QR) program in the specialty retailing industry, Palmer and Markus (2000) find an association between adoption of QR (at a minimal level) and firm performance, and a high-level alignment between the IT adopted and strategic goals. However, they could not found any support for the hypothesis that higher levels of QR adoption lead to higher business performance, or that poor IT fit with strategy leads to poorer performance. The conclusion should therefore not be “more” technology, but “adequate” technology.

135
7.1 Motivation
The Economist defines services as “anything sold in the trade that cannot be dropped on your foot.” According to Levitt,1 products can be seen as the physical embodiment of the services they deliver. For instance, a smartphone can be viewed as an object delivering a communication solution. In fact, as shown in Figure 7.1, a growing proportion of the active population in developed economies would describe their jobs as a service operation. Yet, with a few exceptions, this book has largely focused on supply chains that produce and deliver physical goods to final customers. The question that must be addressed is what portion of the concepts and ideas developed thus far also apply to service settings.
In answering this question, instead of trying to produce a concise def-inition of services, it would be more useful to focus on the differences between manufacturing and service operations. Following Teboul’s2 classification, these characteristics are summarized in Table 7.1.
There are indeed some key differences between a manufactured product and a service offer. The existence of a tangible product in the former case makes it possible to control the production process and the resulting inventories efficiently. Zero defects are possible as long as the quality management system intercepts non-conforming products and reworks them. Given the non-tangible nature of services, effective manage-ment of capacity is crucial. The presence of the customer and, in most cases, the active participation of the customer in the service delivery process (the co-production) renders the traditional inspect-and-rework approach to quality control infeasible. Robust design that is capable of satisfying the requirements of a diverse customer base is necessary to ensure zero defections.
7Service Supply Chains

136 Competitive Supply Chains
Table 7.1 Product and service characteristics
Pure products Pure services
Transformation• Tangible goods• Inventory management• Zero defects; rework
Performance• Intangible value• Capacity management• Zero defections; robustness
Absence of customer• Standardization• Centralization of production• Centralization of distribution• Economies of scale
Presence of customer• Co-production• High variability• Close locations to customer• Economies of scope
Marketing a product• Transactional marketing• Control of channels• Channel efficiencies
Marketing a performance• Relationship marketing• Internal marketing• Channel agility
Figure 7.1 Evolution of different sectors in a developed economy
1800 2000
agriculture
manufacturing
services% of active population
Similarly, while the location of a manufacturing facility or a distribu-tion center is of little interest to the customer of a manufactured prod-uct, a convenient location with easy access is an important prerequisite for any effective service system. On the other hand, internal market-ing of the service concept to a company’s employees, who are the key interface with the customer, is a unique feature of services.
Finally, while digitalization has become the dominant delivery medium for most services (e.g., personal banking, entertainment, and educa-tion), its penetration into physical products has been more limited.

Service Supply Chains 137
While books, newspapers, music, and videos have been digitized and freed of the physical container (paper, USB keys, and DVDs) they were delivered in, a car, a vial of vaccine, or a bottle of water still requires physical transport from source to destination. Even additive manufac-turing, most popularly known as 3D printing, requires the production and delivery of the raw materials (plastics or metals) needed to do the printing.
We have to immediately acknowledge that the differences between manufactured products and service offerings are not as clear-cut as listed above, even for “pure” products (e.g., industrial gases) and “pure” services (e.g., a session with your personal psychiatrist). Can one classify a McDonald’s restaurant as a service? Not if you look at the assembly lines found in the kitchen. Is Peugeot-Citroën simply a car manufac-turer? Not if you consider the dealerships and the after-sales service. In other words, in any activity, there exists a production aspect (or a back office) as well as a service aspect (or a front office). As Teboul puts it, “we are all in services—more or less,” depending on the relative size of the front and back office, respectively. There exist useful frameworks to understand the dynamics of these two stages, the front and back offices.
The product–process matrix3 that contrasts product characteristics with the capabilities of different production processes provides a convenient model to capture the challenges in the back office. The rows of this matrix show the full spectrum of production processes ranging from a project environment with a unique output (offering economies of scope) to continuous flow with a narrow scope (offering economies of scale). The columns of the matrix capture some of the key product characteristics, ranging from low-volume high-variety to high-volume low-variety (highly standardized) products. As illustrated with a medical example in Figure 7.2, Hayes and Wheelwright postulate that it makes economic sense to operate in the diagonal of this matrix. Over the years, technological advances such as Flexible Manufacturing Systems attempted to break away from the diagonal by enabling higher levels of flexibility (hence, product variety and/or volume) without increasing the variable production costs. 3D-CE, concurrent design of the product, the process, and the supply chain, which was introduced in Chapter 3, is the only realistic approach to move away from the diagonal and into the south-west corner of the product–process matrix, thereby mitigating the cost-service trade-off.
In a similar spirit, Teboul proposes the service–intensity matrix, illus-trated in Figure 7.3, to capture the challenges in the front office. As in the product–process matrix, the columns of the service–intensity matrix

138 Competitive Supply Chains
Figure 7.2 The product–process matrix
Low volumehigh varietyproducts
High volumestandardizedproducts
Project
Job shops
Batch flows
Continuous flows
Immunization drive
Full-scale hospital
Specialized clinic
Laser eye
Figure 7.3 Service–intensity matrix
Extended &customizedservice
Limited &standardizedservice
High customeremployee contact
Meaningful contact
Reduced contact
Self-service
Intensive care unit
Outpatient treatment
Home care
Traditional hospital
capture some of the key characteristics of the service offer, ranging from highly customized to highly standardized offers. The rows of the matrix, on the other hand, reflect the level of intensity at the customer interface. Service intensity can be measured, for instance, in terms of the time spent with the customer, the number of repeated interactions, or the level of know-how required to serve the customer. Within that

Service Supply Chains 139
perspective, while advising on an investment portfolio represents a high degree of service intensity, an ATM machine and Internet banking are examples of a low degree of service intensity. Within a given technol-ogy setting, it is economically rational to operate on the diagonal of the service–intensity matrix as well. The upper left-hand corner of the matrix typically reflects high divergence and complexity, whereas the lower right-hand corner reflects lower divergence.
In the back office, we tend to focus on the production and support aspect of the operations, emphasizing the economies of scale. In the front office, however, we focus on the performance and customer inter-action, emphasizing the economies of scope. These differences in focus may lead to difficulties in effectively interfacing the front office with the back office. This challenge is addressed in the next section.
7.2 Interfacing the front office with the back office
Consider a queueing system where customers arrive at random and seek service from a server. Examples of such systems include barber shops, emergency rooms, runways, office coffee machines, and telecom-munication systems. Given the different service requirements of each customer, the service times are not constant. One customer-centric per-formance measure of interest is the average time customers spend in the system, typically referred to as the cycle time (or flow time) in manufac-turing and waiting or sojourn time in queueing theory. Without drown-ing in the mathematical details, let us use the following approximation for waiting time:4
2 2+=
2 1a s
sCV CV u
W tu
⎛ ⎞ ⎛ ⎞⎜ ⎟ ⎜ ⎟−⎝ ⎠⎝ ⎠
, (1)
where CVa and CVs denote the coefficients of variation (σ/μ) for the arrival process and the service process, respectively, which indicates the volatility in these processes. While it may be difficult to estimate the value of CV, a rough assessment of its magnitude may be possible from the physical context. For instance, a CVa of 1 reveals total random-ness in the arrival process; that is, the observation of a customer arrival provides us with no additional information on the arrival time of the next customer. A large CVa indicates positively correlated arrivals; that is, observing one arrival makes further arrivals more likely (e.g., a viral outbreak). Conversely, a negative CVa indicates negative correlation; that is, observing one arrival makes further arrivals less likely (e.g., a
140 Competitive Supply Chains
breakdown in a finite pool of machines). u denotes the utilization rate of the server; ranging from 0 to 1.0, it indicates the load on the server. If a runway at an airport can handle up to 50 landings and take-offs per hour, and only 40 planes are scheduled to use that runway, its capacity utilization rate is u = 40/50 = 0.80. Finally, ts is the average service time.
This intuitive approximation describes the three key drivers of the waiting time, one of the key components of customer experience in the front office. The first one, the average service time, ts, is the scale effect. Intuitively, with short service times, customers spend less time in the sys-tem. The second key driver is the utilization rate of the server. The expres-sion (u/1–u) implies that a high utilization of the server (i.e., a heavy load) would drastically increase the average waiting time for the customers. In fact, waiting time increases exponentially fast as the utilization rate nears 100%. The last driver of the waiting time is the volatility in the arrival and service processes. A higher level of variance results in higher waiting times.
Further, note the compounding effect these drivers have on the wait-ing time. A high level of volatility together with high utilization of the server and long service times would make the average waiting times unbearably longer. For example, in an emergency room, there is virtually no control over the arrival pattern of patients; controlling the input vol-atility is thus impossible. Similarly, as a patient who just suffered a heart attack has drastically different service requirements than a nine-year-old with a broken arm, service time volatility is equally high. Hence, in this environment, no matter how expensive a resource they represent, you cannot insist on a 100% utilization of your physicians without risking an unbearably long waiting time for the emergency patients!
These three drivers can also be viewed as three levers for defining an adequate service experience for the customer through a better interface between the back office and the front office through better product, process, and supply chain design. Specific initiatives can be undertaken to control the volatility in the arrival and service processes and to carefully monitor the utilization rate of the server. Figure 7.4 is taken from a newspaper advertisement for Kone, the Finnish manufacturer of elevators, where the congestion phenomenon captured by the approxi-mation in model (1) is shown along with Kone’s solutions. Further illustrative examples are discussed next.
7.2.1 Shouldice hospital
Consider the Shouldice hospital,5 “a center of excellence for the repair of abdominal wall hernias.” Founded in 1945 in the outskirts of Toronto by Dr. Earl, who developed an innovative surgical procedure enabling

Service Supply Chains 141
Figure 7.4 Waiting for an elevator
rapid recovery, the hospital has thus far hosted over 300,000 patients with over 99% success rate (measured by no recurrence). The “Shouldice technique” however is only one aspect of the patient experience. As illustrated by the “Shouldice Pictorial” on the hospital’s website, the campus looks more like a country club than a hospital.

142 Competitive Supply Chains
Patients, who had previously filled out a diagnostic survey and taken an appointment for surgery, arrive at the facility in the afternoon to go through an initial screening by one of the surgeons. The objective is to conduct the necessary tests to ensure that the patient indeed requires an intervention and, more importantly, that he/she is physically ready for surgery. The remainder of the afternoon is dedicated to settling into a semi-private room, debriefing with a staff nurse about the pre- and post-surgery practices, and socializing with fellow patients. The following morning, the surgery takes place under a local anaesthetic, which ena-bles the patient not only to get up from the operating table and walk to a wheelchair right after the surgery but also to get moving a few hours after the surgery, playing mini-golf, shooting pool, or doing “aerobics.” The patient is usually discharged the following morning.
At Shouldice, the front office has a very high degree of service inten-sity through high levels of interaction with the staff and fellow patients as well as through the special design of the facilities. On the other hand, the back office is run very efficiently. Expression (1) holds the key to this seamless interfacing of the front and back offices: Shouldice is a focused factory! Unlike a general hospital, Shouldice does only one thing: repairing abdominal wall hernias. The Shouldice technique requires 60 minutes for the operation (ts). In addition, by tightly controlling the intake of patients, including a careful screening of their require-ments and their incoming physical condition, the unexpected bad surprises are minimized—or even eliminated—virtually reducing all the variability in the service process 2( )sCV . Similarly, there is no variability in the arrival process 2( 0)aCV ≈ as potential patients take not only a self-diagnostic survey but also appointments for the surgery at the hospital. In such a stable environment, the hospital can afford to achieve a high utilization level for the surgeons and the operating theaters—hence, achieving economies of scale in the back office—without compromising the customer service—that is, the patient experience—in the front office. This is indeed achieved through a careful design of the product (the service concept) and the process (the Shouldice technique).
7.2.2 CIBA Vision in Europe
While half of the world population requires some type of vision correc-tion, only a small fraction wears contact lenses (5% in the EU, 9% in Japan, and 19% in the United States). This low penetration among end consumers is mainly driven by the high cost and care requirements for contact lenses, the cumbersome fitting process, and the long-term safety concerns due to low oxygen permeability. Significant improvements

Service Supply Chains 143
in materials as well as in manufacturing technologies, however, are changing this industry drastically. The continuous improvement in materials has enhanced oxygen permeability, enabling the introduc-tion of extended-wear contact lenses. On the manufacturing side, the development of the wet moulding (Lightstream) technology not only slashed manufacturing costs, making disposable (daily wear) lenses econo mically viable, but also reduced the manufacturing cycle time from 3 days to 15 seconds! In short, materials and process technology have transformed the contact lens industry (the back office) from a high-cost low-volume industry into a high-volume low-cost one.6
This transformation could not leave the downstream channel (the front office) unchanged, particularly blurring the line between the customer and the consumer. Traditionally, the eye care specialist was CIBA Vision’s customer. That is, each national sale subsidiary had a close relationship with the ophthalmologist, optometrist, or the fit-ting studio, providing them with trial sets, taking their orders, and ensuring order fulfilment. The consumer, the contact lens wearer, would only interface with the eye care specialist, typically unaware of the contact lens manufacturer. With the daily-wear disposable lenses, however, the consumer, with the prescription on hand, could visit any one of the optometrist chain outlets—or even the Internet—to order and receive a branded pack of contact lenses. In certain coun-tries, the lenses would be replenished automatically at the consumer’s residence.
With these changes in the industry, CIBA Vision was considering the centralization of its logistics operations in Europe. The main concern in this significant back office reorganization was how well the back office would be able to support the front office, namely the diverging busi-ness requirements from each channel (ophthalmologists, opticians, and eye care chains) in each European country. In particular, the following concerns had to be addressed:
Front office:
• Local regulations (language, labeling, etc.) as contact lenses are considered to be medical devices.
• Local terms of the trade (payment terms, targets, compensation plans, etc.): while average receivables are 18 days in Denmark, they are approximately 90 days in Italy.
• Local channel characteristics (market penetration, local competition, and CRM): while it is necessary to obtain a prescription from an ophthalmologist in France, fitting studios are popular in Scandinavia.

144 Competitive Supply Chains
• Revenue recognition (and other financial implications).• Demand characteristics (average sales, sales volatility, and forecast-
ing practices): the average number of daily shipments is around 1300 in Germany, whereas it hovers around 500 in France, with the corresponding inventory levels being 60 DOS and 90 DOS, respectively.
• Service characteristics (order fulfilment process, performance): 8000 SKUs are carried in Germany, while only 1500 SKUs are held in Scandinavia.
• Costs (WCR, obsolescence, warehousing, headcount, …): obsoles-cence is around 9% of sales in Italy and 5% in the United Kingdom.
Back office:
• Materials management policies: 15 DOS for A items, 30 DOS for B items, and 120 DOS for C items.
• Production planning and scheduling: given the rapidly growing worldwide demand, the production facilities were running almost at capacity.
• Pick-and-pack (P&P) process: with a two-hour picking cycle, a capa-bility to pick 30,000 orders per day that would achieve a 99.9% on time in full (OTIF) service level was targeted.
• Shipping modes for different destinations.• Quantification of the pooling economies: the safety stock that used
to be held in local subsidiaries was centralized, hence reduced.• Lightstream process technology enabling frequent replenishment sys-
tems through a 15-second cycle time.
The key challenge in the front office is to push the standardization of customer service without compromising the varying degrees of cus-tomer intimacy required in each channel and in each country. The key challenge in the back office is to quantify the magnitude of the cost savings due to pooling economies, the increase in shipping costs, the materials management practices, and ultimately the interface with the production process. The interface challenge between the front office and the back office is illustrated in Figure 7.5.
The deployed solution, Eurologistics, separated three key flows of information, material, and cash to achieve compatibility between the highly diverse front office and the highly standardized back office. As before, the customer is fitted with contact lenses by an eye care profes-sional. The professional would then call the local sales subsidiary to place an order for the lenses. Such orders would typically be placed

Service Supply Chains 145
Figure 7.5 Interfacing the front office and the back office for CIBA vision
Extended &customizedservice
Limited &standardizedservice
High customeremployee contact
Meaningful contact
Reduced contact
Self-service
Low volumeHigh varietyproducts
High volumestandardizedproducts
Project
Job shops
Batch flows
Continuous flows
Ophthalmologists
BootsCarrefour
Eurologistics
Opticians (Aflelou, Optic 2000, etc.)
over the phone. For example, in France, CIBA Vision’s sales organiza-tion operates a call center in Toulouse that takes telephone orders from the eye care professionals. These orders are immediately transferred through Electronic Data Interchange (EDI) to the Eurologistics center in Grosswallstadt. If the requested lenses are in stock, a P&P order would be printed. With the single P&P sheet, the lenses are picked, packed, and shipped through overnight delivery directly to the eye care pro-fessional that had originally placed the order with the local sales sub-sidiary. Simultaneously, a dispatch notification is sent to the local sales subsidiary enabling them to invoice the eye care professional.
As summarized in Figure 7.6, Grosswallstadt operates as a toll distribu-tion center that simply matches orders with inventory and ships them to the requested address. It does not hold any customer database; it does not manage any financial transactions, which remain the responsibil-ity of the local sales subsidiary. Such an approach not only preserves

146 Competitive Supply Chains
the close relationship that exists in each country between the repre-sentatives of the sales subsidiary and the pool of eye care specialists they serve (front office performance) while affording pooling economies for inventory and scale economies for the warehousing and distribution operations (back office efficiency).
Recalling expression (1) for the waiting time in a queueing system, we observe that CIBA Vision has deployed all three drivers. The streamlin-ing of the P&P process not only reduced the service time to two hours, but the process design virtually eliminated the variability (hence, the coefficient of variation) of the P&P service. Through the dynamic sched-uling of its workforce, CIBA Vision carefully controls the utilization rate of the server. Finally, the pooling of the demand from all the countries across Europe reduces the coefficient of variation of the order arrival process.
7.3 Dynamic capacity management
The two examples in Section 2 showed the crucial role the product, pro-cess, and supply chain design play in achieving seamless coordination between the front office and the back office. There also exist tactical initiatives aimed at dynamically managing this interface in the short run.
Lufthansa Cargo7 is the largest air cargo carrier in terms of ton-kilometers flown and second largest (behind Federal Express) in terms of tons carried. Air cargo business is a capital-intensive industry; the ratio of tangible assets
Figure 7.6 The Eurologistics solution
Patient
Eye care specialist
Local sales organization
Eurologistics in Grosswallstadt
Order
Dispatch notification Intercompany invoice
Order
ShipmentCustomer invoice

Service Supply Chains 147
to sales was 14% for the German retailer Metro, 26% for DaimlerChrysler, and 60% for Lufthansa Cargo in 2000. It is therefore no surprise that management of capacity, a perishable good, is of crucial importance.
Revenue Management (RM) has received considerable attention in recent years. RM, which exploits the differences in the marginal willingness to pay (WTP) among customers, attempts to find a balance between the fact that unused capacity is lost forever and that higher-margin demand arrives at the last minute. Most passenger airline companies are successfully using RM practices. There are, however, complicating factors in air cargo such as multi-dimensional unit loads (e.g., weight, volume, …), stacking loss due to the shape and position of the cargo, and one-way, unbalanced flows. Moreover, 90–95% of the volume is controlled by freight forwarders, ren-dering direct customer contact virtually impossible.
In this set-up, the challenge for Lufthansa Cargo is to determine the optimal space allocation to various cargo classes to maximize fill rate and expected revenue. For example, as illustrated in Figure 7.7, how much space should be reserved for express cargo that commands higher prices and how much to sell en bloc in advance?
One approach to the capacity management challenge is to dynami-cally price available capacity to reflect the demand–supply conditions, which may irritate potential customers. Another approach is to secure a certain level of load (utilization) through long-term firm-commitment contracts and put the remaining capacity on the spot market. Capacity options can then be used as a mechanism to hedge against spot mar-ket volatility (also giving Lufthansa Cargo additional information to forecast potential demand with higher accuracy). A capacity option represents the right—but not the obligation—for the freight forwarder
Figure 7.7 Managing capacity at Lufthansa (Huchzermeier, ’02)
Guaranteed CapacityAgreements (GCA)
Capacity PurchasingAgreements (CPA)
Expressproducts
Controlled space
Capacity
CapacityAccess
Price
0 % 100 %
Rate
(euro/kg)
Buffer
Presoldcapacity
II.
III.
I.
Highmargin
products

148 Competitive Supply Chains
to purchase cargo capacity at a pre-determined price. The option buyer, the forwarder, will exercise the option only if the spot price is higher than the exercise price of the option. The system is therefore “Pareto-improving” for the shipper (lower rates), the freight forwarder (higher service levels), and the carrier (more accurate demand forecasts and higher fill rates). We are therefore back to contracting; in this case, Monte Carlo simulations would be necessary to assess the effectiveness of various hedging mechanisms and to determine adequate option prices.
Dynamic approaches to matching supply with demand are more effec-tive than the static approaches discussed. In the “sharing economy,” applications like Airbnb and UberPop,8 which use the existing informa-tion and communication technology infrastructure, put such dynamic capabilities within the reach of many service organizations without significant capital investment.
7.4 Summary
• While product supply chains focus on economies of scale and effi-ciency through materials management, service supply chains focus on economies of scope and effectiveness through capacity management.
• Given that most value propositions consist of a product and service bundle, the product-focused back office must be interfaced with the customer-focused front office in spite of the divergent priorities.
• In the long run, an intelligent design of products, processes, and supply chains facilitates this coordination. In the short run, RM is a dynamic way of managing capacity as a perishable good.

149
In this book, I have emphasized three key messages:
1. Value: While the traditional approaches to supply chain manage-ment (SCM) have favored cost minimization, I believe that SCM is a value enabler with strategic decisions in supply chain design leading to value creation and tactical decisions in supply chain coordination leading to value capture.
2. Alignment: In the absence of a vertically integrated industry structure with clear command-and-control lines, it is difficult to coordinate the players in an ecosystem who may have divergent and typically conflicting interests. While trust-based collaborative prac-tices are the ultimate goal, adequate economic incentives should be designed to ensure the much-needed alignment.
3. Sustainability: Just like products and processes, supply chain solu-tions have a limited shelf life. As a consequence, supply chain design should be viewed as a dynamic process, as the capability to design and assemble assets, organizations, skill sets, and competencies for a series of competitive advantages, rather than a set of activities held together by low transaction costs.
Such a focus was the result of various key initiatives undertaken over the past few decades to manage the key interfaces in a more effective fashion. As illustrated in Figure 8.1, Just-in-Time (JIT) was the sweeping philosophy in the 1980s with the aim of promoting mutually beneficial relationships between a manufacturer and its supply base. The Efficient Consumer Response (ECR) movement, which was introduced in the 1990s, aimed at creating transparent relationships within the down-stream channel. With the key advances in the information technology,
8Concluding Comments

150 Competitive Supply Chains
Figure 8.1 Major initiatives along the supply chain
customer relationship management (CRM) was introduced to put the customer in the driver’s seat of the ecosystem. With this background, the alignment of all the players in the ecosystem must be the top priority of all supply chain professionals to make modern supply chains an enabler for value creation and a source of a sustainable competitive advantage.
I started this book by defining the supply chain as a platform deployed to manage three key flows: material, information, and cash. I conclude it with two examples that illustrate how that platform could be designed to enable the deployment of new business models.
8.1 HP business desktop division
In the third quarter of 2006, HP recaptured the top position of worldwide PC shipments from Dell. Even a few months prior to this reversal, match-ing Dell was thought to be very difficult, if not impossible. Analysts were stating that no matter how deeply HP could cut costs, it would never be able to build a zero-cost channel to compete with Dell, which did not have such costs due to its direct model. In fact, the Business Desktop supply chain in the mid-1990s, which is depicted in Figure 8.2, shows the magnitude of the challenge.1 The ecosystem consisted of worldwide suppliers, assembly facilities, tier-1 distributors, and tier-2 value-added resellers (VAR). Inventory levels at various stages are also shown in the figure. The fact that 1% is shaved off of the selling price of a PC every week is sufficient to illustrate the severity of the challenge.
HP’s supply chain redesign efforts started with the realization that the hardware-related costs represent about 25% of the total cost of owner-ship for a PC. This, in turn, has reoriented the organization from selling boxes to providing business computing solutions. The customer-facing front office was thus been defined as depicted in Figure 8.3. At one end of the spectrum, “platform buyers” looked only for hardware, whereby their in-house IT capability took care of the installation, training, and maintenance.

Concluding Comments 151
Figure 8.2 HP’s BDD supply chain in the mid-1990s
Sup
plie
rs
Res
elle
r 1s
t Tie
rD
istr
ibut
or
Res
elle
r 2n
d T
ier
Val
ue-A
dded
Res
elle
rs
INFO
PRODUCTS
Stock 5 weeksStock 1 week
End
Use
r
Stock 3 weeks
Over 100suppliers
Figure 8.3 HP’s customer orientation
HighTouch
LowTouch
Enterprise / Large Named Accounts
Large / Medium Small
HP
- C
usto
mer
Rel
atio
nshi
p
HPBusiness
StoreHP Prime
Partner Prime
Company Size
On the other end of the spectrum, the “solutions buyer” relied on systems vendor for the total end-to-end solution. For a high-touch rela-tionship, HP decoupled the information and material flows as depicted in Figure 8.4.

152 Competitive Supply Chains
Figure 8.4 Material, information, and cash flows
HP
Enterprise Customer
&
HP Business Store
SMB Customer
Partner(s)
Goods and services
Information
Cash
Partner(s)
In terms of the information flows, HP placed itself right in front of the customer ahead of the distributors and VARs. Such a positioning enabled HP to obtain timely and undistorted market information. Then, HP adopted the role of an orchestrator along the supply chain. For plat-form buyers, HP triggered the production of the hardware, which would subsequently be delivered to the customer by the distributor. For the solutions buyers, HP started by designing a solution and triggered the production of the hardware component of that solution. The solution would then be deployed by the VAR at the customer site as a product and service bundle. As for the financial flows, each partner in the sys-tem was remunerated in a fashion that is commensurate to the value they have delivered to the final customer.
To enable such a business model, HP has drastically reorganized the upstream supply chain through such initiatives as the creation of sup-plier hubs, outsourcing of assembly facilities, and channel assembly. This is depicted in Figure 8.5.
Today, HP pursues “advanced local customization” in fast growing markets (e.g., Middle East) by local assembly of PCs in Saudi Arabia where bulky boxes are directly shipped through sea lanes from China and small but expensive critical parts are air-freighted from Eastern Europe.

Concluding Comments 153
Figure 8.5 The new HP supply chain
Sup
plie
rs
Reg
iona
l HU
B o
rS
MI f
rom
sup
plie
r hu
b
Larg
e A
ccou
nt E
ndC
usto
mer
s
CA
P
HP product andbrand
Customized andshipped to the endcustomer by CAP
Installation andcustomer supportby 2nd Tier reseller
2nd T
ier
8.2 Syngenta’s Tegra offer in India and Thailand
Every day half of the world’s population consumes rice. In Asia, one of the key planting and consumption regions, growers face labor shortages and increasing costs. The latter includes the cost of seedlings, products for crop protection, and equipment, in addition to significant amounts of labor. As illustrated in Figure 8.6, water usage also remains highly inefficient.
In 2011, Syngenta introduced Tegra,2 which combines seedlings and agricultural inputs (such as fertilizers, fungicides, etc.) into trays. From the perspective of the grower, Tegra promises significantly increased yield while reducing labor and water use, increasing grower productivity and profitability, thereby increasing his willingness-to-pay (WTP).
For Tegra to be economically sustainable, however, the product, the manufacturing process, and the supply chain have to be concurrently designed to ensure an acceptable landed cost. The product consists of a tray where selected seedlings are pre-planted and treated with agri-cultural inputs aimed at enhancing robustness at a nursery, as shown in Figure 8.7. The nursery must then have sufficient inventory of seed-lings, fertilizers, chemicals, and packaging materials. This tray, which looks like a piece of carpet or English grass, represents a living organ-ism. As a perishable product, it has a limited window during which the carpet must be transplanted onto a field to ensure the promised germi-nation or yield rates. This, in turn, necessitates an agile supply chain. Given the infrastructure in India, it is therefore not possible to achieve economies of scale by creating mega nurseries capable of serving the

154
Figure 8.6 Planting riceSource: Syngenta.
Figure 8.7 The Tegra offerSource: Syngenta.

Concluding Comments 155
entire subcontinent. Instead, multiple nurseries would be created to serve the growers who are located within a radius of 100 km. Even though it represents a small fraction of Syngenta’s sales in rice, Tegra is a successful business model innovation, which managed to increase the grower’s WTP without increasing the cost to serve in a disproportionate fashion through 3D-CE.
8.3 What keeps supply chain professionals awake at night?
Corporate Social Responsibility (CSR) is high on the agenda for sup-ply chain professionals. When the CEO of a company commits herself in front of journalists that her organization would become “carbon neutral by 2020” or claims that all of the suppliers of her company fol-low socially responsible behavior, the challenge of delivering on those claims typically falls on the supply chain. It is therefore necessary for the supply chain professionals to devise economically meaningful solu-tions that go beyond “greenwashing.”
Consider, for example, L’Oréal, the French cosmetics giant. The company operates a large production facility in Rambouillet, France, p roducing almost 300 million bottles of hair care products on an annual basis.3 The production process consists of a continuous flow operation where the product (“the juice”) is produced in large tanks. These tanks are connected through overhead pipes to the filling lines where botlles are filled with shampoo or conditioner, inserted into a cardboard box, and loaded on pallets on their way to warehouses and retail outlets. The Rambouillet plant used to source its bottles from a bottle blower in Belgium. Once manufactured and tested, bottles would be shipped by truck over several hundred kilometers to be filled at Rambouillet, creat-ing an annual traffic of thousands of trucks transporting air! Recently, L’Oréal has entered into a sourcing arrangement with the Austrian packaging company, Alpla, which installed a bottle blowing line at the Rambouillet site. Preforms, shown in panel [1] of Figure 8.8, are trans-ported to the factory, blown into bottles, and immediately sent to the filling lines ready to be filled. Given that preforms have a fraction of the size of a shampoo bottle, this collaborative arrangement has dramati-cally reduced the truck traffic, significantly shrinking the site’s carbon foot print. The L’Oréal–Alpla collaboration is an example of a successful supply chain solution that is not only environmentally sound but also economically sustainable.
As supply chains have gone global, it has become increasingly dif-ficult for individual organizations to enforce CSR practices in their

156 Competitive Supply Chains
Figure 8.8 Bottle blowingSource: smfgmbh.com
1 2 3 4 5 6
ecosystem. Such initiatives must therefore be undertaken at a higher and broader level. The drastic loss of life in the fire at Tazreen Fashions and in the collapse of Rana Plaza4 has drawn considerable attention to the global apparel supply chains and the risky working conditions they feature. Unfortunately, there was persistent disagreement between the American and European apparel brands on the appropriate response to these tragedies with the view of significantly improving the working conditions—testimony to the challenges in introducing industry-wide CSR initiatives.
One such initiative that is getting some traction is the Sustainable Apparel Coalition (SAC), which was originally championed by Patagonia and Walmart. SAC’s vision of achieving “an apparel and footware industry that produces no uneccessary environmental harm and has a positive impact on the people and communities associated with its activities” is supported by Higg Index, a set of self-assessment templates for understanding the environmental impact of one’s supply chain.5
With its mission of “empowering sustainable and ethical supply chains,” Sedex is a non-profit organization that provides its members a secure, online database for sharing information on labor standards, health and safety concerns, environmental impact, and business eth-ics.6 The objective of the database is to eliminate “audit fatigue” on the suppliers by easing the burden on suppliers facing multiple audits, questionnaires, and certifications and, in this process, to drive improve-ments in the ethical performance of global supply chains.
This is a domain in full flux with many initiatives, including envi-ronmental certifications (ISO 14000), global frameworks (UN Global Compact), just to name a few. The supply chain professional cannot ignore these developments. She has to be actively involved in contrib-uting to the discussions, in shaping legislation, in impacting global practice, and in implementing sustainable supply chain solutions that make economic sense.
The best is yet to come …

157
Appendix
Standard normal distribution and standard loss function
z F(z) L(z) z F(z) L(z)
–4.0 0.0000 4.0000 0.0 0.5000 0.3989–3.9 0.0000 3.9000 0.1 0.5398 0.3509–3.8 0.0001 3.8000 0.2 0.5793 0.3069–3.7 0.0001 3.7000 0.3 0.6179 0.2668–3.6 0.0002 3.6000 0.4 0.6554 0.2304–3.5 0.0002 3.5001 0.5 0.6915 0.1978–3.4 0.0003 3.4001 0.6 0.7257 0.1687–3.3 0.0005 3.3001 0.7 0.7580 0.1429–3.2 0.0007 3.2002 0.8 0.7881 0.1202–3.1 0.0010 3.1003 0.9 0.8159 0.1004–3.0 0.0013 3.0004 1.0 0.8413 0.0833–2.9 0.0019 2.9005 1.1 0.8643 0.0686–2.8 0.0026 2.8008 1.2 0.8849 0.0561–2.7 0.0035 2.7011 1.3 0.9032 0.0455–2.6 0.0047 2.6015 1.4 0.9192 0.0367–2.5 0.0062 2.5020 1.5 0.9332 0.0293–2.4 0.0082 2.4027 1.6 0.9452 0.0232–2.3 0.0107 2.3037 1.7 0.9554 0.0183–2.2 0.0139 2.2049 1.8 0.9641 0.0143–2.1 0.0179 2.1065 1.9 0.9713 0.0111–2.0 0.0228 2.0085 2.0 0.9772 0.0085–1.9 0.0287 1.9111 2.1 0.9821 0.0065–1.8 0.0359 1.8143 2.2 0.9861 0.0049–1.7 0.0446 1.7183 2.3 0.9893 0.0037–1.6 0.0548 1.6232 2.4 0.9918 0.0027–1.5 0.0668 1.5293 2.5 0.9938 0.0020–1.4 0.0808 1.4367 2.6 0.9953 0.0015–1.3 0.0968 1.3455 2.7 0.9965 0.0011–1.2 0.1151 1.2561 2.8 0.9974 0.0008–1.1 0.1357 1.1686 2.9 0.9981 0.0005–1.0 0.1587 1.0833 3.0 0.9987 0.0004–0.9 0.1841 1.0004 3.1 0.9990 0.0003–0.8 0.2119 0.9202 3.2 0.9993 0.0002–0.7 0.2420 0.8429 3.3 0.9995 0.0001–0.6 0.2743 0.7687 3.4 0.9997 0.0001–0.5 0.3085 0.6978 3.5 0.9998 0.0001
(continued)

158 Appendix
z F(z) L(z) z F(z) L(z)
–0.4 0.3446 0.6304 3.6 0.9998 0.0000–0.3 0.3821 0.5668 3.7 0.9999 0.0000–0.2 0.4207 0.5069 3.8 0.9999 0.0000–0.1 0.4602 0.4509 3.9 1.0000 0.00000.0 0.5000 0.3989 4.0 1.0000 0.0000
Continued

159
Notes
Preface
1. Kurt Salmon and Associates, 1993.
Introduction
1. Our Industry – 2013, Syngenta Crop Protection Report.
1 Working Definitions
1. Manufacturing the Future: The next era of global growth and innovation, 2012, McKinsey Global Institute.
2. L’Usine Nouvelle, October 1998.3. Porter, 1980. 4. The WEEE (Waste Electrical and Electronic Equipment) Directive within the
European Union defines the boundaries of responsibility within the electron-ics industry.
5. An excellent synthesis of this research can be found in Factory Physics (McGraw-Hill 2001) by Hopp and Spearman.
6. McAfee and Ashia, 2001.7. C.H. Fine, 1998.
2 Value-Based Management: The Guiding Principle for SCM
1. Girotra and Netessine, 2014.2. Fine, 1998.3. International New York Times, 6 April 2015, Reuters Breaking News.4. Young and O’Byrne, 2001.5. International Herald Tribune, 16 June 2006.6. International Herald Tribune, 3 July 2006.7. Hendricks and Singhal, 2003.
3 Value Creation: Dynamic Supply Chain Design
1. Dutta and Yücesan, 1996.2. Grove, 1999.3. Fine, 1998.4. Mendelson and Pillai, 1999.5. SCOR is the SCM framework of the APICS Supply Chain Council, http://www.
apics.org/sites/apics-supply-chain-council

160 Notes
6. Van Mieghem, 2015. 7. OR/MS Today Software Survey: http://www.orms-today.org/ormssurveys.html 8. Randall, 1998. 9. Fisher, 1997.10. Business Week.11. Ülkü, Toktay, and Yücesan, 2006.12. Ülkü, Toktay, and Yücesan, 2005.13. Fine, 1998.14. Fine, 1998.15. Adner, 2006.16. Yoffie and Kwak, 2006.17. Froot et al., 1994.18. www.cred.be19. http://www.apparelcoalition.org20. http://www.goodguide.com/21. Poireir and Quinn, 2003.22. Eskew, 2004.
4 Value Creation: Assessing the Cost-Service Trade-off
1. The newsvendor framework is discussed in Chapter 5. 2. Kopczak and Lee, 1994. HP Deskjet Printer Supply Chain (A). 3. Little, 1992. 4. Harris, 1913 and Wilson, 1934. 5. Pass and Pike, 1984. 6. Modigliani and Miller, 1958. 7. Bendavid, Herer, and Yücesan, 2014. 8. Buzacott and Zhang, 2004. 9. Luo and Shang, 2013.10. Cunat and Garcia Appendini, 2012.
5 Value Capture: Aligning Supply Chain Partners
1. Lee, Padmanabhan, and Whang, 1997.2. Hammond, 1994.3. CPFR.org4. The Straights Times, Santa Emma, 6 November 2006.5. Cachon and Lariviere, 2001.6. Amazon Escalates Battle with Publishers, Financial Times, 23 May 2014.
6 Impact of Technology on SCM: A Brief History of IT for SCM
1. Garvin, 1987.2. Akkermans et al., 2003.3. Harrington and O’Connor, 2009.4. Fung, Fung, and Wind, 2007.

Notes 161
5. http://www.edibasics.com/types-of-edi/web-edi/ 6. Acquired by Ariba, which was in turn acquired by SAP.
7 Service Supply Chains
1. Levitt, 1972.2. Teboul, 2006.3. Hayes and Wheelwright, 1984.4. Kingman, 1961.5. www.shouldice.com6. Yücesan, 2005.7. Hellerman and Huchzermeier, 2002.8. Manjoo, 2015.
8 Concluding Comments
1. Teboul, Van Wassenhove, and Yücesan, 1999.2. https://www.youtube.com/watch?v=yLmFM12tH3I3. http://fr.industrial-excellence-award.eu/accueil 4. http://www.ilo.org/global/about-the-ilo/activities/all/safer-garment-industry-
in-bangladesh/WCMS_240343/lang--en/index.htm 5. http://www.apparelcoalition.org/higgindex/6. http://www.sedexglobal.com/

162
References
Adner, R. 2006. Match Your Innovation Strategy to Your Innovation Ecosystem. Harvard Business Review, April, 98–107.
Akkermans, H.A., Bogerd, P., Yücesan, E., and Wassenhove. L.V. 2003. The Impact of ERP on Supply Chain Management: Exploratory Findings from a European Delphi Study. European Journal of Operational Research. 146, 284–301.
Amit, R. and Zott. C. 2001. Value Creation in e-Business. Strategic Management Journal, 22, 493–520.
Bailey, J.P. and Bakos. J.Y. 1997. An Exploratory Study of the Emerging Role of the Electronic Intermediaries. International Journal of Electronic Commerce, 1, 7–20.
Bendavid, I., Herer, Y., and Yücesan. E. 2014. A Simulation-Based Investigation of Inventory Management under Working Capital Constraints. Proceedings of the Winter Simulation Conference, Savannah, GA.
Bhattacharya, S., Gaba, V. and Hasija, S. 2014. A Comparative Analysis of the Role of Milestone-Based Contracts for Coordinating R&D Partnerships. Forthcoming in Management Science.
Buzacott, J.A. and Zhang, R.Q. 2004. Inventory Management with Asset-Based Financing. Management Science, 50 (9): 1274–1292.
Cachon, G.P. and Lariviere, M.A. 2001. Turning Supply Chains into Revenue Chains. Harvard Business Review, 3, 20–21.
Cunat, V. and Garcia-Appendini, E. 2012. Trade Credit and Its Role in Entrepreneurial Finance. In D. Cummins (editor), Oxford Handbook of Entrepreneurial Finance. Oxford University Press.
Dutta, S. and Yücesan, E. 1996. Rank Xerox France: The Logistics Process. INSEAD Case Study.
Dyer, J.H. and Nobeoka, K. 2000. Creating and Managing a High-Performance Knowledge-Sharing Network: The Toyota Case. Strategic Management Journal, 21 (3), 345–367.
Eskew, M. 2004. Mitigating Supply Chain Risk. CEO, April, 25–26.Evans, P. and Wurster, T.S. 2000. Blown to Bits. HBS Press.Fiala, P., 2005. Information Sharing in Supply Chains. Omega, 33, 419–423.Fine, C.H. 1998. Clockspeed: Winning Industry Control in the Age of Temporary
Advantage, Perseus Books.Fisher, M.L., 1997. What Is the Right Supply Chain for Your Products? Harvard
Business Review, March–April, 105–116.Froot, K.A., David S., Scharfstein and Stein, J. 1994. A Framework for Risk
Management. Harvard Business Review. 72 (6): 59–71. Fung, V.K., Fung, W.K., and Wind. J. 2007. Competing in a Flat World: Building
Enterprises for a Borderless World. Prentice Hall.Garvin, D.A. 1987. DEC: The EndPoint Model (A), Harvard Business School Case
9-688–059.Girotra, K. and Netessine, S. 2014. The Risk Driven Business Model. Harvard
Business School Publishing.

References 163
Grove, A. 1999. Only the Paranoid Survive: How to Exploit the Crisis Points that Challenge Every Company. Doubleday.
Gulati, R., Nohria, N. and Zaheer, A. 2000. Strategic Networks. Strategic Management Journal, 21 (3): 203–215.
Hammond, J. 1994. Barilla SpA (A). Harvard Business School Case Study.Harris, F.W. 1990 [Reprint from 1913]. How Many Parts to Make at Once,
Operations Research (INFORMS) 38 (6): 947–950.Harrington, S. and Nihaus. G. 2003. United Grain Growers: Enterprise Risk
Management and Weather Risk. Risk Management and Insurance Review, 6 (2): 193–217.
Harrington, S. and O’Connor. 2009. Cisco’s Business Continuity Plan. SCM Review, July
Hayes, R. and Wheelwright, S. 1984. Restoring our Competitive Edge: Competing through Manufacturing. Wiley.
Hellerman and Huchzermeier, A. 2002. Lufthansa Cargo AG. WHU Koblenz.Hendricks, K. and Singhal, V. 2003. The Effect of Supply Chain Glitches on
Shareholder Value. Journal of Operations Management. 21: 501–522.Hopp, W.J. and Spearman, M.L. 2001. Factory Physics: Foundations of Manufacturing
Management. Second Edition. McGraw-Hill, NY.Huybrecht, G., Bhattacharya, S. and Hasija, S. 2012. Supply Chain Structural
Change: Pharmaceutical Industry. INSEAD Case Study.Kaplan, S. and Sawhney, M. 2000. E-Hbs: The New B2B Marketplaces. Harvard
Business Review, May–June, 97–103.Kingman, J.F.C. 1961. The Single Server Queue in Heavy Traffic, Proceedings of the
Cambridge Philosophical Society. 57, 902–904.Kopczak, L. and Lee, H. 1994. HP Deskjet Printer Supply Chain (A). Graduate
School of Business, Stanford University.Kurt Salmon and Associates, 1993. Efficient Consumer Response: Enhancing
Consumer Value in the Grocery Industry.Lee, H, Padmanabhan, P., and Whang, S., 1997. The Paralyzing Curse of the
Bullwhip Effect in the Supply Chain. Sloan Management Review. 93–102.Levitt, T. 1972. Production Line Approach to Service. Harvard Business Review.
50 (5): 41–52.Little, J.D.C. 1992. Tautologies, Models, and Theories: Can We Find “Laws” of
Manufacturing. IIE Transactions, 24, 7–13.Luo, W. and Shang. K. 2013. Managing inventory for entrepreneurial firms with
trade credits. Working paper. Fuqua School of Business, Duke University.Malone, T.W., Yates, J. and Benjamin, R.I. 1987. Electronic Markets and Electronic
Hierarchies. Communications of the ACM, 30, 484–497.Manjoo, F. Uber’s business model could change your work, The New York Times,
28 January 2015.McAfee, A.P. and Ashia, M. 2001. Synchra Systems, Harvard Business School.McAfee, R.P. and McMillan, J. 1987. Auctions and Bidding. Journal of Economic
Literature, 25 (2): 699–738.Mendelson, H. and Pillai, R.R. 1999. Industry Clockspeed: Measurement and
Operational Implications. Manufacturing and Service Operations Management, 1, 1–20.
Modigliani, F. and Miller, M.H. 1958. The Cost of Capital, Corporation Finance and the Theory of Investment. American Economic Review, 48 (3): 261–297.

164 References
Moitra, D. and Ganesh, J. 2005. Web Services and Flexible Business Process: Towards the Adaptive Enterprise. Information and Management, 42, 921–933.
Palmer, J.W. and Markus, M.L. 2000. The Performance Impacts of Quick Response and Strategic Alignment in Specialty Retailing. Information Systems Research, 11 (3): 241–259.
Pass, C. and R. Pike. 1984. An Overview of Working Capital Management and Corporate Financing. Management Finance, 10 (3): 1–11.
Poirier, C. and Quinn, F. 2003. Calibration Supply Chain Management. Computer Sciences Corporation.
Porter. M.E. 1980. Competitive Strategy: Techniques for Analyzing Industries and Competitors. The Free Press, New York, NY.
Randall, T., Ulrich, K., Fisher, M., and Reibstein, D. 1998. Managing Product Variety: A Study of the Bicycle Industry. In Managing Product Variety (Teck Ho and Christ Tang, eds) Kluwer Academic Publishers. Dordrecht, NL.
Sodhi, M.S. 2001. Applications and Opportunities for Operations Research in Internet-Enabled Supply Chains and Electronic Markets. Interfaces, 31 (2): 56–69.
Stoll, H.W. 1986. Design for Manufacture: An Overview. Applied Mechanical Review, 39 (9).
Swaminathan, J.M. and Tayur. S.R. 2003. Models for Supply Chains in E-Business. Management Science, 49 (10): 1387–1406.
Tang, C.S. 2006. Robust Strategies for Mitigating Supply Chain Disruptions. International Journal of Logistics: Research and Applications, 9 (1): 33–45.
Teboul, J., Van Wassenhove, L.N., and Yücesan. E. 1999. HP.Teboul, J. 2006. Service is Front Stage: Positioning Services for Value Advantage.
Palgrave McMillan.Tsay, A. A., Nahmias, S. and Agrawal, N. 1999. Modeling Supply Chain Contracts:
A Review. In: Quantitative Models for Supply Chain Management (Tayur, Ganeshan, and Magazine, eds), Kluwer Academic Publishers. Boston. 299–336.
Upton, D.M. and McAfee, A.P. 1996. The Real Virtual Factory. Harvard Business Review, July–August, 123–133.
Ülkü, S., Toktay, B.L., and Yücesan. E. 2006. Risk Ownership in Contract Manufacturing. Manufacturing and Service Operations Management. Forthcoming.
Ülkü, S., Toktay, B.L., and Yücesan, E. 2005. The Impact of Outsourced Manu-facturing on Timing of Entry in Uncertain Markets. Production and Operations Management. 14 (3): 301–314.
Van Mieghem, J. 2015. Operations Strategy: Practices and Principles. Dynamic Ideas.Van Weele, A.J. 2005. Purchasing and Supply Chain Management: Analysis, Strategy,
Planning and Practice. Thomson. 4th Edition.Wang, C.X. and Benaroch, M. 2004. Supply Chain Coordination in Supplier
Centric B2B Electronic Markets. International Journal of Production Economics, 92, 113–124.
Wilson, R.H. 1934. A Scientific Routine for Stock Control. Harvard Business Review, 13 (1): 116–128.
Yoffie, D.B. and Kwak, M. 2006. With Friends Like These. Harvard Business Review, September, 89–98.
Young, S.D. and O’Byrne, S.F. 2001, EVA and Value-Based Management, McGraw-Hill.
Yücesan, E. 2005. CIBA Vision: The Eurologistics Initiative. INSEAD Case Study.

165
Index
Accounts Payable (A/P) 34, 86Accounts Receivable (A/R) 34, 86Agri-business 1, 4, 82, 86Airbnb 147Airbus 36Alpla 155APS 124Apple 39, 60, 76Amazon 20, 39, 106, 121ASML xiv, 4, 55, 57, 93Assemble to Order (ATO) 22Asset-based financing 88Assortment planning 68
B2B 128Balance Sheet 29Barilla 96, 105Base stock policy xiv, 69, 71Batch size 83, 93Bayer 2Benetton 22BRIC 48Bullwhip phenomenon 47, 92Business Process Reengineering
(BPR) 20Buyback contracts 103
Cannondale 49Carl Zeiss 54, 57, 93Cash to cash cycle 32Center for Research on Epidemiology
of Disasters 58CIBA Vision xiv, 142Cisco 65Client-server architecture 42Clockspeed 39, 43, 55Closed-loop supply chain 20Coca Cola 26Coloplast xiii, xv, 72Coordination xii, 22, 28, 32, 53, 92Collaboration xii, xv, 102, 105Collaborative Planning, Forecasting and
Replenishment (CPFR) 22, 97
Consumer surplus 17Contract manufacturing 53, 113Contract Research organization (CRO)
113Contract Sales Organization (CSO)
113Corporate social responsibility (CSR)
xvi, 155Cost of Goods Sold (COGS) 27, 31Cost-service trade-off xv, 12, 18, 67,
73, 76Critical fractile 72, 100Customer Relationship Management
(CRM) 43, 149
DEC 41, 116Decoupling point 38Demand forecasting 68, 73, 93, 94Demand-supply mismatch 4, 9, 98,
101Delayed customization 9, 47, 76,
95Dell 20, 32DfX 49, 127Double helix 42, 76Double marginalization 102
E-commerce 39, 129Economic Profit xi, 28, 29Economic Order Quantity (EOQ) xiv,
82, 93Efficient Consumer Response (ECR)
17, 22, 97, 146Electronic Data Interchange (EDI)
17, 97, 120EMS 53Enabling technology 20, 116ERP 42, 116Eriksson 53
Fair Labor Association 60Fill rate 72, 73Firmenich xiv
166 Index
Flextronics 53Flow
Material 19Information 19Cash 19
Fnac 67Ford 91Forward buying 94Free cash flow xiv, 27, 45, 46Foxconn 60Full Truckload (FTL) 94
Good Guide 60Google drive 121Governance 53
Hachette 106Hackett Group 34Higg Index 156Holding cost 4, 82HP 32, 55, 57, 72, 75, 95, 150
IBM 32, 41Integral product design 49Intel 40, 41, 42, 49, 54, 55, 57Internet 39Inter-operability 41ISO 131, 156IT 111, 120Inventory
Cycle 82Decoupling 84Management 79Pipeline 80Position 69Seasonal 81WIP 79
Just in Time ( JIT) 20, 31, 38, 76, 83, 95, 107, 149
Kone 140Kurt Solomon and Associates xi
Landed cost 17Less than Full Truckload (LTL) 94Li and Fung 32Linear programming xiv, 48Little’s law xiv, 80
Logistics 110Loss of goodwill 4Lost sales 4, 21Lufthansa Cargo 146
Maersk 99Make to Order (MTO) 38, 39Make to Stock (MTS) 22, 38, 39Make vs Buy 25, 52, 112Market mediation 21, 22, 129Mattel xiv, 128McDonalds 137McKinsey Global Institute 11Microsoft 41, 42Modigliani-Miller 87Modular product design 49, 54Monsanto 2Moore’s Law 56MRO 38, 129Munich Re 60
National 49NEC 41Net Present value (NPV) 30Newsvendor model xiv, 47, 71, 84,
87, 98Nissan xivNokia 53Normal distribution 72NORMINV 100NORMSINV 72
Obsolescence 4, 68, 73OEM 53On Time in Full (OTIF) 111Open architecture 41, 42, 49Operating cycle 32, 85Opportunity cost 17Opportunity cost of capital 4Oracle 43L’Oréal 155Organizational structure 20, 42,
54Outsourcing see Make vs BuyOverage cost 47, 71, 72, 83, 98
Patagonia 156Pioneer 2, 48Poisson process xiv

Index 167
Point of sales (POS) 22Postponement see Delayed
customizationP&G 94Process 20, 41Process design 25, 47, 49Product design 25, 47, 49, 54Product life cycle 111, 113Product-Process Matrix 137Profit and Loss (P&L) 17, 29PSA (Peugeot-Citroën) xiv, 137Pull system 69
Quantity discounts 103, 108Queueing models xiv, 139
Replenishment cycle 70, 87, 88Responsible sourcing 60Retail Link 129Return on Invested Capital (ROIC)
xi, 107Return on Net Assets (RONA) xi,
107Revenue sharing 103, 114RFI 131RFQ 131Risk
Appetite 47Management xvi, 45 49, 54, 57Residual 64
Safety stock 71, 83Sales forecast 8, 68Sales, General and Administrative
(SG&A) 27, 31Sales and Operations Planning (S&OP)
5, 94SAP AG 43, 116, 118, 127Sarbanes-Oxley Act 64SCI Sanmina 53SCOR model 45Sedex 156Sensitivity analysis 48Service level 19, 71Service Oriented Architecture (SOA)
43, 126Setup Cost 82, 83Shortage gaming 94Shouldice Hospital 140
Siemens 53Smart car 49Solectron 53Sourcing 108, 128Specialized 49Standard loss function 73Stockless production 79Stock out 4, 21, 68Stock keeping unit (SKU) 8Supplier capacity 85Supply base 38Supply chain
Definition 19Design 22, 28, 30, 32, 45
Sustainable Apparel Coalition 60, 156
Swatch 62Syngenta xiv, 4, 20, 153
Tazreen Fashions 156TCP/IP 124Three-Dimensional Concurrent
Engineering (3D-CE) 25, 35, 46, 48–50, 95, 127, 137, 155
Total Quality Management (TQM) 20
Trade credit 87Two-part tariff 103
Uber 147UN Global Compact 156Underage cost 47, 71, 72, 83, 98UPS xv, 20UTC 130
ValueBased management xi, xii, 24Capture xii, xv, 17, 24, 91Creation xii, xv, 17, 24, 38, 45,
67Shareholder 26, 28, 44Stick 17
VAX 116Vendor Managed Inventory
(VMI) 22, 96, 108Vertical integration 42, 98Voluntary Inter-Commerce Standards
(VICS) 21VooDoo 49

168 Index
W. W. Grainger 129Walmart 129, 156Weighted Average Cost of capital
(WACC) 29Wells Fargo 89Web services 43, 117, 125Willingness to Pay (WP) 17, 24, 50,
155
Wilson’s square root formula see EOQ
Working capital Requirements (WCR) 30, 32, 34, 85
Xerox Corporation 38
Yield loss 85