Embed Size (px)
Citation preview
J Comp Physiol B (1985) 156:3-11 Journal ofComparative \Physiology BI© Springer-Verlag 1985
Biochemical.Symttmlcand Environ-
•*;•;:
An allometric comparison of the mitochondriaof mammalian and reptilian tissues: The implicationsfor the evolution of endothermyP.L. Else* and A.J. Hulbert**Department of Biology, The University of Wollongong. Wollongong NSW 2500. Australia
Accepted April 8, 1985
Summary. The effects of body size and phylogenyon metabolic capacities were examined by comparing the mitochondrial capacities of 6 mammalianand 4 reptilian species representing 100-fold bodyweight ranges. The mammals examined included
^3 eutherian, 2 marsupial and a monotreme species:and the reptiles 2 saurian, 1 crocodilian and 1 tes-tudine species. The tissues examined were liver,
.kidney, brain, heart, lung and skeletal muscle. Allometric equations were derived for tissue weights,:mitochondrial volume densities, internal mitochondrial membrane surface area densities, tissuemitochondrial membrane surface areas both pergram and per total tissue and summated tissue mitochondrial membrane surface areas.
For the mammals and reptiles studied a 100%increase in body size resulted in average increasesof 68% in internal organ size and 107% in skeletalmuscle mass. Similarly, total organ mitochondrialmembrane surface areas increase in mammals andreptiles by an average 54% and for skeletal muscleby an average 96%. These values are similar toincreases in standard (54 and 71%) and maximum(/3 and 77%) organismal metabolism values foundby other authors for mammals and reptiles respectively.
Although the allometric exponents (or rates ofchange with increasing body size) ofthe mitochondrial parameters in mammals and reptiles are statistically the same, in general the total amount ofmitochondrial membrane surface area in the mammalian tissues are four times greater than foundtnhe reptilian tissues. These differences were not* Current address: Department of Developmental and Cellu-
W7iV?Sa University of California, Irvine. California.To whom offprint requests should be sent
the result of any single 'quantum' factor but arefEDffiua b \ I VIA VM \
tissues with a greater proportion of their volumeoccupied by mitochondria and to a lesser extentincreases in the internal mitochondrial membranesurface area densities. Mitochondrial volume density from this present study would appear to bethe major factor involved in changing weight specific metabolism of tissues both as a result of changes in body size and in the evolution of endothermyin mammals from reptiles.
IntroductionTwo of the major determinants of how much oxygen an animal will consume under standard conditions are its body size and its phvloeenv. An increase in body size of 100% increases an animal'stotal oxygen consumption by 68%. This is generally true for both mammals (Kleiber 1961; Dawsonand Hulbert 1970) and ectothermic vertebrates(Hemmingsen 1960; Bennett and Dawson 1976-Taigen 1983) and is described by the relationshipbetween metabolism (M) and body size (W) as,V/ = a W015. The phylogenetic differences betweengroups of animals lies in the level of their totalorganismal oxygen consumptions. Mammals consume vastly greater amounts of oxygen (5-10 x)than similar sized ectotherms measured at the samebody temperatures (Dawson and Hulbert 1970-Bennett and Dawson 1976). These differences areshown in the 'a' constants (or elevations) whichare higher for mammals than for ectothermic vertebrates.
In the evolution of mammals from reptilesthere has been a transition from low to high meta-
.•••
1 2

bolic capacities. In a comparison between singlemammalian and reptilian species, of similar body
S e r M ^ r f ^ ^ ^ t e m ^ ^ ( E l s e a n d "Hulbert 1981), large differences in the mitochondrial capacities of the tissues from each specieswere found. These differences always showed increased metabolic capacities in the mammalian tissues compared to the same reptilian tissues. In afurther comparison (Else and Hulbert 1985) themitochondrial capacities of liver, kidney, brainheart. lung and skeletal muscle, measured by determining the mitochondrial membrane surface areasTpm* d-TSC mammal^n species over a100-fold weight range showed allometric expo
nents characteristic of those for aerobic metabo-ism of the whole animal. In this present paperthe mitochondrial capacities ofthe same six tissuesfrom 4 reptilian species representing 3 reptiliansubclasses and a 100-fold weight range are examined. M.tochondrial volume densities, membranesurface area densities, tissue weights, tissue specificand total tissue mitochondrial membrane surfaceireas are determined and compared allometricallvto those values found for mammals
P.L. E.se and A,. Hulbert: A.lometry of mitochondria in mammals and rept,
•Materials and methods
Animals. The reptilian species used in the comparison are the\wrte Amphibolous nuchalis (body weights 29 ' a d "6" and
*£h^«yifeps .246 g and 249 ,,. lhc freshwatef £^dnfr^l'Tw''" ,5?5g and S82a and freshwatercrocodile. Crocodylusjolmstoni (242 g and 22S6 gl The lizardswere maintained in temperature controlled boxes at V, ±?»C
ml mT r"fCr t0nf" VV,erC kept at room ^mperature (25 X)n a filtered, aerated pool wilh access to a drv pen area Thecrocoddes were obtained from Sydney Universitv. Th 7:irdand tortojses were ,ed daily on a varied fruit, meat, JJ5J
,., , . " ,""" jh^'" uacu mciuue the mouse ( Wta nut-culus; body weights 27 g and 41 a, ,1-., nl , d „, [A"ISI"">35 « ind 7Q« a\.„A ,u u sl' at {Ra"us norvegicus;ind 2061~> Thi ! l°Vcu*V» ™>™t«s; 1870 gind .067 g). The marsupial mammals include the brown ante"-
evince TOS lhe echidna j *««*£SSSy-iJ
V JilY"'!^ fr?m CaCh Species were "*•<• to determinei mitochondnal volume and membrane surface area denies.d tissue weights. The tissues used were the liver k.dnev
e cTP; :r;- unf and *ns*muscie «=—- «£&except for A. nuchalis and M. musculus where onlv liver kidnevbram and heart values are available. These value (or A w7a
HuSen »bTss r i,\°h previousiy ~("muoert 1981). Only liver, kidney and heart data is availabletrom either one or the other of the two A. uuariiutdtnl
■?ii ci- i, I gdst,rocnem,us '"uscle but muscle weight includes
Determination of tissue weights and the »»»««*, „,-,,.. .,...Animals were killed either bv dec;Sagital. The six tissues: liver, kidigastrocnemius muscle were quickly renand weighed (±0.001 g). The carcass.complete body composition determi
dTJ' r °f UleSiX tJSSUes Were P'accd in ■<* col.a£ which ".r '" °-1 Mr S°diUm CaCod-vlale buffer oven..ca«er which they were fixed in 2% w/v osmium tetroxide"
is" 1rff^'ate buffer ^=7.4) for 4h and!nnsea in _/0 w/v sodium acetate and bulk stained in ?«/ «,uranvl acetate. The tissue samples were then d hydethanol series (30-100% dry) over 3 h. transferred to imdry acetone (2x15 min) and infiltrate/- - -tone: Spurrs resin for lh and 12 h „-,„.blocks were then placed in pure resin for 1 „ ;,K
and sodium cacodylate (97%) were obt-:-
aUA K ^H10"0- W nitratC auu soaium a«*«e wer(99%) wS stS h?^ by 2? Chemicals- Sodium citra(V9/0) was supplied by May and Baker Laboratory Chemical
SfacS^t^ 'VOm i°hnS°n Malthe-V Chemica.smu"nvl acetate and Spurrs resin kits were purchased from Polaron
^V^0nl *T ICn rand0mly chosen tissu,chocks (12 blocks in the case of the liver) were sectioned fo-each tissue of every individual animal studied SSmS
"a "kn ivT ? ° " an "J^^ome (LKB 8800 , ) Sglass knives and supported on 200 um copper mesh grids.
Electron microscopy and stereology Imagnifications of x 6.200 and 53".000 wc-v tsectioned tissue block using a JEM 100U elect'
chondral 0voZe°HgraPhS "*V?* l° determine relativ« ■»■>cnonanal volume densities and inner - 'surface areas. The x 53.000 microsra,.termination of cristae membrane surfed -.«»«brane surface densities (SVc) were mt(state 4) mitochondria.
Relative volume densities of the iestimated by projecting electron micrographs"onto a*28^square screen with a 100 point lattice test svstem The surface
?Z the ^ r ^ " I t * " * " -embranes were oundfrom the projection of electron micrographs onto similarscreens and counting the number of intersections (I) The
SSd u? diUmCterS °f kn°Wn ,cn th Sn a u atest grid, using the equation
SV«-=21,/LT(1)
^tw-Ki^S lhe SUrface area Per voll"*-e ratio (m2-cm-3)from Weibel (1969). Cristae membrane surface arcasVT *>termmed from within the mitochondria using the x 53 Ootl-'
m" oTSSnH '" I" UmtS °f ^ °f Cristae -mbrane perli!J u"8, nn°r membrane surface areas (Sv. ) de-erm.ned from the x 6.200 micrographs and therefore Native
^mbaneenVer !"' T? h ^ ^^ of inner -itocho dria^ ,pe,r Cm uof «»« a"d are a function of both the^shape and number of the mitochondria. The mitochondrialmembrane surface area per cm3 (Sv) for each tissue Zt Sc™mined using the following equationS v = ( S v c - V v / 1 0 0 ) + S V i n , ( 2 )
Z^\Sva *q^iS Cristae surface area densities (m^-cm"3 ofr « 0 S " ' S 7 - — b r a n e s u r f a c e a r e a d e n s -dens fies 7/ of ] J* V' 6qUals milo^ondrial volumeaensities ( /„ of tissue volume). The units of S pn„r-i ,h 2of roi-ochondrial membra„e pir cubic cemi^fre 3S*^

P.L. Else and A.J. Hulbert: Allometry of mitochondria in mammals and reptiles
0.20
O Mammal■ • Reptile
Liver 0
VB r a i n ^
•DO
H e a r t o
S k e l e t a l < Wm u s c l e > ^ o
K i d n e y / /
c X > r
O Momma/ Skeletal o^" ta ST6 mitochondnal membrane surface areas (m2) were de-400 ■ • ffepWe muscle y% "vcd by multiplying Sv by respective tissue weiahts (assuming
// the specific weight of the tissues to be that of water)
Statistics. Equations used for the biostatistical analvsis wereobtained from Zar (1974). Mammalian and reptilian allometricslopes were tested for significant differences. In the two only
; , c a s e s w h e r e t h e s l o p e s o f t h e m a m m a l i a n a n d r e p t i l i a n r e c e ssions were found to be different no further statistical analvsis
o / / w a s P e r f o r m e d . W h e n t h e m a m m a l i a n a n d r e p t i l i a n s l o p e s w ' e r e) X / f o u n d t 0 b e P a r a l l e l ( i . e . s t a t i s t i c a l l y t h e s a m e s l o p e s ) , t h e e l e v ations were tested for significant differences. Percentage differ
ences (Table 3) between the mammalian and reptilian mitochondrial parameters were calculated from common slopes(where slopes statistically parallel) and adjusted mean scores.
i
S ^ ^ R e s u l t s
| " " T h e l i v e r , k i d n e y , b r a i n , h e a r t a n d s k e l e t a l m u s c l er- tissues are all larger in mammals than in reptiles.
^ Kidney / These results are shown in Fig. 1 and the corre-/<&•, sponding allometric equations Tor the reptiles are
y* r given in Tab,e 1 and for tr-e mammals in Table 2.ry^^y* In a11 figures each point represents the data from
/ ' • a s i n g l e a n i m a l ._ _ v ^ I . T h e * u r - g i s t h e o n l y o r g a n t o h a v e a s i m i l a r_ ~~J~ ' *i 1 1 1 weight in both the mammals and reptiles, although00 BcCL/m l9rl°s, ,00° ,lhe 'fP"1" delude two aquatic species. The repti-
. lian lung allometric exponent of 0.73 is less thanFig. 1. A comparison of mammalian (o) and reptilian (•) tissue - -0 found by Tenney and Tenney (1970). The allo-W C l g t S m e t r i c e x p o n e n t f o r t h e h e a r t w e i g h t o f t h e r e p t i l e s .
^?i5T* eqUati°nS f°r tlSSUe WeigHlS- mil°Ch0ndrial V0,U™ d^>- a"d mitochondrial membrane surface areas
Skeletal muscle
"-= number of animals
0.05 W0-*5 *c(±0.28.0.95)0.03 H-'0-63 *c(±0.25,0.93)0.11 H/°-3.c(±0.47, 0.54)0.01 IV0-71*'(±0.12, 0.99)0.04 IV0-'3 *(±0.59.0.86)0.19 WXM *(±0.43.0.96)
Mi tochondr ia l Mi lv o l u m e ( m ;d e n s i t y —(% of cell volume) per
Mitochondrial membrane surface area(m-)
11.03 rV0Alt(±0.49.0.21)18.33 iv-°-09'(±0.21,0.39)2.51 IV009(±0.27,0.30)39.99 W-°A1*(±0.19.0.61)0.38 fV0-24(±0.48.0.56)0.89 Ji'0-0(±0.66.0.39)
centimetre3 ofmitochondria *
15.28 ir-°01(±0.21.0.31)21.49 H'0-05(±0.15.0.29)32.05 IV003*(±0.14.0.22)30.10 W001'(±0.10.0.56)89.61 ir01"(±0.39.0.53)93.23 ty-o.i4(±0.29.0.53)
percentimetre3 oftissue
2.58 W-Ql0t(±0.47.0.22)6.05 jr-oo-(±0.14.0.43)0.92 W0AS(±0.40.0.54)15.62 IV012*
:0.20. 0.52)0.55 IV002(±0.82.0.04)1.17 If005(±0.63. 0.09)
0.14 IV0-1* •«(±0.48,0.84)0.18 W0S6*<(±0.30.0.88)0.10 W0Ai *'(±0.43.0.73)0.18 W0bi*'(± 0.23. 0.94)0.04 W°M *(±0.65.0.82)0.22 It'114 *(0.37. 0.97)
s Denotes statistically different elevations between mammals and reptiles (P<0 05)• Denotes statistically different slopes between mammals and reptiles (P<0 05)1- Keters to cristae membranesV in grams

« i P. L . E l s e a n d A . J . H u l b e r t : A l l o m e t r y o f m i t o c h o n d r i a i n m a m m a l s a n d r e p t i l e s
Table 2. The allometric equations for tissue weights, mitochondrial volume density and mitochondrial membrane surface areasin tissues of mammals
n Tissue Mitochondrial Mitochondrial membrane surface areaweight volume (m2)(g) density
(% of cell volume) per per percentimetre3 of centimetre3 of totalmitochondria r tissue tissue
Liver 10 0.09 W081 * 27.51 lV~0Ai * 35.01 W~0Ai * 11.42 W0-2** 0.98 W°-6A *(±0.13,0.98) (±0.12.0.70) (±0.07,0.88) (±0.09,0.91) (±0.10,0.98)
Kidney 10 0.03 W0'8 * 37.97 IV'01-1* 53.15 lV~0Ai 21.71 IV0" * 0.76 IV055 *(±0.17,0.97) (±0.13,0.64) (±0.12,0.56) (±0.20,0.66) (±0.28,0.85)
Brain 9 0.05 W0b9 * 5.38 IV000 69.37 W-°A1 * 4.65 W-°Al * 0.21 W059 *(±0.24,0.93) (±0.08,0.03) (±0.09,0.79) (±0.10,0.71) (±0.19,0.94)
Heart 10 0.01 w°-83 * 42.23 IT-0-09 * 74.95 jT"008 33.61 iV0A6* 0.45 W°-61 *(±0.09.0.99) (±0.06.0.73) (±0.10.0.56) (±0.12,0.72) (±0.18,0.95)
Lung 7 0.01 iv0-90 * 5.89 IV"011 98.79 iV~0-n 1.52 W-°07 0.07 If066 *(±0.26.0.97) (±0.42.0.30) (±0.26.0.60) (±0.62,0.14) (±0.39, 0.89)
Skeletal muscle 7 0.42 WlM * 8.16 W-°09 110.03 W~0Ai 12.39 W~°-13 5.16 W013(±0.36,0.96) (±0.41.0.25) (±0.34,0.40) (±0.61,0.41) (±0.81,0.74)
n = number of animals( ) Within the brackets firstly there is the ±95% confidence limit for each exponent and secondly the correlation coefficient* Denotes exponents statistically significant from 0 (/><0.05)+ Refers to cristae membrane onlyW in arams
Liver
••
Skeletal muscle
Brain
•
Lung
° 0
4 ^Heart
•O Mammal• Repti le
n 1 1 '
Kianey
2 0 1 0 0 1 0 0 0 2 0 1 0 0 1 0 0 0Body weignt (grams)
Fig. 2. A comparison of mammalian (o) and reptilian (•) tissuemitochondrial volume densities
0.77 is less than that found for sea fish at 0.89(Poupa et al. 1981). The skeletal muscle exponentof 1.09 is very similar to those found for intraspecific comparisons in teleost fish with exponentsranging from 0.90 up to 1.21 (Somero and Chil
dress 1980). For the mammals the liver and brainexponents are the same as found by Brody (1945)and the kidney, heart, lung and skeletal muscleexponents are slightly less than values found byBrody (1945), Prothero (1979), Stahl (1967) andHeusner (1964) respectively.
The mitochondrial volume densities of the sixmammalian and reptilian tissues are compared inFig. 2 and the allometric equations for the reptilianand mammalian tissues given in Tables 1 and 2.Reptilian liver, kidney and heart tissues all scalewith negative slopes as do all the mammalian tissues (except brain, slope = 0), with the mammalianliver, kidney and heart scaling with negative slopessignificantly different from zero. All six tissuesshow statistically parallel slopes between the mammals and reptiles. The liver, kidney and heart alsoshow significantly different elevations in mitochondrial volume densities per cm3 of tissue betweenthe mammals and reptiles. The average differencebetween the mammalian and reptilian tissues is a60% increase in the mitochondrial volume densityin the mammalian tissues.
Within the mitochondria the internal membrane surface area density (cristae membrane)differs only slightly between the mammals and reptiles. The mitochondrial membrane surface areadensities per cm3 of mitochondria for the mammalian and reptilian tissues are compared allometrically in Fig. 3, the corresponding allometric equa-

P.L. Else and A.J. Hulbert: Allometry of mitochondria in mammals and reptiles
inn J O Mammal' 1 • R e p t i l e
L O A L i v e r
Skeletal muscle
^ ^ c !
^ ! - ^ ;
i 3-; . = 4 0» U)> c
2 0 1 0 0 1 0 0 0 2 0 1 0 0 1 0 0 0Body weight (grams)
ig. 3. A comparison of mammalian (o) and reptilian (•) mito-hondrial membrane surface area densities
Liver Skeletal muscle5 ■
; 2 -i! ■ •1: 0.5* •
•) 0.2-
! L •3rain
- T J - r p — < £ > fh»Lung
O•
o °i 0.25 ■
! 2 5 -
| 1 0 -
L -
•
Heart
•
o oCc£
Kidney
-O-SL
1-o
O Mammal0.25 - • Rep tile
T 1! 0 1 0 0 1 0 0 0 2 0 1 0 0 1 0 0 0
Body weight (grams)ig. 4. A comparison of mammalian (o) and reptilian •) tissuelitochondrial membrane surface areas
ons for the reptilian tissues are given in Table 1nd for the mammalian tissues in Table 2. The livernd brain of the mammals show negative slopesignificantly different from zero whereas none ofie reptilian tissues show slopes significantly differ-
O Mammal• Rep tile
Liver
Ske le ta l 0 ,m u s c l e y / 7
i
E r a i n °
•
Lung
H e a r t °
h i 1
Kianev8
° s ^ - * f
^ ^■ - •
T 1 12 0 1 0 0 1 0 0 0 2 0 1 0 0 1 0 0 0
Body weight (grams!
Fig. 5. A comparison of mammalian (o) and reptilian (•) totaltissue mitochondrial membrane surface areas
ent from zero. The mitochondrial membrane surface area densities per cm3 of mitochondria forthe mammalian and reptilian tissues show no statistical differences in slope (with the exceptions ofbrain and heart mitochondria) or elevation values(Table 1).
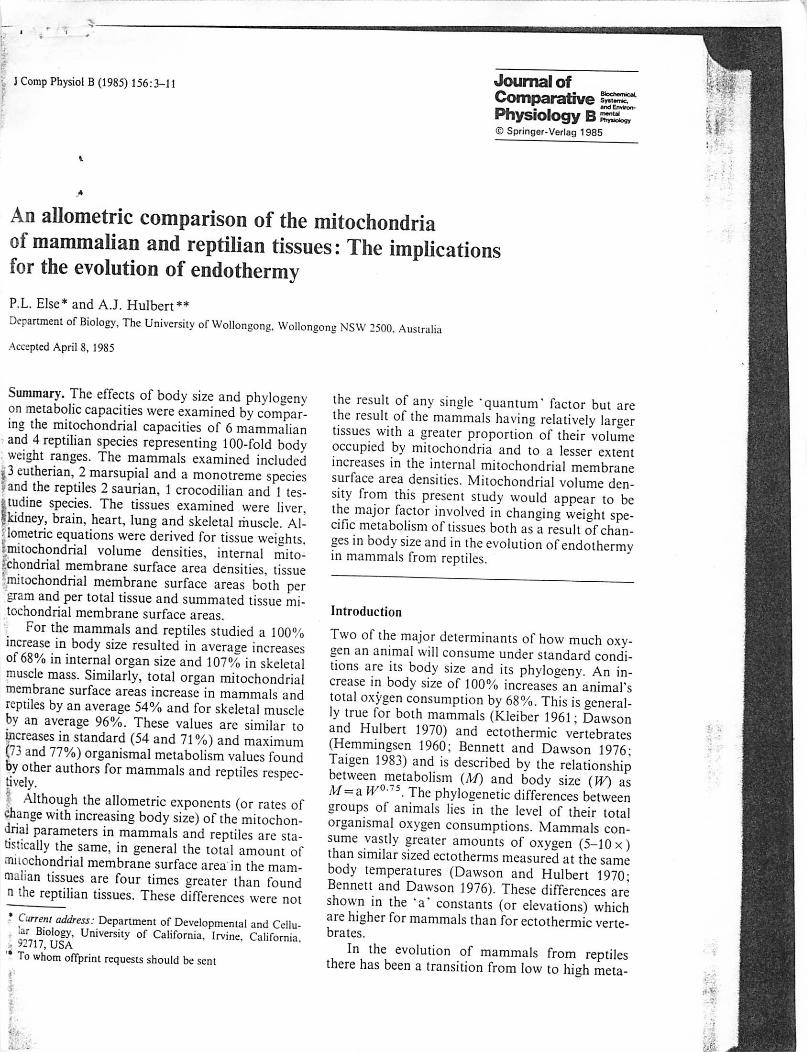
Using data for mitochondrial volume densities,cristae and inner membrane surface area densities,the mitochondrial membrane surface areas per cm3of tissue have been determined (see Methods Eq. 2)and these values are compared in Fig. 4 and theallometric equations for the tissues are given inTables 1 and 2. All the mammalian tissues scalewith negative slopes and those for liver, kidney,brain and heart tissues are significantly differentfrom zero. None of the reptilian tissue show slopessignificantly different from zero. All the mammalian and reptilian slopes are statistically parallel,with liver, heart and kidney all showing statisticallydifferent elevations between the mammals and reptiles. The differences in the mitochondrial membrane surface areas per cubic centimetre of tissuebetween the mammals and reptiles range from 10%greater in the brain to 110% greater in the liver.
P.L. Else and A.J. Hulbert: Allometry of mitochondria in mammals and reptile
membrane 0.75 and 1.00 and weight specific tissue mitochon" increased
is included. Totaltissue mitochondrial membrane surface area forthe mammalian and reptilian tissues are comparedin Fig. 5. The allometric equations are aiven inTables 1 and 2. All slopes for both the mammalsand the reptiles are positive and parallel and allsignificantly different from zero with the one exception of mammalian skeletal muscle. For themammals the tissues which show exponents significantly less than one are liver, kidney, brain andheart, and for the reptiles kidney, brain and heart.Although the slopes are parallel for total tissuemitochondrial membrane surface area, the liver,kidney, brain and heart tissues all show statisticallydifferent elevations between the mammals and reptiles.
DiscussionAs previously noted for mammals (Else and Hulbert 1985) the relationship between body size andoxygen consumption shows effects at many different levels of organization from ecological andphysiological, through to cellular and subcellularlevels. Similar allometric relationships between organismal metabolism and body size are also reflected at different levels within the biology of theictothermic vertebrates. As a result of the phyloge-aetic differences between the mammals and reptilesthe elevations or -a' constants show phylogcneticrelated effects at the different levels of organizationbetween the mammals and ectothermic vertebrates.ror example, the field metabolic rates of lizardsduring the active season are allometricallv correlated with body mass (H'°-so) but are twenty timeslower than for similar sized mammals (Nagy 1983).Respiratory variables such as heart weight in mammals (Stahl 1967: Prothero 1979) and fish (Poupat al. 1981) scale allometrically with similar slopes-ut the mammals have larger hearts as indicatedjy the 5 times higher value of their elevation constant. Similarly, the aerobic enzyme capacities ofmammalian tissues have been shown to be greaterthan those for similar sized reptiles measured atthe same temperatures (Bennett 1972; Else andHulbert 1981).
In both mammals and reptiles the total mitochondrial membrane surface areas of the tissuesshow allometric exponents characteristic of thosewhich describe metabolism of the whole animal.In the majority of tissues these exponents are madeup of tissue weights with allometric slopes between
«*.«*, mvu.L/.aug sui-ciLc area densities with slopebetween -0.25 and zero. Although the slopes othe allometric equations describing total tissue mitochondrial membrane surface area are statisticalthe same, in the mammalian tissues the elevation;are significantly higher, approximately 4 timthigher in the liver, brain and kidney and 3 time,higher in the heart. Also higher in the mammalsare the skeletal muscle (2.2 times) and lung(1.4 times) total tissue mitochondrial membranesurface areas (Table 3).
The increased mitochondrial capacity of mammals compared to reptiles is not the result of amsingle "quantum' factor but is primarily a resultof the mammals having relatively larger tissueswith a greater proportion of their volume occupiedby mitochondria. Internal mitochondrial membrane surface area densities (i.e. per cm3 of mitochondria) show no large differences between themammalian and reptilian mitochondria and therefore are not major contributors to the observeddifferences. All differences measured for tissuesizes and mitochondrial parameters in mammalianand reptilian tissues regardless of how small thedifference, are always to the increased metabolicadvantage ofthe mammalian tissues (Table 3). Thrfactors which contribute to the observed differences between the mammalian and reptilian totaltissue mitochondrial membrane surface areas alsovary in their relative contributions depending uponthe species.
Organismal metabolism is presumably a resultoC the cumulative metabolisms ofthe tissues. Considering the largest and most active organs (liver,heart, kidney and brain) to be major contributorsto standard metabolism (Drabkin 1950) and sum-mating the total tissue weights of those from eachindividual reptile and mammal measured the allometric equations described are given in Table 4.When the total mitochondrial membrane surfaceareas of the same four tissues are similarly treatedthe exponents from the allometric equations (Table 4) are 0.67 and 0.59 for the reptiles and mammals, respectively. Standard oxygen consumptionfor reptiles in general (Bennett and Dawson 1976)and for the mammalian species used in this study(Else and Hulbert 1985) show exponents of 0.77and 0.62, respectively.
The elevation values for the allometric equations describing total mitochondrial membranesurface area for the same four organs are significantly different (P<0.01); the mammalian elevation value is 3.7-fold higher than the reptilian elevation value. The mammals appear to have a total
P.L. Else and A.J. Hulbert: Allometry of mitochondria in mammals and reptiles
Table 3. Relative differences of mitochondrial parameters: mammals compared to reptiles
Organ size Inner Cristae Mitochondrial Mitochondrial Total tissue(%) mitochondrial mitochondrial volume density membrane mitochondrial
membrane membrane (% of cell surface area membrane« surface area surface area volume) (m2-cm~3 surface area
(m2-cm~3 (m2-cm~ 3 of tissue) (m2)of tissue) of mitochondria) 1 (%) (%)
A (%) (%)
Liver 186 200 103 219 213 395Kidney 253 123 106 156 156 404Brain 374 116 - 133 107 439Heart 165 142 - 166 174 288Lung 84 156 I l l 160 148 141Skeletal 129 197 119 140 172 223Muscle
Values are percentages with mammalian values expressed relative to a 100°a reptilian value. Percentage differences calculatedfrom common slopes (where slopes are statistically parallel) and adjusted mean scores
Table 4. The allometric equations for summatcd tissue weights and mitochondrial membrane surface areas in reptiles and mammals
Reptiles Mammals
n Total tissue Mitochondrial / ; T o t a l t i s s u e Mitochondrialweight membrane weight membrane(grams) surface area
(m2) per totalof tissues
(grams) surface area(m2) per totalof tissues
Summated organsLiverKidney o 0.14 W°~s * 0.55 H/0"7 * 0.18 ir0H3* 3.04 ir0-5* *Brain o (±0.18.0.97) (±0.21. 0.96) (±0.11.0.99) (±0.11. 0.98)Heart
Summated tissuesLiverKidneyBrain c. 0.24 IK1-07 * 0.30 »■" " * 0.51 Ii'100* 6.S5 ir0"0*Heart 0
(±0.34,0.98) (±0.36.0.97) (±0.31.0.96) (±0.73.0.77)LungSkeletal-Muscle
n = number of animals() Within the brackets firstly the ±95% confidence limit for each exponent and secondly the correlation coefficient" Denotes exponents statistically significant from 0 (P<0.05)W in grams
3-4-fold greater mitochondrial membrane surfacearea in these four organs.
Maximum oxygen consumption is presumed tobe predominantly the result of muscle metabolism.If skeletal muscle and lung are combined with theorgans already examined (liver, heart, kidney andbrain) the allometric equations describing total tissue weight become as shown in Table 4. The exponents of these equations for both the reptiles andmammals are increased compared to those previously found for the four organs alone. This increase is carried over into the exponents describing
the total mitochondrial membrane surface area ofthese tissue for both the reptiles and mammals (Table 4). The elevation values for the allometric equations describing the total mitochondrial membranesurface areas for skeletal muscle, lung and the fourorgans are 2-3-fold greater for the mammals thanfor the reptiles. This again shows that these particular mammals have 2-3 times more mitochondrial membrane surface area compared to the reptiles.
The exponents for maximum oxygen consumption for reptiles, 0.82 (Bennett and Dawson 1976)and mammals, 0.79 (Taylor et al. 1980) show in-