Embed Size (px)
Citation preview
11th INTERNATIONAL SYMPOSIUM ON COMPRESSOR
& TURBINE FLOW SYSTEMS THEORY & APPLICATION AREAS
SYMKOM 2014 IMP2, Lodz, 20 - 23 October, 2014
An advanced CFD model to study the effect of non-condensable
gas on cavitation in positive displacement pumps Aldo Iannetti
1*, Matthew T. Stickland
2, William M. Dempster
2
1,2 University of Strathclyde, 16 Richmond Street, Glasgow G1 1XQ, Scotland, United Kingdom
Abstract: An advanced transient CFD model of a positive displacement reciprocating pump was
created to study its behavior and performance in cavitating conditions throughout the inlet stroke.
The “full” cavitation model developed by Singhal et al. was utilized and a sensitivity analysis test on
two amounts (1.5 and 15 parts per million) air mass fraction content was carried out to study the
influence of the air content in water on the cavitation phenomenon. The model was equipped with
user defined functions to introduce the liquid compressibility which stabilizes the simulation and to
handle the two-way coupling between the pressure field and the inlet valve lift history. Estimation of
the pump performance is also presented in both cases.
Keywords: Cavitation, PD pumps, non-condensable gas effect, CFD
1. Introduction
Cavitation in pumps is still a debated topic in technical literature. The main discussed subject focuses
on how to correctly estimate the NPSHr of the device. The reason for the persistence on the NPSHr is
mainly due to the achievement of the requirement specified in the API 610, API 674 and DIN EN ISO
13710 standards where, either in Positive Displacement (PD) pump or in centrifugal pumps, a certain
safety margin to cavitation is fixed. Since pump manufacturers are required to specify the NPSHr,
researchers are called to develop tools and procedures to study cavitation in pumps and to estimate
accurately the NPSHr. In the case of centrifugal pumps, for instance, many authors such as Ding [1],
developed a CFD based tool to estimate the NPSH-Head curve to find the operating conditions where
the drop of 3% in head occurs as specified by the API. Ding also stated that the definition of the
NPSHr is affected by the content of air in water. Budris [2] carried out research oriented to
understand the effect of the air content in water in the estimation of the performance of centrifugal
pumps. Budris found that a little amount of air reduces significantly the suction pressure pulsation,
increasing the amount of air content above a certain threshold no further improvement on the
pressure fluctuations results while an increment of the NPSHr occurs.
The case of PD reciprocating pumps appears to be different. The API 674 still defines the NPSHr as
the NPSH where a decrement of 3% in volumetric efficiency occurs but many authors do not agree in
considering the NPSHr in PD pumps a precise engineering requirement. Miller [3] for instance stated
that any suction pressure above the NPSHr would only improve the performance in many ways i.e.
increasing the volumetric efficiency and minimizing the effect of the air entrained or dissolved. Other
authors such as Opitz [4] presented an experimental study on cavitation in PD pumps indicating that
the phenomenon up to a certain limit is harmless and the strict requirement of the API 674 is
perhaps not really necessary. The same author [5] discussed the phenomenon of expansion
generated cavitation relating it to the incipient cavitation occurring at the initial stage of the inlet
stroke when the plunger of the pump moves backward and the inlet valve is still closed and pushed
against its seat by the preloaded spring. This phenomenon will be investigated in more details in this
paper.
The aim of the study being presented is to answer to the following questions:
1. What is exactly the effect of the dissolved gas on cavitation in PD pumps?
2. How does it affect the performance of PD pumps?
3. How does it affect the NPSH?
The authors choose to carry out the investigation already mentioned by means of the advanced CFD
model explained and discussed in [6] that will be briefly recalled in the next sections. The reason for
this choice lies in the higher capability of post processing that a CFD solver has over experimental
tests. In fact a crucial prerequisite for the analysis presented is to separate the fluid dynamic fields of
vapour from air which together constitute the second phase. This capability is almost impossible to
achieve via the experimental counterpart.
The data presented in this paper was acquired during the simulation of the entire suction stroke of
the pump, when the plunger moves backward and the minimum pressure peak is achieved. Based on
the results of the simulation, this paper will discuss the complex phenomena occurring during
cavitation via detailed post processing of the simulation data.
It is known [7] that clean water at ambient conditions contains approximately 15 ppm (parts per
million) of air which is dissolved. As the static pressure lowers during the suction stroke, air separates
from the liquid and gathers in bubbles which interact with the pressure field as air is much more
compressible than water. It is also known [8] that water contains a large amount of nuclei which are
microscopic bubbles containing water vapour and air which are located in the crevices of the solid
boundaries or on dust particles. This amount of air which is not dissolved may increase the overall
amount of the gas. The interaction of this air with the pressure field implies an expansion of the
former: this phenomenon is usually called gas cavitation. Gas cavitation results in a pressure drop
slowdown which may result in a delay in the achievement of the vapour cavitation condition and a
mitigation of the water vapour generation.
For this purpose, two CFD test cases were created and launched, and their results were compared.
The cases dealt with a single chamber PD pump subjected to the same operating and boundary
conditions, they differed only in the property of the fluid processed, the first case utilised water with
15 ppm of dissolved air at standard conditions while the second case utilised a lower air content of
1.5 ppm.
2. CFD Model, geometry and set-up
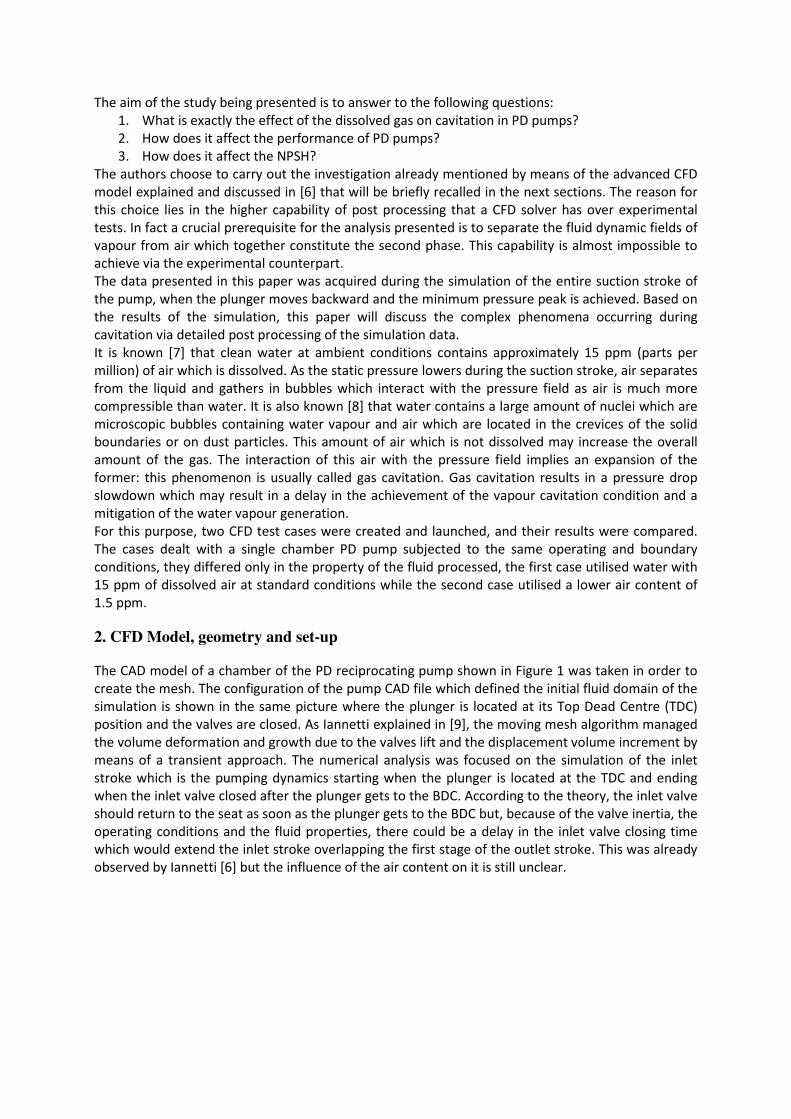
The CAD model of a chamber of the PD reciprocating pump shown in Figure 1 was taken in order to
create the mesh. The configuration of the pump CAD file which defined the initial fluid domain of the
simulation is shown in the same picture where the plunger is located at its Top Dead Centre (TDC)
position and the valves are closed. As Iannetti explained in [9], the moving mesh algorithm managed
the volume deformation and growth due to the valves lift and the displacement volume increment by
means of a transient approach. The numerical analysis was focused on the simulation of the inlet
stroke which is the pumping dynamics starting when the plunger is located at the TDC and ending
when the inlet valve closed after the plunger gets to the BDC. According to the theory, the inlet valve
should return to the seat as soon as the plunger gets to the BDC but, because of the valve inertia, the
operating conditions and the fluid properties, there could be a delay in the inlet valve closing time
which would extend the inlet stroke overlapping the first stage of the outlet stroke. This was already
observed by Iannetti [6] but the influence of the air content on it is still unclear.
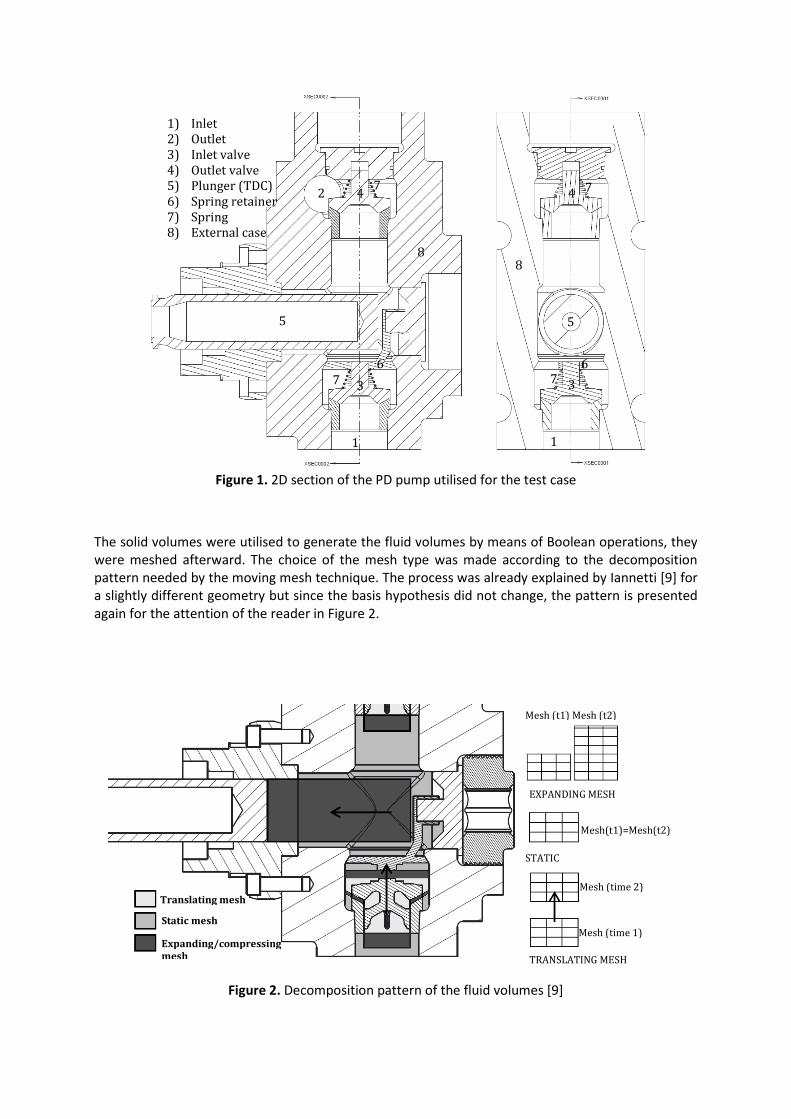
Figure 1. 2D section of the PD pump utilised for the test case
The solid volumes were utilised to generate the fluid volumes by means of Boolean operations, they
were meshed afterward. The choice of the mesh type was made according to the decomposition
pattern needed by the moving mesh technique. The process was already explained by Iannetti [9] for
a slightly different geometry but since the basis hypothesis did not change, the pattern is presented
again for the attention of the reader in Figure 2.
Figure 2. Decomposition pattern of the fluid volumes [9]
1) Inlet
2) Outlet
3) Inlet valve
4) Outlet valve
5) Plunger (TDC)
6) Spring retainer
7) Spring
8) External case
1 1
3
2 4
5
6
7
7
8
3
4
5
6
7
7
8
Static mesh
Expanding/compressing
mesh
Translating mesh
Mesh(t1)=Mesh(t2)
STATIC
MESH
Mesh (time 1)
Mesh (time 2)
TRANSLATING MESH
Mesh (t1) Mesh (t2)
EXPANDING MESH
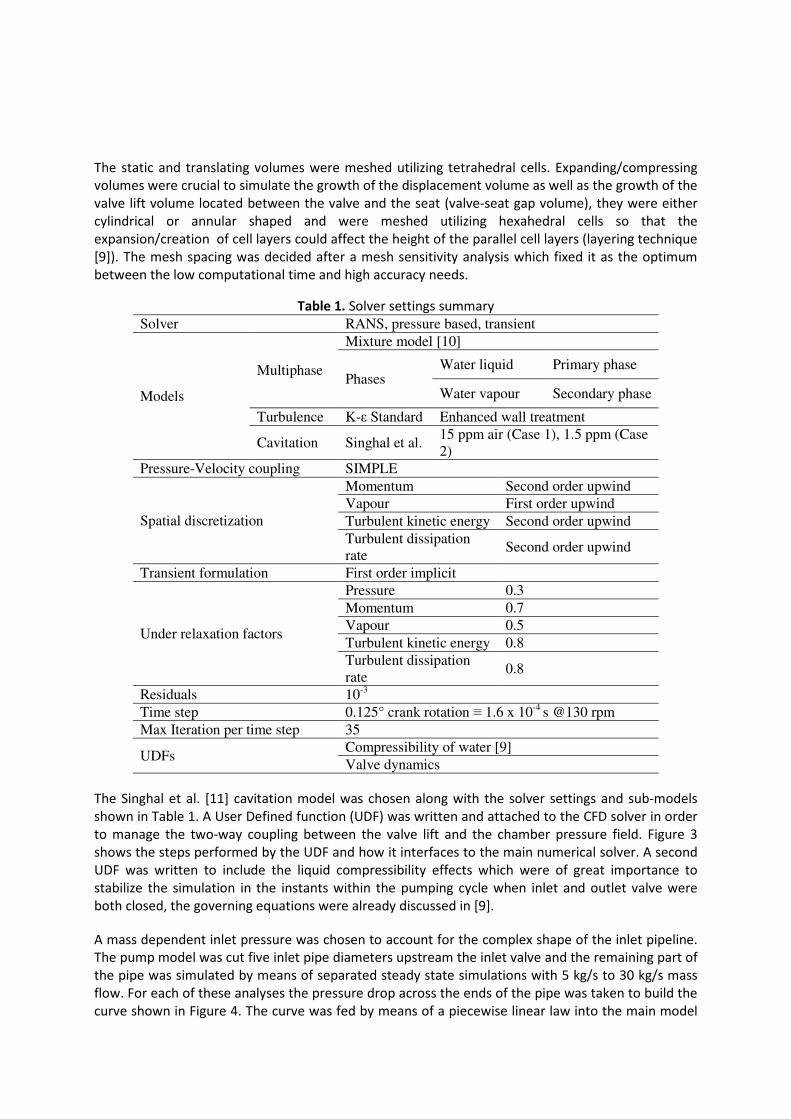
The static and translating volumes were meshed utilizing tetrahedral cells. Expanding/compressing
volumes were crucial to simulate the growth of the displacement volume as well as the growth of the
valve lift volume located between the valve and the seat (valve-seat gap volume), they were either
cylindrical or annular shaped and were meshed utilizing hexahedral cells so that the
expansion/creation of cell layers could affect the height of the parallel cell layers (layering technique
[9]). The mesh spacing was decided after a mesh sensitivity analysis which fixed it as the optimum
between the low computational time and high accuracy needs.
Table 1. Solver settings summary
Solver RANS, pressure based, transient
Models
Multiphase
Mixture model [10]
Phases Water liquid Primary phase
Water vapour Secondary phase
Turbulence K-ε Standard Enhanced wall treatment
Cavitation Singhal et al. 15 ppm air (Case 1), 1.5 ppm (Case
2)
Pressure-Velocity coupling SIMPLE
Spatial discretization
Momentum Second order upwind
Vapour First order upwind
Turbulent kinetic energy Second order upwind
Turbulent dissipation
rate Second order upwind
Transient formulation First order implicit
Under relaxation factors
Pressure 0.3
Momentum 0.7
Vapour 0.5
Turbulent kinetic energy 0.8
Turbulent dissipation
rate 0.8
Residuals 10-3
Time step 0.125° crank rotation ≡ 1.6 x 10⁻⁴
s @130 rpm
Max Iteration per time step 35
UDFs Compressibility of water [9]
Valve dynamics
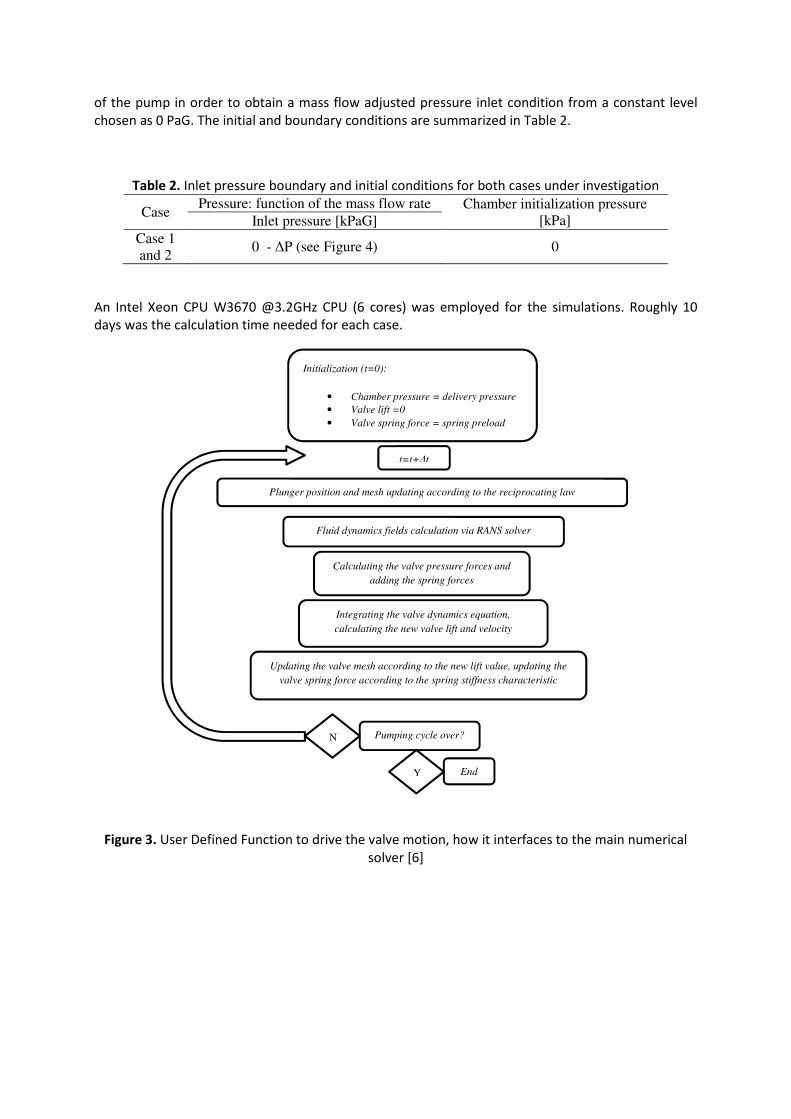
The Singhal et al. [11] cavitation model was chosen along with the solver settings and sub-models
shown in Table 1. A User Defined function (UDF) was written and attached to the CFD solver in order
to manage the two-way coupling between the valve lift and the chamber pressure field. Figure 3
shows the steps performed by the UDF and how it interfaces to the main numerical solver. A second
UDF was written to include the liquid compressibility effects which were of great importance to
stabilize the simulation in the instants within the pumping cycle when inlet and outlet valve were
both closed, the governing equations were already discussed in [9].
A mass dependent inlet pressure was chosen to account for the complex shape of the inlet pipeline.
The pump model was cut five inlet pipe diameters upstream the inlet valve and the remaining part of
the pipe was simulated by means of separated steady state simulations with 5 kg/s to 30 kg/s mass
flow. For each of these analyses the pressure drop across the ends of the pipe was taken to build the
curve shown in Figure 4. The curve was fed by means of a piecewise linear law into the main model
of the pump in order to obtain a mass flow adjusted pressure inlet condition from a constant level
chosen as 0 PaG. The initial and boundary conditions are summarized in Table 2.
Table 2. Inlet pressure boundary and initial conditions for both cases under investigation
Case Pressure: function of the mass flow rate Chamber initialization pressure
[kPa] Inlet pressure [kPaG]
Case 1
and 2 0 - ∆P (see Figure 4) 0
An Intel Xeon CPU W3670 @3.2GHz CPU (6 cores) was employed for the simulations. Roughly 10
days was the calculation time needed for each case.
Figure 3. User Defined Function to drive the valve motion, how it interfaces to the main numerical
solver [6]
Initialization (t=0):
• Chamber pressure = delivery pressure
• Valve lift =0
• Valve spring force = spring preload
t=t+∆t
Plunger position and mesh updating according to the reciprocating law
Fluid dynamics fields calculation via RANS solver
Calculating the valve pressure forces and
adding the spring forces
Integrating the valve dynamics equation,
calculating the new valve lift and velocity
Updating the valve mesh according to the new lift value, updating the
valve spring force according to the spring stiffness characteristic
Pumping cycle over?
Y End
N
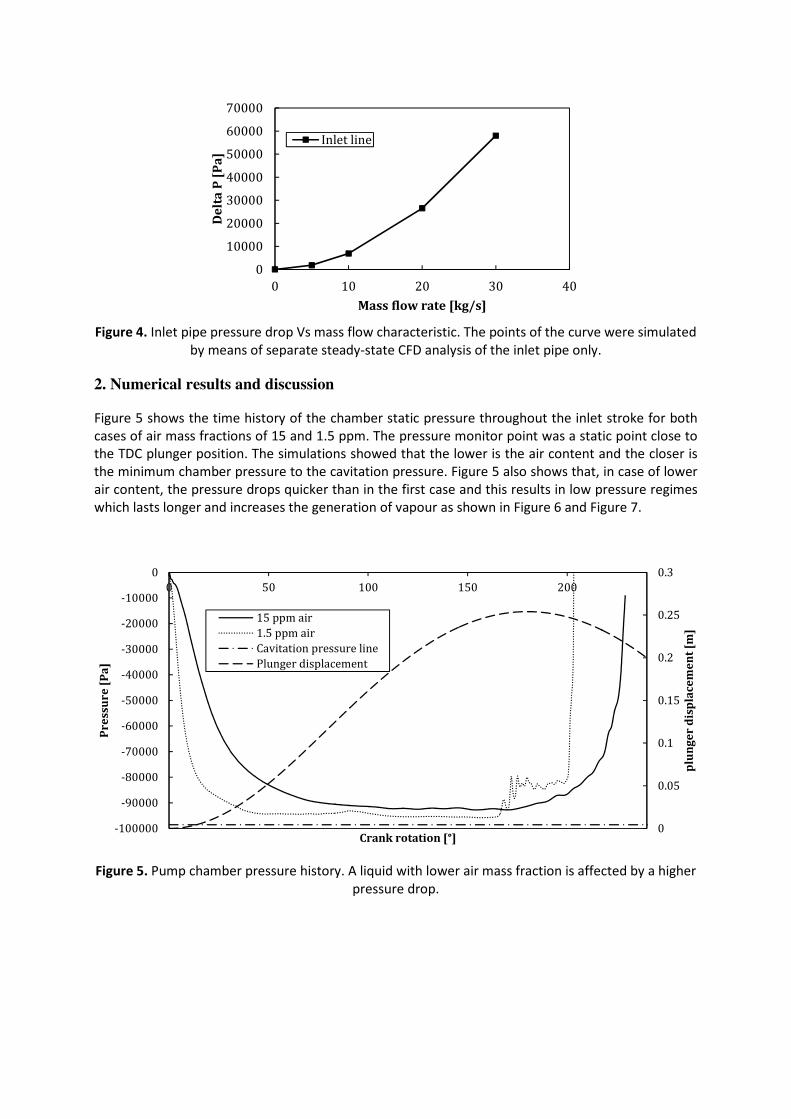
Figure 4. Inlet pipe pressure drop Vs mass flow characteristic. The points of the curve were simulated
by means of separate steady-state CFD analysis of the inlet pipe only.
2. Numerical results and discussion
Figure 5 shows the time history of the chamber static pressure throughout the inlet stroke for both
cases of air mass fractions of 15 and 1.5 ppm. The pressure monitor point was a static point close to
the TDC plunger position. The simulations showed that the lower is the air content and the closer is
the minimum chamber pressure to the cavitation pressure. Figure 5 also shows that, in case of lower
air content, the pressure drops quicker than in the first case and this results in low pressure regimes
which lasts longer and increases the generation of vapour as shown in Figure 6 and Figure 7.
Figure 5. Pump chamber pressure history. A liquid with lower air mass fraction is affected by a higher
pressure drop.
0
10000
20000
30000
40000
50000
60000
70000
0 10 20 30 40
De
lta
P [
Pa
]
Mass flow rate [kg/s]
Inlet line
0
0.05
0.1
0.15
0.2
0.25
0.3
-100000
-90000
-80000
-70000
-60000
-50000
-40000
-30000
-20000
-10000
0
0 50 100 150 200
plu
ng
er
dis
pla
ce
me
nt
[m]
Pr
ess
ur
e [
Pa
]
Crank rotation [°]
15 ppm air
1.5 ppm air
Cavitation pressure line
Plunger displacement
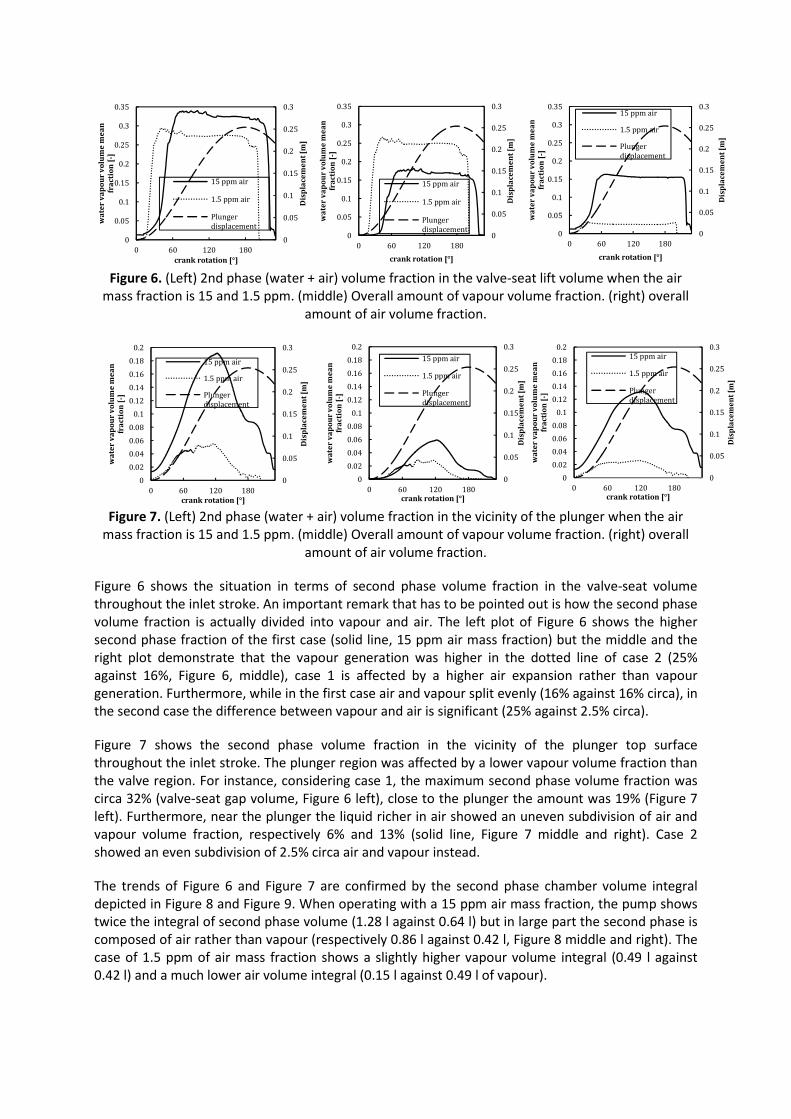
Figure 6. (Left) 2nd phase (water + air) volume fraction in the valve-seat lift volume when the air
mass fraction is 15 and 1.5 ppm. (middle) Overall amount of vapour volume fraction. (right) overall
amount of air volume fraction.
Figure 7. (Left) 2nd phase (water + air) volume fraction in the vicinity of the plunger when the air
mass fraction is 15 and 1.5 ppm. (middle) Overall amount of vapour volume fraction. (right) overall
amount of air volume fraction.
Figure 6 shows the situation in terms of second phase volume fraction in the valve-seat volume
throughout the inlet stroke. An important remark that has to be pointed out is how the second phase
volume fraction is actually divided into vapour and air. The left plot of Figure 6 shows the higher
second phase fraction of the first case (solid line, 15 ppm air mass fraction) but the middle and the
right plot demonstrate that the vapour generation was higher in the dotted line of case 2 (25%
against 16%, Figure 6, middle), case 1 is affected by a higher air expansion rather than vapour
generation. Furthermore, while in the first case air and vapour split evenly (16% against 16% circa), in
the second case the difference between vapour and air is significant (25% against 2.5% circa).
Figure 7 shows the second phase volume fraction in the vicinity of the plunger top surface
throughout the inlet stroke. The plunger region was affected by a lower vapour volume fraction than
the valve region. For instance, considering case 1, the maximum second phase volume fraction was
circa 32% (valve-seat gap volume, Figure 6 left), close to the plunger the amount was 19% (Figure 7
left). Furthermore, near the plunger the liquid richer in air showed an uneven subdivision of air and
vapour volume fraction, respectively 6% and 13% (solid line, Figure 7 middle and right). Case 2
showed an even subdivision of 2.5% circa air and vapour instead.
The trends of Figure 6 and Figure 7 are confirmed by the second phase chamber volume integral
depicted in Figure 8 and Figure 9. When operating with a 15 ppm air mass fraction, the pump shows
twice the integral of second phase volume (1.28 l against 0.64 l) but in large part the second phase is
composed of air rather than vapour (respectively 0.86 l against 0.42 l, Figure 8 middle and right). The
case of 1.5 ppm of air mass fraction shows a slightly higher vapour volume integral (0.49 l against
0.42 l) and a much lower air volume integral (0.15 l against 0.49 l of vapour).
0
0.05
0.1
0.15
0.2
0.25
0.3
0
0.05
0.1
0.15
0.2
0.25
0.3
0.35
0 60 120 180
Dis
pla
ce
me
nt
[m]
wa
ter
va
po
ur
vo
lum
e m
ea
n
fra
cti
on
[-]
crank rotation [°]
15 ppm air
1.5 ppm air
Plunger
displacement
0
0.05
0.1
0.15
0.2
0.25
0.3
0
0.05
0.1
0.15
0.2
0.25
0.3
0.35
0 60 120 180
Dis
pla
ce
me
nt
[m]
wa
ter
va
po
ur
vo
lum
e m
ea
n
fra
cti
on
[-]
crank rotation [°]
15 ppm air
1.5 ppm air
Plunger
displacement0
0.05
0.1
0.15
0.2
0.25
0.3
0
0.05
0.1
0.15
0.2
0.25
0.3
0.35
0 60 120 180
Dis
pla
ce
me
nt
[m]
wa
ter
va
po
ur
vo
lum
e m
ea
n
fra
cti
on
[-]
crank rotation [°]
15 ppm air
1.5 ppm air
Plunger
displacement
0
0.05
0.1
0.15
0.2
0.25
0.3
0
0.02
0.04
0.06
0.08
0.1
0.12
0.14
0.16
0.18
0.2
0 60 120 180
Dis
pla
ce
me
nt
[m]
wa
ter
va
po
ur
vo
lum
e m
ea
n
fra
cti
on
[-]
crank rotation [°]
15 ppm air
1.5 ppm air
Plunger
displacement
0
0.05
0.1
0.15
0.2
0.25
0.3
0
0.02
0.04
0.06
0.08
0.1
0.12
0.14
0.16
0.18
0.2
0 60 120 180
Dis
pla
ce
me
nt
[m]
wa
ter
va
po
ur
vo
lum
e m
ea
n
fra
cti
on
[-]
crank rotation [°]
15 ppm air
1.5 ppm air
Plunger
displacement
0
0.05
0.1
0.15
0.2
0.25
0.3
0
0.02
0.04
0.06
0.08
0.1
0.12
0.14
0.16
0.18
0.2
0 60 120 180
Dis
pla
ce
me
nt
[m]
wa
ter
va
po
ur
vo
lum
e m
ea
n
fra
cti
on
[-]
crank rotation [°]
15 ppm air
1.5 ppm air
Plunger
displacement
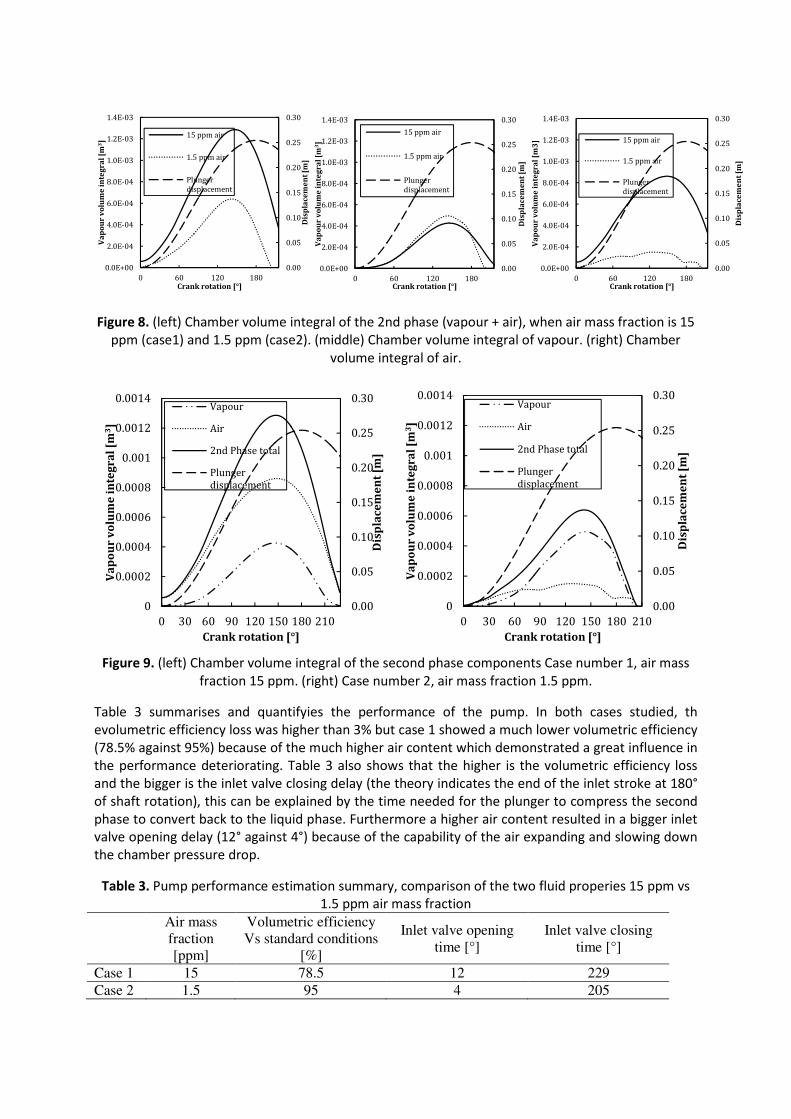
Figure 8. (left) Chamber volume integral of the 2nd phase (vapour + air), when air mass fraction is 15
ppm (case1) and 1.5 ppm (case2). (middle) Chamber volume integral of vapour. (right) Chamber
volume integral of air.
Figure 9. (left) Chamber volume integral of the second phase components Case number 1, air mass
fraction 15 ppm. (right) Case number 2, air mass fraction 1.5 ppm.
Table 3 summarises and quantifyies the performance of the pump. In both cases studied, th
evolumetric efficiency loss was higher than 3% but case 1 showed a much lower volumetric efficiency
(78.5% against 95%) because of the much higher air content which demonstrated a great influence in
the performance deteriorating. Table 3 also shows that the higher is the volumetric efficiency loss
and the bigger is the inlet valve closing delay (the theory indicates the end of the inlet stroke at 180°
of shaft rotation), this can be explained by the time needed for the plunger to compress the second
phase to convert back to the liquid phase. Furthermore a higher air content resulted in a bigger inlet
valve opening delay (12° against 4°) because of the capability of the air expanding and slowing down
the chamber pressure drop.
Table 3. Pump performance estimation summary, comparison of the two fluid properies 15 ppm vs
1.5 ppm air mass fraction
Air mass
fraction
[ppm]
Volumetric efficiency
Vs standard conditions
[%]
Inlet valve opening
time [°]
Inlet valve closing
time [°]
Case 1 15 78.5 12 229
Case 2 1.5 95 4 205
0.00
0.05
0.10
0.15
0.20
0.25
0.30
0.0E+00
2.0E-04
4.0E-04
6.0E-04
8.0E-04
1.0E-03
1.2E-03
1.4E-03
0 60 120 180
Dis
pla
ce
me
nt
[m]
Va
po
ur
vo
lum
e i
nte
gr
al
[m3]
Crank rotation [°]
15 ppm air
1.5 ppm air
Plunger
displacement
0.00
0.05
0.10
0.15
0.20
0.25
0.30
0.0E+00
2.0E-04
4.0E-04
6.0E-04
8.0E-04
1.0E-03
1.2E-03
1.4E-03
0 60 120 180
Dis
pla
ce
me
nt
[m]
Va
po
ur
vo
lum
e i
nte
gr
al
[m3]
Crank rotation [°]
15 ppm air
1.5 ppm air
Plunger
displacement
0.00
0.05
0.10
0.15
0.20
0.25
0.30
0.0E+00
2.0E-04
4.0E-04
6.0E-04
8.0E-04
1.0E-03
1.2E-03
1.4E-03
0 60 120 180
Dis
pla
ce
me
nt
[m]
Va
po
ur
vo
lum
e i
nte
gr
al
[m3
]
Crank rotation [°]
15 ppm air
1.5 ppm air
Plunger
displacement
0.00
0.05
0.10
0.15
0.20
0.25
0.30
0
0.0002
0.0004
0.0006
0.0008
0.001
0.0012
0.0014
0 30 60 90 120 150 180 210
Dis
pla
ce
me
nt
[m]
Va
po
ur
vo
lum
e i
nte
gr
al
[m3]
Crank rotation [°]
Vapour
Air
2nd Phase total
Plunger
displacement
0.00
0.05
0.10
0.15
0.20
0.25
0.30
0
0.0002
0.0004
0.0006
0.0008
0.001
0.0012
0.0014
0 30 60 90 120 150 180 210
Dis
pla
ce
me
nt
[m]
Va
po
ur
vo
lum
e i
nte
gr
al
[m3]
Crank rotation [°]
Vapour
Air
2nd Phase total
Plunger
displacement
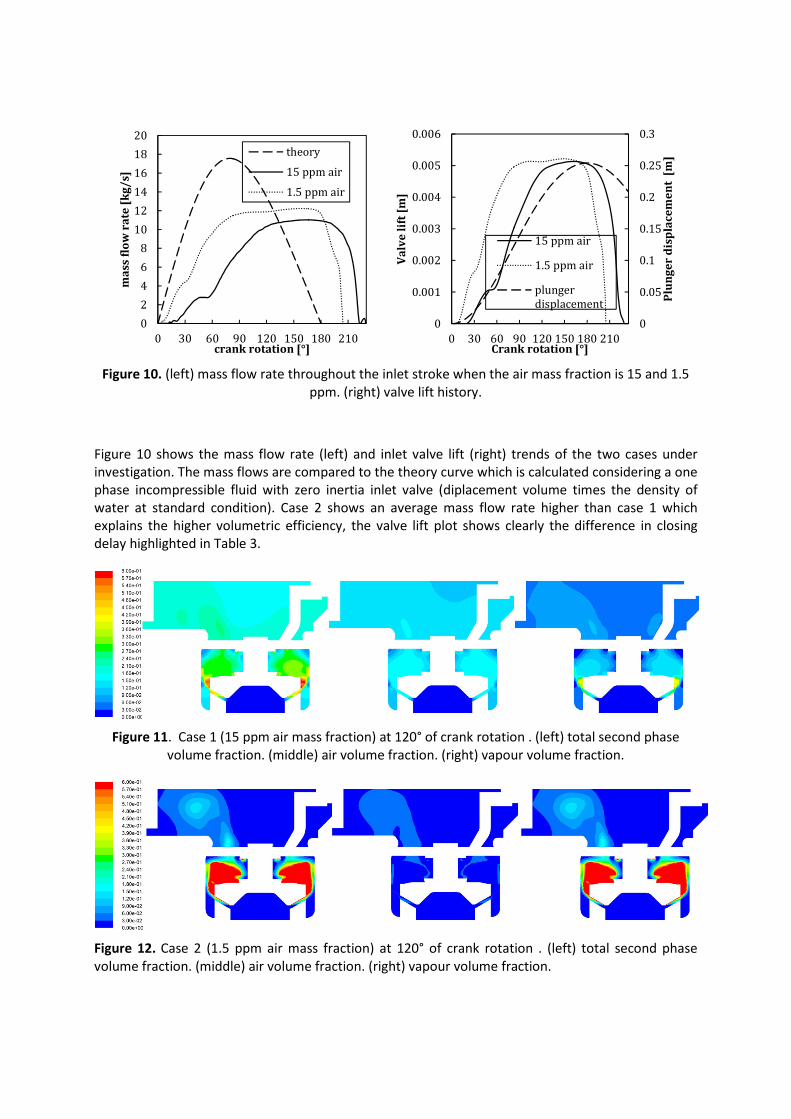
Figure 10. (left) mass flow rate throughout the inlet stroke when the air mass fraction is 15 and 1.5
ppm. (right) valve lift history.
Figure 10 shows the mass flow rate (left) and inlet valve lift (right) trends of the two cases under
investigation. The mass flows are compared to the theory curve which is calculated considering a one
phase incompressible fluid with zero inertia inlet valve (diplacement volume times the density of
water at standard condition). Case 2 shows an average mass flow rate higher than case 1 which
explains the higher volumetric efficiency, the valve lift plot shows clearly the difference in closing
delay highlighted in Table 3.
Figure 11. Case 1 (15 ppm air mass fraction) at 120° of crank rotation . (left) total second phase
volume fraction. (middle) air volume fraction. (right) vapour volume fraction.
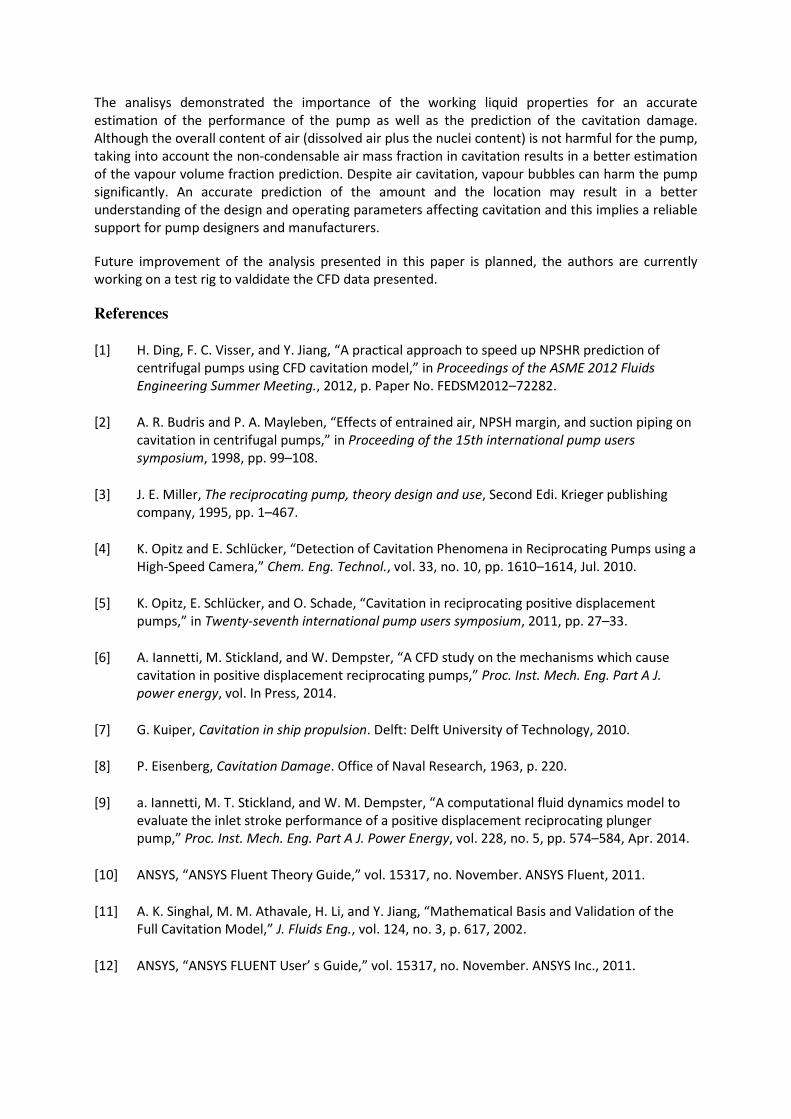
Figure 12. Case 2 (1.5 ppm air mass fraction) at 120° of crank rotation . (left) total second phase
volume fraction. (middle) air volume fraction. (right) vapour volume fraction.
0
0.05
0.1
0.15
0.2
0.25
0.3
0
0.001
0.002
0.003
0.004
0.005
0.006
0 30 60 90 120 150 180 210
Plu
ng
er
dis
pla
ce
me
nt
[m
]
Va
lve
lif
t [m
]
Crank rotation [°]
15 ppm air
1.5 ppm air
plunger
displacement
0
2
4
6
8
10
12
14
16
18
20
0 30 60 90 120 150 180 210
ma
ss f
low
ra
te [
kg
/s]
crank rotation [°]
theory
15 ppm air
1.5 ppm air
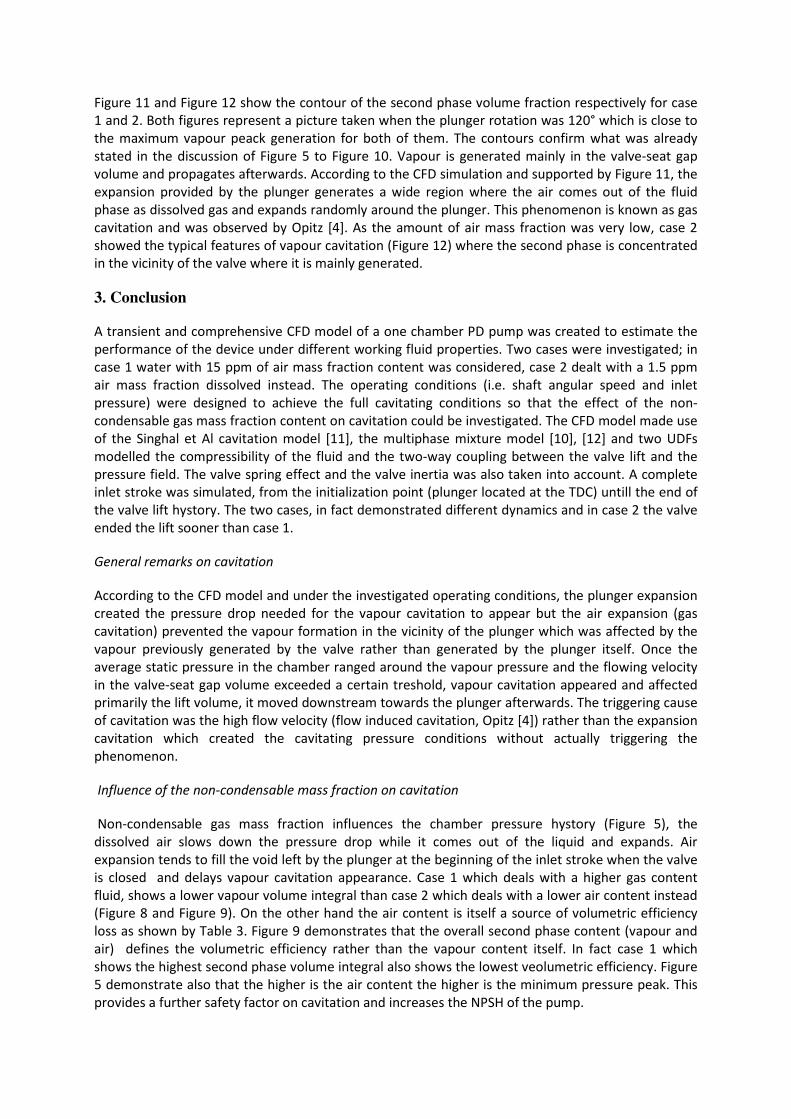
Figure 11 and Figure 12 show the contour of the second phase volume fraction respectively for case
1 and 2. Both figures represent a picture taken when the plunger rotation was 120° which is close to
the maximum vapour peack generation for both of them. The contours confirm what was already
stated in the discussion of Figure 5 to Figure 10. Vapour is generated mainly in the valve-seat gap
volume and propagates afterwards. According to the CFD simulation and supported by Figure 11, the
expansion provided by the plunger generates a wide region where the air comes out of the fluid
phase as dissolved gas and expands randomly around the plunger. This phenomenon is known as gas
cavitation and was observed by Opitz [4]. As the amount of air mass fraction was very low, case 2
showed the typical features of vapour cavitation (Figure 12) where the second phase is concentrated
in the vicinity of the valve where it is mainly generated.
3. Conclusion
A transient and comprehensive CFD model of a one chamber PD pump was created to estimate the
performance of the device under different working fluid properties. Two cases were investigated; in
case 1 water with 15 ppm of air mass fraction content was considered, case 2 dealt with a 1.5 ppm
air mass fraction dissolved instead. The operating conditions (i.e. shaft angular speed and inlet
pressure) were designed to achieve the full cavitating conditions so that the effect of the non-
condensable gas mass fraction content on cavitation could be investigated. The CFD model made use
of the Singhal et Al cavitation model [11], the multiphase mixture model [10], [12] and two UDFs
modelled the compressibility of the fluid and the two-way coupling between the valve lift and the
pressure field. The valve spring effect and the valve inertia was also taken into account. A complete
inlet stroke was simulated, from the initialization point (plunger located at the TDC) untill the end of
the valve lift hystory. The two cases, in fact demonstrated different dynamics and in case 2 the valve
ended the lift sooner than case 1.
General remarks on cavitation
According to the CFD model and under the investigated operating conditions, the plunger expansion
created the pressure drop needed for the vapour cavitation to appear but the air expansion (gas
cavitation) prevented the vapour formation in the vicinity of the plunger which was affected by the
vapour previously generated by the valve rather than generated by the plunger itself. Once the
average static pressure in the chamber ranged around the vapour pressure and the flowing velocity
in the valve-seat gap volume exceeded a certain treshold, vapour cavitation appeared and affected
primarily the lift volume, it moved downstream towards the plunger afterwards. The triggering cause
of cavitation was the high flow velocity (flow induced cavitation, Opitz [4]) rather than the expansion
cavitation which created the cavitating pressure conditions without actually triggering the
phenomenon.
Influence of the non-condensable mass fraction on cavitation
Non-condensable gas mass fraction influences the chamber pressure hystory (Figure 5), the
dissolved air slows down the pressure drop while it comes out of the liquid and expands. Air
expansion tends to fill the void left by the plunger at the beginning of the inlet stroke when the valve
is closed and delays vapour cavitation appearance. Case 1 which deals with a higher gas content
fluid, shows a lower vapour volume integral than case 2 which deals with a lower air content instead
(Figure 8 and Figure 9). On the other hand the air content is itself a source of volumetric efficiency
loss as shown by Table 3. Figure 9 demonstrates that the overall second phase content (vapour and
air) defines the volumetric efficiency rather than the vapour content itself. In fact case 1 which
shows the highest second phase volume integral also shows the lowest veolumetric efficiency. Figure
5 demonstrate also that the higher is the air content the higher is the minimum pressure peak. This
provides a further safety factor on cavitation and increases the NPSH of the pump.
The analisys demonstrated the importance of the working liquid properties for an accurate
estimation of the performance of the pump as well as the prediction of the cavitation damage.
Although the overall content of air (dissolved air plus the nuclei content) is not harmful for the pump,
taking into account the non-condensable air mass fraction in cavitation results in a better estimation
of the vapour volume fraction prediction. Despite air cavitation, vapour bubbles can harm the pump
significantly. An accurate prediction of the amount and the location may result in a better
understanding of the design and operating parameters affecting cavitation and this implies a reliable
support for pump designers and manufacturers.
Future improvement of the analysis presented in this paper is planned, the authors are currently
working on a test rig to valdidate the CFD data presented.
References
[1] H. Ding, F. C. Visser, and Y. Jiang, “A practical approach to speed up NPSHR prediction of
centrifugal pumps using CFD cavitation model,” in Proceedings of the ASME 2012 Fluids
Engineering Summer Meeting., 2012, p. Paper No. FEDSM2012–72282.
[2] A. R. Budris and P. A. Mayleben, “Effects of entrained air, NPSH margin, and suction piping on
cavitation in centrifugal pumps,” in Proceeding of the 15th international pump users
symposium, 1998, pp. 99–108.
[3] J. E. Miller, The reciprocating pump, theory design and use, Second Edi. Krieger publishing
company, 1995, pp. 1–467.
[4] K. Opitz and E. Schlücker, “Detection of Cavitation Phenomena in Reciprocating Pumps using a
High-Speed Camera,” Chem. Eng. Technol., vol. 33, no. 10, pp. 1610–1614, Jul. 2010.
[5] K. Opitz, E. Schlücker, and O. Schade, “Cavitation in reciprocating positive displacement
pumps,” in Twenty-seventh international pump users symposium, 2011, pp. 27–33.
[6] A. Iannetti, M. Stickland, and W. Dempster, “A CFD study on the mechanisms which cause
cavitation in positive displacement reciprocating pumps,” Proc. Inst. Mech. Eng. Part A J.
power energy, vol. In Press, 2014.
[7] G. Kuiper, Cavitation in ship propulsion. Delft: Delft University of Technology, 2010.
[8] P. Eisenberg, Cavitation Damage. Office of Naval Research, 1963, p. 220.
[9] a. Iannetti, M. T. Stickland, and W. M. Dempster, “A computational fluid dynamics model to
evaluate the inlet stroke performance of a positive displacement reciprocating plunger
pump,” Proc. Inst. Mech. Eng. Part A J. Power Energy, vol. 228, no. 5, pp. 574–584, Apr. 2014.
[10] ANSYS, “ANSYS Fluent Theory Guide,” vol. 15317, no. November. ANSYS Fluent, 2011.
[11] A. K. Singhal, M. M. Athavale, H. Li, and Y. Jiang, “Mathematical Basis and Validation of the
Full Cavitation Model,” J. Fluids Eng., vol. 124, no. 3, p. 617, 2002.
[12] ANSYS, “ANSYS FLUENT User’ s Guide,” vol. 15317, no. November. ANSYS Inc., 2011.