Embed Size (px)
Citation preview
Ammonia as a TransportationAmmonia as a TransportationFuelFuel
Meeting PurposeMeeting Purpose
Discuss Pro’s and Con’s of Ammonia as aTransportation Fuel
Provide Facts to Help EnlightenPerspectives
Determine Next Steps

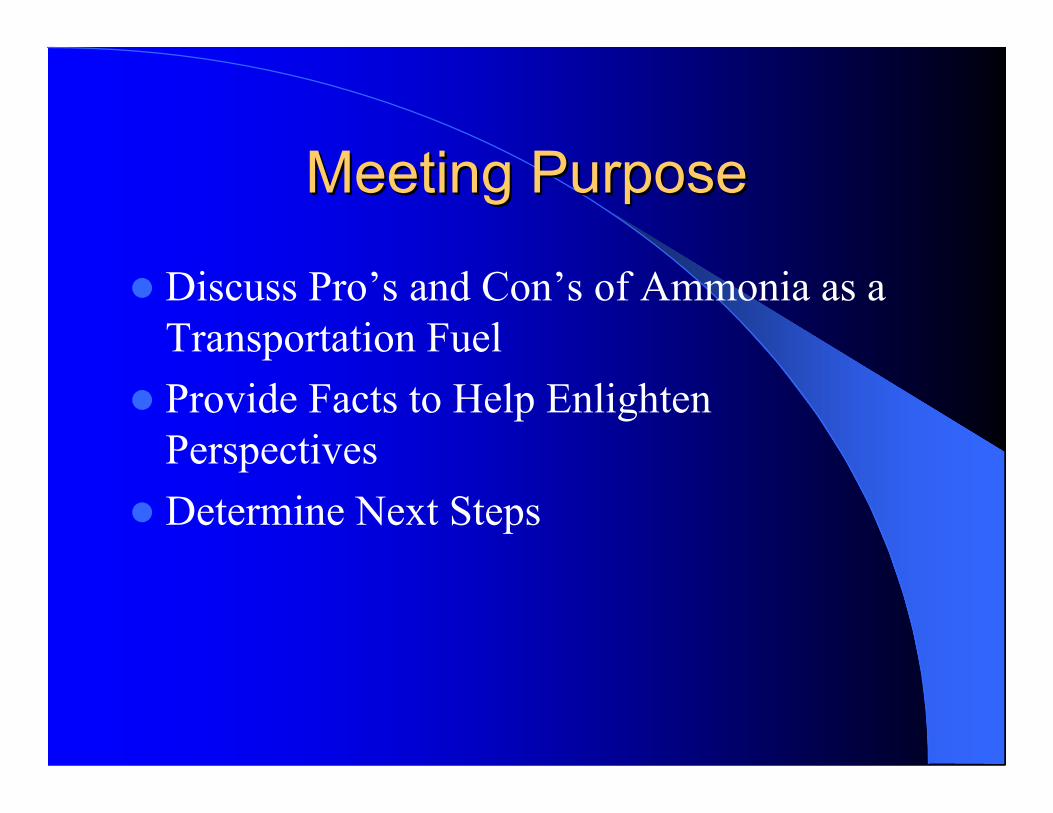
Background InformationBackground Information
Source: Ewald Breunesse, Shell Netherlands, 14th IAMA Annual World Conference, Montreux, June 14th 2004
The Fossil Fuel EraThe Fossil Fuel Era% of total
Traditional
- Biomass - Wind- Water- Animals
Fossil Fuels
- Mechanical- Combustion - High temperature
Renewables
- Electric - Low temperature- Catalysts
0%
25%
50%
75%
100%
1800 1850 1900 1950 2000 2050 2100 2150
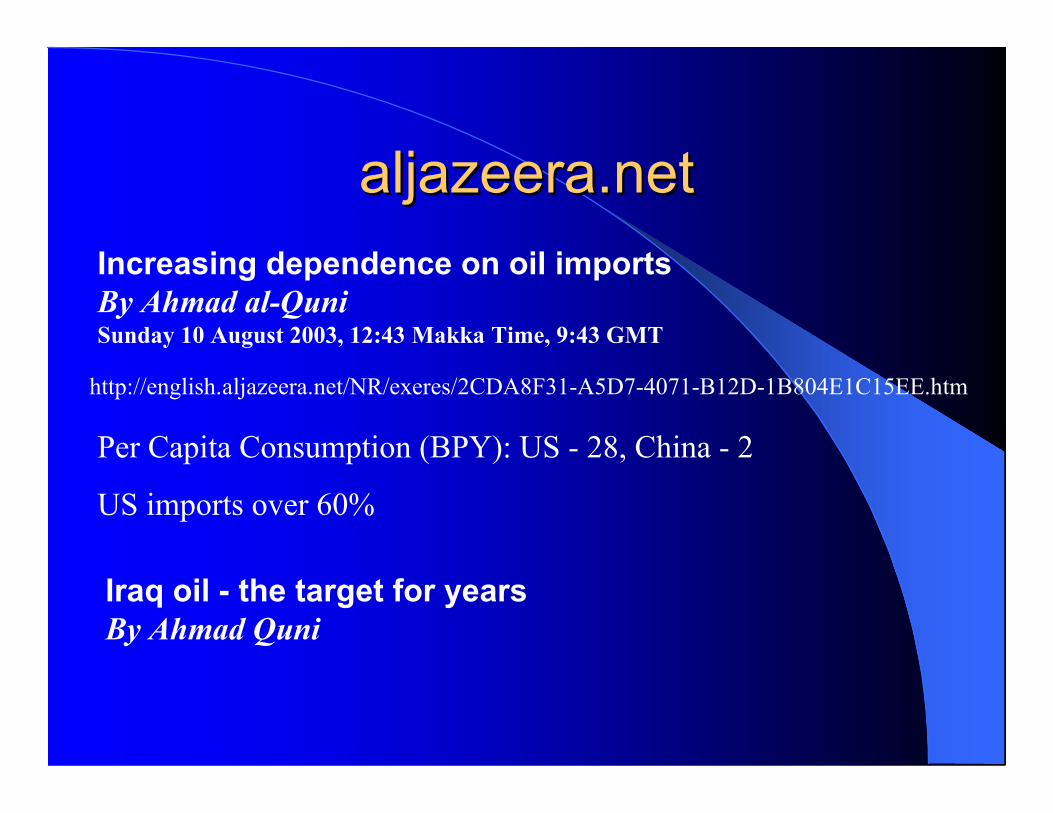
aljazeeraaljazeera.net.net
http://english.aljazeera.net/NR/exeres/2CDA8F31-A5D7-4071-B12D-1B804E1C15EE.htm
Increasing dependence on oil importsBy Ahmad al-QuniSunday 10 August 2003, 12:43 Makka Time, 9:43 GMT
Per Capita Consumption (BPY): US - 28, China - 2
US imports over 60%
Iraq oil - the target for yearsBy Ahmad Quni
Oil ReservesOil Reserves
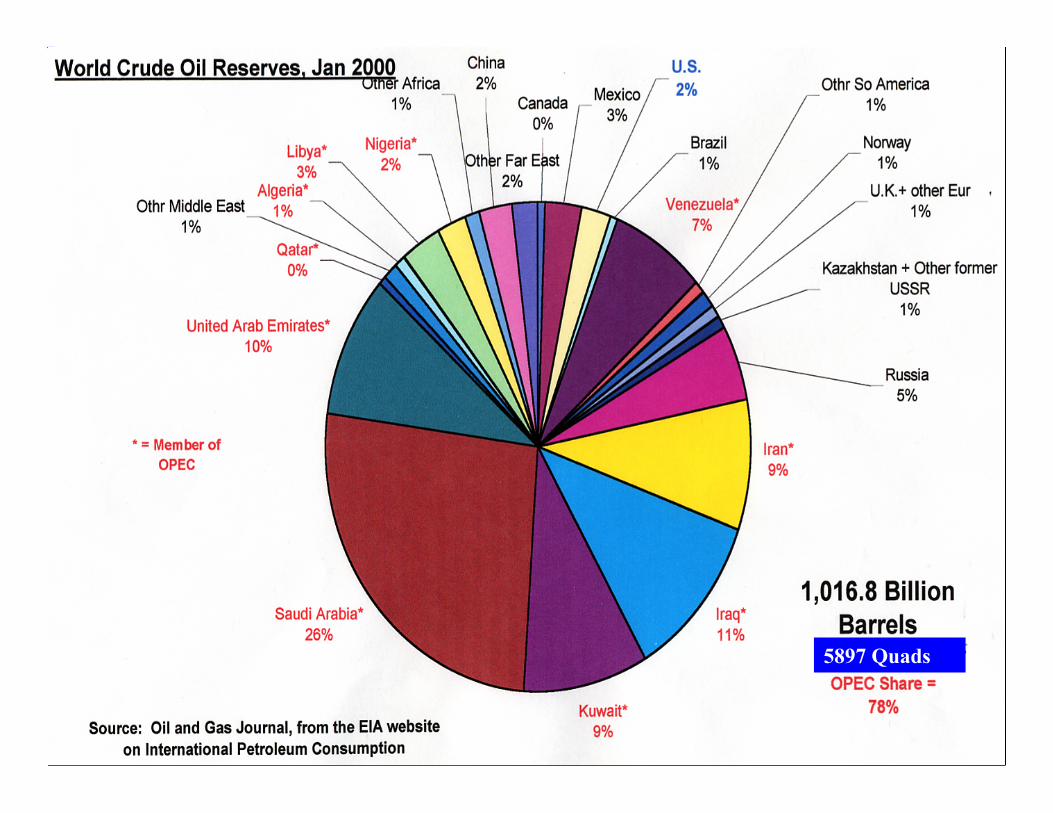
5897 Quads

Coal ReservesCoal Reserves

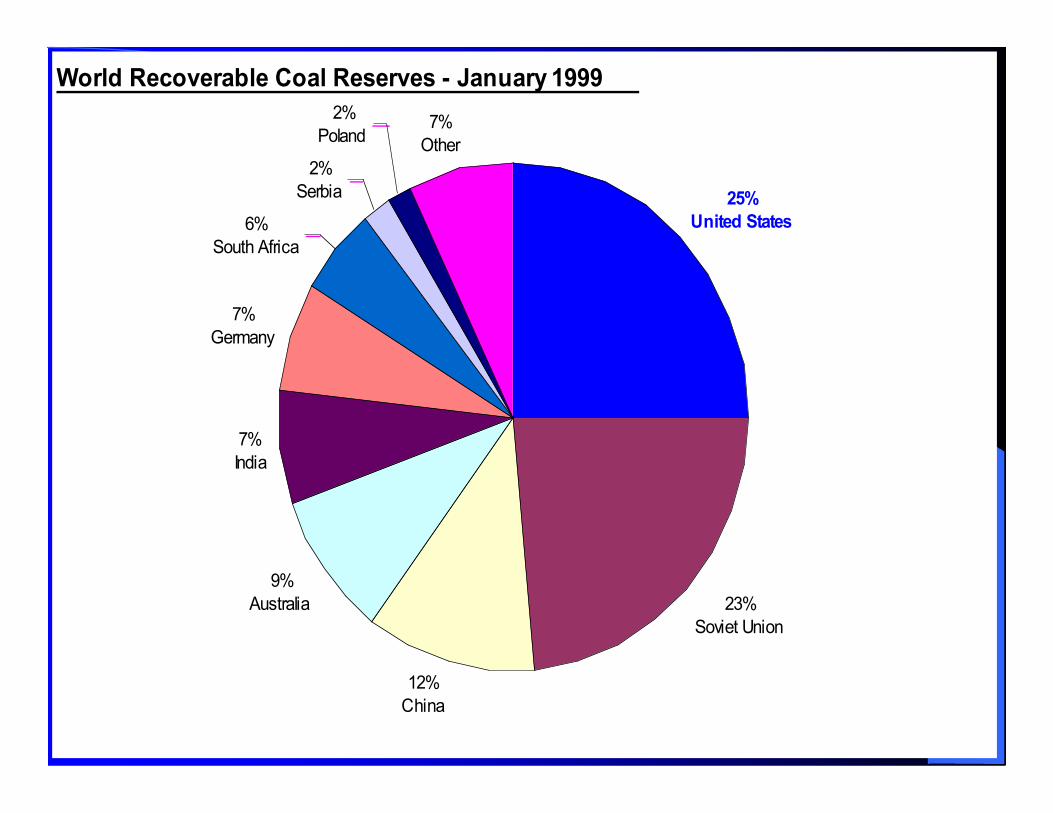
World Recoverable Coal Reserves - January 1999
23%
Soviet Union
25%
United States
12%
China
9%
Australia
7%
India
7%
Germany
6%
South Africa
2%
Serbia
2%
Poland7%
Other
World Total: 1089 Billion Short Tons19554 Quads(5897 Ouads World Crude Oil Reserves in 2000 - 78% OPEC)
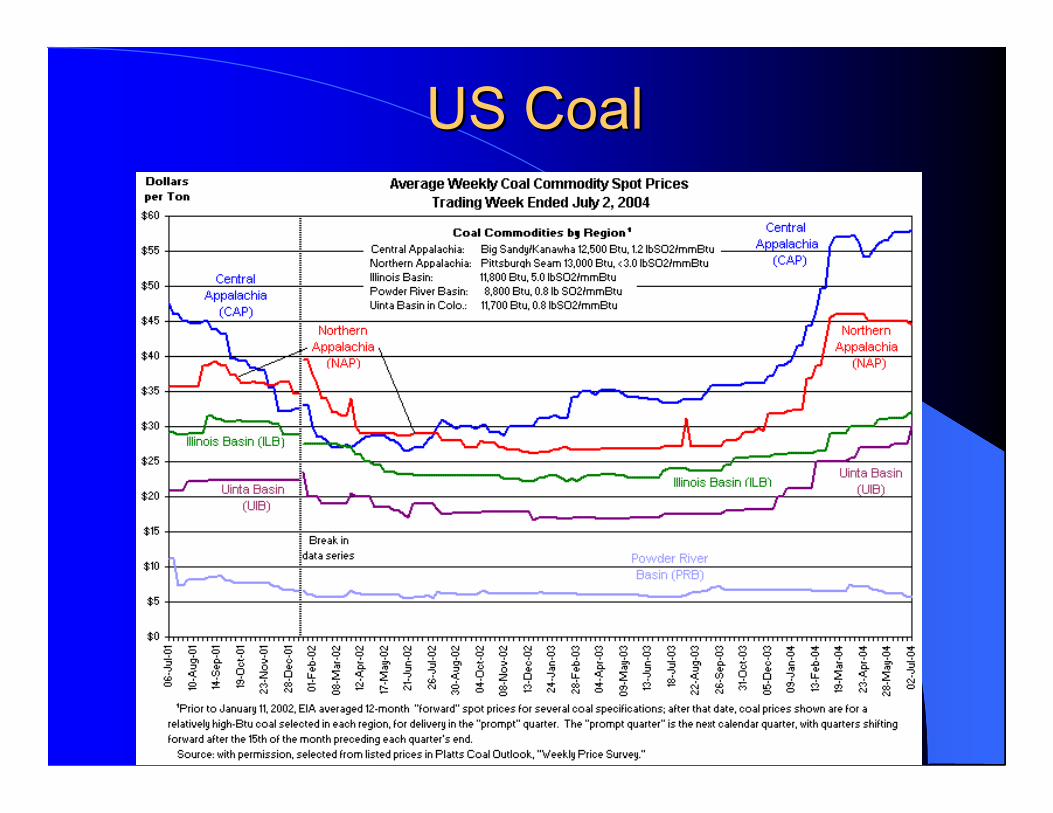
US CoalUS Coal
Status of the Hydrogen Economy:Status of the Hydrogen Economy:Does Hydrogen Have a PracticalDoes Hydrogen Have a PracticalFuture as a Transportation Fuel?Future as a Transportation Fuel?
World Federation of ScientistsEnergy PMP
19 August 2003
Carmen Difiglio, Ph.D.International Energy Agency
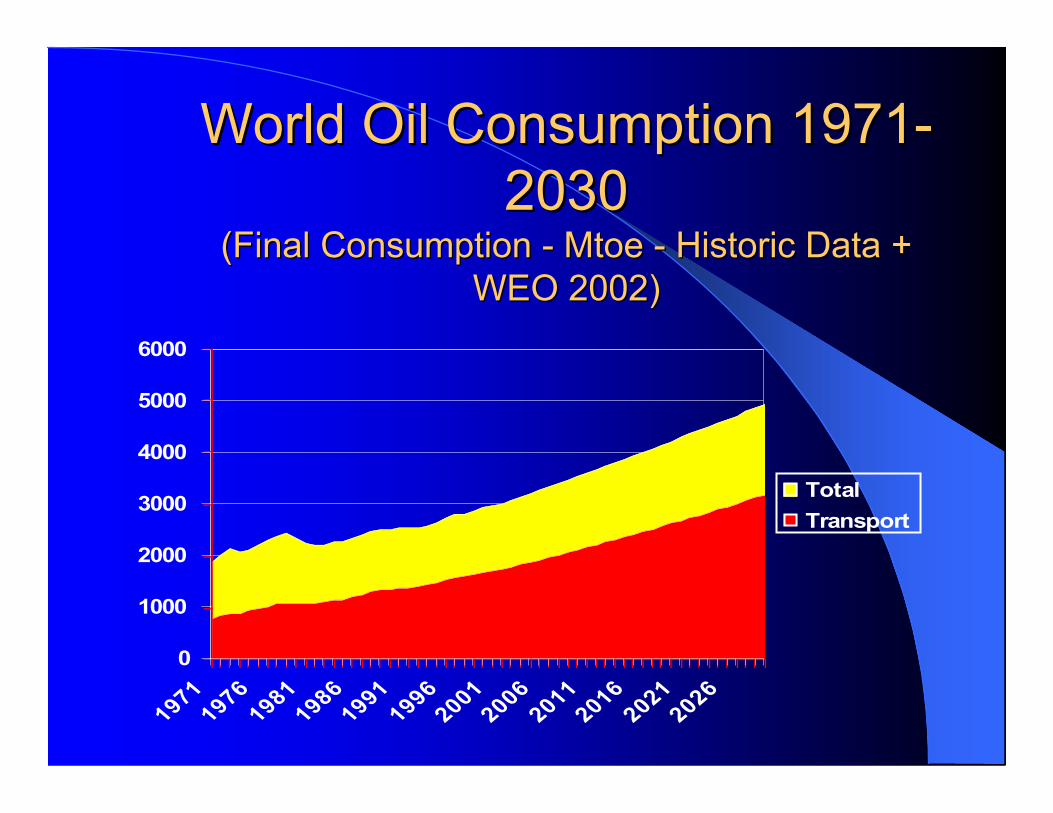
World Oil Consumption 1971-World Oil Consumption 1971-20302030
(Final Consumption - (Final Consumption - MtoeMtoe - Historic Data + - Historic Data +WEO 2002)WEO 2002)
0
1000
2000
3000
4000
5000
6000
1971
1976
1981
1986
1991
1996
2001
2006
2011
2016
2021
2026
Total
Transport
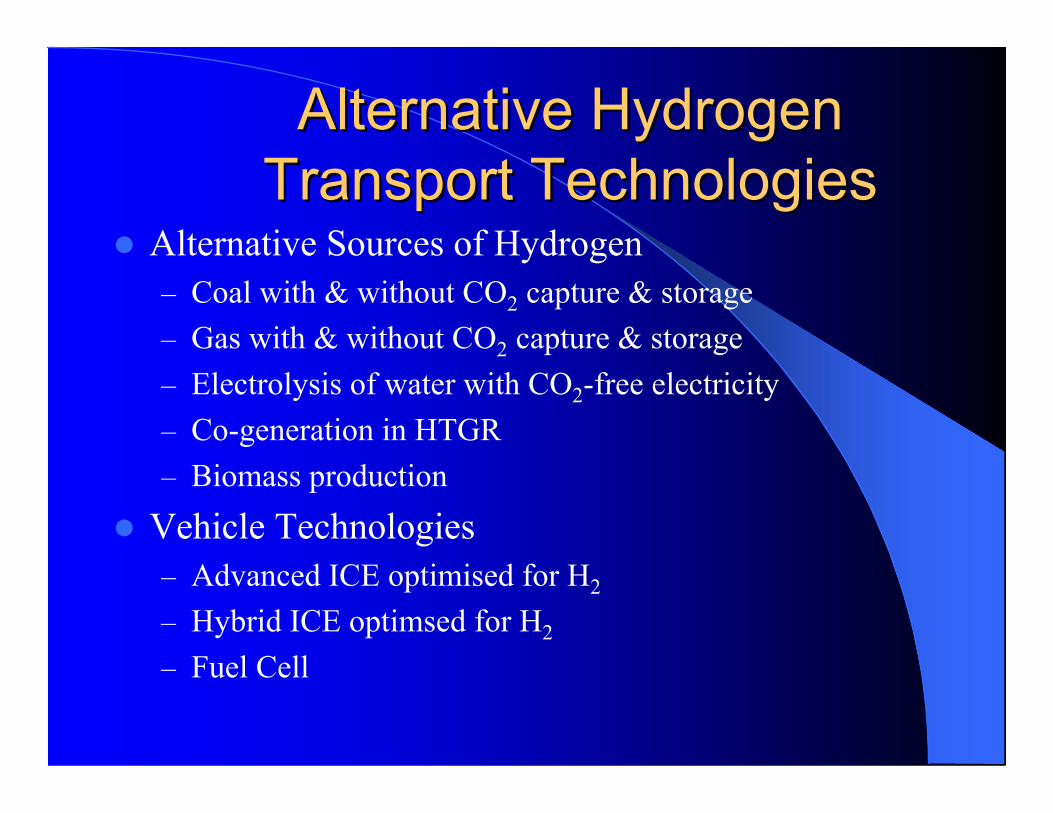
Alternative HydrogenAlternative HydrogenTransport TechnologiesTransport Technologies
Alternative Sources of Hydrogen– Coal with & without CO2 capture & storage– Gas with & without CO2 capture & storage– Electrolysis of water with CO2-free electricity– Co-generation in HTGR– Biomass production
Vehicle Technologies– Advanced ICE optimised for H2
– Hybrid ICE optimsed for H2
– Fuel Cell
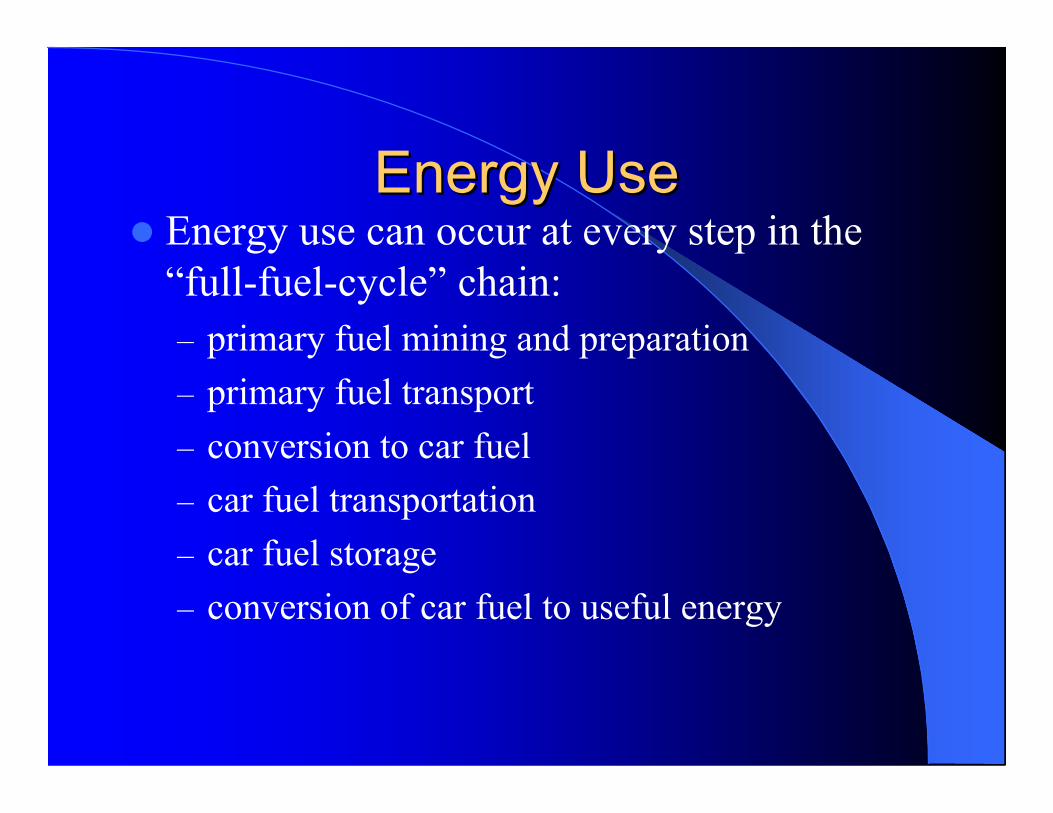
Energy UseEnergy Use Energy use can occur at every step in the
“full-fuel-cycle” chain:– primary fuel mining and preparation– primary fuel transport– conversion to car fuel– car fuel transportation– car fuel storage– conversion of car fuel to useful energy
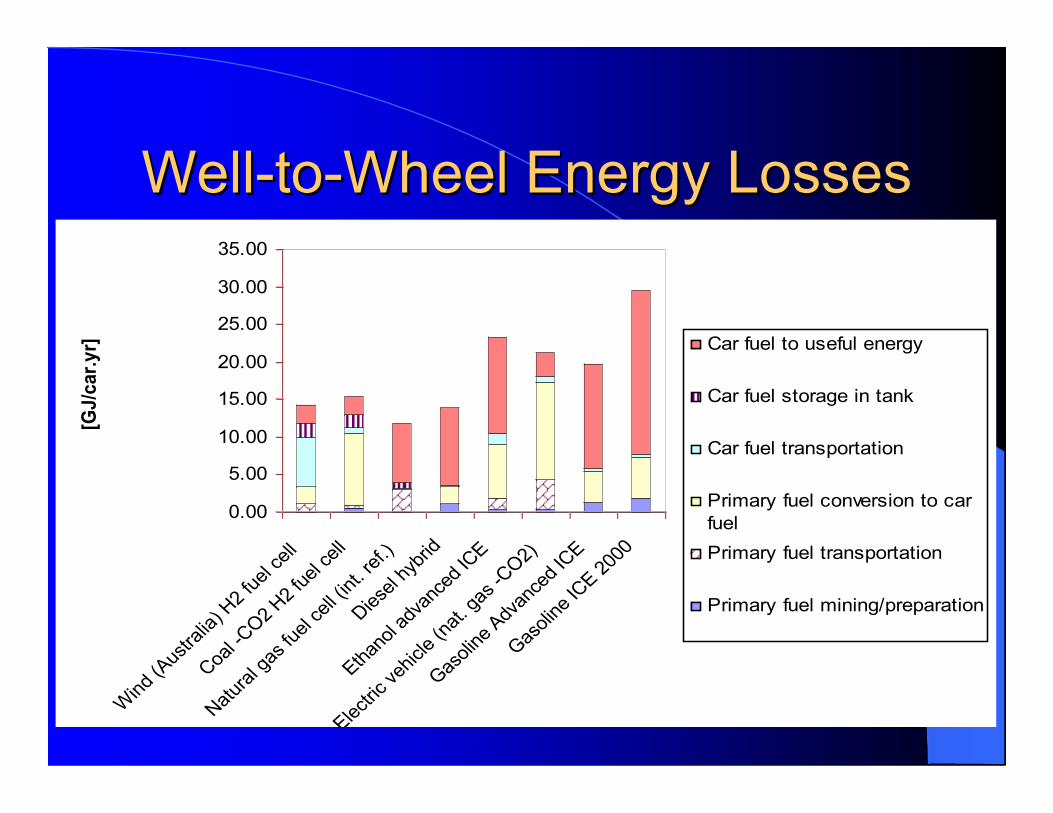
Well-to-Wheel Energy LossesWell-to-Wheel Energy Losses
0.00
5.00
10.00
15.00
20.00
25.00
30.00
35.00
Win
d (A
ustra
lia) H
2 fu
el c
ell
Coa
l -CO
2 H2
fuel
cel
l
Nat
ural
gas
fuel
cel
l (in
t. re
f.)
Die
sel h
ybrid
Ethan
ol a
dvan
ced
ICE
Elect
ric v
ehicle
(nat
. gas
-CO
2)
Gas
olin
e Adv
ance
d IC
E
Gas
olin
e IC
E 200
0
[GJ/car.yr] Car fuel to useful energy
Car fuel storage in tank
Car fuel transportation
Primary fuel conversion to car
fuel
Primary fuel transportation
Primary fuel mining/preparation
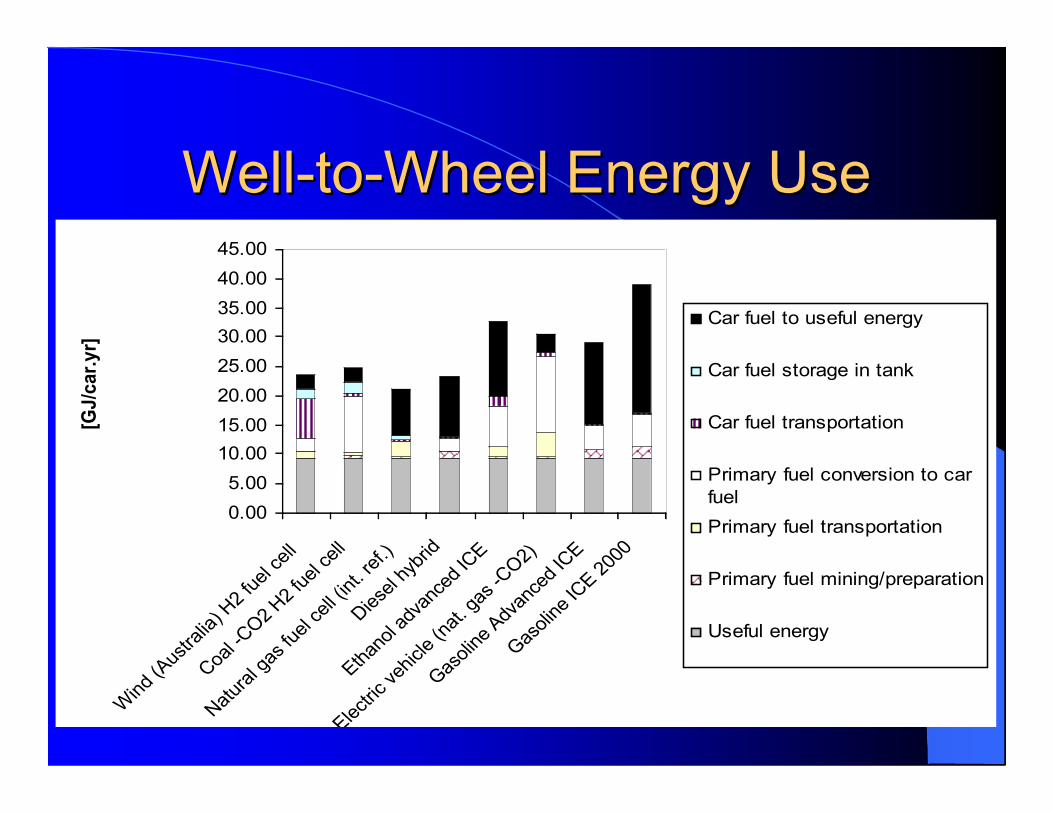
Well-to-Wheel Energy UseWell-to-Wheel Energy Use
0.00
5.00
10.00
15.00
20.00
25.00
30.00
35.00
40.00
45.00
Win
d (A
ustra
lia) H
2 fu
el c
ell
Coa
l -CO
2 H2
fuel
cel
l
Nat
ural
gas
fuel
cel
l (in
t. re
f.)
Die
sel h
ybrid
Ethan
ol a
dvan
ced
ICE
Elect
ric v
ehicle
(nat
. gas
-CO
2)
Gas
olin
e Adv
ance
d IC
E
Gas
olin
e IC
E 200
0
[GJ/car.yr]
Car fuel to useful energy
Car fuel storage in tank
Car fuel transportation
Primary fuel conversion to car
fuel
Primary fuel transportation
Primary fuel mining/preparation
Useful energy
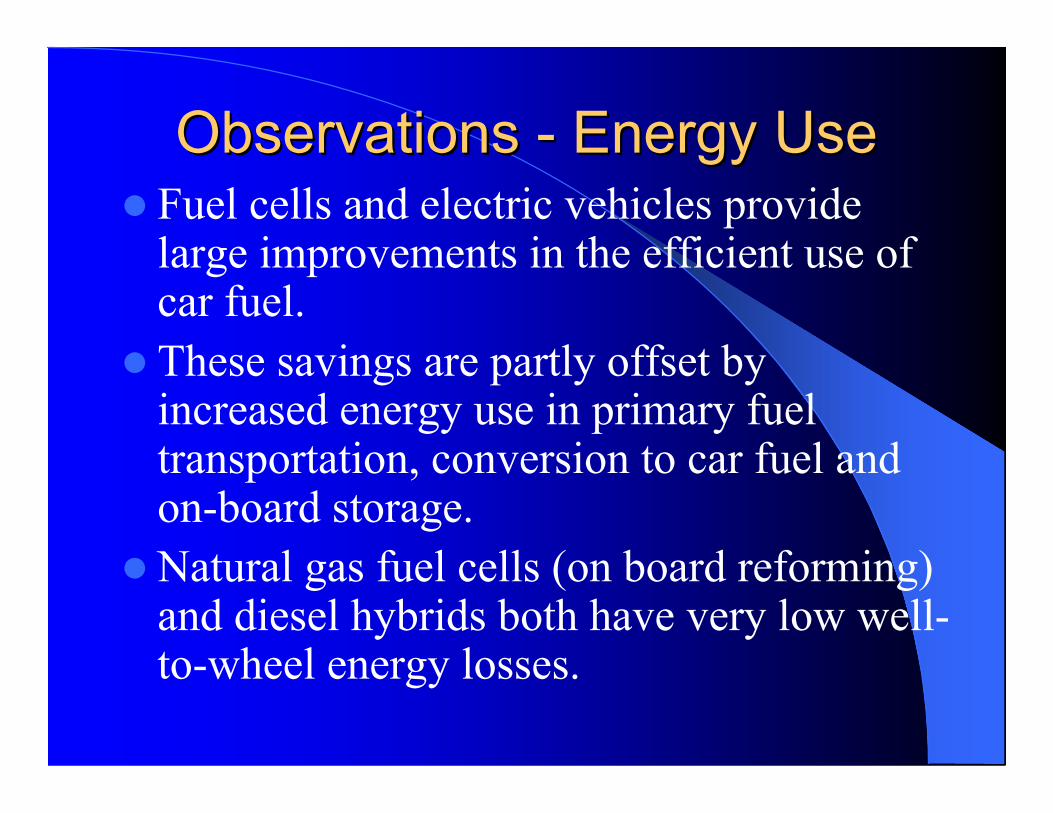
Observations - Energy UseObservations - Energy Use Fuel cells and electric vehicles provide
large improvements in the efficient use ofcar fuel.
These savings are partly offset byincreased energy use in primary fueltransportation, conversion to car fuel andon-board storage.
Natural gas fuel cells (on board reforming)and diesel hybrids both have very low well-to-wheel energy losses.
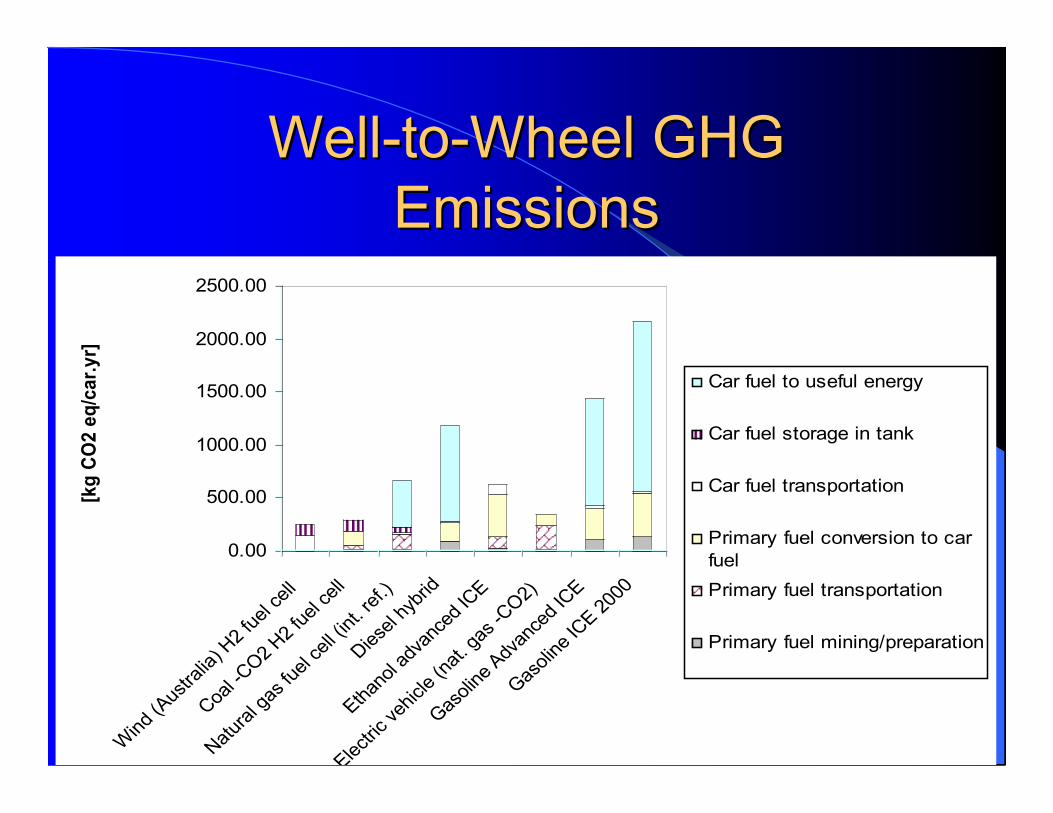
Well-to-Wheel GHGWell-to-Wheel GHGEmissionsEmissions
0.00
500.00
1000.00
1500.00
2000.00
2500.00
Win
d (A
ustra
lia) H
2 fu
el c
ell
Coa
l -CO
2 H2
fuel
cel
l
Nat
ural
gas
fuel
cel
l (in
t. re
f.)
Die
sel h
ybrid
Ethan
ol a
dvan
ced
ICE
Elect
ric v
ehicle
(nat
. gas
-CO
2)
Gas
olin
e Adv
ance
d IC
E
Gas
olin
e IC
E 200
0
[kg
CO
2 e
q/c
ar.
yr]
Car fuel to useful energy
Car fuel storage in tank
Car fuel transportation
Primary fuel conversion to car
fuel
Primary fuel transportation
Primary fuel mining/preparation
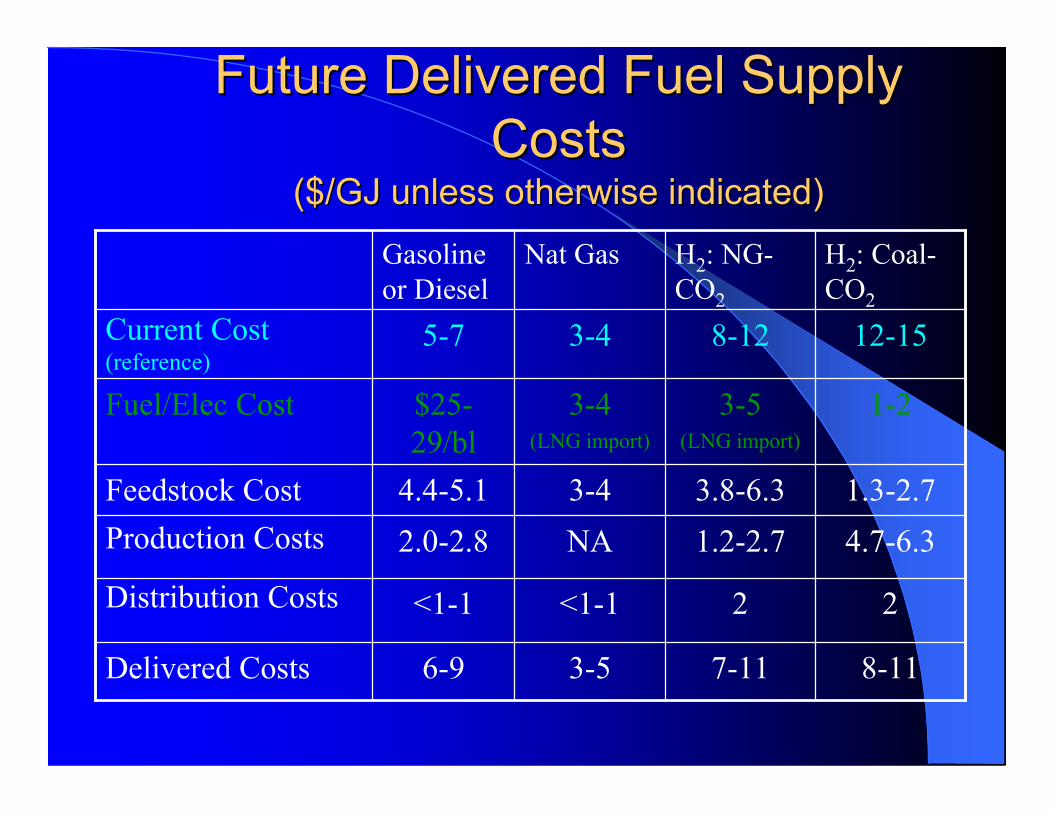
Future Delivered Fuel SupplyFuture Delivered Fuel SupplyCostsCosts
($/GJ unless otherwise indicated)($/GJ unless otherwise indicated)H2: Coal-CO2
H2: NG-CO2
Nat GasGasolineor Diesel
7-11
2
1.2-2.73.8-6.3
3-5(LNG import)
8-12
8-113-56-9Delivered Costs
2<1-1<1-1Distribution Costs
4.7-6.3NA2.0-2.8Production Costs1.3-2.73-44.4-5.1Feedstock Cost
1-23-4(LNG import)
$25-29/bl
Fuel/Elec Cost
12-153-45-7Current Cost(reference)
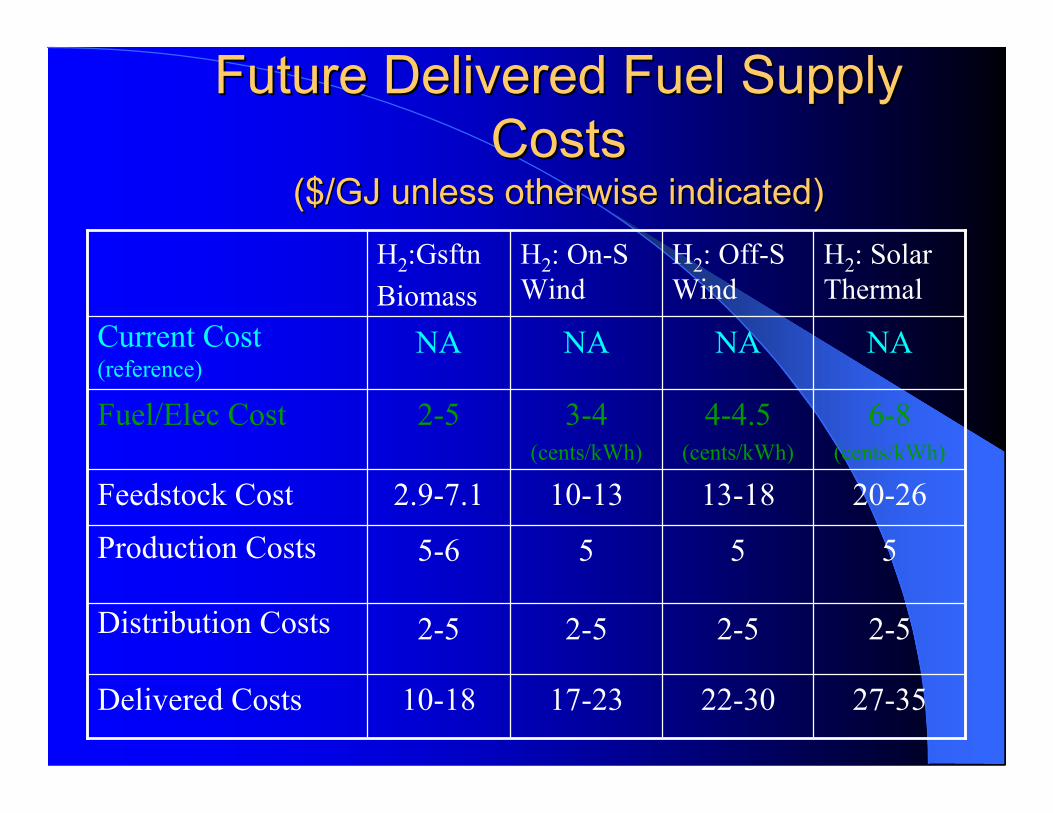
Future Delivered Fuel SupplyFuture Delivered Fuel SupplyCostsCosts
($/GJ unless otherwise indicated)($/GJ unless otherwise indicated)H2: SolarThermal
H2: Off-SWind
H2: On-SWind
H2:GsftnBiomass
22-30
2-5
5
13-18
4-4.5(cents/kWh)
NA
27-3517-2310-18Delivered Costs
2-52-52-5Distribution Costs
555-6Production Costs
20-2610-132.9-7.1Feedstock Cost
6-8(cents/kWh)
3-4(cents/kWh)
2-5Fuel/Elec Cost
NANANACurrent Cost(reference)
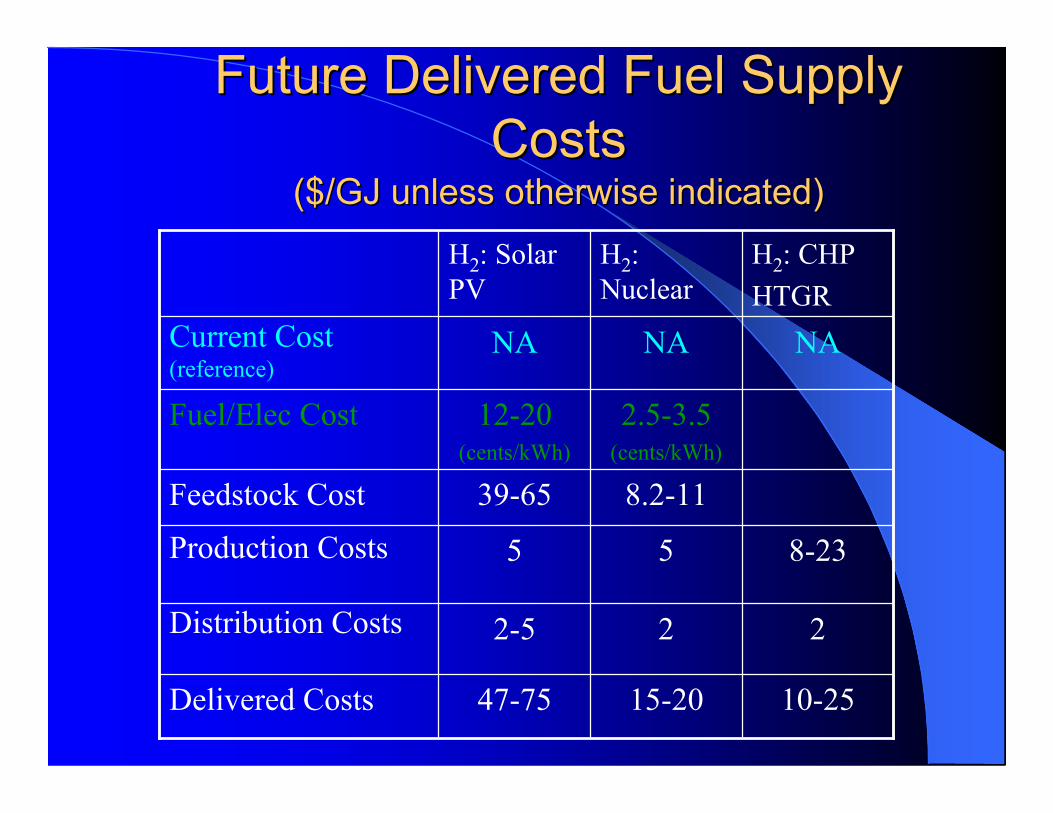
Future Delivered Fuel SupplyFuture Delivered Fuel SupplyCostsCosts
($/GJ unless otherwise indicated)($/GJ unless otherwise indicated)H2: CHPHTGR
H2:Nuclear
H2: SolarPV
15-20
2
5
8.2-11
2.5-3.5(cents/kWh)
NA
10-2547-75Delivered Costs
22-5Distribution Costs
8-235Production Costs
39-65Feedstock Cost
12-20(cents/kWh)
Fuel/Elec Cost
NANACurrent Cost(reference)
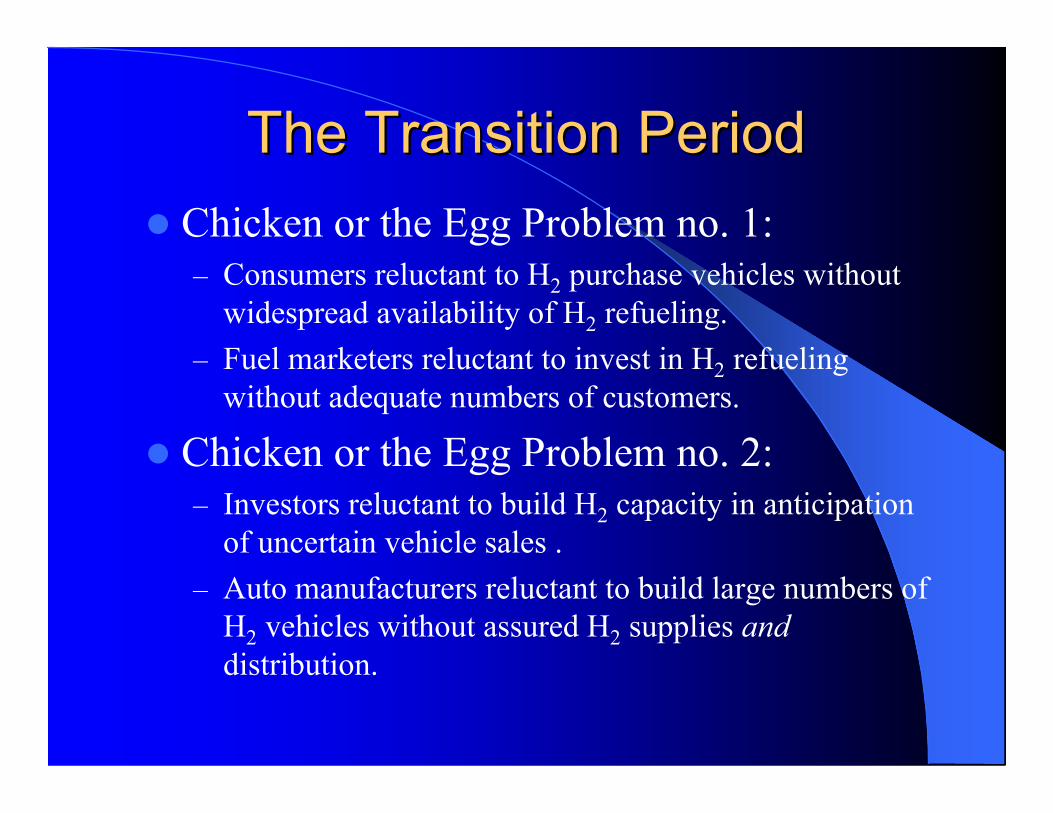
The Transition PeriodThe Transition Period Chicken or the Egg Problem no. 1:
– Consumers reluctant to H2 purchase vehicles withoutwidespread availability of H2 refueling.
– Fuel marketers reluctant to invest in H2 refuelingwithout adequate numbers of customers.
Chicken or the Egg Problem no. 2:– Investors reluctant to build H2 capacity in anticipation
of uncertain vehicle sales .– Auto manufacturers reluctant to build large numbers of
H2 vehicles without assured H2 supplies anddistribution.
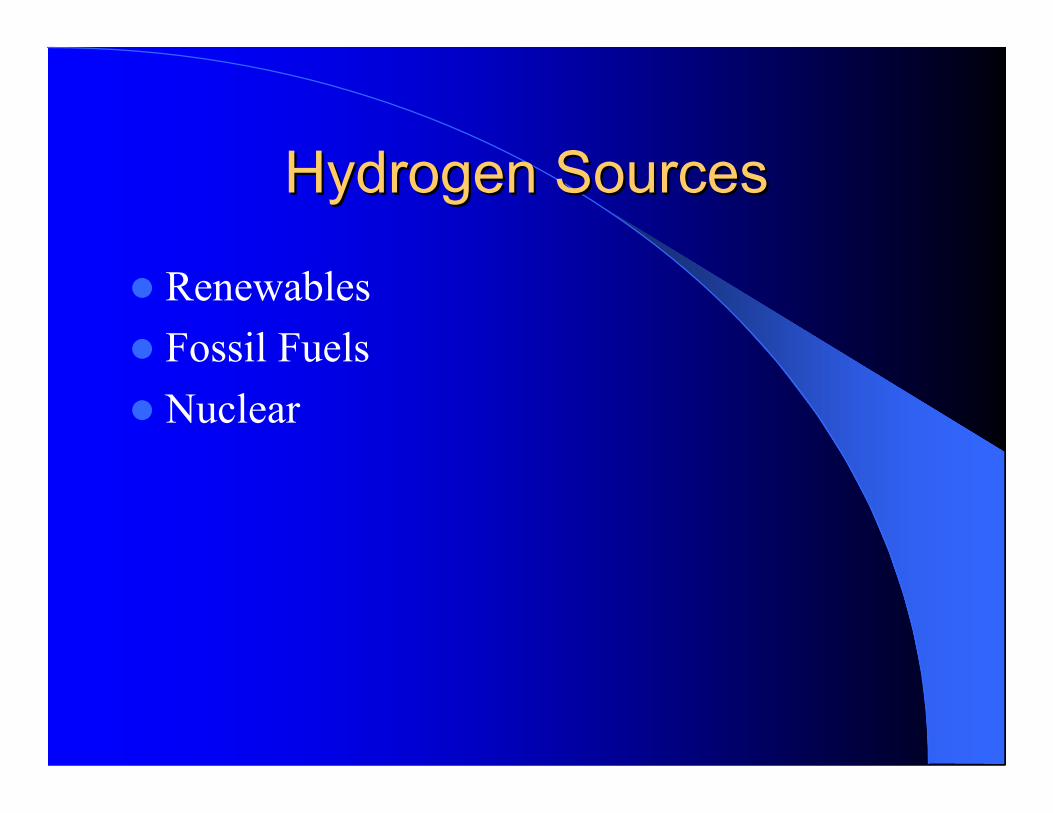
Hydrogen SourcesHydrogen Sources
Renewables Fossil Fuels Nuclear
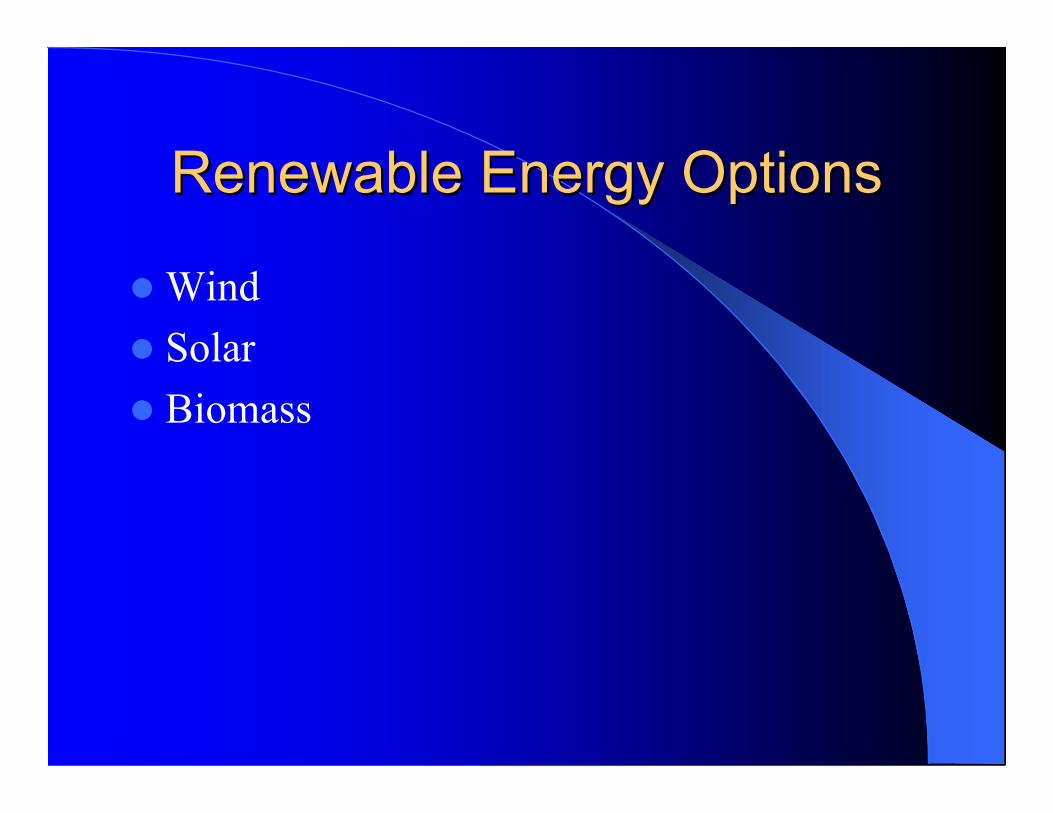
Renewable Energy OptionsRenewable Energy Options
Wind Solar Biomass
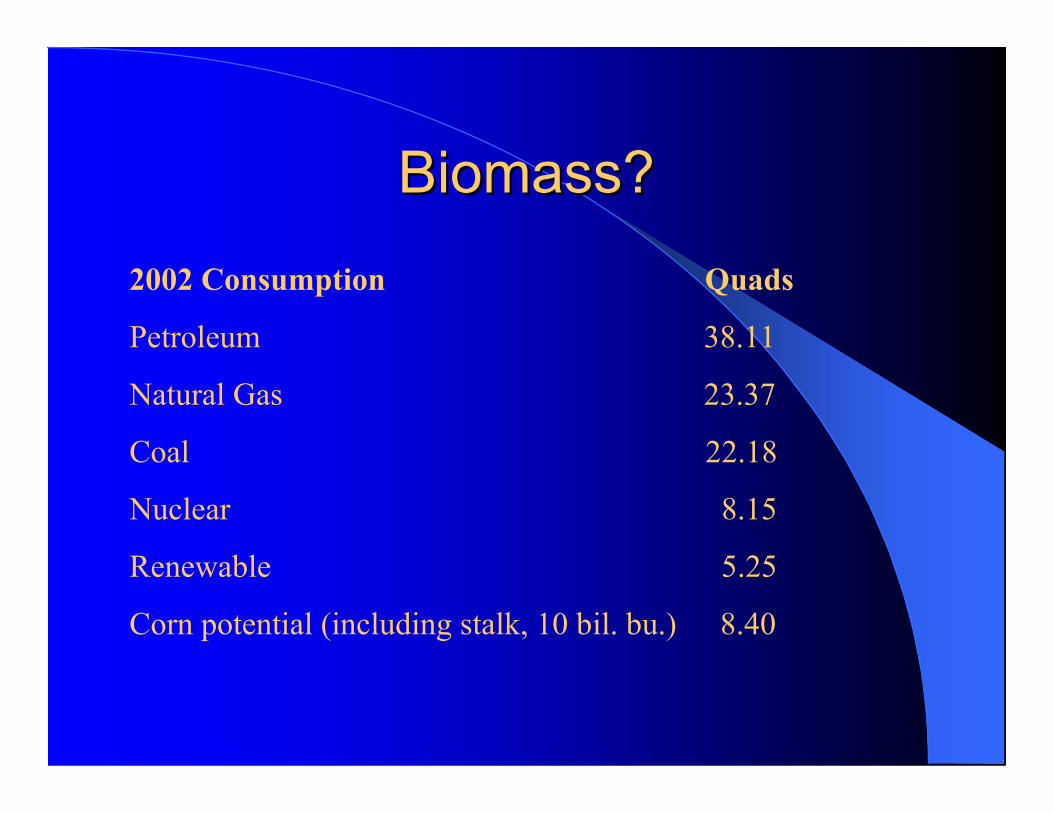
Biomass?Biomass?
2002 Consumption Quads
Petroleum 38.11
Natural Gas 23.37
Coal 22.18
Nuclear 8.15
Renewable 5.25
Corn potential (including stalk, 10 bil. bu.) 8.40

Fossil Fuel Hydrogen SourcesFossil Fuel Hydrogen Sources
Petroleum Natural Gas Coal
World Recoverable Coal Reserves - January 1999
23%
Soviet Union
25%
United States
12%
China
9%
Australia
7%
India
7%
Germany
6%
South Africa
2%
Serbia
2%
Poland7%
Other
World Total: 1089 Billion Short Tons19554 Quads(5897 Ouads World Crude Oil Reserves in 2000 - 78% OPEC)

US CoalUS Coal
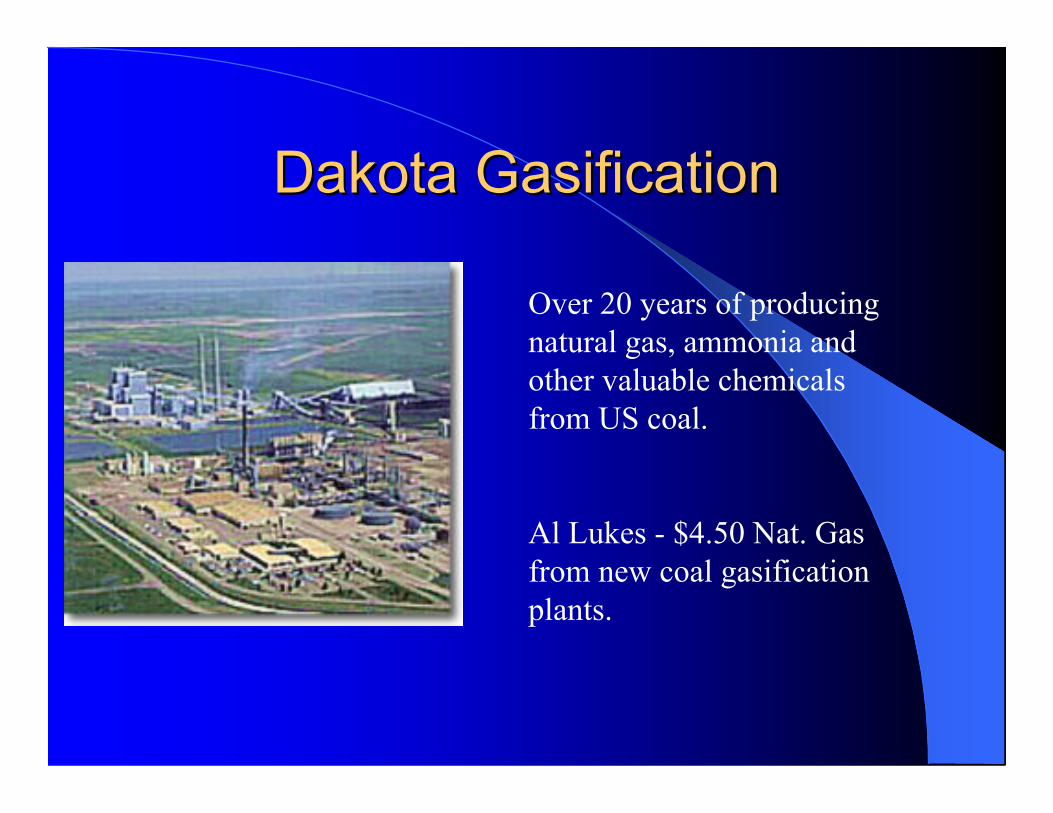
Dakota GasificationDakota Gasification
Over 20 years of producingnatural gas, ammonia andother valuable chemicalsfrom US coal.
Al Lukes - $4.50 Nat. Gasfrom new coal gasificationplants.
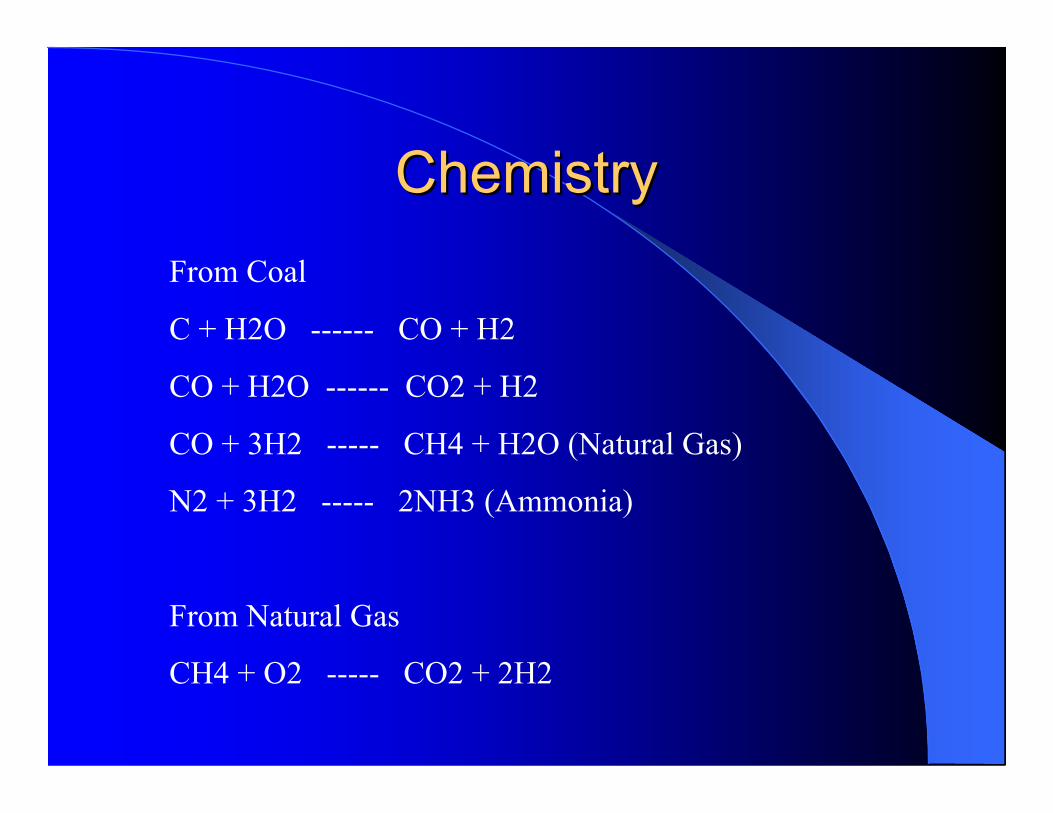
ChemistryChemistryFrom Coal
C + H2O ------ CO + H2
CO + H2O ------ CO2 + H2
CO + 3H2 ----- CH4 + H2O (Natural Gas)
N2 + 3H2 ----- 2NH3 (Ammonia)
From Natural Gas
CH4 + O2 ----- CO2 + 2H2
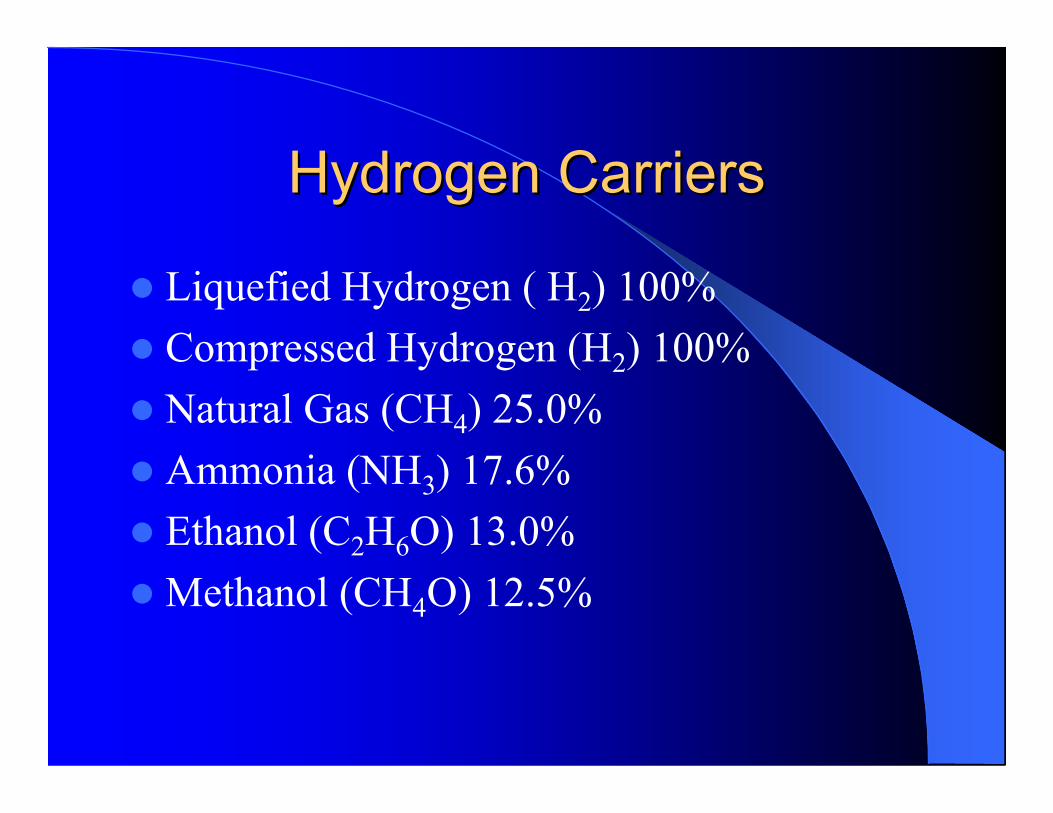
Hydrogen CarriersHydrogen Carriers
Liquefied Hydrogen ( H2) 100% Compressed Hydrogen (H2) 100% Natural Gas (CH4) 25.0% Ammonia (NH3) 17.6% Ethanol (C2H6O) 13.0% Methanol (CH4O) 12.5%
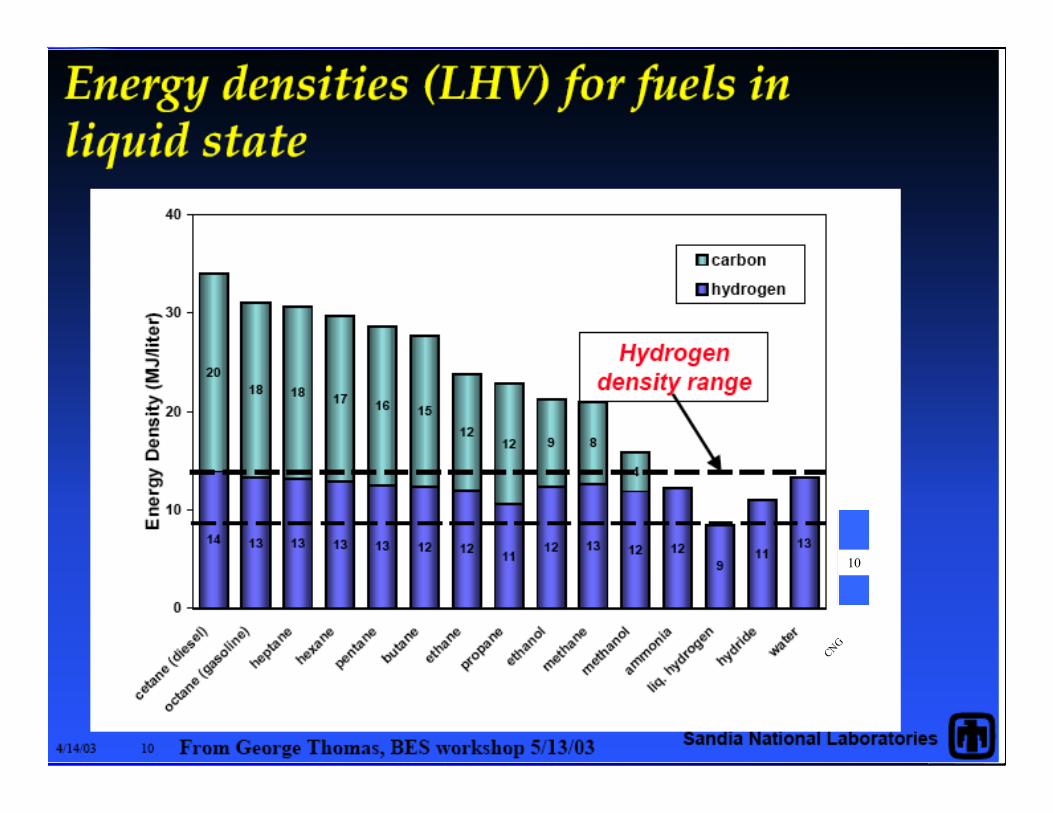
CNG
10
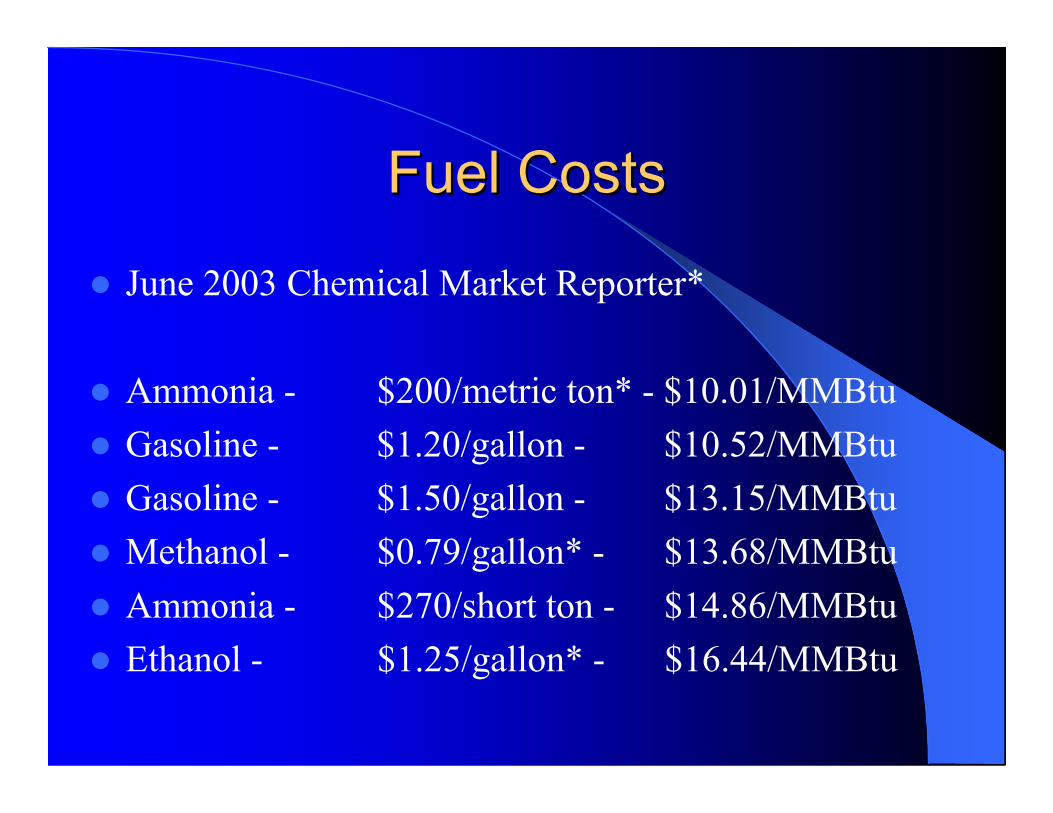
Fuel CostsFuel Costs
June 2003 Chemical Market Reporter*
Ammonia - $200/metric ton* - $10.01/MMBtu Gasoline - $1.20/gallon - $10.52/MMBtu Gasoline - $1.50/gallon - $13.15/MMBtu Methanol - $0.79/gallon* - $13.68/MMBtu Ammonia - $270/short ton - $14.86/MMBtu Ethanol - $1.25/gallon* - $16.44/MMBtu
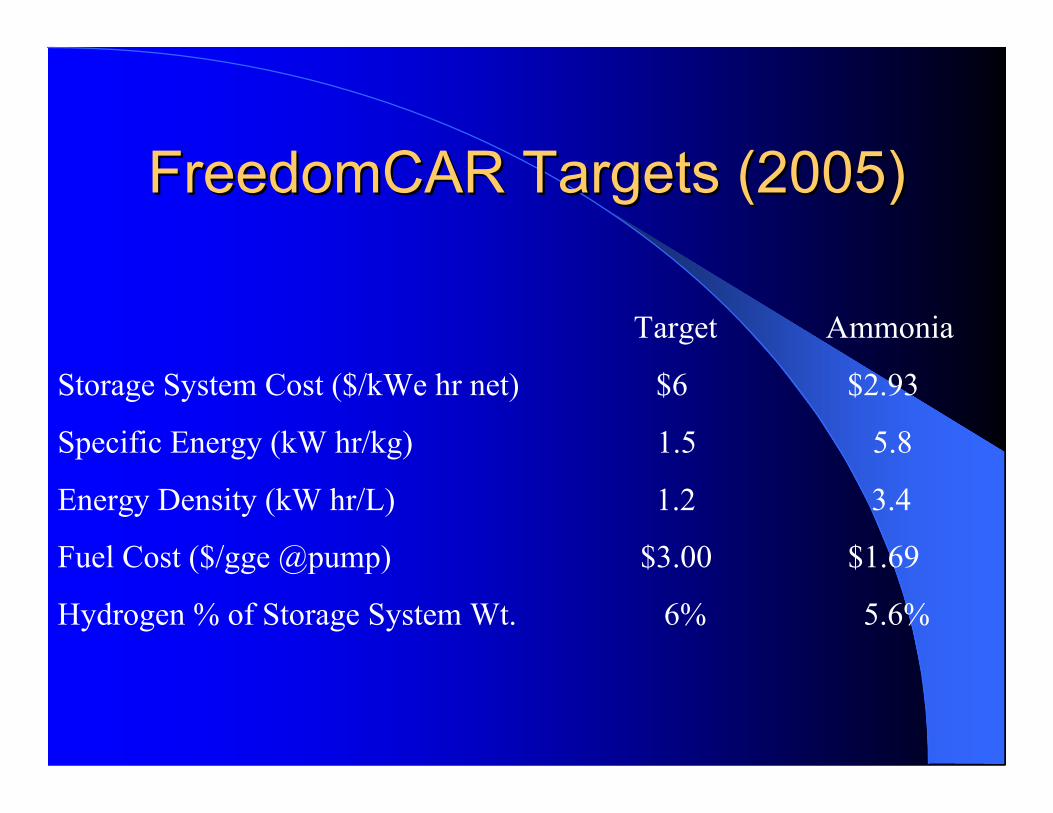
FreedomCAR FreedomCAR Targets (2005)Targets (2005)
Target Ammonia
Storage System Cost ($/kWe hr net) $6 $2.93
Specific Energy (kW hr/kg) 1.5 5.8
Energy Density (kW hr/L) 1.2 3.4
Fuel Cost ($/gge @pump) $3.00 $1.69
Hydrogen % of Storage System Wt. 6% 5.6%
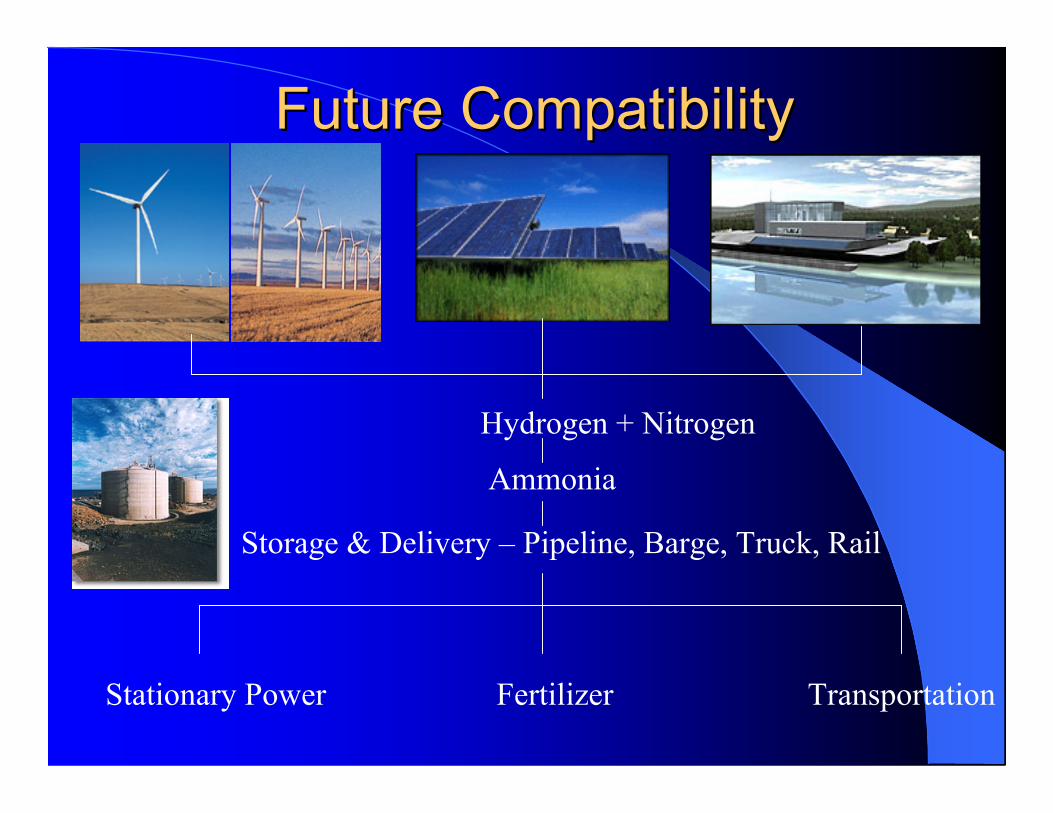
Future CompatibilityFuture Compatibility
Hydrogen + Nitrogen
Ammonia
Storage & Delivery – Pipeline, Barge, Truck, Rail
Stationary Power Fertilizer Transportation

Delivery InfrastructureDelivery Infrastructure
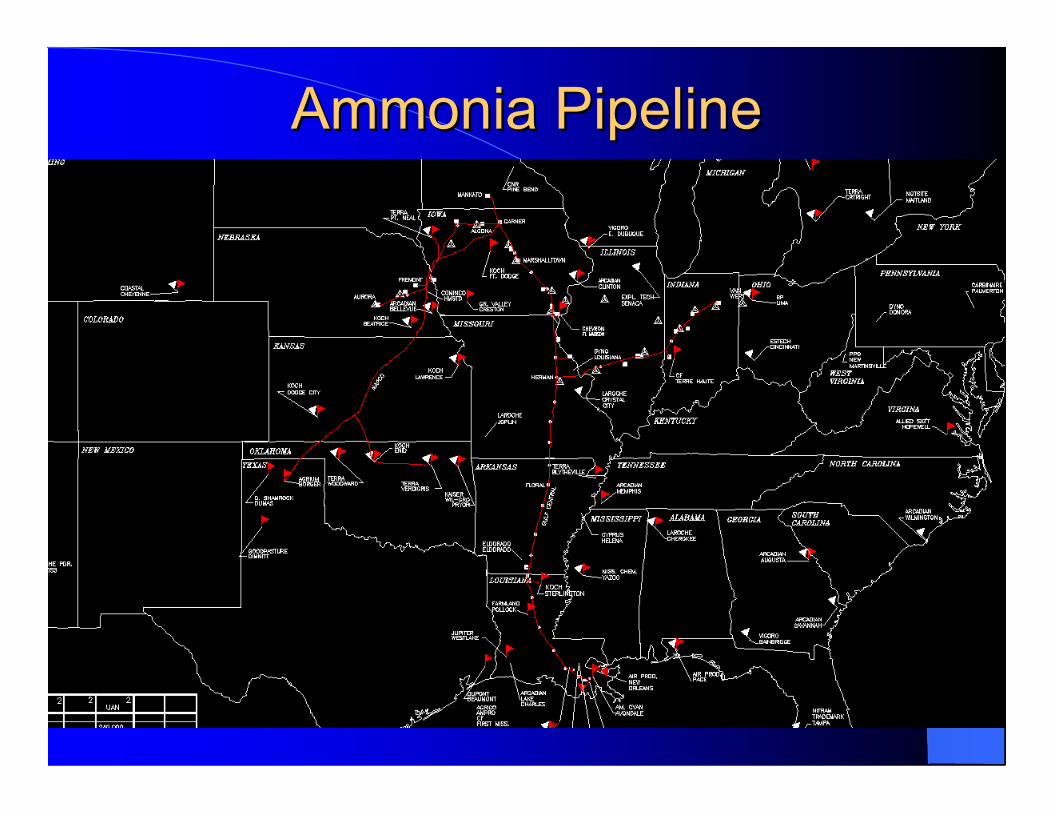
Ammonia PipelineAmmonia Pipeline
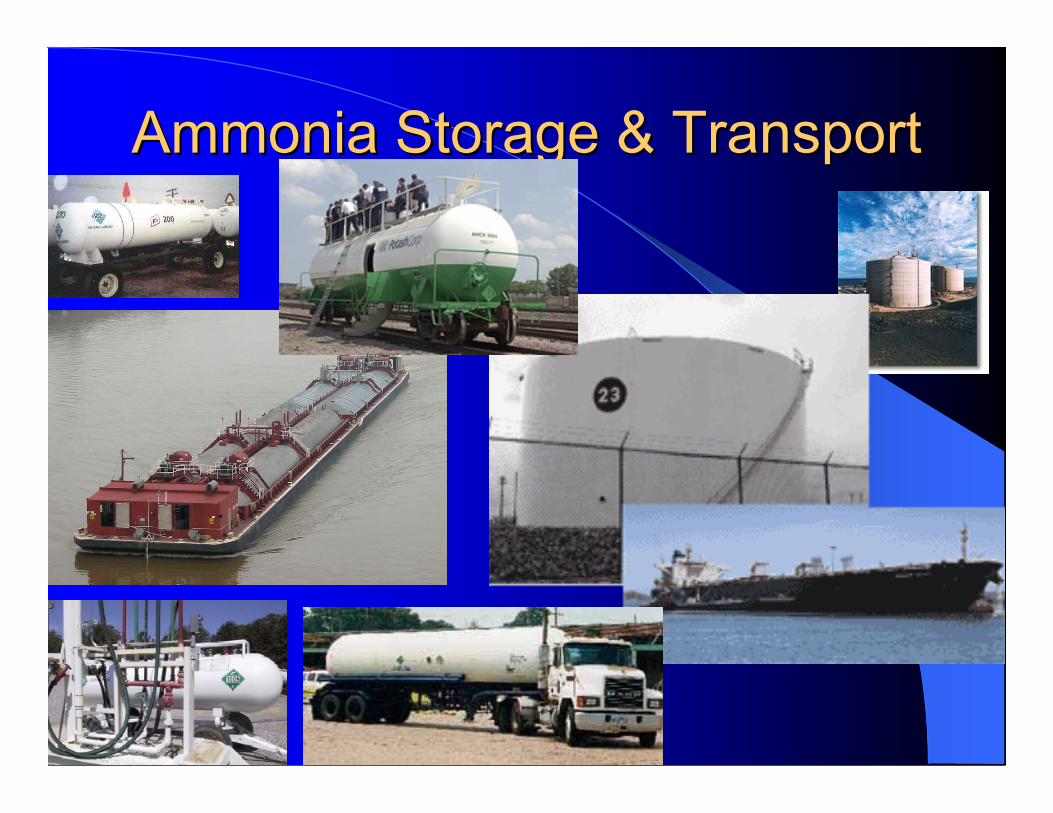
Ammonia Storage & TransportAmmonia Storage & Transport
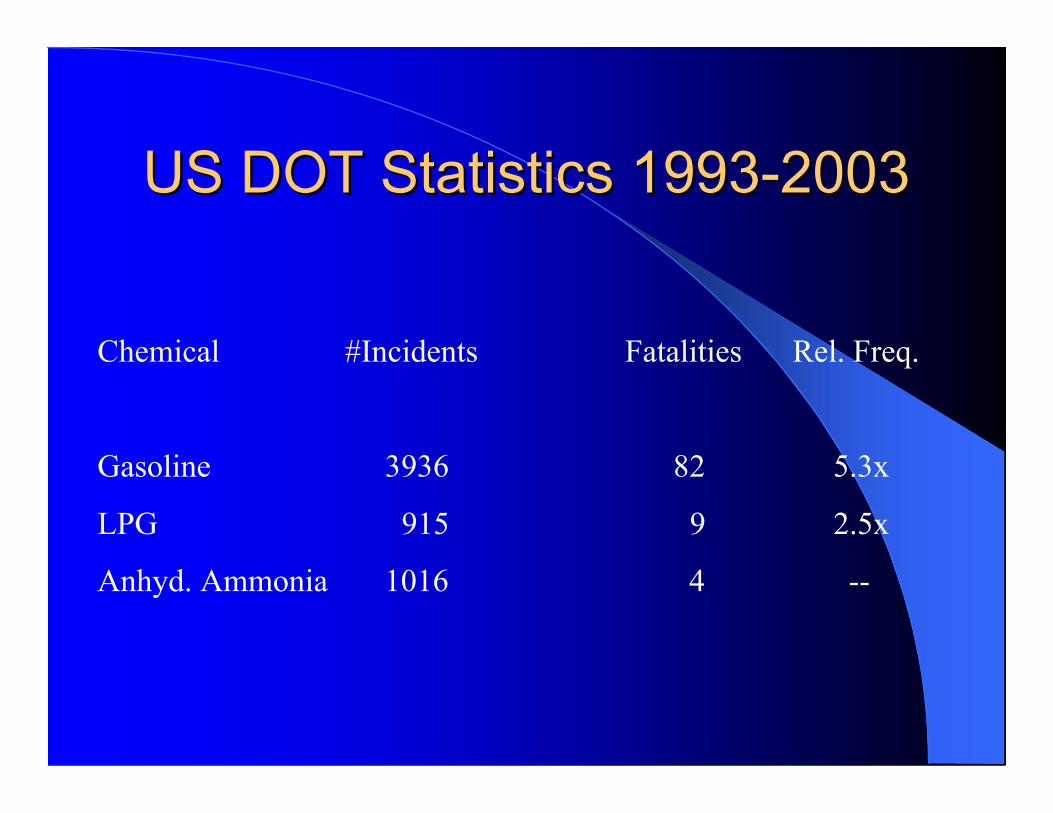
US DOT Statistics 1993-2003US DOT Statistics 1993-2003
Chemical #Incidents Fatalities Rel. Freq.
Gasoline 3936 82 5.3x
LPG 915 9 2.5x
Anhyd. Ammonia 1016 4 --
EuropeEurope
The Homepage ofthe R&D Component ofthe European CommissionClean Coal TechnologyProgramme
euro-cleancoal.net
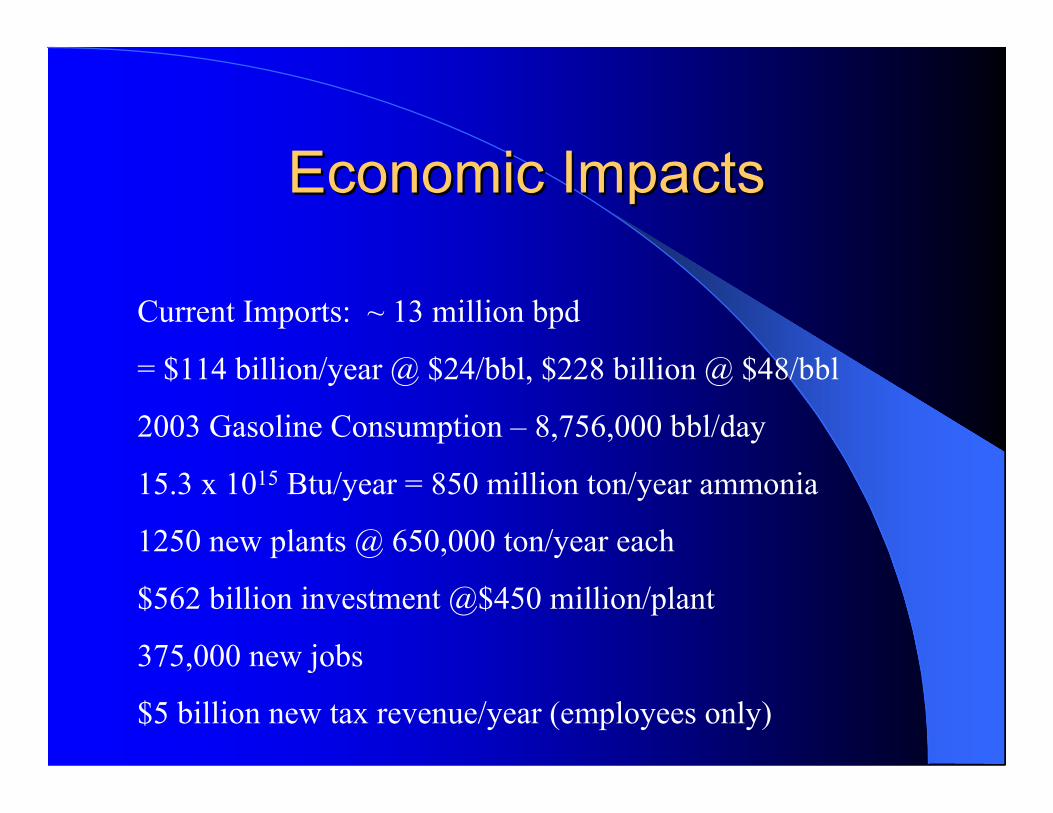
Economic ImpactsEconomic Impacts
Current Imports: ~ 13 million bpd
= $114 billion/year @ $24/bbl, $228 billion @ $48/bbl
2003 Gasoline Consumption – 8,756,000 bbl/day
15.3 x 10¹⁵ Btu/year = 850 million ton/year ammonia
1250 new plants @ 650,000 ton/year each
$562 billion investment @$450 million/plant
375,000 new jobs
$5 billion new tax revenue/year (employees only)
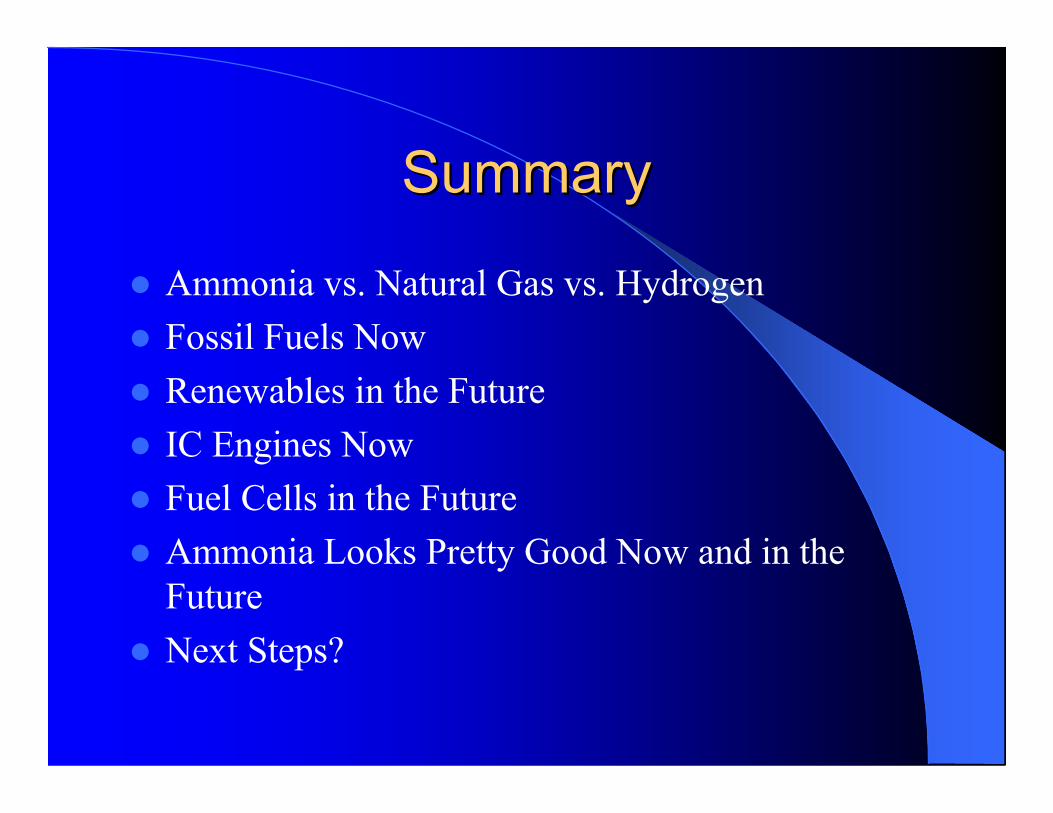
SummarySummary
Ammonia vs. Natural Gas vs. Hydrogen Fossil Fuels Now Renewables in the Future IC Engines Now Fuel Cells in the Future Ammonia Looks Pretty Good Now and in the
Future Next Steps?