Embed Size (px)
Citation preview
ARTICLE
Ammonia-fed reversible protonic ceramic fuel cellswith Ru-based catalystLiangzhu Zhu 1,2✉, Chris Cadigan 3, Chuancheng Duan4, Jake Huang1, Liuzhen Bian1, Long Le3,
Carolina H. Hernandez3, Victoria Avance1, Ryan O’Hayre 1✉ & Neal P. Sullivan3✉
The intermediate operating temperatures (~400–600 °C) of reversible protonic ceramic fuel
cells (RePCFC) permit the potential use of ammonia as a carbon-neutral high energy density
fuel and energy storage medium. Here we show fabrication of anode-supported RePCFC with
an ultra-dense (~100%) and thin (4 μm) protonic ceramic electrolyte layer. When coupled to
a novel Ru-(BaO)2(CaO)(Al2O3) (Ru-B2CA) reversible ammonia catalyst, maximum fuel-cell
power generation reaches 877mW cm−2 at 650 °C under ammonia fuel. We report rela-
tively stable operation at 600 °C for up to 1250 h under ammonia fuel. In fuel production
mode, ammonia rates exceed 1.2 × 10⁻⁸ NH3 mol cm−2 s−1at ambient pressure with H2 from
electrolysis only, and 2.1 × 10⁻⁶ mol NH3 cm−2 s−1 at 12.5 bar with H2 from both electrolysis
and simulated recycling gas.
https://doi.org/10.1038/s42004-021-00559-2 OPEN
1Metallurgical and Materials Engineering Department, Colorado School of Mines, Golden, CO, USA. 2Ningbo Institute of Materials Technology andEngineering, Chinese Academy of Sciences, Ningbo, China. 3Mechanical Engineering Department, Colorado School of Mines, Golden, CO, USA. 4 ChemicalEngineering Department, Kansas State University, Manhattan, KS, USA. ✉email: [email protected]; [email protected]; [email protected]
COMMUNICATIONS CHEMISTRY | (2021) 4:121 | https://doi.org/10.1038/s42004-021-00559-2 | www.nature.com/commschem 1
1234
5678
90():,;
Protonic ceramic fuel cells (PCFCs) are an increasinglyimportant sub-class of conventional solid oxide fuel cells(SOFCs) that primarily conduct protons, and therefore
operate at lower temperatures (typically between ~400 and650 °C) compared to their oxygen-ion conducting counterparts.PCFCs have attracted increasing attention in the past decadedue to large improvements in performance1–8. Recent studies,along with a foundation from earlier pioneering work9–14,have provided major advancements, including new electrolytecompositions with working temperatures ~200 °C lower thanthat in typical SOFCs5–7, new triple-conducting cathodematerials6,8,14,15, improvements in cell fabrication process6,16,and methods to manipulate interfacial properties4 to dramaticallyimprove performance and stability. The recent demonstration ofa 5 × 5 cm2 PCFC reaching 1.3W cm−2 maximum power density(MPD) at 600 °C under H2 fuel, and the demonstration of10 × 10 cm2 PCFC single-cell generating 42W output at 600 °Csuggest PCFCs may now be poised for practical application5,17.Moreover, when operated in reverse, most PCFCs can also beused as protonic ceramic electrolysis cells (PCECs) to produce H2.Recent studies have demonstrated reversible operation in PCFC/PCEC devices with close to 100% H2 faradaic efficiency (FE) atcurrent densities as high as 2000 mA cm−2 and temperaturesbetween 500 and 600 °C2,18,19.
Hydrogen is the most-common working fluid in reversibledevices towards a sustainable green energy-oriented future,However, NH3 presents an attractive alternative. Ammonia canbe easily liquefied at room temperature at about 8 bar or at−33 °C at ambient pressure. In contrast, the liquefaction tem-perature of hydrogen is −253 °C at ambient pressure and lique-faction of hydrogen gas at room temperature is not practical.When liquified, NH3 has a significantly higher volumetric energydensity (12.7 MJ/L) than compressed hydrogen (4.5 MJ/L at~70MPa) or liquified hydrogen (8.5 MJ/L) and as well as Li-ionbatteries (~5.4 MJ/L)20. Ammonia is a widely used raw materialfor agriculture fertilizer and thus has well-established storage,transport, and handling processes (about 180 million tons ofammonia are produced annually)21,22. Techno-economic analysissuggests ammonia is the least expensive fuel among hydrogen,gasoline, natural gas, liquified petroleum gas, and methanol23,24.Finally, NH3 has a much narrower explosive limit in air (15–28vol. %) in contrast to compressed hydrogen (4–75 vol. %) andmethanol (~7–36 vol. %), and a high auto-ignition temperature(650 °C) that reduces flammability risk during storage andtransportation24. With these advantages in mind, an energy sys-tem that can combine the advantages of both RePCFCs and NH3
fuel may be very attractive for space-tight and high energy-density applications such as in fuel cell vehicles, unmanned aerialvehicles, and seasonal-term large scale energy storage.
In this study, we report a high-performance reversiblePCFC coupled to a novel, highly effective and reversibleRu-(BaO)2(CaO)(Al2O3) (Ru-B2CA) ammonia catalyst. By inte-grating the Ru-B2CA catalyst with our high-performance PCFC,we achieved a peak power density of 877 mW cm−2 at 650 °Cunder NH3 fuel, which is among the highest performingammonia-fed SOFCs and PCFCs at this temperature (c.f. Sup-plementary Table S1). Performance on NH3 reaches 93% to 98%of that achieved under H2 fuel from 450 to 650 °C, suggestingvery little penalty for operating on NH3 relative to neat H2.Furthermore, degradation under NH3 fuel, a significant challengefor most fuel cells, is significantly suppressed with the aid of theRu-B2CA catalyst. When operation is reversed to fuel-synthesismode, the same device demonstrates exceptional performance forsteam electrolysis, with high FE, current densities exceeding2000 mAcm−2, and high ammonia production rates at ambientpressure as compared in Supplementary Table S2. Finally, we
further demonstrate reversible cycling between ammonia pro-duction and electric-power generation in a single cell with highperformance and reasonable stability.
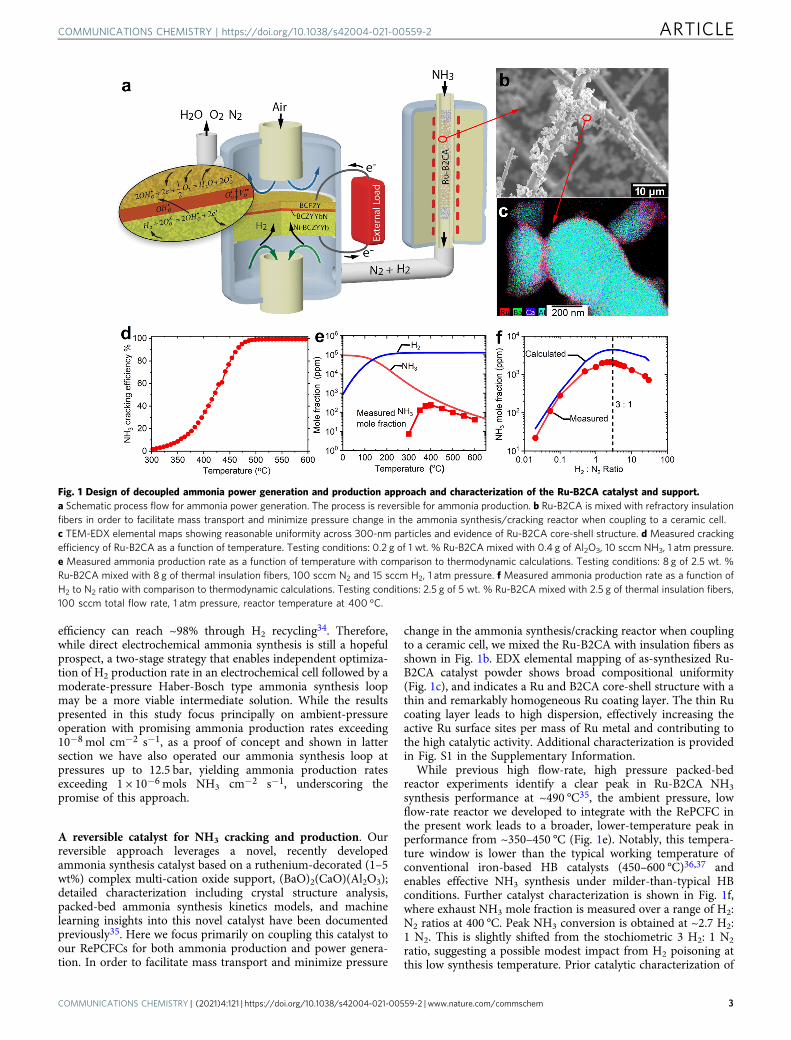
Results and discussionsA decoupled ammonia power generation and ammoniasynthesis design. Figure 1a illustrates our hybrid approach forammonia power generation and ammonia production. In“energy-generation” mode, NH3 fuel is fed and split over thecatalyst to form H2 and N2; the produced H2 is electrochemicallyoxidized to generate electricity. This approach enables fullreversibility. In “energy-storage” mode, feedstocks of H2O, N2
and electricity form NH3 in addition to excess H2 and N2. Whileprior ammonia-based applications of protonic ceramic cells havelargely pursued a fully-integrated, single reactor approach, herewe deliberately pursue a decoupled design, where separate reac-tors are used for power generation/electrochemical water splittingand ammonia cracking/thermochemical ammonia synthesis.
We selected this decoupled design for several reasons. (1)Decoupling enables the size and operating conditions for eachportion of the device to be independently optimized. We operatethe protonic-ceramic electrolyzer at ~600 °C for efficient H2
production, while the NH3 synthesis step is conducted at~400–500 °C to maximize ammonia production rates based onthe thermodynamic and kinetic characteristics of the ammoniasynthesis reaction. (2) Decoupling greatly simplifies devicefabrication procedures, as integrating the non-conductive Ru-B2CA catalyst directly within the RePCEC electrode necessitatescostly and performance-compromising synthesis steps. (3) Thedecoupling also allows the geometry and characteristics of the Ru-B2CA catalyst bed (e.g., residence time, catalyst loading,operating pressure) to be independently controlled relative tothe geometry and characteristics of the electrolysis cell (e.g., H2
production rate, Faradaic efficiency). (4) Decoupling alsofacilitates periodic regeneration/recycling of the ammonia catalystindependent of the electrochemical cell. Furthermore, thedecoupled design facilitates direct adoption into the high pressureand temperature synthesis loop found in the conventional HBprocess. (5) PCEC production of pure, dry hydrogen removes theneed for the gas separation, purification and dehumidificationprocesses required for SMR-based H2 production, simplifyingsystem design. (6) Potential thermal advantages arise as theendotherm associated with steam electrolysis can be balanced bythe exotherm present in ammonia synthesis; similarly, under fuel-cell mode, the NH3-cracking endotherm can be offset by heatproduced by fuel-cell inefficiencies. (7) Finally, thermodynamic,kinetic, and catalytic analyses (further detailed in the SI) suggest itis fundamentally very challenging to suppress hydrogen-evolutionreaction while increasing the nitrogen reduction reaction25–28.Using a decoupled design, ammonia catalysis and H2 evolutioncan be spatially separated and therefore independently optimizedwithout compromise.
We note that our decoupled design approach is in contrast tomost previous attempts to use protonic ceramic electrochemicaldevices for ammonia synthesis, as in the pioneering work of theStoukides group29,30, where direct integration of the ammoniasynthesis catalyst into the proton conducting cell has beenpursued. These previous studies have generally achieved ammo-nia production rates on the order of ~10−12–10−9 mol cm−2 s−1
under ambient conditions, with champion studies reaching low10−8 mol cm−2 s−1 production rates31–33. Furthermore, mostprior studies have used H2 rather than H2O as the startingfeedstock, and H2-to-NH3 conversion rates, when noted, aregenerally <0.1%. In contrast, modern Haber-Bosch (HB) plantsreach 18% H2 single-pass conversion and the conversion
ARTICLE COMMUNICATIONS CHEMISTRY | https://doi.org/10.1038/s42004-021-00559-2
2 COMMUNICATIONS CHEMISTRY | (2021) 4:121 | https://doi.org/10.1038/s42004-021-00559-2 | www.nature.com/commschem
efficiency can reach ~98% through H2 recycling34. Therefore,while direct electrochemical ammonia synthesis is still a hopefulprospect, a two-stage strategy that enables independent optimiza-tion of H2 production rate in an electrochemical cell followed by amoderate-pressure Haber-Bosch type ammonia synthesis loopmay be a more viable intermediate solution. While the resultspresented in this study focus principally on ambient-pressureoperation with promising ammonia production rates exceeding10−8 mol cm−2 s−1, as a proof of concept and shown in lattersection we have also operated our ammonia synthesis loop atpressures up to 12.5 bar, yielding ammonia production ratesexceeding 1 × 10⁻⁶ mols NH3 cm−2 s−1, underscoring thepromise of this approach.
A reversible catalyst for NH3 cracking and production. Ourreversible approach leverages a novel, recently developedammonia synthesis catalyst based on a ruthenium-decorated (1–5wt%) complex multi-cation oxide support, (BaO)2(CaO)(Al2O3);detailed characterization including crystal structure analysis,packed-bed ammonia synthesis kinetics models, and machinelearning insights into this novel catalyst have been documentedpreviously35. Here we focus primarily on coupling this catalyst toour RePCFCs for both ammonia production and power genera-tion. In order to facilitate mass transport and minimize pressure
change in the ammonia synthesis/cracking reactor when couplingto a ceramic cell, we mixed the Ru-B2CA with insulation fibers asshown in Fig. 1b. EDX elemental mapping of as-synthesized Ru-B2CA catalyst powder shows broad compositional uniformity(Fig. 1c), and indicates a Ru and B2CA core-shell structure with athin and remarkably homogeneous Ru coating layer. The thin Rucoating layer leads to high dispersion, effectively increasing theactive Ru surface sites per mass of Ru metal and contributing tothe high catalytic activity. Additional characterization is providedin Fig. S1 in the Supplementary Information.
While previous high flow-rate, high pressure packed-bedreactor experiments identify a clear peak in Ru-B2CA NH3
synthesis performance at ~490 °C35, the ambient pressure, lowflow-rate reactor we developed to integrate with the RePCFC inthe present work leads to a broader, lower-temperature peak inperformance from ~350–450 °C (Fig. 1e). Notably, this tempera-ture window is lower than the typical working temperature ofconventional iron-based HB catalysts (450–600 °C)36,37 andenables effective NH3 synthesis under milder-than-typical HBconditions. Further catalyst characterization is shown in Fig. 1f,where exhaust NH3 mole fraction is measured over a range of H2:N2 ratios at 400 °C. Peak NH3 conversion is obtained at ~2.7 H2:1 N2. This is slightly shifted from the stochiometric 3 H2: 1 N2
ratio, suggesting a possible modest impact from H2 poisoning atthis low synthesis temperature. Prior catalytic characterization of
Fig. 1 Design of decoupled ammonia power generation and production approach and characterization of the Ru-B2CA catalyst and support.a Schematic process flow for ammonia power generation. The process is reversible for ammonia production. b Ru-B2CA is mixed with refractory insulationfibers in order to facilitate mass transport and minimize pressure change in the ammonia synthesis/cracking reactor when coupling to a ceramic cell.c TEM-EDX elemental maps showing reasonable uniformity across 300-nm particles and evidence of Ru-B2CA core-shell structure. d Measured crackingefficiency of Ru-B2CA as a function of temperature. Testing conditions: 0.2 g of 1 wt. % Ru-B2CA mixed with 0.4 g of Al2O3, 10 sccm NH3, 1 atm pressure.e Measured ammonia production rate as a function of temperature with comparison to thermodynamic calculations. Testing conditions: 8 g of 2.5 wt. %Ru-B2CA mixed with 8 g of thermal insulation fibers, 100 sccm N2 and 15 sccm H2, 1 atm pressure. f Measured ammonia production rate as a function ofH2 to N2 ratio with comparison to thermodynamic calculations. Testing conditions: 2.5 g of 5 wt. % Ru-B2CA mixed with 2.5 g of thermal insulation fibers,100 sccm total flow rate, 1 atm pressure, reactor temperature at 400 °C.
COMMUNICATIONS CHEMISTRY | https://doi.org/10.1038/s42004-021-00559-2 ARTICLE
COMMUNICATIONS CHEMISTRY | (2021) 4:121 | https://doi.org/10.1038/s42004-021-00559-2 | www.nature.com/commschem 3
the Ru-B2CA system shows that H2 poisoning is eliminated athigher synthesis temperatures (e.g., 490 °C) with a broadmaximum in NH3 synthesis performance from ~3 H2: 1 N2 allthe way up to 6 H2: 1 N2 ratio, thereby providing a wide operatingwindow for optimizing performance.. Measured NH3 conversionclosely tracks equilibrium predictions above 400 °C, suggestingthermodynamics rather than kinetics limit this catalyst system atthese temperatures and flow rates.
Finally, the cracking efficiency of the Ru-B2CA catalyst isshown in Fig. 1d. Cracking efficiency reaches ~100% above500 °C. Although trace NH3 likely remains after cracking, theRePCFC is tolerant to trace NH3 without loss in performance ordurability. This is in contrast to low-temperature PEMFC-basedsystems, which are generally intolerant to trace NH3 and requirefurther fuel-stream purification prior to use.
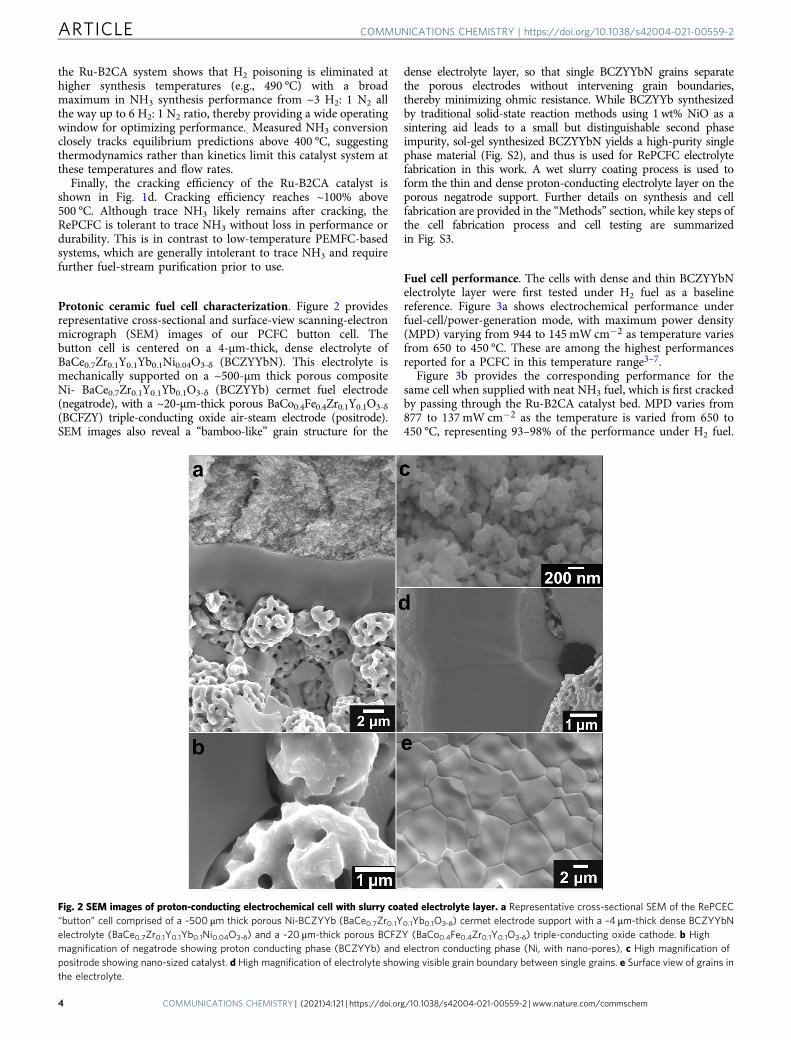
Protonic ceramic fuel cell characterization. Figure 2 providesrepresentative cross-sectional and surface-view scanning-electronmicrograph (SEM) images of our PCFC button cell. Thebutton cell is centered on a 4-μm-thick, dense electrolyte ofBaCe0.7Zr0.1Y0.1Yb0.1Ni0.04O3-δ (BCZYYbN). This electrolyte ismechanically supported on a ~500-μm thick porous compositeNi- BaCe0.7Zr0.1Y0.1Yb0.1O3-δ (BCZYYb) cermet fuel electrode(negatrode), with a ~20-μm-thick porous BaCo0.4Fe0.4Zr0.1Y0.1O3-δ
(BCFZY) triple-conducting oxide air-steam electrode (positrode).SEM images also reveal a “bamboo-like” grain structure for the
dense electrolyte layer, so that single BCZYYbN grains separatethe porous electrodes without intervening grain boundaries,thereby minimizing ohmic resistance. While BCZYYb synthesizedby traditional solid-state reaction methods using 1 wt% NiO as asintering aid leads to a small but distinguishable second phaseimpurity, sol-gel synthesized BCZYYbN yields a high-purity singlephase material (Fig. S2), and thus is used for RePCFC electrolytefabrication in this work. A wet slurry coating process is used toform the thin and dense proton-conducting electrolyte layer on theporous negatrode support. Further details on synthesis and cellfabrication are provided in the “Methods” section, while key steps ofthe cell fabrication process and cell testing are summarizedin Fig. S3.
Fuel cell performance. The cells with dense and thin BCZYYbNelectrolyte layer were first tested under H2 fuel as a baselinereference. Figure 3a shows electrochemical performance underfuel-cell/power-generation mode, with maximum power density(MPD) varying from 944 to 145 mW cm−2 as temperature variesfrom 650 to 450 °C. These are among the highest performancesreported for a PCFC in this temperature range3–7.
Figure 3b provides the corresponding performance for thesame cell when supplied with neat NH3 fuel, which is first crackedby passing through the Ru-B2CA catalyst bed. MPD varies from877 to 137 mW cm−2 as the temperature is varied from 650 to450 °C, representing 93–98% of the performance under H2 fuel.
Fig. 2 SEM images of proton-conducting electrochemical cell with slurry coated electrolyte layer. a Representative cross-sectional SEM of the RePCEC“button” cell comprised of a ~500 μm thick porous Ni-BCZYYb (BaCe0.7Zr0.1Y0.1Yb0.1O3-δ) cermet electrode support with a ~4 μm-thick dense BCZYYbNelectrolyte (BaCe0.7Zr0.1Y0.1Yb0.1Ni0.04O3-δ) and a ~20 μm-thick porous BCFZY (BaCo0.4Fe0.4Zr0.1Y0.1O3-δ) triple-conducting oxide cathode. b Highmagnification of negatrode showing proton conducting phase (BCZYYb) and electron conducting phase (Ni, with nano-pores), c High magnification ofpositrode showing nano-sized catalyst. d High magnification of electrolyte showing visible grain boundary between single grains. e Surface view of grains inthe electrolyte.
ARTICLE COMMUNICATIONS CHEMISTRY | https://doi.org/10.1038/s42004-021-00559-2
4 COMMUNICATIONS CHEMISTRY | (2021) 4:121 | https://doi.org/10.1038/s42004-021-00559-2 | www.nature.com/commschem
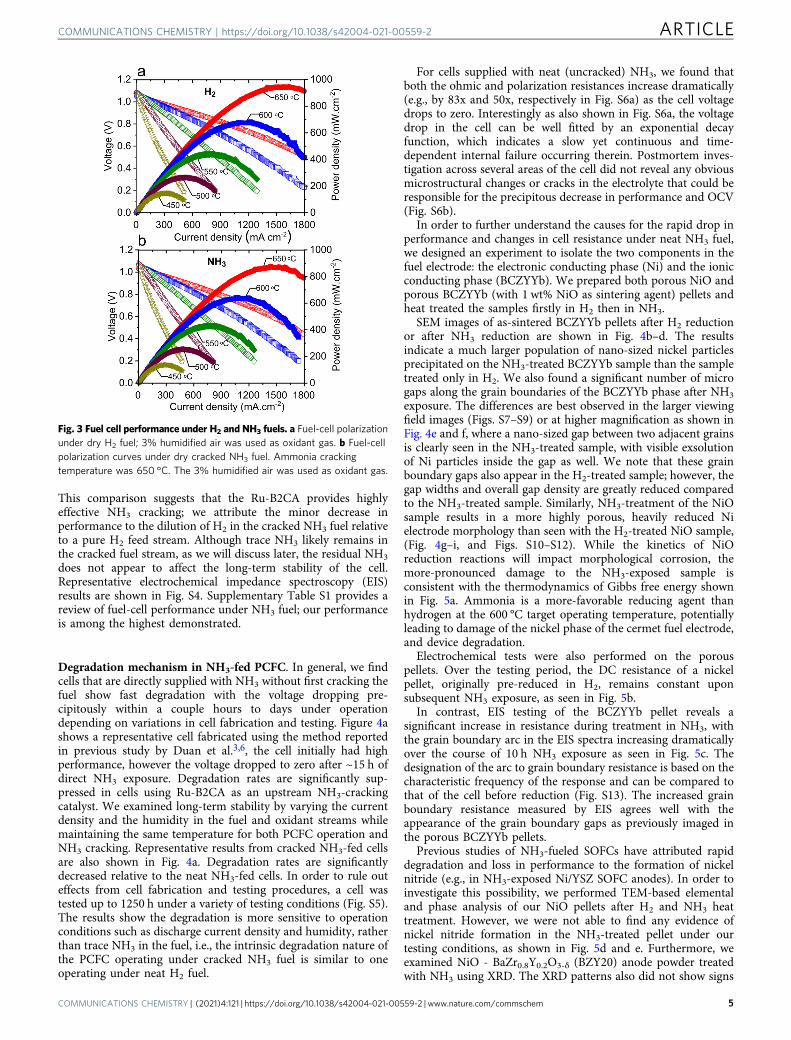
This comparison suggests that the Ru-B2CA provides highlyeffective NH3 cracking; we attribute the minor decrease inperformance to the dilution of H2 in the cracked NH3 fuel relativeto a pure H2 feed stream. Although trace NH3 likely remains inthe cracked fuel stream, as we will discuss later, the residual NH3
does not appear to affect the long-term stability of the cell.Representative electrochemical impedance spectroscopy (EIS)results are shown in Fig. S4. Supplementary Table S1 provides areview of fuel-cell performance under NH3 fuel; our performanceis among the highest demonstrated.
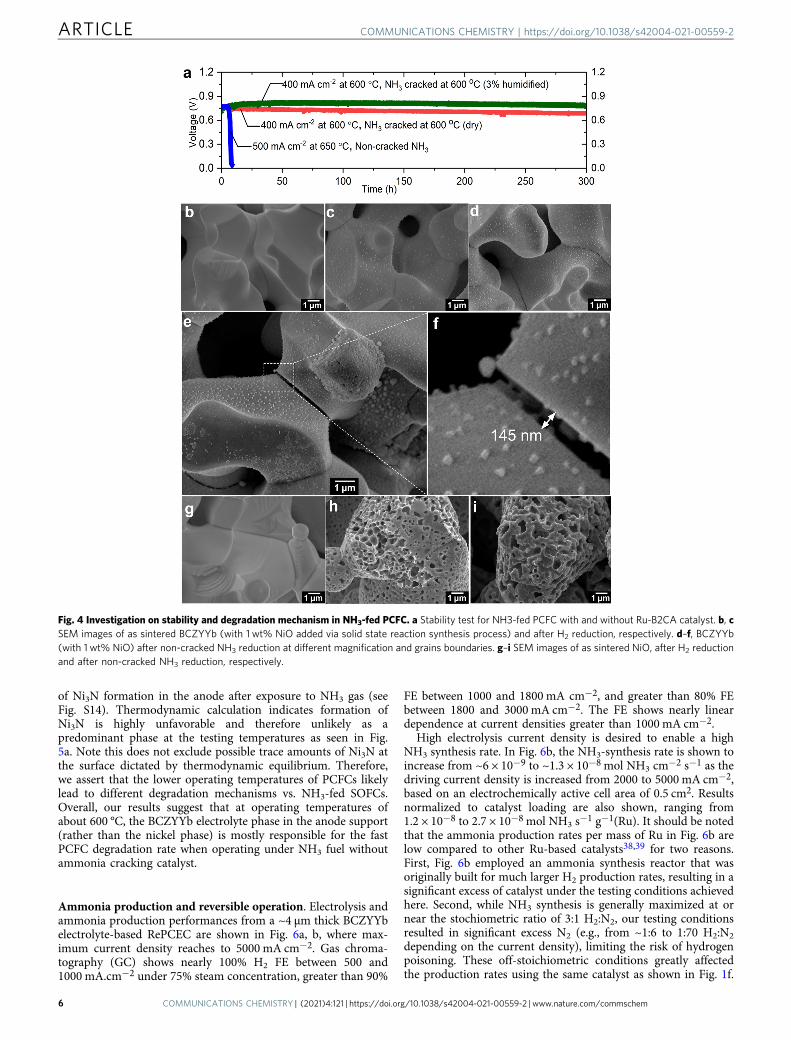
Degradation mechanism in NH3-fed PCFC. In general, we findcells that are directly supplied with NH3 without first cracking thefuel show fast degradation with the voltage dropping pre-cipitously within a couple hours to days under operationdepending on variations in cell fabrication and testing. Figure 4ashows a representative cell fabricated using the method reportedin previous study by Duan et al.3,6, the cell initially had highperformance, however the voltage dropped to zero after ~15 h ofdirect NH3 exposure. Degradation rates are significantly sup-pressed in cells using Ru-B2CA as an upstream NH3-crackingcatalyst. We examined long-term stability by varying the currentdensity and the humidity in the fuel and oxidant streams whilemaintaining the same temperature for both PCFC operation andNH3 cracking. Representative results from cracked NH3-fed cellsare also shown in Fig. 4a. Degradation rates are significantlydecreased relative to the neat NH3-fed cells. In order to rule outeffects from cell fabrication and testing procedures, a cell wastested up to 1250 h under a variety of testing conditions (Fig. S5).The results show the degradation is more sensitive to operationconditions such as discharge current density and humidity, ratherthan trace NH3 in the fuel, i.e., the intrinsic degradation nature ofthe PCFC operating under cracked NH3 fuel is similar to oneoperating under neat H2 fuel.
For cells supplied with neat (uncracked) NH3, we found thatboth the ohmic and polarization resistances increase dramatically(e.g., by 83x and 50x, respectively in Fig. S6a) as the cell voltagedrops to zero. Interestingly as also shown in Fig. S6a, the voltagedrop in the cell can be well fitted by an exponential decayfunction, which indicates a slow yet continuous and time-dependent internal failure occurring therein. Postmortem inves-tigation across several areas of the cell did not reveal any obviousmicrostructural changes or cracks in the electrolyte that could beresponsible for the precipitous decrease in performance and OCV(Fig. S6b).
In order to further understand the causes for the rapid drop inperformance and changes in cell resistance under neat NH3 fuel,we designed an experiment to isolate the two components in thefuel electrode: the electronic conducting phase (Ni) and the ionicconducting phase (BCZYYb). We prepared both porous NiO andporous BCZYYb (with 1 wt% NiO as sintering agent) pellets andheat treated the samples firstly in H2 then in NH3.
SEM images of as-sintered BCZYYb pellets after H2 reductionor after NH3 reduction are shown in Fig. 4b–d. The resultsindicate a much larger population of nano-sized nickel particlesprecipitated on the NH3-treated BCZYYb sample than the sampletreated only in H2. We also found a significant number of microgaps along the grain boundaries of the BCZYYb phase after NH3
exposure. The differences are best observed in the larger viewingfield images (Figs. S7–S9) or at higher magnification as shown inFig. 4e and f, where a nano-sized gap between two adjacent grainsis clearly seen in the NH3-treated sample, with visible exsolutionof Ni particles inside the gap as well. We note that these grainboundary gaps also appear in the H2-treated sample; however, thegap widths and overall gap density are greatly reduced comparedto the NH3-treated sample. Similarly, NH3-treatment of the NiOsample results in a more highly porous, heavily reduced Nielectrode morphology than seen with the H2-treated NiO sample,(Fig. 4g–i, and Figs. S10–S12). While the kinetics of NiOreduction reactions will impact morphological corrosion, themore-pronounced damage to the NH3-exposed sample isconsistent with the thermodynamics of Gibbs free energy shownin Fig. 5a. Ammonia is a more-favorable reducing agent thanhydrogen at the 600 °C target operating temperature, potentiallyleading to damage of the nickel phase of the cermet fuel electrode,and device degradation.
Electrochemical tests were also performed on the porouspellets. Over the testing period, the DC resistance of a nickelpellet, originally pre-reduced in H2, remains constant uponsubsequent NH3 exposure, as seen in Fig. 5b.
In contrast, EIS testing of the BCZYYb pellet reveals asignificant increase in resistance during treatment in NH3, withthe grain boundary arc in the EIS spectra increasing dramaticallyover the course of 10 h NH3 exposure as seen in Fig. 5c. Thedesignation of the arc to grain boundary resistance is based on thecharacteristic frequency of the response and can be compared tothat of the cell before reduction (Fig. S13). The increased grainboundary resistance measured by EIS agrees well with theappearance of the grain boundary gaps as previously imaged inthe porous BCZYYb pellets.
Previous studies of NH3-fueled SOFCs have attributed rapiddegradation and loss in performance to the formation of nickelnitride (e.g., in NH3-exposed Ni/YSZ SOFC anodes). In order toinvestigate this possibility, we performed TEM-based elementaland phase analysis of our NiO pellets after H2 and NH3 heattreatment. However, we were not able to find any evidence ofnickel nitride formation in the NH3-treated pellet under ourtesting conditions, as shown in Fig. 5d and e. Furthermore, weexamined NiO - BaZr0.8Y0.2O3-δ (BZY20) anode powder treatedwith NH3 using XRD. The XRD patterns also did not show signs
Fig. 3 Fuel cell performance under H2 and NH3 fuels. a Fuel-cell polarizationunder dry H2 fuel; 3% humidified air was used as oxidant gas. b Fuel-cellpolarization curves under dry cracked NH3 fuel. Ammonia crackingtemperature was 650 °C. The 3% humidified air was used as oxidant gas.
COMMUNICATIONS CHEMISTRY | https://doi.org/10.1038/s42004-021-00559-2 ARTICLE
COMMUNICATIONS CHEMISTRY | (2021) 4:121 | https://doi.org/10.1038/s42004-021-00559-2 | www.nature.com/commschem 5
of Ni3N formation in the anode after exposure to NH3 gas (seeFig. S14). Thermodynamic calculation indicates formation ofNi3N is highly unfavorable and therefore unlikely as apredominant phase at the testing temperatures as seen in Fig.5a. Note this does not exclude possible trace amounts of Ni3N atthe surface dictated by thermodynamic equilibrium. Therefore,we assert that the lower operating temperatures of PCFCs likelylead to different degradation mechanisms vs. NH3-fed SOFCs.Overall, our results suggest that at operating temperatures ofabout 600 °C, the BCZYYb electrolyte phase in the anode support(rather than the nickel phase) is mostly responsible for the fastPCFC degradation rate when operating under NH3 fuel withoutammonia cracking catalyst.
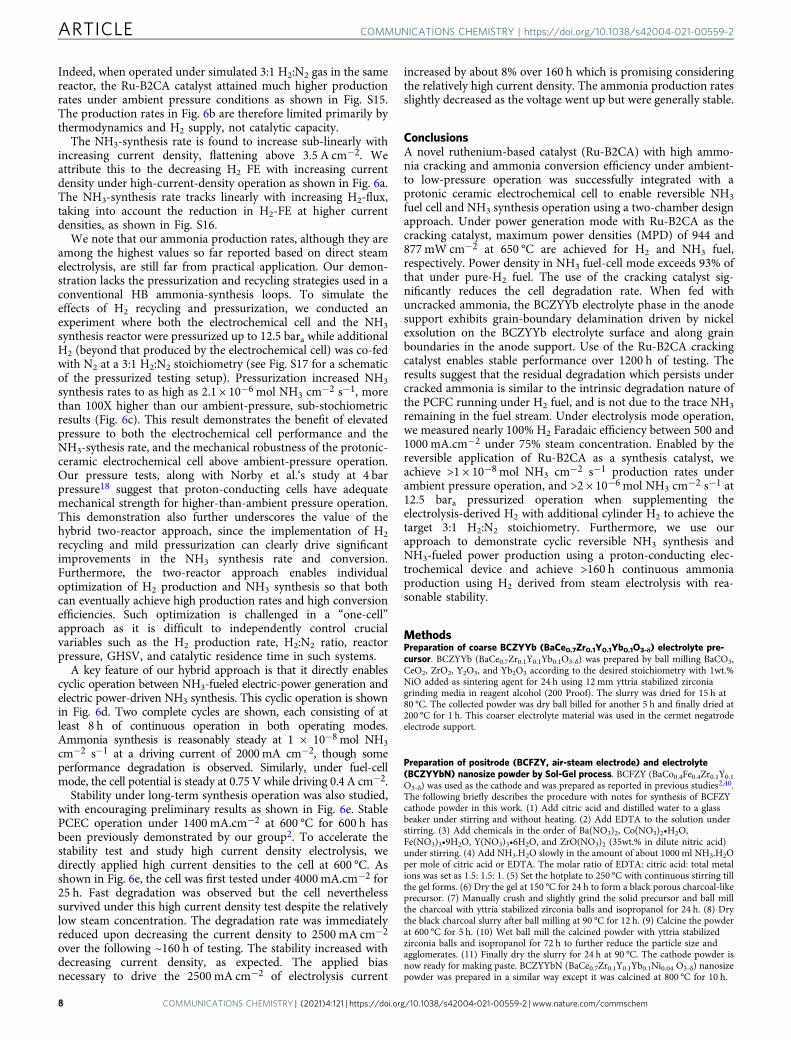
Ammonia production and reversible operation. Electrolysis andammonia production performances from a ~4 µm thick BCZYYbelectrolyte-based RePCEC are shown in Fig. 6a, b, where max-imum current density reaches to 5000 mA cm−2. Gas chroma-tography (GC) shows nearly 100% H2 FE between 500 and1000 mA.cm−2 under 75% steam concentration, greater than 90%
FE between 1000 and 1800 mA cm−2, and greater than 80% FEbetween 1800 and 3000 mA cm−2. The FE shows nearly lineardependence at current densities greater than 1000 mA cm−2.
High electrolysis current density is desired to enable a highNH3 synthesis rate. In Fig. 6b, the NH3-synthesis rate is shown toincrease from ~6 × 10⁻⁹ to ~1.3 × 10⁻⁸ mol NH3 cm−2 s−1 as thedriving current density is increased from 2000 to 5000 mA cm−2,based on an electrochemically active cell area of 0.5 cm2. Resultsnormalized to catalyst loading are also shown, ranging from1.2 × 10−8 to 2.7 × 10⁻⁸ mol NH3 s−1 g−1(Ru). It should be notedthat the ammonia production rates per mass of Ru in Fig. 6b arelow compared to other Ru-based catalysts38,39 for two reasons.First, Fig. 6b employed an ammonia synthesis reactor that wasoriginally built for much larger H2 production rates, resulting in asignificant excess of catalyst under the testing conditions achievedhere. Second, while NH3 synthesis is generally maximized at ornear the stochiometric ratio of 3:1 H2:N2, our testing conditionsresulted in significant excess N2 (e.g., from ~1:6 to 1:70 H2:N2
depending on the current density), limiting the risk of hydrogenpoisoning. These off-stoichiometric conditions greatly affectedthe production rates using the same catalyst as shown in Fig. 1f.
Fig. 4 Investigation on stability and degradation mechanism in NH3-fed PCFC. a Stability test for NH3-fed PCFC with and without Ru-B2CA catalyst. b, cSEM images of as sintered BCZYYb (with 1 wt% NiO added via solid state reaction synthesis process) and after H2 reduction, respectively. d–f, BCZYYb(with 1 wt% NiO) after non-cracked NH3 reduction at different magnification and grains boundaries. g–i SEM images of as sintered NiO, after H2 reductionand after non-cracked NH3 reduction, respectively.
ARTICLE COMMUNICATIONS CHEMISTRY | https://doi.org/10.1038/s42004-021-00559-2
6 COMMUNICATIONS CHEMISTRY | (2021) 4:121 | https://doi.org/10.1038/s42004-021-00559-2 | www.nature.com/commschem
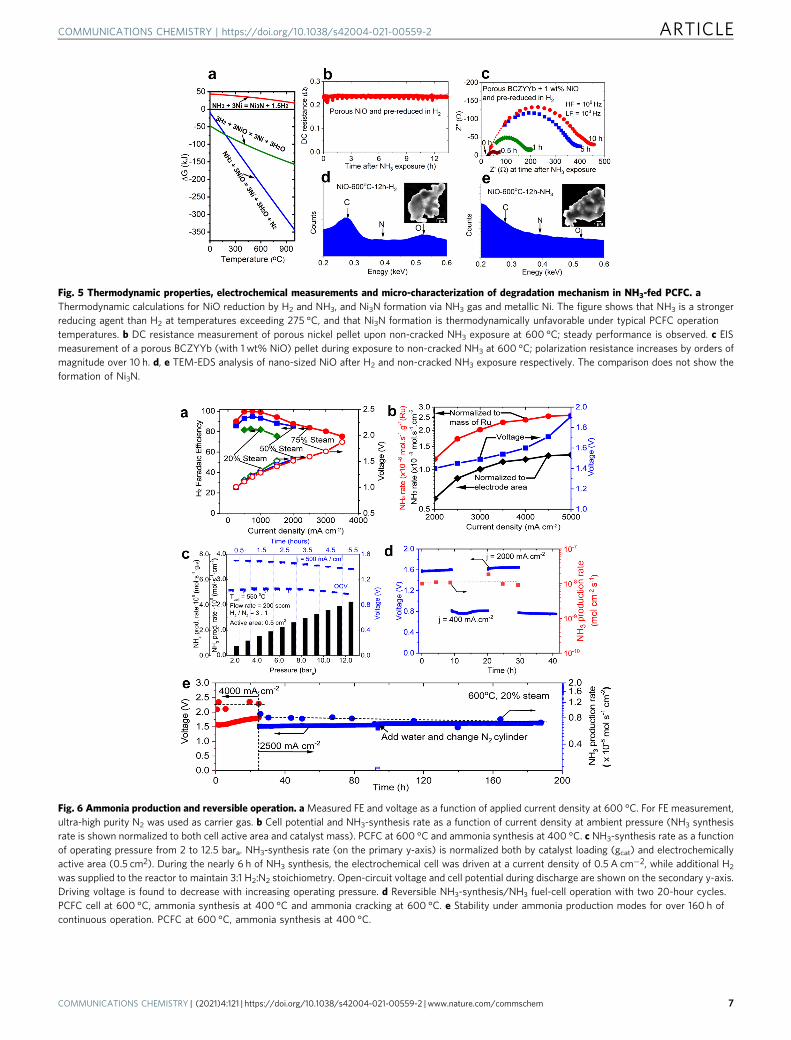
Fig. 5 Thermodynamic properties, electrochemical measurements and micro-characterization of degradation mechanism in NH3-fed PCFC. aThermodynamic calculations for NiO reduction by H2 and NH3, and Ni3N formation via NH3 gas and metallic Ni. The figure shows that NH3 is a strongerreducing agent than H2 at temperatures exceeding 275 °C, and that Ni3N formation is thermodynamically unfavorable under typical PCFC operationtemperatures. b DC resistance measurement of porous nickel pellet upon non-cracked NH3 exposure at 600 °C; steady performance is observed. c EISmeasurement of a porous BCZYYb (with 1 wt% NiO) pellet during exposure to non-cracked NH3 at 600 °C; polarization resistance increases by orders ofmagnitude over 10 h. d, e TEM-EDS analysis of nano-sized NiO after H2 and non-cracked NH3 exposure respectively. The comparison does not show theformation of Ni3N.
Fig. 6 Ammonia production and reversible operation. aMeasured FE and voltage as a function of applied current density at 600 °C. For FE measurement,ultra-high purity N2 was used as carrier gas. b Cell potential and NH3-synthesis rate as a function of current density at ambient pressure (NH3 synthesisrate is shown normalized to both cell active area and catalyst mass). PCFC at 600 °C and ammonia synthesis at 400 °C. c NH3-synthesis rate as a functionof operating pressure from 2 to 12.5 bara. NH3-synthesis rate (on the primary y-axis) is normalized both by catalyst loading (gcat) and electrochemicallyactive area (0.5 cm2). During the nearly 6 h of NH3 synthesis, the electrochemical cell was driven at a current density of 0.5 A cm−2, while additional H2
was supplied to the reactor to maintain 3:1 H2:N2 stoichiometry. Open-circuit voltage and cell potential during discharge are shown on the secondary y-axis.Driving voltage is found to decrease with increasing operating pressure. d Reversible NH3-synthesis/NH3 fuel-cell operation with two 20-hour cycles.PCFC cell at 600 °C, ammonia synthesis at 400 °C and ammonia cracking at 600 °C. e Stability under ammonia production modes for over 160 h ofcontinuous operation. PCFC at 600 °C, ammonia synthesis at 400 °C.
COMMUNICATIONS CHEMISTRY | https://doi.org/10.1038/s42004-021-00559-2 ARTICLE
COMMUNICATIONS CHEMISTRY | (2021) 4:121 | https://doi.org/10.1038/s42004-021-00559-2 | www.nature.com/commschem 7
Indeed, when operated under simulated 3:1 H2:N2 gas in the samereactor, the Ru-B2CA catalyst attained much higher productionrates under ambient pressure conditions as shown in Fig. S15.The production rates in Fig. 6b are therefore limited primarily bythermodynamics and H2 supply, not catalytic capacity.
The NH3-synthesis rate is found to increase sub-linearly withincreasing current density, flattening above 3.5 A cm−2. Weattribute this to the decreasing H2 FE with increasing currentdensity under high-current-density operation as shown in Fig. 6a.The NH3-synthesis rate tracks linearly with increasing H2-flux,taking into account the reduction in H2-FE at higher currentdensities, as shown in Fig. S16.
We note that our ammonia production rates, although they areamong the highest values so far reported based on direct steamelectrolysis, are still far from practical application. Our demon-stration lacks the pressurization and recycling strategies used in aconventional HB ammonia-synthesis loops. To simulate theeffects of H2 recycling and pressurization, we conducted anexperiment where both the electrochemical cell and the NH3
synthesis reactor were pressurized up to 12.5 bara while additionalH2 (beyond that produced by the electrochemical cell) was co-fedwith N2 at a 3:1 H2:N2 stoichiometry (see Fig. S17 for a schematicof the pressurized testing setup). Pressurization increased NH3
synthesis rates to as high as 2.1 × 10⁻⁶ mol NH3 cm−2 s−1, morethan 100X higher than our ambient-pressure, sub-stochiometricresults (Fig. 6c). This result demonstrates the benefit of elevatedpressure to both the electrochemical cell performance and theNH3-sythesis rate, and the mechanical robustness of the protonic-ceramic electrochemical cell above ambient-pressure operation.Our pressure tests, along with Norby et al.‘s study at 4 barpressure18 suggest that proton-conducting cells have adequatemechanical strength for higher-than-ambient pressure operation.This demonstration also further underscores the value of thehybrid two-reactor approach, since the implementation of H2
recycling and mild pressurization can clearly drive significantimprovements in the NH3 synthesis rate and conversion.Furthermore, the two-reactor approach enables individualoptimization of H2 production and NH3 synthesis so that bothcan eventually achieve high production rates and high conversionefficiencies. Such optimization is challenged in a “one-cell”approach as it is difficult to independently control crucialvariables such as the H2 production rate, H2:N2 ratio, reactorpressure, GHSV, and catalytic residence time in such systems.
A key feature of our hybrid approach is that it directly enablescyclic operation between NH3-fueled electric-power generation andelectric power-driven NH3 synthesis. This cyclic operation is shownin Fig. 6d. Two complete cycles are shown, each consisting of atleast 8 h of continuous operation in both operating modes.Ammonia synthesis is reasonably steady at 1 × 10⁻⁸ mol NH3
cm−2 s−1 at a driving current of 2000mA cm−2, though someperformance degradation is observed. Similarly, under fuel-cellmode, the cell potential is steady at 0.75 V while driving 0.4 A cm−2.
Stability under long-term synthesis operation was also studied,with encouraging preliminary results as shown in Fig. 6e. StablePCEC operation under 1400 mA.cm−2 at 600 °C for 600 h hasbeen previously demonstrated by our group2. To accelerate thestability test and study high current density electrolysis, wedirectly applied high current densities to the cell at 600 °C. Asshown in Fig. 6e, the cell was first tested under 4000mA.cm−2 for25 h. Fast degradation was observed but the cell neverthelesssurvived under this high current density test despite the relativelylow steam concentration. The degradation rate was immediatelyreduced upon decreasing the current density to 2500 mA cm−2
over the following ~160 h of testing. The stability increased withdecreasing current density, as expected. The applied biasnecessary to drive the 2500 mA cm−2 of electrolysis current
increased by about 8% over 160 h which is promising consideringthe relatively high current density. The ammonia production ratesslightly decreased as the voltage went up but were generally stable.
ConclusionsA novel ruthenium-based catalyst (Ru-B2CA) with high ammo-nia cracking and ammonia conversion efficiency under ambient-to low-pressure operation was successfully integrated with aprotonic ceramic electrochemical cell to enable reversible NH3
fuel cell and NH3 synthesis operation using a two-chamber designapproach. Under power generation mode with Ru-B2CA as thecracking catalyst, maximum power densities (MPD) of 944 and877 mW cm−2 at 650 °C are achieved for H2 and NH3 fuel,respectively. Power density in NH3 fuel-cell mode exceeds 93% ofthat under pure-H2 fuel. The use of the cracking catalyst sig-nificantly reduces the cell degradation rate. When fed withuncracked ammonia, the BCZYYb electrolyte phase in the anodesupport exhibits grain-boundary delamination driven by nickelexsolution on the BCZYYb electrolyte surface and along grainboundaries in the anode support. Use of the Ru-B2CA crackingcatalyst enables stable performance over 1200 h of testing. Theresults suggest that the residual degradation which persists undercracked ammonia is similar to the intrinsic degradation nature ofthe PCFC running under H2 fuel, and is not due to the trace NH3
remaining in the fuel stream. Under electrolysis mode operation,we measured nearly 100% H2 Faradaic efficiency between 500 and1000 mA.cm−2 under 75% steam concentration. Enabled by thereversible application of Ru-B2CA as a synthesis catalyst, weachieve >1 × 10⁻⁸ mol NH3 cm−2 s−1 production rates underambient pressure operation, and >2 × 10⁻⁶ mol NH3 cm−2 s−1 at12.5 bara pressurized operation when supplementing theelectrolysis-derived H2 with additional cylinder H2 to achieve thetarget 3:1 H2:N2 stoichiometry. Furthermore, we use ourapproach to demonstrate cyclic reversible NH3 synthesis andNH3-fueled power production using a proton-conducting elec-trochemical device and achieve >160 h continuous ammoniaproduction using H2 derived from steam electrolysis with rea-sonable stability.
MethodsPreparation of coarse BCZYYb (BaCe0.7Zr0.1Y0.1Yb0.1O3-δ) electrolyte pre-cursor. BCZYYb (BaCe0.7Zr0.1Y0.1Yb0.1O3-δ) was prepared by ball milling BaCO3,CeO2, ZrO2, Y2O3, and Yb2O3 according to the desired stoichiometry with 1wt.%NiO added as sintering agent for 24 h using 12 mm yttria stabilized zirconiagrinding media in reagent alcohol (200 Proof). The slurry was dried for 15 h at80 °C. The collected powder was dry ball billed for another 5 h and finally dried at200 °C for 1 h. This coarser electrolyte material was used in the cermet negatrodeelectrode support.
Preparation of positrode (BCFZY, air-steam electrode) and electrolyte(BCZYYbN) nanosize powder by Sol-Gel process. BCFZY (BaCo0.4Fe0.4Zr0.1Y0.1
O3-δ) was used as the cathode and was prepared as reported in previous studies2,40.The following briefly describes the procedure with notes for synthesis of BCFZYcathode powder in this work. (1) Add citric acid and distilled water to a glassbeaker under stirring and without heating. (2) Add EDTA to the solution understirring. (3) Add chemicals in the order of Ba(NO3)2, Co(NO3)2•H2O,Fe(NO3)3•9H2O, Y(NO3)3•6H2O, and ZrO(NO3)2 (35wt.% in dilute nitric acid)under stirring. (4) Add NH3.H2O slowly in the amount of about 1000 ml NH3.H2Oper mole of citric acid or EDTA. The molar ratio of EDTA: citric acid: total metalions was set as 1.5: 1.5: 1. (5) Set the hotplate to 250 °C with continuous stirring tillthe gel forms. (6) Dry the gel at 150 °C for 24 h to form a black porous charcoal-likeprecursor. (7) Manually crush and slightly grind the solid precursor and ball millthe charcoal with yttria stabilized zirconia balls and isopropanol for 24 h. (8) Drythe black charcoal slurry after ball milling at 90 °C for 12 h. (9) Calcine the powderat 600 °C for 5 h. (10) Wet ball mill the calcined powder with yttria stabilizedzirconia balls and isopropanol for 72 h to further reduce the particle size andagglomerates. (11) Finally dry the slurry for 24 h at 90 °C. The cathode powder isnow ready for making paste. BCZYYbN (BaCe0.7Zr0.1Y0.1Yb0.1Ni0.04 O3-δ) nanosizepowder was prepared in a similar way except it was calcined at 800 °C for 10 h.
ARTICLE COMMUNICATIONS CHEMISTRY | https://doi.org/10.1038/s42004-021-00559-2
8 COMMUNICATIONS CHEMISTRY | (2021) 4:121 | https://doi.org/10.1038/s42004-021-00559-2 | www.nature.com/commschem
BaCo0.4Fe0.4Zr0.1Y0.1 O3-δ positrode paste preparation. The BCFZY paste wasprepared using the procedure reported in previous study2. Briefly, 4 g of as-prepared BCFZY nanopowder was mixed with 1 g of calcined and ground BCZYYbcoarse electrolyte powder (calcined at 1400 °C for 10 h with 1.0 wt. % NiO powder),0.4 g of 5 wt-% V-006A in alpha terpineol as binder, and 1 g of 20 wt-% Solsperse28,000 in alpha terpineol as dispersant. The materials were manually mixed usingmortar and pestle until a viscous and uniform black paste was formed.
NiO-BaCe0.7Zr0.1Y0.1Yb0.1O3-δ negatrode (fuel-electrode) support prepara-tion. Negatrode green pellets in this study were prepared by die pressing. NiO wasmixed with aforementioned BCZYYb coarse raw precursors in a weight ratio of65:35. PVB (Polyvinyl butyral B-74), ethyl cellulose, and V-006 were added asbinders in a weight ratio 2:1:1. PVP (Polyvinypyrrolindone, MW.40000) was addedas dispersant. Reagent alcohol (200 Proof) with small amounts of 1-butanol andxylene were used as solvents. The mixture was rolling milled for 18 h. In total,20 wt.% starch-powder pore former was added to the NiO and BCZYYb, and ballmilling was continued for another 1 h. The wet slurry was dried at 100 °C for 3 h.The dried powder was then roller milled again for 0.5 h, and sieved using a 40-mesh screen, then sealed and stored for die pressing. When ready for die pressing,reagent alcohol was lightly sprayed over the dry powder, slightly moistening thepowder, and promoting adherence between particles during die pressing. One totwo grams of anode powder was placed within a 19–20 mm stainless steel die andaxially compressed using 49 kN (~11,000 lbs) of force. These parent materials wereformed into a two-phase NiO-BCZYYb composite during co-sintering with theelectrolyte.
Preparation of negatrode-supported membrane-electrode assemblies. Fol-lowing die pressing of the negatrode supports, the green pellets were pre-sintered at1200 °C for 2 h. The electrolyte layer was deposited by two wet-coating processes:(I) For depositing an electrolyte layer of less than 5 µm thick, a spin coating processwas applied which is also the primary method used in this study. This process takesadvantage of centrifugal force due to the high speed spinning so that gas bubblesthat otherwise may be trapped in other coating process are removed immediatelyduring the spin process, leading to a very dense electrolyte layer with negligibledefects. In this study, 30 deposition layers were needed to obtain a 4-µm thicksintered electrolyte layer, leading to a deposition rate of about 130 nm/layer. Higherdeposition rates can be achieved by higher solid loading. Figure S3b shows examplecells after depositing the electrolyte layer by the spin coating process. (II) Fordepositing an electrolyte layer of greater than 10 µm thick, drop coating wasapplied. The liquid amount was calculated and controlled based on the area of thepellets, solid loading, target electrolyte thickness and density of sintered electrolyte.For an electrolyte suspension with a solid loading of ~18 g solid/100 ml solvent asan example, the calculated liquid volume based on an assumed density of 6 g/cm3
(applicable to most electrolyte powder) is about 100 µL for a desired 20 µm thickelectrolyte layer using a 19 mm die (measured was about 25 µm) and about 150 µLfor a desired 15 µm thick electrolyte layer using 25 mm die (measured was about13.5 µm). Supplementary Figure S3c shows samples after the drop coating process.After coating, the anode-electrolyte assemblies were sintered at 1450 °C for 18 h.After sintering, cells were manually ground to the desired thickness of ~500 µm,and were generally flat for compression sealing, as shown in Fig. S3d–3f. In thisstudy, one cell has a brush painted electrolyte followed by sintering (Used in Fig. 4aand see the notes therein) using the method described in previous study6. Cellswithout special notes all employed the spin-coated electrolyte layer.
Fabrication and packaging of complete membrane-electrode assemblies. TheBCFZY positrode paste was painted onto the electrolyte layer of the sinterednegatrode-electrolyte half cells. The cells were then fired at 900 °C for 5 h. Thiscompletes fabrication of the membrane-electrode assembly. For high-temperatureelectrochemical testing, Au or Pt contact pastes were painted on top of the elec-trodes, and silver grids of ~1 mm spacing were painted atop the contact pastes.Two silver wires (0.5 mm diameter) were attached at the center of the electrodesand then baked at 250 °C on a hotplate. The cells were then sealed to an aluminatube using Ceramabond (552-VFG) bonding agent (See Fig. S3h). Ultra-high purityH2 or NH3 were used as fuel, with synthetic air (21% O2, 79% N2) as oxidantduring fuel-cell performance testing. Water vapor was added to the synthetic airstream by flowing the oxidizer through a bubbler with controlled temperature.Planar cell was compression sealed to gas plumbing using Thermiculite 870 gasket(See Supplementary Fig. S3i, Ceramabond was used as additional sealant aroundthe edge of cells to improve sealing). A mechanical needle valve was placeddownstream of the H2 production reactor to regulate the pressure at the ammoniaside of the membrane-electrode assembly, while a back-pressure regulator (Equi-libar) controls air/steam pressure.
H2 faradaic efficiency (FE). H2 FE over a range of conditions was measured at thefuel-electrode exhaust under electrolysis operation using a gas chromatograph(GC). The GC (Agilent 3000 A) was calibrated using four different concentrationH2/N2 calibration gases. The exhaust gas exiting from the fuel electrode of themembrane-electrode assembly was directly fed to the GC. The FE of the cell is
calculated as the ratio of measured H2 produced to the theoretical H2 producedaccording to Faraday’s law.
Catalyst synthesis. The (BaO)2(CaO)(Al2O3) (B2CA) catalyst support was pre-pared using solid-state synthesis. Stoichiometric ratios of BaCO3, CaCO3, andAl2O3 were mixed with heptane in a planetary ball mill for 3 h, then dried in air at80 °C. When dry, the mixture was calcined in air at 1300 °C for 6 h. The resultingmaterial was then ball milled in heptane a second time to increase surface area, andthen allowed to dry. The ruthenium catalyst was deposited onto the B2CA supportthrough wet impregnation. RuCl3 •1H2O was first dissolved in 50 mL of acetone.Once dissolved, a 50 mL suspension of B2CA in acetone was added to the Rusolution. The mixture was continuously stirred until acetone evaporation wascomplete to form the catalyst and support. Ruthenium loading can be varied.
Ammonia reactor. Ru-B2CA catalyst was either mixed with support of refractoryinsulation fibers with 1:1 weight ratio or alumina with 1:2 weight ratio as specifiedfor corresponding figures in the main text. For atmospheric-pressure testing, themixed catalyst-support component was gently loaded into a tubular reactor. Asmall distance at the two ends of catalyst zone was filled with blank insulationfibers to trap catalyst particles that may escape due to gas flow. The reactor wasplaced within a small clamshell test furnace.
Ammonia detection. Ammonia Drager tubes (Fisher Scientific) were used toquantify ammonia production rates due to the relatively low ammonia con-centration. We are aware of the proposed isotope measurements for electro-chemical ammonia synthesis approach41,42. Since we have limited access to isotopemeasurement capability, and our focus is not on single-step electrochemicalammonia synthesis, of which the synthesis mechanism is mostly important, we didnot adopt isotope methods but using other calibration-based method. Briefly, wecalibrate a batch of commercially available fresh Drager tubes using ammoniacalibration gases containing trace amount of NH3 in N2 (2% Certified Standardfrom MESA Specialty Gases & Equipment, no listed NOx as contaminant) withcontrolled flow rates close to synthesis condition. Since each Drager tube givesdistinct color difference within its detecting range (See Fig. S18a), we carefullycount the traveling time corresponding to each marker and plot the data. Thelinear slope (Fig. S18b as an example) is defined as indicator number. The processis repeated for different standard gases to give an average indicate number perdistance of ammonia tracer agent, which is then used to measure ammonia con-centration other than standard values. The tubes were placed downstream of theammonia-synthesis reactor. For NH3 cracking where high ammonia concentrationis expected, a single-zone ammonia gas monitor (Bacharach AGMSZ) or gaschromatograph (Shimadzu GC 2014) equipped with a thermal conductivitydetector and a flame ionization detector (TCD and FID) were used to measureammonia concentration in the reactor exhaust stream
Data availabilityThe data that support the plots within this paper and other findings of this study areavailable from the corresponding authors upon reasonable request.
Received: 23 June 2021; Accepted: 29 July 2021;
References1. Papac, M., Stevanović, V., Zakutayev, A. & O’Hayre, R. Triple ionic–electronic
conducting oxides for next-generation electrochemical devices. Nat. Mater.,20, 301–313 (2021).
2. Duan, C. et al. Highly efficient reversible protonic ceramic electrochemicalcells for power generation and fuel production. Nat. Energy 4, 230–240(2019).
3. Duan, C. et al. Highly durable, coking and sulfur tolerant, fuel-flexibleprotonic ceramic fuel cells. Nature 557, 217–222 (2018).
4. Choi, S. et al. Exceptional power density and stability at intermediatetemperatures in protonic ceramic fuel cells. Nat. Energy 3, 202–210(2018).
5. An, H. et al. A 5 × 5 cm2 protonic ceramic fuel cell with a power density of1.3W cm–2 at 600 °C. Nat. Energy 3, 870–875 (2018).
6. Duan, C. et al. Readily processed protonic ceramic fuel cells with highperformance at low temperatures. Science 349, 1321 (2015).
7. Yang, L. et al. Enhanced sulfur and coking tolerance of a mixed ion conductorfor SOFCs: BaZr0.1Ce0.7Y0.2–xYbxO3–δ. Science 326, 126 (2009).
8. Papac, M., Stevanović, V., Zakutayev, A. & O’Hayre, R. Triple ionic–electronicconducting oxides for next-generation electrochemical devices. Nat. Mater. 20,301–313 (2021).
9. Babilo, P. & Haile, S. M. Enhanced sintering of yttrium-doped bariumzirconate by addition of ZnO. J. Am. Ceram. Soc. 88, 2362–2368 (2005).
COMMUNICATIONS CHEMISTRY | https://doi.org/10.1038/s42004-021-00559-2 ARTICLE
COMMUNICATIONS CHEMISTRY | (2021) 4:121 | https://doi.org/10.1038/s42004-021-00559-2 | www.nature.com/commschem 9

10. F. et al, M. Electrolyte solide à base de AlLaO3. Application aux piles àcombustible. C. R. Acad. Sci. 259, 2813–2816 (1964).
11. Takahashi, T. & Iwahara, H. Ionic conduction in perovskite-type oxide solidsolution and its application to the solid electrolyte fuel cell. Energy Convers.11, 105–111 (1971).
12. Marrony, M. Proton-conducting ceramics: from fundamentals to applied research.ISBN: 978-981-4613–84-2 (CRC Press Taylor & Francis Group, 2016).
13. Uchida, H., Maeda, N. & Iwahara, H. Steam concentration cell using a hightemperature type proton conductive solid electrolyte. J. Appl. Electrochem. 12,645–651 (1982).
14. Kim, J. et al. Triple-conducting layered perovskites as cathode materials forproton-conducting solid oxide fuel cells. ChemSusChem 7, 2811–2815 (2014).
15. Zohourian, R., Merkle, R. & Maier, J. Proton uptake into the protonic cathodematerial BaCo0.4Fe0.4Zr0.2O3-δ and comparison to protonic electrolytematerials. Solid State Ion. 299, 64–69 (2017).
16. Chen, Y. et al. A robust fuel cell operated on nearly dry methane at 500 °Cenabled by synergistic thermal catalysis and electrocatalysis. Nat. Energy 3,1042–1050 (2018).
17. Braun, R. J. et al. Development of kW-scale protonic ceramic fuel cells andsystems. ECS Trans. 91, 997–1008 (2019).
18. Vøllestad, E. et al. Mixed proton and electron conducting double perovskiteanodes for stable and efficient tubular proton ceramic electrolysers. Nat.Mater. 18, 752–759 (2019).
19. Wu, W. et al. Adv. Sci. 5, 1870070 (2018).20. Sartbaeva, A., Kuznetsov, V. L., Wells, S. A. & Edwards, P. P. Hydrogen nexus
in a sustainable energy future. Energy Environ. Sci. 1, 79–85 (2008).21. Cheddie, D., Chapter 13- Ammonia as a hydrogen source for fuel cells: a
review. Hydrogen energy-challenges and perspecives, Edited by Dragica Minić,ISBN: 978-953-51-0812-2 (InTechOpen, 2012).
22. Qing, G. & Hamann, T. W. New electrolytic eevices produce ammonia withexceptional selectivity. Joule 3, 634–636 (2019).
23. Zamfirescu, C. & Dincer, I. Ammonia as a green fuel and hydrogen source forvehicular applications. Fuel Process. Technol. 90, 729–737 (2009).
24. Aziz, M., Wijayanta, A. T. & Nandiyanto, A. B. Ammonia as effectivehydrogen storage: a review on production, storage and utilization. Energies 13,3062 (2020).
25. Singh, A. R. et al. Electrochemical ammonia synthesis—the selectivitychallenge. ACS Catal. 7, 706–709 (2017).
26. Yoo, C.-Y. et al. Role of protons in electrochemical ammonia synthesis usingsolid-state electrolytes. ACS Sustain. Chem. Eng. 5, 7972–7978 (2017).
27. Neese, F. The Yandulov/Schrock cycle and the nitrogenase reaction: pathwaysof nitrogen fixation studied by density functional theory. Angew. Chem. Int.Ed. 45, 196–199 (2006).
28. Montoya, J. H., Tsai, C., Vojvodic, A. & Nørskov, J. K. The challenge ofelectrochemical ammonia synthesis: a new perspective on the role of nitrogenscaling relations. ChemSusChem 8, 2180–2186 (2015).
29. Marnellos, G. & Stoukides, M. Ammonia synthesis at atmospheric pressure.Science 282, 98 (1998).
30. Skodra, A. & Stoukides, M. Electrocatalytic synthesis of ammonia from steamand nitrogen at atmospheric pressure. Solid State Ion. 180, 1332–1336 (2009).
31. Murakami, T., Nohira, T., Ogata, Y. H. & Ito, Y. Electrochemical synthesis ofammonia and coproduction of metal sulfides from hydrogen sulfide andnitrogen under atmospheric pressure. J. Electrochem. Soc. 152, D109-D112,(2005).
32. Xu, G., Liu, R. & Wang, J. Electrochemical synthesis of ammonia using a cellwith a Nafion membrane and SmFe0.7Cu0.3−xNixO3 (x = 0−0.3) cathode atatmospheric pressure and lower temperature. Sci. China Ser. B: Chem. 52,1171–1175 (2009).
33. Murakami, T., Nishikiori, T., Nohira, T. & Ito, Y. Investigation of anodicreaction of electrolytic ammonia synthesis in molten salts under atmosphericpressure. J. Electrochem. Soc. 152, D75–D78, (2005).
34. Jennings, J. R., Catalytic ammonia synthesis: fundamentals and practice ISBN978-1-4757–9594-3, (Plenum Press, New York, 1991).
35. Karakaya, C. et al. Development, characterization, and modeling of a high-performance Ru/B2CA catalyst for ammonia synthesis. Chem. Eng. Sci. 247,116902 (2021).
36. M. Ojha & Dhiman, A. Problem, failure and safety analysis of ammonia plant:a review. Int. J. Chem. Eng. 2, 631–646 (2010).
37. Modak, J. M. Haber process for ammonia synthesis. Resonance 7, 69–77(2002).
38. Hattori, M., Iijima, S., Nakao, T., Hosono, H. & Hara, M. Solid solution forcatalytic ammonia synthesis from nitrogen and hydrogen gases at 50 °C. Nat.Commun. 11, 2001 (2020).
39. Hara, M., Kitano, M. & Hosono, H. Ru-Loaded C12A7:e– electride as acatalyst for ammonia synthesis. ACS Catal. 7, 2313–2324 (2017).
40. Shang, M., Tong, J. & O’Hayre, R. A novel wet-chemistry method for thesynthesis of multicomponent nanoparticles: a case study ofBaCe0.7Zr0.1Y0.1Yb0.1O3−δ. Mater. Lett. 92, 382–385 (2013).
41. Suryanto, B. H. R. et al. Challenges and prospects in the catalysis ofelectroreduction of nitrogen to ammonia. Nat. Catal. 2, 290–296 (2019).
42. Andersen, S. Z. et al. A rigorous electrochemical ammonia synthesis protocolwith quantitative isotope measurements. Nature 570, 504–508 (2019).
AcknowledgementsThe information, data, or work presented herein was funded in part by the AdvancedResearch Projects Agency-Energy (ARPA-E), U.S. Department of Energy, under AwardNumber DE-AR0000808. The views and opinions of authors expressed herein do notnecessarily state or reflect those of the United States Government or any agency thereof.We wish to thank Professor Robert J. Kee for providing art illustration in Fig. 1a, StarfireEnergy for developing and disclosing the novel Ru-B2CA catalyst for this work, and Prof.David R. Diercks for helping on the TEM—EDS work.
Author contributionsN.P.S. is the lead PI of the research project at Colorado School of Mines and securedfunding. L.Z., R.O’H., and N.P.S. developed the intellectual concept, analyzed the dataand led the manuscript writing. L.Z. designed the experiments, fabricated cells, executedtests, and wrote the draft of the manuscript. C.C. synthesized the Ru-B2CA catalyst andperformed ammonia cracking tests. C.D. helped on the GC calibration, performed acontrol test for non-cracked ammonia-fed PCFC using a cell fabricated via SSRS method.C.D. and C.C. participated in the discussion and analysis of the data. V.A. pressed someof the green pellets to be further used by L.Z. for cell fabrication. L.L. and C.H.H.executed the pressurized NH3-synthesis experiments and data analysis. J.H. performedthe anode nitridation verification experiment with exposure to NH3 gas. L.B. introducedan effective silver paste to be used as current collection grid for cell testing.
Competing interestsThe authors declare no competing interests.
Additional informationSupplementary information The online version contains supplementary materialavailable at https://doi.org/10.1038/s42004-021-00559-2.
Correspondence and requests for materials should be addressed to L.Z., R.O’H. or N.P.S.
Peer review information Communications Chemistry thanks the anonymous reviewersfor their contribution to the peer review of this work.
Reprints and permission information is available at http://www.nature.com/reprints
Publisher’s note Springer Nature remains neutral with regard to jurisdictional claims inpublished maps and institutional affiliations.
Open Access This article is licensed under a Creative CommonsAttribution 4.0 International License, which permits use, sharing,
adaptation, distribution and reproduction in any medium or format, as long as you giveappropriate credit to the original author(s) and the source, provide a link to the CreativeCommons license, and indicate if changes were made. The images or other third partymaterial in this article are included in the article’s Creative Commons license, unlessindicated otherwise in a credit line to the material. If material is not included in thearticle’s Creative Commons license and your intended use is not permitted by statutoryregulation or exceeds the permitted use, you will need to obtain permission directly fromthe copyright holder. To view a copy of this license, visit http://creativecommons.org/licenses/by/4.0/.
© The Author(s) 2021
ARTICLE COMMUNICATIONS CHEMISTRY | https://doi.org/10.1038/s42004-021-00559-2
10 COMMUNICATIONS CHEMISTRY | (2021) 4:121 | https://doi.org/10.1038/s42004-021-00559-2 | www.nature.com/commschem


![Reversible ammonia-based and liquid organic hydrogen ... · compressed hydrogen storage option is prohibitively expen-sive [19,20], and therefore alternative hydrogen storage ap-proaches](https://img.pdfslide.us/doc/110x75/5f76f5c9d4f8431e3043ec37/reversible-ammonia-based-and-liquid-organic-hydrogen-compressed-hydrogen-storage.jpg)