Embed Size (px)
Citation preview
Corporate UpdateNovember 2016
Forward‐Looking Statements
2
Cautionary Statement This presentation contains certain information that constitutes “forward‐looking information” and “forward‐looking statements” as defined under Canadian and U.S. securities laws. All statements inthis presentation, other than statements of historical fact, are forward‐looking statements. The words “expect”, “believe”, “anticipate”, “contemplate”, “may”, “could”, “will”, “intend”, “estimate”,“forecast”, “target”, “budget”, “schedule” and similar expressions identify forward‐looking statements. Forward‐looking statements in this presentation include, without limitation, information as toour strategy, projected gold production from the Young‐Davidson, Hemlo – Williams, Eagle River, Fosterville and Stawell mines, which are not owned by the Company, project timelines, the potentialnet smelter return royalty on future production from the Kemess Underground mine, resource and reserve estimates, projected production and costs of the Kemess Underground mine, otherstatements that express our expectations or estimates of future performance, value growth, value creation and shareholder returns, the success of exploration activities, mineral inventory includingthe Company’s ability to delineate additional resources and reserves as a result of such programs, mineral reserves and mineral resources and anticipated grades, exploration expenditures, costs andtiming of any future development, costs and timing of future exploration and the presence of and continuity of metals at Kemess East at modeled grades.
Forward‐looking statements are necessarily based upon a number of factors and assumptions that, while considered reasonable by management at the time of making such statements, are inherentlysubject to significant business, economic and competitive uncertainties and contingencies. Known and unknown factors could cause actual results to differ materially from those projected in theforward‐looking statements. Such factors and assumptions underlying the forward‐looking statements in this presentation include, but are not limited to: changes to current estimates of mineralreserves and resources; fluctuations in the price of gold and copper; changes in foreign exchange rates (particularly the Canadian dollar and U.S. dollar); performance of the Young‐Davidson, Hemlo –Williams, Eagle River, Fosterville and Stawell mines, which may impact the future cash flows associated with the Company’s royalty holdings; the impact of inflation; employee relations; litigation;uncertainty with the Company’s ability to secure capital to execute its business plans; the speculative nature of mineral exploration and development, including the risks of obtaining necessarylicenses, permits, authorizations and/or approvals from the appropriate regulatory authorities for the Kemess Underground project; contests over title to properties; changes in national and localgovernment legislation in Canada and other jurisdictions in which the Company does or may carry on business in the future; risk of loss due to sabotage and civil disturbances; the impact of globalliquidity and credit availability and the values of assets and liabilities based on projected future cash flows; as well as business opportunities that may be pursued by the Company.
Actual results and developments are likely to differ, and may differ materially, from those expressed or implied by the forward‐looking statements contained in this presentation. Such statements arebased on a number of assumptions, including those noted elsewhere in this document, which may prove to be incorrect. Readers are cautioned that forward‐looking statements are not guarantees offuture performance. All of the forward‐looking statements made in this presentation are qualified by these cautionary statements.
There can be no assurance that forward‐looking statements or information will prove to be accurate, accordingly, investors should not place undue reliance on the forward‐looking statements orinformation contained herein. The Company disclaims any intention or obligation to update or revise any forward‐looking statements whether as a result of new information, future events orotherwise, except as required by applicable law.
Cautionary Note to U.S. Investors Concerning Measured, Indicated and Inferred ResourcesThis presentation uses the terms "measured", "indicated" and "inferred” resources. We advise investors that while those terms are recognized and required by Canadian regulations, the United StatesSecurities and Exchange Commission does not recognize them. “Inferred resources” have a great amount of uncertainty as to their existence and as to their economic and legal feasibility. It cannot beassumed that all or any part of an inferred resource will ever be upgraded to a higher category. Under Canadian rules, estimates of inferred mineral resources may not form the basis of feasibility orother economic studies. United States investors are cautioned not to assume that all or any part of measured or indicated mineral resources will ever be converted into mineral reserves. United Statesinvestors are also cautioned not to assume that all or any part of an inferred mineral resource exists, or is economically or legally mineable.
Qualified Person as Defined by National Instrument 43‐101John Fitzgerald, Chief Operating Officer for AuRico Metals Inc. has reviewed and approved the scientific and technical information contained within this presentation. Mr. Fitzgerald is a “QualifiedPerson” as defined by National Instrument 43‐101.
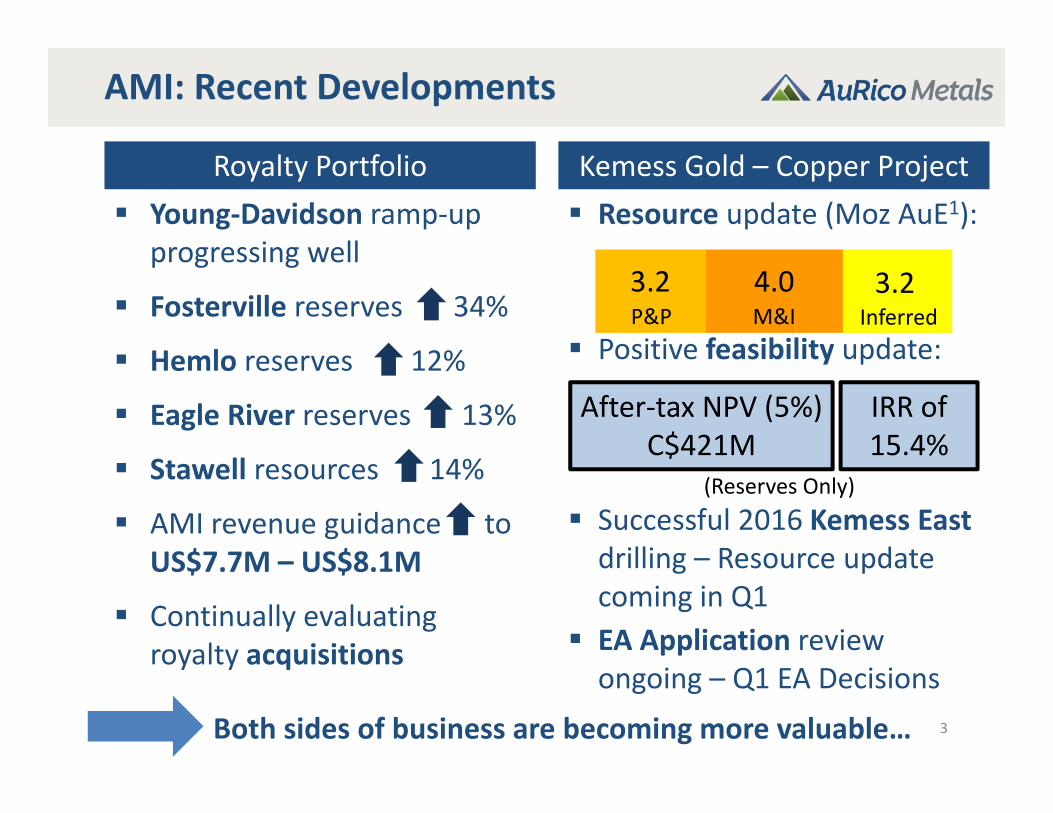
Royalty Portfolio Kemess Gold – Copper Project Young‐Davidson ramp‐up
progressing well
Fosterville reserves 34%
Hemlo reserves 12%
Eagle River reserves 13%
Stawell resources 14%
AMI revenue guidance to US$7.7M – US$8.1M
Continually evaluating royalty acquisitions
Resource update (Moz AuE1):
Positive feasibility update:
Successful 2016 Kemess East drilling – Resource update coming in Q1
EA Application review ongoing – Q1 EA Decisions
3.2 4.0 3.2
AMI: Recent Developments
3
After‐tax NPV (5%)C$421M
P&P M&I Inferred
(Reserves Only)
IRR of 15.4%
Both sides of business are becoming more valuable…
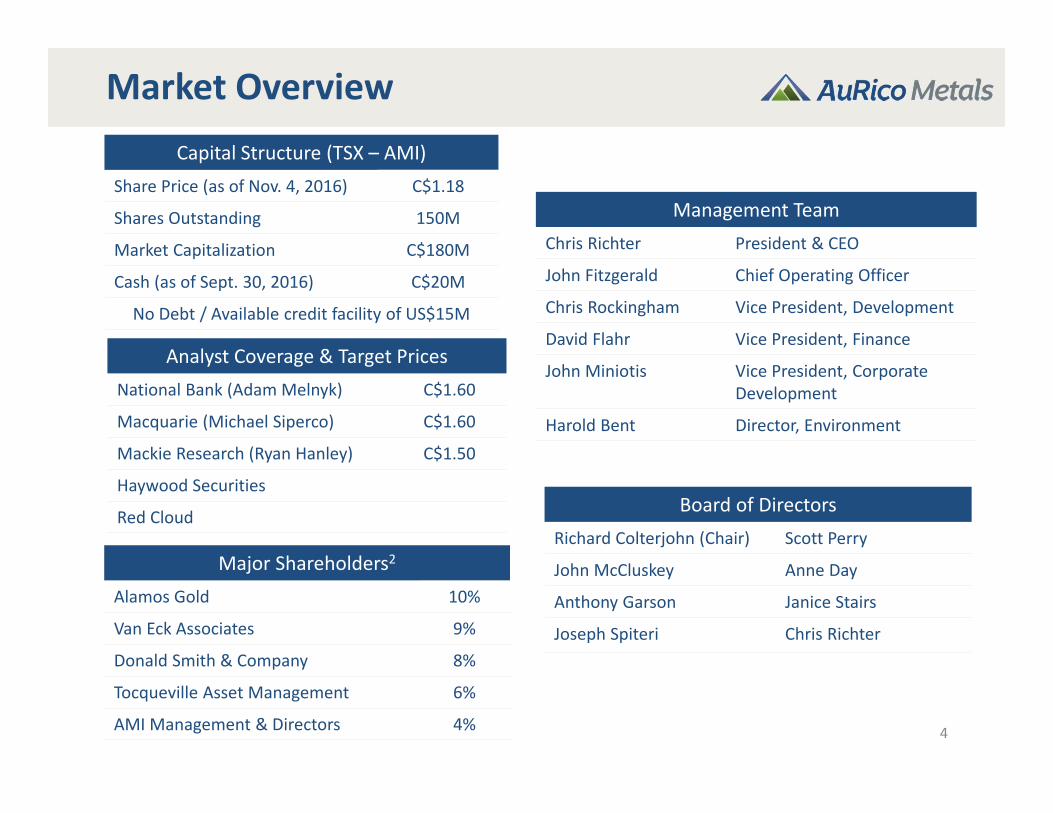
Capital Structure (TSX – AMI)Share Price (as of Nov. 4, 2016) C$1.18
Shares Outstanding 150M
Market Capitalization C$180M
Cash (as of Sept. 30, 2016) C$20M
No Debt / Available credit facility of US$15M
Management TeamChris Richter President & CEO
John Fitzgerald Chief Operating Officer
Chris Rockingham Vice President, Development
David Flahr Vice President, Finance
John Miniotis Vice President, Corporate Development
Harold Bent Director, Environment
Board of DirectorsRichard Colterjohn (Chair) Scott Perry
John McCluskey Anne Day
Anthony Garson Janice Stairs
Joseph Spiteri Chris Richter
Major Shareholders2
Alamos Gold 10%
Van Eck Associates 9%
Donald Smith & Company 8%
Tocqueville Asset Management 6%
AMI Management & Directors 4% 4
Market Overview
Analyst Coverage & Target PricesNational Bank (Adam Melnyk) C$1.60
Macquarie (Michael Siperco) C$1.60
Mackie Research (Ryan Hanley) C$1.50
Haywood Securities
Red Cloud
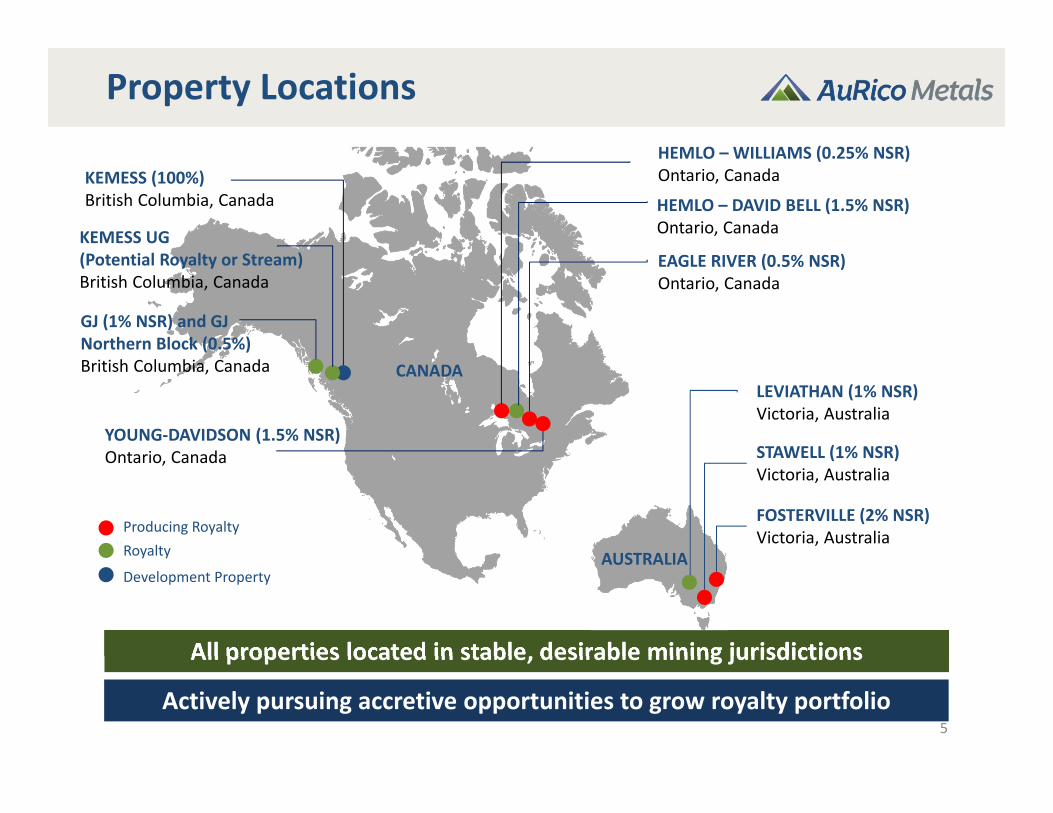
Property Locations
5
All properties located in stable, desirable mining jurisdictions
Development Property
CANADA
AUSTRALIA
KEMESS (100%)British Columbia, Canada
YOUNG‐DAVIDSON (1.5% NSR)Ontario, Canada STAWELL (1% NSR)
Victoria, Australia
FOSTERVILLE (2% NSR)Victoria, Australia
Royalty
LEVIATHAN (1% NSR)Victoria, Australia
KEMESS UG(Potential Royalty or Stream) British Columbia, Canada
HEMLO – WILLIAMS (0.25% NSR)Ontario, Canada
HEMLO – DAVID BELL (1.5% NSR)Ontario, Canada
EAGLE RIVER (0.5% NSR)Ontario, Canada
Actively pursuing accretive opportunities to grow royalty portfolio
Producing Royalty
GJ (1% NSR) and GJ Northern Block (0.5%)British Columbia, Canada
0
2
4
6
8
10
12
14
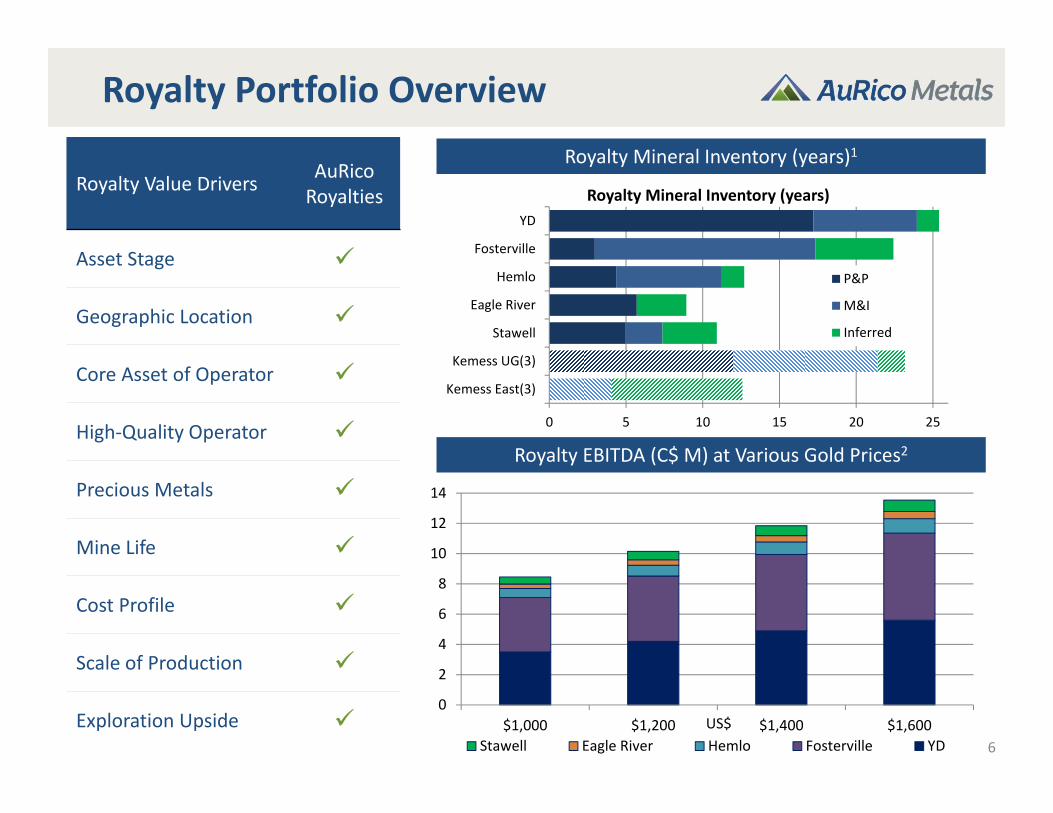
$1,000 $1,200 $1,400 $1,600Stawell Eagle River Hemlo Fosterville YD
Royalty Portfolio Overview
6
Royalty Mineral Inventory (years)1
Royalty EBITDA (C$ M) at Various Gold Prices2
Royalty Value Drivers AuRicoRoyalties
Asset Stage
Geographic Location
Core Asset of Operator
High‐Quality Operator
Precious Metals
Mine Life
Cost Profile
Scale of Production
Exploration Upside US$
0 5 10 15 20 25
Kemess East(3)
Kemess UG(3)
Stawell
Eagle River
Hemlo
Fosterville
YD
Royalty Mineral Inventory (years)
P&P
M&I
Inferred
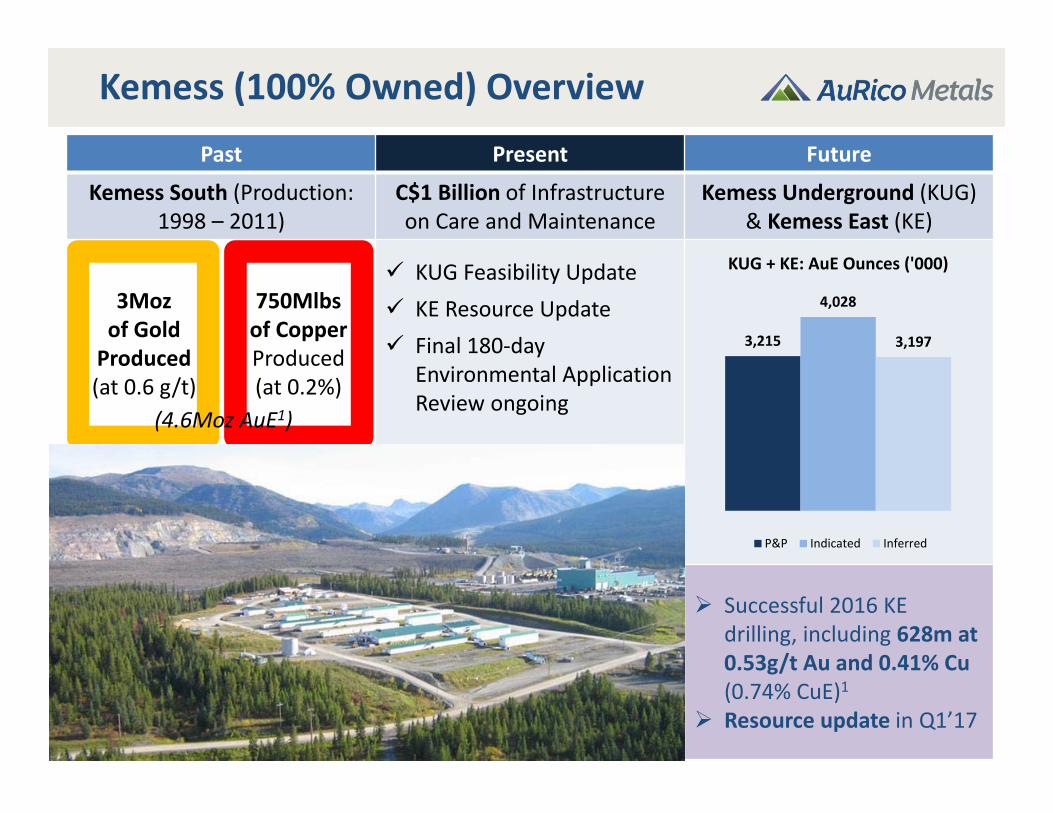
Kemess (100% Owned) Overview
7
Past Present Future
Kemess South (Production: 1998 – 2011)
C$1 Billion of Infrastructure on Care and Maintenance
Kemess Underground (KUG) & Kemess East (KE)
3Mozof Gold Produced(at 0.6 g/t)
750Mlbsof Copper Produced (at 0.2%)
KUG Feasibility Update KE Resource Update Final 180‐day
Environmental Application Review ongoing
Successful 2016 KE drilling, including 628m at 0.53g/t Au and 0.41% Cu (0.74% CuE)1
Resource update in Q1’17
(4.6Moz AuE1)
3,215
4,028
3,197
KUG + KE: AuE Ounces ('000)
P&P Indicated Inferred

Kemess UG – Feasibility Study Update
8
Unique Opportunity
Few other big / near‐term development opportunities in Canada… and Kemessbenefits from C$1bn of infrastructure in place
Robust Economics
After‐tax NPV5% of C$421M and IRR of +15% (assuming $1,250/oz Au, $3.00/lb Cu and C$/US$ of 0.75)
Significant Upside
Large (246Mt) M&I resource (including 107Mt of reserves) situated vertical to the extraction level (of the planned KUG panel cave)
Potential further upside from Kemess East (including high grade core) – which remains open in several directions
K UGK EastKUG K. East
Kemess UG: Production and Costs
9
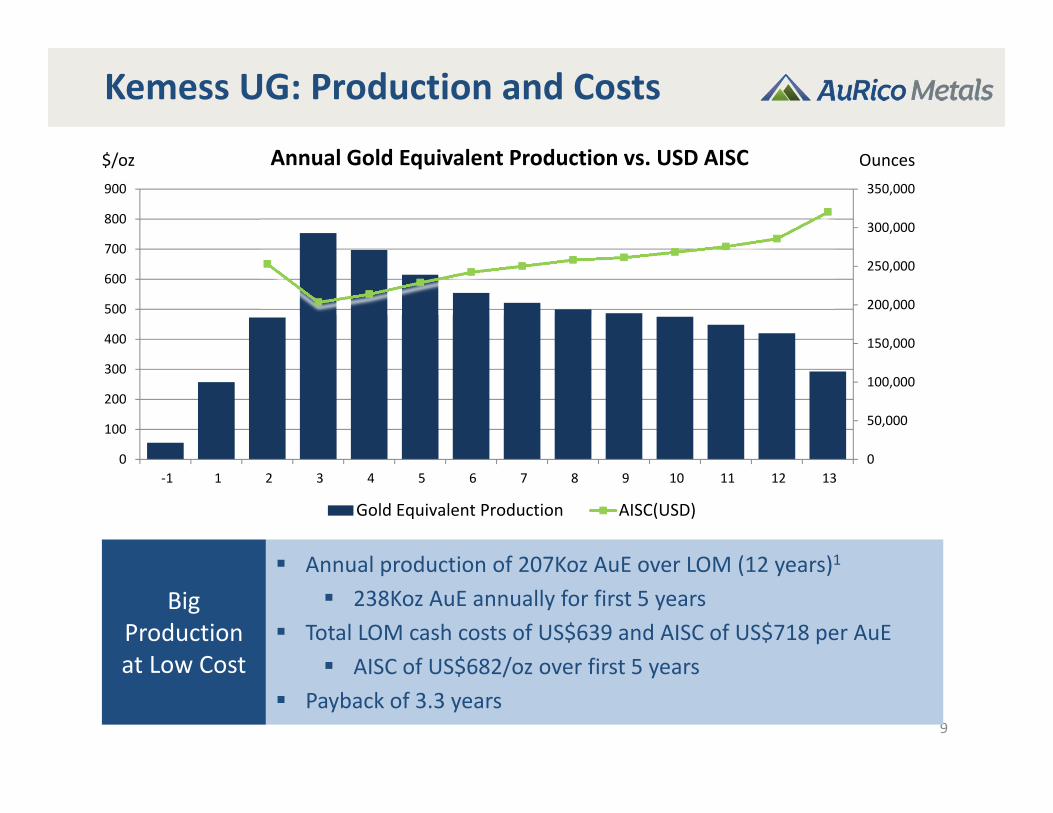
Big Production at Low Cost
Annual production of 207Koz AuE over LOM (12 years)1
238Koz AuE annually for first 5 years Total LOM cash costs of US$639 and AISC of US$718 per AuE
AISC of US$682/oz over first 5 years Payback of 3.3 years
0
50,000
100,000
150,000
200,000
250,000
300,000
350,000
0
100
200
300
400
500
600
700
800
900
‐1 1 2 3 4 5 6 7 8 9 10 11 12 13
Annual Gold Equivalent Production vs. USD AISC
Gold Equivalent Production AISC(USD)
$/oz Ounces

10
Kemess UG: Capex BreakdownCapex(US$ millions)
To First Production
Additional to Commercial Prod’n Total %
Mine 154 46 200 39%
Mill 23 6 29 6%
Access Corridor 27 ‐ 27 5%
Conveyor 30 ‐ 30 6%
UG Electrical & Ventilation 22 ‐ 22 4%
Owner’s Costs, G&A, and Other 25 1 26 5%
Capitalized Op. Costs 108 71 179 35%
Pre‐Commercial Revenue ‐ (64) (64)
Total 393 59 452
Kemess benefits from extensive infrastructure in place including processing facility, grid power, access road, camp, admin and maintenance facilities, airstrip, etc.
UG development capex at less risk of overspend given it’s paid on $/m basis
Opportunity to reduce capex through equipment leasing (C$86M)
87% of capital expenditures are C$ denominated
Capex is heavily weighted to final 2 years prior to commercial production

Kemess UG + Kemess East Reserves and Resources (all categories) of
10.9Moz AuE
Kemess East – Higher Grade Discovery
11
~51Mt in high grade core of KemessEast with Cu grade 69% higher and Au grade 23% higher than KUG Reserves
Completed successful 2016 drilling program with highlight holes including:• #13: 628m of 0.53 g/t Au, 0.41% Cu• #12: 549m of 0.55 g/t Au, 0.41% Cu• #9: 504m of 0.52 g/t Au, 0.36% Cu
Kemess East Resource update expected in Q1/17
Kemess East Cross – Section – Potassic Alteration (Looking West)
Kemess Financing Alternatives
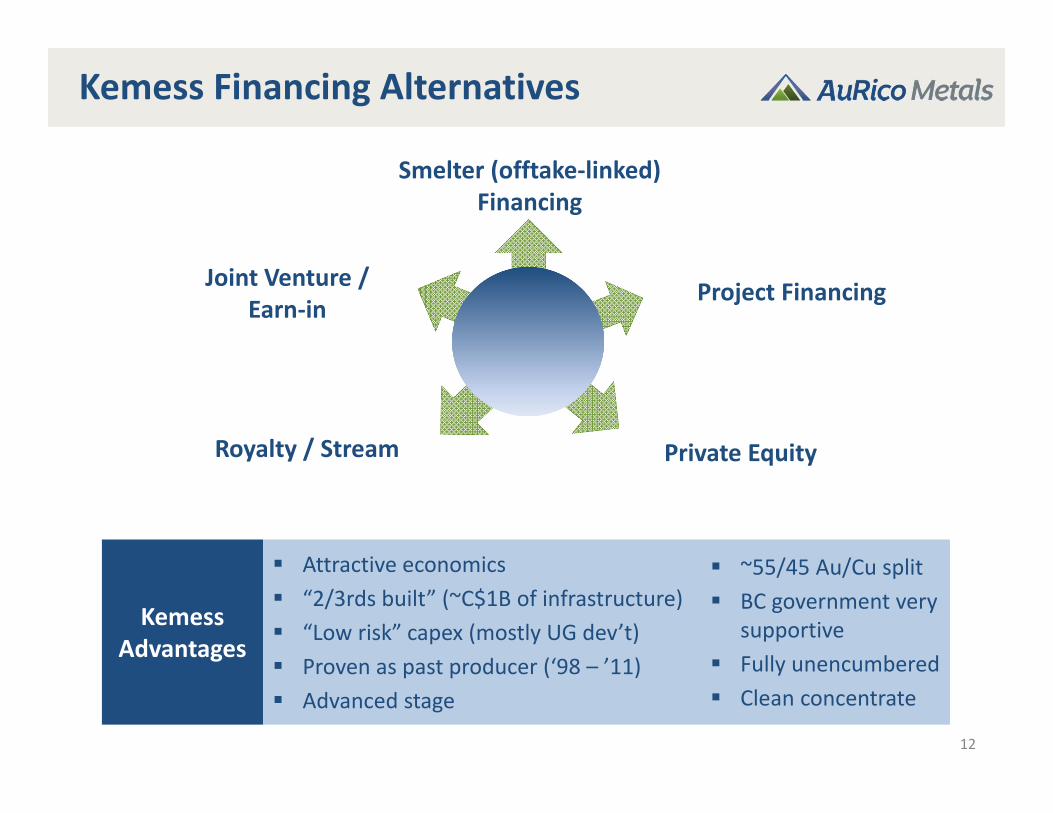
KemessAdvantages
Attractive economics “2/3rds built” (~C$1B of infrastructure) “Low risk” capex (mostly UG dev’t) Proven as past producer (‘98 – ’11) Advanced stage
~55/45 Au/Cu split BC government very
supportive Fully unencumbered Clean concentrate
12
Smelter (offtake‐linked) Financing
Joint Venture / Earn‐in
Project Financing
Royalty / Stream Private Equity
Share Price
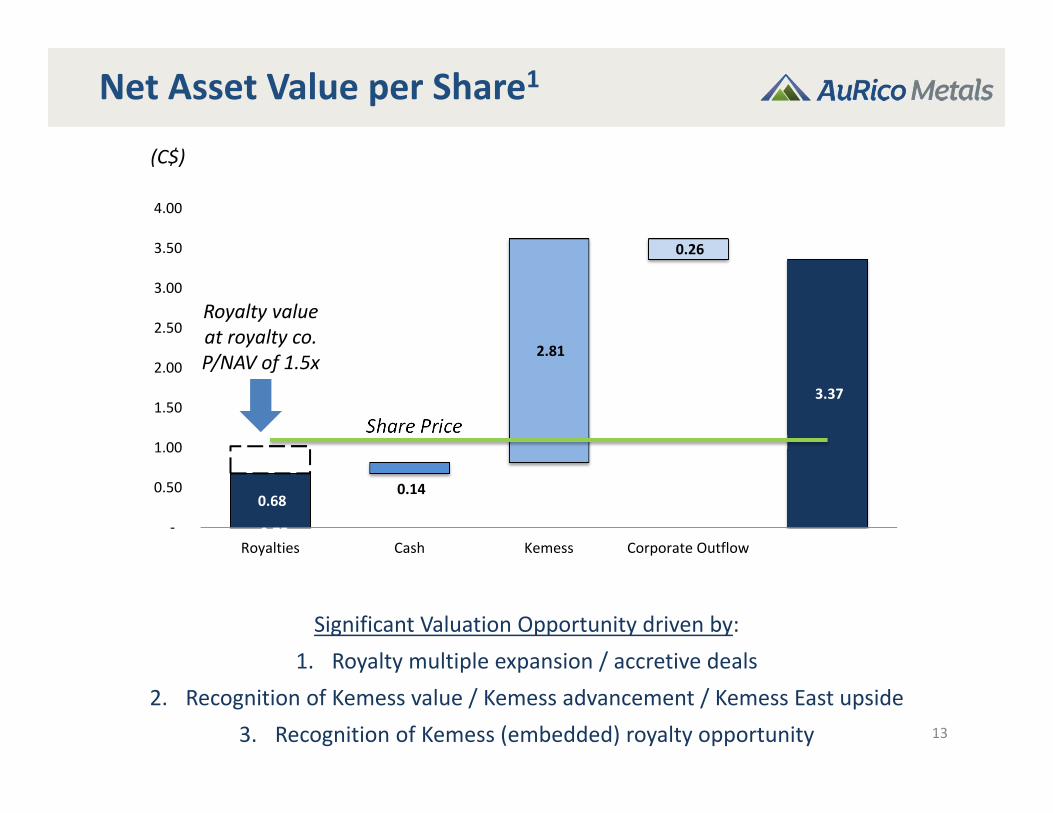
Net Asset Value per Share1
13
Significant Valuation Opportunity driven by:1. Royalty multiple expansion / accretive deals
2. Recognition of Kemess value / Kemess advancement / Kemess East upside3. Recognition of Kemess (embedded) royalty opportunity
(C$)
Royalty value at royalty co. P/NAV of 1.5x
0.68
0.75
0.14
2.81
0.26
3.37
‐
0.50
1.00
1.50
2.00
2.50
3.00
3.50
4.00
Royalties Cash Kemess Corporate Outflow
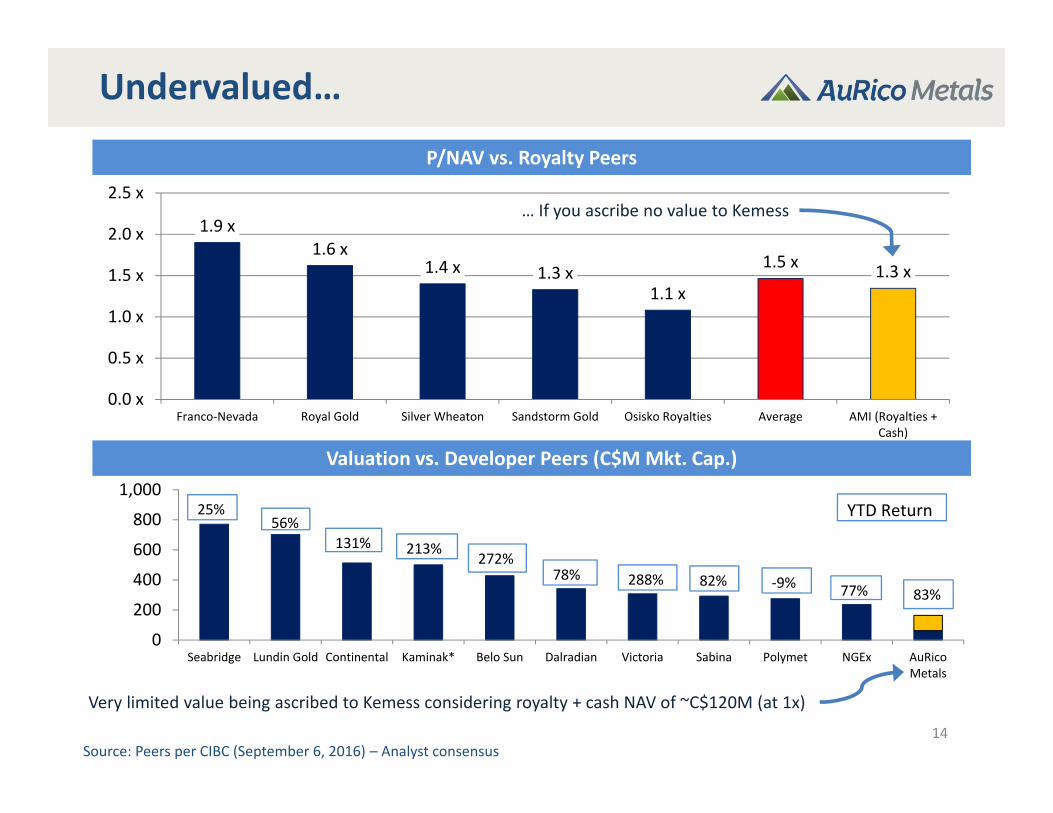
Undervalued…
14
Valuation vs. Developer Peers (C$M Mkt. Cap.)
P/NAV vs. Royalty Peers
Source: Peers per CIBC (September 6, 2016) – Analyst consensus
Very limited value being ascribed to Kemess considering royalty + cash NAV of ~C$120M (at 1x)
1.9 x1.6 x
1.4 x 1.3 x1.1 x
1.5 x 1.3 x
0.0 x
0.5 x
1.0 x
1.5 x
2.0 x
2.5 x
Franco‐Nevada Royal Gold Silver Wheaton Sandstorm Gold Osisko Royalties Average AMI (Royalties +Cash)
0
200
400
600
800
1,000
Seabridge Lundin Gold Continental Kaminak* Belo Sun Dalradian Victoria Sabina Polymet NGEx AuRicoMetals
YTD Return25%56%
131% 213%272%
78% 288% 82% ‐9% 77% 83%
… If you ascribe no value to Kemess
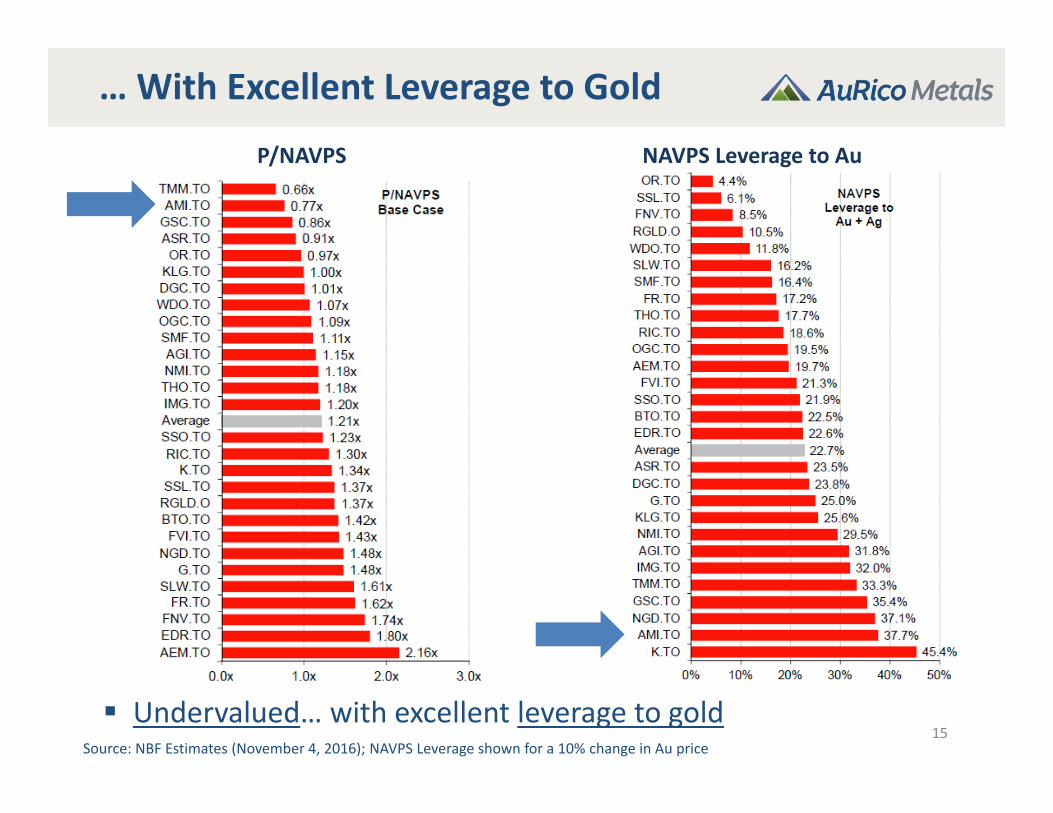
… With Excellent Leverage to Gold
15Source: NBF Estimates (November 4, 2016); NAVPS Leverage shown for a 10% change in Au price
P/NAVPS NAVPS Leverage to Au
Undervalued… with excellent leverage to gold
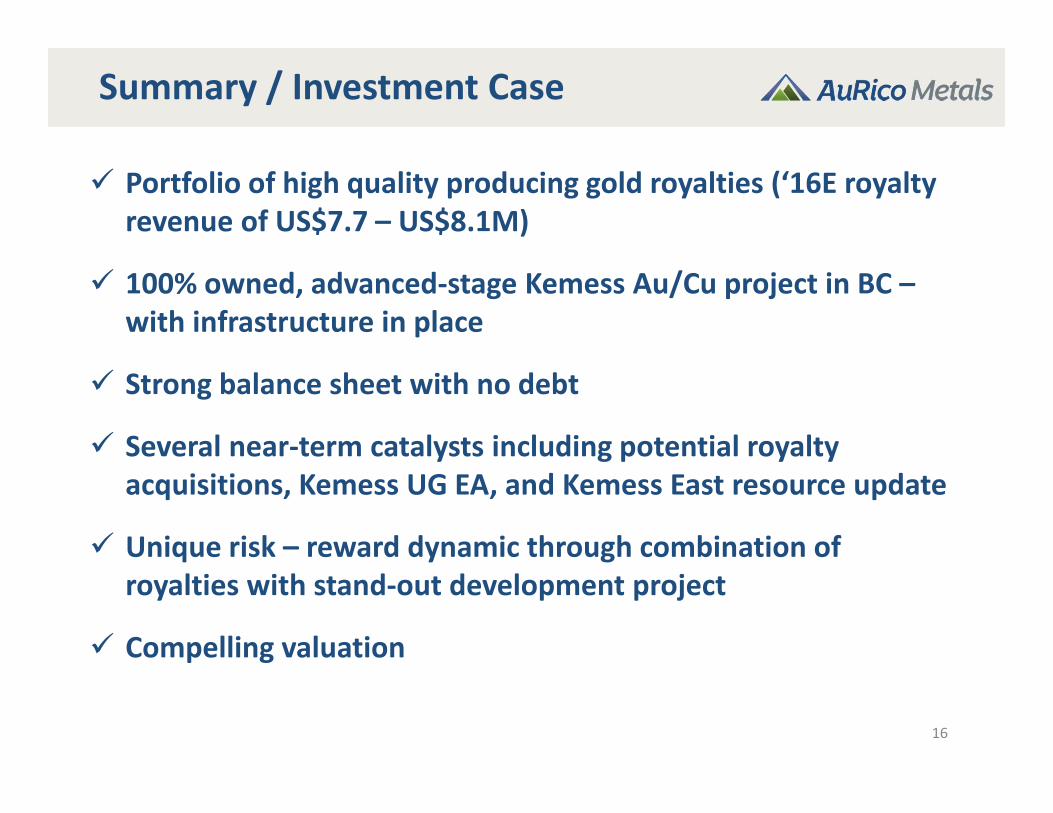
Summary / Investment Case
16
Portfolio of high quality producing gold royalties (‘16E royalty revenue of US$7.7 – US$8.1M)
100% owned, advanced‐stage Kemess Au/Cu project in BC –with infrastructure in place
Strong balance sheet with no debt
Several near‐term catalysts including potential royalty acquisitions, Kemess UG EA, and Kemess East resource update
Unique risk – reward dynamic through combination of royalties with stand‐out development project
Compelling valuation
17
APPENDIX

18
Producing Royalty PortfolioYoung‐Davidson Fosterville Hemlo‐
Williams Eagle River Stawell
Royalty 1.5% NSR 2% NSR 0.25% NSR 0.5% NSR 1% NSR
Location Ontario, Canada
Victoria, Australia Ontario, Canada Ontario, Canada Victoria,
Australia
Operator Alamos Gold Newmarket Gold Barrick Gold Wesdome Gold
MinesNewmarket Gold
Asset Overview Underground mine
Underground mine
Underground and Open Pit mine
Underground mine
Underground mine
2016E Production 170‐180 Koz 130‐140Koz 215 – 230Koz 43 – 47Koz 35Koz
Reserves and Resources
P&P: 3,823KozM&I: 1,499KozInferred:321Koz
P&P: 388Koz M&I: 1,878KozInferred: 665Koz
P&P: 917KozM&I: 1,451KozInferred: 306Koz
P&P: 300KozInferred: 170Koz
P&P: 166Koz M&I: 80KozInferred:118Koz
Commentary
17+ years reserve life (among longest in Canada); UG Ramp‐up ongoing
Increased 2016 production guidance; 3 consecutive years of record production; Ongoing exploration
Increased 2016 production guidance; Hasbeen producing for 30+ years (24Moz) with good reserve replacement
Significant upsidefrom continued exploration of identified ore zones (incl. 300 zone); Continuous production since 1995 (>1Moz)
30+ years of productionhistory; Active drilling on Aurora B discovery; Big Hill Project in permitting stage
Non‐producing royalties include GJ, Hemlo‐David Bell (1.5% NSR), and Leviathan (1% NSR)
19
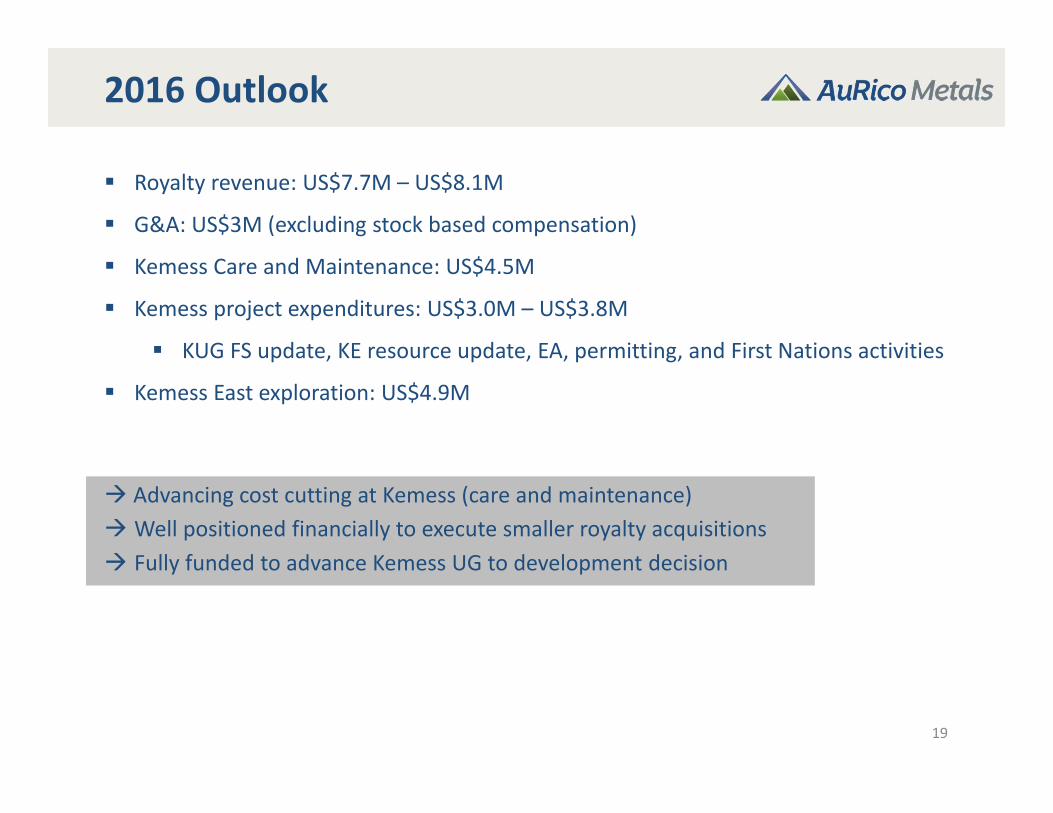
2016 Outlook
Royalty revenue: US$7.7M – US$8.1M
G&A: US$3M (excluding stock based compensation)
Kemess Care and Maintenance: US$4.5M
Kemess project expenditures: US$3.0M – US$3.8M
KUG FS update, KE resource update, EA, permitting, and First Nations activities
Kemess East exploration: US$4.9M
Advancing cost cutting at Kemess (care and maintenance) Well positioned financially to execute smaller royalty acquisitions Fully funded to advance Kemess UG to development decision
20
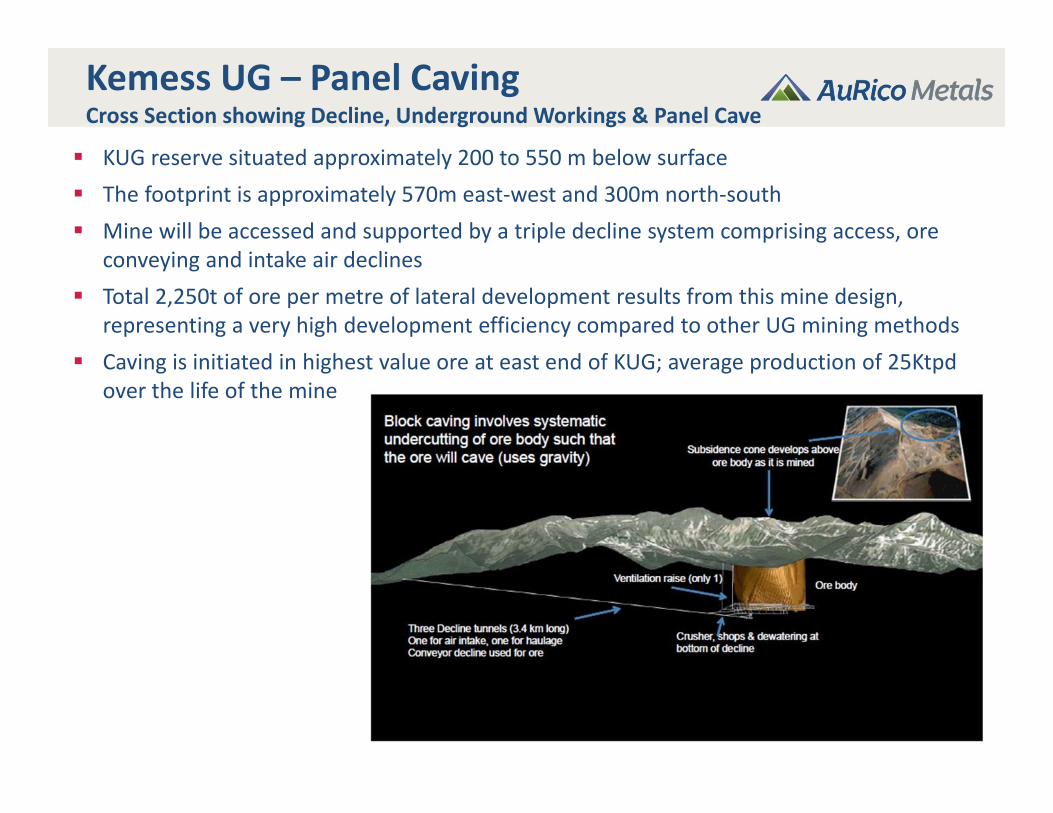
Kemess UG – Panel CavingCross Section showing Decline, Underground Workings & Panel Cave
KUG reserve situated approximately 200 to 550 m below surface The footprint is approximately 570m east‐west and 300m north‐south Mine will be accessed and supported by a triple decline system comprising access, ore
conveying and intake air declines Total 2,250t of ore per metre of lateral development results from this mine design,
representing a very high development efficiency compared to other UG mining methods Caving is initiated in highest value ore at east end of KUG; average production of 25Ktpd
over the life of the mine

21
Select Caving Comparables
2016E Cash Cost (Co-Product) Positioning
KUG in top quartile(2)
Northparkes
Cadia EastNew Afton
“While all mining projects have residual technical uncertainties, the KUG Project is considered to be relatively low risk for a caving project in terms of key mining‐related risks including production ramp‐up, drawpointstability, subsidence and mudrush.” ‐ SRK Consulting
OperationTonnes (Mt) Au (g/t) Cu (%)
Kemess UG 107 0.54 0.27New Afton 62 0.62 0.82Northparkes 102 0.26 0.60Cadia East 1,500 0.47 0.27
Proven & Probable Reserve Comparison1
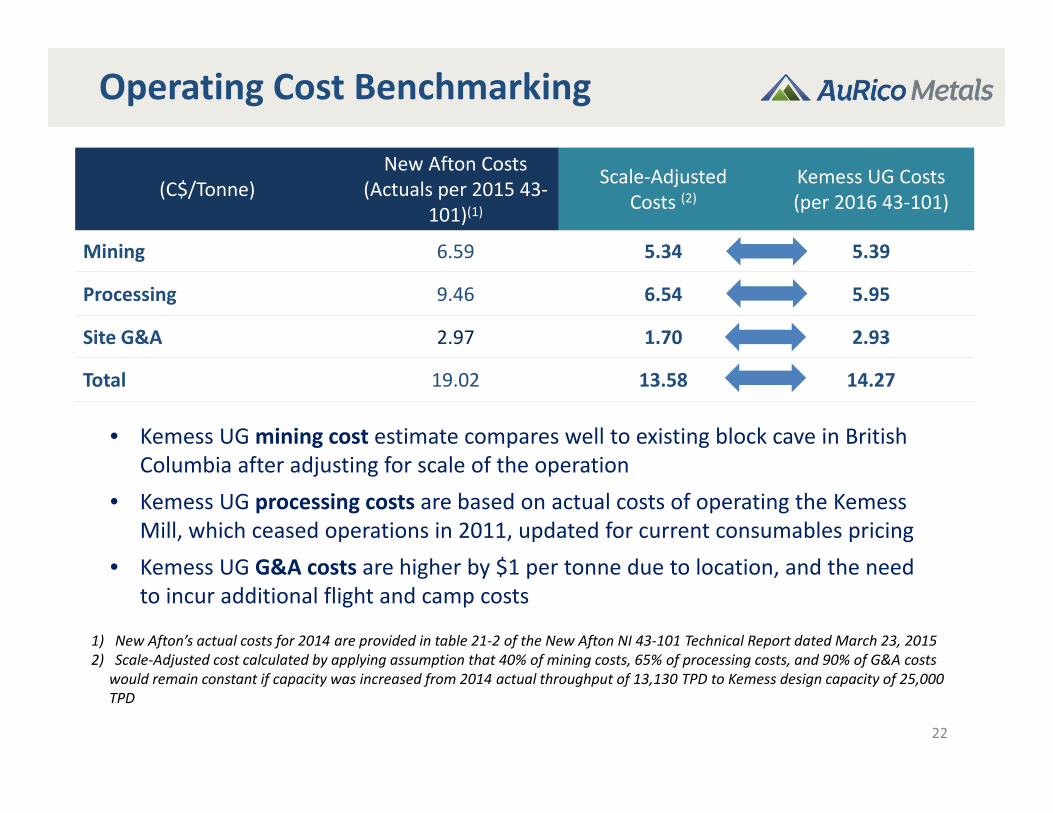
Operating Cost Benchmarking
22
(C$/Tonne)New Afton Costs
(Actuals per 2015 43‐101)(1)
Scale‐AdjustedCosts (2)
Kemess UG Costs(per 2016 43‐101)
Mining 6.59 5.34 5.39
Processing 9.46 6.54 5.95
Site G&A 2.97 1.70 2.93
Total 19.02 13.58 14.27
• Kemess UG mining cost estimate compares well to existing block cave in British Columbia after adjusting for scale of the operation
• Kemess UG processing costs are based on actual costs of operating the Kemess Mill, which ceased operations in 2011, updated for current consumables pricing
• Kemess UG G&A costs are higher by $1 per tonne due to location, and the need to incur additional flight and camp costs
1) New Afton’s actual costs for 2014 are provided in table 21‐2 of the New Afton NI 43‐101 Technical Report dated March 23, 20152) Scale‐Adjusted cost calculated by applying assumption that 40% of mining costs, 65% of processing costs, and 90% of G&A costs
would remain constant if capacity was increased from 2014 actual throughput of 13,130 TPD to Kemess design capacity of 25,000 TPD

Kemess: Low Capital Intensity
23
• Potential to add additional low‐cost ounces at KUG and Kemess East
Source: Canaccord Genuity (March 23, 2016).

24
Reserves & Resources
Classification QuantityGrade Contained Metal
Gold (g/t) Copper (%) Silver (g/t) Gold (koz) Copper (klbs) Silver (koz)Proven and Probable
Proven ‐ ‐ ‐ ‐ ‐ ‐ ‐Probable 107,381 0.54 0.27 1.99 1,868 629,595 6,878Total P&P 107,381 0.54 0.27 1.99 1,868 629,595 6,878
Measured ‐ ‐ ‐ ‐ ‐ ‐ ‐Indicated 246,400 0.42 0.22 1.75 3,328 1,195,300 13,866Total M&I 246,400 0.42 0.22 1.75 3,328 1,195,300 13,866
InferredTotal Inferred 21,600 0.40 0.22 1.70 277 104,700 1,179
Kemess Underground
Kemess East
Classification QuantityGrade Contained Metal
Gold (g/t) Copper (%) Silver (g/t) Gold (koz) Copper (klbs) Silver (koz)
Measured ‐ ‐ ‐ ‐ ‐ ‐ ‐Indicated 39,270 0.50 0.40 1.99 627 344,000 2,512Total M&I 39,270 0.50 0.40 1.99 627 344,000 2,512
InferredTotal Inferred 109,670 0.38 0.37 1.99 1,331 888,000 6,994
M&I Resources are inclusive of reserves

Endnotes
25
Slide 3 – AMI Recent Developments – 1) AuE calculated on basis of $1,250/oz Au and $2.50/lb CuSlide 4 ‐Market Overview
2) Per Bloomberg, Sedi, and company filingsSlide 6 ‐ Royalty Portfolio Overview:
1) Reserves and resources per most recent resource updates from asset owners; Assumes annual production levels for YD, Fosterville,Hemlo, Eagle River, Kemess UG and East, and Stawell of 200Koz, 115Koz, 200Koz, 50Koz, 140Koz, and 30Koz respectively and recoveries of 90%, 88%, 95%, 95%, 90%, and 90% respectively
2) Annual production assumptions per mid‐point of guidance; For Kemess UG, the copper price is being adjusted up/down by the same percentage, i.e. the parallel copper price assumptions for the gold price range of $1,100 ‐ $1,600/oz is $2.54, $2.77, $3.00, $3.23, $3.46, $3.69
Slide 7 ‐ Kemess Overview: AuE ounces calculated on the basis of $1,250/oz Au and $2.50/lb CuSlide 11 ‐ Kemess East
1) AuE calculation assumes Au price of $1,250/oz and Cu price of $2.50/ozSlide 13 – 1) NAV per Share – Royalties and Corporate Outflow per analyst consensus; Kemess per FS (Mar. 23, 2016) at Consensus pricingSlide 21 ‐ Select Caving Comparables
1) Proven and Probable Reserves shown as of December 31, 20152) KUG average total cash cost in commercial production
Slide 24 ‐ Reserves & Resources1) AuE calculation assumes Au price of $1,250/oz and Cu price of $2.50/oz