Embed Size (px)
Citation preview
Corporate Update February 2016
Forward-Looking Statements
2
Cautionary Statement This presentation contains certain information that constitutes “forward-looking information” and “forward-looking statements” as defined under Canadian and U.S. securities laws. All statements in this presentation, other than statements of historical fact, are forward-looking statements. The words “expect”, “believe”, “anticipate”, “contemplate”, “may”, “could”, “will”, “intend”, “estimate”, “forecast”, “target”, “budget”, “schedule” and similar expressions identify forward-looking statements. Forward-looking statements in this presentation include, without limitation, information as to our strategy, projected gold production from the Young-Davidson, Hemlo – Williams, Eagle River, Fosterville and Stawell mines, which are not owned by the Company, project timelines, the planned 2% net smelter return royalty on future production from the Kemess Underground mine, projected exploration results, resource and reserve estimates, projected production and costs of the Kemess Underground mine, other statements that express our expectations or estimates of future performance, value growth, value creation and shareholder returns, the success of exploration activities, mineral inventory including the Company’s ability to delineate additional resources and reserves as a result of such programs, mineral reserves and mineral resources and anticipated grades, exploration expenditures, costs and timing of any future development, costs and timing of future exploration and the presence of and continuity of metals at Kemess East at modeled grades.
Forward-looking statements are necessarily based upon a number of factors and assumptions that, while considered reasonable by management at the time of making such statements, are inherently subject to significant business, economic and competitive uncertainties and contingencies. Known and unknown factors could cause actual results to differ materially from those projected in the forward-looking statements. Such factors and assumptions underlying the forward-looking statements in this presentation include, but are not limited to: changes to current estimates of mineral reserves and resources; fluctuations in the price of gold and copper; changes in foreign exchange rates (particularly the Canadian dollar and U.S. dollar); performance of the Young-Davidson, Hemlo – Williams, Eagle River, Fosterville and Stawell mines, which may impact the future cash flows associated with the Company’s royalty holdings; the impact of inflation; employee relations; litigation; uncertainty with the Company’s ability to secure capital to execute its business plans; the speculative nature of mineral exploration and development, including the risks of obtaining necessary licenses, permits, authorizations and/or approvals from the appropriate regulatory authorities for the Kemess Underground project; contests over title to properties; changes in national and local government legislation in Canada and other jurisdictions in which the Company does or may carry on business in the future; risk of loss due to sabotage and civil disturbances; the impact of global liquidity and credit availability and the values of assets and liabilities based on projected future cash flows; as well as business opportunities that may be pursued by the Company.
Actual results and developments are likely to differ, and may differ materially, from those expressed or implied by the forward-looking statements contained in this presentation. Such statements are based on a number of assumptions, including those noted elsewhere in this document, which may prove to be incorrect. Readers are cautioned that forward-looking statements are not guarantees of future performance. All of the forward-looking statements made in this presentation are qualified by these cautionary statements. There can be no assurance that forward-looking statements or information will prove to be accurate, accordingly, investors should not place undue reliance on the forward-looking statements or information contained herein. The Company disclaims any intention or obligation to update or revise any forward-looking statements whether as a result of new information, future events or otherwise, except as required by applicable law.
Cautionary Note to U.S. Investors Concerning Measured, Indicated and Inferred Resources This presentation uses the terms "measured", "indicated" and "inferred” resources. We advise investors that while those terms are recognized and required by Canadian regulations, the United States Securities and Exchange Commission does not recognize them. “Inferred resources” have a great amount of uncertainty as to their existence and as to their economic and legal feasibility. It cannot be assumed that all or any part of an inferred resource will ever be upgraded to a higher category. Under Canadian rules, estimates of inferred mineral resources may not form the basis of feasibility or other economic studies. United States investors are cautioned not to assume that all or any part of measured or indicated mineral resources will ever be converted into mineral reserves. United States investors are also cautioned not to assume that all or any part of an inferred mineral resource exists, or is economically or legally mineable.
Qualified Person as Defined by National Instrument 43-101 John Fitzgerald, Chief Operating Officer for AuRico Metals Inc. has reviewed and approved the scientific and technical information contained within this presentation. Mr. Fitzgerald is a “Qualified Person” as defined by National Instrument 43-101.
Investor Rationale
Royalty Portfolio Kemess Gold – Copper Project
Diversified, high-quality royalty portfolio
Cash flowing
Minimal operational risk
Lower risk exposure to metal prices, expansions, and exploration success
Advanced stage
Benefit from existing infrastructure and falling C$
Numerous near-term catalysts
Major revaluation opportunity
A Complementary Combination
Attractive risk – reward proposition
Upside from Kemess Project with downside protection of royalty company
Minimize risks: Best jurisdictions, high-quality assets, royalty revenue, cash, diversification
Self sustaining
Leverage strong Board and management team
3
A Unique Opportunity for Value Growth
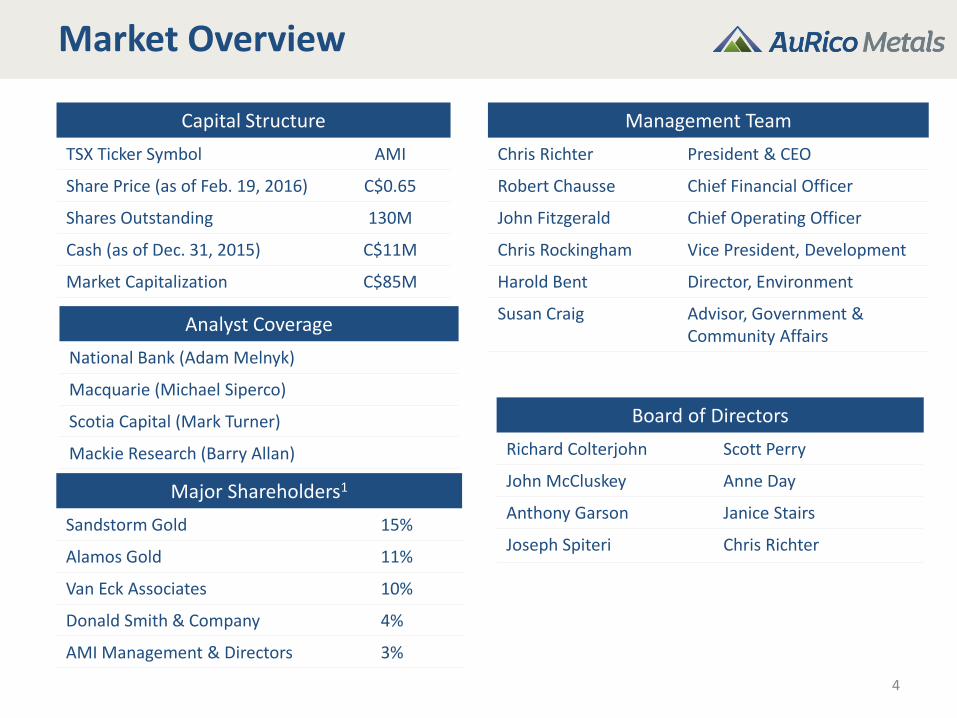
Capital Structure
TSX Ticker Symbol AMI
Share Price (as of Feb. 19, 2016) C$0.65
Shares Outstanding 130M
Cash (as of Dec. 31, 2015) C$11M
Market Capitalization C$85M
Management Team
Chris Richter President & CEO
Robert Chausse Chief Financial Officer
John Fitzgerald Chief Operating Officer
Chris Rockingham Vice President, Development
Harold Bent Director, Environment
Susan Craig Advisor, Government & Community Affairs
Board of Directors
Richard Colterjohn Scott Perry
John McCluskey Anne Day
Anthony Garson Janice Stairs
Joseph Spiteri Chris Richter
Major Shareholders1
Sandstorm Gold 15%
Alamos Gold 11%
Van Eck Associates 10%
Donald Smith & Company 4%
AMI Management & Directors 3%
4
Market Overview
Analyst Coverage
National Bank (Adam Melnyk)
Macquarie (Michael Siperco)
Scotia Capital (Mark Turner)
Mackie Research (Barry Allan)
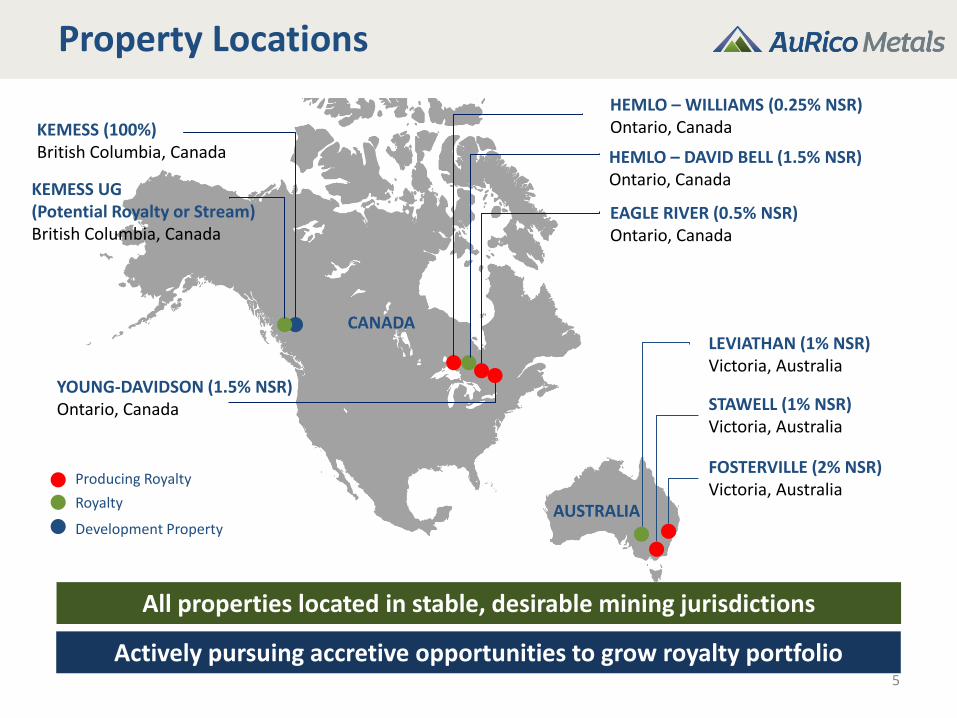
Property Locations
5
All properties located in stable, desirable mining jurisdictions
Development Property
CANADA
AUSTRALIA
KEMESS (100%) British Columbia, Canada
YOUNG-DAVIDSON (1.5% NSR) Ontario, Canada STAWELL (1% NSR)
Victoria, Australia
FOSTERVILLE (2% NSR) Victoria, Australia
Royalty
LEVIATHAN (1% NSR) Victoria, Australia
KEMESS UG (Potential Royalty or Stream) British Columbia, Canada
HEMLO – WILLIAMS (0.25% NSR) Ontario, Canada
HEMLO – DAVID BELL (1.5% NSR) Ontario, Canada
EAGLE RIVER (0.5% NSR) Ontario, Canada
Actively pursuing accretive opportunities to grow royalty portfolio
Producing Royalty
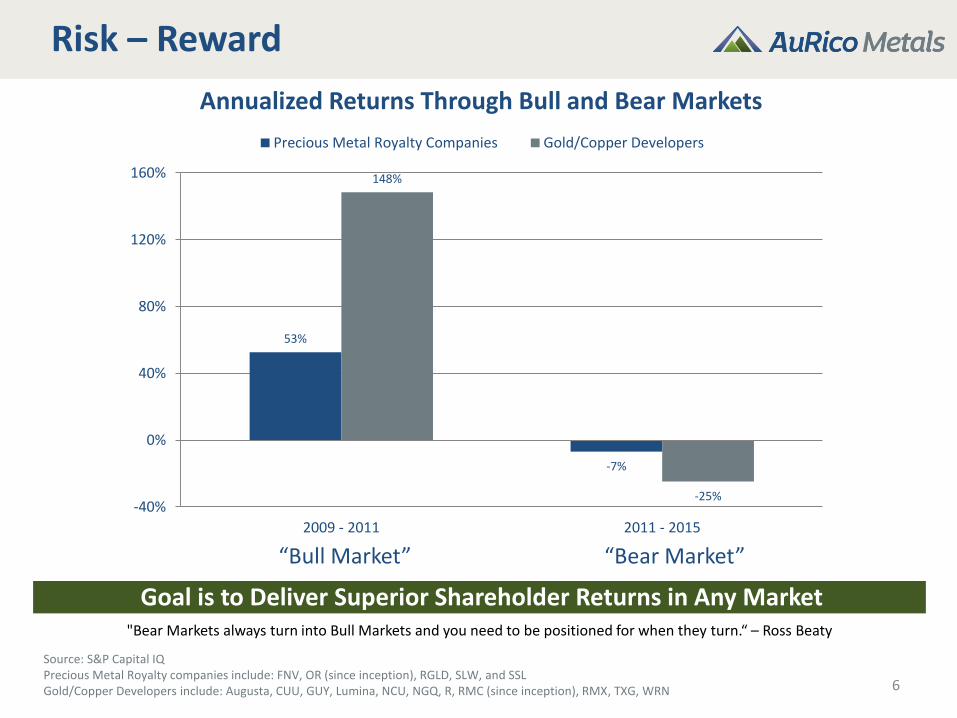
Risk – Reward
Source: S&P Capital IQ Precious Metal Royalty companies include: FNV, OR (since inception), RGLD, SLW, and SSL Gold/Copper Developers include: Augusta, CUU, GUY, Lumina, NCU, NGQ, R, RMC (since inception), RMX, TXG, WRN 6
Goal is to Deliver Superior Shareholder Returns in Any Market
“Bull Market” “Bear Market”
53%
-7%
148%
-25% -40%
0%
40%
80%
120%
160%
2009 - 2011 2011 - 2015
Precious Metal Royalty Companies Gold/Copper Developers
Annualized Returns Through Bull and Bear Markets
"Bear Markets always turn into Bull Markets and you need to be positioned for when they turn.“ – Ross Beaty
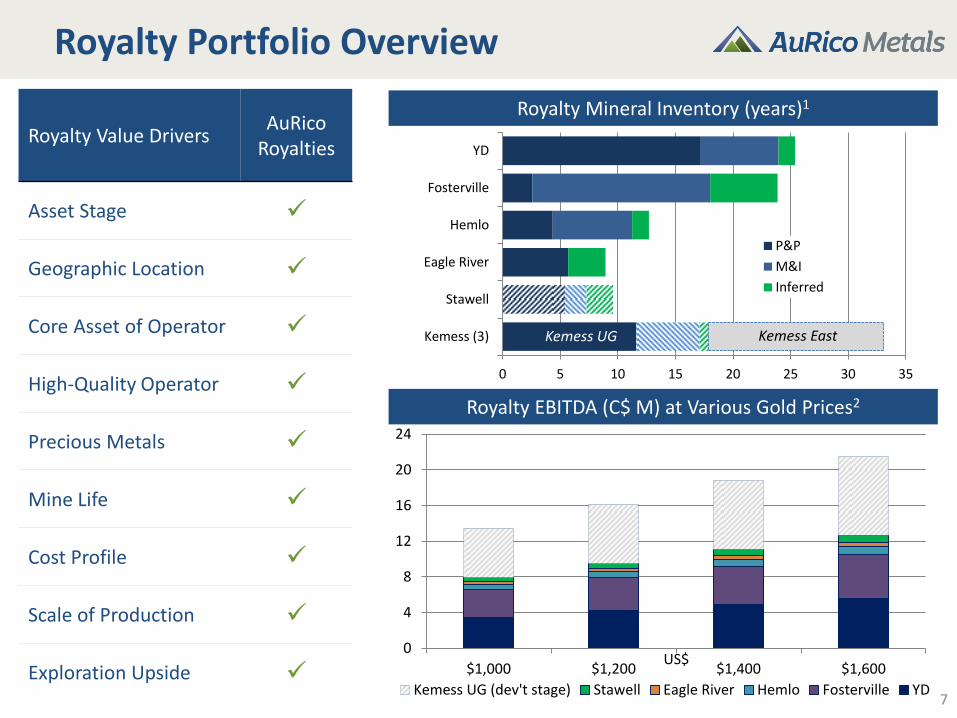
Royalty Portfolio Overview
7
Royalty Mineral Inventory (years)1
Royalty EBITDA (C$ M) at Various Gold Prices2
Royalty Value Drivers AuRico
Royalties
Asset Stage
Geographic Location
Core Asset of Operator
High-Quality Operator
Precious Metals
Mine Life
Cost Profile
Scale of Production
Exploration Upside US$
0
4
8
12
16
20
24
$1,000 $1,200 $1,400 $1,600
Kemess UG (dev't stage) Stawell Eagle River Hemlo Fosterville YD
0 5 10 15 20 25 30 35
Kemess (3)
Stawell
Eagle River
Hemlo
Fosterville
YD
P&P
M&I
Inferred
Kemess East Kemess UG
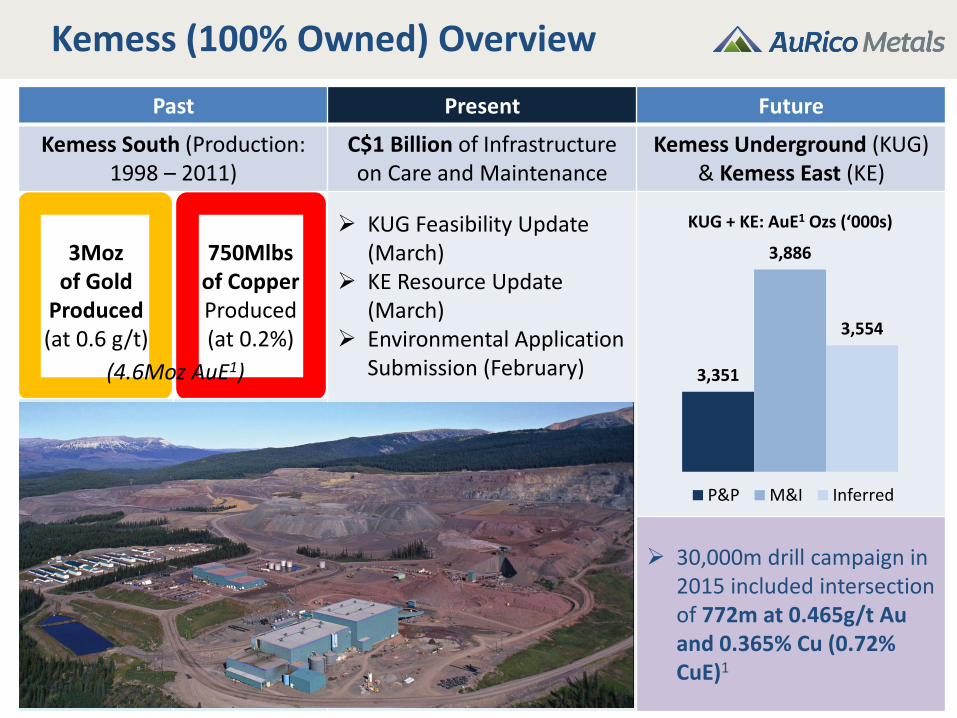
Kemess (100% Owned) Overview
8
End Notes required: 1) Production profile for Kemess
Underground Reserves is from the 2012 Feasibility study.
Past Present Future
Kemess South (Production: 1998 – 2011)
C$1 Billion of Infrastructure on Care and Maintenance
Kemess Underground (KUG) & Kemess East (KE)
3Moz of Gold
Produced (at 0.6 g/t)
750Mlbs of Copper Produced (at 0.2%)
KUG Feasibility Update (March)
KE Resource Update (March)
Environmental Application Submission (February)
30,000m drill campaign in 2015 included intersection of 772m at 0.465g/t Au and 0.365% Cu (0.72% CuE)1
3,351
3,886
3,554
KUG + KE: AuE1 Ozs (‘000s)
P&P M&I Inferred
(4.6Moz AuE1)
Net Asset Value per Share
9
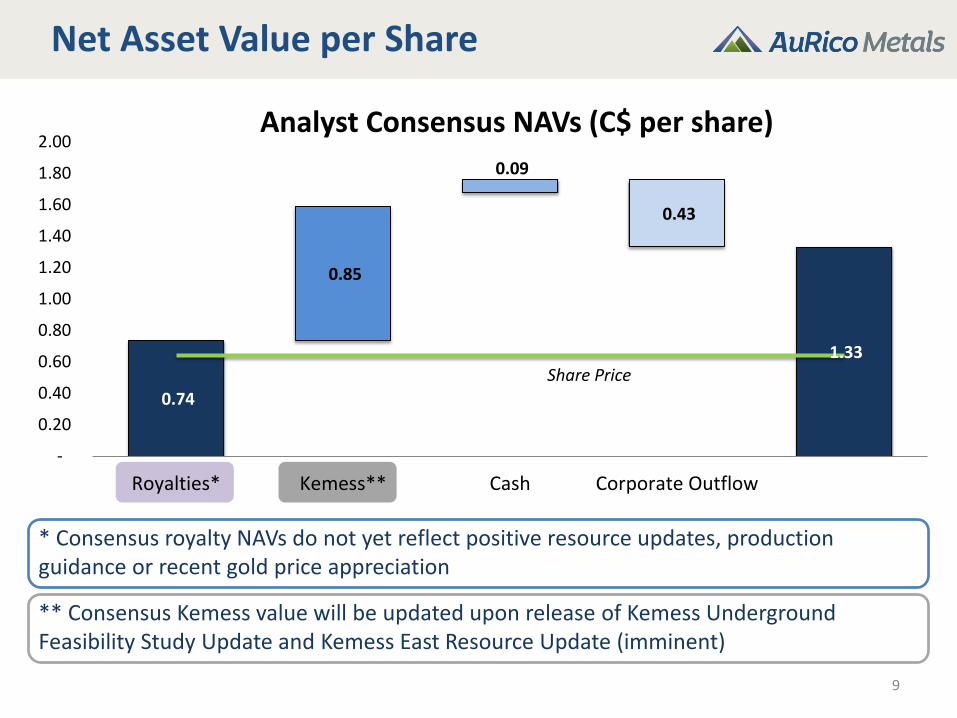
* Consensus royalty NAVs do not yet reflect positive resource updates, production guidance or recent gold price appreciation
0.74
0.85
0.09
0.43
1.33
-
0.20
0.40
0.60
0.80
1.00
1.20
1.40
1.60
1.80
2.00
Royalties* Kemess** Cash Corporate Outflow
Analyst Consensus NAVs (C$ per share)
** Consensus Kemess value will be updated upon release of Kemess Underground Feasibility Study Update and Kemess East Resource Update (imminent)
Share Price
Kemess – Embedded Royalty Value
10
End Notes required: 1) Production profile for Kemess
Underground Reserves is from the 2012 Feasibility study.
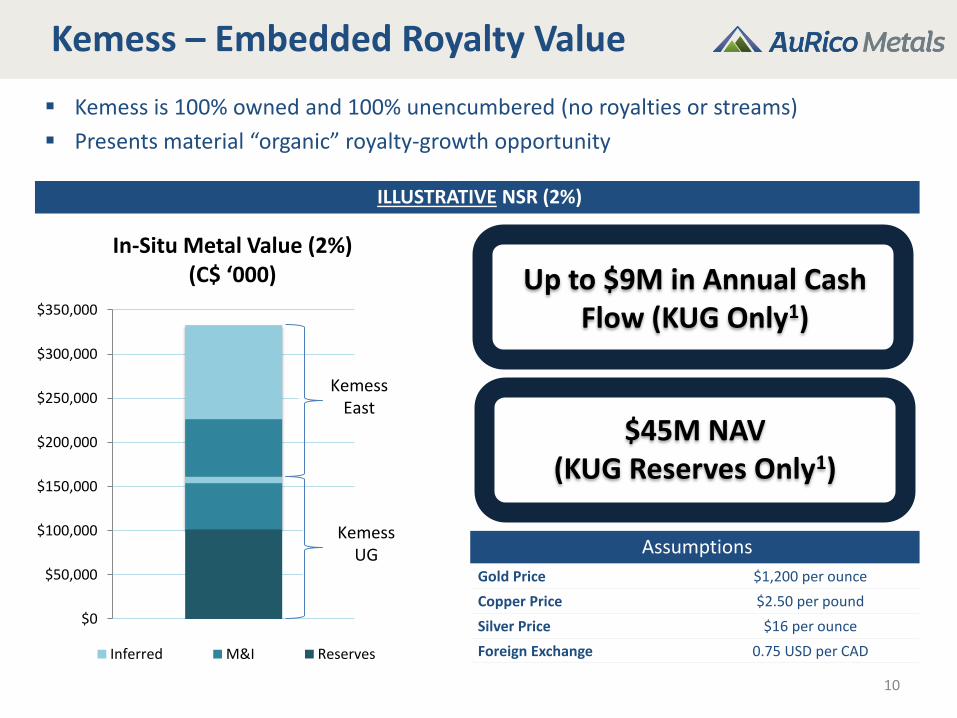
ILLUSTRATIVE NSR (2%)
Assumptions
Gold Price $1,200 per ounce
Copper Price $2.50 per pound
Silver Price $16 per ounce
Foreign Exchange 0.75 USD per CAD
Up to $9M in Annual Cash Flow (KUG Only1)
$45M NAV (KUG Reserves Only1)
Kemess is 100% owned and 100% unencumbered (no royalties or streams)
Presents material “organic” royalty-growth opportunity
$0
$50,000
$100,000
$150,000
$200,000
$250,000
$300,000
$350,000
In-Situ Metal Value (2%) (C$ ‘000)
Inferred M&I Reserves
Kemess East
Kemess East
Kemess UG
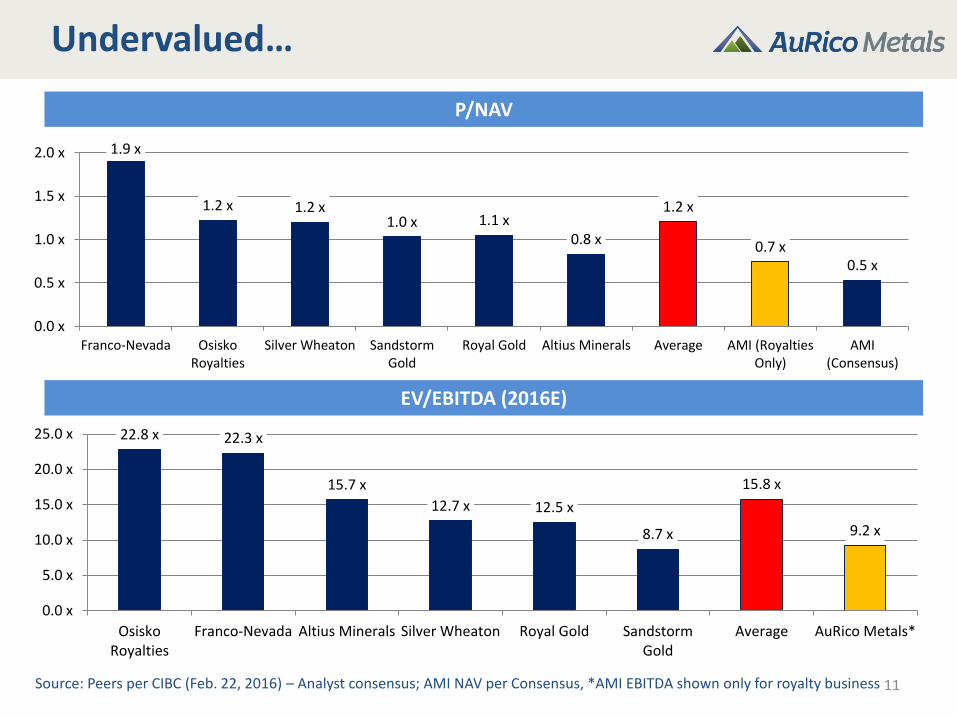
Undervalued…
11
EV/EBITDA (2016E)
Source: Peers per CIBC (Feb. 22, 2016) – Analyst consensus; AMI NAV per Consensus, *AMI EBITDA shown only for royalty business
P/NAV
1.9 x
1.2 x 1.2 x 1.0 x 1.1 x
0.8 x
1.2 x
0.7 x 0.5 x
0.0 x
0.5 x
1.0 x
1.5 x
2.0 x
Franco-Nevada OsiskoRoyalties
Silver Wheaton SandstormGold
Royal Gold Altius Minerals Average AMI (RoyaltiesOnly)
AMI(Consensus)
22.8 x 22.3 x
15.7 x
12.7 x 12.5 x
8.7 x
15.8 x
9.2 x
0.0 x
5.0 x
10.0 x
15.0 x
20.0 x
25.0 x
OsiskoRoyalties
Franco-Nevada Altius Minerals Silver Wheaton Royal Gold SandstormGold
Average AuRico Metals*
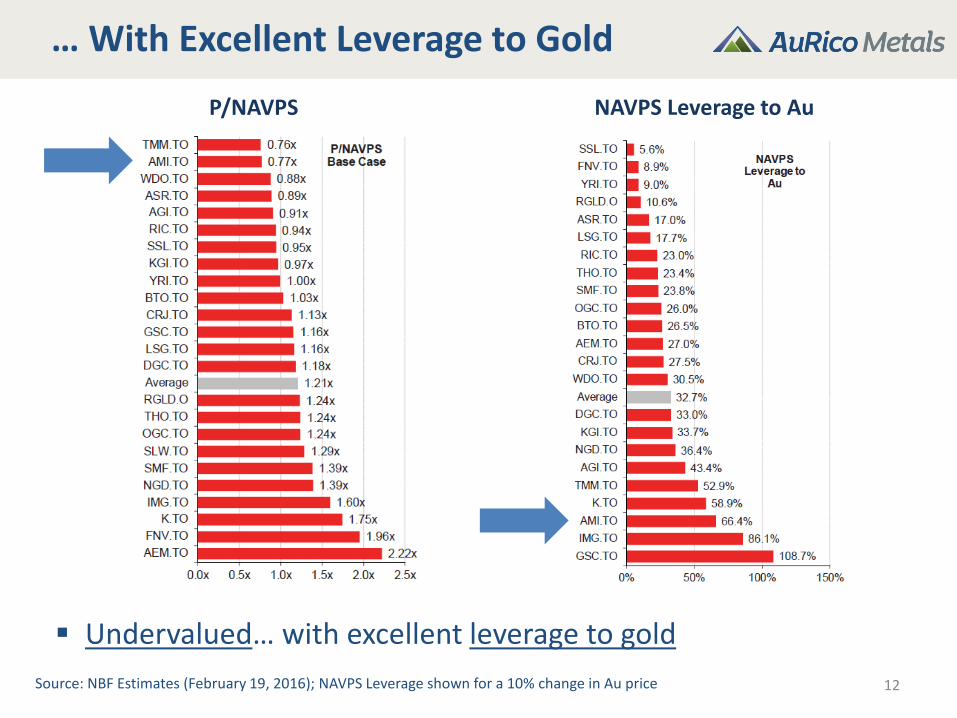
… With Excellent Leverage to Gold
12 Source: NBF Estimates (February 19, 2016); NAVPS Leverage shown for a 10% change in Au price
P/NAVPS NAVPS Leverage to Au
Undervalued… with excellent leverage to gold
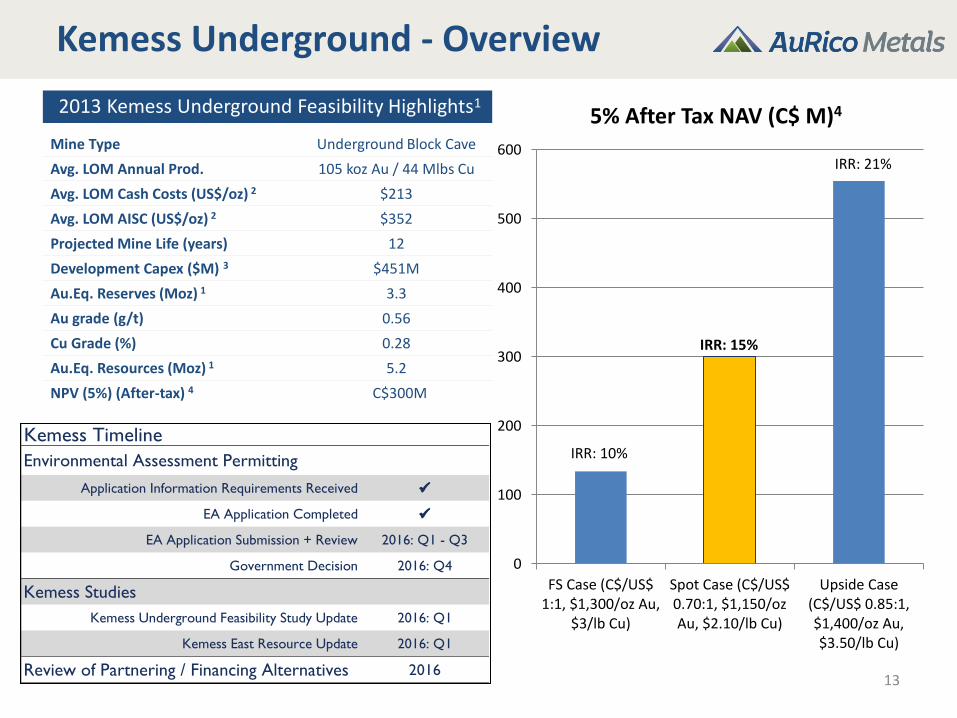
Kemess Underground - Overview
Mine Type Underground Block Cave
Avg. LOM Annual Prod. 105 koz Au / 44 Mlbs Cu
Avg. LOM Cash Costs (US$/oz) 2 $213
Avg. LOM AISC (US$/oz) 2 $352
Projected Mine Life (years) 12
Development Capex ($M) 3 $451M
Au.Eq. Reserves (Moz) 1 3.3
Au grade (g/t) 0.56
Cu Grade (%) 0.28
Au.Eq. Resources (Moz) 1 5.2
NPV (5%) (After-tax) 4 C$300M
2013 Kemess Underground Feasibility Highlights1
13
0
100
200
300
400
500
600
FS Case (C$/US$1:1, $1,300/oz Au,
$3/lb Cu)
Spot Case (C$/US$0.70:1, $1,150/ozAu, $2.10/lb Cu)
Upside Case(C$/US$ 0.85:1,$1,400/oz Au,$3.50/lb Cu)
5% After Tax NAV (C$ M)4
IRR: 10%
IRR: 15%
IRR: 21%
Environmental Assessment Permitting
Application Information Requirements Received
EA Application Completed
EA Application Submission + Review 2016: Q1 - Q3
Government Decision 2016: Q4
Kemess Studies
Kemess Underground Feasibility Study Update 2016: Q1
Kemess East Resource Update 2016: Q1
Review of Partnering / Financing Alternatives 2016
Kemess Timeline
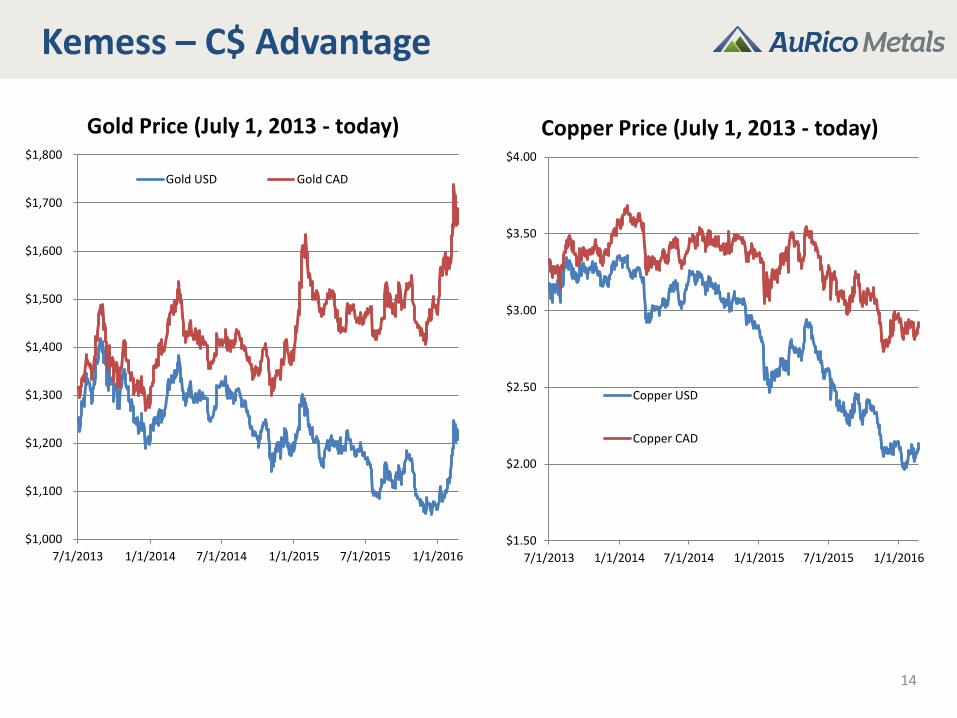
Kemess – C$ Advantage
14
$1,000
$1,100
$1,200
$1,300
$1,400
$1,500
$1,600
$1,700
$1,800
7/1/2013 1/1/2014 7/1/2014 1/1/2015 7/1/2015 1/1/2016
Gold Price (July 1, 2013 - today)
Gold USD Gold CAD
$1.50
$2.00
$2.50
$3.00
$3.50
$4.00
7/1/2013 1/1/2014 7/1/2014 1/1/2015 7/1/2015 1/1/2016
Copper Price (July 1, 2013 - today)
Copper USD
Copper CAD
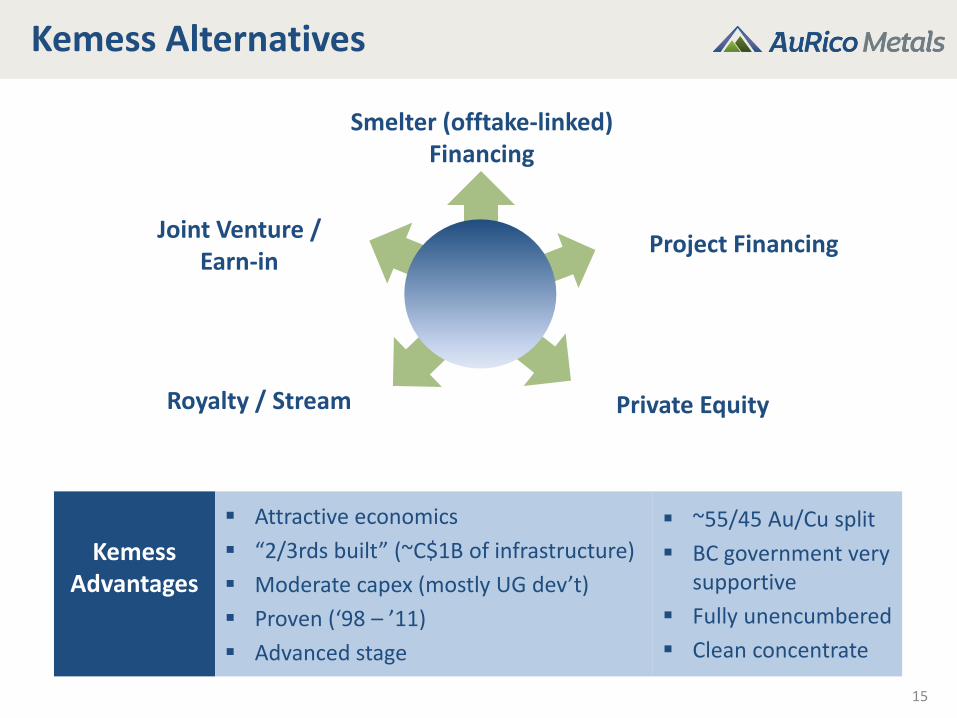
Kemess Alternatives
Kemess Advantages
Attractive economics
“2/3rds built” (~C$1B of infrastructure)
Moderate capex (mostly UG dev’t)
Proven (‘98 – ’11)
Advanced stage
~55/45 Au/Cu split
BC government very supportive
Fully unencumbered
Clean concentrate
15
Smelter (offtake-linked) Financing
Joint Venture / Earn-in
Project Financing
Royalty / Stream Private Equity
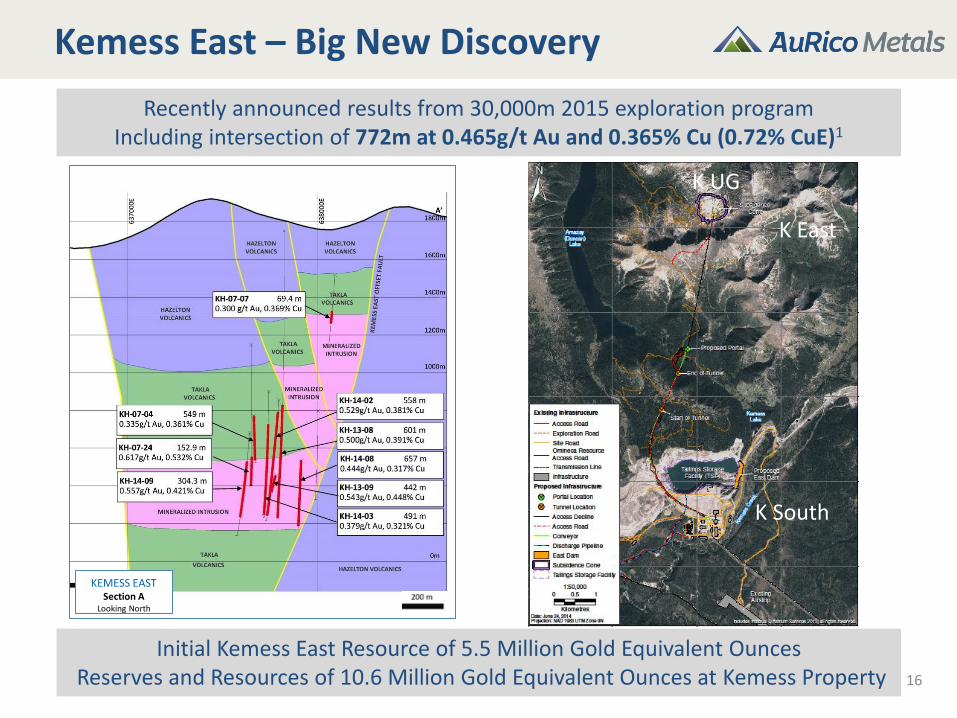
Initial Kemess East Resource of 5.5 Million Gold Equivalent Ounces
Reserves and Resources of 10.6 Million Gold Equivalent Ounces at Kemess Property
Kemess East – Big New Discovery
16
Recently announced results from 30,000m 2015 exploration program Including intersection of 772m at 0.465g/t Au and 0.365% Cu (0.72% CuE)1
KEMESS EAST Section A
Looking North
K UG
K East
K South
Catalysts
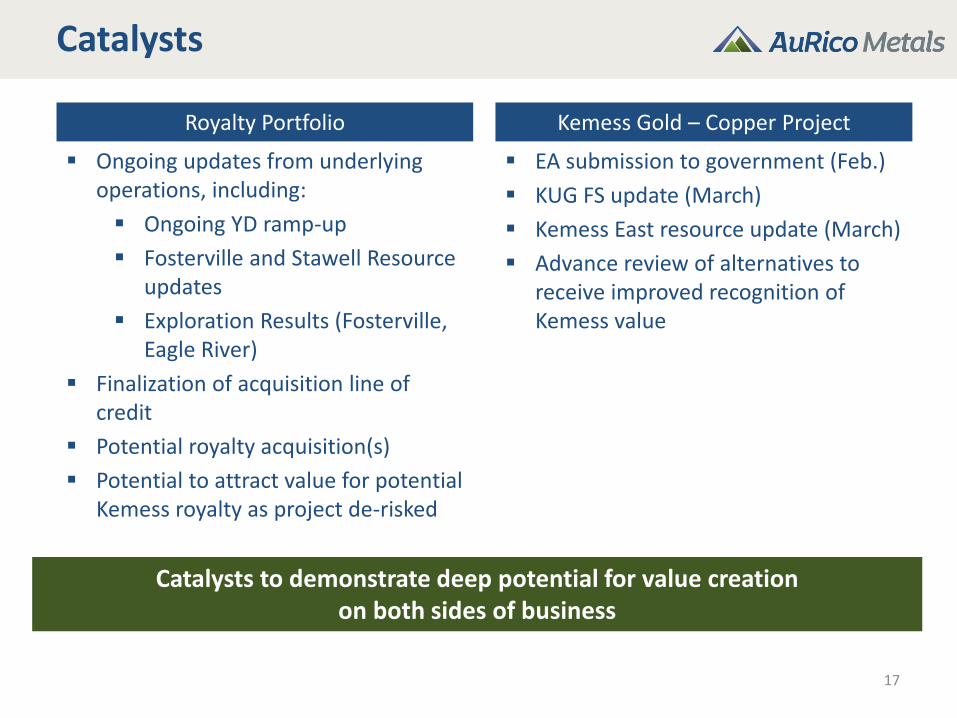
Royalty Portfolio Kemess Gold – Copper Project
Ongoing updates from underlying operations, including:
Ongoing YD ramp-up
Fosterville and Stawell Resource updates
Exploration Results (Fosterville, Eagle River)
Finalization of acquisition line of credit
Potential royalty acquisition(s)
Potential to attract value for potential Kemess royalty as project de-risked
EA submission to government (Feb.)
KUG FS update (March)
Kemess East resource update (March)
Advance review of alternatives to receive improved recognition of Kemess value
17
Catalysts to demonstrate deep potential for value creation on both sides of business
18
APPENDIX
19
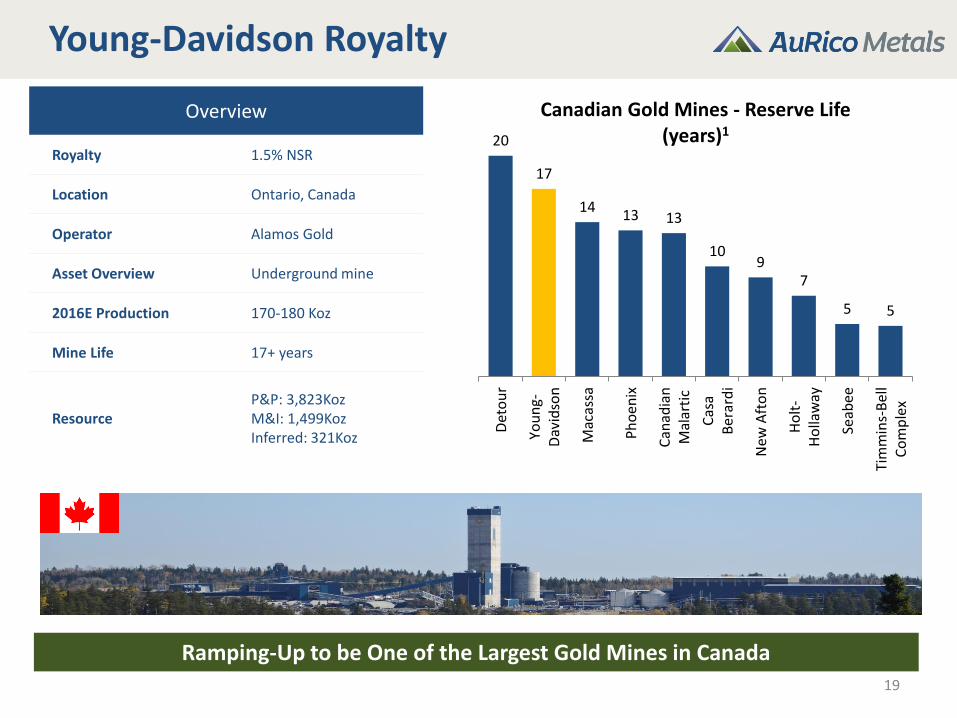
Young-Davidson Royalty
Ramping-Up to be One of the Largest Gold Mines in Canada
Overview
Royalty 1.5% NSR
Location Ontario, Canada
Operator Alamos Gold
Asset Overview Underground mine
2016E Production 170-180 Koz
Mine Life 17+ years
Resource P&P: 3,823Koz M&I: 1,499Koz Inferred: 321Koz
20
17
14 13 13
10 9
7
5 5
Det
ou
r
You
ng-
Dav
idso
n
Mac
assa
Ph
oen
ix
Can
adia
nM
alar
tic
Cas
aB
erar
di
New
Aft
on
Ho
lt-
Ho
llaw
ay
Seab
ee
Tim
min
s-B
ell
Co
mp
lex
Canadian Gold Mines - Reserve Life (years)1
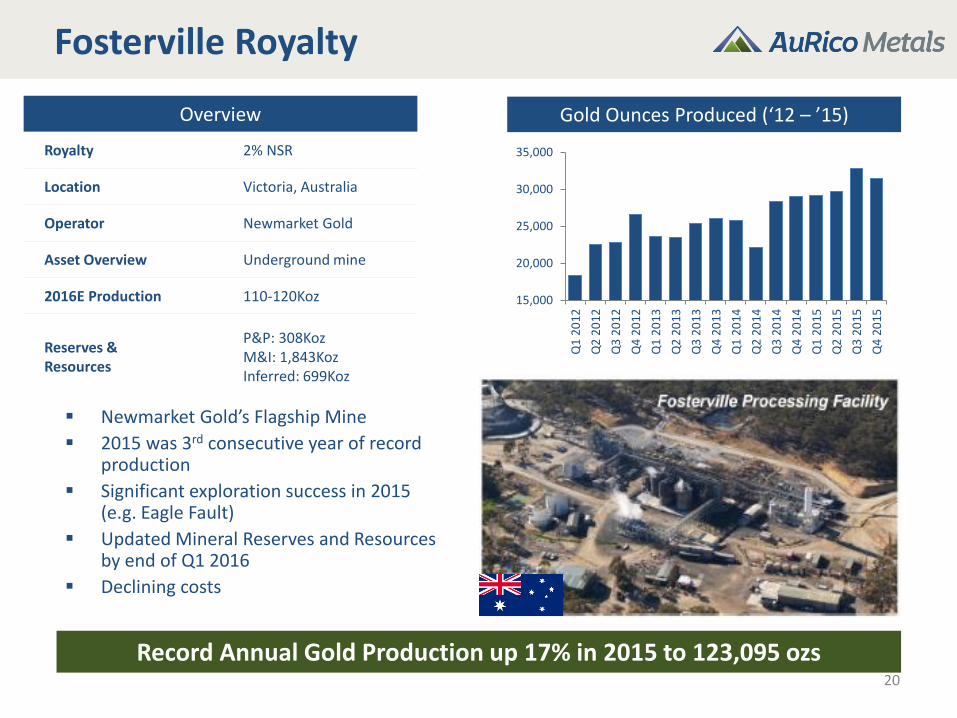
Fosterville Royalty
Overview
Royalty 2% NSR
Location Victoria, Australia
Operator Newmarket Gold
Asset Overview Underground mine
2016E Production 110-120Koz
Reserves & Resources
P&P: 308Koz M&I: 1,843Koz Inferred: 699Koz
20
15,000
20,000
25,000
30,000
35,000
Q1
20
12
Q2
20
12
Q3
20
12
Q4
20
12
Q1
20
13
Q2
20
13
Q3
20
13
Q4
20
13
Q1
20
14
Q2
20
14
Q3
20
14
Q4
20
14
Q1
20
15
Q2
20
15
Q3
20
15
Q4
20
15
Newmarket Gold’s Flagship Mine
2015 was 3rd consecutive year of record production
Significant exploration success in 2015 (e.g. Eagle Fault)
Updated Mineral Reserves and Resources by end of Q1 2016
Declining costs
Record Annual Gold Production up 17% in 2015 to 123,095 ozs
Gold Ounces Produced (‘12 – ’15)
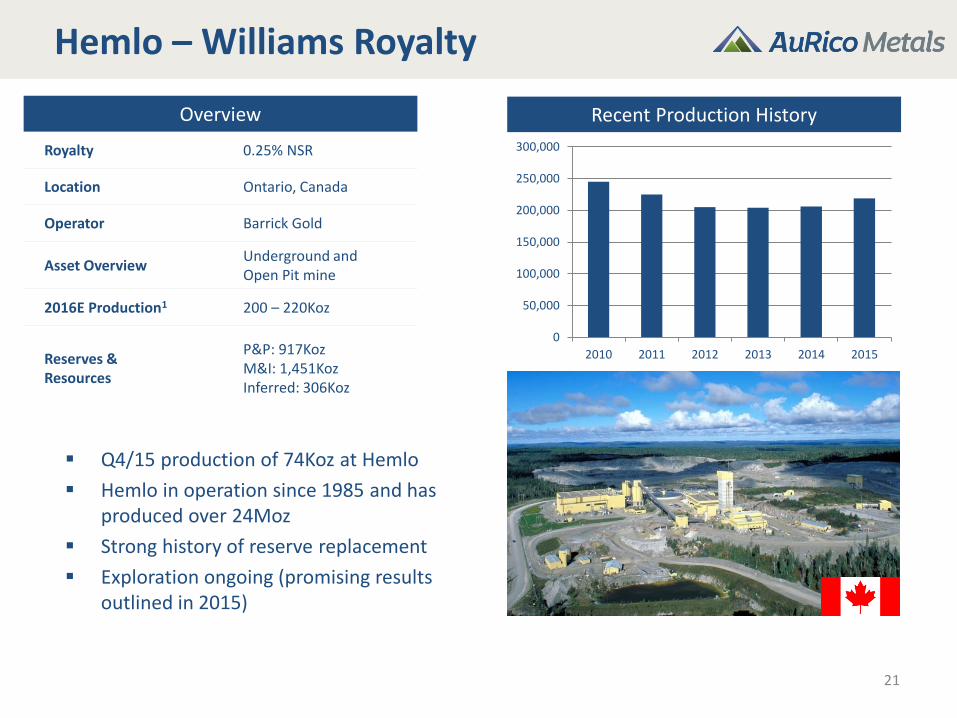
Hemlo – Williams Royalty
Overview
Royalty 0.25% NSR
Location Ontario, Canada
Operator Barrick Gold
Asset Overview Underground and Open Pit mine
2016E Production1 200 – 220Koz
Reserves & Resources
P&P: 917Koz M&I: 1,451Koz Inferred: 306Koz
21
Q4/15 production of 74Koz at Hemlo
Hemlo in operation since 1985 and has produced over 24Moz
Strong history of reserve replacement
Exploration ongoing (promising results outlined in 2015)
Recent Production History
0
50,000
100,000
150,000
200,000
250,000
300,000
2010 2011 2012 2013 2014 2015
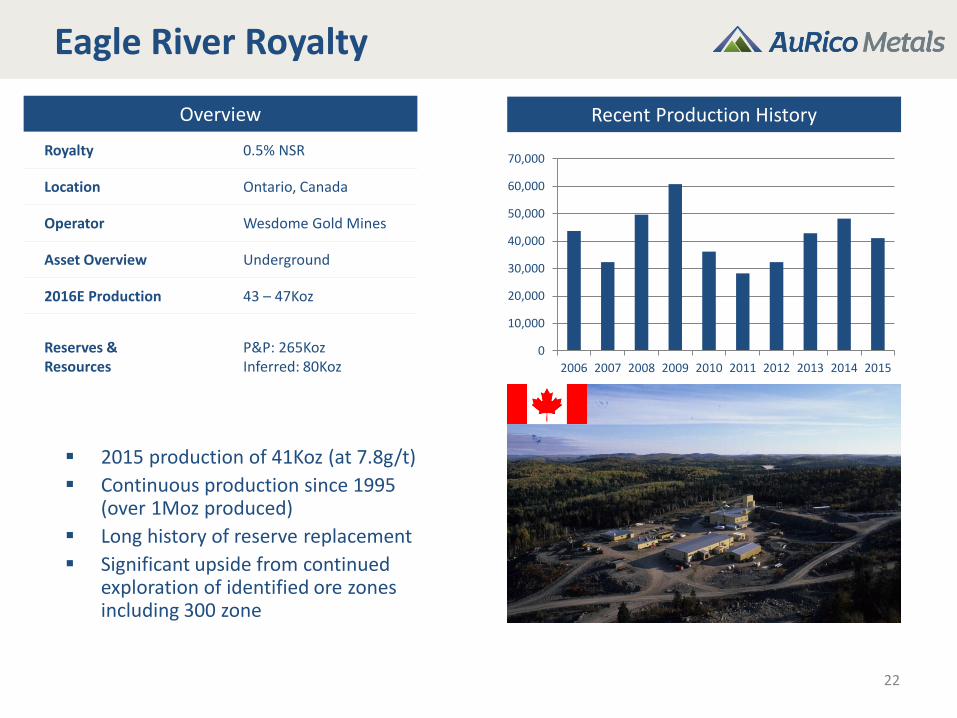
Eagle River Royalty
Overview
Royalty 0.5% NSR
Location Ontario, Canada
Operator Wesdome Gold Mines
Asset Overview Underground
2016E Production 43 – 47Koz
Reserves & Resources
P&P: 265Koz Inferred: 80Koz
22
2015 production of 41Koz (at 7.8g/t)
Continuous production since 1995 (over 1Moz produced)
Long history of reserve replacement
Significant upside from continued exploration of identified ore zones including 300 zone
Recent Production History
0
10,000
20,000
30,000
40,000
50,000
60,000
70,000
2006 2007 2008 2009 2010 2011 2012 2013 2014 2015
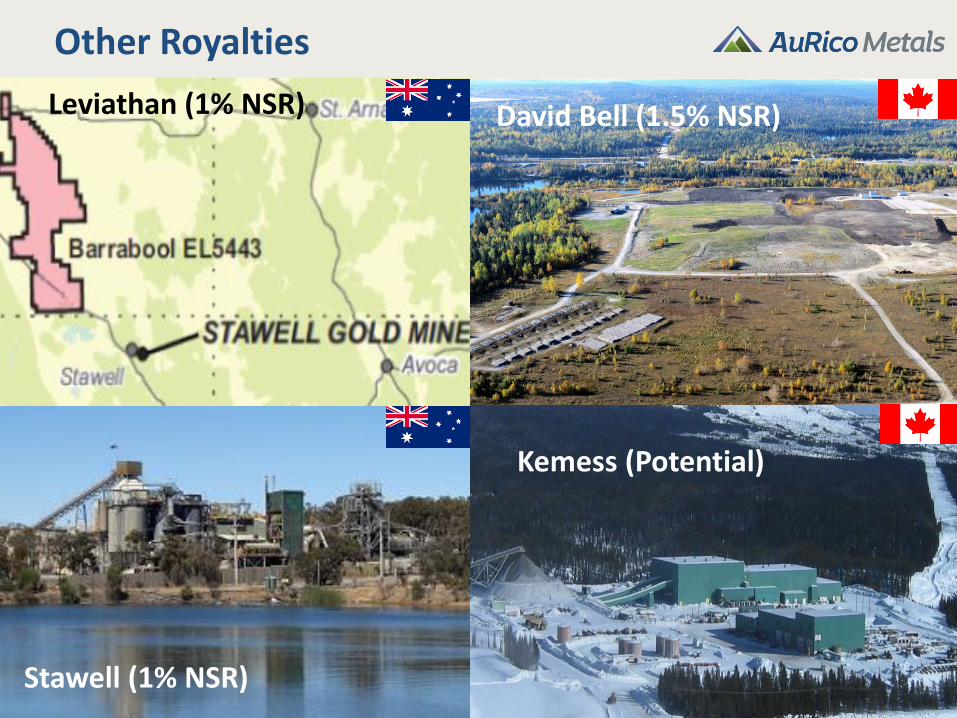
Other Royalties
23
Kemess (Potential)
David Bell (1.5% NSR)
Stawell (1% NSR)
Leviathan (1% NSR)
24
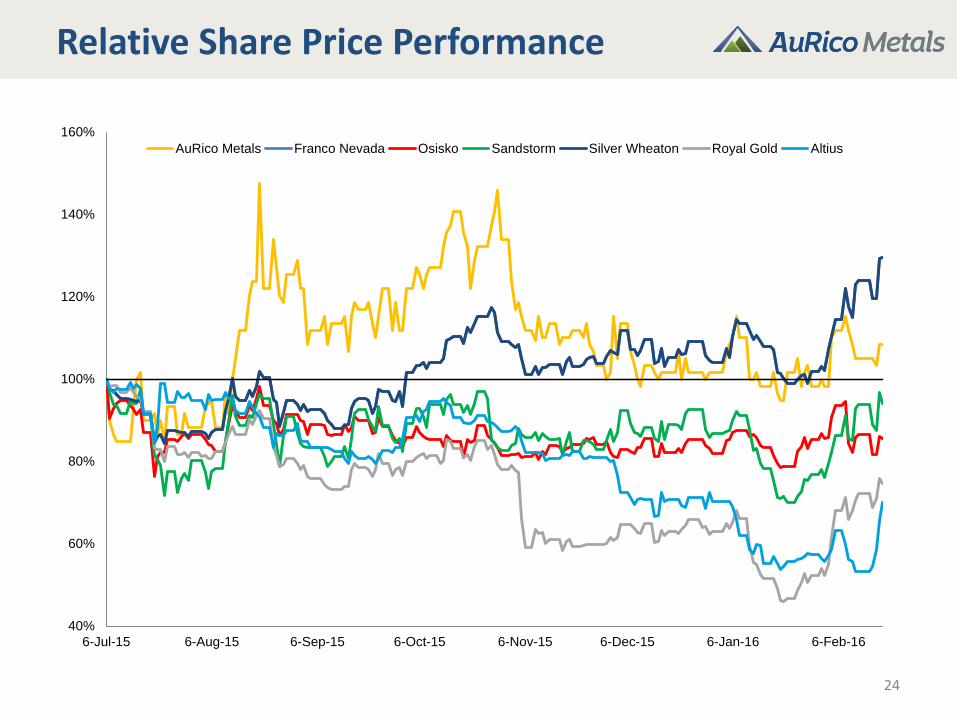
Relative Share Price Performance
40%
60%
80%
100%
120%
140%
160%
6-Jul-15 6-Aug-15 6-Sep-15 6-Oct-15 6-Nov-15 6-Dec-15 6-Jan-16 6-Feb-16
AuRico Metals Franco Nevada Osisko Sandstorm Silver Wheaton Royal Gold Altius
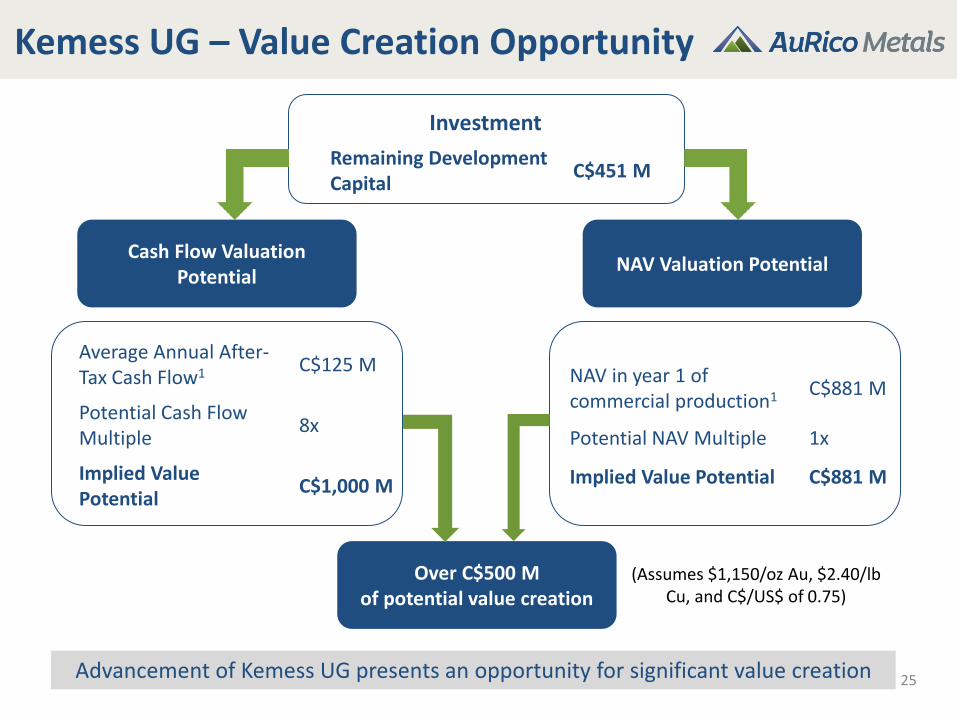
Kemess UG – Value Creation Opportunity
Investment
Remaining Development Capital
C$451 M
Average Annual After-Tax Cash Flow1 C$125 M
Potential Cash Flow Multiple
8x
Implied Value Potential
C$1,000 M
Over C$500 M of potential value creation
25 Advancement of Kemess UG presents an opportunity for significant value creation
NAV in year 1 of commercial production1 C$881 M
Potential NAV Multiple 1x
Implied Value Potential C$881 M
Cash Flow Valuation Potential
NAV Valuation Potential
(Assumes $1,150/oz Au, $2.40/lb Cu, and C$/US$ of 0.75)
26
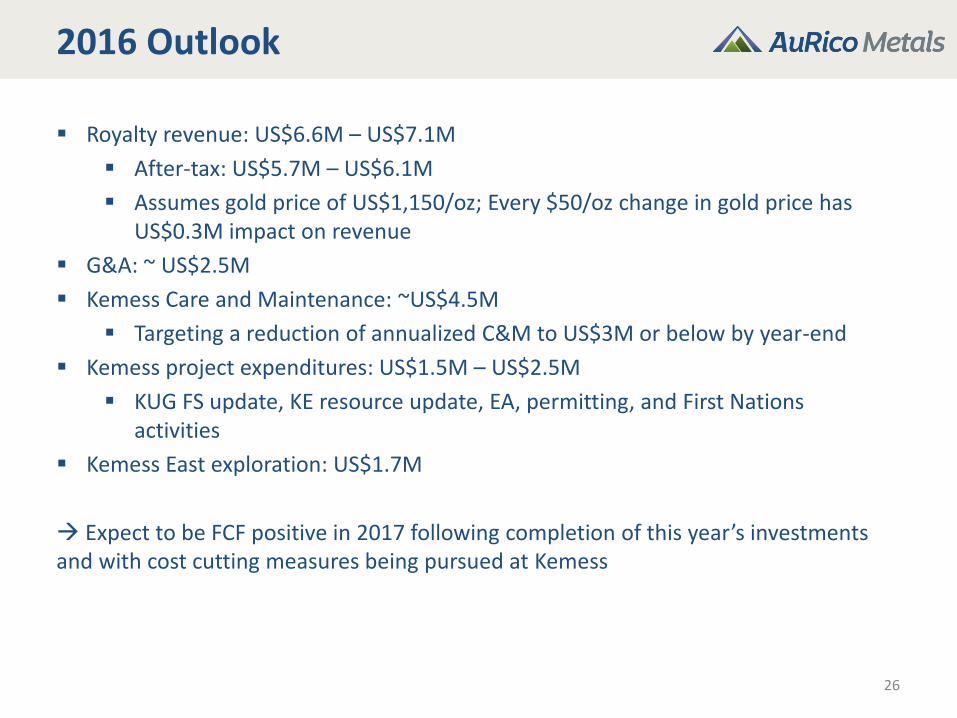
2016 Outlook
Royalty revenue: US$6.6M – US$7.1M
After-tax: US$5.7M – US$6.1M
Assumes gold price of US$1,150/oz; Every $50/oz change in gold price has US$0.3M impact on revenue
G&A: ~ US$2.5M
Kemess Care and Maintenance: ~US$4.5M
Targeting a reduction of annualized C&M to US$3M or below by year-end
Kemess project expenditures: US$1.5M – US$2.5M
KUG FS update, KE resource update, EA, permitting, and First Nations activities
Kemess East exploration: US$1.7M
Expect to be FCF positive in 2017 following completion of this year’s investments and with cost cutting measures being pursued at Kemess
27
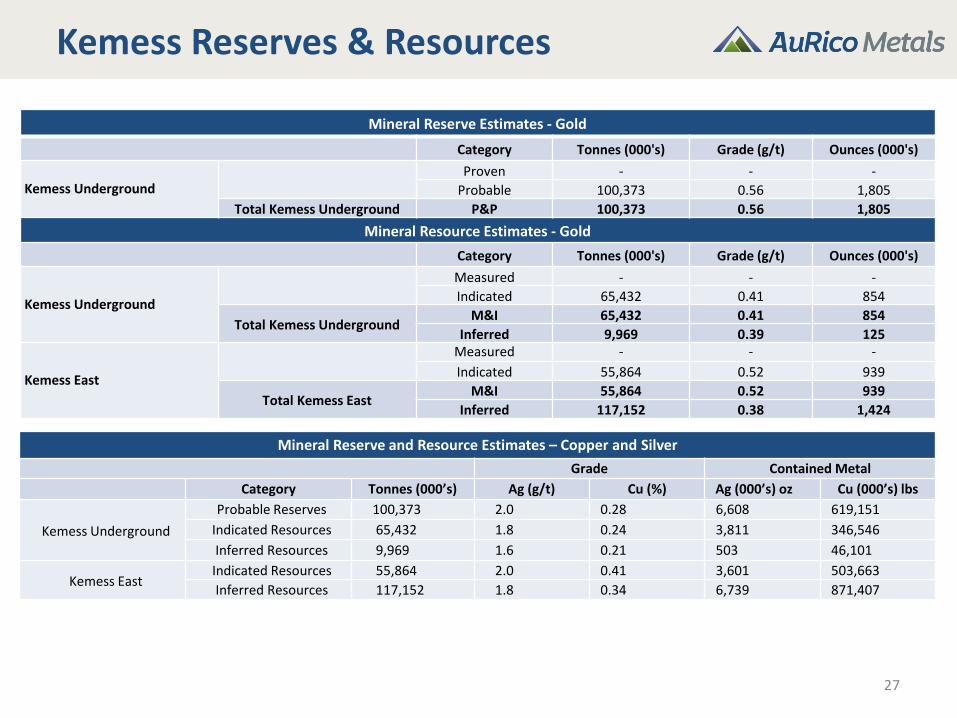
Mineral Reserve Estimates - Gold
Category Tonnes (000's) Grade (g/t) Ounces (000's)
Kemess Underground
Proven - - -
Probable 100,373 0.56 1,805
Total Kemess Underground P&P 100,373 0.56 1,805
Mineral Resource Estimates - Gold
Category Tonnes (000's) Grade (g/t) Ounces (000's)
Kemess Underground
Measured - - -
Indicated 65,432 0.41 854
Total Kemess Underground M&I 65,432 0.41 854
Inferred 9,969 0.39 125
Kemess East
Measured - - -
Indicated 55,864 0.52 939
Total Kemess East M&I 55,864 0.52 939
Inferred 117,152 0.38 1,424
Mineral Reserve and Resource Estimates – Copper and Silver
Grade Contained Metal
Category Tonnes (000’s) Ag (g/t) Cu (%) Ag (000’s) oz Cu (000’s) lbs
Kemess Underground
Probable Reserves 100,373 2.0 0.28 6,608 619,151
Indicated Resources 65,432 1.8 0.24 3,811 346,546
Inferred Resources 9,969 1.6 0.21 503 46,101
Kemess East Indicated Resources 55,864 2.0 0.41 3,601 503,663
Inferred Resources 117,152 1.8 0.34 6,739 871,407
Kemess Reserves & Resources
CHRIS RICHTER President & Chief Executive Officer,
Director
Chris has over 14 years of experience in the mining industry leading strategy, M&A, evaluation, and capital allocation
efforts. Most recently, Chris was Senior Vice President of Corporate Development at AuRico Gold and before that he
spent 7 years at Barrick Gold. Chris is also a former director of Carlisle Goldfields. Over his career Chris has completed
over $20B in M&A transactions. Chris holds a Master of Arts degree in Economics from the University of Toronto and a
Bachelor of Arts degree in Economics and Political Science from the University of Waterloo. He is also a CFA charter
holder.
ROBERT CHAUSSE Chief Financial Officer
Robert Chausse brings with him more than 20 years of international finance and mining experience. His past
experience includes his role as Executive Vice President & Chief Financial Officer of AuRico Gold, and prior to that
Robert was the Vice President of Finance, Operations and Projects for Kinross Gold, a position he held since 2009. He
served as Chief Financial Officer for Baffinland Iron Mines Corporation from 2006 to 2009, and held increasingly senior
positions with Barrick Gold from 1998 to 2006. Robert received his Chartered Accountant designation in 1990.
JOHN FITZGERALD Chief Operating Officer
John Fitzgerald has over 25 years experience in the mining industry. Prior to his role at AuRico Metals, John Joined
AuRico Gold through the Northgate transaction in 2011 where he served as Director of Mining, playing a key role in the
advancement of the Young-Davidson Project. Holding varied roles with De Beers, Rio Tinto, Barrick Gold & Scotia
Capital, as well as a successful independent consultancy career, John brings with him a wealth of experience. Mr.
Fitzgerald holds a B. Eng. degree from Nottingham University and an MBA from Durham University, England.
CHRIS ROCKINGHAM Vice President, Development
Chris Rockingham brings over 30 years of extensive exploration experience, focused on precious and base-metal
deposits in various geological, geographic and cultural settings in North and South America. He held the position of Vice
President of Exploration and Business Development with Northgate Minerals for eight years prior to its amalgamation
with AuRico Gold in 2011. He has a Master of Science degree in Geology from the University of Western Ontario and an
MBA (with distinction) from the Richard Ivey School of Business.
HAROLD BENT Director, Environment
Harold Bent has over 25 years experience in the environmental, mining and mineral exploration sectors across Canada
and internationally. He has been involved with the Kemess Project since 2000 where he advanced to position
of Manager of Environment. Mr. Bent has provided lead guidance on mine site environmental management plans,
closure planning, Federal and Provincial Environmental Assessments and internal environmental reviews. He holds a
Bachelor of Science degree in Geology from Acadia University and an Environmental Science Post-Baccalaureate
Diploma from Capilano College North Vancouver.
SUSAN CRAIG Advisor, Government & Community Affairs
Susan Craig is a professional geologist with more than 20 years experience in exploration and mine development in
North America. She is a founder and past president/CEO of Northern Freegold Resources Ltd. Prior to working with
Northern Freegold, Susan was the land and environmental manager at NovaGold Resources where she was
instrumental in the environmental assessment and permitting of the Galore Creek Project in northwestern British
Columbia. Susan hold a Masters of Science degree in Geology from Lakehead University.
28
Management Team
Endnotes
29
Slide 4 - Market Overview 1) Per Scotia, Sedi, and company filings
Slide 7 - Royalty Portfolio Overview: 1) Reserves and resources per most recent resource updates from asset owners; Assumes annual production levels for YD, Fosterville, Hemlo, Eagle River, Kemess UG, and Stawell of 200Koz, 105Koz, 200Koz, 50Koz, 140Koz, and 30Koz respectively and recoveries of 90%, 88%, 95%, 95%, 90%, and 90% respectively; Kemess East resources added to end of KUG life at steady production rate 2) Annual production assumptions per mid-point of guidance; For Kemess UG, the copper price is being adjusted up/down by the same percentage, i.e. the parallel copper price assumptions for the gold price range of $1,100 - $1,600/oz is $2.54, $2.77, $3.00, $3.23, $3.46, $3.69
Slide 8 - Kemess Overview: AuE ounces calculated on the basis of $1,200/oz Au and $2.50/lb Cu Slide 10 – Kemess Embedded Royalty Value
1) Per 2012 FS; FS update due in March Slide 13 - Kemess UG Overview:
1) See NI 43-101 Technical Report for Kemess Property on AuRico Metals’ Sedar profile on July 2, 2015 2) Cash costs per gold ounce and all-in sustaining costs (“AISC”) are non-GAAP measures that do not have a standardized meaning 3) Development Capex represents total capital expenditures required to achieve commercial production including capitalized operating costs less revenue from pre-commercial production revenue (at pricing used in Feasibility Study)(See note 1). 4) NPV references Feasibility Study model run in “Spot” price scenario ($1,150/oz Au, $2.10/lb Cu, and C$/US$ of 0.70); Does not factor in impact of potential royalty.
Slide 16 (Kemess East): 1) CuE calculation assumes Au price of $1,200/oz and Cu price of $2.50/oz
Slide 19 - YD Royalty: 1) Scotia analysis
Slide 21 - Hemlo - Williams Royalty 1) Total 2015 production for Hemlo Complex per Barrick disclosure; not 100% attributable to Williams mine Slide 25 – Kemess UG – Value Creation Opportunity 1) Based on KUG FS (2012); Update to be released in March