Embed Size (px)
Citation preview

Americans Love Streaming TV Services but Can’t Give Up ‘Destination Television,’ J.D. Power Finds Over-the-Top Streaming Services Gain in Customer Satisfaction, but Regularly Scheduled Program Viewing Continues to Rise COSTA MESA, Calif.: 28 Sept. 2017 — Pay-TV subscribers in the United States are growing increasingly satisfied with over-the-top streaming TV services vs. traditional cable TV, but they also are spending nearly an hour more a week watching regularly scheduled television programming than they did two years ago. That increasingly complex consumer relationship with streaming and cable television is explored in detail in a trio of J.D. Power studies released today. The related studies are the J.D. Power 2017 U.S. Residential Television Service Provider Satisfaction StudySM; the J.D. Power 2017 U.S. Residential Internet Service Provider Satisfaction StudySM; and the J.D. Power 2017 U.S. Residential Telephone Service Provider Satisfaction Study.SM
“Although it seems like the world is consumed with idea of cord-cutting in the wake of Hulu’s first Emmy and the proliferation of new shows on Netflix and Amazon, the number of current pay-TV customers who plan to cut the cord has actually declined, and the number of hours spent watching old-fashioned, time-slot television is growing,” said Peter Cunningham, Technology, Media, and Telecommunications Practice Lead at J.D. Power. “We’re seeing a trend toward the co-existence of traditional and alternative service providers, with each offering some lessons to the other on how best to drive an increase in customer satisfaction.” Following are some of the key findings of the study:
Streaming services make gains as traditional TV declines: Customer satisfaction with the overall streaming video service experience (7.91 on a 10-point scale) and performance and reliability (7.97) has slightly improved year over year. Conversely, overall satisfaction with traditional pay-TV services has fallen to 710 this year (on a 1,000-point scale) from 724 last year.
Destination TV viewing reaches three-year high: Despite growing satisfaction with streaming
video services and widespread use of DVR and video on-demand, the number of hours spent watching regularly scheduled television programs has increased by nearly an hour between 2015 and 2017. In a typical week, households have spent an average of 17.4 hours watching regularly schedule programming this year, up from 16.6 in 2015.
Percentage of likely cord-cutters declines slightly: The percentage of customers who say they
plan to cut the cord on pay-TV during the next 12 months has declined to 8% this year from 9% in 2016.
Mobile app adoption low, but satisfaction high among early adopters: Nearly two-thirds (65%)
of pay-TV customers never watch content from their provider via mobile app, and only 6% say they
watch via mobile on a daily basis. However, overall satisfaction with pay-TV providers increases as the frequency that customers use a mobile app to watch their provider’s content increases.
Billing errors present challenge and opportunity: Though the incidence of billing errors has
steadily decreased over the past five years, hidden fees continue to be the most common billing error by a large margin. Provider efforts to address this have paid off. Billing satisfaction among customers who experienced a billing error and are given an automatic credit or refund slightly exceeds that among customers who did not experience any billing errors (768 vs. 760, respectively).
Provider Rankings Residential Internet Service Provider Satisfaction Study
Verizon ranks highest in the East region (737); AT&T/DIRECTV ranks highest in the North Central region (699); Charter Spectrum ranks highest in the South region (717); and Cox Communications ranks highest in the West region (706).
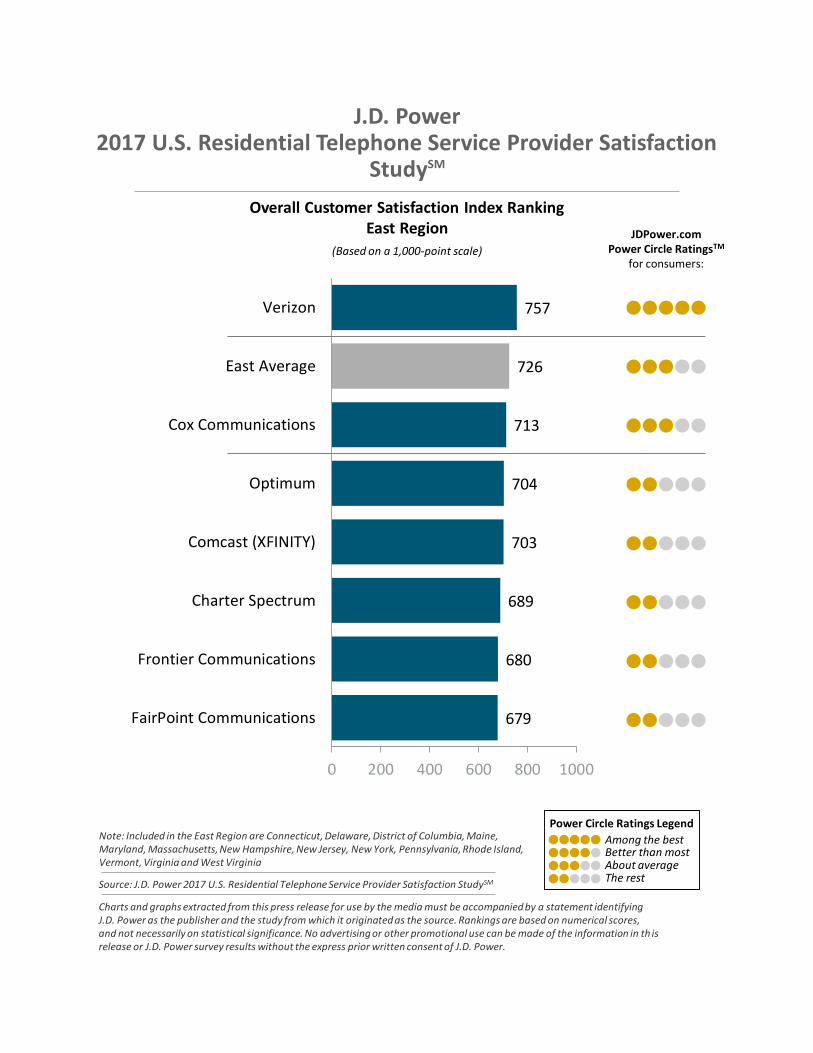
Residential Telephone Service Provider Satisfaction Study
Verizon ranks highest in the East region (757); AT&T/DIRECTV ranks highest in the North Central region (733) and South region (742); and Cox Communications ranks highest in the West region (734).
Residential Television Service Provider Satisfaction Study
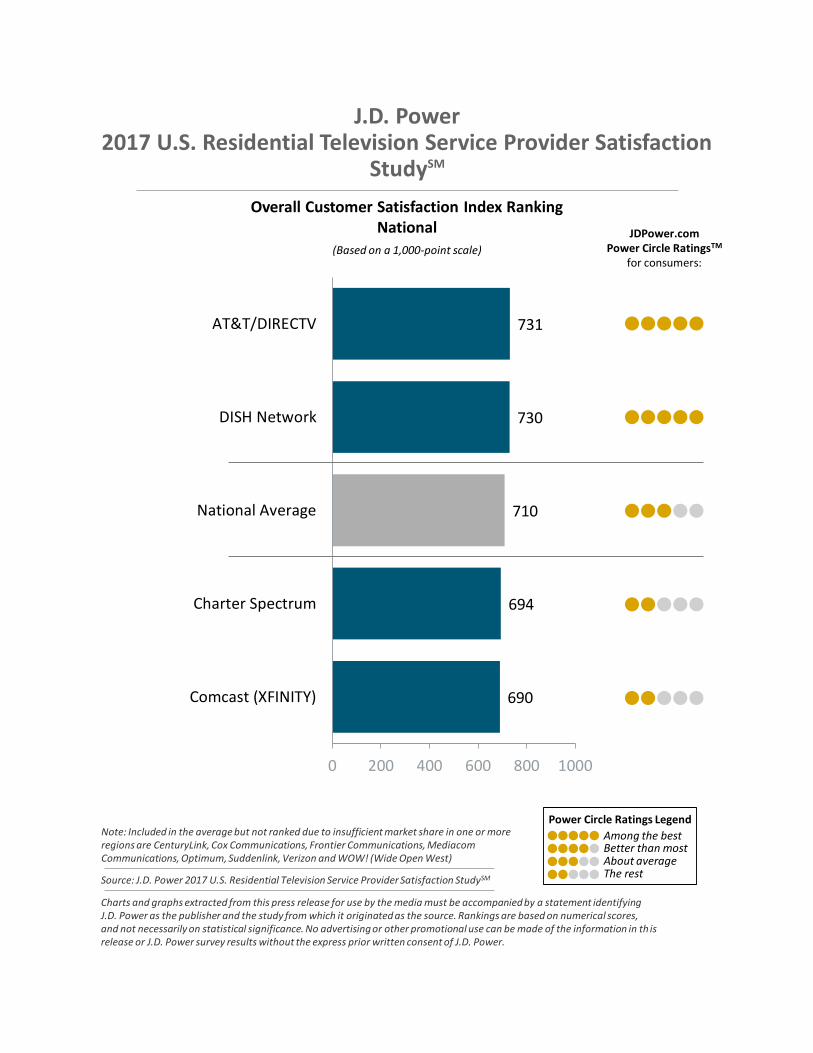
AT&T/DIRECTV performs highest in overall satisfaction in the national segment with a score of 731. Due to small market share, Verizon was not eligible for the national segment but does rank highest in the East region (755). DISH Network ranks highest in the North Central region (722) and South region (740). AT&T/DIRECTV ranks highest in the West region (726).
The annual wireline studies, now in their 16th year, evaluate residential customers’ experiences with TV, internet and phone services in four geographical regions: East, South, North Central and West. The ISP and telephone studies measure customer satisfaction across five factors: network performance and reliability; cost of service; billing; communication; and customer service. The TV study measures satisfaction in those same five factors plus a sixth: programming. The 2017 U.S. wireline studies are based on responses from 27,415 customers nationwide who evaluated their cable/satellite TV, high-speed internet and telephone service providers. The studies were fielded in four waves: November 2016, January-February 2017, April-May 2017 and July 2017. For more information about the 2017 U.S. wireline studies, visit http://www.jdpower.com/resource/us-residential-internet-service-provider-customer-satisfaction-study, http://www.jdpower.com/resource/jd-power-residential-telephone-customer-satisfaction-study or http://www.jdpower.com/resource/us-residential-television-customer-satisfaction-study. See the online press release at http://www.jdpower.com/pr-id/2017168. J.D. Power is a global leader in consumer insights, advisory services and data and analytics. These capabilities enable J.D. Power to help its clients drive customer satisfaction, growth and profitability.
Established in 1968, J.D. Power is headquartered in Costa Mesa, Calif., and has offices serving North/South America, Asia Pacific and Europe. J.D. Power is a portfolio company of XIO Group, a global alternative investments and private equity firm headquartered in London, and is led by its four founders: Athene Li, Joseph Pacini, Murphy Qiao and Carsten Geyer. Media Relations Contacts Geno Effler; Costa Mesa, Calif.; 714-621-6224; [email protected] John Roderick; St. James, N.Y.; 631-584-2200; [email protected] About J.D. Power and Advertising/Promotional Rules www.jdpower.com/about-us/press-release-info
# # # NOTE: Fourteen charts follow.

737
695
688
679
679
660
619
0 200 400 600 800 1000
Verizon
East Average
Optimum
Comcast (XFINITY)
Cox Communications
Charter Spectrum
Frontier Communications
J.D. Power2017 U.S. Residential Internet Service Provider Satisfaction
StudySM
Overall Customer Satisfaction Index RankingEast Region
(Based on a 1,000-point scale)
JDPower.comPower Circle RatingsTM
for consumers:
Source: J.D. Power 2017 U.S. Residential Internet Service Provider Satisfaction StudySM
Charts and graphs extracted from this press release for use by the media must be accompanied by a statement identifying J.D. Power as the publisher and the study from which it originated as the source. Rankings are based on numerical scores, and not necessarily on statistical significance. No advertising or other promotional use can be made of the information in th is release or J.D. Power survey results without the express prior written consent of J.D. Power.
Note: Included in the East Region are Connecticut, Delaware, District of Columbia, Maine, Maryland, Massachusetts, New Hampshire, New Jersey, New York, Pennsylvania, Rhode Island, Vermont, Virginia and West Virginia
Among the bestBetter than mostAbout averageThe rest
Power Circle Ratings Legend

699
674
669
668
644
639
625
0 200 400 600 800 1000
AT&T/DIRECTV
North Central Average
Comcast (XFINITY)
Charter Spectrum
WOW! (Wide Open West)
CenturyLink
Frontier Communications
J.D. Power2017 U.S. Residential Internet Service Provider Satisfaction
StudySM
Overall Customer Satisfaction Index RankingNorth Central Region
(Based on a 1,000-point scale)
JDPower.comPower Circle RatingsTM
for consumers:
Source: J.D. Power 2017 U.S. Residential Internet Service Provider Satisfaction StudySM
Charts and graphs extracted from this press release for use by the media must be accompanied by a statement identifying J.D. Power as the publisher and the study from which it originated as the source. Rankings are based on numerical scores, and not necessarily on statistical significance. No advertising or other promotional use can be made of the information in th is release or J.D. Power survey results without the express prior written consent of J.D. Power.
Note: Included in the North Central Region are Illinois, Indiana, Michigan, Ohio and Wisconsin
Among the bestBetter than mostAbout averageThe rest
Power Circle Ratings Legend

717
714
699
697
697
690
678
675
635
624
0 200 400 600 800 1000
Charter Spectrum
AT&T/DIRECTV
South Average
Cox Communications
Suddenlink
Comcast (XFINITY)
Cable One
CenturyLink
Frontier Communications
Windstream
J.D. Power2017 U.S. Residential Internet Service Provider Satisfaction
StudySM
Overall Customer Satisfaction Index RankingSouth Region
(Based on a 1,000-point scale)
JDPower.comPower Circle RatingsTM
for consumers:
Source: J.D. Power 2017 U.S. Residential Internet Service Provider Satisfaction StudySM
Charts and graphs extracted from this press release for use by the media must be accompanied by a statement identifying J.D. Power as the publisher and the study from which it originated as the source. Rankings are based on numerical scores, and not necessarily on statistical significance. No advertising or other promotional use can be made of the information in th is release or J.D. Power survey results without the express prior written consent of J.D. Power.
Note: Included in the South Region are Alabama, Arkansas, Florida, Georgia, Kansas, Kentucky, Louisiana, Mississippi, Missouri, North Carolina, Oklahoma, South Carolina, Tennessee and Texas
Among the bestBetter than mostAbout averageThe rest
Power Circle Ratings Legend

706
697
680
679
673
650
624
619
0 200 400 600 800 1000
Cox Communications
AT&T/DIRECTV
Charter Spectrum
Comcast (XFINITY)
West Average
CenturyLink
Frontier Communications
Mediacom Communications
J.D. Power2017 U.S. Residential Internet Service Provider Satisfaction
StudySM
Overall Customer Satisfaction Index RankingWest Region
(Based on a 1,000-point scale)
JDPower.comPower Circle RatingsTM
for consumers:
Source: J.D. Power 2017 U.S. Residential Internet Service Provider Satisfaction StudySM
Charts and graphs extracted from this press release for use by the media must be accompanied by a statement identifying J.D. Power as the publisher and the study from which it originated as the source. Rankings are based on numerical scores, and not necessarily on statistical significance. No advertising or other promotional use can be made of the information in th is release or J.D. Power survey results without the express prior written consent of J.D. Power.
Note: Included in the West Region are Arizona, California, Colorado, Idaho, Iowa, Minnesota, Montana, Nebraska, Nevada, New Mexico, North Dakota, Oregon, South Dakota, Utah, Washington and Wyoming
Among the bestBetter than mostAbout averageThe rest
Power Circle Ratings Legend
757
726
713
704
703
689
680
679
0 200 400 600 800 1000
Verizon
East Average
Cox Communications
Optimum
Comcast (XFINITY)
Charter Spectrum
Frontier Communications
FairPoint Communications
J.D. Power2017 U.S. Residential Telephone Service Provider Satisfaction
StudySM
Overall Customer Satisfaction Index RankingEast Region
(Based on a 1,000-point scale)
JDPower.comPower Circle RatingsTM
for consumers:
Source: J.D. Power 2017 U.S. Residential Telephone Service Provider Satisfaction StudySM
Charts and graphs extracted from this press release for use by the media must be accompanied by a statement identifying J.D. Power as the publisher and the study from which it originated as the source. Rankings are based on numerical scores, and not necessarily on statistical significance. No advertising or other promotional use can be made of the information in th is release or J.D. Power survey results without the express prior written consent of J.D. Power.
Note: Included in the East Region are Connecticut, Delaware, District of Columbia, Maine, Maryland, Massachusetts, New Hampshire, New Jersey, New York, Pennsylvania, Rhode Island, Vermont, Virginia and West Virginia
Among the bestBetter than mostAbout averageThe rest
Power Circle Ratings Legend

733
712
701
696
692
671
657
0 200 400 600 800 1000
AT&T/DIRECTV
North Central Average
Charter Spectrum
Comcast (XFINITY)
CenturyLink
Frontier Communications
WOW! (Wide Open West)
J.D. Power2017 U.S. Residential Telephone Service Provider Satisfaction
StudySM
Overall Customer Satisfaction Index RankingNorth Central Region
(Based on a 1,000-point scale)
JDPower.comPower Circle RatingsTM
for consumers:
Source: J.D. Power 2017 U.S. Residential Telephone Service Provider Satisfaction StudySM
Charts and graphs extracted from this press release for use by the media must be accompanied by a statement identifying J.D. Power as the publisher and the study from which it originated as the source. Rankings are based on numerical scores, and not necessarily on statistical significance. No advertising or other promotional use can be made of the information in th is release or J.D. Power survey results without the express prior written consent of J.D. Power.
Note: Included in the North Central Region are Illinois, Indiana, Michigan, Ohio and Wisconsin
Among the bestBetter than mostAbout averageThe rest
Power Circle Ratings Legend
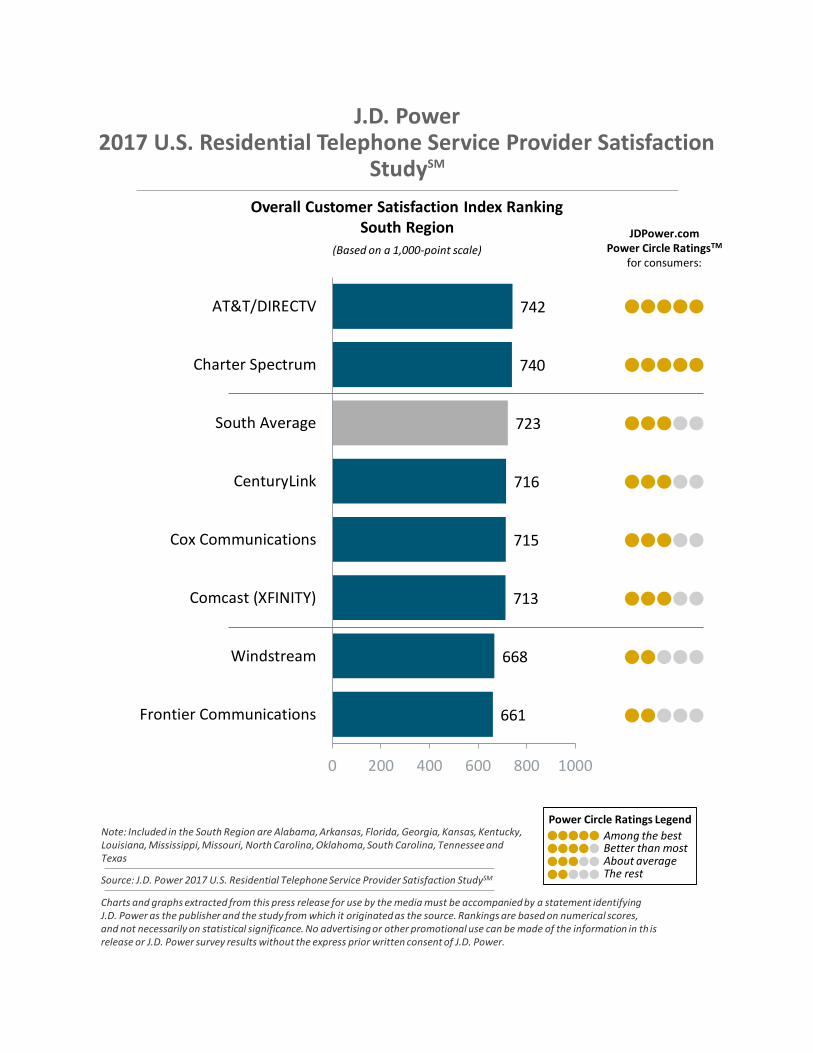
742
740
723
716
715
713
668
661
0 200 400 600 800 1000
AT&T/DIRECTV
Charter Spectrum
South Average
CenturyLink
Cox Communications
Comcast (XFINITY)
Windstream
Frontier Communications
J.D. Power2017 U.S. Residential Telephone Service Provider Satisfaction
StudySM
Overall Customer Satisfaction Index RankingSouth Region
(Based on a 1,000-point scale)
JDPower.comPower Circle RatingsTM
for consumers:
Source: J.D. Power 2017 U.S. Residential Telephone Service Provider Satisfaction StudySM
Charts and graphs extracted from this press release for use by the media must be accompanied by a statement identifying J.D. Power as the publisher and the study from which it originated as the source. Rankings are based on numerical scores, and not necessarily on statistical significance. No advertising or other promotional use can be made of the information in th is release or J.D. Power survey results without the express prior written consent of J.D. Power.
Note: Included in the South Region are Alabama, Arkansas, Florida, Georgia, Kansas, Kentucky, Louisiana, Mississippi, Missouri, North Carolina, Oklahoma, South Carolina, Tennessee and Texas
Among the bestBetter than mostAbout averageThe rest
Power Circle Ratings Legend
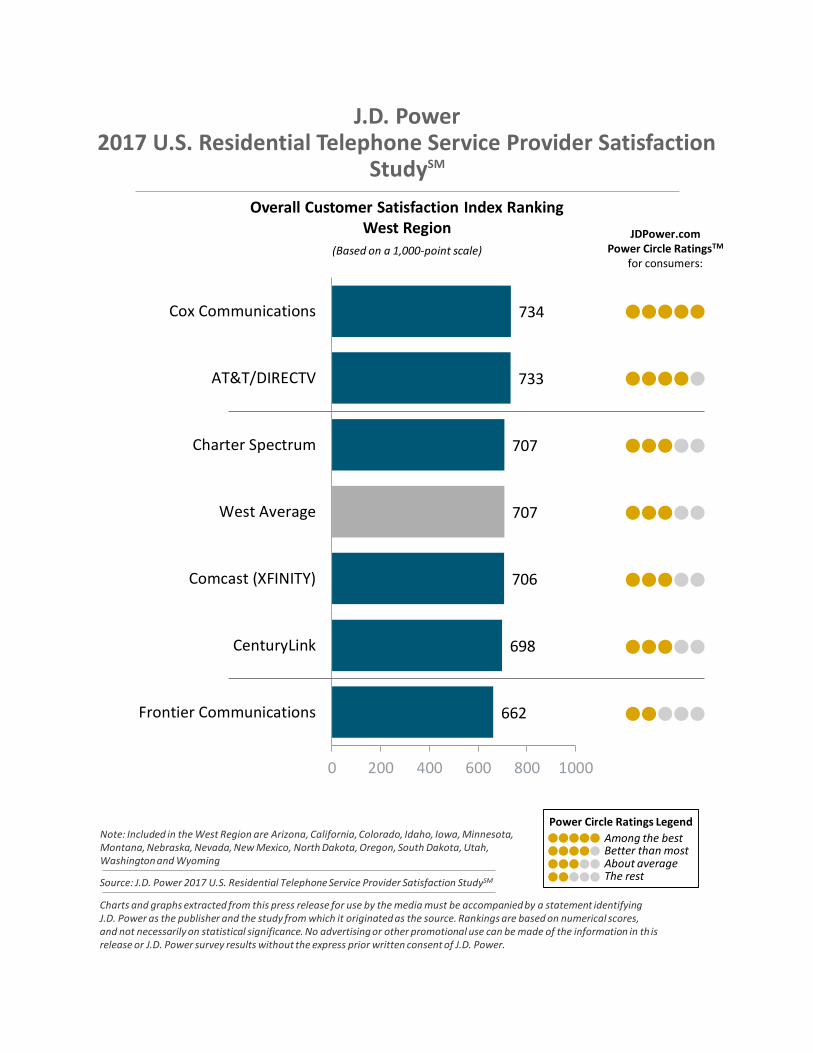
734
733
707
707
706
698
662
0 200 400 600 800 1000
Cox Communications
AT&T/DIRECTV
Charter Spectrum
West Average
Comcast (XFINITY)
CenturyLink
Frontier Communications
J.D. Power2017 U.S. Residential Telephone Service Provider Satisfaction
StudySM
Overall Customer Satisfaction Index RankingWest Region
(Based on a 1,000-point scale)
JDPower.comPower Circle RatingsTM
for consumers:
Source: J.D. Power 2017 U.S. Residential Telephone Service Provider Satisfaction StudySM
Charts and graphs extracted from this press release for use by the media must be accompanied by a statement identifying J.D. Power as the publisher and the study from which it originated as the source. Rankings are based on numerical scores, and not necessarily on statistical significance. No advertising or other promotional use can be made of the information in th is release or J.D. Power survey results without the express prior written consent of J.D. Power.
Note: Included in the West Region are Arizona, California, Colorado, Idaho, Iowa, Minnesota, Montana, Nebraska, Nevada, New Mexico, North Dakota, Oregon, South Dakota, Utah, Washington and Wyoming
Among the bestBetter than mostAbout averageThe rest
Power Circle Ratings Legend
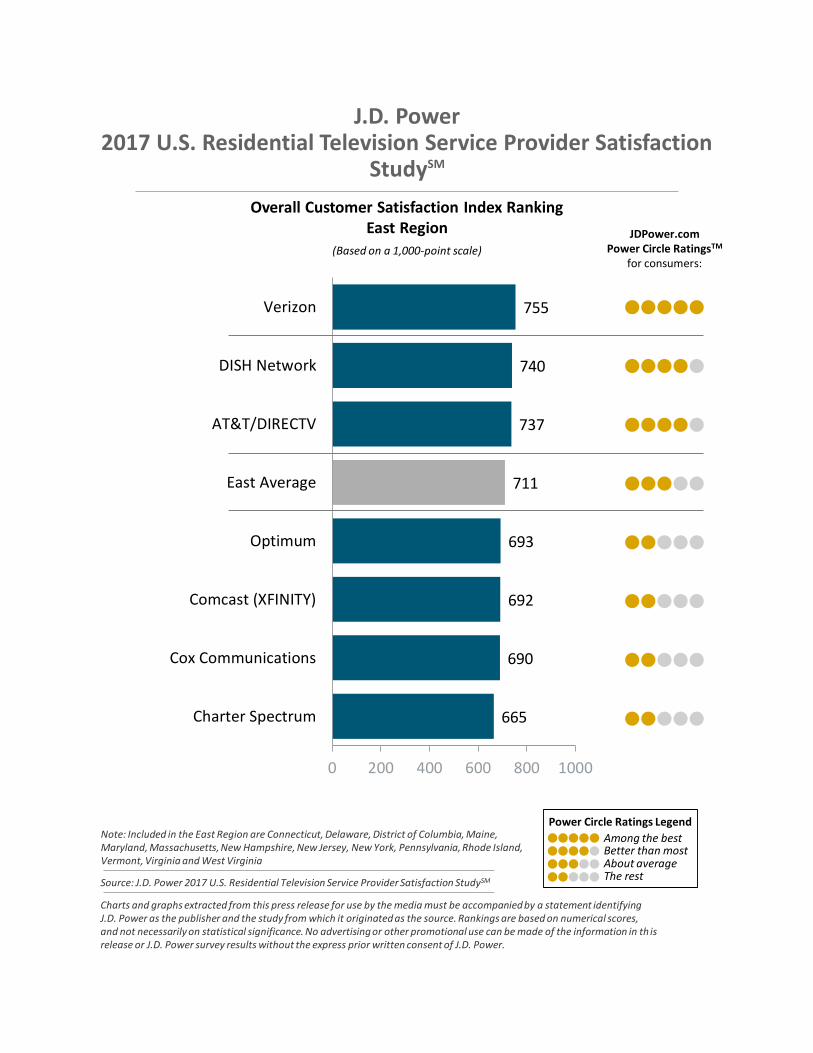
755
740
737
711
693
692
690
665
0 200 400 600 800 1000
Verizon
DISH Network
AT&T/DIRECTV
East Average
Optimum
Comcast (XFINITY)
Cox Communications
Charter Spectrum
J.D. Power2017 U.S. Residential Television Service Provider Satisfaction
StudySM
Overall Customer Satisfaction Index RankingEast Region
(Based on a 1,000-point scale)
JDPower.comPower Circle RatingsTM
for consumers:
Source: J.D. Power 2017 U.S. Residential Television Service Provider Satisfaction StudySM
Charts and graphs extracted from this press release for use by the media must be accompanied by a statement identifying J.D. Power as the publisher and the study from which it originated as the source. Rankings are based on numerical scores, and not necessarily on statistical significance. No advertising or other promotional use can be made of the information in th is release or J.D. Power survey results without the express prior written consent of J.D. Power.
Note: Included in the East Region are Connecticut, Delaware, District of Columbia, Maine, Maryland, Massachusetts, New Hampshire, New Jersey, New York, Pennsylvania, Rhode Island, Vermont, Virginia and West Virginia
Among the bestBetter than mostAbout averageThe rest
Power Circle Ratings Legend

722
721
695
685
671
633
0 200 400 600 800 1000
DISH Network
AT&T/DIRECTV
North Central Average
Comcast (XFINITY)
Charter Spectrum
WOW! (Wide Open West)
J.D. Power2017 U.S. Residential Television Service Provider Satisfaction
StudySM
Overall Customer Satisfaction Index RankingNorth Central Region
(Based on a 1,000-point scale)
JDPower.comPower Circle RatingsTM
for consumers:
Source: J.D. Power 2017 U.S. Residential Television Service Provider Satisfaction StudySM
Charts and graphs extracted from this press release for use by the media must be accompanied by a statement identifying J.D. Power as the publisher and the study from which it originated as the source. Rankings are based on numerical scores, and not necessarily on statistical significance. No advertising or other promotional use can be made of the information in th is release or J.D. Power survey results without the express prior written consent of J.D. Power.
Note: Included in the North Central Region are Illinois, Indiana, Michigan, Ohio and Wisconsin
Among the bestBetter than mostAbout averageThe rest
Power Circle Ratings Legend
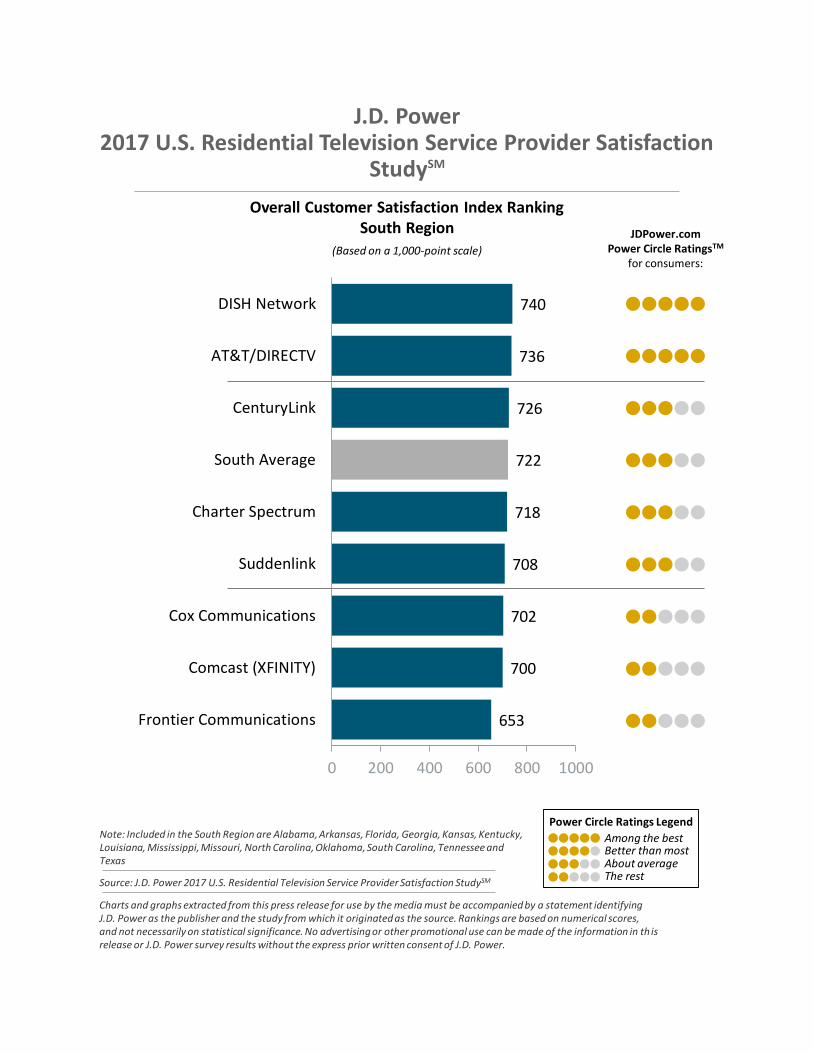
740
736
726
722
718
708
702
700
653
0 200 400 600 800 1000
DISH Network
AT&T/DIRECTV
CenturyLink
South Average
Charter Spectrum
Suddenlink
Cox Communications
Comcast (XFINITY)
Frontier Communications
J.D. Power2017 U.S. Residential Television Service Provider Satisfaction
StudySM
Overall Customer Satisfaction Index RankingSouth Region
(Based on a 1,000-point scale)
JDPower.comPower Circle RatingsTM
for consumers:
Source: J.D. Power 2017 U.S. Residential Television Service Provider Satisfaction StudySM
Charts and graphs extracted from this press release for use by the media must be accompanied by a statement identifying J.D. Power as the publisher and the study from which it originated as the source. Rankings are based on numerical scores, and not necessarily on statistical significance. No advertising or other promotional use can be made of the information in th is release or J.D. Power survey results without the express prior written consent of J.D. Power.
Note: Included in the South Region are Alabama, Arkansas, Florida, Georgia, Kansas, Kentucky, Louisiana, Mississippi, Missouri, North Carolina, Oklahoma, South Carolina, Tennessee and Texas
Among the bestBetter than mostAbout averageThe rest
Power Circle Ratings Legend

726
718
718
699
690
684
659
624
624
0 200 400 600 800 1000
AT&T/DIRECTV
Cox Communications
DISH Network
West Average
Charter Spectrum
Comcast (XFINITY)
CenturyLink
Frontier Communications
Mediacom Communications
J.D. Power2017 U.S. Residential Television Service Provider Satisfaction
StudySM
Overall Customer Satisfaction Index RankingWest Region
(Based on a 1,000-point scale)
JDPower.comPower Circle RatingsTM
for consumers:
Source: J.D. Power 2017 U.S. Residential Television Service Provider Satisfaction StudySM
Charts and graphs extracted from this press release for use by the media must be accompanied by a statement identifying J.D. Power as the publisher and the study from which it originated as the source. Rankings are based on numerical scores, and not necessarily on statistical significance. No advertising or other promotional use can be made of the information in th is release or J.D. Power survey results without the express prior written consent of J.D. Power.
Note: Included in the West Region are Arizona, California, Colorado, Idaho, Iowa, Minnesota, Montana, Nebraska, Nevada, New Mexico, North Dakota, Oregon, South Dakota, Utah, Washington and Wyoming
Among the bestBetter than mostAbout averageThe rest
Power Circle Ratings Legend
731
730
710
694
690
0 200 400 600 800 1000
AT&T/DIRECTV
DISH Network
National Average
Charter Spectrum
Comcast (XFINITY)
J.D. Power2017 U.S. Residential Television Service Provider Satisfaction
StudySM
Overall Customer Satisfaction Index RankingNational
(Based on a 1,000-point scale)
JDPower.comPower Circle RatingsTM
for consumers:
Source: J.D. Power 2017 U.S. Residential Television Service Provider Satisfaction StudySM
Charts and graphs extracted from this press release for use by the media must be accompanied by a statement identifying J.D. Power as the publisher and the study from which it originated as the source. Rankings are based on numerical scores, and not necessarily on statistical significance. No advertising or other promotional use can be made of the information in th is release or J.D. Power survey results without the express prior written consent of J.D. Power.
Note: Included in the average but not ranked due to insufficient market share in one or more regions are CenturyLink, Cox Communications, Frontier Communications, Mediacom Communications, Optimum, Suddenlink, Verizon and WOW! (Wide Open West)
Among the bestBetter than mostAbout averageThe rest
Power Circle Ratings Legend

J.D. Power 2017 U.S. Residential Internet Service Provider Satisfaction StudySM;
J.D. Power 2017 U.S. Residential Telephone Service Provider Satisfaction StudySM;
J.D. Power 2017 U.S. Residential Television Service Provider Satisfaction StudySM
Award-Eligible Wireline Providers Included in the Studies
Sources: J.D. Power 2017 U.S. Residential Internet Service Provider Satisfaction StudySM;J.D. Power 2017 U.S. Residential Telephone Service Provider Satisfaction StudySM;J.D. Power 2017 U.S. Residential Television Service Provider Satisfaction StudySM
Charts and graphs extracted from this press release for use by the media must be accompanied by a statement identifying J.D. Power as the publisher and the study from which it originated as the source. Rankings are based on numerical scores, and not necessarily on statistical significance. No advertising or other promotional use can be made of the information in th is release or J.D. Power survey results without the express prior written consent of J.D. Power.
Company Name CEO Name Company Location
AT&T/DIRECTV Randall Stephenson Dallas, Texas
Cable One Julie Laulis Phoenix, Ariz.
CenturyLink Glen Post III Monroe, La.
Charter Spectrum Tom Rutledge Stamford, Conn.
Comcast (XFINITY) David N. Watson Philadelphia, Pa.
Cox Communications Alexander C. Taylor Atlanta, Ga.
DISH Network Charlie Ergen Englewood, Colo.
FairPoint Communications Bob Udell Charlotte, N.C.
Frontier Communications Daniel J. McCarthy Norwalk, Conn.
Mediacom Communications Rocco B. Commisso Mediacom Park, N.Y.
Optimum Dexter Goei Bethpage, N.Y.
Suddenlink Dexter Goei Bethpage, N.Y.
Verizon Lowell McAdam New York City, N.Y.
Windstream Anthony W. Thomas Little Rock, Ark.
WOW! (Wide Open West) Steven Cochran Englewood, Colo.