Embed Size (px)
Citation preview

Operation & Installation Manual V12-V6 2010-05-31.doc 31/05/2010 1/60
ALTOSONIC V12 / OPTISONIC V6
Operation and Installation Manual
Operation & Installation Manual V12-V6 2010-05-31.doc 31/05/2010 2/60
Disclaimer (liability) KROHNE is not liable for any damage of any kind by use of the product described in this manual, including, but not limited to direct, indirect, incidental, punitive and consequential damages. This disclaimer does not apply in case KROHNE has acted on purpose or with gross negligence. In the event any applicable law does not allow such limitations on implied warranties or the exclusion of limitation of certain damages, you may, if such law applies to you, not be subject to some or the entire disclaimer, exclusions or limitations. This document contains important information about the product. KROHNE attempts to be as accurate and up-to-date as possible but accepts no responsibility for errors or omissions. Although KROHNE does not make any commitment to update the information in this document, KROHNE reserves the right to alter the content of its documents, including this disclaimer in any way, at any time, for any reason, without prior notification, and will not be liable in any way for possible consequences of such changes. This is not a controlled document: owners of this document can not claim that KROHNE is responsible for replacing this document in case an updated version becomes available.
Limited Warranty Any product purchased from KROHNE is warranted in accordance with the relevant product documentation and our Terms and Conditions of Sale. Improper installation and operation of the product, repairs by persons not adequately trained and not authorized by KROHNE or repairs using parts not approved or not provided by KROHNE, may cause loss of warranty. Deterioration of the product due to normal usage (“wear and tear”) will not entitle to claim repair work and/or replacement of parts under conditions of warranty. All rights reserved. It is prohibited to reproduce this documentation or any part thereof, without the prior written authorisation of KROHNE Messtechnik GmbH & Co. KG. Subject to change without notice. Copyright 2008 by KROHNE Messtechnik GmbH & Co. KG . Ludwig-Krohne-Straße 5 . 47058 Duisburg
Operation & Installation Manual V12-V6 2010-05-31.doc 31/05/2010 3/60
Table of Content: Disclaimer (liability) ............................................................................................................... 2
Limited Warranty ................................................................................................................... 2
Table of Content:................................................................................................................... 3
1 General instructions....................................................................................................... 5
1.1 Intended use. ......................................................................................................... 5
1.2 Certification and applicable standards.................................................................... 5
1.3 Information concerning the documentation............................................................. 6
1.3.1. Important information regarding safety. .......................................................... 6
1.4 Display conventions ............................................................................................... 6
1.5 Safety instructions.................................................................................................. 7
1.1.1. Transportation and handling........................................................................... 7
1.5.1. Explosion safety instructions. ......................................................................... 7
2 Instrument description ................................................................................................... 8
2.1 Measuring principle................................................................................................ 8
2.1.1. Transit time measuring principle..................................................................... 8
2.1.2. Swirl compensation. ....................................................................................... 9
2.1.3. Multipath ultrasonic flow meters ....................................................................10
2.2 General description. ..............................................................................................11
2.3 Detailed description ..............................................................................................12
2.3.1. Ultrasonic transducer ....................................................................................12
2.3.2. ALTOSONIC V12 Meter body .......................................................................13
2.3.3. ALTOSONIC V12 signal converter ................................................................14
2.3.4. Signal converter enclosure ............................................................................14
2.3.5. Main Board Assembly ...................................................................................16
2.4 Software................................................................................................................16
2.4.1. Configuration file. ..........................................................................................16
2.4.2. Start up .........................................................................................................17
2.4.3. The basic transit time measuring process. ....................................................17
2.4.4. The flow calculation module. .........................................................................18
2.4.5. The signal output module ..............................................................................19
2.4.6. Path substitution............................................................................................21
2.4.7. Write protect lock...........................................................................................21
2.4.8. Sealing requirements for fiscal Use ...............................................................21
3 Before installation .........................................................................................................22
3.1 Inspection received products.................................................................................22
3.1.1. Packing and transportation............................................................................22
3.1.2. Scope of delivery...........................................................................................22
3.1.3. Name plate....................................................................................................22
3.1.4. Visual check ..................................................................................................22
3.2 Storage .................................................................................................................22
3.3 Environmental Requirements ................................................................................23
3.4 Installation requirements .......................................................................................24
3.4.1. Pipe diameters and lengths ...........................................................................24
3.4.2. Flow conditioners. .........................................................................................24
3.4.3. Control valves ...............................................................................................24
4 Installation of the ultrasonic gas flow meter ..................................................................25
5 Electrical Installation .....................................................................................................26
5.1 Safety instructions.................................................................................................26
5.2 Electronics enclosure and cable entries ................................................................26
5.3 Electrical connections ...........................................................................................26
5.3.1. Power connection..........................................................................................26
5.3.2. Digital I/O connections. .................................................................................27

Operation & Installation Manual V12-V6 2010-05-31.doc 31/05/2010 4/60
5.3.2.1. Pulse/Frequency output,........................................................................28
5.3.2.2. Status outputs........................................................................................28
5.3.3. Serial data communication (RS485) ..............................................................29
5.3.4. Serial communication (USB) .........................................................................30
5.3.5. TCP/IP communication..................................................................................30
5.4 Cabling .................................................................................................................30
5.5 Ground connection................................................................................................31
6 Operation of the ultrasonic gas flow meter. ...................................................................32
6.1 Start up .................................................................................................................32
6.2 Display and Operating Elements...........................................................................32
6.3 Available display information.................................................................................33
6.4 Operating the display ............................................................................................33
7 Software Service Tool...................................................................................................35
7.1 Introduction ...........................................................................................................35
7.2 Starting a session .................................................................................................35
7.2.1. Connecting....................................................................................................35
7.2.2. User views.....................................................................................................37
7.2.3. loading monitoring configuration....................................................................38
7.2.4. start up user views automatically...................................................................39
7.2.5. Viewing Data Unformatted.............................................................................40
7.2.6. Creating Reports. ..........................................................................................41
7.2.6.1. Reporting related to calibration parameter settings. ...............................42
7.2.6.2. Create a file listing the parameters in CSV format: ................................44
7.2.6.3. Saving a parameter file in .XML format..................................................44
7.2.6.4. Reporting related to process values.......................................................45
7.3 Logging data from a flow meter.............................................................................45
7.4 Adjusting Meter factor (For Authorised personnel only).........................................46
8 Maintenance.................................................................................................................49
8.1 Periodic maintenance............................................................................................49
8.2 Cleaning................................................................................................................49
8.3 Exchange of transducers ......................................................................................49
8.3.1. Exchange of Transducers - Depressurised Condition....................................49
8.3.2. Exchange of Transducers - Pressurised Condition ........................................50
8.4 Exchange of Electronics Unit ................................................................................51
8.5 Battery maintenance .............................................................................................53
8.6 Spare Parts Availability .........................................................................................54
8.7 Service Availability ................................................................................................54
8.8 Returning a Device to the Manufacturer................................................................54
8.8.1. General Information.......................................................................................54
8.9 Disposal ................................................................................................................54
8.10 KROHNE Care...................................................................................................55
9 Technical specifications................................................................................................56
10 Marks and Seals .......................................................................................................57
Operation & Installation Manual V12-V6 2010-05-31.doc 31/05/2010 5/60
1 General instructions.
1.1 Intended use. The ALTOSONIC V12 is a gas flow meter designed for custody transfer applications. Generally speaking, the meter operates within the relevant accuracy limits for all kinds of gases, although there may be some exceptions. A major field of application is measuring natural gas, the meter is suitable to operate at least under the following conditions: * relative density from 0.55 and upwards * methane concentrations 75…100% * presence of higher hydrocarbons, nitrogen, carbon dioxide, hydrogen, noble gases * small amounts of other components, e.g. sulphur components, condensates, traces of oil mixed with mill-scale, dirt or sand
NOTE!:
The presence of some components in the gas can influence the performance of the meter. In particular, due to its acoustic absorption properties, high levels of CO2 may influence and even inhibit the operation of an UFM. It is recommended to submit a specification of the medium to be measured at the manufacturer for advice.
NOTE!
If possible, avoid the installation of an ultrasonic gas flow meter in close vicinity to a pressure regulating valve. Especially when operating at a high pressure differential, a pressure regulator may produce a high level of ultrasonic noise. In extreme cases this can be a problem for the operation of the ultrasonic gas flow meter. In case of doubt consult the manufacturer.
1.2 Certification and applicable standards. INFORMATION!
The ALTOSONIC V12 custody transfer gas flow meter meets the technical requirements and standards applicable to equipment designed for use in different countries world wide. EU (European Union):
• Pressure Equipment Directive 97/23/EC
• EMC Directive 2004/108/EC (former 89/336/EC and 93/68/EC), according to: EN 50081-2 EN 61000-6 (part 1, 2 and 3) EN 61326-1 (1997) and A1 (1998), A2 (2001)
• Low-Voltage Directives 2006/95/EC (former 73/23/EEC and 93/68/EEC) according to: EN 61010-1:2001
• The ALTOSONIC V12 is certified for use in potentially explosive atmospheres according to the ATEX directive 94/9/EC following standards as: EN 60079-1 (Ex ‘d’) EN 60079/ -7 (Ex ‘e’) EN 60079-18 (Ex ‘ma’)

Operation & Installation Manual V12-V6 2010-05-31.doc 31/05/2010 6/60
America:
• The ALTOSONIC V12 is certified for use in potentially explosive atmospheres according to FM with following standards as: FM3600 FM3615
Canada:
• CRN
• The ALTOSONIC V12 is certified for use in potentially explosive atmospheres according to CSA with following standards as: C22.2 No. 30 C22.2 No. 0.4
Other Standards/Countries:
• Australia IECEx PTB 10.0013X • Algeria: No005/DIR/ONML/10DU 07/02/2010
• China: PAC 2009-F265
• Malaysia Sirim
• Singapore Spring
1.3 Information concerning the documentation.
1.3.1. Important information regarding safety.
To prevent any risk regarding the safety of operators and in order avoid damage to the flow meter or other equipment, it is essential that you read the information in this document carefully. Also observe applicable national standards, safety requirements and accident prevention regulations. If this document is not in your native language or if you have any problems understanding the text, we advise you to contact your local KROHNE office for assistance. KROHNE cannot accept responsibility for any damage or injury caused by misunderstanding of the information in this document. This document is provided to help you establish operating conditions, which will permit safe and efficient use of this flow meter. Special considerations and precautions are also described in the document, pictograms as shown below are used to focus attention to these sections.
1.4 Display conventions The following symbols are used to help you navigate this documentation more easily:
These warning signs must be observed without fail. Even only partial disregarding such warnings can result in serious health damage, damage to the flow meter itself or to parts of the operator’s plant.
This symbol designates safety advice on handling electricity.

Operation & Installation Manual V12-V6 2010-05-31.doc 31/05/2010 7/60
This symbol designates important information for the handling of the device.
This symbol designates information on statutory directives and standards.
This symbol designates all instructions for actions to be carried out by the operator in the specified sequence.
1.5 Safety instructions CAUTION!
In general, devices from KROHNE should only be installed, commissioned, operated and maintained by properly trained and authorized personnel. This document is provided to help you establish operating conditions, which will permit safe and efficient use of this device. It is recommended to read this manual carefully before installing and operating the instrument. Especially the sections regarding safety, marked with icons as WARNING, DANGER or CAUTION should be regarded.
1.1.1. Transportation and handling
CAUTION!
• Even smaller size flow meters have a considerable weight. Check the weight of your flow meter in order to select suitable means for transportation and lifting.
• Use appropriate materials such as chains or hoisting straps that are in good condition.
• Use the eye bolts on the meter body to attach chains or straps for lifting the meter (if not present: Check condition of the threaded holes on the flanges and if okay screw eye bolts in the threaded holes).
• Never lift the meter using the electronic enclosure to attach straps.
• Never allow the weight of the meter to rest on the metal sheet enclosure of the measuring section (the section in the middle) of the meter.
• In case a fork lift will be used make sure the flow meter is secured against rolling off the forks, or against straps sliding off the forks.
• Verify local safety regulations, directives and company procedures with respect to hoisting, rigging and transportation of (heavy) equipment.
1.5.1. Explosion safety instructions.
WARNING!
When the meter is operated or being installed in a potentially explosive atmosphere, consult the manual with instructions regarding explosion safety that is distributed separately. In case you have not received this document, please contact your local KROHNE office in order to get a copy of this document.
Operation & Installation Manual V12-V6 2010-05-31.doc 31/05/2010 8/60
2 Instrument description
2.1 Measuring principle The ALTOSONIC V12 ultrasonic gas flow meter operates according to the principle of measuring the transit time of an ultrasonic sound wave. A gas velocity is derived from the difference in transit time of a sound wave travelling in a direction with the flow direction and the sound wave travelling in the opposite direction. The trajectory of the sound wave is called the acoustic path. A chord is the direct path crossing the pipe from one side to the opposite side. Using reflection, an acoustic path can consist of two or more chords. The name ALTOSONIC V12 is related to its design where 12 chords build 6 acoustic paths.
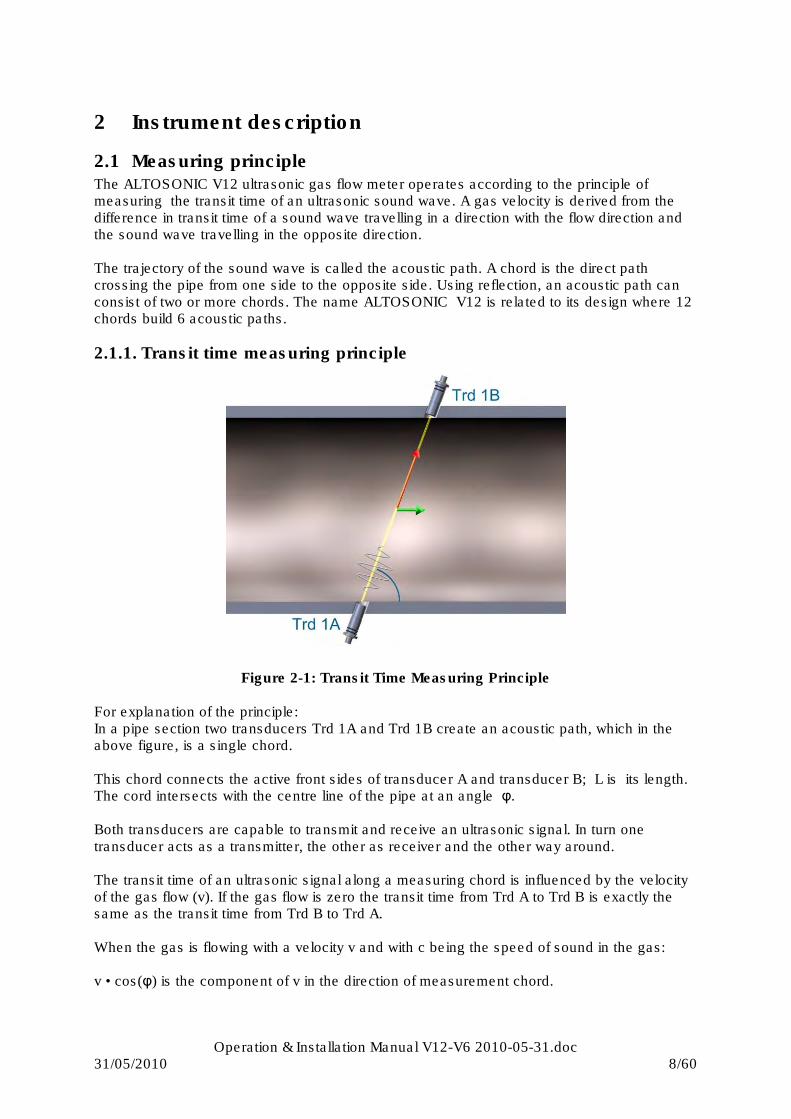
2.1.1. Transit time measuring principle
Figure 2-1: Transit Time Measuring Principle For explanation of the principle: In a pipe section two transducers Trd 1A and Trd 1B create an acoustic path, which in the above figure, is a single chord. This chord connects the active front sides of transducer A and transducer B; L is its length. The cord intersects with the centre line of the pipe at an angle φ. Both transducers are capable to transmit and receive an ultrasonic signal. In turn one transducer acts as a transmitter, the other as receiver and the other way around. The transit time of an ultrasonic signal along a measuring chord is influenced by the velocity of the gas flow (v). If the gas flow is zero the transit time from Trd A to Trd B is exactly the same as the transit time from Trd B to Trd A. When the gas is flowing with a velocity v and with c being the speed of sound in the gas: v • cos(φ) is the component of v in the direction of measurement chord.

Operation & Installation Manual V12-V6 2010-05-31.doc 31/05/2010 9/60
This component increases or decreases the speed of the sound wave as it moves from one transducer to the other transducer. The transit time from Trd A to Trd B (tAB) is:
(1)
In opposite direction (from Trd B to Trd A) the transit time (tBA) becomes:
(2)
The velocity of gas is derived from formula (1) and (2) as : (3)
An important feature of this method is that the calculated gas velocity does not depend on the speed of sound in the gas or gas properties in general. The gas velocity as calculated is only a function of the measured transit times tAB and tBA; the length of the chord and the angle of intersection of the measuring chord are supposed to be known from the design of the flow meter. As a “bonus” the speed of sound in the gas can also be derived from formula (1) and (2) as :
(4)
This gives a measured speed of sound value, a valuable tool for diagnostic purposes, as it can be compared with data from other sources.
2.1.2. Swirl compensation.
Symmetrical swirl.
Figure 2-2: Symmetrical swirl
ϕcos⋅+=
vc
Lt
AB
ϕcos⋅−=
vc
Lt
BA
−⋅
⋅=
BAABtt
Lv
11
cos2 ϕ
+⋅=
BAABtt
Lc
11
2
Operation & Installation Manual V12-V6 2010-05-31.doc 31/05/2010 10/60
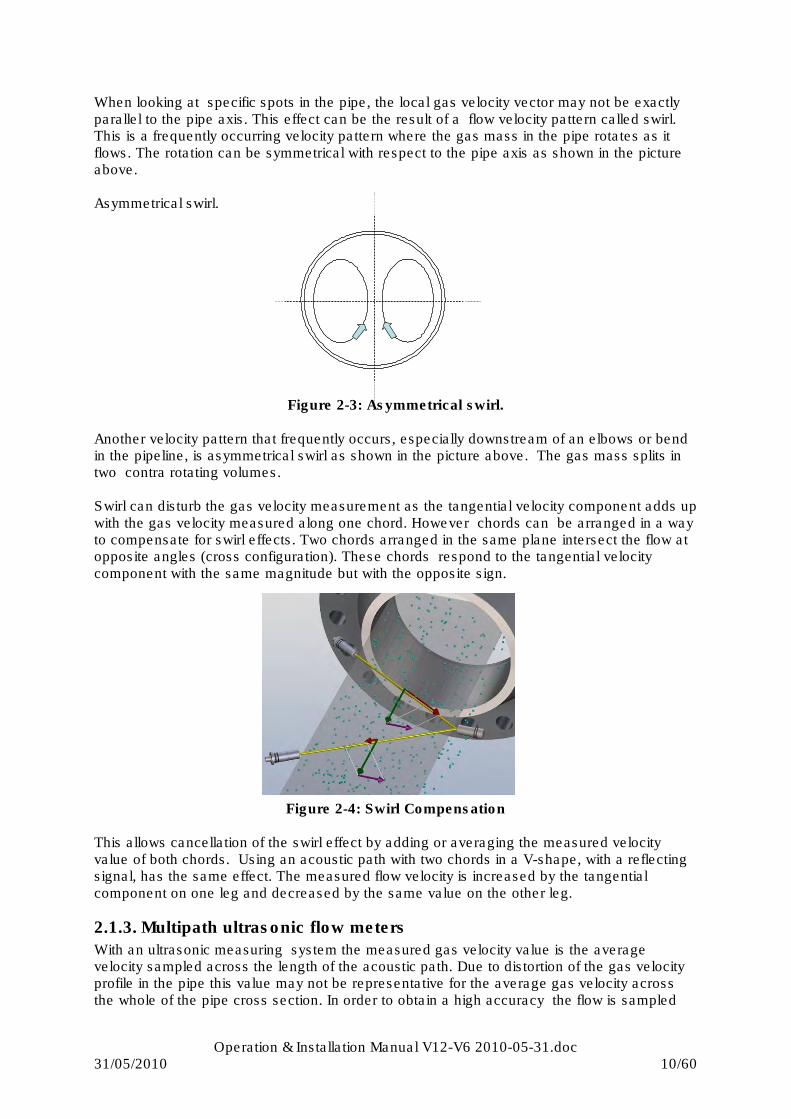
When looking at specific spots in the pipe, the local gas velocity vector may not be exactly parallel to the pipe axis. This effect can be the result of a flow velocity pattern called swirl. This is a frequently occurring velocity pattern where the gas mass in the pipe rotates as it flows. The rotation can be symmetrical with respect to the pipe axis as shown in the picture above. Asymmetrical swirl.
Figure 2-3: Asymmetrical swirl. Another velocity pattern that frequently occurs, especially downstream of an elbows or bend in the pipeline, is asymmetrical swirl as shown in the picture above. The gas mass splits in two contra rotating volumes. Swirl can disturb the gas velocity measurement as the tangential velocity component adds up with the gas velocity measured along one chord. However chords can be arranged in a way to compensate for swirl effects. Two chords arranged in the same plane intersect the flow at opposite angles (cross configuration). These chords respond to the tangential velocity component with the same magnitude but with the opposite sign.
Figure 2-4: Swirl Compensation This allows cancellation of the swirl effect by adding or averaging the measured velocity value of both chords. Using an acoustic path with two chords in a V-shape, with a reflecting signal, has the same effect. The measured flow velocity is increased by the tangential component on one leg and decreased by the same value on the other leg.
2.1.3. Multipath ultrasonic flow meters
With an ultrasonic measuring system the measured gas velocity value is the average velocity sampled across the length of the acoustic path. Due to distortion of the gas velocity profile in the pipe this value may not be representative for the average gas velocity across the whole of the pipe cross section. In order to obtain a high accuracy the flow is sampled
Operation & Installation Manual V12-V6 2010-05-31.doc 31/05/2010 11/60
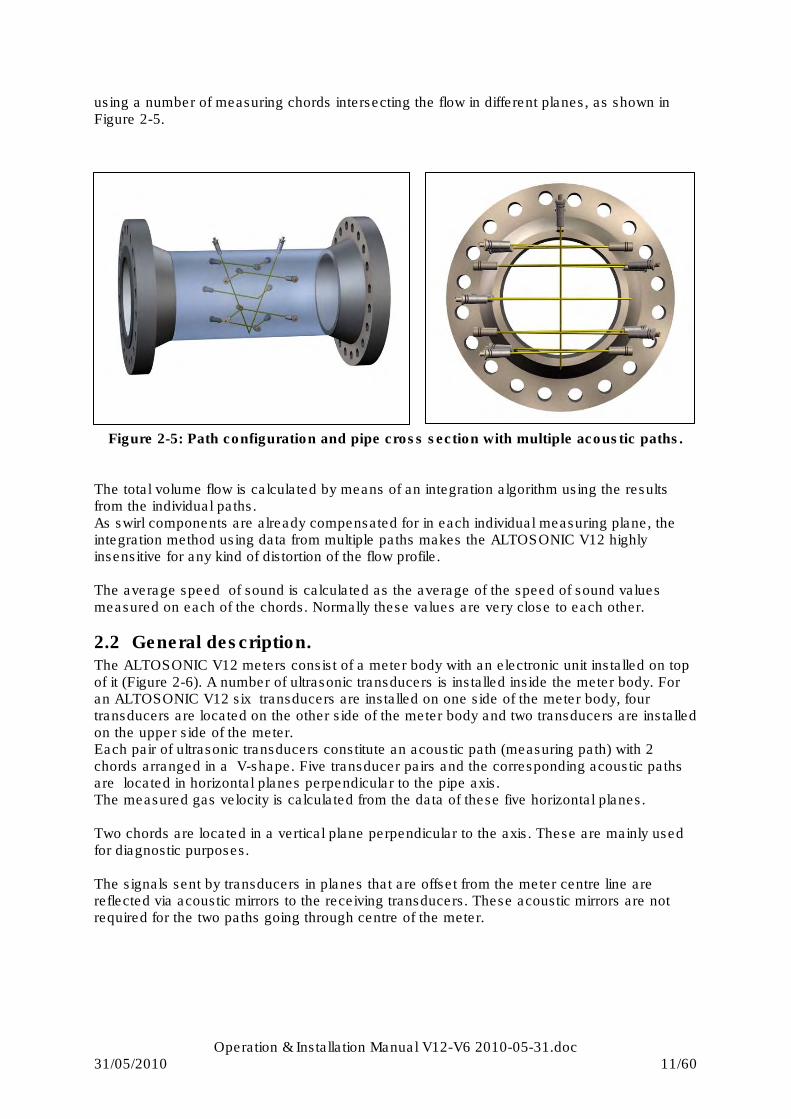
using a number of measuring chords intersecting the flow in different planes, as shown in Figure 2-5.
Figure 2-5: Path configuration and pipe cross section with multiple acoustic paths. The total volume flow is calculated by means of an integration algorithm using the results from the individual paths. As swirl components are already compensated for in each individual measuring plane, the integration method using data from multiple paths makes the ALTOSONIC V12 highly insensitive for any kind of distortion of the flow profile. The average speed of sound is calculated as the average of the speed of sound values measured on each of the chords. Normally these values are very close to each other.
2.2 General description. The ALTOSONIC V12 meters consist of a meter body with an electronic unit installed on top of it (Figure 2-6). A number of ultrasonic transducers is installed inside the meter body. For an ALTOSONIC V12 six transducers are installed on one side of the meter body, four transducers are located on the other side of the meter body and two transducers are installed on the upper side of the meter. Each pair of ultrasonic transducers constitute an acoustic path (measuring path) with 2 chords arranged in a V-shape. Five transducer pairs and the corresponding acoustic paths are located in horizontal planes perpendicular to the pipe axis. The measured gas velocity is calculated from the data of these five horizontal planes. Two chords are located in a vertical plane perpendicular to the axis. These are mainly used for diagnostic purposes. The signals sent by transducers in planes that are offset from the meter centre line are reflected via acoustic mirrors to the receiving transducers. These acoustic mirrors are not required for the two paths going through centre of the meter.

Operation & Installation Manual V12-V6 2010-05-31.doc 31/05/2010 12/60
Figure 2-6: Location of sensors and electronics of an ALTOSONIC V12 The transducers are electrically connected to the electronic unit on top of the meter by means of coaxial cables. The cabling is protected against mechanical damage and moisture by means of covers or a case that is welded around part of the meter body.
The coaxial cables enter the electronics enclosure through its “foot” (or support). In this foot an Ex d approved cable feed through is installed that closes this entry to the electronics enclosure Figure 2-11.
2.3 Detailed description
2.3.1. Ultrasonic transducer
Acoustic signals are transmitted and acoustic signals are received by means of ultrasonic transducers. The active part of an ultrasonic transducer is a small disk of piëzo electric ceramic in the front of the transducer. It is packaged (sealed) in a construction of metal parts and high grade epoxy. The front side of the transducer is exposed to the fluid to be measured, this results in the best efficiency for transmitting and receiving ultrasound. The electrical signals are connected to the piëzo electric disk by means of a glass sealed feed through. This provides for an effective sealing of gas at high pressure. The transducers have an Ex-d connector (socket, ref 1. Figure 2-7) that connects to a to an Ex d connector (plug, ref 2.) which terminates a coaxial wire (ref 3.) A pin (ref 4.) on the connector engages with a slot in the socket (ref 5.), this makes sure the transducer is connected with the correct polarity. The cap (ref 6.), screwed onto the socket, fastens the connector, a small screw (M2) (ref 7.) secures this cap. The transducers are fastened in the meter body using a nut with a hole in the centre (ref 8.) A double O-ring (ref. 9) seals the pressure inside the piping effectively from the outside world.

Operation & Installation Manual V12-V6 2010-05-31.doc 31/05/2010 13/60
Figure 2-7: sensor & connector assembly
The transducers are designed to meet the requirements for explosion safety according the European standards EN 60079-18 Encapsulated “ma” EN 60079-1 Flameproof “d” and are marked accordingly as Ex II 2 G Ex d ma IIC T5 The transducers are approved by KEMA with certificate number KEMA 07ATEX0181 X Regarding temperature, the transducers are predominantly exposed to the temperature of the flowing medium (gas). The transducers are designed and approved for a temperature range of -40 C up to +50 C (+70 C pending, type G5) and -40 C up to +100 C (type G6)
2.3.2. ALTOSONIC V12 Meter body
The meter body of the ALTOSONIC V12 can be designed and manufactured according to either one of two different concepts, depending of the nominal diameter. For smaller meters (typically smaller than 12 inch diameter – but not limiting) the meter body is manufactured from a single piece of metal. This piece of metal is machined to a conduit for the gas flow. Holes are machined to accommodate the transducers. Covers are bolted on top and on both sides of the meter body to protect the transducers and the wiring of the transducers. The covers can be disassembled to give access to the transducers for inspection, service or repair work.
Figure 2-8 show a meter body according to this first concept (covers and electronics enclosure partly “cut away”, cabling not shown). Larger meters (typically larger than 12 inch – but not limiting) are manufactured using a piece of pipe and flanges that are welded together. “Nozzles” are welded onto the pipe to accommodate the transducers. To protect the transducers and wiring, a case is welded around the area where the nozzles are located. This case may have bolted covers that can be disassembled to give access to the transducers for inspection, service or repair work.
5
2
34
1 6 7 89
5
2
34
1 6 7 8
5
2
34
1 6 7 89
Operation & Installation Manual V12-V6 2010-05-31.doc 31/05/2010 14/60
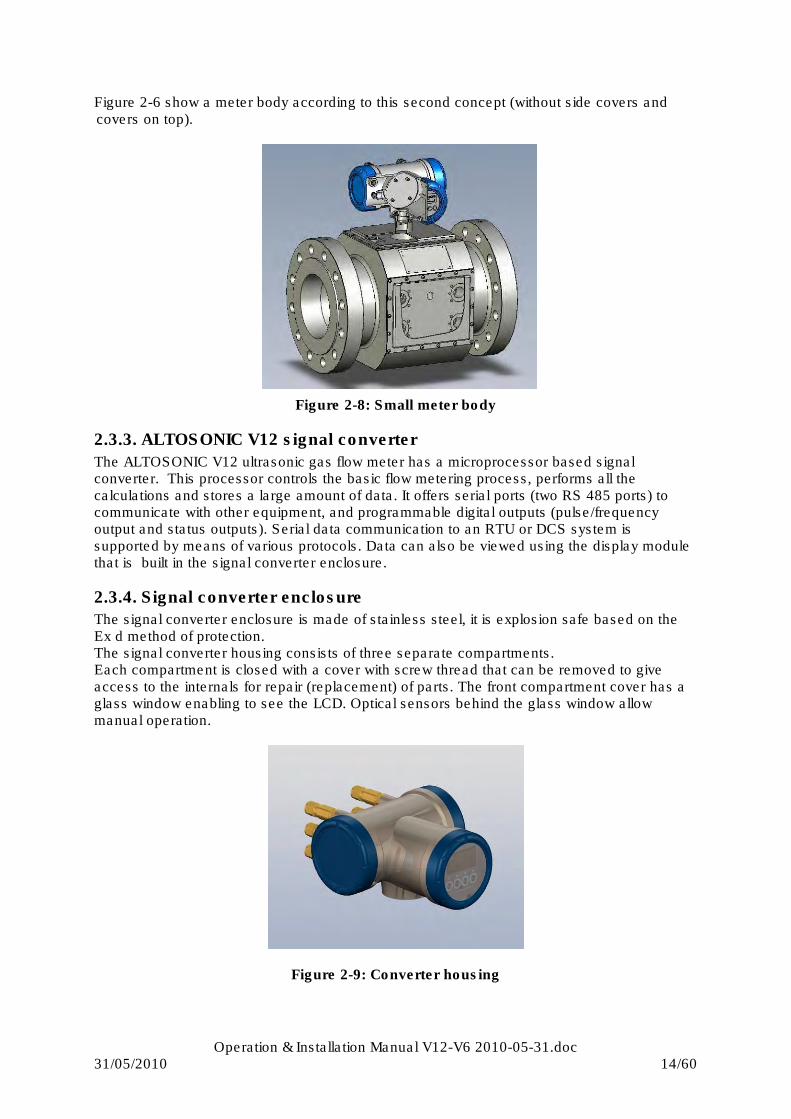
Figure 2-6 show a meter body according to this second concept (without side covers and covers on top).
Figure 2-8: Small meter body
2.3.3. ALTOSONIC V12 signal converter
The ALTOSONIC V12 ultrasonic gas flow meter has a microprocessor based signal converter. This processor controls the basic flow metering process, performs all the calculations and stores a large amount of data. It offers serial ports (two RS 485 ports) to communicate with other equipment, and programmable digital outputs (pulse/frequency output and status outputs). Serial data communication to an RTU or DCS system is supported by means of various protocols. Data can also be viewed using the display module that is built in the signal converter enclosure.
2.3.4. Signal converter enclosure
The signal converter enclosure is made of stainless steel, it is explosion safe based on the Ex d method of protection. The signal converter housing consists of three separate compartments. Each compartment is closed with a cover with screw thread that can be removed to give access to the internals for repair (replacement) of parts. The front compartment cover has a glass window enabling to see the LCD. Optical sensors behind the glass window allow manual operation.
Figure 2-9: Converter housing
Operation & Installation Manual V12-V6 2010-05-31.doc 31/05/2010 15/60
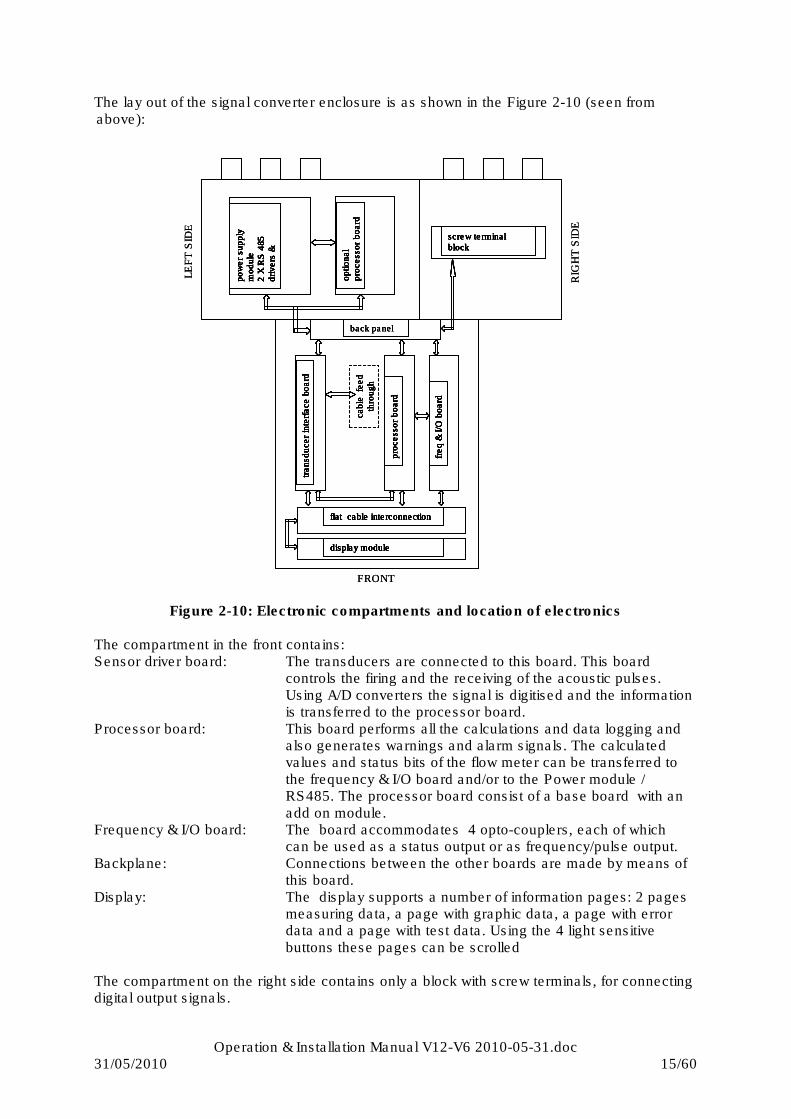
The lay out of the signal converter enclosure is as shown in the Figure 2-10 (seen from above):
Figure 2-10: Electronic compartments and location of electronics The compartment in the front contains: Sensor driver board: The transducers are connected to this board. This board
controls the firing and the receiving of the acoustic pulses. Using A/D converters the signal is digitised and the information is transferred to the processor board.
Processor board: This board performs all the calculations and data logging and also generates warnings and alarm signals. The calculated values and status bits of the flow meter can be transferred to the frequency & I/O board and/or to the Power module / RS485. The processor board consist of a base board with an add on module.
Frequency & I/O board: The board accommodates 4 opto-couplers, each of which can be used as a status output or as frequency/pulse output.
Backplane: Connections between the other boards are made by means of this board.
Display: The display supports a number of information pages: 2 pages measuring data, a page with graphic data, a page with error data and a page with test data. Using the 4 light sensitive buttons these pages can be scrolled
The compartment on the right side contains only a block with screw terminals, for connecting digital output signals.
back panel
screw terminal
block
flat cable interconnection
display module
transd
ucer
inte
rface b
oa
rd
pro
cess
or
board
freq &
I/O
board
cable
fe
ed
thro
ugh
optional
pro
cess
or
board
pow
er
supply
module
2 X
RS
485
drivers
&
FRONT
LE
FT
SID
E
RIG
HT
SID
E
back panel
screw terminal
block
flat cable interconnection
display module
transd
ucer
inte
rface b
oa
rd
pro
cess
or
board
freq &
I/O
board
cable
fe
ed
thro
ugh
optional
pro
cess
or
board
pow
er
supply
module
2 X
RS
485
drivers
&
back panelback panel
screw terminal
block
flat cable interconnection
display module
transd
ucer
inte
rface b
oa
rd
pro
cess
or
board
freq &
I/O
board
cable
fe
ed
thro
ugh
optional
pro
cess
or
board
pow
er
supply
module
2 X
RS
485
drivers
&
screw terminal
block
flat cable interconnection
display module
transd
ucer
inte
rface b
oa
rd
pro
cess
or
board
freq &
I/O
board
cable
fe
ed
thro
ugh
optional
pro
cess
or
board
pow
er
supply
module
2 X
RS
485
drivers
&
screw terminal
block
screw terminal
block
flat cable interconnection
display module
flat cable interconnectionflat cable interconnection
display moduledisplay module
transd
ucer
inte
rface b
oa
rd
pro
cess
or
board
freq &
I/O
board
cable
fe
ed
thro
ugh
transd
ucer
inte
rface b
oa
rdtr
ansd
ucer
inte
rface b
oa
rd
pro
cess
or
board
pro
cess
or
board
freq &
I/O
board
freq &
I/O
board
cable
fe
ed
thro
ugh
optional
pro
cess
or
board
pow
er
supply
module
2 X
RS
485
drivers
&
optional
pro
cess
or
board
optional
pro
cess
or
board
pow
er
supply
module
2 X
RS
485
drivers
&
pow
er
supply
module
2 X
RS
485
drivers
&
FRONT
LE
FT
SID
E
RIG
HT
SID
E
Operation & Installation Manual V12-V6 2010-05-31.doc 31/05/2010 16/60
The compartment on the left side contains the power supply / RS485 module. Two RS 485 serial communication ports and the power supply are integrated on this circuit board. Space is available to accommodate an optional printed circuit board for future expansion of functionality. External connections are made using edge connectors with screw terminals that connect to the printed circuit board.
2.3.5. Main Board Assembly
The main part of the signal processing consists of a number of printed circuit boards packaged in a carrier frame. The boards contained in this frame are:
• an input / output board
• the main processor board
• the sensor driver board Attached to this frame is also the LCD display module (at the front). The front compartment contains guides that allow the frame to slide into or out of the enclosure (when the cover is opened and after releasing the bolts).This unit connects to a printed circuit board in the back of the compartment. From this back plane the wiring connects to the other compartment and the main terminal block.
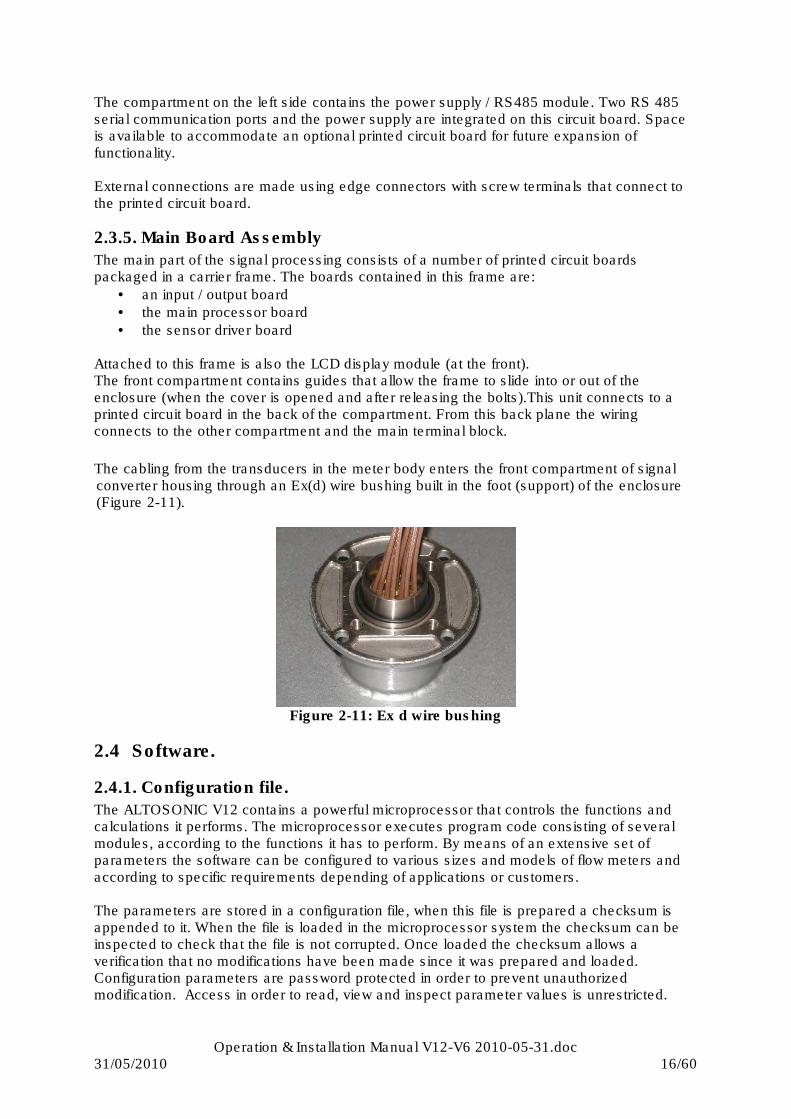
The cabling from the transducers in the meter body enters the front compartment of signal converter housing through an Ex(d) wire bushing built in the foot (support) of the enclosure (Figure 2-11).
Figure 2-11: Ex d wire bushing
2.4 Software.
2.4.1. Configuration file.
The ALTOSONIC V12 contains a powerful microprocessor that controls the functions and calculations it performs. The microprocessor executes program code consisting of several modules, according to the functions it has to perform. By means of an extensive set of parameters the software can be configured to various sizes and models of flow meters and according to specific requirements depending of applications or customers. The parameters are stored in a configuration file, when this file is prepared a checksum is appended to it. When the file is loaded in the microprocessor system the checksum can be inspected to check that the file is not corrupted. Once loaded the checksum allows a verification that no modifications have been made since it was prepared and loaded. Configuration parameters are password protected in order to prevent unauthorized modification. Access in order to read, view and inspect parameter values is unrestricted.
Operation & Installation Manual V12-V6 2010-05-31.doc 31/05/2010 17/60
Individual parameters are classified according to “roles” in order to define differentiated access rights. Each “role” is associated with a “typical” user or operator having specific responsibilities or duties. Users have to be registered with a user name and a password, when registered the role of the user is also defined, and by consequence also the access rights of that user. The following roles have been defined, hereunder listed in according to the rank in the hierarchy. Developer: restricted to KROHNE R&D employees. Factory : restricted to KROHNE factory employees, to implement factory settings in the
meter Service : restricted to authorized service personnel, to the discretion of KROHNE Calibrator : restricted to personnel acting on behalf of a legal calibration station Supervisor : restricted to personnel acting on behalf of the owner/operator of
the meter (administrator function), to the discretion of the owner/operator of the meter
Operator: restricted to personnel acting on behalf of the owner/operator of the meter (for day to day operation), to the discretion of the owner/operator of the meter
Only a higher rank user is allowed to register a lower rank user. Multiple users having the same rank or role may be registered. In addition to restrictions depending of the defined role of a user, a physical “overwrite disable” contact / jumper protects the configuration parameters. This disables any user from making modifications to parameters that would influence the measured flow or volume value (Figure 9-1). This prevents unintentional or unauthorized changes to the parameters and possibly invalidation of the calibration. Normally the meter is delivered with a set of parameters suitable for the application. In case a modification of the configuration file is made, this is stored in its data logging memory. This information can be retrieved afterwards for auditing and verification purposes. In case of a modification of the configuration file its “checksum” is also updated.
2.4.2. Start up
As the meter is powered up, the software that is stored in non volatile memory is loaded in working memory, this initialization process takes approximately 25 seconds. A “checksum” is appended to the software, each time the software is loaded the checksum is evaluated to verify the integrity of the software. Each time the meter is powered up this checksum of the configuration file is also inspected to verify its integrity. When the initialization is completed the meter will automatically start its measuring function. The following list shows the main functions performed by the software and the microprocessor :
• the basic transit time measuring process
• the flow calculations
• controlling output signals
• controlling a display
• communication with other devices
2.4.3. The basic transit time measuring process.
Measuring a single transit time for the signal to travel from one transducer to the other basically involves the following actions: Generating an electric signal to fire the transmitting
Operation & Installation Manual V12-V6 2010-05-31.doc 31/05/2010 18/60
transducer (transmit pulse) and digitizing and storing the signal on the receiving transducer (receiving pulse). Before starting the digitizing process a “receiving” window must open. The time to open and to close this window (relative to the firing time of the transmit pulse) are dependant of the size of the meter and are set as a parameters in the configuration file. This are factory settings that should not be changed. An accurate and high resolution timer is used to control the digitizing process. The digitized and stored signal is evaluated to detect the arrival time of the acoustic signal. As the signal is evaluated, it is checked for specific criteria to make sure it is the wanted and genuine signal and that it can be used for a reliable transit time measurement. If the signal does not meet the criteria it is rejected. Based on the strength of the received signal, the setting of an variable gain amplifier is updated in order to match the level of the signal to the operating envelope of the digitizing circuit. The setting of the variable gain amplifier is available as a diagnostic value to indicate the strength of the received signal. To capture the level of background noise the received signal strength is also measured at a time when no signal is expected. The background noise is used to evaluate the signal to noise ratio and is also available as a diagnostic value. The repetition rate (called sample rate, expressed as times per second) for performing a single transit time measurement can be set as a parameter in the configuration file. This is not a critical value and has no impact regarding the measured flow values. The sample rate can be set to a value that is too high to be physically achievable, meaning the transit time does not allow such a repetition rate. In that case the meter will automatically adjust the sample rate to the highest achievable value. This value is also reported as a diagnostic value: The actual sample rate. As a cycle the meter performs transit time measurements for all acoustic paths, each path in both directions. After completion of a cycle all results are forwarded to the flow calculation module. This includes the measured transit times, signal strength data and signal to noise ratio data. In case a measurement had failed this will be indicated: the results are marked as rejected values.
2.4.4. The flow calculation module.
The flow calculation module processes the data received from the basic transit time measuring process. After each cycle a number of variables is updated, such as
• Volume flow rate
• Average gas velocity
• Average speed of sound
• Gas velocity for each measuring path
• Speed of sound for each measuring path
• Reynolds number
• Reynolds correction factor
• Reliability
• Total (forward, accountable)
• Total (forward, not accountable)
• Total (reverse, accountable)
• Total (reverse, not accountable)
• Statistics
• Averages The flow calculation module will also report diagnostic information as:
Operation & Installation Manual V12-V6 2010-05-31.doc 31/05/2010 19/60
• number of rejected measurements,
• signal strength,
• signal to noise ratio.
• error indications (if there is a reason for) The flow calculation module prepares data to be used by other modules as:
• the signal output module
• the display module
• the communication module
• the data logging module
2.4.5. The signal output module
The settings described in this paragraph are only available for users with Developer, Factory and Service rights. The settings are factory set based on customer requirements. The electronic hardware provides 4 digital outputs: open collector circuits that can be switched on or off. The physical outputs are marked as output A, output B, output C and output D. The software of the signal output module determines the variable and the “format” used to control each physical output. This is set by a number of parameters. Format means here that an output is either switched “on” or “off” to represent a binary (logical) value (for example flow direction is “forward” or “reverse”) or the output is used to transmit a frequency or pulse width modulated signal to represent a numerical value. In order to present a numerical value as a frequency or as a pulse width modulated signal, this numerical value must be converted first. The software contains the frequency synthesizer function and the pulse width modulation function, both are capable to convert one numerical value, this can be two different values or the same values, as both functions are independent and may be used at the same time. The following parameters are used to program the frequency conversion: frequency output value: selects the numerical value (variable) to be converted to
a frequency frequency output 100 % output : the upper frequency of the normal operating range of
the frequency output (for short: F100%) frequency output 100 % reference : the numerical value of the variable that will be
converted to a frequency of F100% (for short: Ref100%) frequency output over range : in case the numerical value exceeds Ref100%, the
frequency will exceed F100%. This parameter sets a limitation to the maximum frequency equal to F100% + the over range percentage (related to F100%).
In addition to the primary frequency signal secondary frequency signals are available, related to the same variable and having the same frequency but with a phase difference of 90 degrees, 180 degrees or 270 degrees. The parameters used to program the pulse width conversion are: PWM output value : selects the numerical value (variable) to be converted to a
pulse width modulated signal PWM output frequency : defines the frequency (and consequently the interval time)
of the pulse width modulated signal
Operation & Installation Manual V12-V6 2010-05-31.doc 31/05/2010 20/60
PWM output 100% reference : defines the upper limit of the normal range of the numerical value to be converted to a pulse width modulated signal
PWM output over range : defines the maximum value of the numerical value to be converted to a pulse width modulated signal. This maximum numerical value of the selected variable will be converted to a signal having a duty cycle of 100 %
clip negative values to zero: for example in case of reverse flow, the numerical value of
the flow will be negative. This parameter offers the option (option “off”) to ignore the sign and have the absolute value of a numerical value transmitted as a frequency or pulse width modulated signal. The other option (“on”) will disable the frequency signal and the pulse width signal in case of a negative numerical value
Each of the digital outputs A, B, C and D are programmed by means of three parameters: Mode select: this parameter defines the source that controls the status (on/off)
of the physical output. The options are: No output : output is not used Binary output : output is directly controlled by a boolean variable (or logical
value: on/off) Frequency phase 0 : output is controlled by the primary frequency signal (the result
of the conversion) Frequency phase 90 : output is controlled by the secondary frequency signal with
phase 90degrees Frequency phase 180 : output is controlled by the secondary frequency signal with
phase 180 degrees Frequency phase 270 : output is controlled by the secondary frequency signal with
phase 270 degrees PWM : output is controlled by the result of the conversion to a pulse
width modulated signal PWM inverted : output is controlled by the result of the conversion to a pulse
width modulated signal, but signal levels (on /off) are inverted.
In case two outputs are programmed as frequency output, one being the primary frequency having a phase of 0 degrees and one being a secondary frequency having a phase of 90 degrees the parameter “Flow direction indication” can be used to program the secondary frequency phase to be direction dependant. This means the phase will be 90 degrees in case of positive flow direction and 270 degrees in case of negative flow direction (option automatic flow direction indication). Otherwise the phase of the secondary frequency will always remain 90 degrees, irrespective of flow direction (option no flow direction indication). The parameter “Status select” is relevant in case the option “Binary output” is selected for the parameter : “Mode select” . The parameter “Status select” defines the variable that will control the status of the physical output being programmed. The parameter “Bit mask” allows to define the bit pattern (mask) of a 32-bit word. This word can be used to select specific bits from another 32-bit word, representing the variable selected with the parameter “Status select”. The bits of this variable, corresponding to the bits in the mask that have the value “1” are selected to control the output. In case multiple bits are selected the selected bits are combined with a “or” function in order to obtain a single binary value. As an example: this function can be used to combine different alarms represented by separate bits in a 32-bit word to output a single external alarm signal.
Operation & Installation Manual V12-V6 2010-05-31.doc 31/05/2010 21/60
2.4.6. Path substitution
The ALTOSONIC V12 is designed for custody transfer applications. In order to maintain the accuracy required for custody transfer measurement under all circumstances, a minimum of three out of five measuring paths must be operational. In case one or two of the five measuring paths fail during operation, an automatic path substitution procedure is started. This enables the unit to continue operation with minimum added uncertainty. Nevertheless it is recommended to resolve the cause of the problem at the earliest opportunity
2.4.7. Write protect lock
A security lock is used to prevent unwanted changes to the flow meters configuration set-up. It is implemented as a DIP switch, for locating this switch see Chapter 9 Marks and Seals, Figure 9-1. Switch number 4 in position “off” means overwrite is disabled (protected), switch number 4 in position “on” means overwrite is enabled. During flow calibration a final correction factor has to be entered and secured. After locking the electronics and its embedded software, only functions that will not impact on the reading of the meter can be accessed.
2.4.8. Sealing requirements for fiscal Use
Having designed the ALTOSONIC V12 for custody transfer flow measurement mainly fiscal applications will be monitored. In many national regulations sealing of the main flow meter components and electronics is mandatory when using it for fiscal purposes. This prevents altering the meter configuration without notice (see Chapter 9 Marks and Seals). Overwriting the fiscal meter’s software parameter set-up is disabled by means of a DIP-switch. Access to this switch is only possible by breaking a physical seal, such as e.g. a sticker, see Chapter 9 Marks and Seals, Figure 9-1. (In addition to parameters being password protected).

Operation & Installation Manual V12-V6 2010-05-31.doc 31/05/2010 22/60
3 Before installation
3.1 Inspection received products
3.1.1. Packing and transportation
The standard packaging of an ultrasonic gas flow meter is in a reinforced wooden seaworthy crate. This crate is suitable for road, railroad and sea container transportation. It is advisable to install Indicators inside the crate to detect impact during transportation, which may lead to malfunction of the equipment. In the event an impact detector shows incorrect handling during transportation contact KROHNE for assistance on handling warranty and repair procedures, even if no outer damage is visible to the equipment it is advised to inform KROHNE about the issue. Problems might come out at a later stage during commissioning and start-up.
3.1.2. Scope of delivery
INFORMATION!
Check the packing list to see if you have received all the parts ordered. The ALTOSONIC V12 will arrive in a wooden crate. Carefully unpack the UFM: remove the crate’s lid, unscrew the protecting beams or release the strap belts. Lift the UFM from the crate’s floor using the lifting lugs or eye bolts.
3.1.3. Name plate
CHECK!
Check on the device nameplates, that the device is supplied according to your order. In particular check the following data specified on the name plate:
• pressure rating
• temperature rating
• power supply voltage
• material of pressure containing part These specifications should be in agreement with the requirements of your application. If not, contact your local KROHNE representative for advice.
3.1.4. Visual check
CHECK!
Check the meter for any signs of damage that might be caused by transportation. In case damage is suspected, contact your local KROHNE representative.
3.2 Storage INFORMATION!
In between factory release for transportation and final installation the equipment may be held in storage for some time. Maintain the following storage conditions to prevent the equipment from corrosion or early failure:

Operation & Installation Manual V12-V6 2010-05-31.doc 31/05/2010 23/60
• Humidity: < 95 % RH (closed and heated storage area) • Storage temperature: -40…+65°C / -40…+149°F • Avoid direct solar radiation during long storage periods, store under a sunshade For carbon steel meters or other materials that could suffer from corrosion , a specific point of attention is the conservation of the inner pipe wall. Typical applications such as measuring dry natural gas (sales quality) or natural gas with a corrosion inhibitor do not require an anti corrosion coating inside the meter tube. A coating can even be regarded as unwanted because it may wear off, which could have an impact (although minor) on the accuracy. However for storage and/or transportation additional protective measure are recommended. Depending of how long the protection should last one of several methods can be considered. 1. Protection by a light oil (WD40 or an equivalent product) for a short period of time
(max. 2 weeks): The oil does not dry and as such it can not be used for a long period of time. Do not apply oil on the sensors. Later it can be removed with cloth and a solvent.
2. Protection by Tectyl or similar product for a longer period (few moths): The Tectyl dries and gives a longer protection. The it can be removed using solvent and cloth. Also do not apply onto the sensors
3. Protection by oxygen free environment (blind flanges and nitrogen): To protect against corrosion the humidity should be less than 38% and/or oxygen should not be present. Place some bags of silica gel inside the meter. Mount blind flanges (can be a special type low pressure rating made of plastic), flush with nitrogen (approx. 5 times the volume of meter). Also first a vacuum pump can be used to remove air. This option results in a slightly pressurised flow meter. Special regulation may be applicable for transportation and storage of pressurised equipment.
3.3 Environmental Requirements NOTE!
The equipment is designed for safe operation under conditions according to the following classifications:
• Pollution degree 2: This means normally only nonconductive (dry) pollution will occur, Temporary conductivity caused by condensation is to be expected.
• Protection class I: This means the equipment should be earthed.
• Humidity: < 95 % RH
• Ambient temperature: -40…+65°C / -40…+149°F
• Suitable for indoor and outdoor use
• IP66 or NEMA 4X classification NOTE!
Sun shade Direct solar radiation introducing temperature gradients in the metering section shall be avoided as much as possible. If required because of the climate, use a sunshade or canopy over the flow, pressure and temperature transmitters for protection against direct exposure to sunshine. Alternatively thermal insulation of the complete metering section including transmitters can be applied as an option.
Operation & Installation Manual V12-V6 2010-05-31.doc 31/05/2010 24/60
CAUTION!
The ALTOSONIC V12 should be protected from corrosive chemicals or gases and dust or particles accumulation.
3.4 Installation requirements
3.4.1. Pipe diameters and lengths
INFORMATION!
The location for installing an ALTOSONIC V12 shall be selected carefully. The location shall be horizontal (preferred) with sufficient upstream and downstream straight pipe length in accordance with international and/or company regulations. The inner diameter of upstream and downstream piping shall match the specified connection diameter of the ultrasonic flow meter, preferably within 1% but at maximum within 3% (see e.g. ISO17089 or AGA-9 for details). The inlet pipe spool of a custody transfer flow meter shall have a straight length of at least 10DN. Also 5DN upstream straight length is allowed pending on the required accuracy class. The outlet pipe spool shall have a minimum straight length of 3DN. It is recommended to install the applicable inlet pipe spool in front of the ultrasonic flow meter during the flow (wet) calibration (see e.g. ISO17089 or AGA-9 for detailed requirements).
3.4.2. Flow conditioners.
Although the ALTOSONIC V12 is a highly accurate device an additional flow conditioner can be installed upstream of the flow meter in order to minimize measuring uncertainty, in particular when a strongly distorted flow velocity profile has to be expected, or when the available space for a metering run is critical. If a flow conditioner is used the total inlet length may be reduced to only 5DN: having 2DN upstream of the flow conditioner and 3DN in between the flow conditioner and the meter. As a flow conditioner the preferred model is the “perforated plate”. Using “pipe bundle” type of flow conditioner is not recommended. When a flow conditioner is included in the metering run, it is recommended to use the same flow conditioner and inlet pipe configuration during a flow (wet) calibration (see e.g. ISO17089 or AGA-9 for detailed requirements).
3.4.3. Control valves
NOTE!
Under circumstances ultrasonic gas flow meters can suffer from interference from noise generated by pressure control valves (PCV). In case the frequency spectrum of the PCV-noise extends in the range of the operating frequency of the ultrasonic transducers and the strength of the noise results in a signal to noise ratio smaller than the critical value, the ultrasonic flow meter will not be able to operate. Consult KROHNE for advice in case a PVC with high pressure cut will be operated in the vicinity of the ultrasonic flow meter.

Operation & Installation Manual V12-V6 2010-05-31.doc 31/05/2010 25/60
4 Installation of the ultrasonic gas flow meter
Figure 4-1: General installation requirements
• Always lift the flow meter and its adjacent pipe spools (if applicable) at the lifting lugs
or use hoisting straps. • Install the ultrasonic gas flow meter in horizontal position with the flow arrow indicator
on the nameplate or on the meter body in the direction of the positive (forward) gas flow.
• The converter shall be located at the top of the ultrasonic flow meter. • Connect the pressure transmitter to the Pr-point on the meter body using an
intermediate isolation valve and/or valve manifold. • A temperature assembly (PT100 element with thermo well and transmitter) shall be
installed downstream in the positive flow direction at a position between 1.5DN and 3DN. In case of a bi-directional flow application the temperature transmitter shall be positioned between 3DN and 5DN.
Pr
10D or 5D with flow straightener
gas flow
1.5…3D
Tr

Operation & Installation Manual V12-V6 2010-05-31.doc 31/05/2010 26/60
5 Electrical Installation
5.1 Safety instructions CAUTION! INFORMATION!
The ALTOSONIC V12 ultrasonic gas flow meter is designed to meet requirements for applications in potentially hazardous areas (explosion). The equipment is certified accordingly (ATEX). Read the dedicated Explosion Safety Instructions Manual related to this product before starting to work on this equipment. As a general rule make sure power supplies are switched off and that the meter is free of any voltage before working on electrical equipment. After switching off the power supply, the main part that will retain electrical energy for some time is a bank of capacitors with a total capacity of 4000 µF. Starting from 18 V the charge will disappear according to an exponential decay curve. After 1 minutes the charge on these capacitors is decreased to 0,2 V, representing an energy of 0,08 mJ. therefore the Ex d enclosure can safely be opened after a waiting time of 1 minutes after switching off the power to the unit It is still strongly recommended to use a gas detector in case of any risk that an explosive gas mixture can be present. Be aware of the general safety directives, local safety directives and detailed instructions for working on electrical installations. Adhere to safety procedures, an authorized work permit is usually required when working on equipment or premises having a hazardous area classification.
5.2 Electronics enclosure and cable entries The metal (SS 316) converter housing of the ALTOSONIC V12 contains the electronic circuit boards of the ultrasonic flow meter. Three separate compartments contain a. connection block with screw terminals b. the electronic circuit boards including the display unit c. the power supply and serial communication line drivers. See also sections 2.3.3 and 2.3.4. The ALTOSONIC V12 electronics enclosure has six threaded holes M20x1,5 , three on compartment a. and three on compartment c. The holes accommodate Ex d cable glands suitable for cables wit a diameter from 6.5 to 14 mm to enter the enclosure. Unused holes shall be closed with an Ex d approved stopping plug.
5.3 Electrical connections
5.3.1. Power connection
NOTE!
The ALTOSONIC V12 Ultrasonic Gas Flow Meter needs to be powered from a 24V dc supply. Maximum power consumption is 10 W, a voltage variation of ±10% is acceptable .
Operation & Installation Manual V12-V6 2010-05-31.doc 31/05/2010 27/60
The electronic system has a built in diode for protection against connecting the DC power with the wrong (reversed) polarity. Also a fuse is present to protect the electronics against high current. The fuse used is: 800mAT, IEC 60127-2, 250 VAC, 300 VDC, Träge T UL:115V-300VDC
IMPORTANT!
Always use a fuse with the same specification as mentioned above
Figure 5-1: Power connection DC power to the electronics is supplied through a dedicated power cable using one of the cable entries of the converter housing (Figure 2-10: cable entries on the compartment to the left).
IMPORTANT!
• The power supply should be a NEC class 2 power supply (max 100VA, 24VDC, see also IEC 61010-1, clause 6.3.1 and 6.3.2)
• The protective conductor clamp terminal size M5, press-fitted in the terminal compartment (near the main connection terminals), shall always to be connected to the protective earth conductor of the mains supply. Conductors up to 4 mm² (11 AWG), wit a minimum of 1 mm² should be connected to this terminal.
• The Protective Conductor clamp or GND of the connector can be used for cable shielding.
5.3.2. Digital I/O connections.
The digital outputs are passive open collector outputs, galvanically isolated from each other and from the main circuit. To use these outputs an external voltage source and current limiting resistors must be applied.
NOTE! IMPORTANT!
• For normal operation a voltage up to 32 V may be used (exceeding this exception wise up to 200 % will not harm) , the maximum current to be switched on or off is 100 mA.
Operation & Installation Manual V12-V6 2010-05-31.doc 31/05/2010 28/60
• The power supply to the I/O card should be a NEC class 2 power supply (max 100VA, 24 VDC, IEC 61010-1, Clause 6.3.1 & 6.3.2)
• The Protective Conductor terminal of the I/O compartment can be used for cable shielding.
The digital outputs are connected to the screw terminals in compartment a. The terminal marked with A, B, C and D is connected to the collector of the (NPN) transistor acting as a switch, the terminal with the A-, B-, C- and D- sign is connected to the emitter of the transistor.
Figure 5-2: Digital & frequency outputs
Four digital output signals are available. Each output can be defined as a pulse or frequency output or as a status output. (Remark: A+ is not used)
5.3.2.1. Pulse/Frequency output,
Default the first digital I/O connection is set as a pulse/frequency output, having a frequency proportional to the volume flow rate (actual volume: under process conditions). It is possible to assign another variable to control this output (defined by means of parameter settings, see section 2.4.5).
5.3.2.2. Status outputs.
Default the next three digital I/O connections are defined as status outputs (Data not valid, Fail unreliable and Reverse flow). However the function of these outputs can be programmed to various alarms or status signals. One of the status outputs may be programmed to a second pulse output, having the same frequency as the first pulse output, however the phase difference can be set to either 0, 90, 180 or 270 degrees.
5.3.2.3. Emulation of a turbine meter
If the ultrasonic flow meter should emulate a turbine meter. The following set up and settings can be implemented:
• A/A-: Frequency output related to the line flow
A, B, C, D
A-, B-, C-, D-

Operation & Installation Manual V12-V6 2010-05-31.doc 31/05/2010 29/60
• B/B-: Frequency output inverted related to the line flow whereby this frequency output will stop operating if data valid alarm on status bit C/C- will occur. To do so the frequency output B/B- should be placed in series with status bit C/C- as presented in Figure 5-3
A
A-
B
B-
C
C-
D
D-
Alarm
A
A-
A
A-
B
B-
B
B-
C
C-
C
C-
D
D-
D
D-
Alarm
Figure 5-3: Connecting diagram for turbine emulation.
5.3.3. Serial data communication (RS485)
Figure 5-4: Serial data communication RS485
The electronics has two independent serial ports operating in half duplex mode (switching automatically between receiving and transmitting). The electrical connections of these ports are galvanic isolated from each other and from the main circuit. Each port is connected by means of terminals A and B and (optional) GND. The GND can be used for cable shielding. It is recommended , even when only one port is used for data acquisition, to wire both serial ports to the a location outside the hazardous area.. The second port, not connected to the data acquisition system, can be used as a flexible interface for remote programming and monitoring of the flow meter using the service tool (see service tool manual or section

Operation & Installation Manual V12-V6 2010-05-31.doc 31/05/2010 30/60
5.3.4. Serial communication (USB)
NOTE!
This port is only available when electronic housing is open.. A serial port (USB 2.0) is provided for connection to a notebook PC. This is a service/maintenance connection to be used only by the factory or technicians authorized by Krohne. The initial parameter set-up is programmed into the flow meter by means of this serial connection. Entering or overwriting parameters with incorrect values will cause serious problems regarding the functioning of the flow meter. As soon as the meter has left the factory and has been installed in the field it is recommended to use one of the RS485 serial ports (see par.5.3.3) for monitoring the flow meter or in order to make modifications to the parameter set-up, if required.
5.3.5. TCP/IP communication
NOTE!
This option is only available when electronic housing is open and using a signal cable with a special interface. This is also service/maintenance connection to be used only by the factory or technicians authorized by Krohne. When the meter is installed in the field it is recommended to use one of the RS485 serial ports (see par.5.3.3). for monitoring the flow meter or in order to make modifications to the parameter set-up, if required.
5.4 Cabling For connecting power and the digital outputs as minimum one cable can be used, two separate cables may be used as there are two cable glands available. An unused cable gland shall be removed and replaced by an Ex-d blind plug. We recommend to use screened cable with twisted pairs for connecting power and the status signals. The screen may be used to connect the ground terminal. In order to limit the voltage drop across the power wires to an acceptable value, the copper cross section shall not be less than the value according to the table below (assuming no other components - such as safety barriers - add any additional voltage loss):
Length of cable
between power
supply and ultrasonic
gas flow meter
Required
minimum copper
cross section
70 m 2 X 0,5 mm2
100 m 2 X 0,75 mm2
200 m 2 X 1,5 mm2
400 m 2 X 4 mm2
For connecting the serial data outputs as minimum one cable can be used, two separate cables may be used as there are two cable glands available. An unused cable gland shall be removed and replaced by an Ex-d blind plug. We recommend to use screened cable with twisted pairs for connecting the serial ports. The twisted pairs may be screened individually or both pairs may have one and the same screen. The screen(s) may be used to connect the ground terminal(s).
Operation & Installation Manual V12-V6 2010-05-31.doc 31/05/2010 31/60
IMPORTANT! The temperature rating of the cables used should be higher than 65 0C
5.5 Ground connection The foot of the enclosure has two screw connection points (one M5 thread and one M4 thread) to attach a ground conductor. See the picture below.
Figure 5-5: Ground connection
This ground connection can be used to connect the upstream and downstream piping to the Ultrasonic Flow Meter (Equipotential).

Operation & Installation Manual V12-V6 2010-05-31.doc 31/05/2010 32/60
Operation of the ultrasonic gas flow meter.
5.6 Start up The flow meter will be delivered with fully programmed electronics. Additional start up procedures are not necessary. After powering up the flow meter the KRONE logo should be visible on the display of the converter and in about 25 seconds the measurement data will appear. The standard default page will show the values of Process Flow, Process Velocity and Speed of Sound. The data presented on the display can be modified according to customer’s preferences.
5.7 Display and Operating Elements
Figure 0-1: Display Display elements: 1 Field with product name 2 X is shown when an optical button is activated 3 Indication of page or menu number 4 Data fields: 1, 2 or 3 lines each showing one measurement result
In programming mode: the bar on the right side visualizes the number of the selected item the options list.
5 Analog indicator (bar) 0 – 100% of defined measuring range 8 Status: ↑↓ scroll down to help listing Operating keys: The 4 operating keys are optical sensors that will respond when approached by a reflecting object. They perform best when approached perpendicular to the front. The keys can be actuated while the cover is closed. 7 Operating keys (see table below for description) 6 Infrared sensor for IR cable (this is an option, not implemented)
Operation & Installation Manual V12-V6 2010-05-31.doc 31/05/2010 33/60
5.8 Available display information The information on the display is fully programmable. There are 5 pages available for displaying different type of information:
• Two pages with 3 lines for measuring data (page M1 & M2),
• One page with graphic data (G1),
• One page with status information (S1)
• One test page (T1) By default the display is programmed to show the following information pages:
• Page M1: Line 1: Forward Total Line 2: Reverse Total Line 3: ………………..
• Page M2: Line 1: Process Flow Line 2: Process Velocity Line 3: Speed of Sound
• Page G1 Graphics of Process flow over time
• Page S1 Status/alarm messages
• Page T1 Test page, the display will cycle through the following screens:
• KROHNE logo normal
• KROHNE logo inverted
• Software version
5.9 Operating the display In the normal operating mode an information page can be selected by means of the optical sensitive buttons “up” (▲) and “down” (▼) (scrolling mode). The information pages (lay out and content) can be changed in the programming mode. To enter the programming: touch and hold the button > as long as the display tells to hold this button and release this button when the display tells to release it. In programming mode a menu structure is entered, the display will show a menu number (in the upper right corner) and the display will show three or four lines Three lines (applicable when the current item in the option list is a submenu):
• Preceding item in options list
• Current item in options list
• Next item in options list Four lines (applicable when the current item in the option list is a menu item that can be changed or assigned a value to):
• Preceding menu item
• Current menu item
• Setting/value of current menu item
• Next menu item
Operation & Installation Manual V12-V6 2010-05-31.doc 31/05/2010 34/60
Use the > button to enter a submenu Use the < button to go one step back in the menu structure, Press > to open a menu item in order to change its value, the display will show 3 lines
• Current value
• Menu item that will be changed
• Selected value to replace current value Press > to accept the selected value and go back one step back in the menu structure. Press > to leave the programming mode. Description of the buttons (keys)
Function of the buttons (keys)
Operation & Installation Manual V12-V6 2010-05-31.doc 31/05/2010 35/60
6 Software Service Tool
6.1 Introduction The ALTOSONIC V12/V6 Monitoring, Configuration and Service Tool (MCST) is a software package developed to support the application of the ALTOSONIC V12 / OPTISONIC V6 ultrasonic gas flow meters. It is designed to be used with a PC or laptop computer with a Windows operating system. It has the capability to
• collect data from a flow meter
• present data from a flow meter
• verify/set/adjust parameters used by the software inside the flow meter The software can be operated using different communication methods such as
• TCP/IP
• Modbus
• USB As discussed in sections 5.3.3 5.3.4 and 5.3.5 the RS485 serial communication link is applicable for field installations. For details of the service tool see: Quick start guide and Manual, Monitoring, Configuration and Service Tool (MCST), ALTOSONIC V12, OPTISONIC V6. For convenience the most important functions are described in this standard operating manual as well.
6.2 Starting a session
6.2.1. Connecting
After the program is launched a blank screen will appear with only a number of menu pull down buttons on the menu bar on the upper left side of the computer screen.
Figure 6-1: Menu pull down buttons
In order to start the data communication with a particular meter:
� Choose and click the menu pull down button “Device” A menu will open with the options Connect, Reconnect and Disconnect.
Figure 6-2: Connecting
� Click “Connect” (at this time the only valid option)

Operation & Installation Manual V12-V6 2010-05-31.doc 31/05/2010 36/60
This will open a dialog box asking to select or confirm the communication method you intend to use.
Figure 6-3: Communication protocol
For in filed application MODBUS/RS485 should be the option to choose
� Press “OK” to confirm A dialog box will appear asking for your user name and password.
Figure 6-4: User/Password
� Type your user name and password and click “OK”.
You have now access to the flow meter according to the access rights associated with your user name and password. The software will now automatically start up the user view.

Operation & Installation Manual V12-V6 2010-05-31.doc 31/05/2010 37/60
6.2.2. User views
Normally after having connected to the meter, using the service tool, the User views will automatically pop up.
Figure 6-5: User View
The user view has different tabs with specific information.
Figure 6-6: User View Tabs
If the user view do not appear go to:
� View > User Views ..
Figure 6-7: Activating User View
Operation & Installation Manual V12-V6 2010-05-31.doc 31/05/2010 38/60
If still the user views are not shown or shown incompletely as presented in this manual than the monitoring configuration is not properly loaded and a monitoring configuration should be loaded manually prior to selecting the User Views
6.2.3. loading monitoring configuration
To load a monitoring configuration:
� Click the button “File” to open the File menu.
� Select the option “Open Monitoring Configuration”
Figure 6-8: Open Monitoring Configuration
A warning may occur in a pop up screen:
� Select Yes
Figure 6-9: Warning monitoring session running
A browser window will open as shown below.

Operation & Installation Manual V12-V6 2010-05-31.doc 31/05/2010 39/60
Figure 6-10: Browser configuration monitoring
� Select a “default” monitoring configuration file and press “Open” A dialog box will appear, asking whether you want to start the monitoring function now.
Figure 6-11: Start monitoring?
� Press “Yes” to start the monitoring function. To activate the user views go to: � View > User Views .. See Figure 6-7
6.2.4. start up user views automatically
To start up the user views automatically the next time the service tool is running the following steps should be taken. � Click the “Tools” button to open the tools menu.
Figure 6-12: Open settings menu

Operation & Installation Manual V12-V6 2010-05-31.doc 31/05/2010 40/60
� Click “Settings”. A window “Settings” with 4 tabbed sheets will open.
Figure 6-13: Settings menu
On the sheet “”Auto start” check the box “Start monitoring after connecting” and click the button “Use current configuration”, or Click “Browse” and choose default.mom � Click “OK” to confirm this setting.
6.2.5. Viewing Data Unformatted
Besides the described User Views data can be viewed in another way, using unformatted data. This viewing option can be chosen under “view”
Figure 6-14: Viewing unformatted data
� Click “Monitoring Data (unformatted)….” An information window as below will appear. It opens as a scroll list, you can find the data you want to see using the scroll bar to the right. Using the scroll bar at the bottom you can select the columns showing the data you are interested in.

Operation & Installation Manual V12-V6 2010-05-31.doc 31/05/2010 41/60
The data that will be presented is the data as currently being collected from the meter: only the values of the variables as defined in the monitoring configuration file.
Figure 6-15: Unformatted data
6.2.6. Creating Reports.
The service tool has been developed to also enable you to create records regarding the state of the ultrasonic flow meter and the way the meter performs. Records can be printed reports or records can be exported and saved as data files on a storage medium. Records can be created regarding:
• the actual parameter values as present in the meter, governing the performance and functionality of the meter
• process values as observed at a specific instant
• the Modbus address mapping regarding the parameters and process values that can be retrieved from the meter using Modbus register addressing
To obtain a report: � Click “Tools” to open the Tools menu � Click “Reporting” to open the Reporting submenu
Figure 6-16: Reporting menu

Operation & Installation Manual V12-V6 2010-05-31.doc 31/05/2010 42/60
6.2.6.1. Reporting related to calibration parameter settings.
Click “Parameters” to open a window in which all parameters are listed.
Figure 6-17: Parameter list
Use the scroll bar at the right side of the window to scroll trough the list and the scroll bar at the bottom to display the columns you are interested in. In order to print a hard copy: � Click “Reports and Exports” � Click “Reports…”
NOTE!
A print out of the complete parameter file consists of about 30 pages and is not advised. For metrological purposes the calibration Parameter Report is sufficient.
Figure 6-18: Print out of report

Operation & Installation Manual V12-V6 2010-05-31.doc 31/05/2010 43/60
� Select “Calibration Parameter Report” A printable preview of the Calibration Parameter Report will be displayed
Figure 6-19: Preview calibration report
The small panel at the left side lists – as a tree structure - all the items included in the report. You can click the highlighted “tree” icon to remove this “tree” panel, click again to let it reappear.
Figure 6-20: Tree visibility
� Click the button with the printer icon in the upper left of the window to get a printed
copy of the report. � Click the button with diskette icon in the upper left corner to save the parameter list as
an electronic document. In the dialogue box that appears: � Select the location where you want the document to be saved � Enter a unique name for the document you are about to create
NOTE!
Be sure to select the file extension properly, for example .doc in case you want the document to be saved in Microsoft Word format. Or pick any extension according to a format that your computer software can handle. The default format is the Crystal Reports format. If you don’t

Operation & Installation Manual V12-V6 2010-05-31.doc 31/05/2010 44/60
have the Crystal Reports software installed on your computer you will not be able to read the document afterwards.
6.2.6.2. Create a file listing the parameters in CSV format:
� Click “Tools” to open the Tools menu � Click “Reporting” to open the Reporting submenu � Click “Parameters” to open a window in which all parameters are listed. � Click “Reports and Exports” � Click “Export to CSV…” A window will open that allows to make a selection of the attributes to be listed for each parameter.
NOTE!
A file consisting of all the parameters is not advisable again for metrological purposes the calibration parameters are sufficient. So � Deselect All � Choose only Calibration
Figure 6-21: Choose data to export (csv)
� Click the button “Export” In the output dialog box that appears: � Specify the location where you want to store the file � Type a unique file name for the document � Click the button “Save”
6.2.6.3. Saving a parameter file in .XML format
Saving and storing the parameter file as in .XML format is an important feature. In case of the unexpected event of a problem, you may need the file in this format to reload the parameters in the processor of the ultrasonic gas flow meter, for example after replacing the electronic unit.
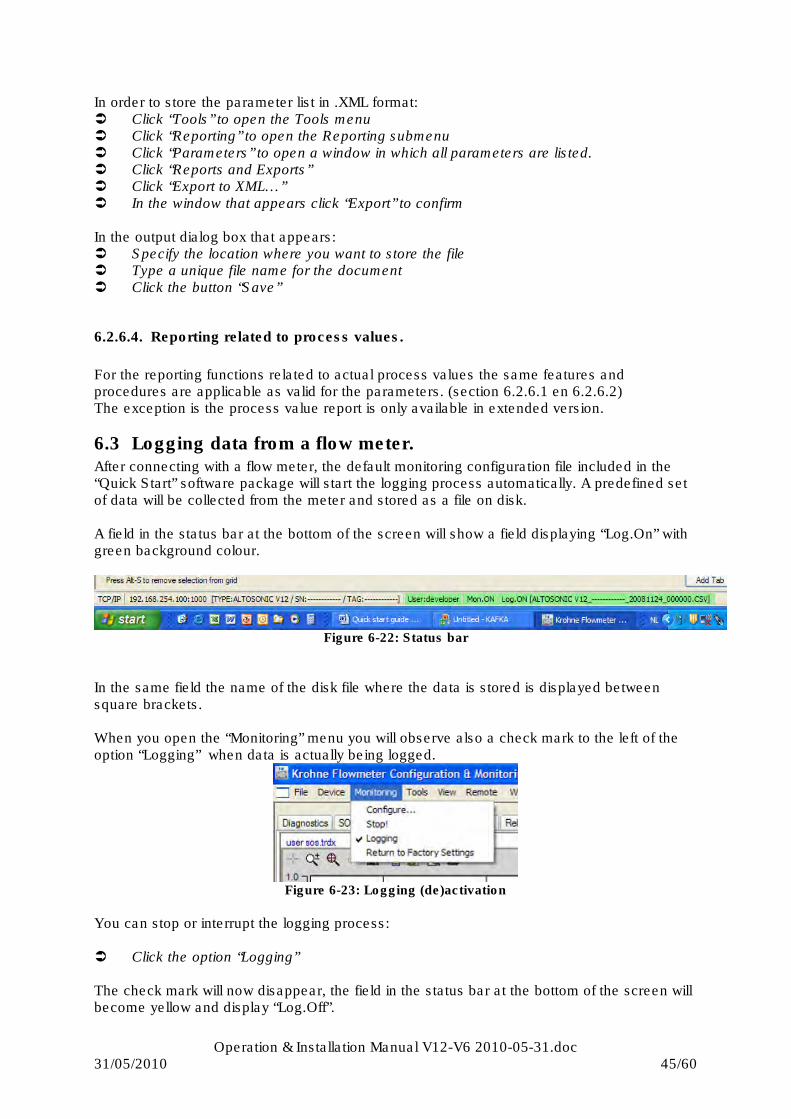
Operation & Installation Manual V12-V6 2010-05-31.doc 31/05/2010 45/60
In order to store the parameter list in .XML format: � Click “Tools” to open the Tools menu � Click “Reporting” to open the Reporting submenu � Click “Parameters” to open a window in which all parameters are listed. � Click “Reports and Exports” � Click “Export to XML…” � In the window that appears click “Export” to confirm In the output dialog box that appears: � Specify the location where you want to store the file � Type a unique file name for the document � Click the button “Save”
6.2.6.4. Reporting related to process values.
For the reporting functions related to actual process values the same features and procedures are applicable as valid for the parameters. (section 6.2.6.1 en 6.2.6.2) The exception is the process value report is only available in extended version.
6.3 Logging data from a flow meter. After connecting with a flow meter, the default monitoring configuration file included in the “Quick Start” software package will start the logging process automatically. A predefined set of data will be collected from the meter and stored as a file on disk. A field in the status bar at the bottom of the screen will show a field displaying “Log.On” with green background colour.
Figure 6-22: Status bar
In the same field the name of the disk file where the data is stored is displayed between square brackets. When you open the “Monitoring” menu you will observe also a check mark to the left of the option “Logging” when data is actually being logged.
Figure 6-23: Logging (de)activation
You can stop or interrupt the logging process: � Click the option “Logging” The check mark will now disappear, the field in the status bar at the bottom of the screen will become yellow and display “Log.Off”.

Operation & Installation Manual V12-V6 2010-05-31.doc 31/05/2010 46/60
To restart the logging process: � Open the “Monitoring” menu � Click “Logging” The check mark will reappear and the status field will display “Log.On” and turn to green again. Logged data will be stored in a file for each day (provided it is the same meter). The software will automatically assign a name to file where the logged data will be stored, the date will be part of the file name (see also Figure 6-13) When the logging process is restarted - after it has been interrupted – the new data will be appended to the same file as used before (assuming this will happen on the same day). When a new day breaks a new log file will be created even while a logging process is running. Logged data will be stored in a file with “.CSV” format. The file will be stored in the folder: C:\KrohneData\Logging\...........
6.4 Adjusting Meter factor (For Authorised personnel only) A typical adjustment of the parameter settings is the adjustment of the meter factor, This meter factor is determined during calibration and the meter factor can be installed before sealing the Ultrasonic flow meter. This is however dependant on the requirements of the customer. Adjustment of the meter factor for CT applications can only be done under supervision of a calibrating officer. Open the object tree details (view) Open the tree by clicking on “+”
Figure 6-24: Opening object tree
Go to (the numbering within the tree may differ from the example below): � FlowCalculationModule > Configuration > Flow Calcs > MeterConstant_Fwd
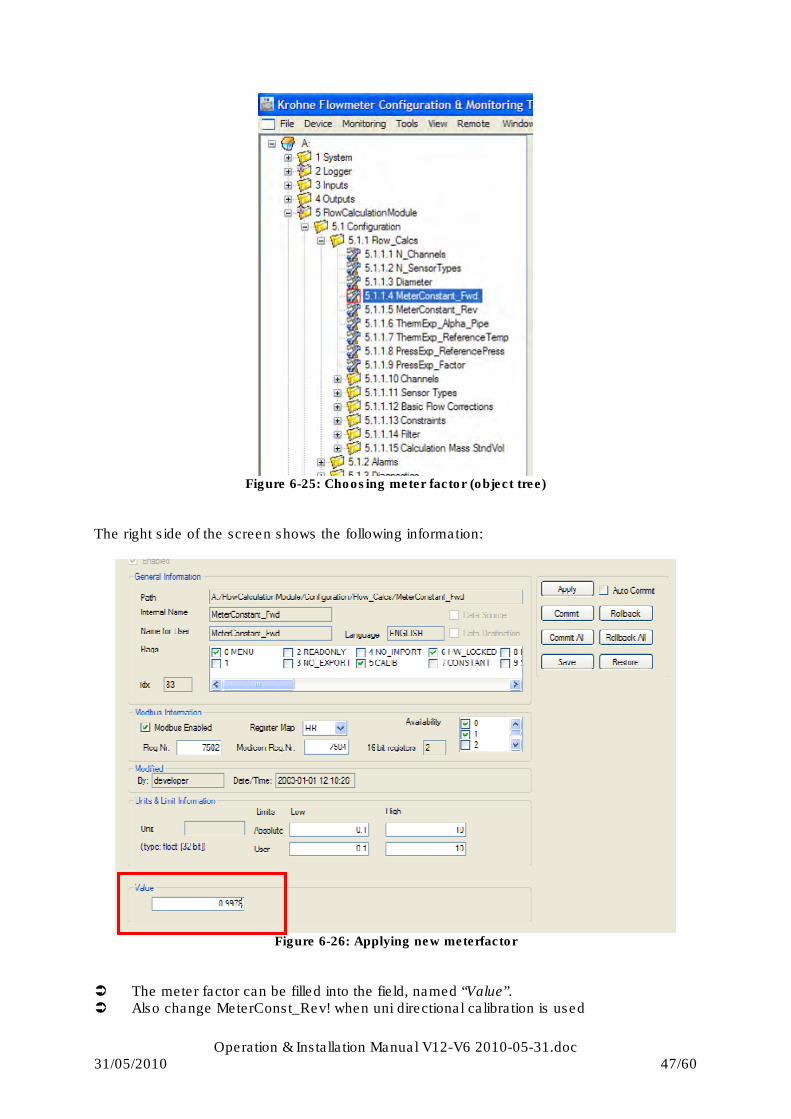
Operation & Installation Manual V12-V6 2010-05-31.doc 31/05/2010 47/60
Figure 6-25: Choosing meter factor (object tree)
The right side of the screen shows the following information:
Figure 6-26: Applying new meterfactor
� The meter factor can be filled into the field, named “Value”. � Also change MeterConst_Rev! when uni directional calibration is used
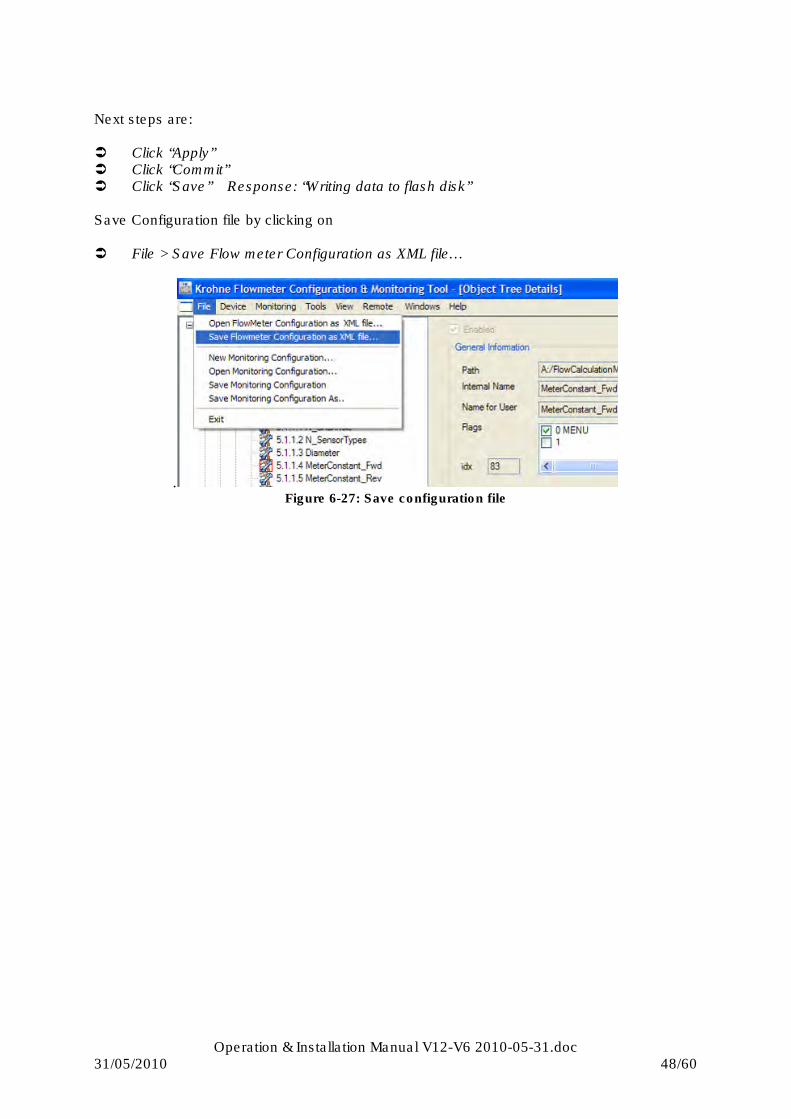
Operation & Installation Manual V12-V6 2010-05-31.doc 31/05/2010 48/60
Next steps are: � Click “Apply” � Click “Commit” � Click “Save” Response: “Writing data to flash disk” Save Configuration file by clicking on � File > Save Flow meter Configuration as XML file…
. Figure 6-27: Save configuration file
Operation & Installation Manual V12-V6 2010-05-31.doc 31/05/2010 49/60
7 Maintenance
7.1 Periodic maintenance The ALTOSONIC V12 has no moving parts that can wear and tear. No service or maintenance is required, unless the meter gets corroded or heavily contaminated. It is however good practice to make a log file (see par. 6.3) on regular basis. It is not to be expected that wear or tear takes place but external influences such as an overflow in a separator or a process failure in a gas treatment plant, may cause a fouling of the meter which may result in a deviations. By making a log file on regular basis such a failure can be pinpointed in time, and as such the financial consequences can be correctly adjusted. The ALTOSONIC V12 also has on board diagnostic features which will produce warnings and or alarms. In a log file information will be stored with much more detail. For even closer monitoring of the ultrasonic flow meter, KROHNE can deliver the “KROHNE
CARE System” that on a regular base automatically collects log data, alarms and captures changes in the flow profile as a result of corrosion, contamination or operating conditions that
otherwise have been changed. If required the KROHNE CARE organises trained process engineers on site to schedule the required visual inspections, validation and calibration frequency of the flow meter (see details in section 7.10).
7.2 Cleaning In case of exceptional growth of contamination inside the meter body, that is detected using
the log file trending, on board diagnostic or KROHNE Care system, the ultrasonic gas flow meter may need dismantling and cleaning.
7.3 Exchange of transducers Transducers are not likely to break down (MTBF > 300 years). In the exceptional situation a transducer fails there are two methods to replace both transducers of an ultrasonic path:
1. Isolate the ultrasonic flow meter with failing path(s). Depressurize the corresponding meter run to atmospheric conditions as per company procedures (continue par.7.3.1).
2. Use a transducer extraction tool to remove the broken transducer(s) under pressure (max. 100 bar(g)). Use the same device to install a new set of transducers (see par.7.3.2).
7.3.1. Exchange of Transducers - Depressurised Condition
DANGER!
Always read instructions for safe handling of the equipment and installations first. Switch off the power supply to the meter and wait at least 1 minute before opening the EXd enclosure. Advisable is also to use a gas detector in detecting possible hazardous environmental conditions. Also during raining conditions make sure no water/rain can penetrate in the electronic housing, same accounts for dusty environments. It s also preferred to disconnect power supply from the equipment by unscrewing the right lid of the electronic housing (see par 5.3.1 & Figure 5-1). After disconnecting close lid fully and attach labels to switching gear to prevent from unwanted switching on again.

Operation & Installation Manual V12-V6 2010-05-31.doc 31/05/2010 50/60
The transducers are installed and fixed mechanically at a very precise manufactured position inside the meter body. To access the transducer position that needs to be replaced use the following instructions: � Remove the top cover plate of the transducer pair to be replaced. � Disconnect the signal cable from the transducers (sel figure 2-7).
o Turn the M2 locking screw a few turns anticlockwise, sufficient to allow the cap to be rotated
o Rotate the cap anticlockwise (a special tool is required) till it can be detached from the transducer,
o Pull the coaxial transducer cable with its connector gently out of the of the transducer
� Remove the hollow nut that fastens the transducer (requires a special tool). � Attach another special tool onto the fine screw thread on top of the transducer and pull
the transducer out of its pocket. � Replace the pair of damaged or malfunctioning transducers with a new pair. � Reassemble locking mechanism, transducer cable and cover in opposite order.
7.3.2. Exchange of Transducers - Pressurised Condition
Transducers can be replaced under pressure, just in case it does happen (MTTR < 15 min.). KROHNE supplies a transducer retraction tool as an option (contact KROHNE for details). The instructions for transducer exchange with this device are found in a specific user manual.
DANGER!
Do not use the retraction tool without having read the specific user manual
Figure 7-1: Transducer extraction tool in initial position
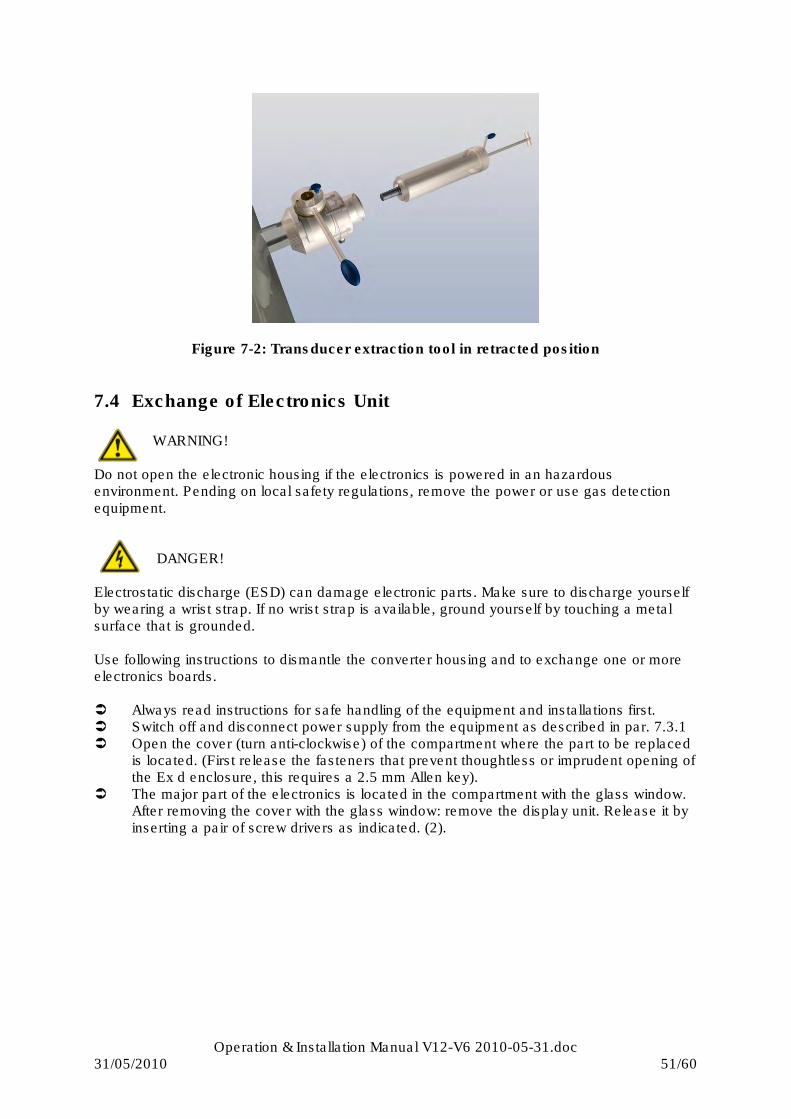
Operation & Installation Manual V12-V6 2010-05-31.doc 31/05/2010 51/60
Figure 7-2: Transducer extraction tool in retracted position
7.4 Exchange of Electronics Unit WARNING!
Do not open the electronic housing if the electronics is powered in an hazardous environment. Pending on local safety regulations, remove the power or use gas detection equipment.
DANGER!
Electrostatic discharge (ESD) can damage electronic parts. Make sure to discharge yourself by wearing a wrist strap. If no wrist strap is available, ground yourself by touching a metal surface that is grounded. Use following instructions to dismantle the converter housing and to exchange one or more electronics boards. � Always read instructions for safe handling of the equipment and installations first. � Switch off and disconnect power supply from the equipment as described in par. 7.3.1 � Open the cover (turn anti-clockwise) of the compartment where the part to be replaced
is located. (First release the fasteners that prevent thoughtless or imprudent opening of the Ex d enclosure, this requires a 2.5 mm Allen key).
� The major part of the electronics is located in the compartment with the glass window. After removing the cover with the glass window: remove the display unit. Release it by inserting a pair of screw drivers as indicated. (2).
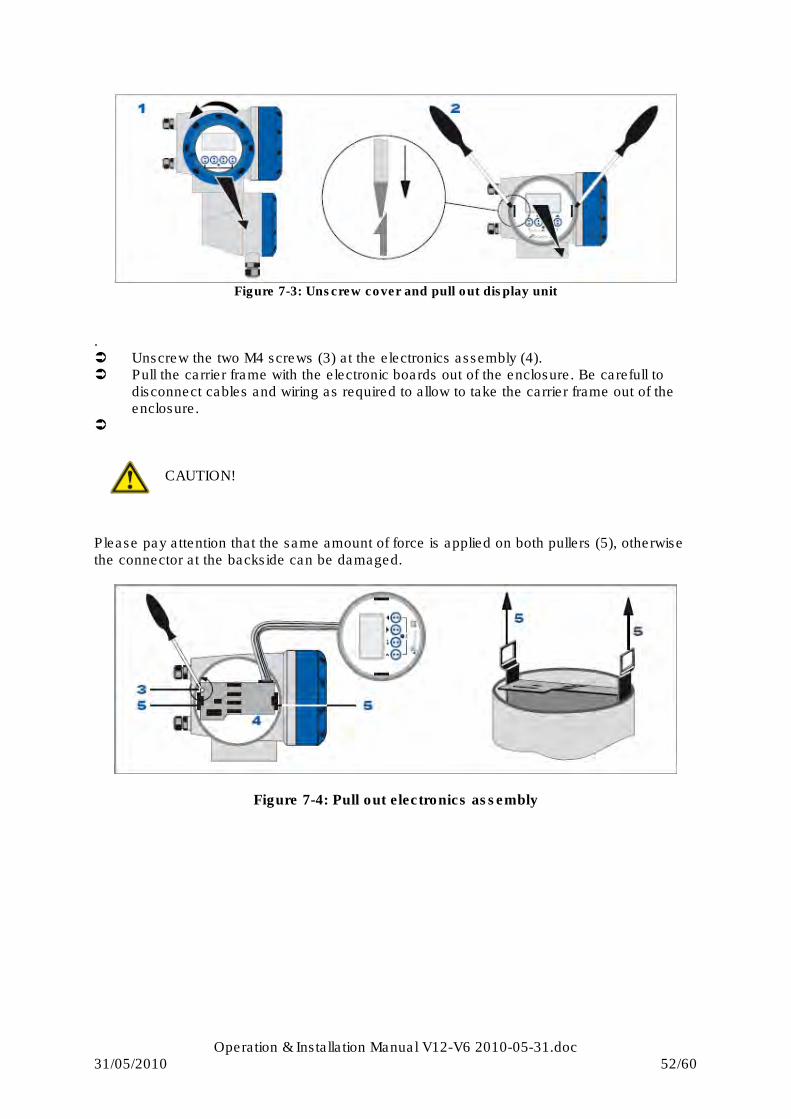
Operation & Installation Manual V12-V6 2010-05-31.doc 31/05/2010 52/60
Figure 7-3: Unscrew cover and pull out display unit
. � Unscrew the two M4 screws (3) at the electronics assembly (4). � Pull the carrier frame with the electronic boards out of the enclosure. Be carefull to
disconnect cables and wiring as required to allow to take the carrier frame out of the enclosure.
�
CAUTION!
Please pay attention that the same amount of force is applied on both pullers (5), otherwise the connector at the backside can be damaged.
Figure 7-4: Pull out electronics assembly
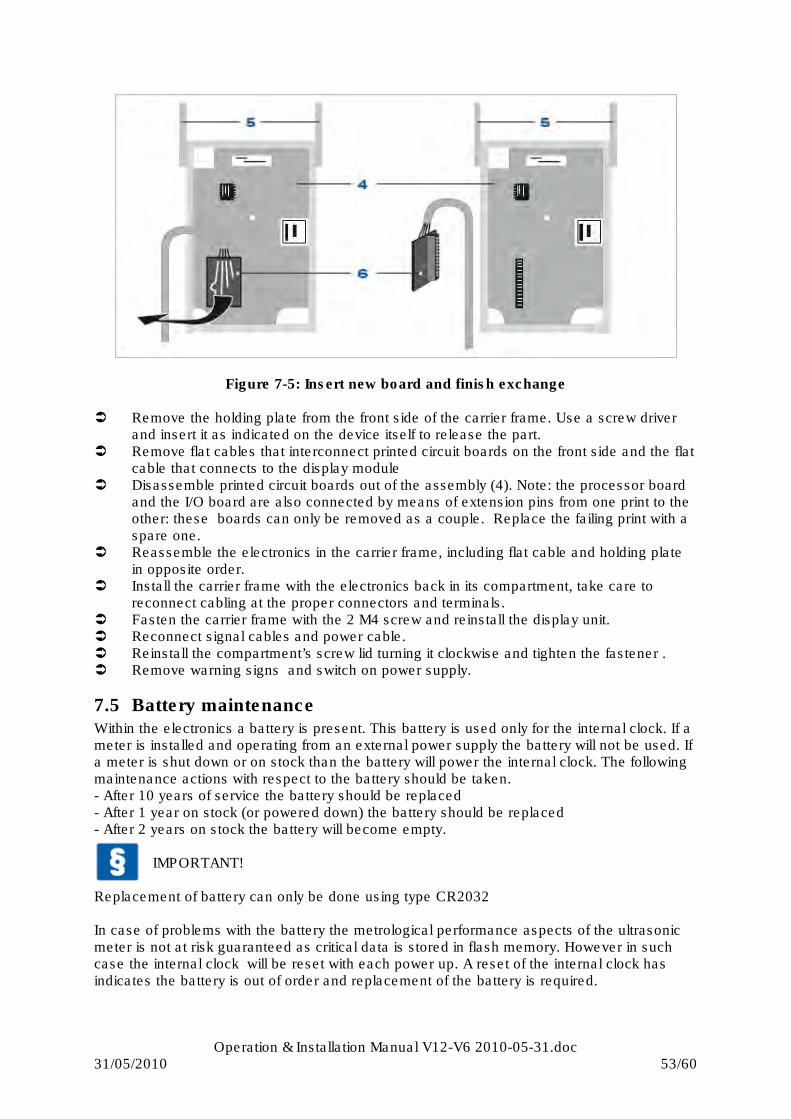
Operation & Installation Manual V12-V6 2010-05-31.doc 31/05/2010 53/60
Figure 7-5: Insert new board and finish exchange � Remove the holding plate from the front side of the carrier frame. Use a screw driver
and insert it as indicated on the device itself to release the part. � Remove flat cables that interconnect printed circuit boards on the front side and the flat
cable that connects to the display module � Disassemble printed circuit boards out of the assembly (4). Note: the processor board
and the I/O board are also connected by means of extension pins from one print to the other: these boards can only be removed as a couple. Replace the failing print with a spare one.
� Reassemble the electronics in the carrier frame, including flat cable and holding plate in opposite order.
� Install the carrier frame with the electronics back in its compartment, take care to reconnect cabling at the proper connectors and terminals.
� Fasten the carrier frame with the 2 M4 screw and reinstall the display unit. � Reconnect signal cables and power cable. � Reinstall the compartment’s screw lid turning it clockwise and tighten the fastener . � Remove warning signs and switch on power supply.
7.5 Battery maintenance Within the electronics a battery is present. This battery is used only for the internal clock. If a meter is installed and operating from an external power supply the battery will not be used. If a meter is shut down or on stock than the battery will power the internal clock. The following maintenance actions with respect to the battery should be taken. - After 10 years of service the battery should be replaced - After 1 year on stock (or powered down) the battery should be replaced - After 2 years on stock the battery will become empty.
IMPORTANT!
Replacement of battery can only be done using type CR2032 In case of problems with the battery the metrological performance aspects of the ultrasonic meter is not at risk guaranteed as critical data is stored in flash memory. However in such case the internal clock will be reset with each power up. A reset of the internal clock has indicates the battery is out of order and replacement of the battery is required.
Operation & Installation Manual V12-V6 2010-05-31.doc 31/05/2010 54/60
7.6 Spare Parts Availability It is the policy of KROHNE to provide operational spare parts for any flow meter or major accessory for a period of ten (10) years after shipment of the final production run of that flow meter model. Operational spare parts are defined as those that are susceptible to failure during their normal operation.
7.7 Service Availability KROHNE provides a variety of services to support its customers after warranty expiration. Repair, technical support and training can be provided.
NOTE!
For detailed information please contact your local KROHNE representative.
7.8 Returning a Device to the Manufacturer
7.8.1. General Information
This ALTOSONIC V12 has been carefully manufactured and tested. If installed and operated in accordance with the operating instructions, it will rarely develop any problems. When using
the KROHNE CARE system it is even possible to monitor the performance of the flow meter continuously and receive online (early) warnings or alarms.
CAUTION!
Nevertheless should it be necessary to return a device to KROHNE for inspection or repair, please pay strict attention to the following points:
• Due to statutory regulations on environmental protection and safeguarding the health and safety of our personnel, KROHNE may only handle, test and repair returned devices that have been in contact with products without risk to personnel and environment.
This means that KROHNE can only service this device if it is accompanied by a signed certificate (Product Return Sheet, example see Appendices) confirming that the device is safe to handle.
CAUTION!
If the device has been operated with toxic, caustic, flammable or water-endangering products, you are kindly requested:
• to check and ensure, if necessary by rinsing or neutralizing, that all cavities are free from such dangerous substances, to enclose a certificate with the device confirming that is safe to handle and stating the product used.
7.9 Disposal CAUTION!
Disposal must be carried out in accordance with legislation applicable in your country.

Operation & Installation Manual V12-V6 2010-05-31.doc 31/05/2010 55/60
7.10 KROHNE Care KROHNE has developed a software system to support condition-based monitoring and
maintenance of various products called KROHE Care. This software provides services to the user to keep track of meter performance and diagnostics. It advises about changes of the flow profile (warnings or alarms) often caused by process contamination and builds a history of maintenance data. Sensitive fiscal data is left out of this maintenance audit trail to avoid any violence of clients’ fiscal data confidentiality. KROHNE stores the maintenance data in an on-line database and offers assistance to inform clients about the performance of their metering equipment on a 24-hour basis.
(KROHE Care will be available from 2010).
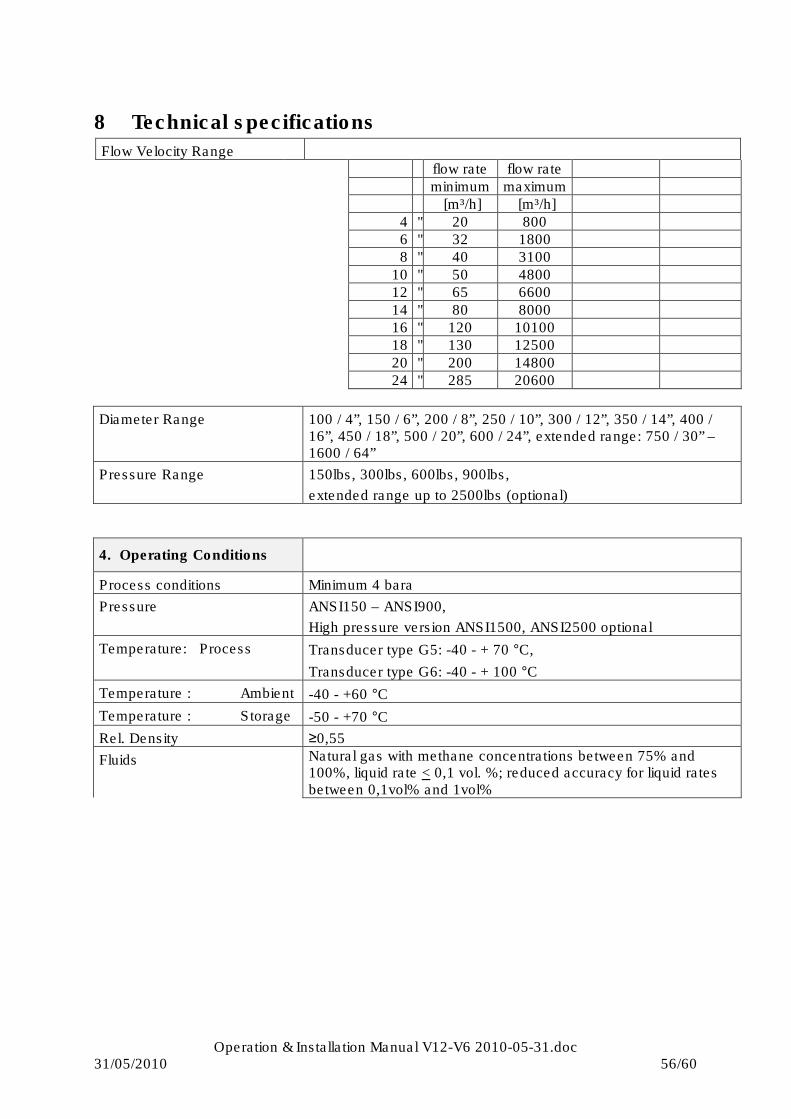
Operation & Installation Manual V12-V6 2010-05-31.doc 31/05/2010 56/60
8 Technical specifications
Flow Velocity Range flow rate flow rate
minimum maximum [m³/h] [m³/h]
4 " 20 800 6 " 32 1800 8 " 40 3100
10 " 50 4800 12 " 65 6600
14 " 80 8000 16 " 120 10100 18 " 130 12500
20 " 200 14800 24 " 285 20600
Diameter Range 100 / 4”, 150 / 6”, 200 / 8”, 250 / 10”, 300 / 12”, 350 / 14”, 400 / 16”, 450 / 18”, 500 / 20”, 600 / 24”, extended range: 750 / 30” – 1600 / 64”
Pressure Range 150lbs, 300lbs, 600lbs, 900lbs,
extended range up to 2500lbs (optional)
4. Operating Conditions
Process conditions Minimum 4 bara
Pressure ANSI150 – ANSI900,
High pressure version ANSI1500, ANSI2500 optional
Temperature: Process Transducer type G5: -40 - + 70 °C,
Transducer type G6: -40 - + 100 °C
Temperature : Ambient -40 - +60 °C
Temperature : Storage -50 - +70 °C
Rel. Density ≥0,55
Fluids Natural gas with methane concentrations between 75% and 100%, liquid rate < 0,1 vol. %; reduced accuracy for liquid rates between 0,1vol% and 1vol%
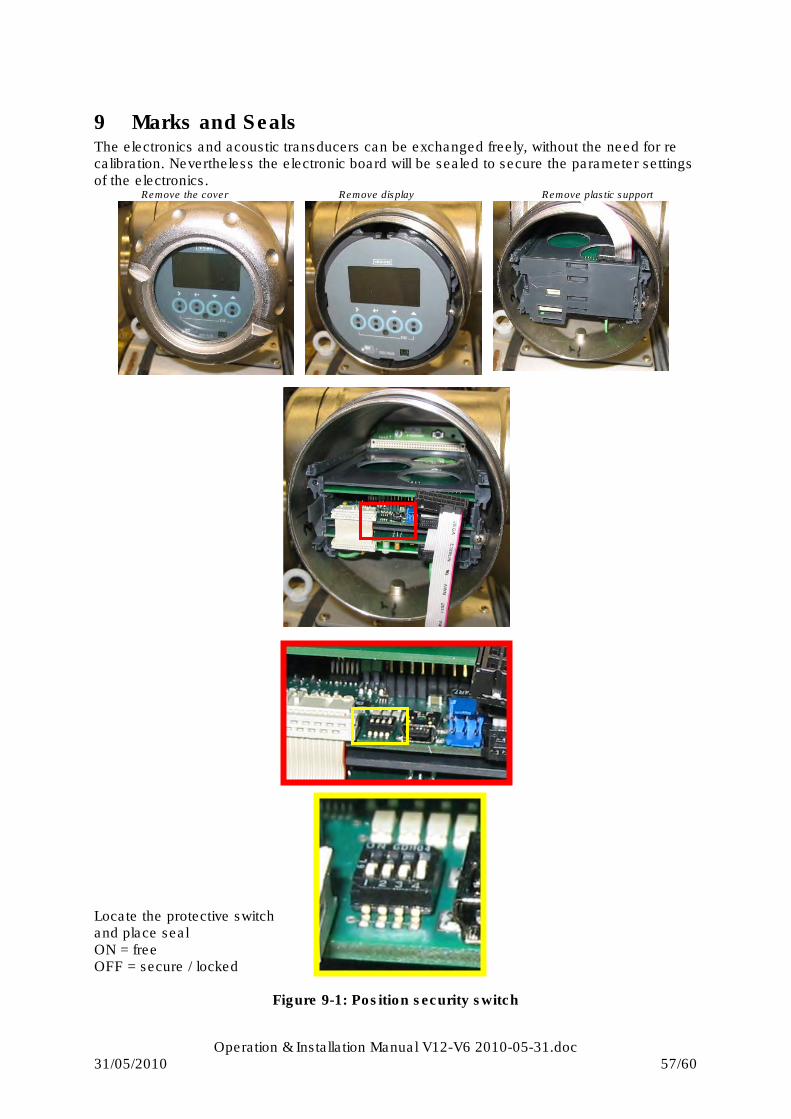
Operation & Installation Manual V12-V6 2010-05-31.doc 31/05/2010 57/60
9 Marks and Seals The electronics and acoustic transducers can be exchanged freely, without the need for re calibration. Nevertheless the electronic board will be sealed to secure the parameter settings of the electronics.
Remove the cover Remove display Remove plastic support
Locate the protective switch and place seal ON = free OFF = secure / locked
Figure 9-1: Position security switch

Operation & Installation Manual V12-V6 2010-05-31.doc 31/05/2010 58/60
Optional it can be decided to seal also the cover of the electronic housing as can seen below
Figure 9-2: External sealing (optional)
Secondly the tag plate needs to be sealed: Example of tag plate (true user tag plate may differ from example below):
Figure 9-3: Tag plate informatio (example)
Location of the tag plate on UFM
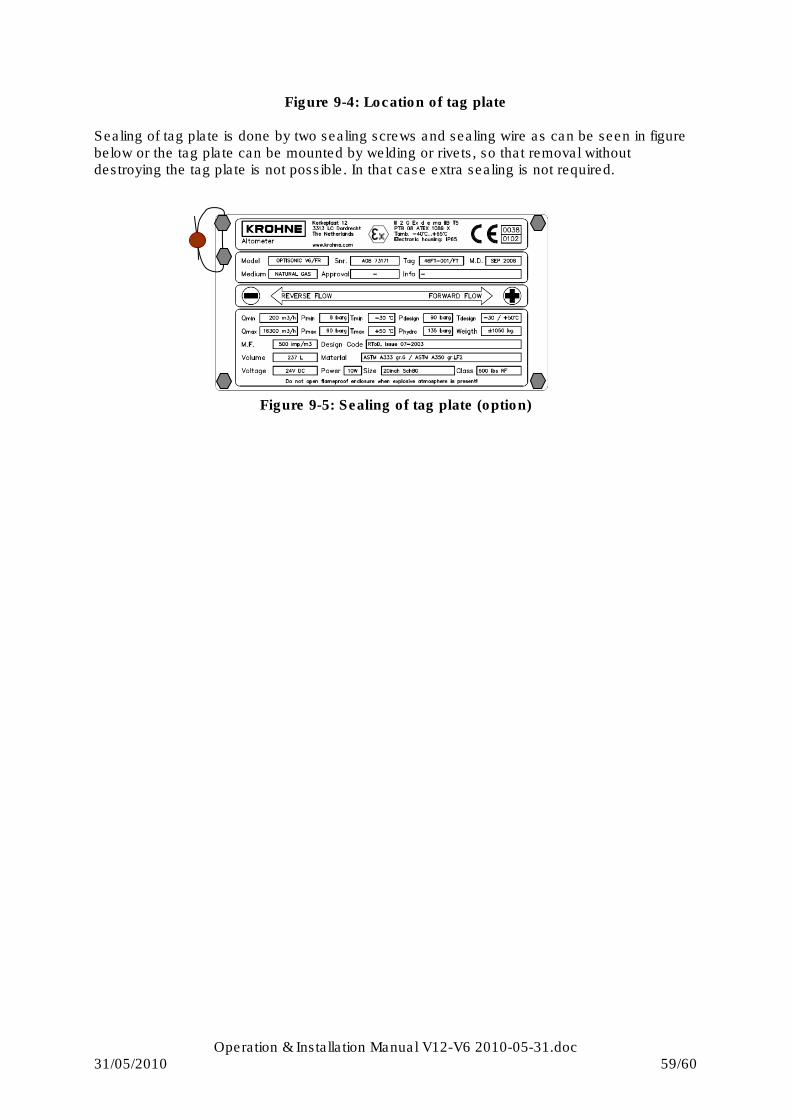
Operation & Installation Manual V12-V6 2010-05-31.doc 31/05/2010 59/60
Figure 9-4: Location of tag plate Sealing of tag plate is done by two sealing screws and sealing wire as can be seen in figure below or the tag plate can be mounted by welding or rivets, so that removal without destroying the tag plate is not possible. In that case extra sealing is not required.
Figure 9-5: Sealing of tag plate (option)

Operation & Installation Manual V12-V6 2010-05-31.doc 31/05/2010 60/60
Figure 2-1: Transit Time Measuring Principle ........................................................................ 8
Figure 2-2: Symmetrical swirl ................................................................................................ 9
Figure 2-3: Asymmetrical swirl..............................................................................................10
Figure 2-4: Swirl Compensation ...........................................................................................10
Figure 2-5: Path configuration and pipe cross section with multiple acoustic paths. .............11
Figure 2-6: Location of sensors and electronics of an ALTOSONIC V12 ..............................12
Figure 2-7: sensor & connector assembly.............................................................................13
Figure 2-8: Small meter body ...............................................................................................14
Figure 2-9: Converter housing ..............................................................................................14
Figure 2-10: Electronic compartments and location of electronics ........................................15
Figure 2-11: Ex d wire bushing .............................................................................................16
Figure 4-1: General installation requirements .......................................................................25
Figure 5-1: Power connection...............................................................................................27
Figure 5-2: Digital & frequecy ouputs....................................................................................28
Figure 5-3: Serial data communication RS485......................................................................29
Figure 5-4: Ground connection .............................................................................................31
Figure 6-1: Display ...............................................................................................................32
Figure 7-1: Menu pull down buttons......................................................................................35
Figure 7-2: Connecting .........................................................................................................35
Figure 7-3: Communication protocol.....................................................................................36
Figure 7-4: User/Password...................................................................................................36
Figure 7-5: User View...........................................................................................................37
Figure 7-6: User View Tabs..................................................................................................37
Figure 7-7: Activating User View ..........................................................................................37
Figure 7-8: Open Monitoring Configuration...........................................................................38
Figure 7-9: Warning monitoring session running...................................................................38
Figure 7-10: Browser configuration monitoring .....................................................................39
Figure 7-11: Start monitoring?..............................................................................................39
Figure 7-12: Open settings menu .........................................................................................39
Figure 7-13: Settings menu ..................................................................................................40
Figure 7-14: Viewing unformatted data.................................................................................40
Figure 7-15: Unformatted data..............................................................................................41
Figure 7-16: Reporting menu................................................................................................41
Figure 7-17: Parameter list ...................................................................................................42
Figure 7-18: Print out of report..............................................................................................42
Figure 7-19: Preview calibration report .................................................................................43
Figure 7-20: Tree visibility ....................................................................................................43
Figure 7-21: Choose data to export (csv)..............................................................................44
Figure 7-22: Status bar.........................................................................................................45
Figure 7-23: Logging (de)activation ......................................................................................45
Figure 7-24: Opening object tree ..........................................................................................46
Figure 7-25: Choosing meter factor (object tree) ..................................................................47
Figure 7-26: Applying new meterfactor .................................................................................47
Figure 7-27: Save configuration file ......................................................................................48
Figure 8-1: Transducer extraction tool in initial position ........................................................50
Figure 8-2: Transducer extraction tool in retracted position ..................................................51
Figure 8-3: Unscrew cover and pull out display unit..............................................................52
Figure 8-4: Pull out electronics assembly .............................................................................52
Figure 8-5: Insert new board and finish exchange ................................................................53
Figure 10-1: Position security switch ....................................................................................57
Figure 10-2: External sealing (optional) ................................................................................58
Figure 10-3: Tag plate informatio (example) .........................................................................58
Figure 10-4: Location of tag plate .........................................................................................59
Figure 10-5: Sealing of tag plate (option)..............................................................................59


![SSNP154 – Benchmark NAFEMS de validation du contac[] › V2 › doc › v12 › fr › man_v › v6 › v6.03... · 2017-12-14 · Responsable : DE SOZA Thomas Clé : V6.03.154](https://img.pdfslide.us/doc/110x75/5f14d681df37931baf1c5847/ssnp154-a-benchmark-nafems-de-validation-du-contac-a-v2-a-doc-a-v12-a.jpg)