Embed Size (px)
Citation preview
Alpha Capital.
The Road ahead – Q4 FY 15
1
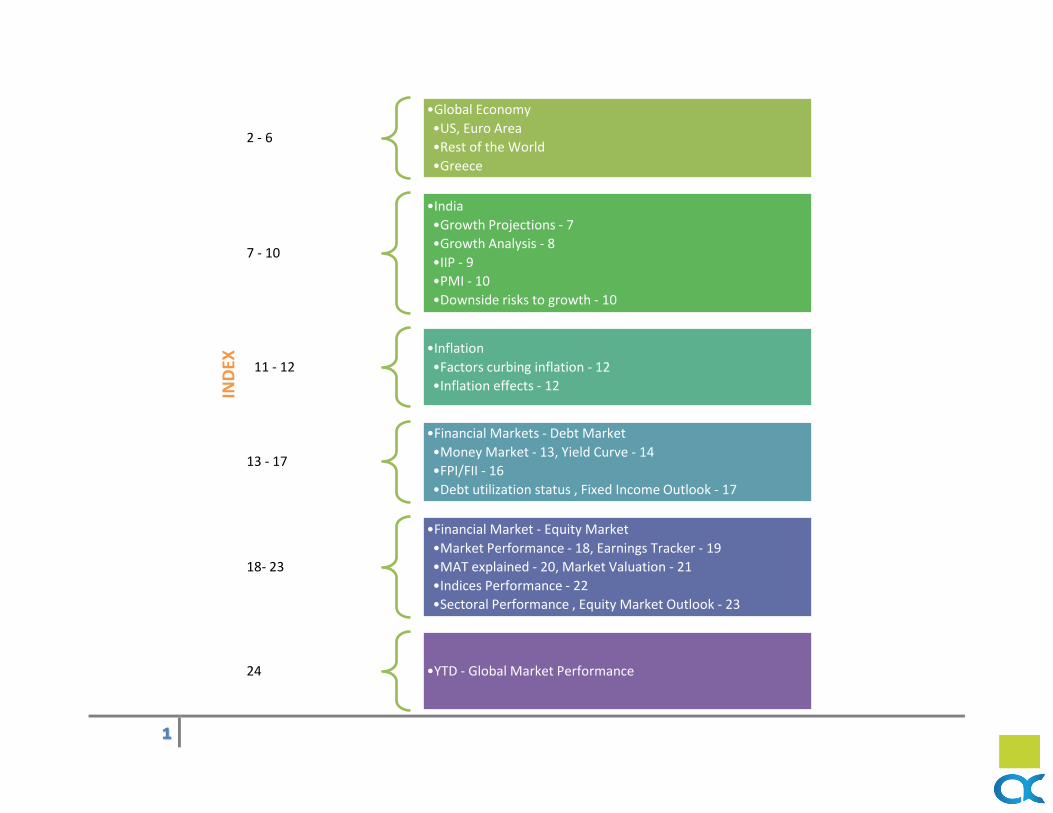
2 - 6
•Global Economy
•US, Euro Area
•Rest of the World
•Greece
7 - 10
•India
•Growth Projections - 7
•Growth Analysis - 8
•IIP - 9
•PMI - 10
•Downside risks to growth - 10
111 - 12
•Inflation
•Factors curbing inflation - 12
•Inflation effects - 12
13 - 17
•Financial Markets - Debt Market
•Money Market - 13, Yield Curve - 14
•FPI/FII - 16
•Debt utilization status , Fixed Income Outlook - 17
18- 23
•Financial Market - Equity Market
•Market Performance - 18, Earnings Tracker - 19
•MAT explained - 20, Market Valuation - 21
•Indices Performance - 22
•Sectoral Performance , Equity Market Outlook - 23
24 •YTD - Global Market Performance
IND
EX
2
GLOBAL ECONOMY
Financial Markets have been volatile since mid-2014, triggered by:
Data releases in US and Fed’s statements on the normalization of monetary policy.
Political tensions in Europe relating to Greece
Lower oil prices
Country specific events All the above factors have impacted investor sentiments worldwide.
UNITED STATES OF AMERICA
Severe weather-related problems for the second winter in a row have deferred output gains into the second and third quarters.
Sharp appreciation in US dollar in recent months could dampen prospects for exports and foreign earnings.
Renewed slump in durable goods orders over the past six months has been observed.
Incoming data suggest a deceleration in business spending, partly reflecting the decline in equipment spending in oil-related industries.
A fairly robust bounce back in US activity is expected in months ahead aided by:
Improving labour and housing market conditions.
Increase in demand as lower gas prices increase the purchasing power of households. A rebound in housing-related activity is expected after inclement weather held back home sales in the first two months of the quarter.
In US inflation has been declining since the second half of 2014, with zero inflation in February. Appreciation of the dollar has also had a disinflationary effect.
3
Euro Area In Euro area, economic conditions remain weak although some pick up in Q4 of 2014 and early months of 2015 is being observed. Factors supporting euro growth:
Lower crude prices
Depreciation in Euro
Increase in bank lending
Quantitative easing by ECB
Euro area is struggling to emerge out of a deflationary spiral with CPI inflation of -0.1% in March.
Rest of the world
Japan – Consumer confidence and exports show improvement, but retail sales and industrial production have contracted. CPI inflation has shrugged off the effects of the hike in the consumption tax in April 2014 and has fallen to 2.2% primarily driven by falling commodity prices.
China – investment demand lost pace and the real estate sector weakened. China faces risk of deflation due to weak domestic demand and falling factory prices.
Peoples Bank of China has cut the reserve requirement ratio by 1% making it 18.5% (effective from 20th Apr, 2015), thereby increasing liquidity in the market to fight the slowdown its economy is currently staring into.
Russia – Economy slowed due to sharply falling oil prices and western sanctions. High inflation is observed due to substantial currency depreciation and domestic factors.
Brazil – High inflation squeezed domestic demand.
Middle East, Eastern Europe, Latin America – Falling oil and commodity prices weighed on growth prospects.
4
What happened in Greece?
Greece became the epicenter of Europe’s debt crisis after Wall Street imploded in 2008.
In October 2009, Greece announced that it had been understating its deficit figures for years, raising alarms about the soundness of Greek finances.
Suddenly, Greece was shut out from borrowing in the financial markets.
By the spring of 2010, it was veering toward bankruptcy, which threatened to set off a new financial crisis.
To avert calamity, the so-called troika — the International Monetary Fund, the European Central Bank and the European Commission — issued the first of two international bailouts for Greece, which eventually totaled 240 billion euros.
The bailouts came with conditions. Lenders imposed harsh austerity terms, requiring deep budget cuts and steep tax increases. They also required Greece to overhaul its economy by streamlining the government, ending tax evasion and making Greece an easier place to do business.
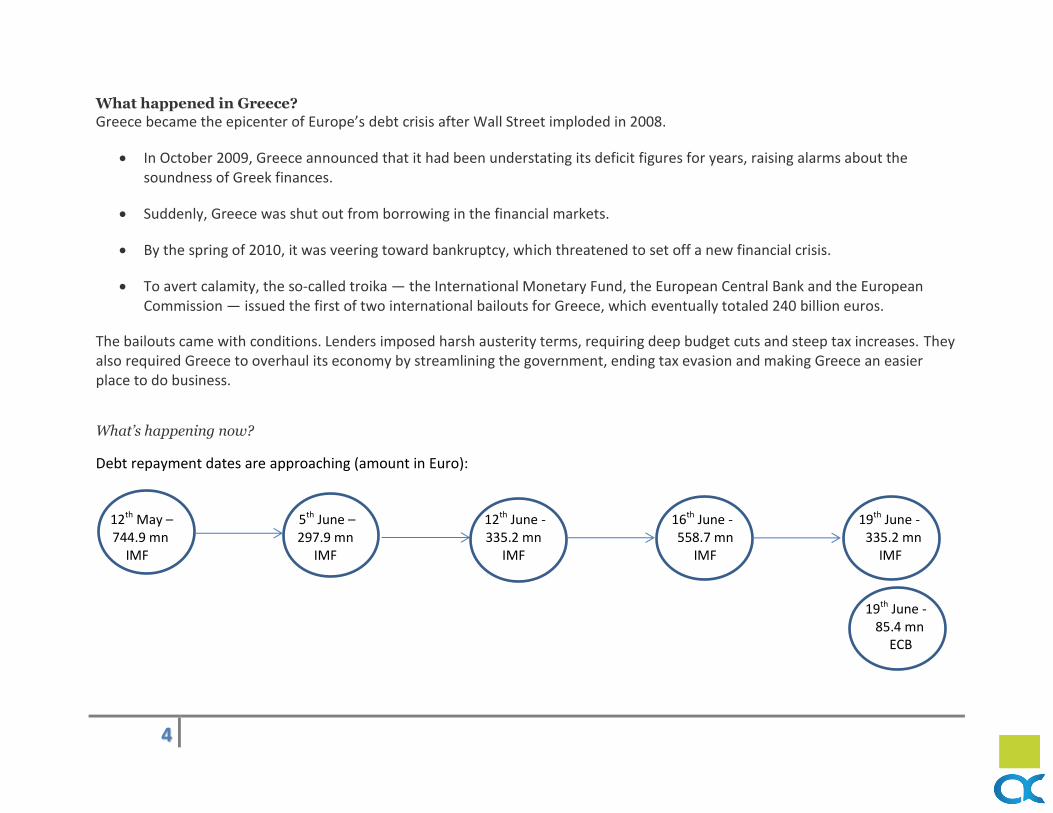
What’s happening now?
Debt repayment dates are approaching (amount in Euro): 12th May – 5th June – 12th June - 16th June - 19th June - 744.9 mn 297.9 mn 335.2 mn 558.7 mn 335.2 mn IMF IMF IMF IMF IMF 19th June - 85.4 mn ECB
5
Hence a big repayment schedule looms over the head of Greece. In a desperate attempt to avoid the default Greece has asked its local, regional and public bodies to handover their spare cash to central bank. Deputy prime minister has talked to the Russian president in what appeared to be a reminder to the rest of the EU that he had other options in the event of Greece being forced out of the Euro. Many experts are worried that Greece’s problems would spill over into the rest of the world. If Greece defaulted on its debt and exited the Eurozone, it could create global financial shocks bigger than the collapse of Lehman Brothers.

6
INDIA
7
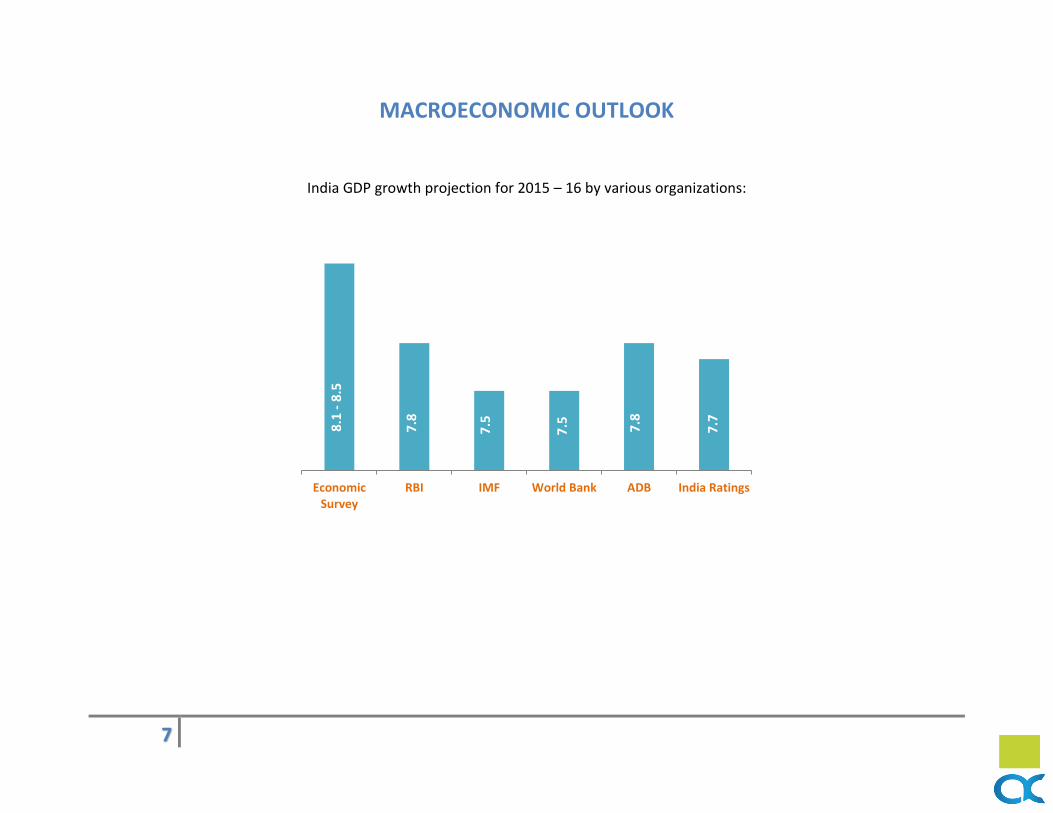
MACROECONOMIC OUTLOOK
India GDP growth projection for 2015 – 16 by various organizations:
EconomicSurvey
RBI IMF World Bank ADB India Ratings
8.1
- 8
.5
7.8
7.5
7.5
7.8
7.7
8
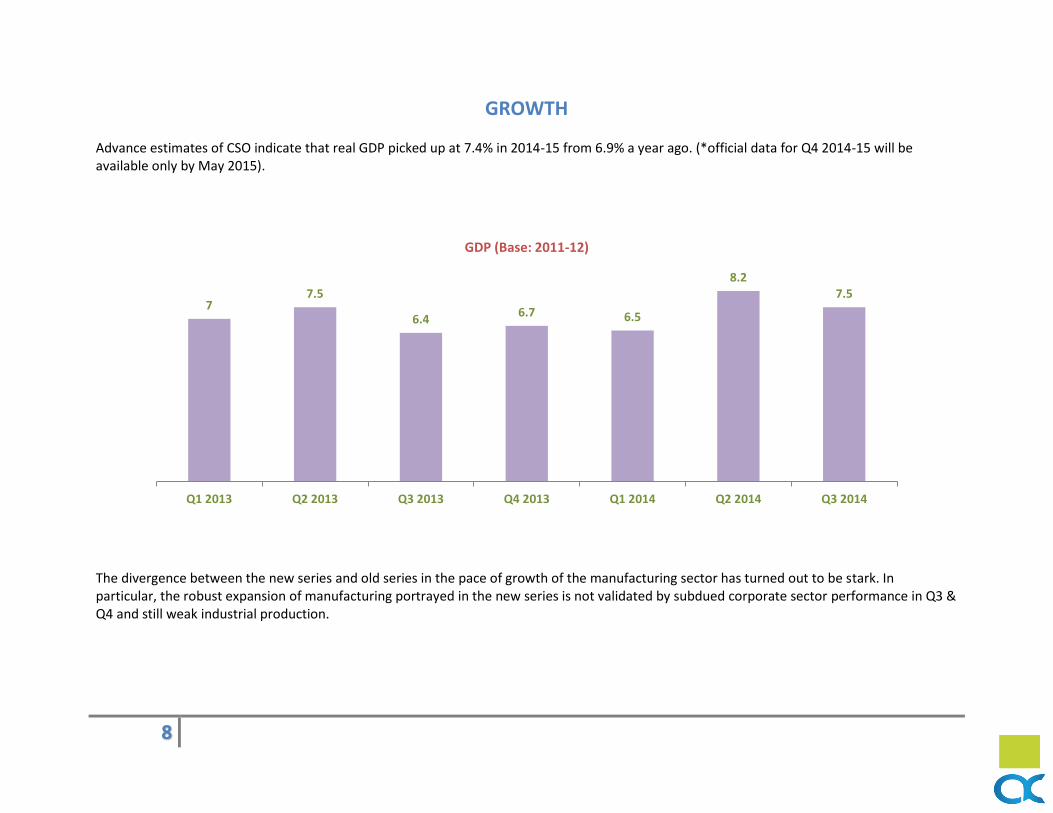
GROWTH Advance estimates of CSO indicate that real GDP picked up at 7.4% in 2014-15 from 6.9% a year ago. (*official data for Q4 2014-15 will be available only by May 2015).
The divergence between the new series and old series in the pace of growth of the manufacturing sector has turned out to be stark. In particular, the robust expansion of manufacturing portrayed in the new series is not validated by subdued corporate sector performance in Q3 & Q4 and still weak industrial production.
7 7.5
6.4 6.7 6.5
8.2 7.5
Q1 2013 Q2 2013 Q3 2013 Q4 2013 Q1 2014 Q2 2014 Q3 2014
GDP (Base: 2011-12)
9
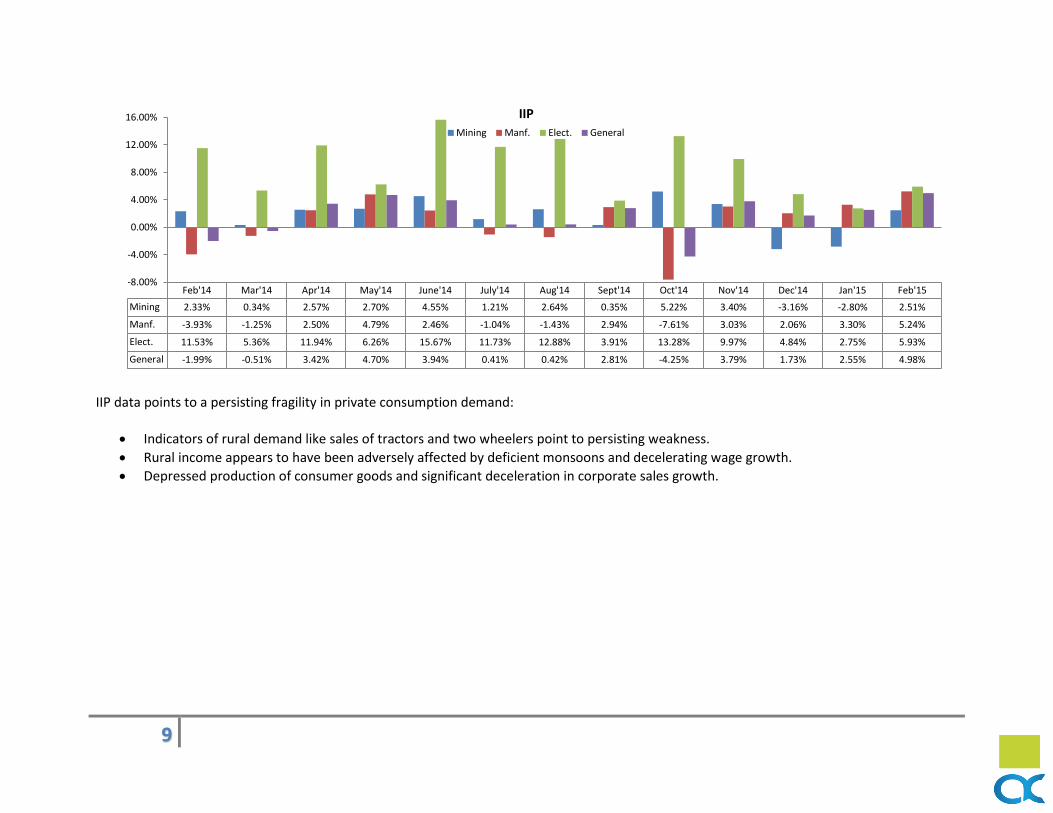
IIP data points to a persisting fragility in private consumption demand:
Indicators of rural demand like sales of tractors and two wheelers point to persisting weakness.
Rural income appears to have been adversely affected by deficient monsoons and decelerating wage growth.
Depressed production of consumer goods and significant deceleration in corporate sales growth.
Feb'14 Mar'14 Apr'14 May'14 June'14 July'14 Aug'14 Sept'14 Oct'14 Nov'14 Dec'14 Jan'15 Feb'15
Mining 2.33% 0.34% 2.57% 2.70% 4.55% 1.21% 2.64% 0.35% 5.22% 3.40% -3.16% -2.80% 2.51%
Manf. -3.93% -1.25% 2.50% 4.79% 2.46% -1.04% -1.43% 2.94% -7.61% 3.03% 2.06% 3.30% 5.24%
Elect. 11.53% 5.36% 11.94% 6.26% 15.67% 11.73% 12.88% 3.91% 13.28% 9.97% 4.84% 2.75% 5.93%
General -1.99% -0.51% 3.42% 4.70% 3.94% 0.41% 0.42% 2.81% -4.25% 3.79% 1.73% 2.55% 4.98%
-8.00%
-4.00%
0.00%
4.00%
8.00%
12.00%
16.00% IIP
Mining Manf. Elect. General
10
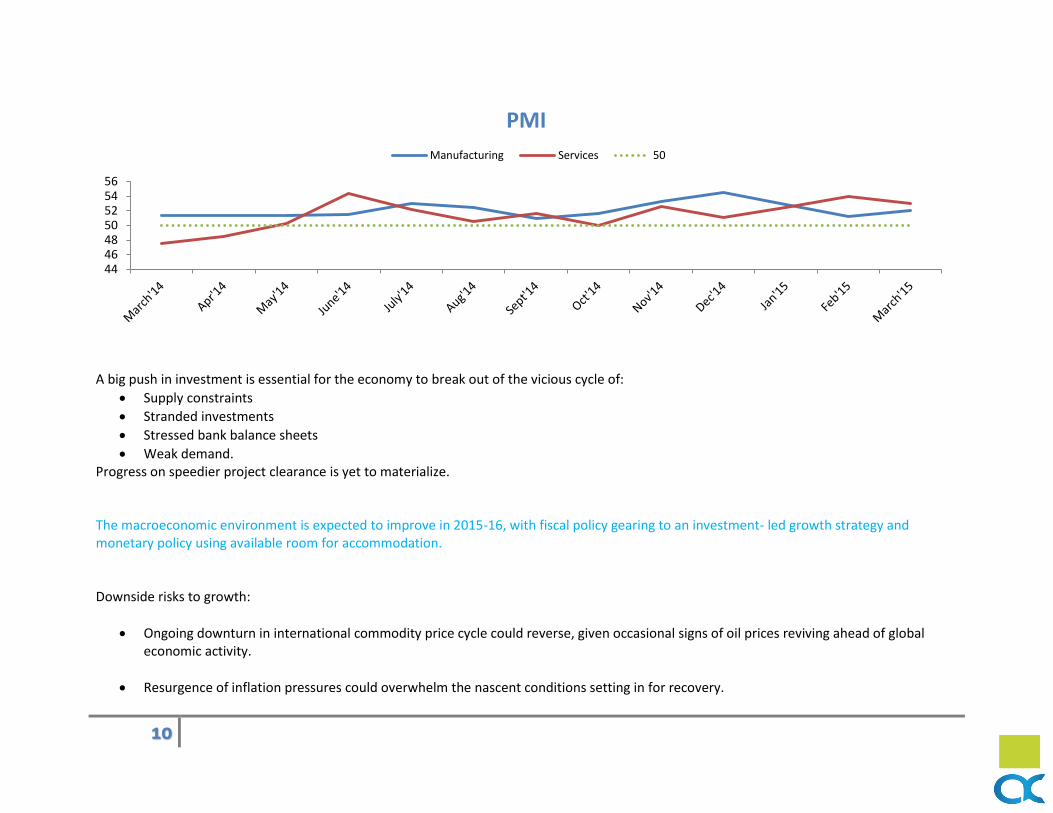
A big push in investment is essential for the economy to break out of the vicious cycle of:
Supply constraints
Stranded investments
Stressed bank balance sheets
Weak demand. Progress on speedier project clearance is yet to materialize. The macroeconomic environment is expected to improve in 2015-16, with fiscal policy gearing to an investment- led growth strategy and monetary policy using available room for accommodation. Downside risks to growth:
Ongoing downturn in international commodity price cycle could reverse, given occasional signs of oil prices reviving ahead of global economic activity.
Resurgence of inflation pressures could overwhelm the nascent conditions setting in for recovery.
44464850525456
PMI
Manufacturing Services 50
11
Risks to budgetary forecasts from tax shortfalls, subsidy overshoots and disinvestment under-realization could impact the level of budgeted allocation for capital expenditure.
Uneven monsoon pattern may dent the agriculture outlook.
If gross savings as percentage of gross national disposable income continues its declining trend from 33% in 2011-12 to 30% in 2013-14, it could tighten the financial constraint to growth unless productivity improves significantly.
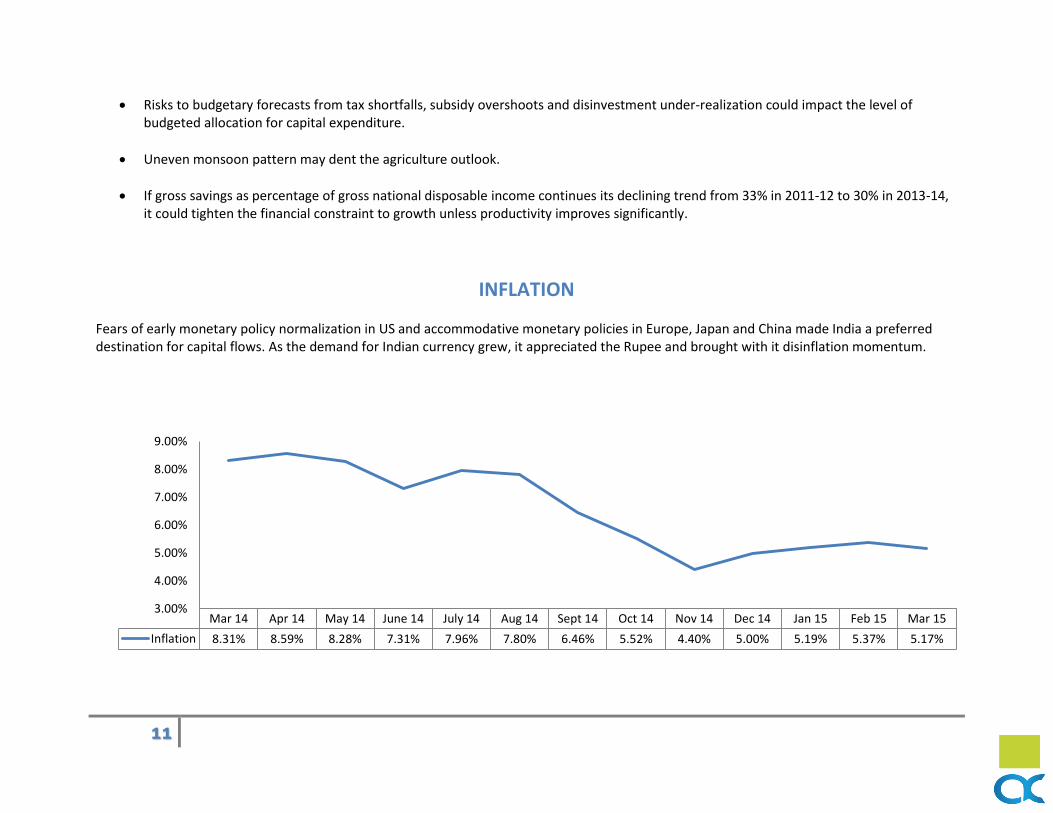
INFLATION Fears of early monetary policy normalization in US and accommodative monetary policies in Europe, Japan and China made India a preferred destination for capital flows. As the demand for Indian currency grew, it appreciated the Rupee and brought with it disinflation momentum.
Mar 14 Apr 14 May 14 June 14 July 14 Aug 14 Sept 14 Oct 14 Nov 14 Dec 14 Jan 15 Feb 15 Mar 15
Inflation 8.31% 8.59% 8.28% 7.31% 7.96% 7.80% 6.46% 5.52% 4.40% 5.00% 5.19% 5.37% 5.17%
3.00%
4.00%
5.00%
6.00%
7.00%
8.00%
9.00%
12
FACTORS CURBING INFLATION
Proactive supply management strategies
Moderation in the pace of increase in MSP
Sharp deceleration in rural wage growth Professional forecasters expect CPI inflation to average between 5 – 6 percent in 2015 – 16. According to RBI CPI inflation will remain below the target of 6% set for January 2016. It is expected to hover around 5% in the first half of 2015-16 and a little above 5.5% in the second half. INFLATION EFFECTS
In FY 2015, India import prices declined faster than export prices, thereby conferring unexpected gains in net terms of trade as well as an appreciable easing of imported inflationary pressures.
Large declines in commodity prices and the benign inflation outlook for the near term should provide boost to growth.
13
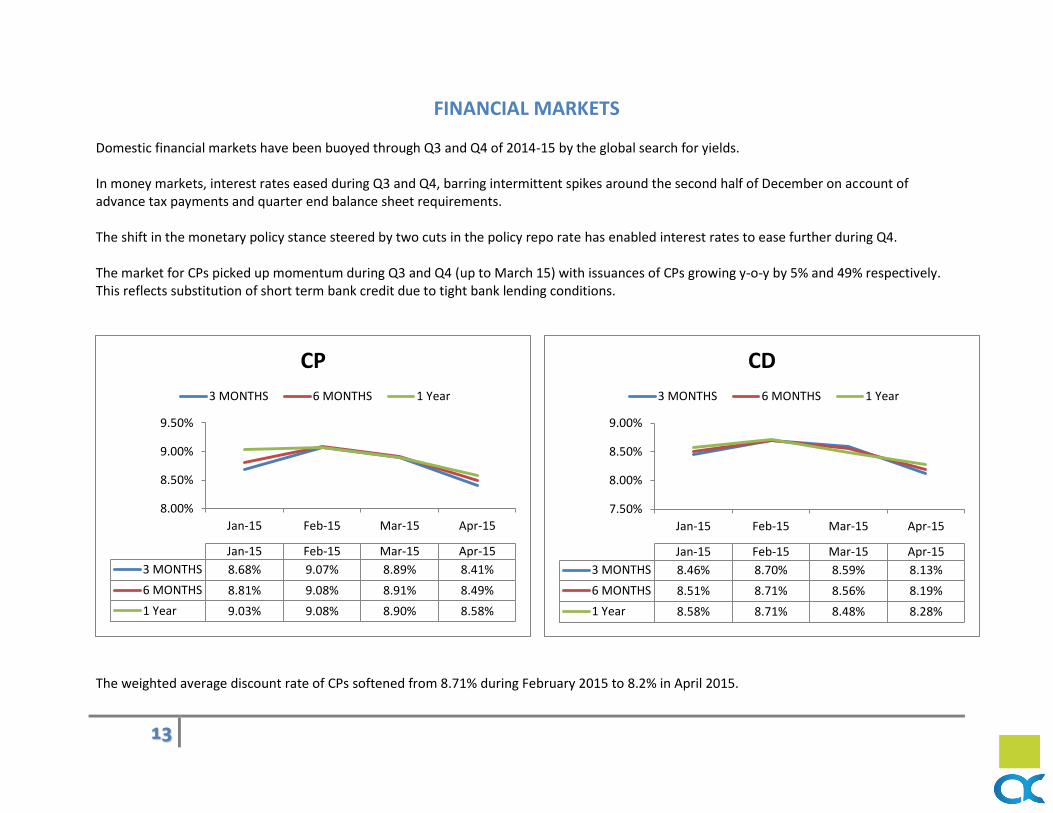
FINANCIAL MARKETS Domestic financial markets have been buoyed through Q3 and Q4 of 2014-15 by the global search for yields. In money markets, interest rates eased during Q3 and Q4, barring intermittent spikes around the second half of December on account of advance tax payments and quarter end balance sheet requirements. The shift in the monetary policy stance steered by two cuts in the policy repo rate has enabled interest rates to ease further during Q4. The market for CPs picked up momentum during Q3 and Q4 (up to March 15) with issuances of CPs growing y-o-y by 5% and 49% respectively. This reflects substitution of short term bank credit due to tight bank lending conditions.
The weighted average discount rate of CPs softened from 8.71% during February 2015 to 8.2% in April 2015.
7.50%
8.00%
8.50%
9.00%
Jan-15 Feb-15 Mar-15 Apr-15
Jan-15 Feb-15 Mar-15 Apr-15
3 MONTHS 8.46% 8.70% 8.59% 8.13%
6 MONTHS 8.51% 8.71% 8.56% 8.19%
1 Year 8.58% 8.71% 8.48% 8.28%
CD
3 MONTHS 6 MONTHS 1 Year
8.00%
8.50%
9.00%
9.50%
Jan-15 Feb-15 Mar-15 Apr-15
Jan-15 Feb-15 Mar-15 Apr-15
3 MONTHS 8.68% 9.07% 8.89% 8.41%
6 MONTHS 8.81% 9.08% 8.91% 8.49%
1 Year 9.03% 9.08% 8.90% 8.58%
CP
3 MONTHS 6 MONTHS 1 Year
14
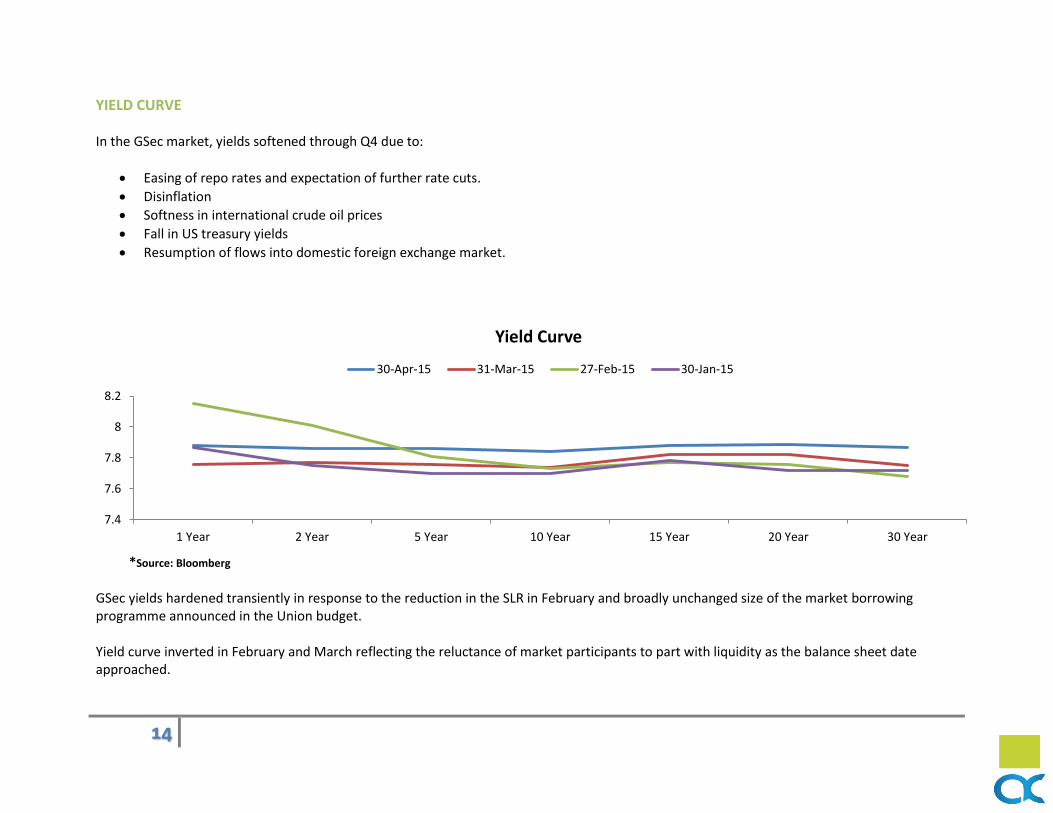
YIELD CURVE In the GSec market, yields softened through Q4 due to:
Easing of repo rates and expectation of further rate cuts.
Disinflation
Softness in international crude oil prices
Fall in US treasury yields
Resumption of flows into domestic foreign exchange market.
*Source: Bloomberg GSec yields hardened transiently in response to the reduction in the SLR in February and broadly unchanged size of the market borrowing programme announced in the Union budget. Yield curve inverted in February and March reflecting the reluctance of market participants to part with liquidity as the balance sheet date approached.
7.4
7.6
7.8
8
8.2
1 Year 2 Year 5 Year 10 Year 15 Year 20 Year 30 Year
Yield Curve
30-Apr-15 31-Mar-15 27-Feb-15 30-Jan-15
15
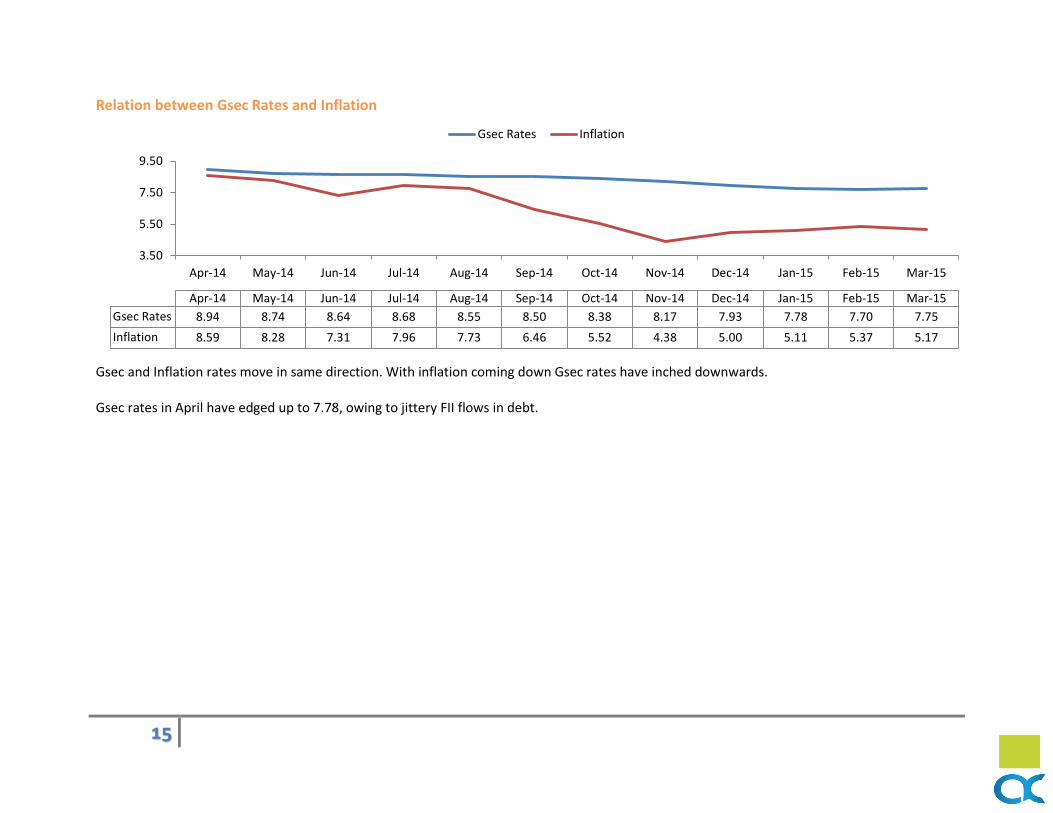
Relation between Gsec Rates and Inflation
Gsec and Inflation rates move in same direction. With inflation coming down Gsec rates have inched downwards. Gsec rates in April have edged up to 7.78, owing to jittery FII flows in debt.
3.50
5.50
7.50
9.50
Apr-14 May-14 Jun-14 Jul-14 Aug-14 Sep-14 Oct-14 Nov-14 Dec-14 Jan-15 Feb-15 Mar-15
Apr-14 May-14 Jun-14 Jul-14 Aug-14 Sep-14 Oct-14 Nov-14 Dec-14 Jan-15 Feb-15 Mar-15
Gsec Rates 8.94 8.74 8.64 8.68 8.55 8.50 8.38 8.17 7.93 7.78 7.70 7.75
Inflation 8.59 8.28 7.31 7.96 7.73 6.46 5.52 4.38 5.00 5.11 5.37 5.17
Gsec Rates Inflation
16
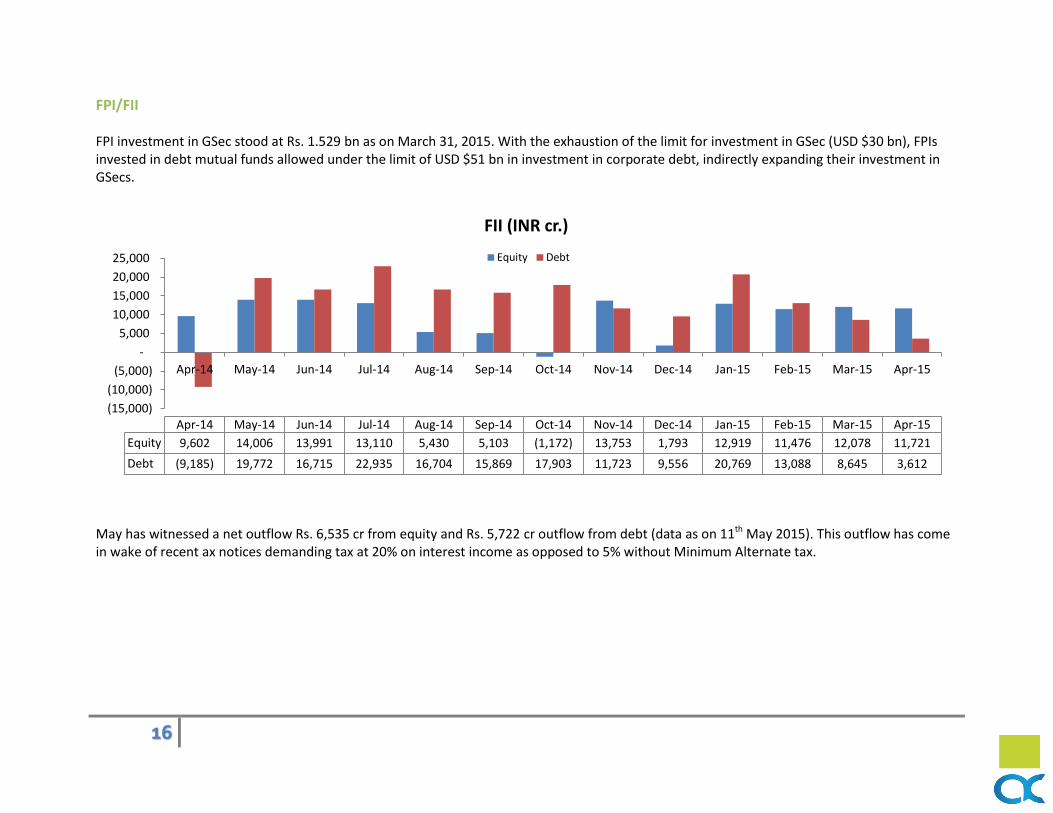
FPI/FII FPI investment in GSec stood at Rs. 1.529 bn as on March 31, 2015. With the exhaustion of the limit for investment in GSec (USD $30 bn), FPIs invested in debt mutual funds allowed under the limit of USD $51 bn in investment in corporate debt, indirectly expanding their investment in GSecs.
May has witnessed a net outflow Rs. 6,535 cr from equity and Rs. 5,722 cr outflow from debt (data as on 11th May 2015). This outflow has come in wake of recent ax notices demanding tax at 20% on interest income as opposed to 5% without Minimum Alternate tax.
(15,000)
(10,000)
(5,000)
-
5,000
10,000
15,000
20,000
25,000
Apr-14 May-14 Jun-14 Jul-14 Aug-14 Sep-14 Oct-14 Nov-14 Dec-14 Jan-15 Feb-15 Mar-15 Apr-15
Apr-14 May-14 Jun-14 Jul-14 Aug-14 Sep-14 Oct-14 Nov-14 Dec-14 Jan-15 Feb-15 Mar-15 Apr-15
Equity 9,602 14,006 13,991 13,110 5,430 5,103 (1,172) 13,753 1,793 12,919 11,476 12,078 11,721
Debt (9,185) 19,772 16,715 22,935 16,704 15,869 17,903 11,723 9,556 20,769 13,088 8,645 3,612
FII (INR cr.)
Equity Debt
17
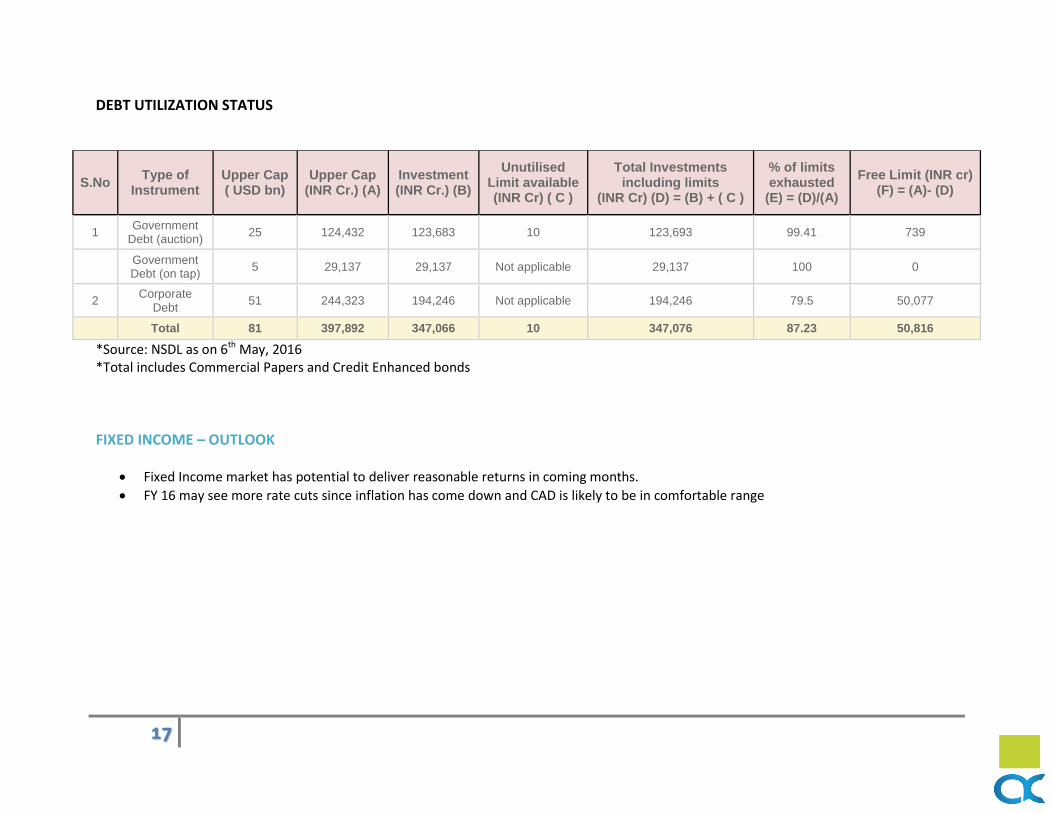
DEBT UTILIZATION STATUS
S.No Type of
Instrument Upper Cap ( USD bn)
Upper Cap (INR Cr.) (A)
Investment (INR Cr.) (B)
Unutilised Limit available (INR Cr) ( C )
Total Investments including limits
(INR Cr) (D) = (B) + ( C )
% of limits exhausted
(E) = (D)/(A)
Free Limit (INR cr) (F) = (A)- (D)
1 Government
Debt (auction) 25 124,432 123,683 10 123,693 99.41 739
Government Debt (on tap)
5 29,137 29,137 Not applicable 29,137 100 0
2 Corporate
Debt 51 244,323 194,246 Not applicable 194,246 79.5 50,077
Total 81 397,892 347,066 10 347,076 87.23 50,816
*Source: NSDL as on 6th May, 2016 *Total includes Commercial Papers and Credit Enhanced bonds
FIXED INCOME – OUTLOOK
Fixed Income market has potential to deliver reasonable returns in coming months.
FY 16 may see more rate cuts since inflation has come down and CAD is likely to be in comfortable range
18
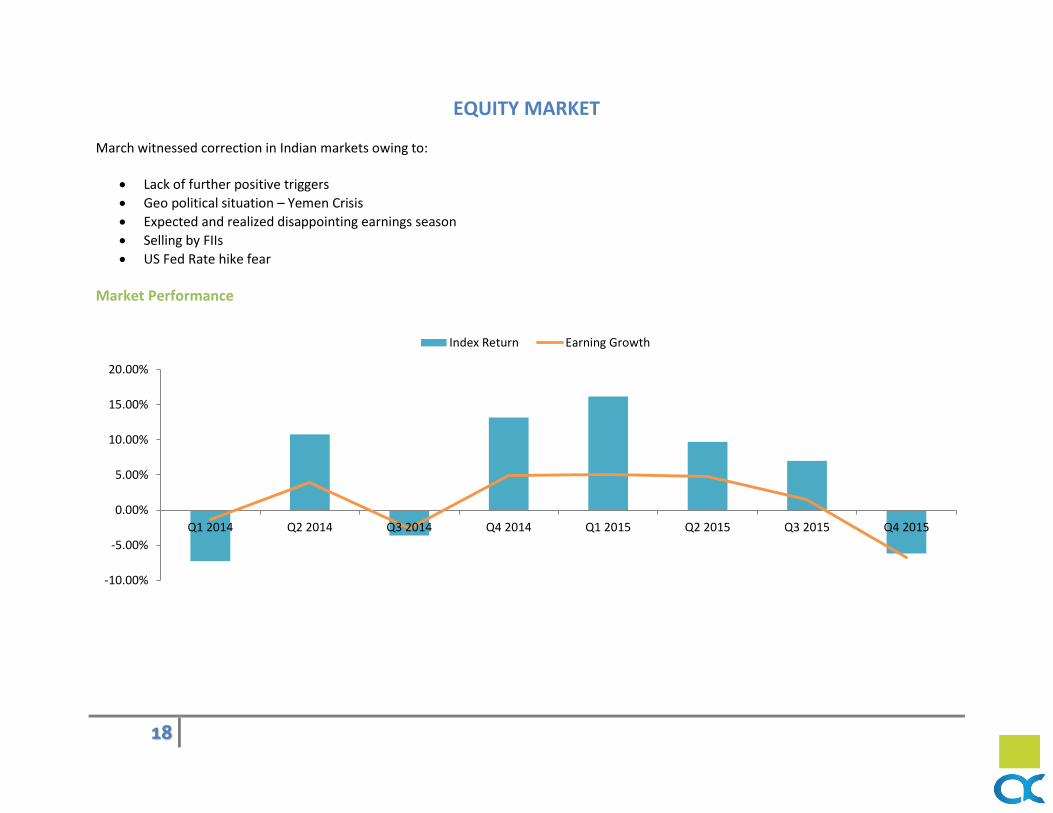
EQUITY MARKET March witnessed correction in Indian markets owing to:
Lack of further positive triggers
Geo political situation – Yemen Crisis
Expected and realized disappointing earnings season
Selling by FIIs
US Fed Rate hike fear
Market Performance
-10.00%
-5.00%
0.00%
5.00%
10.00%
15.00%
20.00%
Q1 2014 Q2 2014 Q3 2014 Q4 2014 Q1 2015 Q2 2015 Q3 2015 Q4 2015
Index Return Earning Growth
19
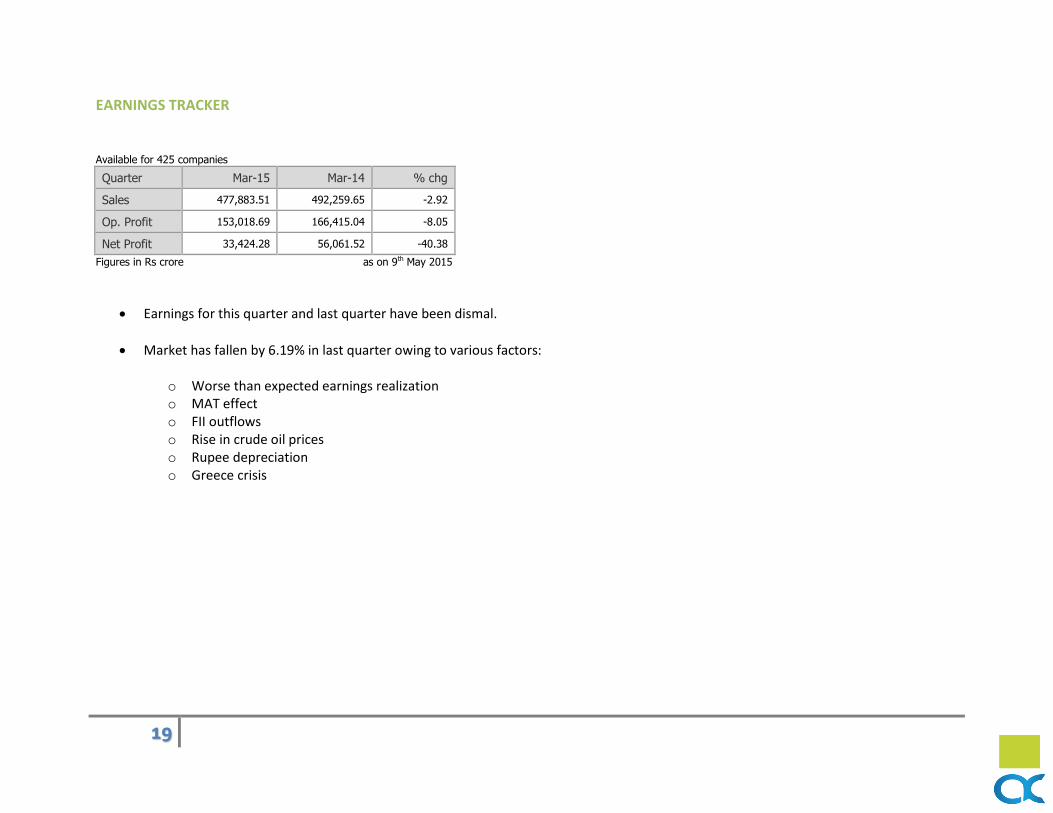
EARNINGS TRACKER Available for 425 companies
Quarter Mar-15 Mar-14 % chg
Sales 477,883.51 492,259.65 -2.92
Op. Profit 153,018.69 166,415.04 -8.05
Net Profit 33,424.28 56,061.52 -40.38
Figures in Rs crore as on 9th May 2015
Earnings for this quarter and last quarter have been dismal.
Market has fallen by 6.19% in last quarter owing to various factors:
o Worse than expected earnings realization o MAT effect o FII outflows o Rise in crude oil prices o Rupee depreciation o Greece crisis
20
What is MAT? MAT is an addition to income tax levied by Indian Tax authority. It was introduced in 1997-98 to avoid paying taxes. As per this rule, every company has to pay tax @18% even if its effective tax rate is lower. What does policy say? Finance Minister Arun Jaitley announced that MAT would not be applicable for Foreign Portfolio Investors (FPIs). This means they need not to pay 18% tax on their book profits. This was to be applicable from April 2015 Onwards. However investor had to pay MAT in previous years. Although Govt said that MAT would not be applicable for investors trading from countries which have tax treatment like DTAA with India. Tax Notice to FIIs: Tax Officials sent tax notices to 100 Foreign Investors for three years preceding 2015.They have demanded for tax payment amount to nearly Rs 40,000 Crore. Aftermath: With this news spreading, FIIs have limited their participation in the stock markets. FIIs started selling because of this issue and Market plunges to 26400 level. Current Scenario: FIIs which do not have any tax treaty with India have approached Supreme Court. Now, it depends on the Supreme Court to decide if FII will indeed have to pay billions of dollars of tax. However there is no clarity till date for the court hearing. The government has set up a high-level committee on minimum alternate tax (MAT) on foreign institutional investors (FIIs).
21
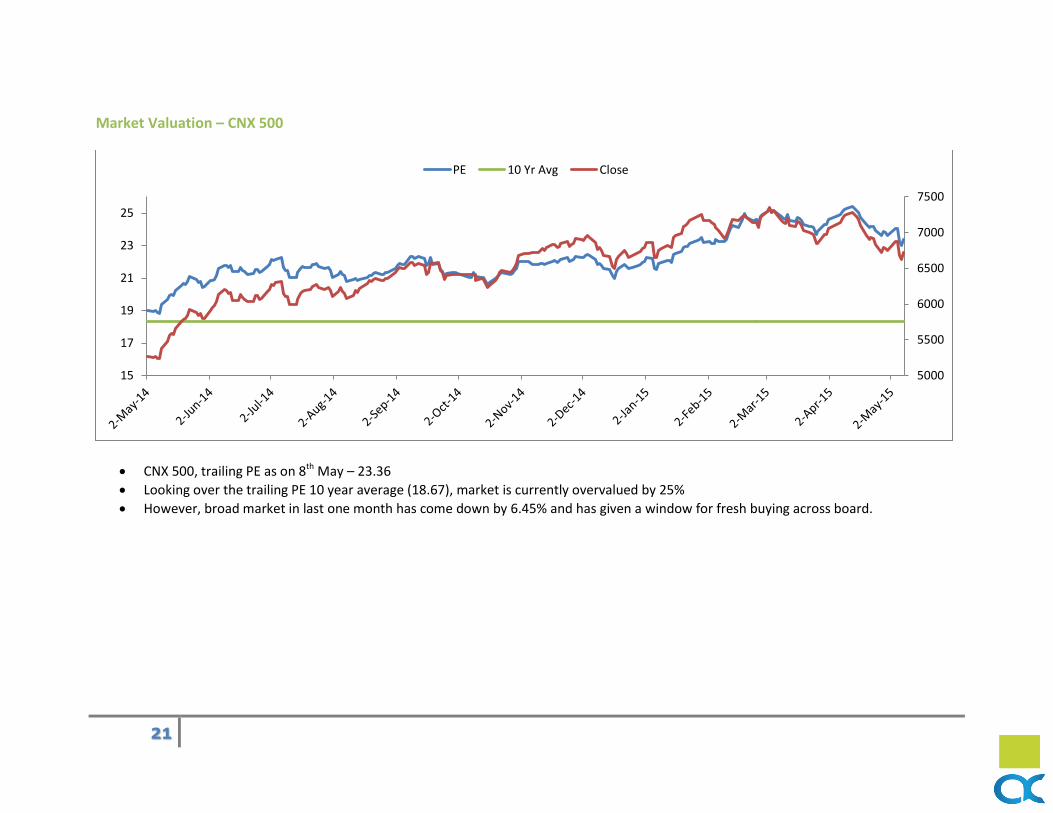
Market Valuation – CNX 500
CNX 500, trailing PE as on 8th May – 23.36
Looking over the trailing PE 10 year average (18.67), market is currently overvalued by 25%
However, broad market in last one month has come down by 6.45% and has given a window for fresh buying across board.
5000
5500
6000
6500
7000
7500
15
17
19
21
23
25
PE 10 Yr Avg Close
22
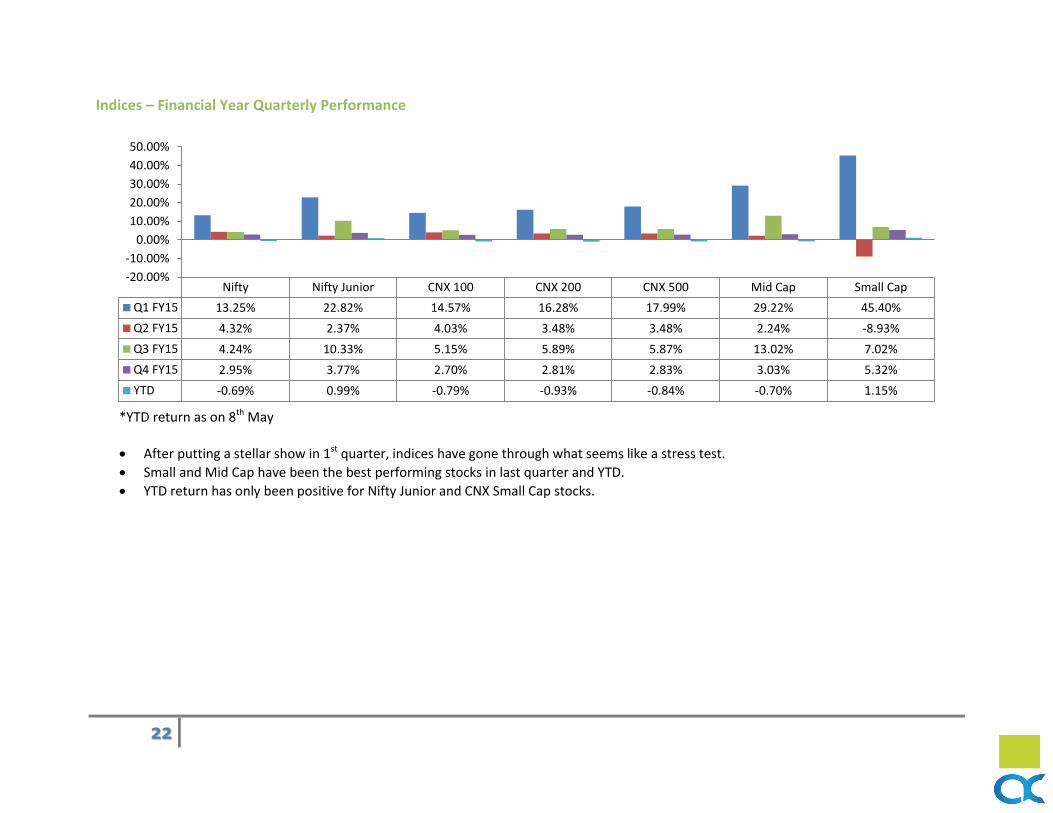
Indices – Financial Year Quarterly Performance
*YTD return as on 8th May
After putting a stellar show in 1st quarter, indices have gone through what seems like a stress test.
Small and Mid Cap have been the best performing stocks in last quarter and YTD.
YTD return has only been positive for Nifty Junior and CNX Small Cap stocks.
Nifty Nifty Junior CNX 100 CNX 200 CNX 500 Mid Cap Small Cap
Q1 FY15 13.25% 22.82% 14.57% 16.28% 17.99% 29.22% 45.40%
Q2 FY15 4.32% 2.37% 4.03% 3.48% 3.48% 2.24% -8.93%
Q3 FY15 4.24% 10.33% 5.15% 5.89% 5.87% 13.02% 7.02%
Q4 FY15 2.95% 3.77% 2.70% 2.81% 2.83% 3.03% 5.32%
YTD -0.69% 0.99% -0.79% -0.93% -0.84% -0.70% 1.15%
-20.00%
-10.00%
0.00%
10.00%
20.00%
30.00%
40.00%
50.00%
23
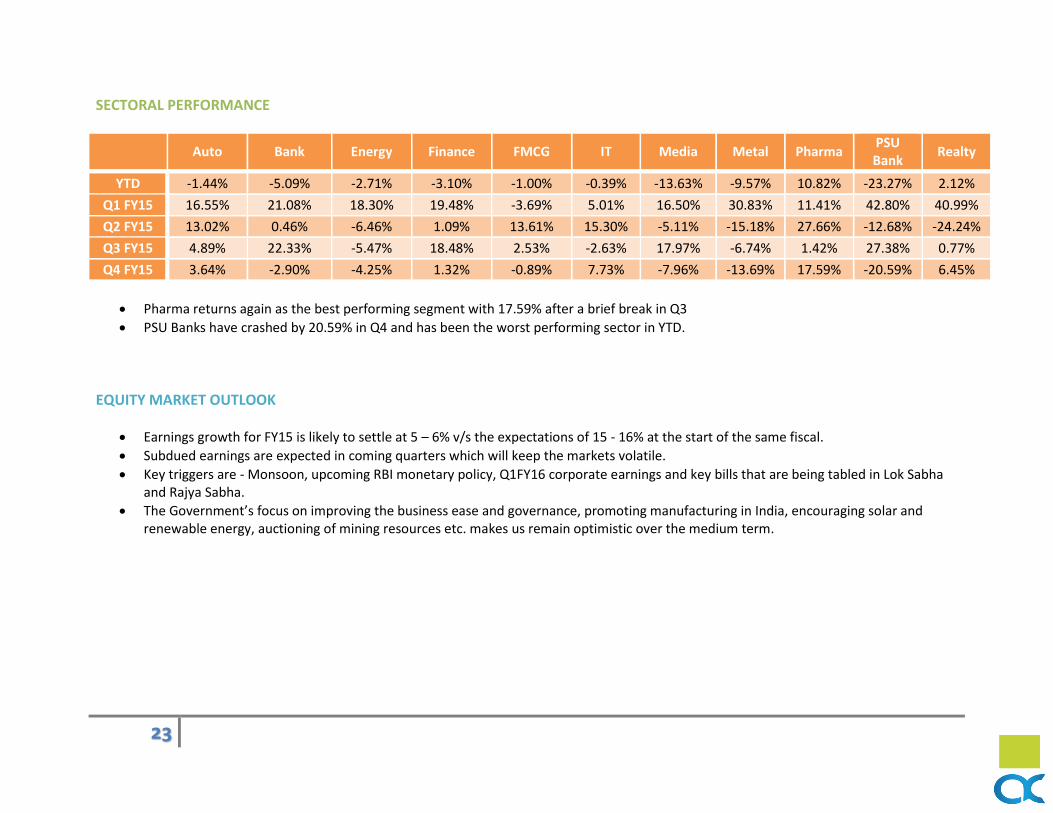
SECTORAL PERFORMANCE
Auto Bank Energy Finance FMCG IT Media Metal Pharma
PSU Bank
Realty
YTD -1.44% -5.09% -2.71% -3.10% -1.00% -0.39% -13.63% -9.57% 10.82% -23.27% 2.12%
Q1 FY15 16.55% 21.08% 18.30% 19.48% -3.69% 5.01% 16.50% 30.83% 11.41% 42.80% 40.99%
Q2 FY15 13.02% 0.46% -6.46% 1.09% 13.61% 15.30% -5.11% -15.18% 27.66% -12.68% -24.24%
Q3 FY15 4.89% 22.33% -5.47% 18.48% 2.53% -2.63% 17.97% -6.74% 1.42% 27.38% 0.77%
Q4 FY15 3.64% -2.90% -4.25% 1.32% -0.89% 7.73% -7.96% -13.69% 17.59% -20.59% 6.45%
Pharma returns again as the best performing segment with 17.59% after a brief break in Q3
PSU Banks have crashed by 20.59% in Q4 and has been the worst performing sector in YTD.
EQUITY MARKET OUTLOOK
Earnings growth for FY15 is likely to settle at 5 – 6% v/s the expectations of 15 - 16% at the start of the same fiscal.
Subdued earnings are expected in coming quarters which will keep the markets volatile.
Key triggers are - Monsoon, upcoming RBI monetary policy, Q1FY16 corporate earnings and key bills that are being tabled in Lok Sabha and Rajya Sabha.
The Government’s focus on improving the business ease and governance, promoting manufacturing in India, encouraging solar and renewable energy, auctioning of mining resources etc. makes us remain optimistic over the medium term.
24
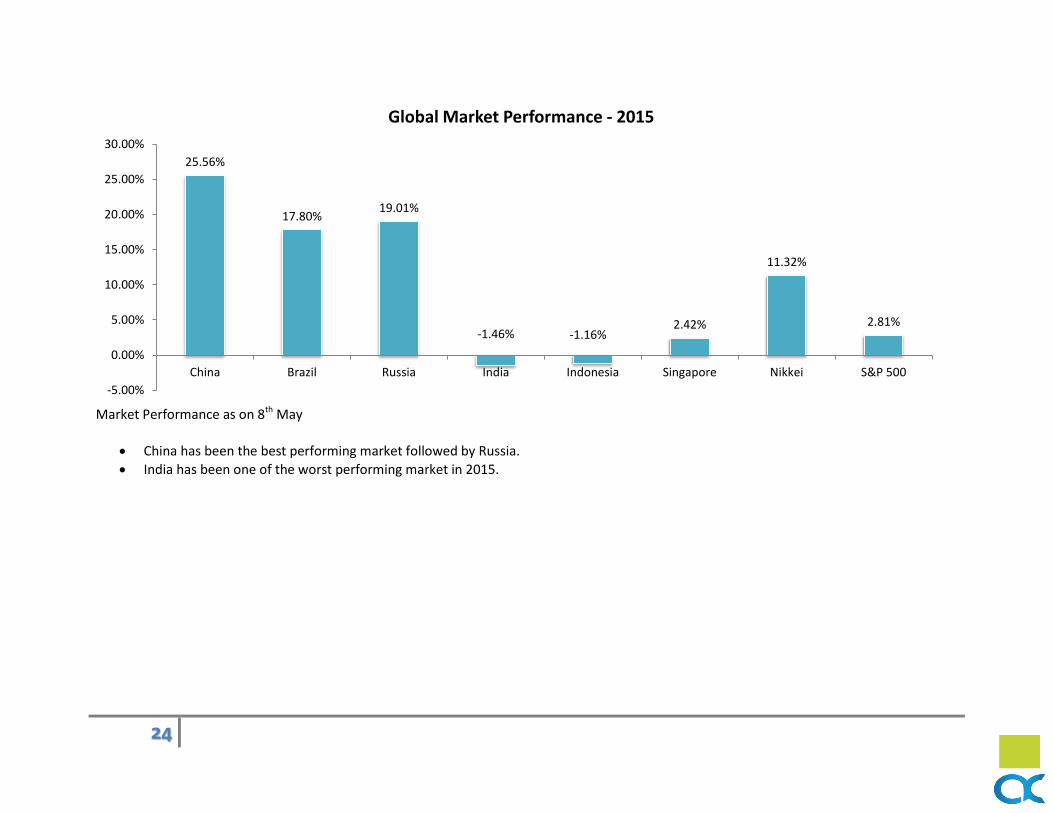
Market Performance as on 8th May
China has been the best performing market followed by Russia.
India has been one of the worst performing market in 2015.
25.56%
17.80% 19.01%
-1.46% -1.16% 2.42%
11.32%
2.81%
-5.00%
0.00%
5.00%
10.00%
15.00%
20.00%
25.00%
30.00%
China Brazil Russia India Indonesia Singapore Nikkei S&P 500
Global Market Performance - 2015
25
This report has been prepared by Investment Committee: Mukesh Jindal CFA, CAIA, CFP Akhil Bhardwaj Partner, Alpha Capital Partner, Alpha Capital Shruti Singh CWM Rovind Kumar Senior Analyst, Research Desk Senior Analyst, Research Desk Pankaj Kumar Kunal Jain Associate Associate
For further queries and clarification please contact: [email protected]
Disclaimer In the preparation of the material contained in this document, Alpha Capital has used information that is publicly available, including information developed in-house. Some of the material used in the document may have been obtained from members/persons other than the company and/or its affiliates and which may have been made available to the company and/or to its affiliates. Information gathered and material used in this document is believed to be from reliable sources. The company however does not warrant the accuracy, reasonableness and / or completeness of any information. We have included statements / opinions / recommendations in this document, which contain words, or phrases such as “will”, “expect”, “should”, “believe” and similar expressions or variations of such expressions that are “forward looking statements”. Actual results may differ materially from those suggested by the forward looking statements due to risk or uncertainties associated with our expectations with respect to, but not limited to, exposure to market risks, general economic and political conditions in India and other countries globally, which have an impact on our services and / or investments, the monetary and interest policies of India, inflation, deflation, unanticipated turbulence in interest rates, foreign exchange rates, equity prices or other rates or prices etc. Alpha Capital, the Mutual Fund, The Trust and any of its officers, directors, personnel and employees, shall not liable for any loss, damage of any nature, including but not limited to direct, indirect, punitive, special, exemplary, consequential, as also any loss of profit in any way arising from the use of this material in any manner.