Embed Size (px)
Citation preview
Upside Participation, Downside Management
DYNAMIC ALPHA STRATEGIES
One International Place, Suite 1400, Boston, MA 02110
Phone: 617-535-7542
Email: [email protected]
Web: www.julexcapital.com
1
JUL
EX
CA
PIT
AL : O
VE
RV
IEW
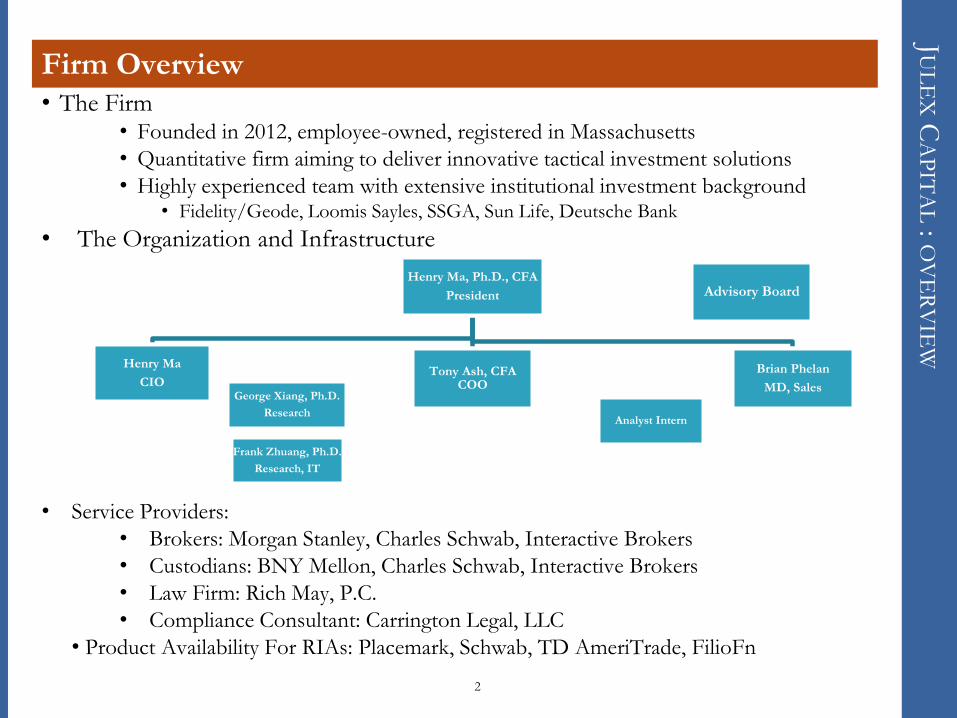
Firm Overview
• The Firm • Founded in 2012, employee-owned, registered in Massachusetts
• Quantitative firm aiming to deliver innovative tactical investment solutions
• Highly experienced team with extensive institutional investment background • Fidelity/Geode, Loomis Sayles, SSGA, Sun Life, Deutsche Bank
• The Organization and Infrastructure
• Service Providers:
• Brokers: Morgan Stanley, Charles Schwab, Interactive Brokers
• Custodians: BNY Mellon, Charles Schwab, Interactive Brokers
• Law Firm: Rich May, P.C.
• Compliance Consultant: Carrington Legal, LLC
• Product Availability For RIAs: Placemark, Schwab, TD AmeriTrade, FilioFn
2
Henry Ma, Ph.D., CFA
President
Henry Ma, Ph.D., CFA
President
Henry Ma
CIO
Henry Ma
CIO
Tony Ash, CFA COO
Tony Ash, CFA COO
Brian Phelan
MD, Sales
Brian Phelan
MD, Sales
Frank Zhuang, Ph.D.
Research, IT
Frank Zhuang, Ph.D.
Research, IT
Analyst Intern Analyst Intern
Advisory Board Advisory Board
George Xiang, Ph.D.
Research
George Xiang, Ph.D.
Research
JUL
EX
CA
PIT
AL : JU
LE
X M
AN
AG
EM
EN
T T
EA
M
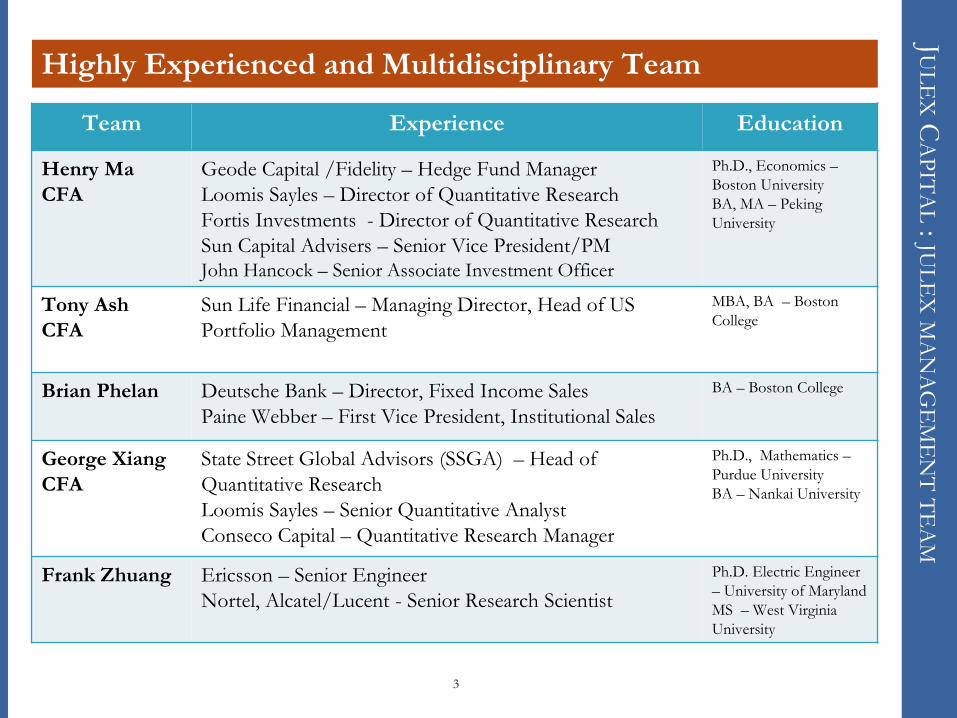
Highly Experienced and Multidisciplinary Team
3
Team Experience Education
Henry Ma
CFA
Geode Capital /Fidelity – Hedge Fund Manager
Loomis Sayles – Director of Quantitative Research
Fortis Investments - Director of Quantitative Research
Sun Capital Advisers – Senior Vice President/PM John Hancock – Senior Associate Investment Officer
Ph.D., Economics –
Boston University
BA, MA – Peking
University
Tony Ash
CFA
Sun Life Financial – Managing Director, Head of US
Portfolio Management
MBA, BA – Boston
College
Brian Phelan Deutsche Bank – Director, Fixed Income Sales
Paine Webber – First Vice President, Institutional Sales
BA – Boston College
George Xiang
CFA
State Street Global Advisors (SSGA) – Head of
Quantitative Research
Loomis Sayles – Senior Quantitative Analyst
Conseco Capital – Quantitative Research Manager
Ph.D., Mathematics –
Purdue University
BA – Nankai University
Frank Zhuang Ericsson – Senior Engineer
Nortel, Alcatel/Lucent - Senior Research Scientist
Ph.D. Electric Engineer
– University of Maryland
MS – West Virginia
University
JUL
EX
CA
PIT
AL : N
EW
INV
EST
ME
NT P
AR
AD
IGM
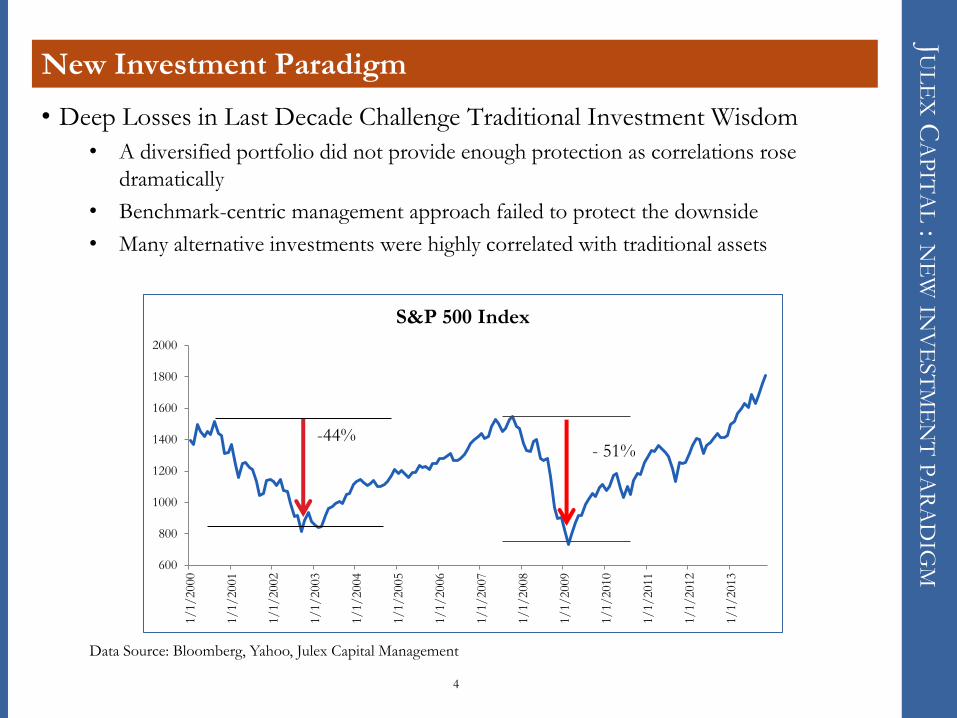
New Investment Paradigm
• Deep Losses in Last Decade Challenge Traditional Investment Wisdom
• A diversified portfolio did not provide enough protection as correlations rose
dramatically
• Benchmark-centric management approach failed to protect the downside
• Many alternative investments were highly correlated with traditional assets
Data Source: Bloomberg, Yahoo, Julex Capital Management
600
800
1000
1200
1400
1600
1800
2000
1/
1/
2000
1/
1/
2001
1/
1/
2002
1/
1/
2003
1/
1/
2004
1/
1/
2005
1/
1/
2006
1/
1/
2007
1/
1/
2008
1/
1/
2009
1/
1/
2010
1/
1/
2011
1/
1/
2012
1/
1/
2013
S&P 500 Index
- 51% -44%
4
JUL
EX
CA
PIT
AL : IN
VE
ST
ME
NT P
HIL
OSO
PH
Y
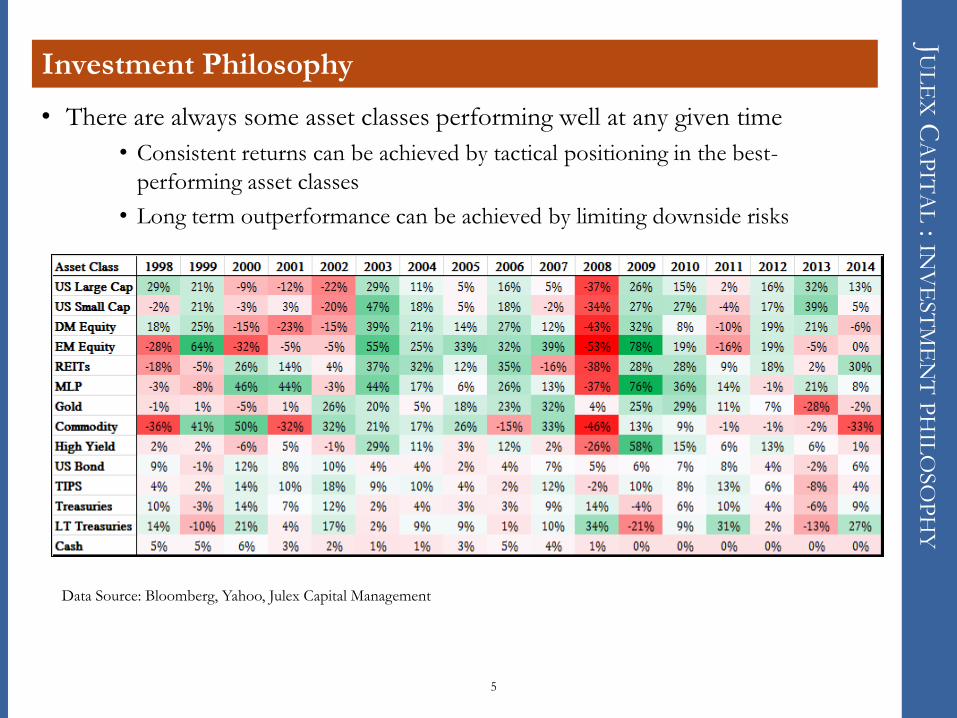
Investment Philosophy
• There are always some asset classes performing well at any given time
• Consistent returns can be achieved by tactical positioning in the best-
performing asset classes
• Long term outperformance can be achieved by limiting downside risks
Data Source: Bloomberg, Yahoo, Julex Capital Management
5
JUL
EX
CA
PIT
AL : IN
VE
ST
ME
NT P
RO
CE
SS
Investment Process
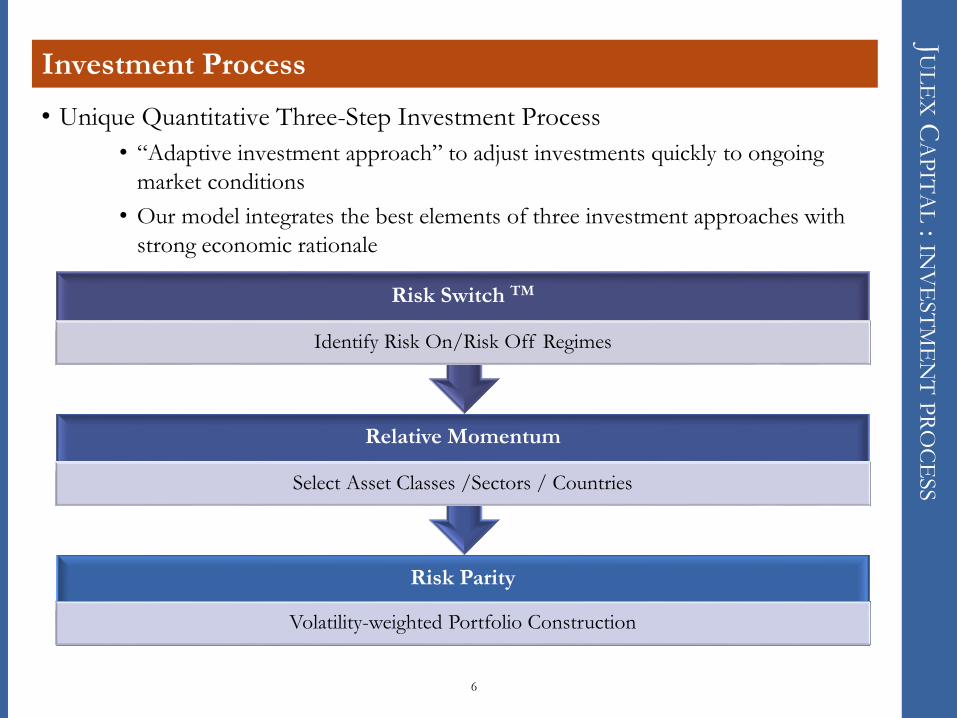
• Unique Quantitative Three-Step Investment Process
• “Adaptive investment approach” to adjust investments quickly to ongoing
market conditions
• Our model integrates the best elements of three investment approaches with
strong economic rationale
Risk Parity
Volatility-weighted Portfolio Construction
Relative Momentum
Select Asset Classes /Sectors / Countries
Risk Switch TM
Identify Risk On/Risk Off Regimes
6
JUL
EX
CA
PIT
AL : R
ISK
SW
ITC
H
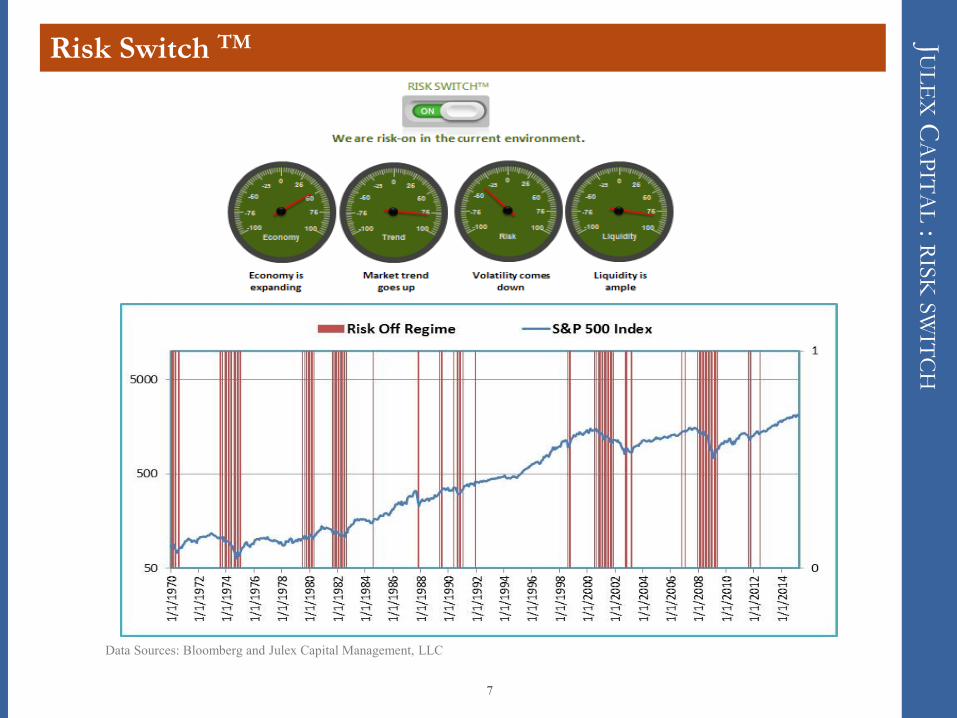
Risk Switch TM
7
Data Sources: Bloomberg and Julex Capital Management, LLC
JUL
EX
CA
PIT
AL : P
RO
CE
SS IN
AC
TIO
N
Process In Action
8
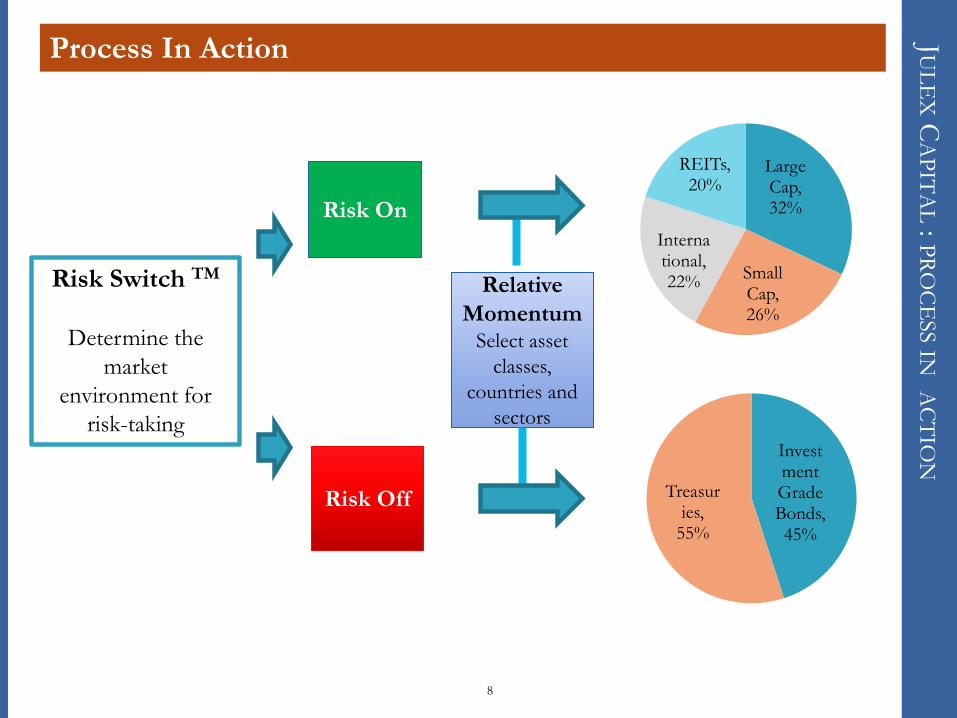
Risk Switch TM
Determine the
market
environment for
risk-taking
Risk On Risk On
Risk Off Risk Off
Relative
Momentum Select asset
classes,
countries and
sectors
Relative
Momentum Select asset
classes,
countries and
sectors
Large Cap, 32%
Small Cap, 26%
International, 22%
REITs, 20%
Investment Grade Bonds, 45%
Treasuries,
55%
JUL
EX
CA
PIT
AL : O
BJE
CT
IVE
S AN
D P
RO
DU
CT
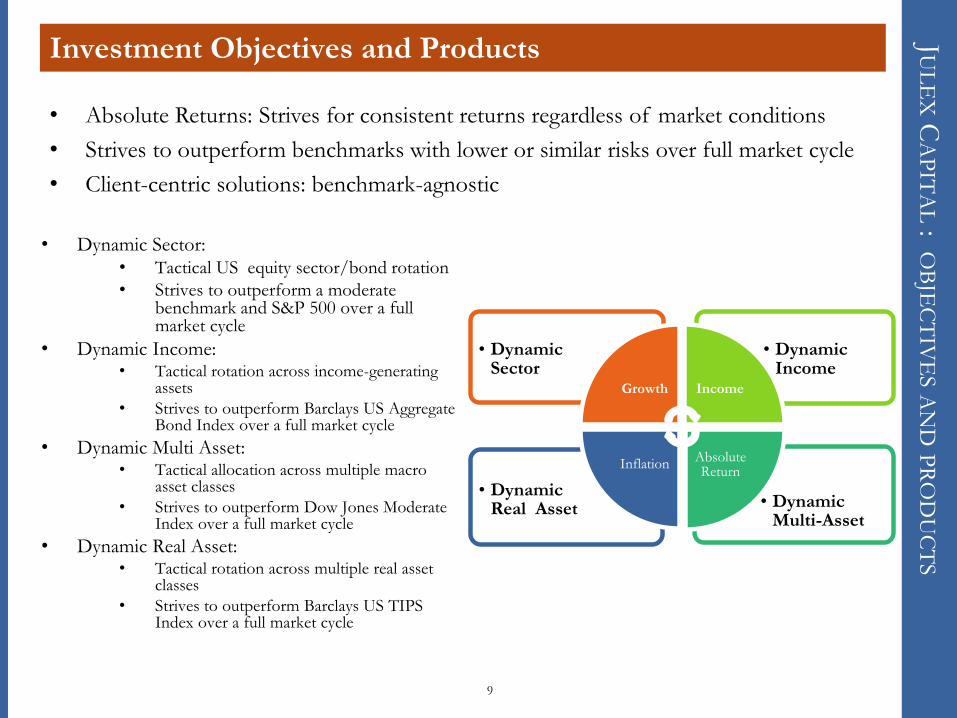
S Investment Objectives and Products
• Dynamic Sector: • Tactical US equity sector/bond rotation
• Strives to outperform a moderate benchmark and S&P 500 over a full market cycle
• Dynamic Income: • Tactical rotation across income-generating
assets
• Strives to outperform Barclays US Aggregate Bond Index over a full market cycle
• Dynamic Multi Asset: • Tactical allocation across multiple macro
asset classes
• Strives to outperform Dow Jones Moderate Index over a full market cycle
• Dynamic Real Asset: • Tactical rotation across multiple real asset
classes
• Strives to outperform Barclays US TIPS Index over a full market cycle
9
• Dynamic Multi-Asset
• Dynamic Real Asset
• Dynamic Income
• Dynamic Sector
Growth Income
Absolute Return
Inflation
• Absolute Returns: Strives for consistent returns regardless of market conditions
• Strives to outperform benchmarks with lower or similar risks over full market cycle
• Client-centric solutions: benchmark-agnostic
JUL
EX
CA
PIT
AL : JU
LE
X D
YN
AM
IC F
AC
TO
R
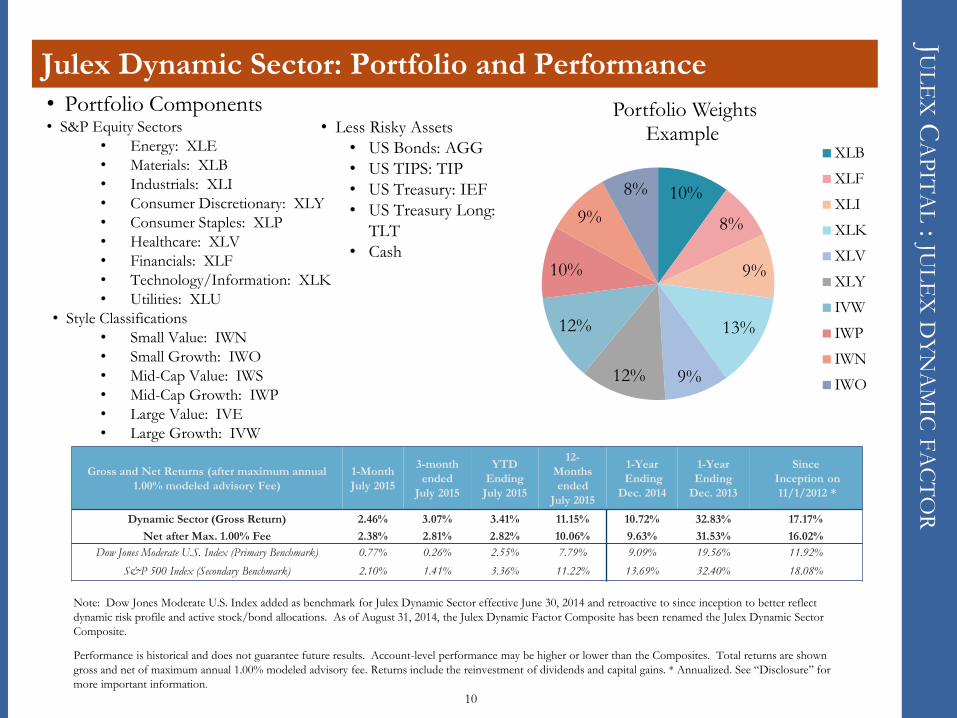
Julex Dynamic Sector: Portfolio and Performance
• Portfolio Components • S&P Equity Sectors
• Energy: XLE
• Materials: XLB
• Industrials: XLI
• Consumer Discretionary: XLY
• Consumer Staples: XLP
• Healthcare: XLV
• Financials: XLF
• Technology/Information: XLK
• Utilities: XLU
• Style Classifications
• Small Value: IWN
• Small Growth: IWO
• Mid-Cap Value: IWS
• Mid-Cap Growth: IWP
• Large Value: IVE
• Large Growth: IVW
10%
8%
9%
13%
9% 12%
12%
10%
9%
8%
Portfolio Weights Example
XLB
XLF
XLI
XLK
XLV
XLY
IVW
IWP
IWN
IWO
10
Gross and Net Returns (after maximum annual
1.00% modeled advisory Fee)
1-Month
July 2015
3-month
ended
July 2015
YTD
Ending
July 2015
12-
Months
ended
July 2015
1-Year
Ending
Dec. 2014
1-Year
Ending
Dec. 2013
Since
Inception on
11/1/2012 *
Dynamic Sector (Gross Return) 2.46% 3.07% 3.41% 11.15% 10.72% 32.83% 17.17%
Net after Max. 1.00% Fee 2.38% 2.81% 2.82% 10.06% 9.63% 31.53% 16.02%
Dow Jones Moderate U.S. Index (Primary Benchmark) 0.77% 0.26% 2.55% 7.79% 9.09% 19.56% 11.92%
S&P 500 Index (Secondary Benchmark) 2.10% 1.41% 3.36% 11.22% 13.69% 32.40% 18.08%
• Less Risky Assets
• US Bonds: AGG
• US TIPS: TIP
• US Treasury: IEF
• US Treasury Long:
TLT
• Cash
Note: Dow Jones Moderate U.S. Index added as benchmark for Julex Dynamic Sector effective June 30, 2014 and retroactive to since inception to better reflect
dynamic risk profile and active stock/bond allocations. As of August 31, 2014, the Julex Dynamic Factor Composite has been renamed the Julex Dynamic Sector
Composite.
Performance is historical and does not guarantee future results. Account-level performance may be higher or lower than the Composites. Total returns are shown
gross and net of maximum annual 1.00% modeled advisory fee. Returns include the reinvestment of dividends and capital gains. * Annualized. See “Disclosure” for
more important information.
JUL
EX
CA
PIT
AL : JU
LE
X D
YN
AM
IC IN
CO
ME
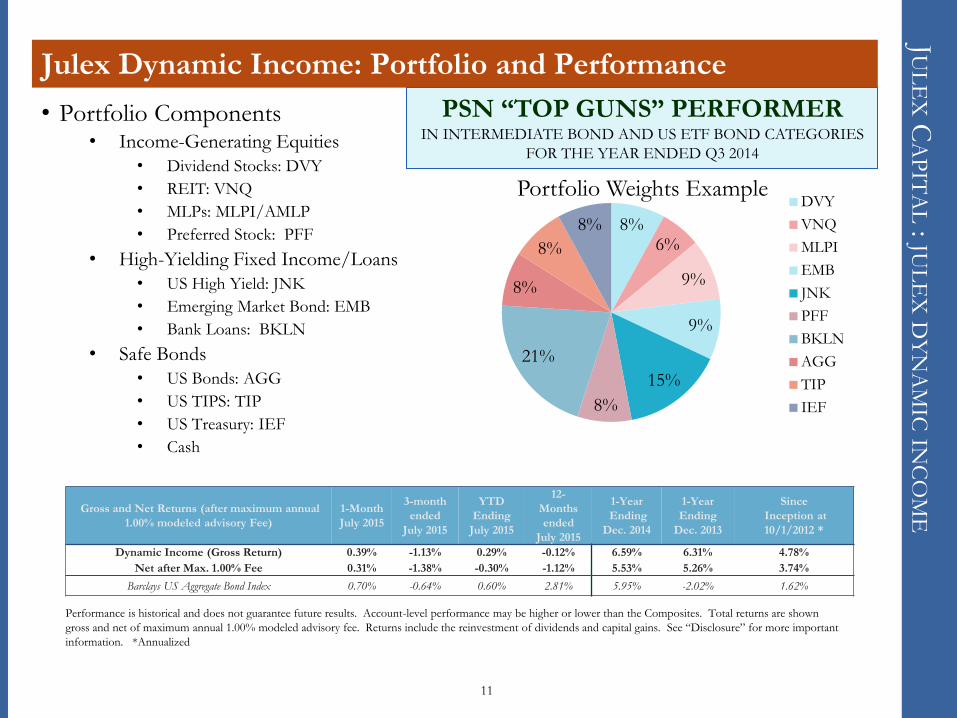
Julex Dynamic Income: Portfolio and Performance
• Portfolio Components • Income-Generating Equities
• Dividend Stocks: DVY
• REIT: VNQ
• MLPs: MLPI/AMLP
• Preferred Stock: PFF
• High-Yielding Fixed Income/Loans
• US High Yield: JNK
• Emerging Market Bond: EMB
• Bank Loans: BKLN
• Safe Bonds
• US Bonds: AGG
• US TIPS: TIP
• US Treasury: IEF
• Cash
8% 6%
9%
9%
15%
8%
21%
8%
8%
8%
Portfolio Weights Example DVY
VNQ
MLPI
EMB
JNK
PFF
BKLN
AGG
TIP
IEF
11
PSN “TOP GUNS” PERFORMER IN INTERMEDIATE BOND AND US ETF BOND CATEGORIES
FOR THE YEAR ENDED Q3 2014
PSN “TOP GUNS” PERFORMER IN INTERMEDIATE BOND AND US ETF BOND CATEGORIES
FOR THE YEAR ENDED Q3 2014
Gross and Net Returns (after maximum annual
1.00% modeled advisory Fee)
1-Month
July 2015
3-month
ended
July 2015
YTD
Ending
July 2015
12-
Months
ended
July 2015
1-Year
Ending
Dec. 2014
1-Year
Ending
Dec. 2013
Since
Inception at
10/1/2012 *
Dynamic Income (Gross Return) 0.39% -1.13% 0.29% -0.12% 6.59% 6.31% 4.78%
Net after Max. 1.00% Fee 0.31% -1.38% -0.30% -1.12% 5.53% 5.26% 3.74%
Barclays US Aggregate Bond Index 0.70% -0.64% 0.60% 2.81% 5.95% -2.02% 1.62%
Performance is historical and does not guarantee future results. Account-level performance may be higher or lower than the Composites. Total returns are shown
gross and net of maximum annual 1.00% modeled advisory fee. Returns include the reinvestment of dividends and capital gains. See “Disclosure” for more important
information. *Annualized

JUL
EX
CA
PIT
AL : JU
LE
X M
UL
TI A
SSE
T
Julex Dynamic Multi-Asset : Portfolio and Performance
• Portfolio Components • Risk Assets
• US Large Cap: SPY • US Small Cap: IWM • International: EFA • Emerging Markets: VWO • Real Estate: VNQ • MLPs: MLPI/AMLP • Commodity: DJP
• Hybrids • High Yield Bonds: JNK • Gold: GLD
• Bonds • US Bonds: AGG • US TIPS: TIP • US Treasury: IEF • US Long Term Treasuries: TLT • Cash
32%
26%
22%
20%
Portfolio Weights Example
SPY
IWM
EFA
VNQ
12
PSN “TOP GUNS” PERFORMER IN GLOBAL BALANCED AND ETF GLOBAL BALANCED
CATEGORIES
FOR THE YEAR ENDED Q3 2014
PSN “TOP GUNS” PERFORMER IN GLOBAL BALANCED AND ETF GLOBAL BALANCED
CATEGORIES
FOR THE YEAR ENDED Q3 2014
Gross and Net Returns (after maximum annual
1.00% modeled advisory Fee)
1-Month
July
2015
3-month
ended
July 2015
YTD
Ending
July 2015
12-
Months
ended
July 2015
1-Year
Ending
Dec. 2014
1-Year
Ending
Dec. 2013
Since
Inception at
6/1/2013 *
Dynamic Multi-Asset (Gross Return) -0.52% -2.54% -3.76% -2.80% 5.52% n.a. 6.68%
Net after Max. 1.00% Fee -0.60% -2.78% -4.32% -3.77% 4.47% n.a. 5.62%
Dow Jones Moderate Index (Global) 0.20% -1.22% 1.84% 2.89% 5.35% n.a. 6.97%
Morningstar Tactical Allocation Category ** -0.04% -3.16% -1.53% -2.03% 3.44% 8.47% 4.38%
Performance is historical and does not guarantee future results. Account-level performance may be higher or lower than the Composites. Total returns are shown
gross and net of maximum annual 1.00% modeled advisory fee. Returns include the reinvestment of dividends and capital gains. See “Disclosure” for more
important information. * Annualized ** For Peer Category Comparison
JUL
EX
CA
PIT
AL : JU
LE
X R
EA
L A
SSE
T
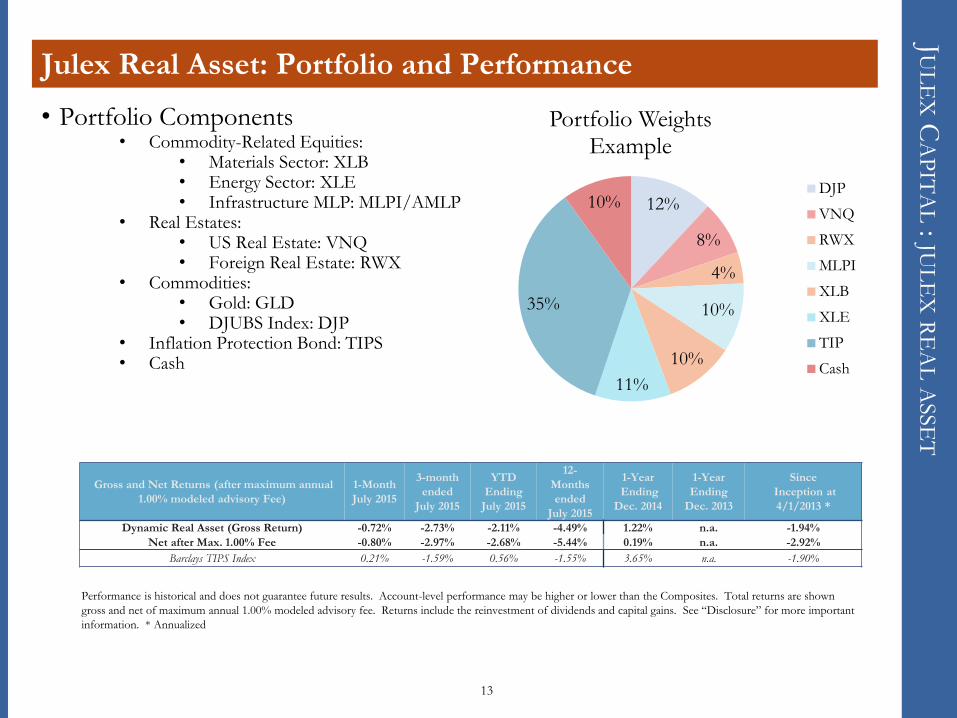
Julex Real Asset: Portfolio and Performance
• Portfolio Components • Commodity-Related Equities:
• Materials Sector: XLB • Energy Sector: XLE • Infrastructure MLP: MLPI/AMLP
• Real Estates: • US Real Estate: VNQ • Foreign Real Estate: RWX
• Commodities: • Gold: GLD • DJUBS Index: DJP
• Inflation Protection Bond: TIPS • Cash
12%
8%
4%
10%
10%
11%
35%
10%
Portfolio Weights Example
DJP
VNQ
RWX
MLPI
XLB
XLE
TIP
Cash
13
Gross and Net Returns (after maximum annual
1.00% modeled advisory Fee)
1-Month
July 2015
3-month
ended
July 2015
YTD
Ending
July 2015
12-
Months
ended
July 2015
1-Year
Ending
Dec. 2014
1-Year
Ending
Dec. 2013
Since
Inception at
4/1/2013 *
Dynamic Real Asset (Gross Return) -0.72% -2.73% -2.11% -4.49% 1.22% n.a. -1.94%
Net after Max. 1.00% Fee -0.80% -2.97% -2.68% -5.44% 0.19% n.a. -2.92%
Barclays TIPS Index 0.21% -1.59% 0.56% -1.55% 3.65% n.a. -1.90%
Performance is historical and does not guarantee future results. Account-level performance may be higher or lower than the Composites. Total returns are shown
gross and net of maximum annual 1.00% modeled advisory fee. Returns include the reinvestment of dividends and capital gains. See “Disclosure” for more important
information. * Annualized

JUL
EX
CA
PIT
AL : M
AN
AG
EM
EN
T T
EA
M
Management Team Henry Ma, Ph.D., CFA, President and Chief Investment Officer. Dr. Ma has two decades of extensive hands-on and
leadership experience in asset management industry. Prior to founding Julex, he worked as a global macro hedge fund manger
with Geode Capital Management (a Fidelity affiliate). Earlier, he served as Director of Quantitative Research and Financial
Engineering with Loomis Sayles & Co., and Director of Quantitative Research and Risk Management with Fortis Investments.
He led quantitative research and risk management groups to develop investment strategies, portfolio risk analytics and structured
credit strategies. Dr. Ma also worked as Senior Vice President at Sun Life Financial, where he helped manage $30 billion in
fixed income assets. His investment career began with John Hancock Financial Services as a Senior Associate Investment
Officer. He developed investment and derivatives strategies as well as oversaw $3 billion in a multi-asset portfolio. Dr. Ma is a
published author and an industry speaker on the topics of quantitative investing, risk management and structured finance. He
earned a Bachelor and a Master in Economics and Management from Peking University and a Ph.D. in Economics from Boston
University.
Tony Ash, CFA, Managing Director and Chief Operating Officer. Mr. Ash has 30 years of broad experience in asset
allocation and investment risk management. Most recently, he served as Managing Director and Head of US Portfolio
Management at Sun Life Financial. In that role he developed and implemented investment policies, strategies, and mandates for
$37 billion in all asset classes backing the insurance general account. He entered the financial services industry in 1982 as an
Investment Analyst at New England Life and joined the U.S. Operations of Sun Life Financial in 1985. During his tenure at Sun
Life, Tony led the launch of a successful multi-billion dollar captive investment adviser and investment company complex (Sun
Capital Advisers Trust) in 1998 and also served as internal Investment Advisor to the Sun Life U.S. Employees Defined Benefit
and Defined Contribution plans from 1999 to 2009. Tony received his BA in Economics and his MBA in Investments both from
Boston College. Tony has been a member of the ACLI Investment Advisory Council for the SIMS Conference.
Brian Phelan, Managing Director, Sales. Brian brings over thirty years of capital markets experience to Julex Capital
Management. He spent twenty-two years as a First Vice President at PaineWebber Group in institutional fixed income sales
covering major and middle market accounts for investment grade and high yield corporate debt, residential and commercial
mortgage backed securities, asset backed securities and rates. Later, he worked at Deutsche Bank Securities as a Director in the
generalist fixed income securities platform within the Capital Markets Group. Most recently, Brian co-founded MacBride
Partners, a consulting firm to assist it’s clients improve investment performance by implementing the industry best practices.
Brian graduated from the Carroll School of Management at Boston College with a BS in General Management / Marketing and
currently holds his Series 7 and Series 63 licenses.
14

JUL
EX
CA
PIT
AL : R
ESE
AR
CH
TE
AM
Research Team
George Xiang, Ph.D., CFA, Research Consultant. Dr. Xiang has extensive experiences in fixed income, quantitative equity,
and commodities. His experiences include designing investment products, creating trading strategies, and developing analytic
tools. During his career, George worked as Head of Global Fixed Income Research at SSGA, a senior quantitative analyst at
Loomis Sayles & Company and quantitative research manager at Conseco Capital Management. George received a Ph.D. in
mathematics and MS in computer science from Purdue University, and BS in mathematics from Nankai University. He is CFA
and FRM charter holder. He has numerous publications in finance, mathematics, and computer science. Also, George has one
patent pending that involves investment technology and products.
Frank Zhuang, Ph.D., Research Consultant. Dr. Zhuang is an expert in machine learning and artificial intelligence. He has
extensive experiences in applying cutting-edge statistical techniques and technologies to financial modeling and trading in last
twenty years. His expertise includes neural networks, signal processing, machine learning, pattern recognition, artificial
intelligence and other advanced statistical analysis. He has published numerous research in those subjects in the nationally
recognized journals. During his career, Dr. Zhuang has served as a Senior Research Scientist with Nortel, Alcatel/Lucent and
other global technology companies. He holds Ph.D. degree in Electrical Engineering from the University of Maryland, College
Park. He also earned M.S. degree in mathematics from West Virginia University.
Advisory Board
Maryam H. Muessel , Advisor. Ms. Muessel has been a senior leader in the financial industry for decades. She was the Chief
Investment Officer for Global Credit at BNP Paribas, a $1 trillion global asset manager. At BNP, she was responsible for
defining and monitoring the management process and the investment strategy implemented by the credit investment teams
across over $250 billion in fixed income mandates globally. Maryam also actively participated in designing and developing the
product range. She joined Fortis Investments in 2004 as the CIO for US Fixed Income & Structured Finance, which was
ultimately acquired by BNP. In 2008 she became COO of Alternatives & Solutions division with a direct responsibility on
Global Credit & Hybrids. Prior to Fortis, she was ACA’s COO and head of Structured Credit and Asset Management Business.
From 1998 to 2004, Maryam held senior positions at Prudential Securities where she was in charge of the CDO business, MBIA
where she was in charge of their Alternative Investment business and at CapMAC where she was in charge of their structured
credit and financial engineering business. She began her career in 1985 at Mellon Bank. Maryam is a graduate in Economics
from University of Southern California and holds a Doctorate/MA in Economics from Georgetown University.
15
JUL
EX
CA
PIT
AL: A
PP
EN
DIX
APPENDIX : SUPPLEMENTAL INFORMATION –
• HOW TO USE JULEX STATEGIES
• MACRO OPPORTUNITIES PRO FORMA PEFORMANCE
• BACK TEST HISTORICAL RESULTS
16
HO
W T
O U
SE
JUL
EX
ST
RA
TE
GIE
S
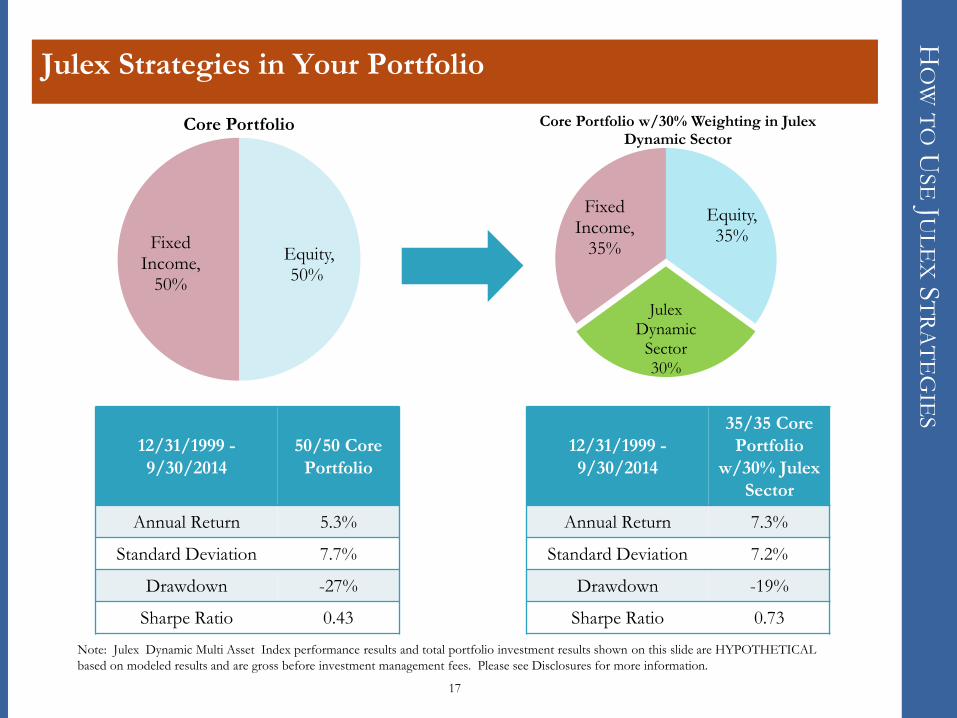
Julex Strategies in Your Portfolio
Equity, 35%
Julex Dynamic
Sector 30%
Fixed Income,
35%
Core Portfolio w/30% Weighting in Julex Dynamic Sector
17
Equity, 50%
Fixed Income,
50%
Core Portfolio
12/31/1999 -
9/30/2014
50/50 Core
Portfolio
Annual Return 5.3%
Standard Deviation 7.7%
Drawdown -27%
Sharpe Ratio 0.43
12/31/1999 -
9/30/2014
35/35 Core
Portfolio
w/30% Julex
Sector
Annual Return 7.3%
Standard Deviation 7.2%
Drawdown -19%
Sharpe Ratio 0.73
Note: Julex Dynamic Multi Asset Index performance results and total portfolio investment results shown on this slide are HYPOTHETICAL
based on modeled results and are gross before investment management fees. Please see Disclosures for more information.
JUL
EX
CA
PIT
AL : M
AC
RO
OP
PO
RT
UN
ITIE
S
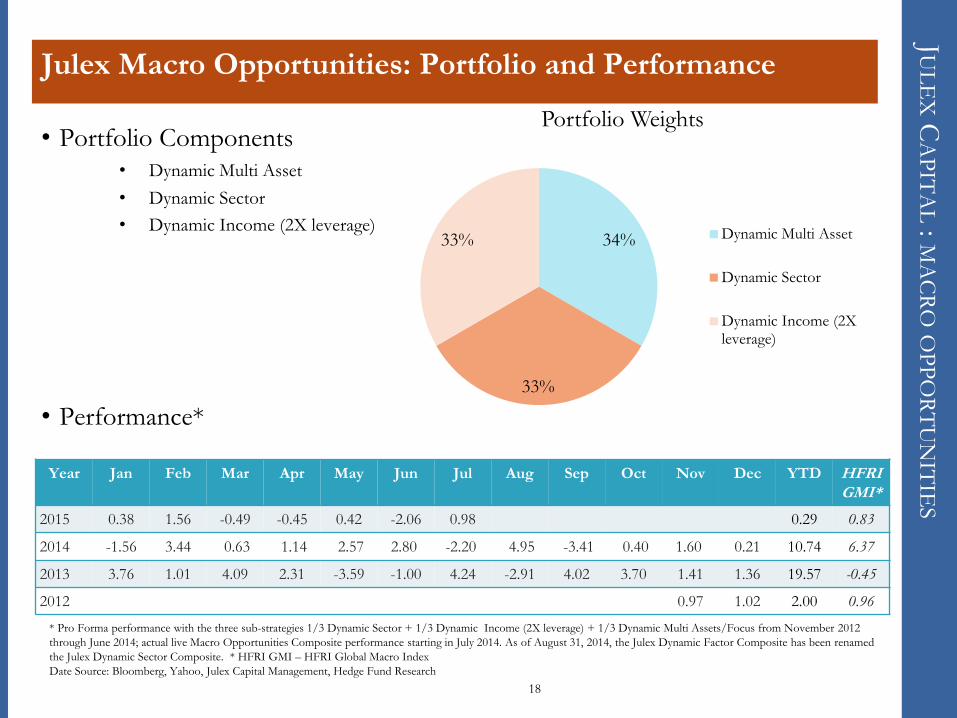
Julex Macro Opportunities: Portfolio and Performance
• Portfolio Components • Dynamic Multi Asset
• Dynamic Sector
• Dynamic Income (2X leverage)
• Performance*
18
34%
33%
33%
Portfolio Weights
Dynamic Multi Asset
Dynamic Sector
Dynamic Income (2Xleverage)
* Pro Forma performance with the three sub-strategies 1/3 Dynamic Sector + 1/3 Dynamic Income (2X leverage) + 1/3 Dynamic Multi Assets/Focus from November 2012
through June 2014; actual live Macro Opportunities Composite performance starting in July 2014. As of August 31, 2014, the Julex Dynamic Factor Composite has been renamed
the Julex Dynamic Sector Composite. * HFRI GMI – HFRI Global Macro Index
Date Source: Bloomberg, Yahoo, Julex Capital Management, Hedge Fund Research
Year Jan Feb Mar Apr May Jun Jul Aug Sep Oct Nov Dec YTD HFRI GMI*
2015 0.38 1.56 -0.49 -0.45 0.42 -2.06 0.98 0.29 0.83
2014 -1.56 3.44 0.63 1.14 2.57 2.80 -2.20 4.95 -3.41 0.40 1.60 0.21 10.74 6.37
2013 3.76 1.01 4.09 2.31 -3.59 -1.00 4.24 -2.91 4.02 3.70 1.41 1.36 19.57 -0.45
2012 0.97 1.02 2.00 0.96
JUL
EX
CA
PIT
AL : JU
LE
X D
YN
AM
IC S
EC
TO
R
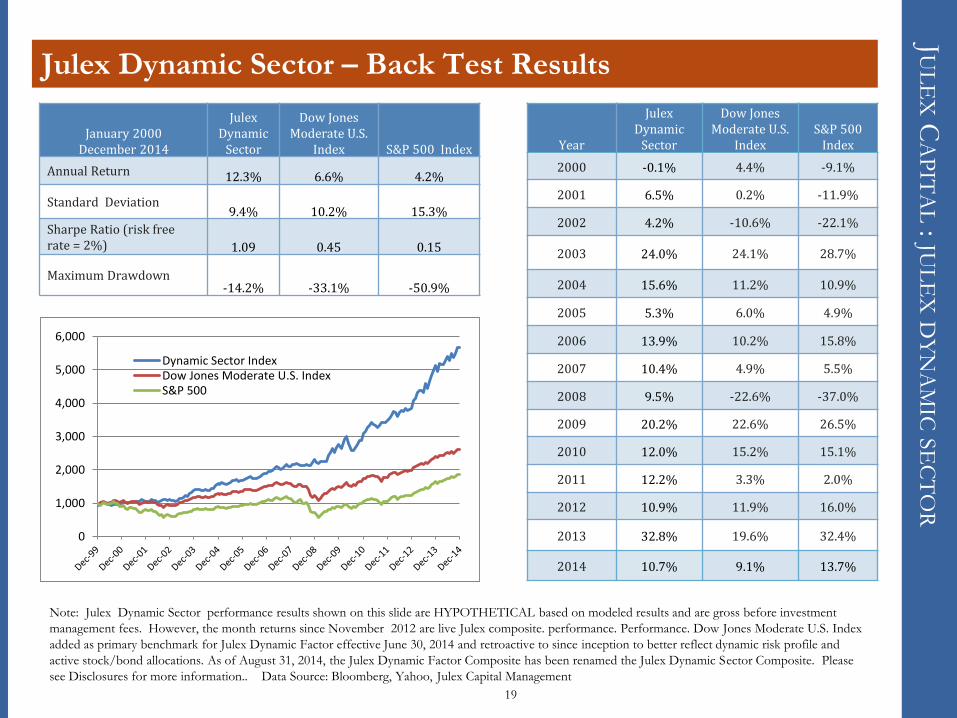
Julex Dynamic Sector – Back Test Results
Note: Julex Dynamic Sector performance results shown on this slide are HYPOTHETICAL based on modeled results and are gross before investment
management fees. However, the month returns since November 2012 are live Julex composite. performance. Performance. Dow Jones Moderate U.S. Index
added as primary benchmark for Julex Dynamic Factor effective June 30, 2014 and retroactive to since inception to better reflect dynamic risk profile and
active stock/bond allocations. As of August 31, 2014, the Julex Dynamic Factor Composite has been renamed the Julex Dynamic Sector Composite. Please
see Disclosures for more information.. Data Source: Bloomberg, Yahoo, Julex Capital Management
19
January 2000 December 2014
Julex Dynamic
Sector
Dow Jones Moderate U.S.
Index S&P 500 Index
Annual Return 12.3% 6.6% 4.2%
Standard Deviation 9.4% 10.2% 15.3%
Sharpe Ratio (risk free rate = 2%) 1.09 0.45 0.15
Maximum Drawdown -14.2% -33.1% -50.9%
Year
Julex Dynamic
Sector
Dow Jones Moderate U.S.
Index S&P 500
Index
2000 -0.1% 4.4% -9.1%
2001 6.5% 0.2% -11.9%
2002 4.2% -10.6% -22.1%
2003 24.0% 24.1% 28.7%
2004 15.6% 11.2% 10.9%
2005 5.3% 6.0% 4.9%
2006 13.9% 10.2% 15.8%
2007 10.4% 4.9% 5.5%
2008 9.5% -22.6% -37.0%
2009 20.2% 22.6% 26.5%
2010 12.0% 15.2% 15.1%
2011 12.2% 3.3% 2.0%
2012 10.9% 11.9% 16.0%
2013 32.8% 19.6% 32.4%
2014 10.7% 9.1% 13.7%
0
1,000
2,000
3,000
4,000
5,000
6,000
Dynamic Sector IndexDow Jones Moderate U.S. IndexS&P 500
JUL
EX
CA
PIT
AL : JU
LE
X D
YN
AM
IC IN
CO
ME
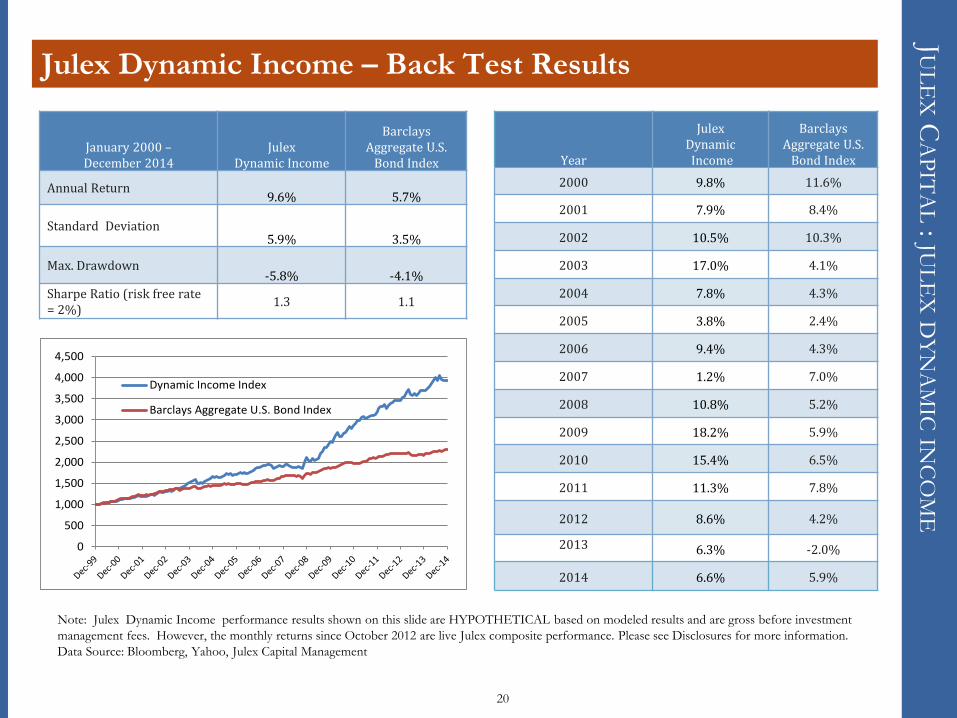
Julex Dynamic Income – Back Test Results
Note: Julex Dynamic Income performance results shown on this slide are HYPOTHETICAL based on modeled results and are gross before investment
management fees. However, the monthly returns since October 2012 are live Julex composite performance. Please see Disclosures for more information.
Data Source: Bloomberg, Yahoo, Julex Capital Management
20
January 2000 – December 2014
Julex Dynamic Income
Barclays Aggregate U.S.
Bond Index
Annual Return 9.6% 5.7%
Standard Deviation 5.9% 3.5%
Max. Drawdown -5.8% -4.1%
Sharpe Ratio (risk free rate = 2%)
1.3 1.1
Year
Julex Dynamic Income
Barclays Aggregate U.S.
Bond Index
2000 9.8% 11.6%
2001 7.9% 8.4%
2002 10.5% 10.3%
2003 17.0% 4.1%
2004 7.8% 4.3%
2005 3.8% 2.4%
2006 9.4% 4.3%
2007 1.2% 7.0%
2008 10.8% 5.2%
2009 18.2% 5.9%
2010 15.4% 6.5%
2011 11.3% 7.8%
2012 8.6% 4.2%
2013 6.3% -2.0%
2014 6.6% 5.9%
0
500
1,000
1,500
2,000
2,500
3,000
3,500
4,000
4,500
Dynamic Income Index
Barclays Aggregate U.S. Bond Index
JUL
EX
CA
PIT
AL : D
YN
AM
IC M
UL
TI A
SSE
T
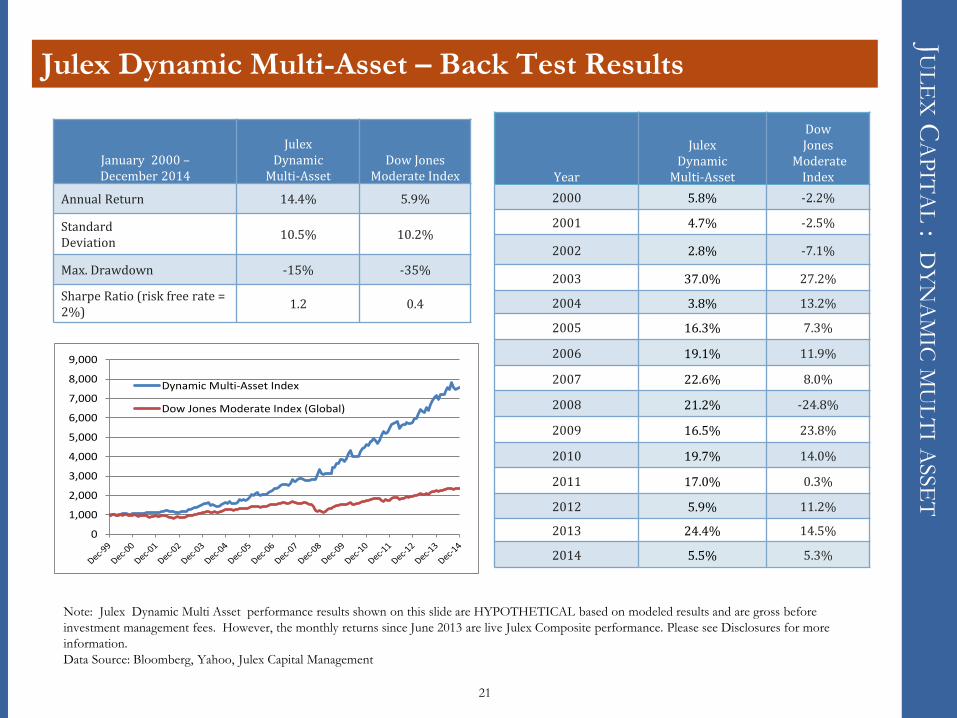
Julex Dynamic Multi-Asset – Back Test Results
Note: Julex Dynamic Multi Asset performance results shown on this slide are HYPOTHETICAL based on modeled results and are gross before
investment management fees. However, the monthly returns since June 2013 are live Julex Composite performance. Please see Disclosures for more
information.
Data Source: Bloomberg, Yahoo, Julex Capital Management
21
January 2000 – December 2014
Julex Dynamic
Multi-Asset Dow Jones
Moderate Index
Annual Return 14.4% 5.9%
Standard Deviation
10.5% 10.2%
Max. Drawdown -15% -35%
Sharpe Ratio (risk free rate = 2%)
1.2 0.4
Year
Julex Dynamic
Multi-Asset
Dow
Jones
Moderate Index
2000 5.8% -2.2%
2001 4.7% -2.5%
2002 2.8% -7.1%
2003 37.0% 27.2%
2004 3.8% 13.2%
2005 16.3% 7.3%
2006 19.1% 11.9%
2007 22.6% 8.0%
2008 21.2% -24.8%
2009 16.5% 23.8%
2010 19.7% 14.0%
2011 17.0% 0.3%
2012 5.9% 11.2%
2013 24.4% 14.5%
2014 5.5% 5.3%
0
1,000
2,000
3,000
4,000
5,000
6,000
7,000
8,000
9,000
Dynamic Multi-Asset Index
Dow Jones Moderate Index (Global)
JUL
EX
CA
PIT
AL : D
YN
AM
IC R
EA
L A
SSE
T
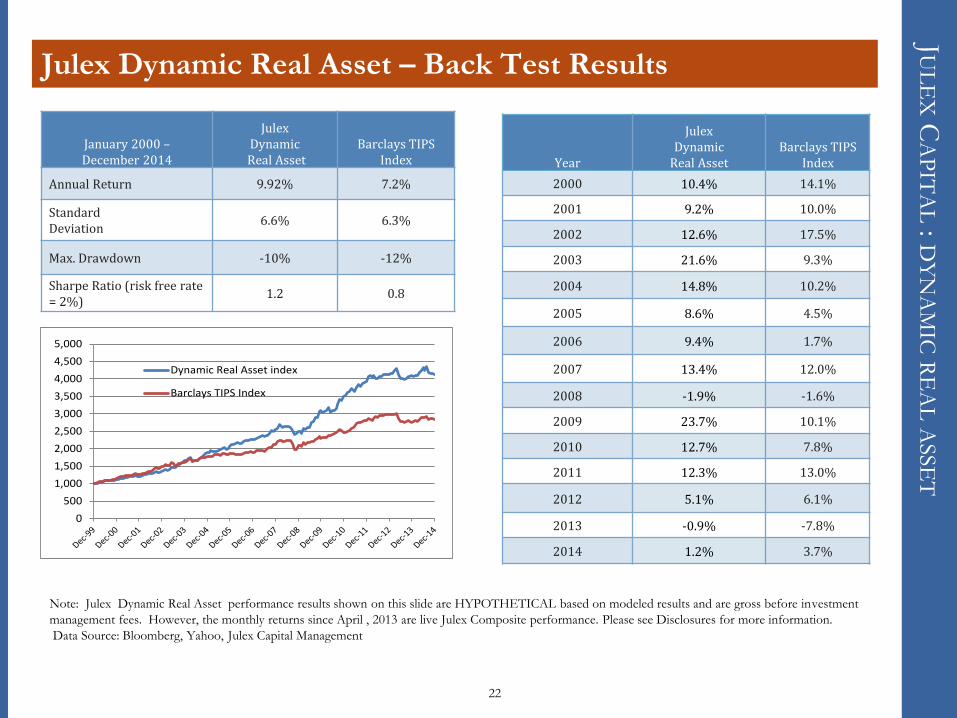
Julex Dynamic Real Asset – Back Test Results
Note: Julex Dynamic Real Asset performance results shown on this slide are HYPOTHETICAL based on modeled results and are gross before investment
management fees. However, the monthly returns since April , 2013 are live Julex Composite performance. Please see Disclosures for more information.
Data Source: Bloomberg, Yahoo, Julex Capital Management
22
January 2000 – December 2014
Julex Dynamic
Real Asset Barclays TIPS
Index
Annual Return 9.92% 7.2%
Standard Deviation
6.6% 6.3%
Max. Drawdown -10% -12%
Sharpe Ratio (risk free rate = 2%)
1.2 0.8
Year
Julex Dynamic
Real Asset Barclays TIPS
Index
2000 10.4% 14.1%
2001 9.2% 10.0%
2002 12.6% 17.5%
2003 21.6% 9.3%
2004 14.8% 10.2%
2005 8.6% 4.5%
2006 9.4% 1.7%
2007 13.4% 12.0%
2008 -1.9% -1.6%
2009 23.7% 10.1%
2010 12.7% 7.8%
2011 12.3% 13.0%
2012 5.1% 6.1%
2013 -0.9% -7.8%
2014 1.2% 3.7%
0
500
1,000
1,500
2,000
2,500
3,000
3,500
4,000
4,500
5,000
Dynamic Real Asset index
Barclays TIPS Index
JUL
EX
CA
PIT
AL : M
AC
RO
OP
PO
RT
UN
ITIE
S IND
EX
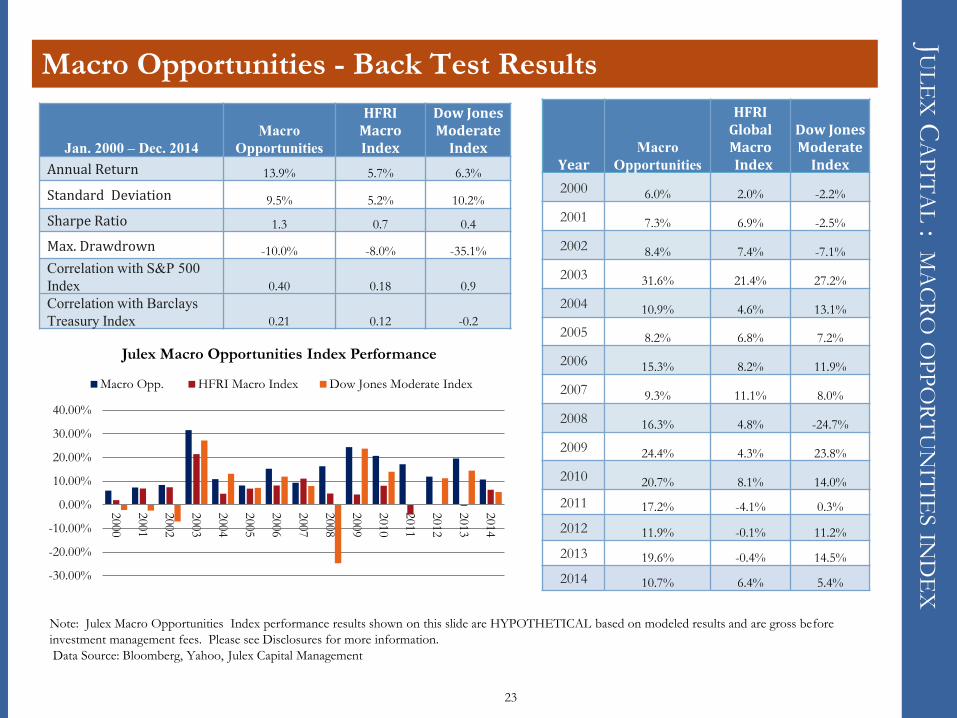
Macro Opportunities - Back Test Results
Note: Julex Macro Opportunities Index performance results shown on this slide are HYPOTHETICAL based on modeled results and are gross before
investment management fees. Please see Disclosures for more information.
Data Source: Bloomberg, Yahoo, Julex Capital Management
Jan. 2000 – Dec. 2014
Macro
Opportunities
HFRI Macro Index
Dow Jones Moderate
Index
Annual Return 13.9% 5.7% 6.3%
Standard Deviation 9.5% 5.2% 10.2%
Sharpe Ratio 1.3 0.7 0.4
Max. Drawdrown -10.0% -8.0% -35.1%
Correlation with S&P 500
Index 0.40 0.18 0.9
Correlation with Barclays
Treasury Index 0.21 0.12 -0.2
Year
Macro
Opportunities
HFRI Global Macro Index
Dow Jones Moderate
Index
2000 6.0% 2.0% -2.2%
2001 7.3% 6.9% -2.5%
2002 8.4% 7.4% -7.1%
2003 31.6% 21.4% 27.2%
2004 10.9% 4.6% 13.1%
2005 8.2% 6.8% 7.2%
2006 15.3% 8.2% 11.9%
2007 9.3% 11.1% 8.0%
2008 16.3% 4.8% -24.7%
2009 24.4% 4.3% 23.8%
2010 20.7% 8.1% 14.0%
2011 17.2% -4.1% 0.3%
2012 11.9% -0.1% 11.2%
2013 19.6% -0.4% 14.5%
2014 10.7% 6.4% 5.4% -30.00%
-20.00%
-10.00%
0.00%
10.00%
20.00%
30.00%
40.00%
2000
2001
2002
2003
2004
2005
2006
2007
2008
2009
2010
2011
2012
2013
2014
Julex Macro Opportunities Index Performance
Macro Opp. HFRI Macro Index Dow Jones Moderate Index
23

DY
NA
MIC
SO
LU
TIO
NS
JULEX DYNAMIC SOLUTIONS
24
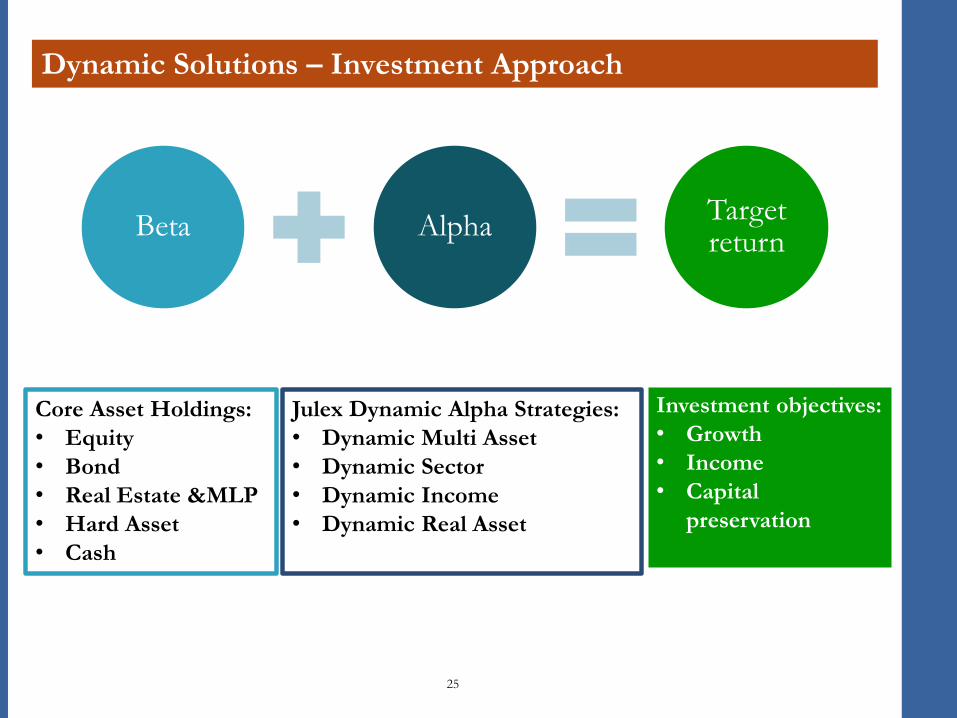
Dynamic Solutions – Investment Approach
25
Beta Alpha Target return
Core Asset Holdings:
• Equity
• Bond
• Real Estate &MLP
• Hard Asset
• Cash
Julex Dynamic Alpha Strategies:
• Dynamic Multi Asset
• Dynamic Sector
• Dynamic Income
• Dynamic Real Asset
Investment objectives:
• Growth
• Income
• Capital
preservation
Investment objectives:
• Growth
• Income
• Capital
preservation
L : O
BJE
CT
IVE
S AN
D P
RO
DU
CT
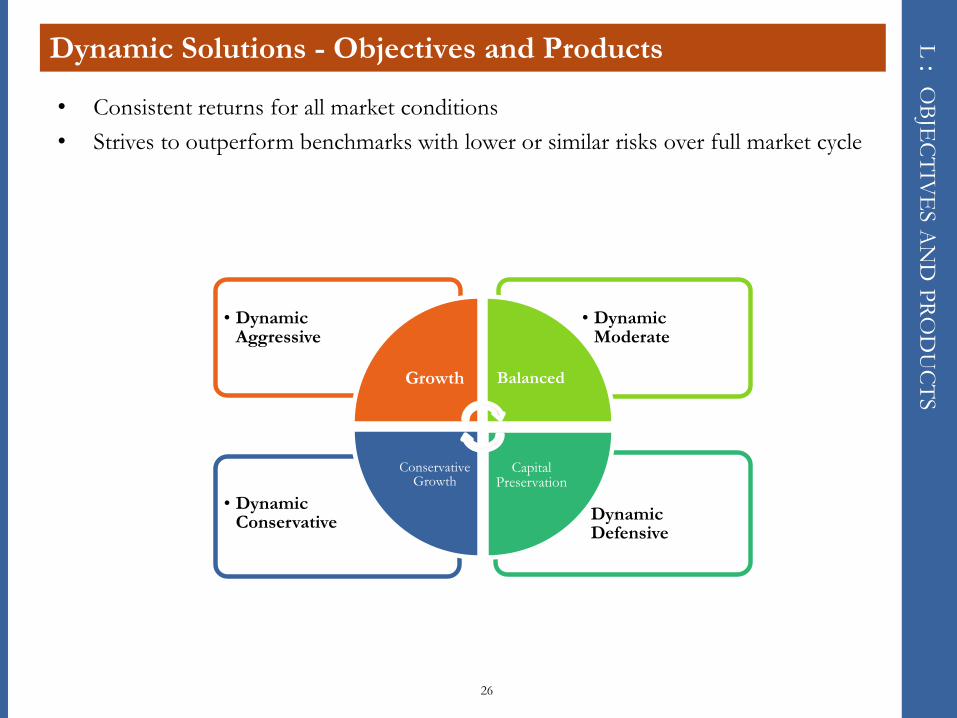
S Dynamic Solutions - Objectives and Products
26
• Dynamic Defensive
• Dynamic Conservative
• Dynamic Moderate
• Dynamic Aggressive
Growth Balanced
Capital Preservation
Conservative Growth
• Consistent returns for all market conditions
• Strives to outperform benchmarks with lower or similar risks over full market cycle
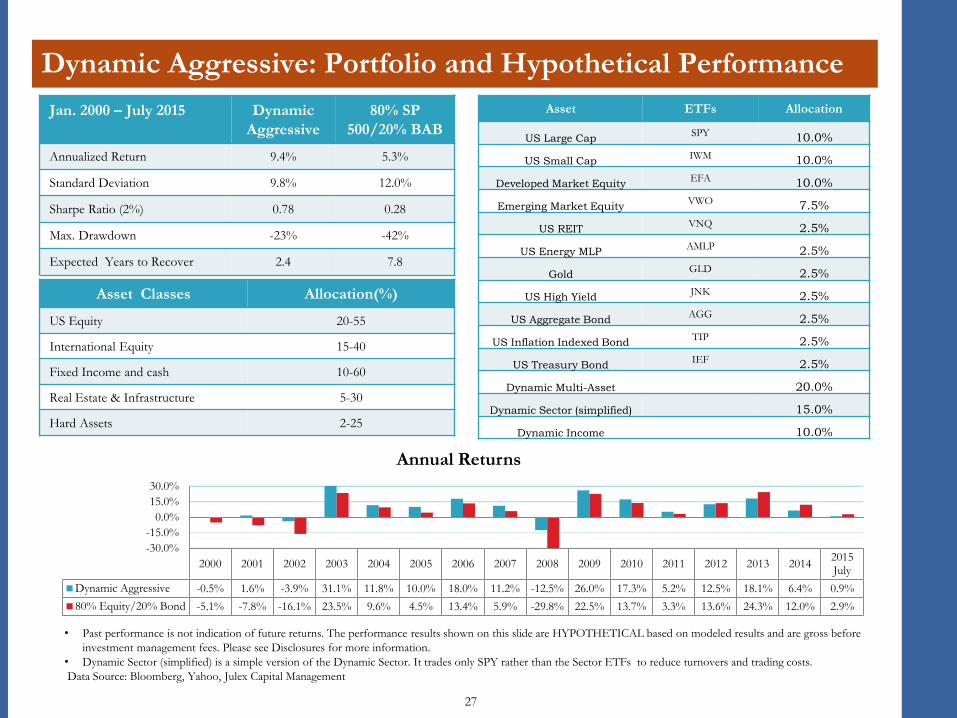
Dynamic Aggressive: Portfolio and Hypothetical Performance
• Past performance is not indication of future returns. The performance results shown on this slide are HYPOTHETICAL based on modeled results and are gross before
investment management fees. Please see Disclosures for more information.
• Dynamic Sector (simplified) is a simple version of the Dynamic Sector. It trades only SPY rather than the Sector ETFs to reduce turnovers and trading costs.
Data Source: Bloomberg, Yahoo, Julex Capital Management
27
2000 2001 2002 2003 2004 2005 2006 2007 2008 2009 2010 2011 2012 2013 20142015July
Dynamic Aggressive -0.5% 1.6% -3.9% 31.1% 11.8% 10.0% 18.0% 11.2% -12.5% 26.0% 17.3% 5.2% 12.5% 18.1% 6.4% 0.9%
80% Equity/20% Bond -5.1% -7.8% -16.1% 23.5% 9.6% 4.5% 13.4% 5.9% -29.8% 22.5% 13.7% 3.3% 13.6% 24.3% 12.0% 2.9%
-30.0%
-15.0%
0.0%
15.0%
30.0%
Annual Returns
Jan. 2000 – July 2015 Dynamic
Aggressive
80% SP
500/20% BAB
Annualized Return 9.4% 5.3%
Standard Deviation 9.8% 12.0%
Sharpe Ratio (2%) 0.78 0.28
Max. Drawdown -23% -42%
Expected Years to Recover 2.4 7.8
Asset Classes Allocation(%)
US Equity 20-55
International Equity 15-40
Fixed Income and cash 10-60
Real Estate & Infrastructure 5-30
Hard Assets 2-25
Asset ETFs Allocation
US Large Cap SPY 10.0%
US Small Cap IWM 10.0%
Developed Market Equity EFA 10.0%
Emerging Market Equity VWO 7.5%
US REIT VNQ 2.5%
US Energy MLP AMLP 2.5%
Gold GLD 2.5%
US High Yield JNK 2.5%
US Aggregate Bond AGG 2.5%
US Inflation Indexed Bond TIP 2.5%
US Treasury Bond IEF 2.5%
Dynamic Multi-Asset 20.0%
Dynamic Sector (simplified) 15.0%
Dynamic Income 10.0%
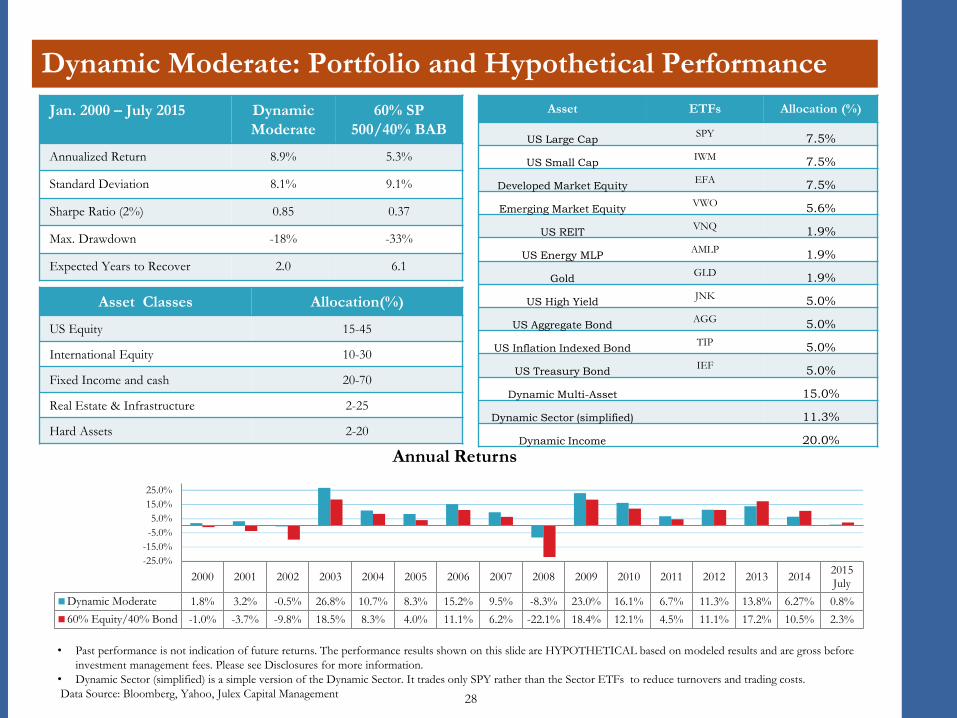
Dynamic Moderate: Portfolio and Hypothetical Performance
• Past performance is not indication of future returns. The performance results shown on this slide are HYPOTHETICAL based on modeled results and are gross before
investment management fees. Please see Disclosures for more information.
• Dynamic Sector (simplified) is a simple version of the Dynamic Sector. It trades only SPY rather than the Sector ETFs to reduce turnovers and trading costs.
Data Source: Bloomberg, Yahoo, Julex Capital Management 28
2000 2001 2002 2003 2004 2005 2006 2007 2008 2009 2010 2011 2012 2013 20142015July
Dynamic Moderate 1.8% 3.2% -0.5% 26.8% 10.7% 8.3% 15.2% 9.5% -8.3% 23.0% 16.1% 6.7% 11.3% 13.8% 6.27% 0.8%
60% Equity/40% Bond -1.0% -3.7% -9.8% 18.5% 8.3% 4.0% 11.1% 6.2% -22.1% 18.4% 12.1% 4.5% 11.1% 17.2% 10.5% 2.3%
-25.0%
-15.0%
-5.0%
5.0%
15.0%
25.0%
Annual Returns
Jan. 2000 – July 2015
Dynamic
Moderate
60% SP
500/40% BAB
Annualized Return 8.9% 5.3%
Standard Deviation 8.1% 9.1%
Sharpe Ratio (2%) 0.85 0.37
Max. Drawdown -18% -33%
Expected Years to Recover 2.0 6.1
Asset Classes Allocation(%)
US Equity 15-45
International Equity 10-30
Fixed Income and cash 20-70
Real Estate & Infrastructure 2-25
Hard Assets 2-20
Asset ETFs Allocation (%)
US Large Cap SPY
7.5%
US Small Cap IWM
7.5%
Developed Market Equity EFA
7.5%
Emerging Market Equity VWO
5.6%
US REIT VNQ
1.9%
US Energy MLP AMLP
1.9%
Gold GLD
1.9%
US High Yield JNK
5.0%
US Aggregate Bond AGG
5.0%
US Inflation Indexed Bond TIP
5.0%
US Treasury Bond IEF
5.0%
Dynamic Multi-Asset 15.0%
Dynamic Sector (simplified) 11.3%
Dynamic Income 20.0%
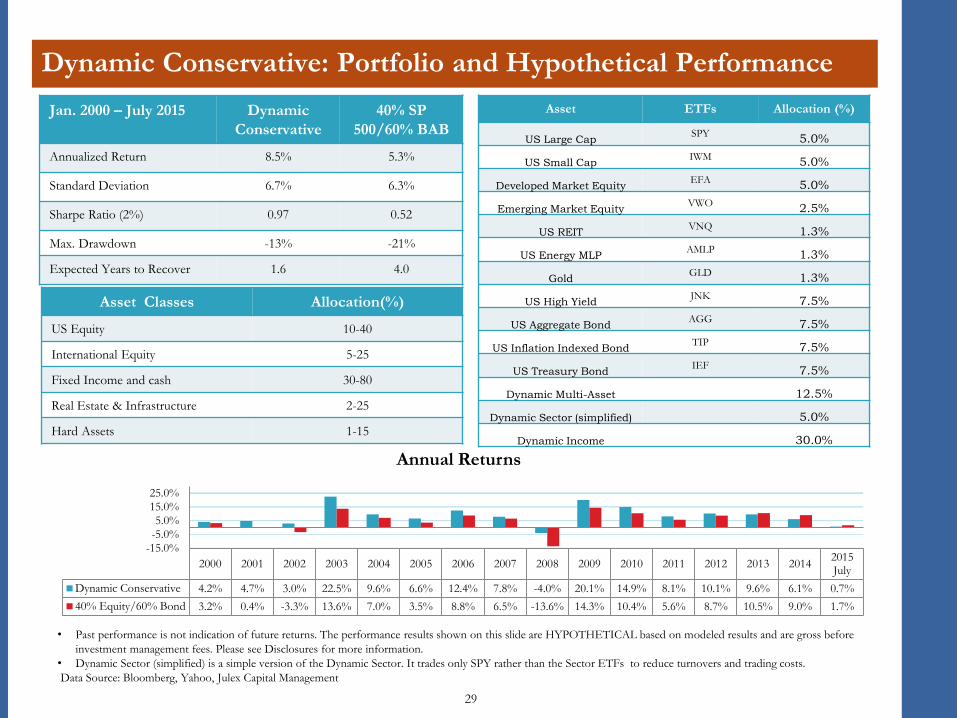
Dynamic Conservative: Portfolio and Hypothetical Performance
29
2000 2001 2002 2003 2004 2005 2006 2007 2008 2009 2010 2011 2012 2013 20142015July
Dynamic Conservative 4.2% 4.7% 3.0% 22.5% 9.6% 6.6% 12.4% 7.8% -4.0% 20.1% 14.9% 8.1% 10.1% 9.6% 6.1% 0.7%
40% Equity/60% Bond 3.2% 0.4% -3.3% 13.6% 7.0% 3.5% 8.8% 6.5% -13.6% 14.3% 10.4% 5.6% 8.7% 10.5% 9.0% 1.7%
-15.0%
-5.0%
5.0%
15.0%
25.0%
Annual Returns
Jan. 2000 – July 2015
Dynamic
Conservative
40% SP
500/60% BAB
Annualized Return 8.5% 5.3%
Standard Deviation 6.7% 6.3%
Sharpe Ratio (2%) 0.97 0.52
Max. Drawdown -13% -21%
Expected Years to Recover 1.6 4.0
Asset Classes Allocation(%)
US Equity 10-40
International Equity 5-25
Fixed Income and cash 30-80
Real Estate & Infrastructure 2-25
Hard Assets 1-15
Asset ETFs Allocation (%)
US Large Cap SPY
5.0%
US Small Cap IWM
5.0%
Developed Market Equity EFA
5.0%
Emerging Market Equity VWO
2.5%
US REIT VNQ
1.3%
US Energy MLP AMLP
1.3%
Gold GLD
1.3%
US High Yield JNK
7.5%
US Aggregate Bond AGG
7.5%
US Inflation Indexed Bond TIP
7.5%
US Treasury Bond IEF
7.5%
Dynamic Multi-Asset 12.5%
Dynamic Sector (simplified) 5.0%
Dynamic Income 30.0%
• Past performance is not indication of future returns. The performance results shown on this slide are HYPOTHETICAL based on modeled results and are gross before
investment management fees. Please see Disclosures for more information.
• Dynamic Sector (simplified) is a simple version of the Dynamic Sector. It trades only SPY rather than the Sector ETFs to reduce turnovers and trading costs.
Data Source: Bloomberg, Yahoo, Julex Capital Management
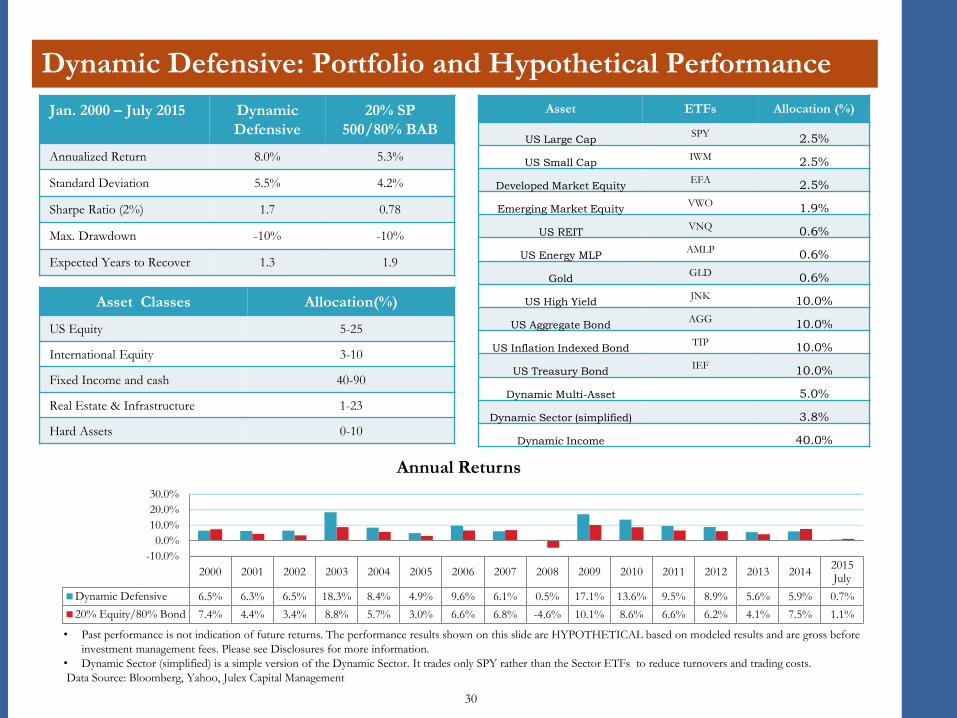
Dynamic Defensive: Portfolio and Hypothetical Performance
• Past performance is not indication of future returns. The performance results shown on this slide are HYPOTHETICAL based on modeled results and are gross before
investment management fees. Please see Disclosures for more information.
• Dynamic Sector (simplified) is a simple version of the Dynamic Sector. It trades only SPY rather than the Sector ETFs to reduce turnovers and trading costs.
Data Source: Bloomberg, Yahoo, Julex Capital Management
30
2000 2001 2002 2003 2004 2005 2006 2007 2008 2009 2010 2011 2012 2013 20142015July
Dynamic Defensive 6.5% 6.3% 6.5% 18.3% 8.4% 4.9% 9.6% 6.1% 0.5% 17.1% 13.6% 9.5% 8.9% 5.6% 5.9% 0.7%
20% Equity/80% Bond 7.4% 4.4% 3.4% 8.8% 5.7% 3.0% 6.6% 6.8% -4.6% 10.1% 8.6% 6.6% 6.2% 4.1% 7.5% 1.1%
-10.0%
0.0%
10.0%
20.0%
30.0%
Annual Returns
Jan. 2000 – July 2015
Dynamic
Defensive
20% SP
500/80% BAB
Annualized Return 8.0% 5.3%
Standard Deviation 5.5% 4.2%
Sharpe Ratio (2%) 1.7 0.78
Max. Drawdown -10% -10%
Expected Years to Recover 1.3 1.9
Asset Classes Allocation(%)
US Equity 5-25
International Equity 3-10
Fixed Income and cash 40-90
Real Estate & Infrastructure 1-23
Hard Assets 0-10
Asset ETFs Allocation (%)
US Large Cap SPY
2.5%
US Small Cap IWM
2.5%
Developed Market Equity EFA
2.5%
Emerging Market Equity VWO
1.9%
US REIT VNQ
0.6%
US Energy MLP AMLP
0.6%
Gold GLD
0.6%
US High Yield JNK
10.0%
US Aggregate Bond AGG
10.0%
US Inflation Indexed Bond TIP
10.0%
US Treasury Bond IEF
10.0%
Dynamic Multi-Asset 5.0%
Dynamic Sector (simplified) 3.8%
Dynamic Income 40.0%
JUL
EX
CA
PIT
AL : D
ISC
LO
SU
RE
S
Disclosures
This information in this presentation is for the purpose of information exchange. This is not a solicitation or offer to buy or sell any security. You must do your own due diligence and consult a professional investment advisor before making any investment decisions. The use of a proprietary technique, model or algorithm does not guarantee any specific or profitable results. Past performance is not indicative of future returns. The performance data presented are gross returns, unless otherwise noted.
The risk of loss in trading securities can be substantial. You should therefore carefully consider whether such trading is suitable for you in light of your financial condition. All information posted is believed to come from reliable sources. We do not warrant the accuracy or completeness of information made available and therefore will not be liable for any losses incurred.
The investment performance shown in the Appendix is HYPOTHETICAL. It is based on the back tests of historical data. Hypothetical performance results have many inherent limitations, some of which are described below. No representation is being made that any account will or is likely to achieve profits or losses similar to those shown. In fact, there are frequently sharp differences between hypothetical performance results and the actual results subsequently achieved by any particular trading program.
One of the limitations of hypothetical performance results is that they are generally prepared with the benefit of hindsight. In addition, hypothetical trading does not involve financial risk, and no hypothetical trading record can completely account for the impact of financial risk in actual trading. For example, the ability to withstand losses or adhere to a particular trading program in spite of trading losses are material points which can also adversely affect actual trading results. There are numerous other factors related to the markets in general or to the implementation of any specific trading program which cannot be fully accounted for in the presentation of hypothetical performance results and all of which can adversely affect actual trading results.
The composition of a benchmark index may not reflect the manner in which a Julex portfolio is constructed in relation to expected or achieved returns, investment holdings, portfolio guidelines, restrictions, sectors, correlations, concentrations, volatility, or tracking error targets, all of which are subject to change over time.
No representation or warranty is made to the reasonableness of the assumptions made or that all assumptions used to construct the performance provided have been stated or fully considered.
In the back test, we used the index returns in case the historical returns of the ETFs are not long enough. The ETF returns were approximated by index returns subtracted by their respective expense ratios. Please see “Notes on Data” for more details.
31
JUL
EX
CA
PIT
AL : N
OT
ES O
N D
AT
A
Notes on Data
In the back test, we used the index returns in case the historical returns of the ETFs are not long enough. The ETF returns were approximated by index returns subtracted by their respective expense ratios.
The following summarizes the detailed calculations:
(1) IWM: Russell 2000 Index - 20bps before 5/31/2000
(2) EFA: MSCI EAFE Index - 34 bps before 8/28/2001
(3) VWO: MSCI EM Index -15 bps before 4/29/2005
(4) VNQ: MSCI US REIT Index - 10 bps before 10/29/2004
(5) MLPI: Alerian MLP Infrastructure Index - 85 bps before 5/28/2010
(6) GLD: London Gold Fixing - 40 bps before 12/31/2004
(7) JNK: Barclays Capital US High Yield Index - 40 bps before 1/31/2008
(8) AGG: Barclays Capital US Aggregate Index - 8 bps before 10/31/2003
(9) IEF: Barclays Capital US Treasury Index - 15 bps before 8/30/2002
(10) TLT: Barclays Capital 20+ year US Treasury Index -15 bps before 8/30/2002
(11) SHV: Three-month T-bill before 02/28/2007
(13) DVY: Dow Jones US Select Dividend Index - 39 bps before 12/31/2003
(14) EMB: JP Morgan EMBI Global Core Index - 60 bps before 1/31/2008
(15) PFF: S&P US Preferred Index - 47 bps before 4/30/2007
(16) BKLN: S&P/LSTA Bank Loan Index -65 bps before 4/29/2011
(17) IVE: S&P 500 Value Index - 18 bps before 6/30/2000
(18) IVW: S&P 500 Growth Index - 18 bps before 6/30/2000
(19) IWS: Russell MidCap Value Index - 25 bps before 9/28/2001
(20) IWP: Russell MidCap Growth Index - 25 bps before 9/28/2001
(21) IWN: Russell SmallCap Value Index - 25 bps before 8/31/2000
(22) IWO: Russell SmallCap Growth Index - 25 bps before 8/31/2000
(23) DJP: Dow Jones UBS Commodity Index - 75 bps before 11/30/2006
(24) RWX: Dow Jone Global Real Estate Index -59 bps before 1/31/2007
32