Embed Size (px)
Citation preview

June 2018
Monthly Report

Executive Summary
Indian Economy
Indian Equity Market
Indian Fixed Income
Global Equity Market
Global Fixed Income
Currency
Commodity
Mutual Fund Corner
What’s Inside

Executive Summary

Investors turned anxious as U.S.-China trade war tensions resurfaced in May 2018 and fresh differences arose between
U.S. and North Korea. These, together with other developments, kept major global markets under pressure. U.S. markets
managed to inch up as crude oil prices increased and economic data improved. However, the U.S. administration
planning to impose tariffs on imports from Canada, European Union (EU) and Mexico restricted the gains. Also, the U.S.
government’s changing stance on Chinese imports kept markets guessing.
The tense political scenarios of Spain and Italy kept European markets weak, though later in the month the situation
came under control. The market fall was cushioned by upbeat quarterly earnings and rise in crude oil prices.
Fear of U.S. and China trade war resurfaced and pressurised Asian markets. Political uncertainty in Italy and U.S.
President’s change in stance over talks with North Korea kept investors wary. Strength in crude oil and positive
economic data came to the rescue.
Indian equity markets ended flat in the midst of high volatility. Other than the global factors such as trade war fears,
North Korea-U.S. problems, and U.S. sanctions on Iran, Karnataka polls kept market participants nervous. Increase in
inflation and a weak rupee made investors worry that the Monetary Policy Committee (MPC) could raise interest rates
in its forthcoming meeting.
Bond yields rose following increase in global crude oil prices and increase in domestic inflationary pressures. Losses
were restricted when the Reserve Bank of India (RBI) relaxed rules for foreign investment in government securities.
Meanwhile, MPC in its bi-monthly meeting held on Jun 6, 2018, raised interest rates by 25 basis points to 6.25%, the first
hike in more than four years. The step was taken to combat high inflation and weakness in rupee, but the committee
maintained its neutral stance on monetary policy.
What Happened Last Month
4

Investors will track the developments around government formation in Karnataka. The centralopposition leaders from the state are likely to visit New Delhi to discuss the list of ministers and portfolioallocation with the party high-command, ahead of the cabinet expansion in the southern state.
Surge in global crude oil prices has once again raised fears of fiscal slippage as it is expected tohave a cascading effect on India’s import bill. In addition, movement of the rupee against thegreenback and stance adopted by foreign portfolio investors will be closely tracked.
RBI is trying to boost the attractiveness of the domestic debt market by easing rules for foreigninvestment in government securities. However, bond yields have continued to move north giventhe lack of positive triggers in the domestic debt market.
Moving ahead, the bond yield trajectory will be dictated by how a slew of factors pan out namelysystematic liquidity, domestic inflationary pressures and the distribution of monsoons.
Domestic Market Outlook
5

Global cues likely toimpact buying interestinclude the latestprotectionist moveadopted by the U.S.President on the tradefront.
According to mediareports, the WhiteHouse is planning toimpose steel andaluminum tariffs onCanada, Mexico andthe EU. The same hasraised speculation overprobable retaliation bysome of the major U.S.allies.
The rate hike stance ofthe U.S. Federal Reserve(Fed) will continue toimpact marketsentiment. Meanwhile,stronger than expectedU.S. jobs growth in Mayinstilled confidenceamong investors aboutthe strength of the U.S.economy to withstandfurther rate hikes.
Investors will continueto monitor the politicaldevelopments in Italyand Spain.
Global Market Outlook
6

Domestic Economy

• The Gross Domestic Product (GDP) at 2011-12 prices of the Indian economy witnessed a growth of 7.7% YoY in the
fourth quarter of FY18, better than the growths of 5.6%, 6.3% and 7.0% in the Q1, Q2 and Q3 of FY18, respectively. For
FY18, the Indian economy grew 6.7%.
• The MPC, in its second bi-monthly policy review for 2018-19, increased the key policy repo rate by 25 basis to 6.25%
and retained its “neutral” stance.
• The Consumer Price Index (CPI)-based inflation grew 4.58% in Apr 2018, up from 4.28% in Mar 2018 and from 2.99% in
Apr 2017.
• India’s Index of Industrial Production (IIP) marked a five-month low at 4.4% YoY in Mar 2018 as against downwardly
revised growth of 7.0% (7.1% originally reported) in Feb 2018.
• India’s Wholesale Price Index-based inflation (WPI) rose to four-month high to 3.18% in Apr 2018 from a provisional
2.47% growth in Mar 2018 and 3.85% in Apr 2017.
Key Indicators Period Actual Previous
Consumer Price Index (CPI) Apr-2018 4.58% 4.28%
Wholesale Price Index (WPI) Apr-2018 3.18% 2.47%
Index of Industrial Production (IIP) Mar-2018 4.40% 7.00%
Gross Domestic Product (GDP) Mar-2018 7.70% 7.00%
Core Sector Output (%) Apr-2018 4.65% 4.44%
Export (Y-o-Y) Apr-2018 5.17% -0.66%
Import (Y-o-Y) Apr-2018 4.60% 7.15%
Source: MOSPI, Thomson Reuters Eikon
Monthly CPI & WPI Movement
Source: MOSPI
Indian Economy
8
0.00
2.00
4.00
6.00
Apr-17 Aug-17 Dec-17 Apr-18
WPI CPISource: MOSPI
Gro
wth
(I
n %
)
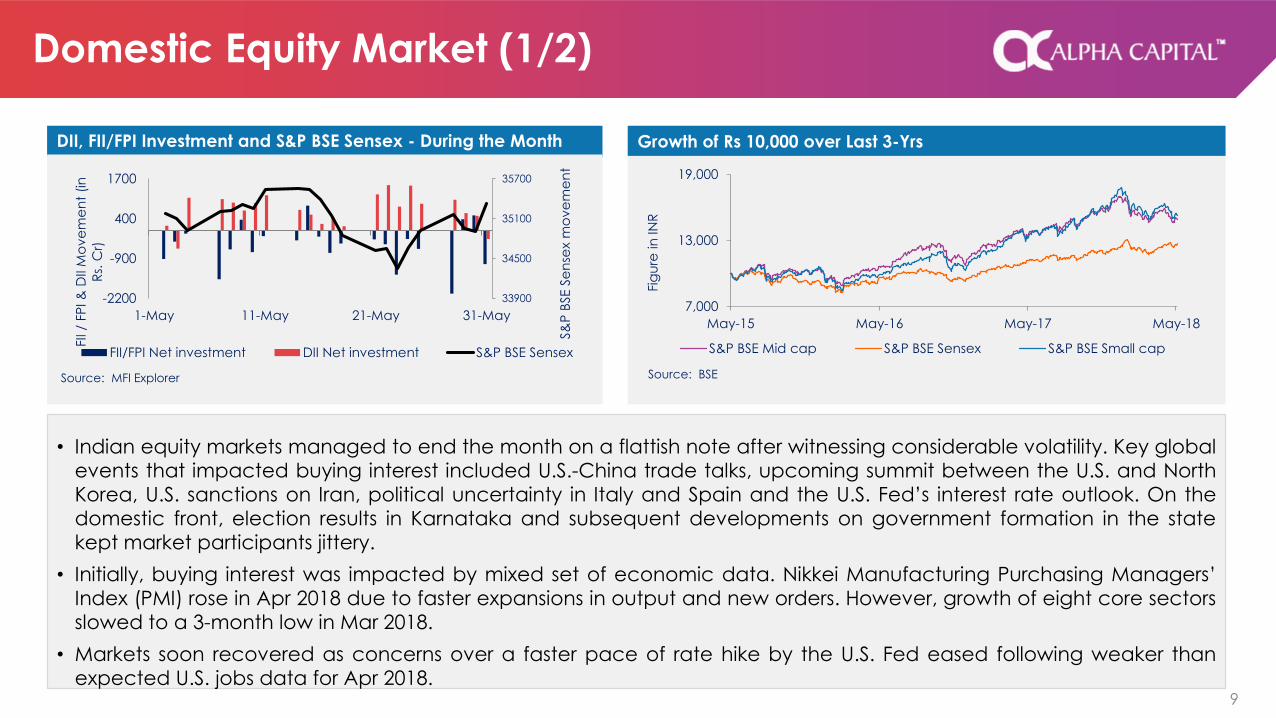
• Indian equity markets managed to end the month on a flattish note after witnessing considerable volatility. Key global
events that impacted buying interest included U.S.-China trade talks, upcoming summit between the U.S. and North
Korea, U.S. sanctions on Iran, political uncertainty in Italy and Spain and the U.S. Fed’s interest rate outlook. On the
domestic front, election results in Karnataka and subsequent developments on government formation in the state
kept market participants jittery.
• Initially, buying interest was impacted by mixed set of economic data. Nikkei Manufacturing Purchasing Managers’
Index (PMI) rose in Apr 2018 due to faster expansions in output and new orders. However, growth of eight core sectors
slowed to a 3-month low in Mar 2018.
• Markets soon recovered as concerns over a faster pace of rate hike by the U.S. Fed eased following weaker than
expected U.S. jobs data for Apr 2018.
DII, FII/FPI Investment and S&P BSE Sensex - During the Month Growth of Rs 10,000 over Last 3-Yrs
Domestic Equity Market (1/2)
9
7,000
13,000
19,000
May-15 May-16 May-17 May-18
S&P BSE Mid cap S&P BSE Sensex S&P BSE Small cap
Fig
ure
in
IN
R
Source: BSE
33900
34500
35100
35700
-2200
-900
400
1700
1-May 11-May 21-May 31-May
S&
P B
SE S
en
sex
mo
ve
me
nt
FII /
FP
I &
DII M
ove
me
nt
(in
Rs.
Cr)
FII/FPI Net investment DII Net investment S&P BSE Sensex
Source: MFI Explorer
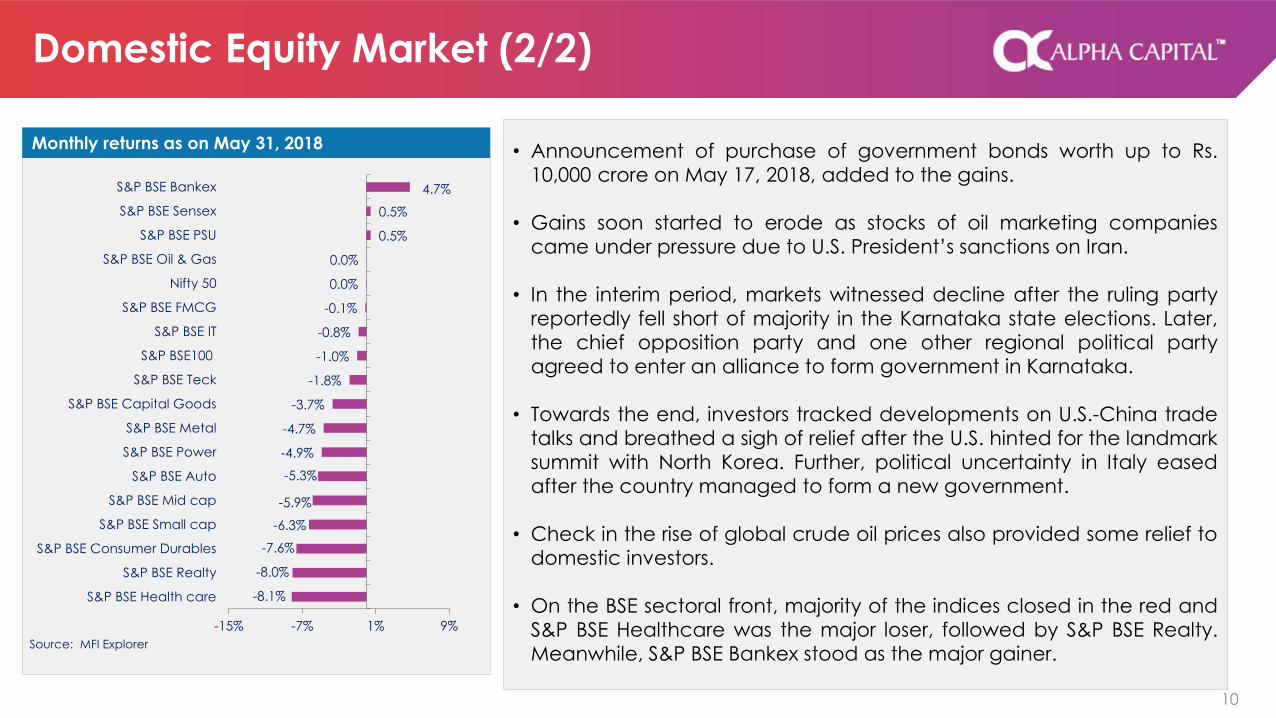
• Announcement of purchase of government bonds worth up to Rs.
10,000 crore on May 17, 2018, added to the gains.
• Gains soon started to erode as stocks of oil marketing companies
came under pressure due to U.S. President’s sanctions on Iran.
• In the interim period, markets witnessed decline after the ruling party
reportedly fell short of majority in the Karnataka state elections. Later,
the chief opposition party and one other regional political party
agreed to enter an alliance to form government in Karnataka.
• Towards the end, investors tracked developments on U.S.-China trade
talks and breathed a sigh of relief after the U.S. hinted for the landmark
summit with North Korea. Further, political uncertainty in Italy eased
after the country managed to form a new government.
• Check in the rise of global crude oil prices also provided some relief to
domestic investors.
• On the BSE sectoral front, majority of the indices closed in the red and
S&P BSE Healthcare was the major loser, followed by S&P BSE Realty.
Meanwhile, S&P BSE Bankex stood as the major gainer.
Monthly returns as on May 31, 2018
Domestic Equity Market (2/2)
10
-8.1%
-8.0%
-7.6%
-6.3%
-5.9%
-5.3%
-4.9%
-4.7%
-3.7%
-1.8%
-1.0%
-0.8%
-0.1%
0.0%
0.0%
0.5%
0.5%
4.7%
-15% -7% 1% 9%
S&P BSE Health care
S&P BSE Realty
S&P BSE Consumer Durables
S&P BSE Small cap
S&P BSE Mid cap
S&P BSE Auto
S&P BSE Power
S&P BSE Metal
S&P BSE Capital Goods
S&P BSE Teck
S&P BSE100
S&P BSE IT
S&P BSE FMCG
Nifty 50
S&P BSE Oil & Gas
S&P BSE PSU
S&P BSE Sensex
S&P BSE Bankex
Source: MFI Explorer

• Bond yields rose in May following rise in global crude oil prices and more than expected increase in domestic
inflationary pressures in Apr 2018. Losses were restricted after global crude oil prices fell to some extent at the end of
the month and RBI relaxed rules for foreign investment in government securities.
• Yield on the 10-year benchmark bond (7.17% GS 2028) rose 6 bps to close at 7.83% from the previous month’s close of
7.77% after moving in a wide range of 7.55% to 7.95%.
10-Yr Benchmark Bond 10 Year Corporate Bond Spread (for AAA & AA bonds)
Fixed Income (1/2)
11
6.3
6.9
7.5
8.1
May-17 Sep-17 Jan-18 May-18
Yie
ld (
%)
Source: CCIL
0
70
140
210
May-17 Sep-17 Jan-18 May-18
AAA Bond Spread (in bps) AA Bond Spread (in bps)
Sp
rea
d (
in b
ps)
Source: Thomson Reuters Eikon

• Bond yields fell further after RBI unexpectedly announced to
conduct an open market purchase of government securities for an
aggregate amount of Rs. 10,000 crore and a government official
indicated that the central bank will continue buying bonds through
Open Market Operations (OMO).
• However, the trend reversed after the U.S. President withdrew from
the Iran nuclear deal and the global crude oil prices shot up to a
three and a half year high. Surge in global crude oil prices led to
concerns that MPC might increase interest rates. Market sentiment
was further dampened after both CPI and WPI-based inflation grew
in Apr 2018.
• Meanwhile, global concerns over U.S. and China trade talks
weighed on the debt market. Speculation over a lower possibility of
another open market purchase of government bonds by RBI also
added to the losses.
• Political uncertainty in Italy, weakness in the domestic currency and
absence of positive triggers in the domestic debt market also had a
bearing on market sentiment. However, further losses were restricted
after global crude oil prices fell to some extent towards the end.
Liquidity Monitor- M3 Supply and Net Borrowings
Key Indicator May-18 Apr-18 May-17
Call Rate 5.94% 6.02% 6.02%
10‐Yr benchmark bond 7.83% 7.77% 6.66%
Reverse Repo* 6.00% 5.75% 6.00%
Repo* 6.25% 6.00% 6.25%
Bank Rate* 6.50% 6.25% 6.50%
CRR 4.00% 4.00% 4.00%
Source: CCIL,RBI; *As per Bi-monthly Monetary Policy as on 06-06-18
Fixed Income (2/2)
12
-40,000
20,000
80,000
140,000
4
7
10
13
May-16 Jan-17 Sep-17 May-18
Rs.
in
Cro
re
in (
%)
M3 Supply Net Borrowings
Source: Thomson Reuters Eikon

Global Equity & Debt Market
14
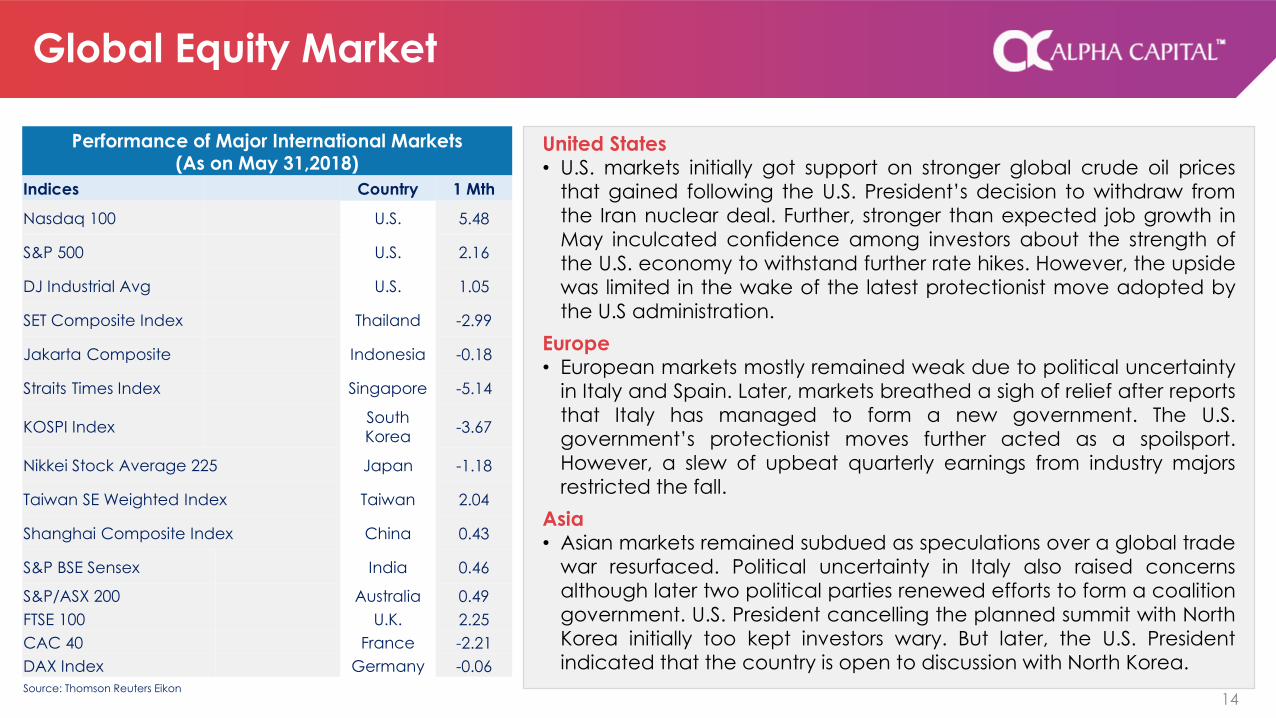
United States• U.S. markets initially got support on stronger global crude oil prices
that gained following the U.S. President’s decision to withdraw from
the Iran nuclear deal. Further, stronger than expected job growth in
May inculcated confidence among investors about the strength of
the U.S. economy to withstand further rate hikes. However, the upside
was limited in the wake of the latest protectionist move adopted by
the U.S administration.
Europe• European markets mostly remained weak due to political uncertainty
in Italy and Spain. Later, markets breathed a sigh of relief after reports
that Italy has managed to form a new government. The U.S.
government’s protectionist moves further acted as a spoilsport.
However, a slew of upbeat quarterly earnings from industry majors
restricted the fall.
Asia• Asian markets remained subdued as speculations over a global trade
war resurfaced. Political uncertainty in Italy also raised concerns
although later two political parties renewed efforts to form a coalition
government. U.S. President cancelling the planned summit with North
Korea initially too kept investors wary. But later, the U.S. President
indicated that the country is open to discussion with North Korea.
Performance of Major International Markets (As on May 31,2018)
Indices Country 1 Mth
Nasdaq 100 U.S. 5.48
S&P 500 U.S. 2.16
DJ Industrial Avg U.S. 1.05
SET Composite Index Thailand -2.99
Jakarta Composite Indonesia -0.18
Straits Times Index Singapore -5.14
KOSPI IndexSouth
Korea-3.67
Nikkei Stock Average 225 Japan -1.18
Taiwan SE Weighted Index Taiwan 2.04
Shanghai Composite Index China 0.43
S&P BSE Sensex India 0.46
S&P/ASX 200 Australia 0.49
FTSE 100 U.K. 2.25
CAC 40 France -2.21
DAX Index Germany -0.06
Source: Thomson Reuters Eikon
Global Equity Market
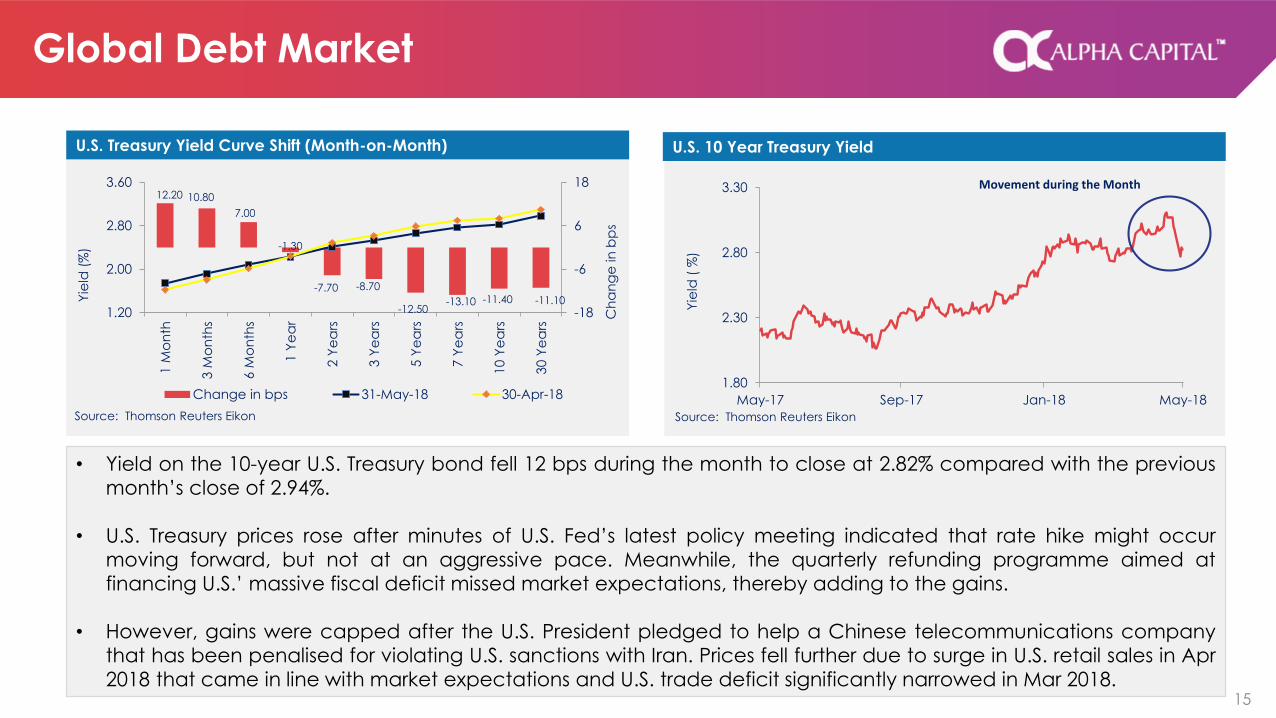
• Yield on the 10-year U.S. Treasury bond fell 12 bps during the month to close at 2.82% compared with the previous
month’s close of 2.94%.
• U.S. Treasury prices rose after minutes of U.S. Fed’s latest policy meeting indicated that rate hike might occur
moving forward, but not at an aggressive pace. Meanwhile, the quarterly refunding programme aimed at
financing U.S.’ massive fiscal deficit missed market expectations, thereby adding to the gains.
• However, gains were capped after the U.S. President pledged to help a Chinese telecommunications company
that has been penalised for violating U.S. sanctions with Iran. Prices fell further due to surge in U.S. retail sales in Apr
2018 that came in line with market expectations and U.S. trade deficit significantly narrowed in Mar 2018.
U.S. Treasury Yield Curve Shift (Month-on-Month) U.S. 10 Year Treasury Yield
Global Debt Market
15
1.80
2.30
2.80
3.30
May-17 Sep-17 Jan-18 May-18
Yie
ld (
%)
Movement during the Month
Source: Thomson Reuters Eikon
12.20 10.80
7.00
-1.30
-7.70 -8.70
-12.50-13.10 -11.40 -11.10
-18
-6
6
18
1.20
2.00
2.80
3.60
1 M
on
th
3 M
on
ths
6 M
on
ths
1 Y
ea
r
2 Y
ea
rs
3 Y
ea
rs
5 Y
ea
rs
7 Y
ea
rs
10 Y
ea
rs
30 Y
ea
rs
Ch
an
ge
in
bp
s
Yie
ld (
%)
Change in bps 31-May-18 30-Apr-18
Source: Thomson Reuters Eikon

INR
• The Indian rupee weakened against the U.S. dollar and touched 16-
month low but retreated to some extent at the end. Rupee fell due to
continuous demand for greenback from oil importers and corporates.
Market sentiment dampened following increase in global crude oil
prices.
• Rupee fell further as obstructions in trade talks between the U.S. and
China renewed fears of trade war. Losses in the domestic equity
markets following a global sell off amid political crisis and uncertainty
over Italy’s membership of the euro also hurt the domestic currency.
EURO
• The Euro plunged against the U.S. dollar in May. The single currency fell
as data showed a pickup in U.S. consumer spending, which led to rise
in U.S. Treasury yields. Softer than expected economic data from the
euro zone and Britain increased losses.
• Rising bond yields in Italy made investors nervous and developing
political instability in Spain weighed on sentiment. However, losses
were restricted at the end on reports that Italy's biggest party would
make a renewed attempt to form a coalition government.
Rupee Versus Dollar during the year
Movement of Major Currencies
Currency Value 1 Mth 1 Yr
U.S. Dollar 67.45 66.78 64.55
Pound Sterling 89.79 92.89 82.64
Euro 78.79 80.74 72.14
100 Yen 62.04 61.08 58.15
Source: RBI
Currency Market
16
63
65
67
69
May-17 Sep-17 Jan-18 May-18
INR
V/S
USD
Source: RBI

Crude
• Initially, Brent crude prices gained and traded at more than three-year-
high level of $81 per barrel after the U.S. decided to withdraw from a
nuclear deal with Iran. This raised concerns over supply disruptions from
the Middle East and ignited geopolitical tensions in the region. However,
the upside was limited after the Organization of the Petroleum Exporting
Countries (OPEC) and non-OPEC country Russia indicated to raise
production level to meet the shortfall in supply from Iran and Venezuela.
Gold
• Gold prices initially remained weak as U.S. Treasury yields strengthened
after the U.S. President decided to withdraw from an international nuclear
deal with Iran. Easing concerns on political turmoil in Italy and possibility of
U.S. and North Korea’s scheduled summit in Jun 2018 further weighed on
the bullion’s prices.
• However, downside was limited on fears of probable trade war after the
U.S. announced that it might impose tariffs on imported steel and
aluminum from the EU, Canada and Mexico. Trade tensions between U.S.
and China also resurfaced, outweighing initial optimism over resolution
between the countries following first round of discussion.
Movement of Commodity Prices Over 1 Year
Performance of Various Commodities
Commodities Value 1 Mth 1 Yr
Crude Brent ($/Barrel) 76.74 76.66 49.04
Gold ($/Oz) 1297.92 1314.95 1268.09
Gold (Rs/10 gm) 31026 31033 28839
Silver ($/Oz) 16.35 16.31 17.29
Silver (Rs/Kg) 39803 38777 39691
Source: Thomson Reuters Eikon,MCX
Commodity Market
17
80
110
140
170
May-17 Sep-17 Jan-18 May-18
Gold Silver Brent Crude
Co
mm
od
ity
Pric
es
(USD
)
Source: Thomson Reuters Eikon

• The mutual fund industry witnessed buying spree in equity
segment to the tune of Rs. 12,509.65 crore in May 2018
against previous month’s purchase of Rs. 11,293.46 crore.
However, the debt segment witnessed selling worth Rs.
20,080.81 crore in May against purchase of Rs. 20,164.96
crore in Apr 2018.
• In the equity space, barring banking sector, all the
segments moved down during the month. Rise in crude oil
prices, concerns over inflation level and renewed trade
tensions across the major developed countries kept
investors tensed. However, with the onset of South West
monsoon in Kerala in the second half of the month and
announcement by China that it will steeply reduce import
tariffs for automobiles provided some relief to investors.
• In the debt space, investors shifted towards liquid and
ultra-short-term categories. Bond yields rose in May 2018
following rise in global crude oil prices and more than
expected increase in domestic inflationary pressures in Apr
2018. Losses were restricted after global crude oil prices fell
to some extent at the end of the month and RBI relaxed
rules for foreign investment in government securities.
Mutual Fund Corner
18
Category wise performance of Mutual FundsEquity 6 Mnth 1 Yr 3 Yr 5 Yr
Large Cap 1.96 8.84 8.48 14.6
Small/Mid Cap -2.54 11.87 14.2 25.53
Diversified 0.3 9.85 9.82 16.65
Balanced 0.38 8.41 9.13 15.34
Banking 2.17 10.47 13.09 16.54
FMCG 4.93 18.52 15.47 15.39
Pharma -7.02 -0.18 -4.71 11.55
Technology 22.85 37.76 10.79 20.54
Infrastructure -6.71 7.39 10.07 17.84
Gold Funds 5.85 5.67 3.56 1.57
Debt 6 Mnth 1 Yr 3 Yr SI
Liquid 6.62 6.56 7.00 7.30
Ultrashort Bond 5.49 6.15 7.35 7.58
Short-T Bond 2.87 4.66 7.13 7.67
Long-T Bond 1.37 3.58 7.04 7.79
Long T Govt Sec -2.46 0.42 6.61 7.80
Short T Govt Sec 2.32 3.69 6.72 14.55
Source: MFI Explorer; * Returns less than 1 year are absolute, greater than 1 year are Compounded Annualized , # As on 31-May-2018

DisclaimerDisclaimer
All information contained herein is obtained by ICRA Online Limited (“ICRON”) from sources believed by it to be accurate andreliable. Because of the possibility of human or mechanical error as well as other factors, however, all information containedherein is provided “AS IS” without warranty of any kind. ICRON adopts all necessary measures so that the information it uses is ofsufficient quality and from sources ICRON considers to be reliable including, when appropriate, independent third-partysources. However, ICRON is not an auditor and cannot in every instance independently verify or validate information receivedin preparing this document.
All information contained herein must be construed solely as statements of opinion, and ICRA Online Limited or its affiliates orgroup companies and its respective and any of its officers, directors, personnel and employees, disclaim liability to any loss,damage of any nature, including but not limited to direct, indirect, punitive, special, exemplary, consequential, as also any lossof profit in any way arising from the use of this document or its contents in any manner or for any contingency within or beyondthe control of, ICRON or any of its directors, officers, employees, agents, representatives, licensors or suppliers, arising from or inconnection with the information contained herein or the use of or inability to use any such information. Opinions expressed inthe document are not the opinions of our holding company, ICRA Limited (ICRA), and should not be construed as any
indication of credit rating or grading of ICRA for any instruments that have been issued or are to be issued by any entity. Therecipient alone shall be fully responsible and/or are liable for any decision taken on the basis of this document and/or theinformation contained herein.
Disclaimer
19