Embed Size (px)
Citation preview

Alpha BankQ1 2020 Results
Investor Presentation
May 28, 2020

2
DisclaimerSystemic bank established in 1879
This presentation has been prepared and issued by Alpha Bank solely for informational purposes. For the purposes of this disclaimer, this presentation shall mean and include
materials, including and together with any oral commentary or presentation and any question and answer session. By attending a meeting at which the presentation is made, or
otherwise viewing or accessing the presentation, whether live or recorded, you will be deemed to have agreed to the following restrictions and acknowledged that you understand the
legal and regulatory sanctions attached to the misuse, disclosure or improper circulation of the presentation or any information contained herein. By reading this presentation, you agree
to be bound by the following limitations:
No representation or warranty, express or implied, is or will be made in relation to, and no responsibility is or will be accepted by Alpha Bank (or any member of Alpha Bank’s Group) as
to the accuracy, fairness, completeness, reliability or sufficiency of the information contained in this presentation and nothing in this presentation shall be deemed to constitute such a
representation or warranty. The information contained in this presentation may contain and/or be based on information that has been derived from publicly available sources that have
not been independently verified. Alpha Bank is not under any obligation to update, revise or supplement this presentation or any additional information or to remedy any inaccuracies in
or omissions from this presentation.
This presentation does not constitute an offer, invitation or recommendation to subscribe for or otherwise acquire securities. Also, it is not intended to be relied upon as advice to
investors or potential investors and does not take into account the objectives, financial situation or needs of any particular investor. You are solely responsible for forming own opinion
and conclusion.
Certain statements in this presentation may be deemed to be “forward-looking”. You should not place undue reliance on such forward-looking statements. By their nature, forward-
looking statements involve risk and uncertainty because they reflect current expectations and assumptions as to future events and circumstances that may not prove accurate. Forward-
looking statements are not guarantees of future performance, and the actual results, performance, achievements or industry results of Alpha Bank’s operations, results of operations,
financial position and the development of the markets and the banking industry in which it operates or is likely to operate may differ materially from those described in, or suggested by,
the forward-looking statements contained in this presentation. In addition, even if the operations, results of operations, financial position and the development of the markets and the
banking industry in which Alpha Bank operates is consistent with the forward-looking statements contained in this document, those results or developments may not be indicative of
results or developments in subsequent periods. A number of factors could cause results and developments to differ materially from those expressed or implied by the forward-looking
statements including, without limitation, general economic and business conditions, competition, changes in banking regulation and currency fluctuations.
Forward-looking statements may, and often do, differ materially from actual results. Any forward-looking statements in this document reflect Alpha Bank’s current view with respect to
future events and are subject to risks relating to future events and other risks, uncertainties and assumptions relating to Alpha Bank's financial position, operations, results of operations,
growth, strategy and expectations. Any forward-looking statement speaks only as of the date on which it is made. New factors will emerge in the future, and it is not possible for Alpha
Bank to predict which factors they will be. In addition, Alpha Bank cannot assess the impact of each factor on its business or the extent to which any factor, or combination of factors,
may cause actual results to differ materially from those described in any forward looking statements. Alpha Bank disclaims any obligation to update any forward-looking statements
contained herein, except as required pursuant to applicable law.
3
Alpha Bank
• Q1 2020 Highlights
• Macroeconomic Update
• Financial Performance Analysis
• Appendix
Asset Quality
Capital
Volumes
P&L
3
10
15
24
31
33
42
Pages

4
Q1 2020 Highlights
Covid-19
Operational
Performance
Funding &
Liquidity
• Focused on supporting our Customers, Colleagues and Communities
• Offering debt repayment deferrals, promoting usage of remote channels and contactless solutions, whilst
keeping 100% of branches operational with extra health safety measures taken
• Core operating income in Q1 2020 at €480mn up by 2% y-o-y
• Continued focus on cost initiatives with recurring Opex in Q1 2020 down by 3% y-o-y reaching €251mn
• Core PPI in Q1 2020 increased by 14% q-o-q
• Robust capital position with Total CAD ratio at 17.5%
• €2.9bn capital buffer above SREP OCR of 11.5%
• Potential further upside to capital from various further regulatory easing
Capital
• Continued improvement on liquidity profile with Group LDR at 95% as of March 2020 versus 103% a year ago
• ECB funding increased to €9.3bn in May 2020 vs. vs. €3.9bn in March, benefiting from lower cost of financing
from LTRO at -0.50%
Asset Quality
• Prudently booked €120mn Covid-19 provisions above underlying loan losses with Q1 2020 CoR reaching 2.5% or
€307mn
• Negative gross NPE organic formation in Greece in Q1 2020 across all segments
• Galaxy process underway, with signing targeted for Q4 2020
• €1.6bn new disbursements in Q1 20, including usage of previously undrawn commitments of €0.7bn
• Deposit balances in Greece increased by €1.6bn, as a result of inflows from both businesses & individuals
Commercial
Activity

5
Committed to support our Customers, Employees and the Society
Active support to our Customers Care for our Employees
Ongoing Communication of Bank’s
response to the pandemic
▪ Weekly updates on guidelines and policies
Full operational readiness and remote
working capability during lockdown
100% of branches operational
90% of central functions working remotely
50% of branch employees on premises, on a
rotation basis
Increased medical care
Open line of communication with the Bank’s
physicians
Direct online access to medical advice
through MyAXAdoctor
For individuals, debt payment deferrals, via a fully
automated online process
For businesses, debt payment deferrals, extension
of revolving credit lines maturity, emergency working
capital
Increased limit of contactless card transactions
from €25 to €50, increasing these transactions to
75% from 50% previously
First Greek Bank to launch Apple Pay with
activations reaching 20,000 within 1 month
Usage of remote channels to facilitate customer
transactions
90,000 new e-banking users, double vs.
previous 2 months
Commitment to Society
Supporting the National Health System by
covering the needs for medical and healthcare
supplies at Intensive Care Units in three
COVID-19 referral hospitals across Greece
(Athens, Thessaloniki and Larissa) with
advanced technology medical equipment as
well as protective equipment.
Supporting 6th Medical District (Peloponnese,
Western Greece, Ionian Islands) with
thousands of medical masks for doctors and
the nursing personnel
Cooperation with Medecins du Monde Greece
to help isolated vulnerable people over the age
of 60, providing home delivery of medicine
as well as medical advise and support

6
Offering payment deferrals to our Clients – easing of current financial position
• Individuals: Instalment deferral until 30th September 2020
• Small Business Loans: Instalment deferral until 30th September
2020 as well as extension of revolving credit lines’ maturity for six
months, up to 31st of December 2020
• SMEs and larger businesses: Capital payment deferral until 30th
September 2020 (and interest payments in specific product types).
In addition, extension of term loans’ maturity up to 9 months where
needed as well as extension of revolving credit lines’ maturity
(short-term funding lines with up 12 months maturity) after 1st of
January 2021.
• €0.4bn Covid-19 implementations in Cyprus
• €0.4bn Covid-19 implementations in Romania
Wholesale
1.8
0.6
Mortgage
0.4
0.9
Consumer SBL
3.7
Total
3.7
Implementations on PEs - per segment
Euro bn
26% 18% 42% 7% 15%
% out of
total PEs
(Greece)
Implementations on PEs - weekly evolution
Euro bn69.2k
# accounts
Note: Bank level
0.2
0.5
0.8 0.80.7
0.3 0.3
17.4-24.430.3-3.4 3.4-10.4 24.4-1.510.4-17.4 8.5-15.51.5-8.5

7
Providing Credit to Customers – Leading participation in State sponsored financing programmes
Loans to SMEs
Entrepreneurship Fund II
"Business Funding”
New loan disbursements
€1.6bn of new loan disbursements within Q1
2020, o/w use of untapped credit lines €0.7bn
96% to business, 4% to individuals
Business disbursements primarily towards sectors
that drive the economy such as manufacturing,
trade, transportation and tourism
State Guaranteed Loans
c.€2bn guarantees to cover up to 80% of
individual loans and up to 40% for SMEs, 30% for
Large Corporates on a portfolio basis
Duration: a. guarantees: 72 months; b. working
capital loans/Bullet loans: up to 60 months; c. grace
period: 12 months
Criteria: Up to 10% x Maximum Portfolio Volume,
resulting (the highest)
2 times annual payroll expenses, or
25% of firms 2019 turnover
Criteria will include, Business Plan proving 12-18
months needs, specific levels for ratios like net debt
to EBITDA, debt-to-equity, etc
Total system financing: circa €7bn
Loans to SMEs, Large Corporate & Self-
employed (mostly working capital)
Loans to Individuals and businesses
1.0
0.8
Q4 19
0.6
Q1 19 Q2 19
0.90.9
Q3 19
1.6
Q1 20
2.0
YTD
0.6
0.9 1.0
1.6
2.1Individuals Businesses
Financing 40% by State and 60% by the Bank
Interest subsidized by State for the first
2 years and reduced by 40% for remaining
3 years
Total available system program: €1.6bn

8
Q4 2020
Significant progress has been made on Project Galaxy to date, with transaction signing now targeted for Q4 2020
Bank active on significant workstreams of Project Galaxy, including the issuance of the securitizations’ notes, the rating process on
retail portfolios, the preparation for the launch of the hive-down and the acquisition of Cepal ahead of the Servicer sale
Completion
of Galaxy
Securitization
30/04
Hive-Down
Targeted Launch1
Galaxy
signing1
Galaxy
closing1
Q2 2020
Rating
progress in
advanced
status
Cepal fully
owned
subsidiary
1 Subject to applicable Corporate approvals
Hive-Down
Completion1
Application
for HAPS

9
Galaxy involves a highly modular set of assets, allowing for transaction flexibility and calibration within a comfortable capital envelope
Galaxy Wholesale
(HAPS)
Galaxy Retail
(HAPS)
Unitranche Leasing
New Cepal
Unitranche Unsecured
Retail
Galaxy perimeter highly modular
Priority Assets/Portfolios
New Cepal Prioritize the sale of New Cepal which offers a solid
investment opportunity
Market leader in terms of size
Operating model with stable cashflows
Renewed interest for servicing capacity in the region
Retail portfolios
(HAPS)
Advance with sale process for Retail Secured Portfolios
(SPV I €1.9bn1, SPV II €5.7bn1) that offer access to a granular
asset class with higher collateral visibility and are thus more
resilient in the current market environment.
Wholesale
portfolio (HAPS)
Progress work on the rating of the wholesale portfolio (SPV
IV €3bn1) to capitalize on growing signs of market
normalization and investor appetite.
Capital envelope Calibrate the capital impact on the back of increased
perimeter coverage built up during previous quarters, with
potential upside from Covid-19 government measures to
support housing loans.
Clear flexibilities in transaction structuring
1 GBV as of cut off date
A
B
C
A B C
D E
c. €7.6 bn c. €3 bn

10
Alpha Bank
• Q1 2020 Highlights
• Macroeconomic Update
• Financial Performance Analysis
• Appendix
Asset Quality
Capital
Volumes
P&L
Pages
3
10
15
24
31
33
42

11
The Way Forward after Flattening the Covid-19 Curve
Re-opening the economy by sector of activities Number of new cases decreasing
Greece has been less affected than other
countries
5 day average
26/2. First Confirmed
Case
10/3. Educational institutions close
13/3. Cafes, restaurants, bars, sport's venues, malls close
16/3. All shops close, religious functions suspended
23/3. Ban of non-essential transport across the country
4/5. Start of relaxation of measures; Re- opening of hair salons, beauty shops and religious places
11/5. Re-opening of retail shops
(except malls),driving schools, gambling agencies; restart of 3rd grade
(high school)
18/5. Secondary education classes restart; Malls, museums and zoos re-open
25/5. Re-opening of cafes, restaurants and bars
1/6. Re-opeing of Hotels (12-months operation); Primary education
15/6. Re-opening of seasonal hotels; Lift of travel restrictions towards the Airport "El. Venizelos"
1/7. Lift of travel
restrictions towards the
rest airports
15/7. Gradual easing of the
remaining
travel restricti
ons
0
10
20
30
40
50
60
70
80
90
100
0
500
1000
1500
2000
2500
3000
25/2
/20
20
27/2
/20
20
29/2
/20
20
2/3
/20
20
6/3
/20
20
8/3
/20
20
10/3
/20
20
12/3
/20
20
14/3
/20
20
16/3
/20
20
18/3
/20
20
20/3
/20
20
22/3
/20
20
24/3
/20
20
26/3
/20
20
28/3
/20
20
30/3
/20
20
1/4
/20
20
3/4
/20
20
5/4
/20
20
7/4
/20
20
9/4
/20
20
11/4
/20
20
13/4
/20
20
15/4
/20
20
17/4
/20
20
19/4
/20
20
21/4
/20
20
23/4
/20
20
25/4
/20
20
27/4
/20
20
29/4
/20
20
1/5
/20
20
3/5
/20
20
5/5
/20
20
7/5
/20
20
9/5
/20
20
11/5
/20
20
13/5
/20
20
15/5
/20
20
17/5
/20
20
19/5
/20
20
21/5
/20
20
23/5
/20
20
25/5
/20
20
27/5
/20
20
29/5
/20
20
31/5
/20
20 …
15/6
/20
20 … … …
15/7
/20
20
Cumulative confirmedcases
Stringency index, rhs
Phase 1: Lockdown Tightening Phase 2: Lockdown Easing
Source: Oxford COVID-19 Government Response Tracker (OxCGRT), "Coronavirus Pandemic (COVID-19)“, published online at OurWorldInData.org.
0
20
40
60
80
100
as of 25 May 2020.
0
1000
2000
3000
4000
5000
6000
Total cases (per mn) Total deaths (per mn)
Spain UK Italy Portugal Germany Greece

12
The Economic Impact of the Pandemic in an Almost Covid-free Country
Uncertainty surrounds the size of the downturn in 2020
and the strength of the recovery in 2021…
Recessionary shock not expected to cause
unemployment to deviate from downward trend
Alternative growth scenarios for the Greek Economy vary with respect to
the size of the downturn in the current year, and the strength of the recovery
in 2021.
Increased uncertainty is already reflected in recent European-wide soft data
releases; Greece exhibits a smaller drop in economic sentiment since the
outbreak of Covid19 compared to the Euro area average, reflecting the
success of front-loaded containment measures which flattened the epidemic
curve, as well as, fiscal policy interventions.
The projected increase in unemployment in 2020 is mainly associated with
the rise in seasonal unemployment; contrary to other European countries, the
unemployment rate is expected to decline cumulatively by 0.5 pps over
2020-2021.
Source: European Commission, ELSTAT, Ministry of Finance Stability Programme 2020, European Commission Economic Forecasts Spring 2020, IMF WEO April 2020
…which is already reflected in recent European-wide soft
data releases
1.9
-9.7
7.9
-4.7
5.1
-10-12-10-8-6-4-202468
2012 2013 2014 2015 2016 2017 2018 2019 2020f 2021fEC, Spring Forecasts (May 2020) MoF(April 2020) IMF WEO (April 2020)
Real GDP growth (%)
2.9
2.2 2.0
1.2 1.2 1.20.9 0.7 0.7
0.4 0.4 0.3
-0.5-1
0
1
2
3
4
Projected cumulative change in unemployment in p.p, 2019-2021
60
70
80
90
100
110
120
ESI-Euro area ESI-Greece Long-term average

13
Ending Lockdowns while Stimulating the Economy
The broad-based fiscal response supports aggregate
demand(Stability Programme 2020)
Sources: Ministry of Finance, Stability Programme 2020, European Commission, Ergani Information System, IMF Policy Tracker
How to pay for seasonal unemployment
90.6
-82.8
92.1
-98.4
108.7
-120.1
105.3
-125.7
7.2
90
95
100
105
110
115
-150
-100
-50
0
50
100
150
Jan-16 Nov-16 Sep-17 Jul-18 May-19 Mar-20
Tourist seasonEmployment Flows Balance (New Hirings-Dismissals, '000 contracts)Εmployment Expectations Indicator (3m mov. avg, rhs)
18%
13%11% 11%
5%
France Greece Cyprus Spain Romania
Sizeable government stimulus package Government support as % of GDP
After the new Government measures
(May 2020), with additional EU funding,
the total stimulus package will reach 24
bn (13% of 2019 GDP)
0.0 0.2 0.4 0.6 0.8 1.0 1.2 1.4
Hellenic Development Bank Guarantees
Special allowances to the private sector
Business financing (refundable advancedpayment)
SSC and Easter bonus coverage
Interest payment of performing loans forSMEs
Healthcare expenditures
Unemployment benefits
Easter bonus of public servants workingin hospitals etc
Support of the primary sector of theeconomy
Special purpose leave
Other
Suspension of tax obligations
Suspension of payment of SSC
Discount of taxes and other obligations
Expenditure
Revenue losses
(% GDP 2020)
Guarantees

14
Developments in Oil Prices Support the Trade Balance while Tourism Restarts
Distribution of tourism revenues in Greece (2019)
Source: Bank of Greece, European Commission Economic Forecasts Spring 2020
4%
26%
59%
11%
Q1 Q2 Q3 Q4
Early end of lockdown and plans to reopen hotel industry in June.
Government’s fast response to Covid-19 has allowed Greece to contain the
spread of infection in a timely manner.
To encourage tourism, Greece announced a comprehensive package
supporting businesses in the tourism sector with a wide range of measures
including the reduction of VAT, reduced lease payments, support for seasonal
employees, income tax relief.
-0.9
-2.3
-24
-18
-12
-6
0
6
12
2007 2008 2009 2010 2011 2012 2013 2014 2015 2016 2017 2018 2019 2020f2021f
(% G
DP
)
Oil Balance Goods Balance (excluding oil)
Services Balance Primary Income Balance
Secondary Income Balance Current Account
No shocks expected in Current Account: Declining oil price
cushions the impact of Covid-19
Deflationary pressures are expected throughout the current year,
reflecting the lower energy prices and subdued aggregate demand.
Being a net oil importer with a relatively high energy dependency ratio,
Greece is expected to benefit from lower oil prices.

15
Alpha Bank
• Q1 2020 Highlights
• Macroeconomic Update
• Financial Performance Analysis
• Appendix
Asset Quality
Capital
Volumes
P&L
Pages
3
10
15
24
31
33
42

16
Overview of Q1 20 Financial Performance
210.8229.6
(7.2 )
19.0
(0.7)
7.8
Core PPI increase by 9% yoy
Q1 20
Core PPI
Δ Other
Income
Δ ΝΙΙ Δ OPEXQ1 19
Core PPI
Δ Fees
Underlying CoR down to 1.5%; CoR 2.5%
including Covid19 impact
1.9% 1.9%
2.1% 2.0%
1.5%
1.0%
2.5%
Q1 19 Q2 19 Q3 19 Q4 19 Q1 20
Group Q4 2019 Q1 2020
NPE ratio 44.8% 43.5%
NPE Cash Coverage 43.8% 44.1%
NPE formation (Greece) (€0.5bn) (€0.4bn)
Continued negative NPE formation - further
NPE ratio decline
Continued improvement of liquidity metrics
Group, €bn Dec-19 Mar-20 May-20
LDR 97% 95% 98%
LCR 84% 91% 92%
ECB funding 3.1 3.9 9.3
Repos 6.3 6.5 3.4
Cash & CB 2.0 3.7 4.2
Deposits 40.4 41.9 40.6
o/w state deposits 0.9 1.5 0
Underlying CoR Covid19-related
€2.9bn total capital buffer, CET1 almost
10p.p. above regulatory minimum1
6.7%
16.5%4.8%
1.0% 11.5%
17.5%
Requirement Q1 20
CET1 AT1 & Tier 2
1 Assuming fully filling AT1 and Tier 2 buckets
Continued growth of deposits and
performing loans
40.4 41.9
Q4 19 Q1 20
Customer deposits Performing loans
26.9 27.7
Q4 19 Q1 20
o/w €6.2bn
in LTRO
@ -0.50%
EUR mn
Group, EUR bn

17
Q1 2020 Group P&L and Balance Sheet
Profit & Loss (EUR mn)Q1
2020
Q1
2019
yoy %
change
Q1
2020
Q4
2019
qoq %
change
Net Interest Income (NII) 381 388 (1.8%) 381 387 (1.5%)
Net fee and commission Income 89 70 27.0% 89 93 (4.2%)
Trading & Other Income2 96 75 28.0% 96 127 (24.8%)
Operating Income 566 533 6.1% 566 607 (6.8%)
Total Operating Expenses1 (259) (262) (1.1%) (259) (351) (26.2%)
Recurring Operating Expenses1 (251) (258) (3.0%) (251) (284) (11.8%)
Core Pre Provision Income 230 211 8.9% 230 202 13.6%
Pre Provision Income (PPI) 307 271 13.2% 307 256 19.8%
Impairment Losses on Loans (307) (243) 26.7% (307) (245) 25.6%
Other Impairment Losses (9) 22 … (9) (6) …
Profit/ (Loss) before income tax (PBT) (9) 51 … (9) 5 …
Income Tax (1) (24) … (1) 0 …
Profit/ (Loss) after income tax (11) 27 … (11) 6 …
Net Interest Margin (NIM%) 2.34% 2.53% 2.34% 2.45%
Cost to Income ratio (Recurring) 52.2% 55.1% 52.2% 58.4%
Balance Sheet (EUR bn) 31/03/2020 31/12/2019
qoq
change
(EUR bn)
Assets 66.6 63.5 3.2
Securities 9.1 8.7 0.4
Cash & CB 3.7 2.0 1.7
Net Loans 39.8 39.3 0.5
Deposits 41.9 40.4 1.5
Tangible Equity (TE) 7.7 7.9 -0.2
Common Equity Tier 1 Ratio
(CET1 %)16.5% 17.9% …
Capital Adequacy Ratio (CAD %) 17.5% 17.9% …
NPE ratio 43.5% 44.8% …
NPE Cash Coverage 44.1% 43.8% …
NPL ratio 30.0% 30.1% …
NPL Cash Coverage 64% 65% …
• Continued reduction of NPE ratio in Q1 2020
• Q1 20 Profit After Tax impacted by €120mn Covid-19 provisions
1 2019 comparative figures have been restated due to reclassification of Extraordinary cost items to Recurring Staff Costs
2 Other income Includes a goodwill impairment of Euro 9.7 million for Q1 2019 of an associated company acquisition, not included in Core Operating Income

18
Net Interest Income lower by €6mn in Q1 2020 mostly due to calendar effect
NII qoq evolutionEUR mn In Q1 2020, Net Interest Income declined by 1.5% q-o-q to Euro
381.2 million mainly affected by lower contribution from loans and
calendar effect
NII benefited by deposits contribution on term deposits repricing,
partly counterbalanced by increased volumes
3% q-o-q growth of performing loans in Q1 20 following €1.6bn
new loan disbursements provides possible upside to NII going forward
Additional upside from replacement of repos with TLTRO going
forward
Funding cost ratesbps
8070
4324 11
59 56
5244
35
-31 -32
-40 -40 -41-40 -37
-33 -33 -40
Q1 19 Q2 19 Q3 19 Q4 19 Q1 20
Average ReposCost
Time Depositsrates
Average 3MEuribor
Average ECBCost
1 Time deposits rates refer to euro-denominated deposits
1
2.5 1.5
LoansNII
Q4 19
Funding
(4.4)
Deposits
(1.4)
Bonds
& Other
(4.2)
387.1
Days
effect
NII
Q1 20
381.2
(€6mn)
Net loans (avg. balances)EUR mn
Q4 19 Q1 20
40,144 39,959
(€185mn)
402 400
Q4 19 Q1 20
Loans spreadbps
(€2bps)

19
Net Fee and Commission income was higher by 27% yoy
Net Fee & Commission Income evolution yoyEUR mn
+€19mn
Net Fee & Commission Income evolution qoqEUR mn
3 26 1
5 2
Cards IB &
Brokerage
56
70
89
67
2
Q1 19
4
Bancassurance
& Private
Banking
Asset
Mgmt
Other
Commercial
Banking
Loans
12
Q1 20
17
18
93
73
Q1 20Q4 19
Commercial
Banking
Asset Gathering
& Bancassurance
IB & Brokerage4
89
67
3
(€4mn)
Net fee & Commission income increased by €19mn yoy with growth in
Commercial Banking, Asset Gathering & Bancassurance and IB & Brokerage
Going forward, transaction fees will be significantly affected by the Covid-19 crisis,
also on contained tourist arrivals, partly counterbalanced by lending fees
Commercial BankingAsset Gathering
& Bancassurance IB & Brokerage
Partially due to
seasonality
18
Net fee and commission income amounted to Euro 89.2 million in
Q1 2020, down 4.2% q-o-q or Euro 3.9 million, due to seasonally
driven lower revenues from cards and the base effect of higher
revenues from bond and syndicated loans’ issuance in Q4 2019,
which more than offset the increased contribution from asset
management

20
Recurring Operating Expenses reduced by -3.0% yoy
Recurring OPEX evolution qoqEUR mn
Recurring operating expenses for the Group continued to decline, down by 3% y-o-y or €8mn to
€251mn, primarily as a result of lower Staff Costs due to headcount reduction
In Greece, Recurring Operating Expenses declined by 6.2% y-o-y to €198.5mn
Cost savings actively targeted linked with Covid-19 and lockdown, postponement of discretionary
spending, projects reprioritization and lower transaction volumes
Recurring OPEX evolution yoyEUR mn
109 106
114
2
107
35 38
Staff costs
Q1 19 General
expenses
Staff
costs
(7)(3)
D&A
General
expenses
Q1 20
Depreciation
& amortization
258 251
(€8mn) (€34mn)
130106
117107
37
38
Staff costsQ4 19
(24) (10)
General
expenses
0
D&A Q1 20
284
251
212 199
Abroad47
Q1 19
52
Q1 20
Greece
258 251
Staff costs amounted to €107mn, down by €10mn, as a
result of the Voluntary Separation Scheme (VSS)
implemented in our operations in Greece during 2019
General Expenses came lower in Q1 2020 by €24mn mainly
reflecting lower NPL remedial management and third party
fees and marketing expenses
Partially due to
seasonality
Depreciation
& amortization
General
expenses
Staff costs

21
Significant PPI generation provides strong buffer against potentially increased credit losses in 2020
211 213 220 202
230
Q1 19 Q2 19 Q3 19 Q4 19 Q1 20
Core PPIEUR mn
Core PPI supported by resilient NII on the back of higher
volumes of business disbursements and lower retail and
wholesale financing rates, as well as incremental cost savings
-258 -267 -265 -284-251
388 389 383 387 381
70 81 96 93 8911 11 6 6 10
Recurring OPEX NII Fees Other Income
Core PPI driversEUR mn
Core
Operating
Income
Recurring
OPEX
469 481480
Q1 19 Q4 19 Q1 20
485 486
Q2 19 Q3 19
Core PPI
2019 avg.
€212mn
Trading
gains74 124 80 121 86
NII
2019 avg.
€387mn
Rec. Opex
2019 avg.
€269mn
1 Other income Includes a goodwill impairment of Euro 9.7 million for Q1 2019 of an associated company acquisition, not included in Core Operating Income
1

22
Group Impairment impacted by Covid-19 provisions in Q1 2020
Q1 20 Group impairments
€120mn additional Covid-19 related provisions above underlying loan
losses as a result of change in IFRS9 macro scenarios
Covid-19 provisions led to 98bps increase in the cost of risk vs. the
underlying cost of risk
Total Q1 20 loan loss provisions reached €307mn
Several scenarios of different shapes of the shock used in Q1 impairment.
A v-shape as basic, providing for a cumulative change in GDP between
2020-2021 of -1.1%
Risks to GDP assumptions are skewed to downside by employing an
L-shaped adverse scenario
Macroeconomic forecasts by third parties
Broadly similar shape of the shock amongst forecasts provided by Bank of
Greece, Ministry of Finance and European Commission
Cumulative delta in 2020-2021 GDP ranges between -1.8% to +0.4%
39%
61%
COVID-19 related impairments
Underlying impairments
Cumulative 2020-2021 GDP growth (%)
(0.5%)
0.4%
(1.8%)
Bank of Greece Ministry of Finance EuropeanCommission
€120mn
€187mn
EUR mn
Q1 20
CoR
2.5%
Q4 19
CoR
2.0%1.0%
1.5%

23
CAD ratio at 17.5% mainly impacted by IFRS 9 phasing and the movement in FVOCI portfolio
CAD ratio evolution
IFRS 9 & B3
amortisation
and other DTA
(2bps)
CAD
Dec-19
FVOCI
(77bps)
Period Loss
17.5%
(53bps)
CAD
Mar-20
(12bps)
Increase of
RWA & Other
Tier 2
104bps
FLB3 CAD
Mar-20
17.9%
15.1%
8,354
EUR mn
CET1
€7,840mn
16.5%
7,0818,510
11.5%
SREP 2020
Min. OCR
€2.9bn
Buffer
• Reduced capital requirements due to suspension of capital
conservation buffer and on CRD5 changes on P2R composition
• Successful Euro 500 million Tier 2 issuance in February 2020
at 4.25%
The new CRR provide room for potential upside to capital ratio via:
Non-deduction of software intangibles
SME supporting factor benefit
Infrastructure supporting factor
S1 and S2 Recouping provisions
Lower risk weightings for certain loans backed by pensions or
salaries
+ c.90bps

24
Alpha Bank
• Q1 2020 Highlights
• Macroeconomic Update
• Financial Performance Analysis
• Appendix
Asset Quality
Capital
Volumes
P&L
Pages
3
10
15
24
31
33
42

25
Split of performing loan book by Covid-19 impact
Performing exposures (Greece)
22.4
31.03.20
Sectors to be affected
significantly31%
30%
Sectors
with low or no impact39%
Sectors to be affected
modestly
Sectors to be more affected
▪ Hospitality
▪ Transportation
▪ Construction
▪ Wholesale Trade
▪ Retail Trade (excl. supermarkets)
Sectors to be modestly affected
▪ Real Estate
▪ Energy
▪ Agri-business
▪ Industry
▪ Consumer loans
Sectors with low or no impact
▪ Healthcare & Pharmaceuticals
▪ IT services & telecoms
▪ Supermarkets
▪ Mortgages
EUR bn
▪ Significant government support measures for the most affected industries
▪ 18% of exposures in the most affected industries currently under payment
moratoria
▪ €1.6bn in Hospitality, with top 10 exposures covering 26% of portfolio
▪ >80% of clients rated acceptable or better, with good leverage ratios
▪ Main exposure is in resort hotels
▪ €1.7bn in Wholesale Trade, a widely spread portfolio with >1,100 business
customers
Note: Bank level 1 Shipping portfolio is apportioned by 70% to sectors to be affected significantly and 30% to sectors with low or no impact (mainly related to tankers)
A highly diversified performing loan book
Energy
5%
Wholesale Trade
7%
Hospitality
7%
Shipping
8%
Mortgages
32%
Food Sector & Agri-business
5%
Industry
4%
Consumers
9%
Construction
4%
Real Estate
3%
Transportation & Logistic Services
3%
Other
12%
€22.4bn
1

26
Negative gross organic formation in Greece
Note: Gross formation including curings, repayments, liquidations and debt forgiveness
NPE reduction - GreeceEUR bn
Negative gross formation in Greece
Gross NPE
formation(0.06) (0.38) (0.26) (0.49)
EUR bn
Entries
Exits
Dec-17Dec-16 Dec-18 Dec-19 Mar-20
27.7
25.0
21.9
18.8 18.4
(€0.4bn)
0.680.48
0.600.49 0.47
(0.74)(0.86) (0.86)
(0.97)(0.85)
Q3 19Q2 19Q1 19 Q4 19 Q1 20
(0.38)

27
Negative gross organic NPE formation in Greece across segments
Note: Gross formation including curings, repayments, liquidations and debt forgiveness
Gross formation (Organic) - WholesaleEUR mn
60
(189)
(51) (11) (40)
Q1 19 Q2 19 Q3 19 Q4 19 Q1 20
Gross formation (Organic) - SBLEUR mn
Gross formation (Organic) - RetailEUR mn
(117)(193) (208)
(476)
(339)
Q1 19 Q2 19 Q3 19 Q4 19 Q1 20
(88) (81) (104)
(223)(132)
Q1 19 Q2 19 Q3 19 Q4 19 Q1 20
Gross formation (Organic) - MortgagesEUR mn
(63) (102) (70)(139) (141)
Q1 19 Q2 19 Q3 19 Q4 19 Q1 20
Gross formation (Organic) - ConsumerEUR mn
33
(11) (34)(114)
(67)
Q1 19 Q2 19 Q3 19 Q4 19 Q1 20
28
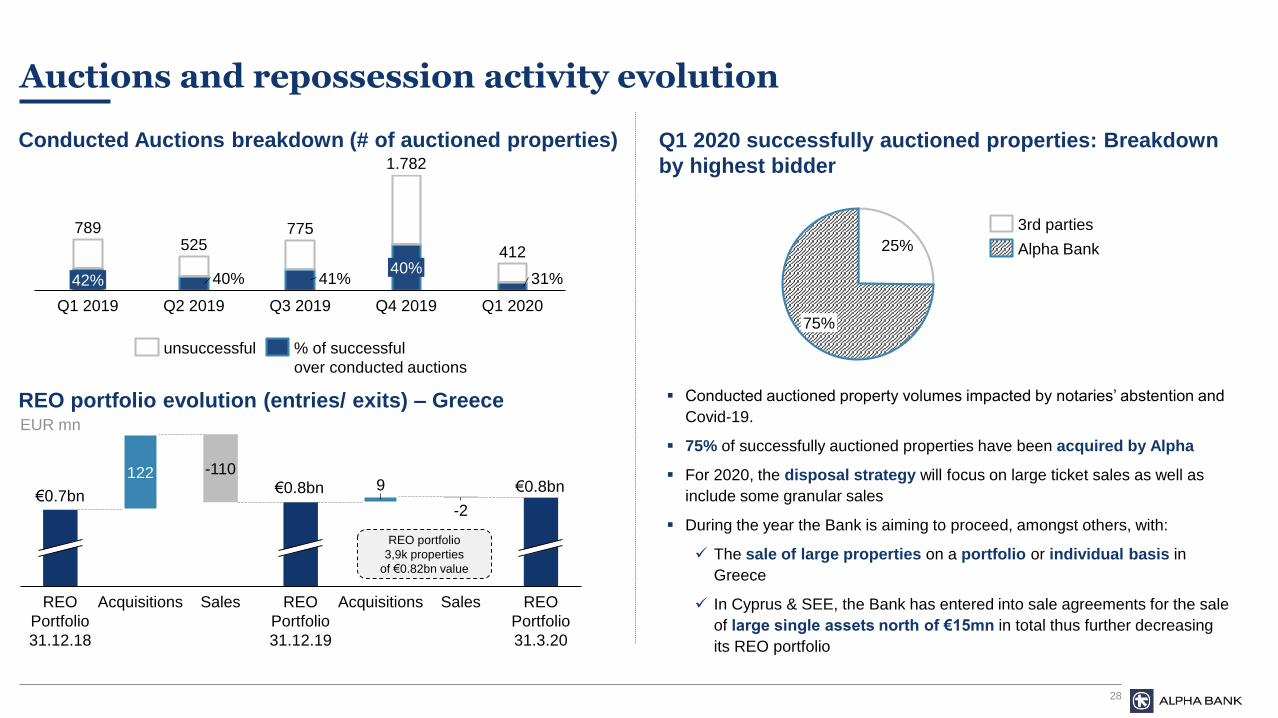
Auctions and repossession activity evolution
Conducted Auctions breakdown (# of auctioned properties) Q1 2020 successfully auctioned properties: Breakdown
by highest bidder
REO portfolio evolution (entries/ exits) – GreeceEUR mn
REO
Portfolio
31.3.20
Acquisitions
9
REO
Portfolio
31.12.18
122
Acquisitions
-110
Sales REO
Portfolio
31.12.19
-2
Sales
€0.7bn€0.8bn €0.8bn
25%
75%
3rd parties
Alpha Bank
Conducted auctioned property volumes impacted by notaries’ abstention and
Covid-19.
75% of successfully auctioned properties have been acquired by Alpha
For 2020, the disposal strategy will focus on large ticket sales as well as
include some granular sales
During the year the Bank is aiming to proceed, amongst others, with:
The sale of large properties on a portfolio or individual basis in
Greece
In Cyprus & SEE, the Bank has entered into sale agreements for the sale
of large single assets north of €15mn in total thus further decreasing
its REO portfolio
REO portfolio
3,9k properties
of €0.82bn value
40%42%40%
Q1 2019 Q1 2020Q2 2019
41%
Q4 2019Q3 2019
31%
789525
775
1.782
412
unsuccessful % of successful
over conducted auctions

29
Detailed overview of Alpha Bank’s asset quality by portfolio – Greece
(€ bn) Wholesale SBL Mortgages Consumer Total
Gross loans 18.4 4.7 14.1 5.0 42.2
(-) Accumulated Provisions (2.7) (1.6) (1.9) (1.7) (7.8)
Net loans 15.7 3.2 12.2 3.3 34.4
NPLs 2.7 2.8 4.9 1.9 12.3
NPL ratio 14.7% 59.1% 34.4% 38.6% 29.1%
NPEs 5.1 3.4 7.0 2.9 18.4
NPE ratio 27.8% 72.0% 49.7% 58.2% 43.7%
NPL collateral 1.5 1.2 3.5 0.5 6.7
NPE collateral 3.1 1.6 5.3 0.6 10.6
Coverage ratio
NPLs 2.7 2.8 4.9 1.9 12.3
(+) Forborne NPLs < 90 dpds 2.1 0.6 2.1 1.0 5.8
(+) Unlikely to pay 0.3 0.0 0.0 0.0 0.4
NPEs 5.1 3.4 7.0 2.9 18.4
Forborne NPLs >90dpd 1.1 0.8 2.2 1.4 5.5
Forborne NPLs <90dpd 2.1 0.6 2.1 1.0 5.8
Performing forborne 0.5 0.7 2.4 0.4 4.0
Total forborne 3.7 2.1 6.7 2.8 15.3
100%
53% 56% 46% 39% 27%
88% 58% 64% 42%
56%
61% 45% 47% 72% 75%
25%
22% 55%
58%
156%
114% 100% 93%
111% 102% 112%
80%
118% 100%
NPL NPE NPL NPE NPL NPE NPL NPE NPL NPE
Collateral
Cash

30
Detailed overview of Alpha Bank’s asset quality by portfolio – Group
(€ bn) Wholesale SBL Mortgages Consumer Total
Gross loans 21.5 4.8 17.3 5.5 49.1
(-) Accumulated Provisions (3.3) (1.6) (2.7) (1.8) (9.4)
Net loans 18.1 3.2 14.6 3.7 39.7
NPLs 3.6 2.8 6.2 2.1 14.7
NPL ratio 16.6% 59.1% 35.9% 38.4% 30.0%
NPEs 6.3 3.4 8.5 3.1 21.4
NPE ratio 29.3% 71.9% 49.1% 56.6% 43.5%
NPL collateral 2.0 1.3 4.0 0.5 7.8
NPE collateral 3.8 1.6 5.9 0.7 12.0
Coverage ratio
NPLs 3.6 2.8 6.2 2.1 14.7
(+) Forborne NPLs < 90 dpds 2.4 0.6 2.2 1.0 6.2
(+) Unlikely to pay 0.3 0.0 0.0 0.0 0.4
NPEs 6.3 3.4 8.5 3.1 21.4
Forborne NPLs >90dpd 1.4 0.8 3.0 1.5 6.6
Forborne NPLs <90dpd 2.4 0.6 2.2 1.0 6.2
Performing forborne 0.5 0.7 2.5 0.5 4.2
Total forborne 4.3 2.1 7.8 2.9 17.0
94% 53% 56% 46% 43% 32%
86% 58% 64% 44%
55%
60% 45% 47% 65% 70%
26%
23% 53%
56%
148%
113% 100% 93%
108% 101% 111%
81%
117% 100%
NPL NPE NPL NPE NPL NPE NPL NPE NPL NPE
Collateral
Cash

31
Alpha Bank
• Q1 2020 Highlights
• Macroeconomic Update
• Financial Performance Analysis
• Appendix
Asset Quality
Capital
Volumes
P&L
Pages
3
10
15
24
31
33
42

32
Group RWAs and Regulatory Capital – March 2020
Group Risk Weighted AssetsEUR bn
(€0.1bn)
0.3
3.6 3.6
1.5
Credit
42.4
Dec-19 Market
42.7
1.3
Mar-20
47.5
(0.2)
47.6
Credit OperationalMarket
EUR mn
8,2367,714 7,840 7,843
8,354
(522)(905)
1,031 3 511
OrdinaryEquity
Intangibles Tangiblebookvalue
DTADeductionfrom CET1
IFRS9& Other
CET1capital
Hybrids Tier 1 LowerTier II
TotalCAD
11.7% Tangible book value / Tangible Assets
Equity to regulatory capital bridge
Credit Risk Weights per portfolio
66%
104%79%
Performing Net NPE Total Loan PortfolioRWA Density
DTA & Tax Credit with CET1 CapitalEUR bn
Mar-20
(phased-in)
0.9
3.1
0.3
3.1
0.8
Mar-20
(fully loaded)
4.43.9
DTA 250%
RWf
DTC 100%
RWf
CET1 7.8 6.6
DTC
IFRS9
Other DTA
IFRS 9/B3 DTA amortisation
Amortisation (€mn) 2020 2021 2022 2023 2024
IFRS 9 -239 -319 -398 -398
DTA Basel 3 -39 -39 -39 -39 -39

33
Alpha Bank
• Q1 2020 Highlights
• Macroeconomic Update
• Financial Performance Analysis
• Appendix
Asset Quality
Capital
Volumes
P&L
Pages
3
10
15
24
31
33
42
34
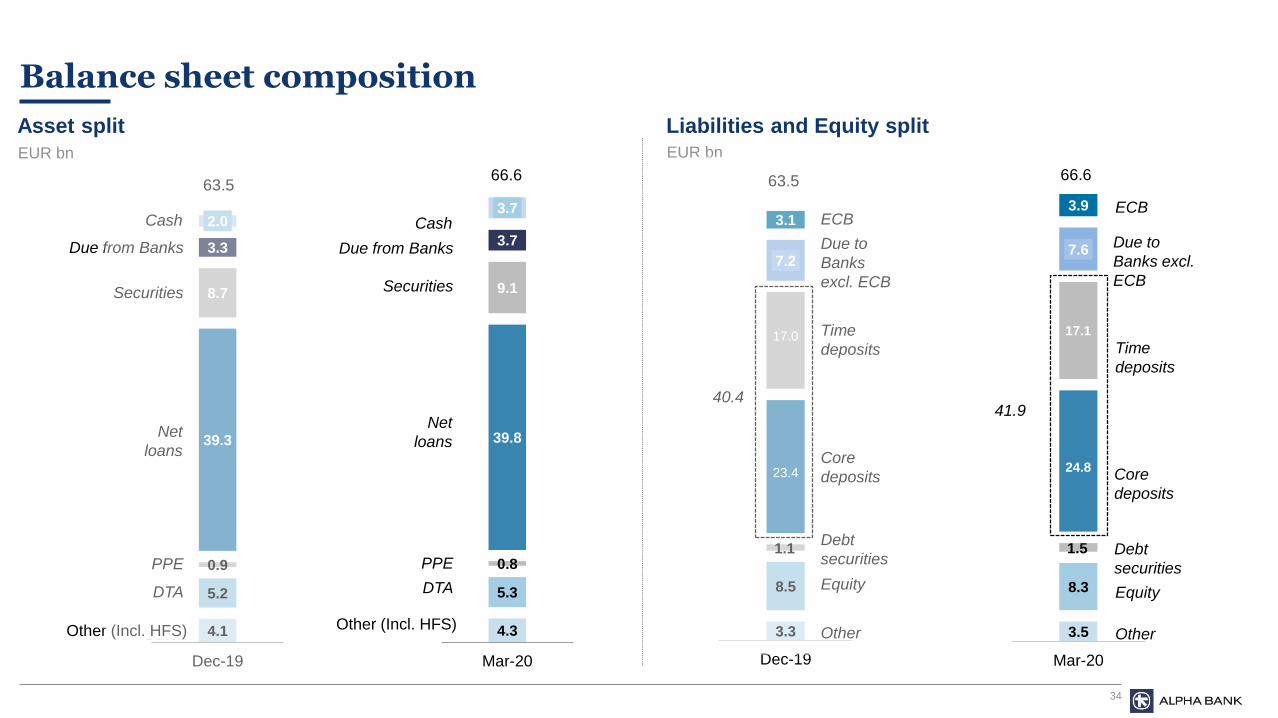
Balance sheet composition
4.1
5.2
0.9
39.3
8.7
3.3
2.0
Dec-19
4.3
5.3
0.8
39.8
9.1
3.7
3.7
Mar-20
Asset split
EUR bn
Liabilities and Equity splitEUR bn
66.6
Net
loans
PPE
DTA
Other
Securities
Cash
Due from Banks
63.5
Other (Incl. HFS)3.5
8.3
1.5
7.6
3.9
Mar-20
3.3
8.5
1.1
7.2
3.1
Dec-19
Due to
Banks excl.
ECB
40.441.9
ECB
Time
deposits
Core
deposits
Debt
securities
Equity
Other
Due to
Banks
excl. ECB
ECB
Time
deposits
Core
deposits
Debt
securities
Equity
Other
63.5 66.6
Net
loans
PPE
DTA
Other
Securities
Cash
Due from Banks
Other (Incl. HFS)
17.1
24.8
17.0
23.4

35
Business Volumes
(€ mn) Mar 2020 Dec 2019 Sep 2019 Jun 2019 Mar 2019% Mar 2020/
Mar 2019
Group Gross Loans 49,095 48,731 49,147 51,330 51,836 (5.3%)
Mortgages 17,294 17,474 17,709 18,052 18,311 (5.6%)
Consumer Loans 4,218 4,258 4,327 4,402 4,418 (4.5%)
Credit Cards 1,310 1,415 1,351 1,280 1,341 (2.4%)
Small Business Loans 4,792 4,842 4,927 5,008 5,093 (5.9%)
Medium and Large Business Loans 21,482 20,741 20,832 22,588 22,673 (5.3%)
of which:
Greece 42,240 41,777 42,089 44,092 44,399 (4.9%)
Mortgages 14,144 14,333 14,540 14,844 15,060 (6.1%)
Consumer Loans 3,738 3,775 3,842 3,885 3,906 (4.3%)
Credit Cards 1,274 1,378 1,314 1,244 1,306 (2.4%)
Small Business Loans 4,726 4,776 4,859 4,938 5,022 (5.9%)
Medium and Large Business Loans 18,357 17,514 17,533 19,180 19,105 (3.9%)
of which: Shipping Loans 2,246 2,172 2,165 1,979 2,074 7.5%
Southeastern Europe 6,458 6,535 6,647 6,845 7,055 (8.5%)
Accumulated Provisions (9,422) (9,558) (9,800) (11,518) (11,990) (21.4%)
Group Net Loans 39,767 39,266 39,451 39,913 39,948 (0.5%)
Customer Assets 46,315 45,929 44,829 44,432 43,920 5.5%
of which:
Group Deposits 41,894 40,364 39,612 39,263 38,937 7.6%
Sight & Savings 24,826 23,362 22,841 21,923 20,909 18.7%
Time deposits & Alpha Bank Bonds 17,067 17,002 16,772 17,340 18,027 (5.3%)
Greece 36,081 34,450 33,682 33,271 33,017 9.3%
Sight & Savings 22,253 20,830 20,435 19,542 18,633 19.4%
Time deposits & Alpha Bank Bonds 13,829 13,620 13,246 13,729 14,384 (3.9%)
Southeastern Europe 5,202 5,266 5,214 5,226 5,143 1.2%
Money Market Mutual Funds 111 127 151 192 219 (49.5%)
Other Mutual Funds 1,313 1,789 1,659 1,526 1,364 (3.7%)
Private Banking 2,997 3,648 3,407 3,452 3,400 (11.8%)

36
Breakdown of loans portfolio – March 2020
Agriculture
1%
Energy
3%Real Estate
4%
Tourism
5%
Other
5%
Construction
6%
Transportation
6%
Manufacturing
11%Trade
13%
Households
46% €49.1bn
Wholesale loans
44%
Credit Cards
3%
SBLs
10%Consumer loans
8% Mortgages
35%
Handysize/Handymax (Bulk Carriers)
18%
Panamax (Bulk Carriers)
21%
Afamax (Tankers)
4%
Capesize (Bulk Carriers)
11%
Product (Tankers)
10%
Panamax (Tankers)
3%
Suezmax (Tankers)
9%VLCC (Tankers)
6%
Containers
11%
LNG
3%
Passenger Vessels
4%
€49.1bn
€2.2bn
Total Group loans – per segmentEUR bn
Tankers
32%
Dry
Bulk
50%
• Duration of shipping loan portfolio at 5 years
Group Loans portfolio structure EUR bn
Shipping loans portfolio structure

37
Revenue to be supported by increase in new financing of €1.6bn in Q1 2020 vs. € 3.5bn in FY 2019
New disbursements – per categoryEUR mn
Q1 2020 Business disbursements – per sector
Media &
Communication
1%
Agriculture
2%
Real Estate
10%
Construction
4%
Tourism
7%
Manufacturing
10%
Transportation
12%Other
14%
Energy
19%
Trade
22%
€1.6bn
Loan disbursements of €1.6bn in Q1 2020, including €0.7bn drawdowns of untapped
credit lines by businesses
96% to business, 4% to individuals
Business disbursements primarily towards sectors that drive the economy such as
transportation, manufacturing, trade and energy
Q1 19 Q2 19 Q3 19 Q4 19 FY 19 Q1 20
Individuals 48 70 75 119 312 64
Business 567 842 907 891 3,206 1,575
Total 615 911 982 1,010 3,518 1,639

38
Liquidity profile continued to improve with Group deposits inflows of €1.5 billion q-o-q
Group deposits evolutionEUR bn
6.3 6.5
3.4
Dec-19 Mar-20 May-20
EUR bn
Repo balances
EUR bn
3.1
3.1 3.1
6.2 LTRO
Dec-19
0.8
Mar-20 May-20
3.9
TLTRO
9.3
ECB balances
LTRO cost
@ -0.50%5.9
0.4 0.7 0.6
5.8Abroad
34.5
Dec-19 Individuals Business
36.1
State
deposits
Abroad
40.4
Mar-20
Greece
(0.1)
41.9
+€1.5bn
Greece +€1.6bn
Deposits in Greece increased by €1.6bn in Q1 2020, as a
result of inflows from both businesses & individuals and state
deposits
TLTRO cost
@ -0.40%
39
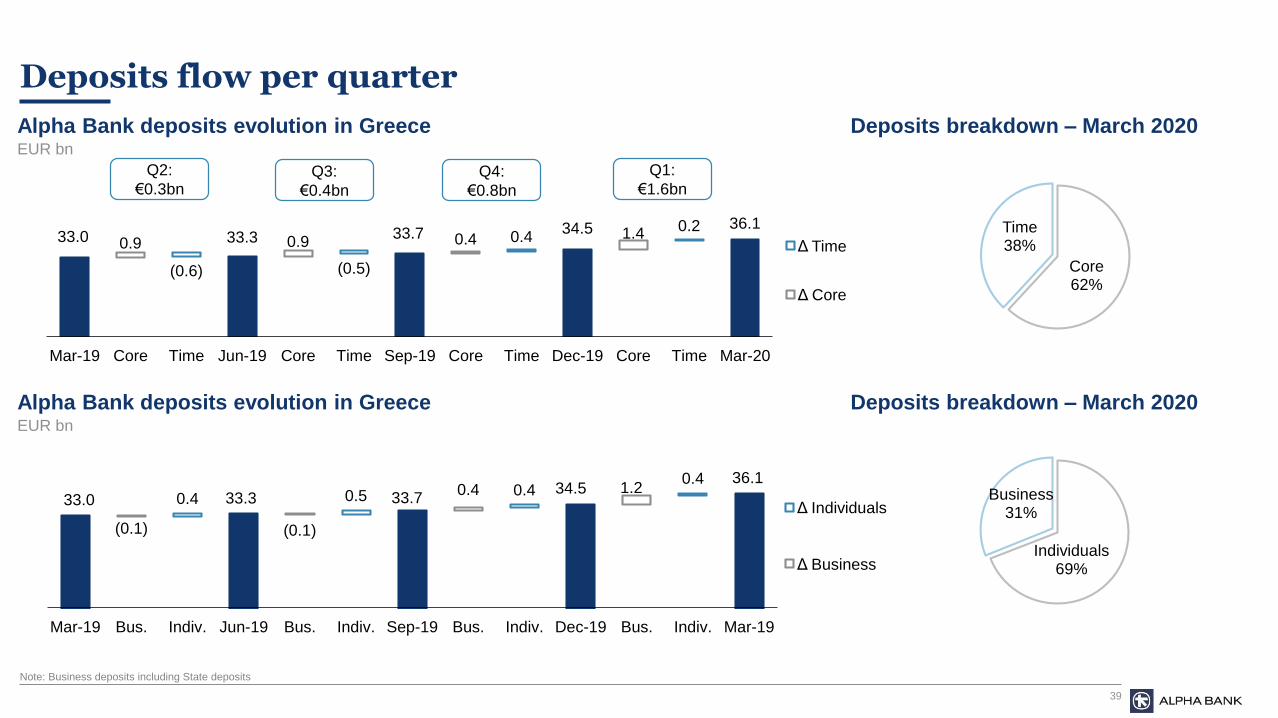
Deposits flow per quarter
Alpha Bank deposits evolution in GreeceEUR bn
33.0 33.3 33.7 34.5 36.1
0.9 0.9 0.4 1.4
(0.6) (0.5)
0.40.2
Mar-19 Core Time Jun-19 Core Time Sep-19 Core Time Dec-19 Core Time Mar-20
Δ Time
Δ Core
33.0 33.3 33.734.5
36.1
(0.1) (0.1)
0.4 1.20.4 0.5 0.4
0.4
Mar-19 Bus. Indiv. Jun-19 Bus. Indiv. Sep-19 Bus. Indiv. Dec-19 Bus. Indiv. Mar-19
Δ Individuals
Δ Business
Q3:
€0.4bn
Q2:
€0.3bnQ4:
€0.8bn
Q1:
€1.6bn
Alpha Bank deposits evolution in GreeceEUR bn
Deposits breakdown – March 2020
Note: Business deposits including State deposits
Deposits breakdown – March 2020
Core62%
Time38%
Individuals69%
Business31%

40
Gradual reduction of GGB portfolio measured at fair value to stabilise capital; almost €0.4bn unrealised gains on GGB portfolio
GGB unrealized gainsEUR mn
GGBs at FVOCIBook Value EUR bnBook Value EUR bn
GGBs at amortized cost
Bond portfolio at amortised cost increased in order to reduce
the impact in Equity position from price volatility
1.1
1.9
2.5
May-20Mar-20Dec-19
653
503
371
Dec-19 May-20Mar-20
3.8
3.22.7
Dec-19 Mar-20 May-20

41
Wealth management evolution
Alpha Private Bank balancesEUR mn
Asset Management balancesEUR mn
536 567 586
1,0461,169 1,139
23589 54
1,817 1,825 1,779
Mar-18 Mar-19 Mar-20
Money Market Mutual FundsNon Money Market Mutual FundsOther AUM
241 266 448
2,771 2,825 2,639
1,224 1,183953
4,235 4,2754,039
Mar-18 Mar-19 Mar-20
Discretionary Advisory Execution Only
42
Alpha Bank
• Q1 2020 Highlights
• Macroeconomic Update
• Financial Performance Analysis
• Appendix
Asset Quality
Capital
Volumes
P&L
Pages
3
10
15
24
31
33
42

43
PPI and NII breakdown
Core PPI breakdownEUR mn
NII decompositionEUR mn
469 481 485 486 480
(258) (267)(265) (284) (251)
211 213 220202
230
Q1 19 Q2 19 Q3 19 Q4 19 Q1 20
Core Operating Income Recurring OPEX Core PPI
(50) (49) (50) (52) (48)
(17) (16) (11) (10) (11)
396 398 397 399 390
59 55 47 50 51
Q1 19 Q2 19 Q3 19 Q4 19 Q1 20
Bonds & other Loans Funding Depos
388 389 383 387 381

44
Loan and deposit spreads
Net loan balances & spreadsEUR bn
Deposit mix & cost evolutionEUR bn
Lending spreads (Greece and SEE) Deposit spreads (Greece and SEE)bps bps
End of
quarter
balances
39.9 39.9 39.5 39.3 39.8
408 407402 402 400
Q1 19 Q2 19 Q3 19 Q4 19 Q1 20
Net Loans Group loans spread
41%
59%
% Total
887 897862 854 855
620 600 579 588 568
418422 422 417 416
400 400 398 397 393
253 251 251 251 251
Q1 19 Q2 19 Q3 19 Q4 19 Q1 20
Consumer Credit
Small BusinessLoans
SEE
Medium & LargeBusiness
Mortgages
20.9 21.9 22.8 23.4 24.8
18.0 17.3 16.8 17.0 17.1
38.9 39.3 39.6 40.4 41.9
(50) (49) (49) (50) (47)
Q1 19 Q2 19 Q3 19 Q4 19 Q1 20
Core deposits Time deposits Group deposits spread
(32) (34) (39) (45)
(45)
(16) (15) (9) (9) (7)
(86) (81) (78) (73)(64)
Q1 19 Q2 19 Q3 19 Q4 19 Q1 20
Sight andSavings
SE Europe
TimeDeposits

45
Operating Expenses
Recurring OPEX evolution
Employees Branches
EUR mnEUR mn Q1 19 Q1 20 yoy %
Staff costs (113.8) (107.0) (6.0%)
General Administrative
expenses(109.4) (106.1) (3.0%)
Depreciation and
amortisation(35.2) (37.5) 6.7%
Recurring OPEX (258.4) (250.6) (3.0%)
Extraordinary costs (3.5) (8.3) …
Total OPEX (262.0) (259.0) (1.1%)
114 115 112 117 107
109 115 118 130106
35 37 3537
38
258 267 265284
251
Q1 19 Q2 19 Q3 19 Q4 19 Q1 20
Depreciation &amortisation
Generaladministrativeexpenses
Staff costs
13,856
11,863 11,72711,314 11,322 11,295 11,251
10,530 10,511
Dec-15 Dec-16 Dec-17 Dec-18 Mar-19 Jun-19 Sep-19 Dec-19 Mar-20
FYROM
-240
VSS Cy
-249
Greece 9,687 8,888 8,667 8,147 8,165 8,145 8,080 7,354 7,330
Serbia
-836
Hilton
-323
VSS Gr
-523
897
721670
629 613 606 600 580 556
Dec-15 Dec-16 Dec-17 Dec-18 Mar-19 Jun-19 Sep-19 Dec-19 Mar-20
Bulg
-83
FYROM
-18
Serbia
-67
1 Includes corporate and private banking centers
Greece1 626 533 483 443 426 420 414 394 369

46
SEE Operations1
1 Country View
EUR mn Δ% Δ% Δ% Δ%
Mar-20 Cyprus yoy Romania yoy Albania yoy Total SEE yoy
Deposits 2,142 (5.0%) 2,557 7.4% 504 (0.8%) 5,202 1.2%
Gross Loans 3,500 (16.7%) 2,667 4.8% 290 (4.8%) 6,458 (8.5%)
Mortgages 1,872 (8.2%) 1,183 6.1% 71 1.9% 3,126 (3.0%)
Consumer Credit 236 (6.7%) 235 (2.8%) 36 14.3% 507 (3.7%)
Businesses 1,392 (27.2%) 1,249 5.1% 184 (10.0%) 2,824 (14.5%)
NPE ratio 76.0% 7.5% 16.8%
NPE Cash coverage 53% 75% 41%
NPE Total coverage 99% 141% 97%
NPL ratio 64.8% 5.1% 12.4%
NPL Cash coverage 63% 112% 56%
NPL Total coverage 106% 167% 97%
Total Operating Income 24.9 5.7% 35.4 2.2% 5.1 (20.6%) 65.4 1.2%
Operating Expenses (pre-O/H allocation) (22.2) 49.7% (28.5) 7.7% (4.2) 12.5% (54.9) 21.9%
Impairment Losses (36.7) (0.1%) (4.1) 4.1% (0.6) … (41.4) 4.3%
Profit Before Tax (pre- O/H allocation) (34.0) … 2.8 … 0.3 … (30.9) …
Branches 22 130 34 186
Employees 691 1,992 419 3,102
47
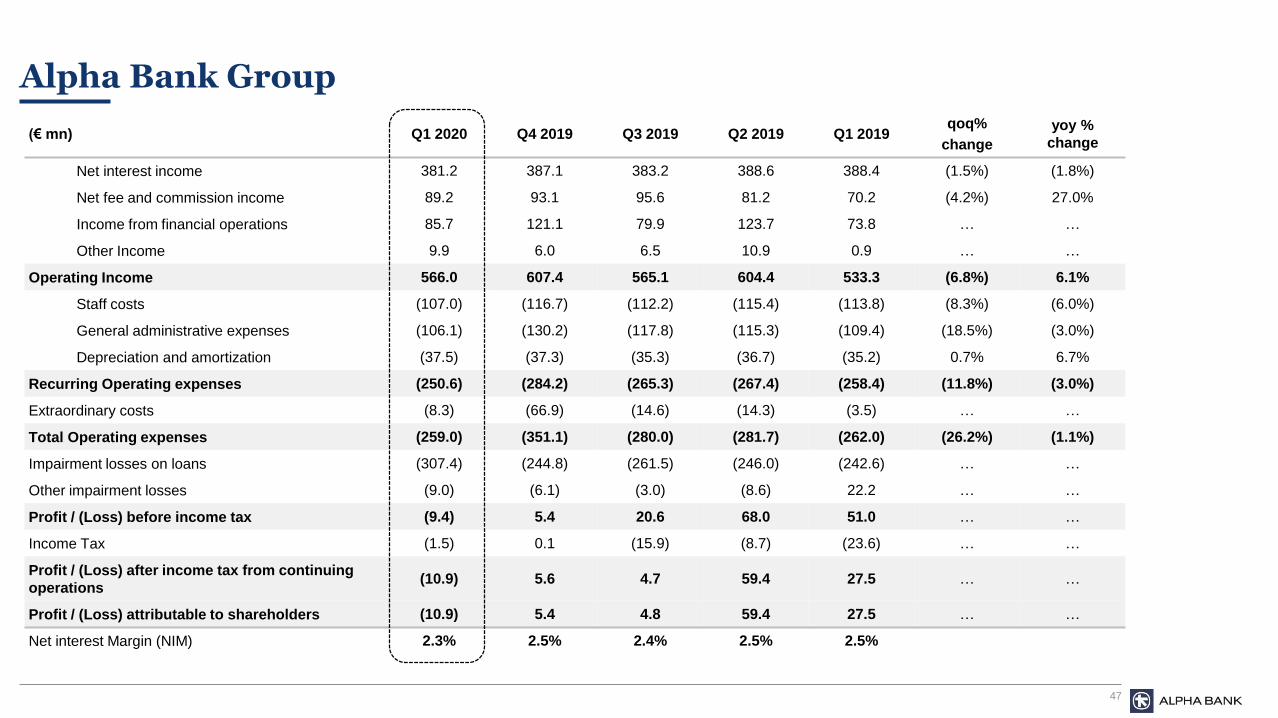
Alpha Bank Group
(€ mn) Q1 2020 Q4 2019 Q3 2019 Q2 2019 Q1 2019qoq%
change
yoy %
change
Net interest income 381.2 387.1 383.2 388.6 388.4 (1.5%) (1.8%)
Net fee and commission income 89.2 93.1 95.6 81.2 70.2 (4.2%) 27.0%
Income from financial operations 85.7 121.1 79.9 123.7 73.8 … …
Other Income 9.9 6.0 6.5 10.9 0.9 … …
Operating Income 566.0 607.4 565.1 604.4 533.3 (6.8%) 6.1%
Staff costs (107.0) (116.7) (112.2) (115.4) (113.8) (8.3%) (6.0%)
General administrative expenses (106.1) (130.2) (117.8) (115.3) (109.4) (18.5%) (3.0%)
Depreciation and amortization (37.5) (37.3) (35.3) (36.7) (35.2) 0.7% 6.7%
Recurring Operating expenses (250.6) (284.2) (265.3) (267.4) (258.4) (11.8%) (3.0%)
Extraordinary costs (8.3) (66.9) (14.6) (14.3) (3.5) … …
Total Operating expenses (259.0) (351.1) (280.0) (281.7) (262.0) (26.2%) (1.1%)
Impairment losses on loans (307.4) (244.8) (261.5) (246.0) (242.6) … …
Other impairment losses (9.0) (6.1) (3.0) (8.6) 22.2 … …
Profit / (Loss) before income tax (9.4) 5.4 20.6 68.0 51.0 … …
Income Tax (1.5) 0.1 (15.9) (8.7) (23.6) … …
Profit / (Loss) after income tax from continuing
operations(10.9) 5.6 4.7 59.4 27.5 … …
Profit / (Loss) attributable to shareholders (10.9) 5.4 4.8 59.4 27.5 … …
Net interest Margin (NIM) 2.3% 2.5% 2.4% 2.5% 2.5%

48
Group Results by Business Unit
(€ mn)
RetailCommercial &
CorporateSE Europe
Investment
Banking &
Treasury
Asset
ManagementOther Group
Jan-Mar Jan-Mar Jan-Mar Jan-Mar Jan-Mar Jan-Mar Jan-Mar
2020 2019 2020 2019 2020 2019 2020 2019 2020 2019 2020 2019 2020 2019
Operating Income 189.6 196.5 153.2 162.5 65.4 64.6 137.7 105.8 20.0 14.5 0.2 (10.6) 566.0 533.3
Net Interest Income 163.0 175.4 127.4 130.9 52.0 51.2 35.3 26.7 3.2 2.9 0.2 1.3 381.2 388.4
Net fee and Commission Income 24.0 20.2 27.1 29.2 8.7 7.3 14.5 3.8 14.9 9.8 (0.0) (0.0) 89.2 70.2
Trading & Other 2.6 0.9 (1.3) 2.4 4.7 6.1 87.9 75.4 1.9 1.8 (0.0) (11.9) 95.7 74.7
Operating Expenses (134.7) (150.2) (39.0) (45.0) (59.4) (48.6) (7.2) (7.4) (9.0) (7.9) (9.6) (2.9) (259.0) (262.0)
Staff Costs (54.9) (63.3) (18.0) (20.2) (24.4) (21.9) (3.0) (3.1) (4.7) (4.4) (2.2) (1.1) (107.1) (114.1)
General Administrative Expenses (59.8) (67.9) (13.9) (17.6) (28.7) (21.0) (3.4) (3.4) (3.2) (2.6) (5.3) (0.2) (114.3) (112.7)
Depreciation & Amortisation (20.0) (19.1) (7.1) (7.2) (6.3) (5.6) (0.9) (0.9) (1.1) (0.8) (2.1) (1.5) (37.5) (35.2)
Pre Provision Income (PPI) 54.9 46.2 114.2 117.5 5.9 16.0 130.5 98.4 11.0 6.7 (9.5) (13.5) 307.1 271.4
Impairment Losses on Loans (154.4) (146.6) (109.9) (58.0) (41.1) (39.8) (2.0) 1.9 0.0 (0.0) 0.0 0.0 (307.4) (242.6)
Other Impairment Losses 0.0 0.0 0.0 0.0 (0.3) 0.1 (8.3) 20.6 (0.3) 2.2 0.0 (0.7) (9.0) 22.2
Profit / (Loss) before tax (99.5) (100.3) 4.3 59.5 (35.5) (23.7) 120.2 120.8 10.7 8.8 (9.5) (14.1) (9.4) 51.0

49
Results: Retail Business Unit
(€ mn) Q1 2020 Q4 2019 Q3 2019 Q2 2019 Q1 2019
Operating Income 189.6 198.7 203.0 203.9 196.5
Net Interest Income 163.0 164.7 164.8 174.1 175.4
Net fee and Commission Income 24.0 32.2 35.9 27.9 20.2
Trading & Other 2.6 1.7 2.3 1.9 0.9
Operating Expenses (134.7) (150.1) (145.7) (149.3) (150.2)
Staff Costs (54.9) (61.9) (61.5) (63.1) (63.3)
General Administrative Expenses (59.8) (69.2) (65.6) (67.6) (67.9)
Depreciation and Amortisation (20.0) (19.0) (18.6) (18.5) (19.1)
Impairment losses on Loans (154.4) (123.7) (113.9) (175.4) (146.6)
Other Impairment Losses
Profit / (Loss) before tax (99.5) (75.1) (56.7) (120.8) (100.3)
RWA e 18,295 18,603 18,354 18,119 18,311

50
Results: Commercial & Corporate Business Unit
(€ mn) Q1 2020 Q4 2019 Q3 2019 Q2 2019 Q1 2019
Operating Income 153.2 119.6 166.0 153.8 162.5
Net Interest Income 127.4 129.2 128.7 130.5 130.9
Net fee and Commission Income 27.1 32.4 35.0 28.9 29.2
Trading & Other (1.3) (42.0) 2.2 (5.7) (2.4)
Operating Expenses (39.0) (44.9) (42.0) (46.4) (45.0)
Staff Costs (18.0) (21.2) (19.7) (20.6) (20.2)
General Administrative Expenses (13.9) (16.6) (16.6) (17.6) (17.6)
Depreciation and Amortisation (7.1) (7.2) (5.7) (8.2) (7.2)
Impairment losses on Loans (109.9) (81.1) (121.7) (62.1) (58.0)
Other Impairment Losses - - - - -
Profit / (Loss) before tax 4.3 (6.4) 2.3 45.3 59.5
RWA e 16,349 16,245 16,831 17,177 17,251

51
Results: Asset Management Business Unit
(€ mn) Q1 2020 Q4 2019 Q3 2019 Q2 2019 Q1 2019
Operating Income 20.0 19.5 18.1 18.4 14.5
Net Interest Income 3.2 3.9 3.6 3.4 2.9
Net fee and Commission Income 14.9 14.5 12.5 11.3 9.8
Trading & Other 1.9 1.1 2.0 3.7 1.8
Operating Expenses (9.0) (9.3) (9.0) (9.1) (7.9)
Staff Costs (4.7) (5.0) (4.8) (4.7) (4.4)
General Administrative Expenses (3.2) (3.3) (3.0) (3.4) (2.6)
Depreciation and Amortisation (1.1) (1.1) (1.3) (1.0) (0.8)
Impairment losses on Loans 0.0 (0.1) 0.1 0.0 (0.0)
Other Impairment Losses (0.3) (0.1) (0.9) (0.7) 2.2
Profit / (Loss) before tax 10.7 10.0 8.2 8.7 8.8
RWA e 362 362 362 361 356

52
Results: Investment Banking & Treasury Business Unit
(€ mn) Q1 2020 Q4 2019 Q3 2019 Q2 2019 Q1 2019
Operating Income 137.7 196.5 96.5 148.0 105.8
Net Interest Income 35.3 35.1 33.1 27.4 26.7
Net fee and Commission Income 14.5 5.3 4.5 5.3 3.8
Trading & Other 87.9 156.1 58.9 115.3 75.4
Operating Expenses (7.2) (7.9) (5.7) (7.7) (7.4)
Staff Costs (3.0) (3.6) (3.0) (3.1) (3.1)
General Administrative Expenses (3.4) (3.4) (2.4) (3.6) (3.4)
Depreciation and Amortisation (0.9) (0.9) (0.3) (1.0) (0.9)
Impairment losses on Loans (2.0) 3.5 (3.0) 0.1 1.9
Other Impairment Losses (8.3) (5.9) (2.2) (8.9) 20.6
Profit / (Loss) before tax 120.2 186.2 85.5 131.6 120.8
RWA e 5,724 5,389 4,966 4,860 4,842

53
Results: SE Europe Business Unit
(€ mn) Q1 2020 Q4 2019 Q3 2019 Q2 2019 Q1 2019
Operating Income 65.4 66.6 67.2 67.2 64.6
Net Interest Income 52.0 52.9 53.7 52.6 51.2
Net fee and Commission Income 8.7 8.6 8.0 7.8 7.3
Trading & Other 4.7 5.1 5.5 6.8 6.1
Operating Expenses (59.4) (59.7) (53.0) (51.0) (48.6)
Staff Costs (24.4) (24.6) (24.2) (22.6) (21.9)
General Administrative Expenses (28.7) (29.0) (22.8) (22.0) (21.0)
Depreciation and Amortisation (6.3) (6.1) (6.1) (6.5) (5.6)
Impairment losses on Loans (41.1) (43.4) (22.9) (8.6) (39.8)
Other Impairment Losses (0.3) (0.0) 0.1 0.2 0.1
Profit / (Loss) before tax (35.5) (36.5) (8.7) 7.8 (23.7)
RWA e 4,661 4,719 4,760 4,835 4,801

54
Results: Other Business Unit
(€ mn) Q1 2020 Q4 2019 Q3 2019 Q2 2019 Q1 2019
Operating Income 0.2 6.5 14.4 13.1 (10.6)
Net Interest Income 0.2 1.3 (0.8) 0.6 1.3
Net fee and Commission Income (0.0) (0.0) (0.2) (0.0) (0.0)
Trading & Other (0.0) 5.2 15.4 12.5 (11.9)
Operating Expenses (9.6) (79.2) (24.5) (18.2) (2.9)
Staff Costs (2.2) (1.8) 0.9 (1.4) (1.1)
General Administrative Expenses (5.3) (24.7) (22.0) (15.2) (0.2)
Depreciation and Amortisation (2.1) (3.1) (3.4) (1.6) (1.5)
Expenses for VSS (49.6)
Impairment losses on Loans - - - - -
Other Impairment Losses - - - 0.7 (0.7)
Profit / (Loss) before tax (9.5) (72.8) (10.1) (4.5) (14.1)
RWA e 2,165 2,482 2,572 2,389 2,208
55
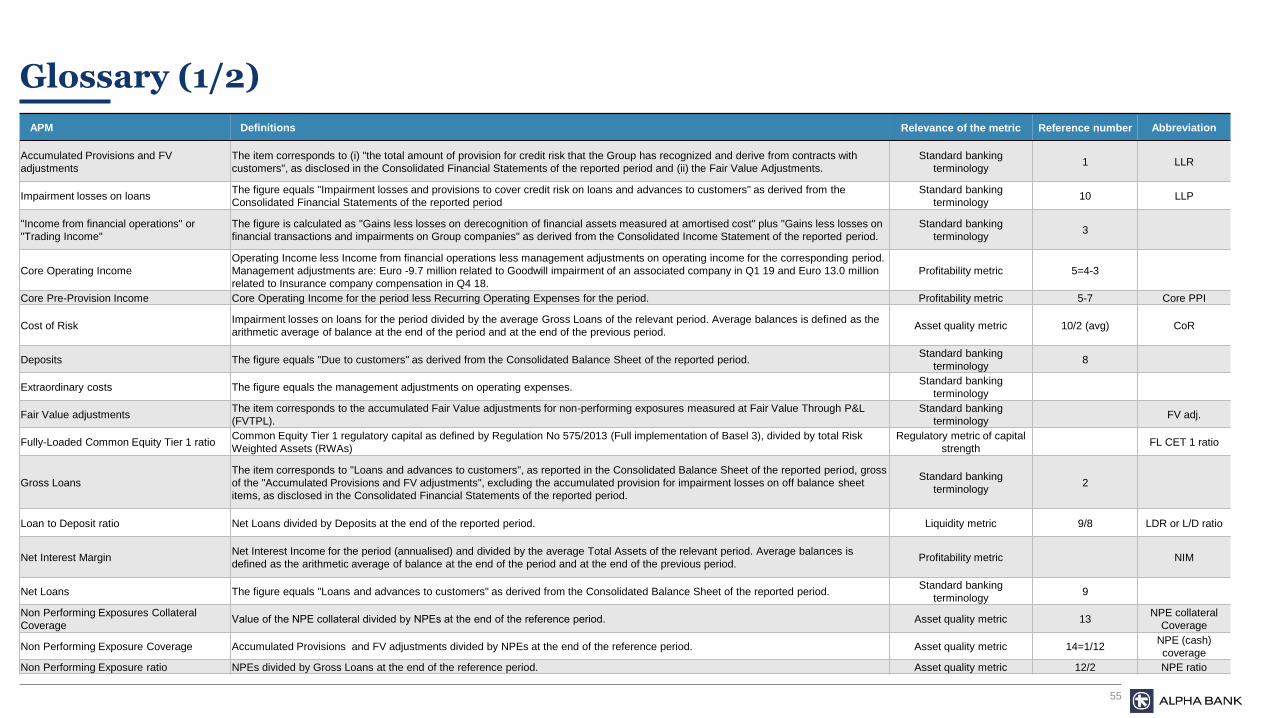
Glossary (1/2)
APM Definitions Relevance of the metric Reference number Abbreviation
Accumulated Provisions and FV
adjustments
The item corresponds to (i) "the total amount of provision for credit risk that the Group has recognized and derive from contracts with
customers", as disclosed in the Consolidated Financial Statements of the reported period and (ii) the Fair Value Adjustments.
Standard banking
terminology1 LLR
Impairment losses on loansThe figure equals "Impairment losses and provisions to cover credit risk on loans and advances to customers" as derived from the
Consolidated Financial Statements of the reported period
Standard banking
terminology10 LLP
"Income from financial operations" or
"Trading Income"
The figure is calculated as "Gains less losses on derecognition of financial assets measured at amortised cost" plus "Gains less losses on
financial transactions and impairments on Group companies" as derived from the Consolidated Income Statement of the reported period.
Standard banking
terminology3
Core Operating Income
Operating Income less Income from financial operations less management adjustments on operating income for the corresponding period.
Management adjustments are: Euro -9.7 million related to Goodwill impairment of an associated company in Q1 19 and Euro 13.0 million
related to Insurance company compensation in Q4 18.
Profitability metric 5=4-3
Core Pre-Provision Income Core Operating Income for the period less Recurring Operating Expenses for the period. Profitability metric 5-7 Core PPI
Cost of RiskImpairment losses on loans for the period divided by the average Gross Loans of the relevant period. Average balances is defined as the
arithmetic average of balance at the end of the period and at the end of the previous period.Asset quality metric 10/2 (avg) CoR
Deposits The figure equals "Due to customers" as derived from the Consolidated Balance Sheet of the reported period.Standard banking
terminology8
Extraordinary costs The figure equals the management adjustments on operating expenses.Standard banking
terminology
Fair Value adjustmentsThe item corresponds to the accumulated Fair Value adjustments for non-performing exposures measured at Fair Value Through P&L
(FVTPL).
Standard banking
terminologyFV adj.
Fully-Loaded Common Equity Tier 1 ratioCommon Equity Tier 1 regulatory capital as defined by Regulation No 575/2013 (Full implementation of Basel 3), divided by total Risk
Weighted Assets (RWAs)
Regulatory metric of capital
strengthFL CET 1 ratio
Gross Loans
The item corresponds to "Loans and advances to customers", as reported in the Consolidated Balance Sheet of the reported period, gross
of the "Accumulated Provisions and FV adjustments", excluding the accumulated provision for impairment losses on off balance sheet
items, as disclosed in the Consolidated Financial Statements of the reported period.
Standard banking
terminology2
Loan to Deposit ratio Net Loans divided by Deposits at the end of the reported period. Liquidity metric 9/8 LDR or L/D ratio
Net Interest Margin Net Interest Income for the period (annualised) and divided by the average Total Assets of the relevant period. Average balances is
defined as the arithmetic average of balance at the end of the period and at the end of the previous period.Profitability metric NIM
Net Loans The figure equals "Loans and advances to customers" as derived from the Consolidated Balance Sheet of the reported period.Standard banking
terminology9
Non Performing Exposures Collateral
Coverage Value of the NPE collateral divided by NPΕs at the end of the reference period. Asset quality metric 13
NPE collateral
Coverage
Non Performing Exposure Coverage Accumulated Provisions and FV adjustments divided by NPEs at the end of the reference period. Asset quality metric 14=1/12NPE (cash)
coverage
Non Performing Exposure ratio NPEs divided by Gross Loans at the end of the reference period. Asset quality metric 12/2 NPE ratio

56
Glossary (2/2)
APM DefinitionsRelevance of the
metric
Reference
numberAbbreviation
Non Performing Exposure Total
Coverage
Accumulated Provisions and FV adjustment plus the value of the NPE collateral divided by NPEs at the end of the reported period. NPE Total coverage equals the
sum of NPE coverage and NPE collateral coverage.Asset quality metric 13+14
NPE Total
coverage
Non Performing Exposures
Non-performing exposures are defined according to "EBA ITS on forbearance and Non Performing Exposures" as exposures that satisfy either or both of the
following criteria: a) material exposures which are more than 90 days past-due b)The debtor is assessed as unlikely to pay its credit obligations in full without
realisation of collateral, regardless of the existence of any past-due amount or of the number of days past due.
Asset quality metric 12 NPEs
Non Performing Loan Collateral
Coverage Value of collateral received for Non Performing Loans divided by NPLs at the end of the reference period. Asset quality metric 16
NPL collateral
Coverage
Non Performing Loan Coverage Accumulated Provisions and FV adjustments divided by NPLs at the end of the reference period. Asset quality metric 17=1/15NPL (cash)
Coverage
Non Performing Loan ratio NPLs divided by Gross Loans at the end of the reference period. Asset quality metric 15/2 NPL ratio
Non Performing Loan Total
Coverage
Accumulated Provisions and FV adjustments plus the value of the NPL collateral divided by NPLs at the end of the reference period. NPL Total coverage equals the
sum of NPL coverage and NPL collateral coverage.Asset quality metric 16+17
NPL Total
Coverage
Non Performing Loans Non Performing Loans are Gross loans that are more than 90 days past-due. Asset quality metric 15 NPLs
Operating Income The figure is calculated as "Total Income" plus "Share of profit/(loss) of associates and joint ventures" as derived from the Consolidated Income Statement of the
reported period, taking into account the impact from any potential restatement as described in Note 32 of the Consolidated Financial Statements.
Standard banking
terminology4
Other impairment losses The figure equals "Impairment losses on other financial instruments" as derived for the Consolidated Financial Statements of the reported period.Standard banking
terminology
Other IncomeThis item corresponds to the sum of "Dividend income", "Other income" and "Share of profit/(loss) of associates and joint ventures", as defined in the Consolidated
Balance Sheet of the reported period.
Standard banking
terminology
Pre-Provision Income Operating Income for the period less Total Operating Expenses for the period Profitability metric 4-6 PPI
Recurring Cost to Income ratio Recurring Operating Expenses for the period divided by Core Operating Income for the period. Efficiency metric 7/5 C/I ratio
Recurring Operating Expenses
Total Operating Expenses less management adjustments on operating expenses. Management adjustments on operating expenses include events that do not occur
with a certain frequency, and events that are directly affected by the current market conditions and/or present significant variation between the reporting periods, and
are quoted in the appendix of the Financial Report.
Efficiency metric 7 Recurring OPEX
Securities This item corresponds to the sum of "Investment securities" and "Trading securities", as defined in the Consolidated Balance Sheet of the reported period.Standard banking
terminology
Shareholders' Equity This item corresponds to "Equity attributable to equity owners of the Bank", as defined in the Consolidated Balance Sheet of the reported period.Standard banking
terminology
Tangible Book Value (or
Tangible Equity)
TBV (or TE) is the sum of "Total Equity" less "Goodwill and other intangible assets", less "Non-controlling interests" and less "hybrid securities", as defined in the
Consolidated Balance sheet at the reported period.
Standard banking
terminologyTBV or TE
Tangible Book Value (or
Tangible Equity) per share Tangible Book Value (or Tangible Equity) divided by the outstanding number of shares. Valuation metric TBV/share
Total AssetsThe figure equals "Total Assets" as derived from the Consolidated Balance Sheet of the reported period taking into account the impact from any potential
restatement, as described in Note 32 of the Consolidated Financial Statements.
Standard banking
terminology11 TA
Total Operating Expenses The figure equals "Total expenses before impairment losses and provisions to cover credit risk" as derived from the Consolidated Income Statement of the reported
period taking into account the impact from any potential restatement, as described in Note 32 of the Consolidated Financial Statements.
Standard banking
terminology6 Total OPEX
57
Alpha Bank Contacts
General Manager – CFO
Internet : www.alpha.gr
Reuters : ACBr.AT (shares)
Bloomberg : ALPHA GA (shares)
Alpha Bank Depository Receipts (ADRs)
Reuters : ALBKY.PK
Bloomberg : ALBKY US
Lazaros Papagaryfallou
+30 210 326 2261
Manager
Investor Relations Division
Dimitrios Kostopoulos
+30 210 326 2271
Deputy Manager
Investor Relations Division
Elena Katopodi
+30 210 326 2272
Senior
Investor Relations Officer
Stella Traka
+30 210 326 2274
Investor Relations Division
+30 210 326 2271
+30 210 326 2273
+30 210 326 2277
40 Stadiou Street,
102 52, Athens