Embed Size (px)
Citation preview

Q2 2020 Financial ResultsJuly 2020

©2020 RealPage Inc.
Forward Looking Statements
2
This presentation contains “forward-looking” statements relating to RealPage, Inc.’s strategy, goals, future focus areas, and expected, possible or assumed future results, including its financial outlook for the third quarter ending
September 30, 2020 and calendar year ending December 31, 2020, the surging demand for solutions that facilitate virtual leasing and living offered by RealPage, the anticipated investment in product development and sales and
marketing at elevated levels to capitalize on the changing dynamics of the way renters live and work in a post-COVID world, and our belief that these investments position us for sustained long term growth. These forward-looking
statements are based on management's beliefs and assumptions and on information currently available to management. Forward-looking statements include all statements that are not historical facts and may be identified by terms such
as “expects,” “believes,” “plans,” or similar expressions and the negatives of those terms.
These forward-looking statements involve known and unknown risks, uncertainties, and other factors that may cause actual results, performance or achievements to be materially different from any future results, performance or
achievements, expressed or implied by the forward-looking statements, including the uncertainty associated with the potential impacts of the COVID-19 pandemic on our business, financial condition, and results of operations. The
company may be required to revise its results contained herein upon finalizing its review of quarterly and full-year results and completion of the annual audit, which could cause or contribute to such differences. Additional factors that
could cause or contribute to such differences include, but are not limited to, the following: (a) the possibility that general economic conditions, including leasing velocity or other uncertainty, and conditions and uncertainty caused by the
COVID-19 pandemic, could cause information technology spending, particularly in the rental housing industry, to be reduced or purchasing decisions to be delayed; (b) an increase in insurance claims; (c) an increase in client
cancellations; (d) the inability to increase sales to existing clients and to attract new clients; (e) RealPage’s failure to integrate recent or future acquired businesses successfully or to achieve expected synergies, including the recently
completed acquisitions of Modern Message, Buildium, Investor Management Services, Simple Bills, Hipercept, and Lease Term Solutions; (f) the timing and success of new product introductions by RealPage or its competitors; (g) changes
in RealPage’s pricing policies or those of its competitors; (h) legal or regulatory proceedings; (i) the inability to achieve revenue growth or to enable margin expansion; (j) changes in RealPage’s estimates with respect to its long-term
corporate tax rate or any other impact from the Tax Cuts and Jobs Act; and (k) such other risks and uncertainties described more fully in documents filed with or furnished to the Securities and Exchange Commission (“SEC”) by RealPage,
including its Annual Report on Form 10-K previously filed with the SEC on March 2, 2020 and its Quarterly Report on Form 10-Q previously filed with the SEC on May 8, 2020. All information provided in this presentation is as of the date
hereof and RealPage undertakes no duty to update this information except as required by law.
A global software and data analytics company that improves the operational and transactional performance of real estate assets.
Lifecycle of an Asset
Buy Operate Sell
©2020 RealPage Inc.
REALPAGE RPU TOTALADDRESSABLE MARKET
(ALL REALPAGE PRODUCTS)
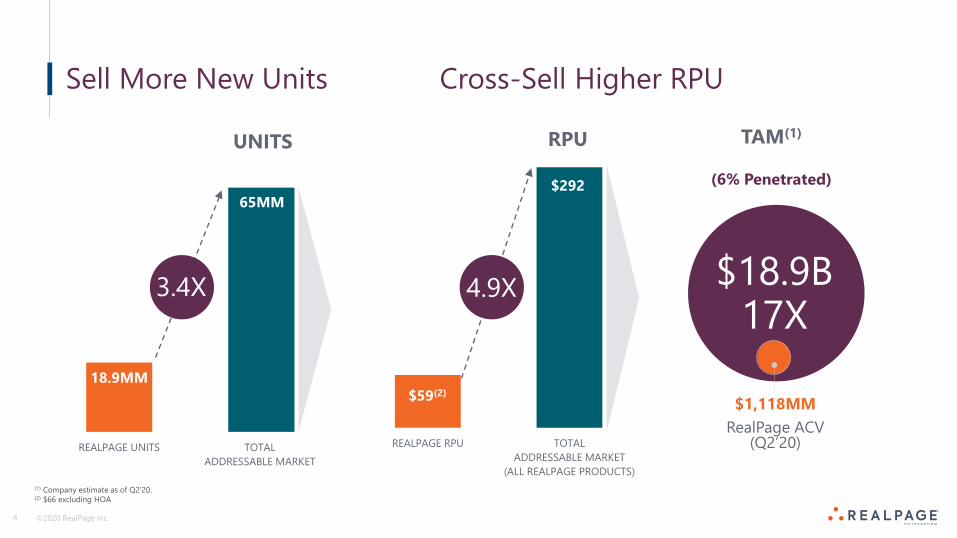
Sell More New Units Cross-Sell Higher RPU
4
(1) Company estimate as of Q2’20.(2) $66 excluding HOA
REALPAGE UNITS TOTALADDRESSABLE MARKET
$18.9B17X
$292
$59(2)$1,118MM
RealPage ACV(Q2’20)
RPU TAM(1)
(6% Penetrated)65MM
UNITS
18.9MM
4.9X3.4X
©2020 RealPage Inc.5
Macroeconomic Backdrop
• Fundamentals in rental housing space have deteriorated, however market still in good shape over long-term• Leasing volume down March through May, now returning to healthier levels• Strong resident retention has provided a tailwind for solid occupancy rates• Pricing, which was down in late Q1/early Q2, now stabilizing
©2020 RealPage Inc.
-4.0%
-2.0%
0.0%
2.0%
4.0%
6.0%
8.0%
Annual Rent Growth By Class
92%
93%
94%
95%
96%
97%
-3%
-2%
-1%
0%
1%
2%
3%
4%
5%
6%
Annual Rent Growth / Occupancy
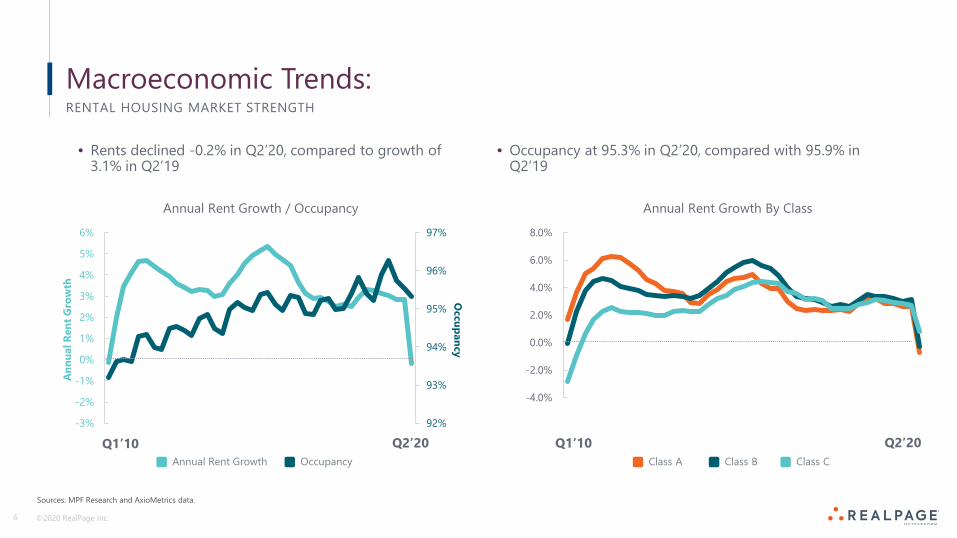
Macroeconomic Trends:
• Rents declined -0.2% in Q2’20, compared to growth of 3.1% in Q2’19
• Occupancy at 95.3% in Q2’20, compared with 95.9% in Q2’19
RENTAL HOUSING MARKET STRENGTH
6
Sources: MPF Research and AxioMetrics data.
Annual Rent Growth OccupancyQ1’10 Q2’20 Q1’10 Q2’20
Class CClass A Class B
Occupancy
Ann
ual R
ent G
row
th
©2020 RealPage Inc.
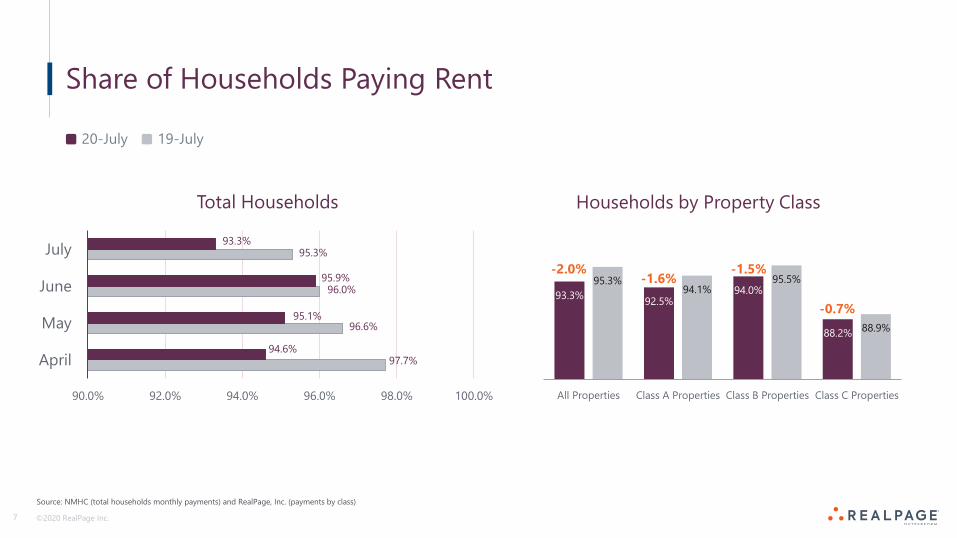
93.3% 92.5%94.0%
88.2%
95.3%94.1%
95.5%
88.9%
80.0%
85.0%
90.0%
95.0%
100.0%
All Properties Class A Properties Class B Properties Class C Properties
Households by Property Class
Share of Households Paying Rent
7
20-July 19-July
-2.0%-1.6%
-1.5%
-0.7%
Source: NMHC (total households monthly payments) and RealPage, Inc. (payments by class)
97.7%
96.6%
96.0%
95.3%
94.6%
95.1%
95.9%
93.3%
90.0% 92.0% 94.0% 96.0% 98.0% 100.0%
April
May
June
July
Total Households
©2020 RealPage Inc.
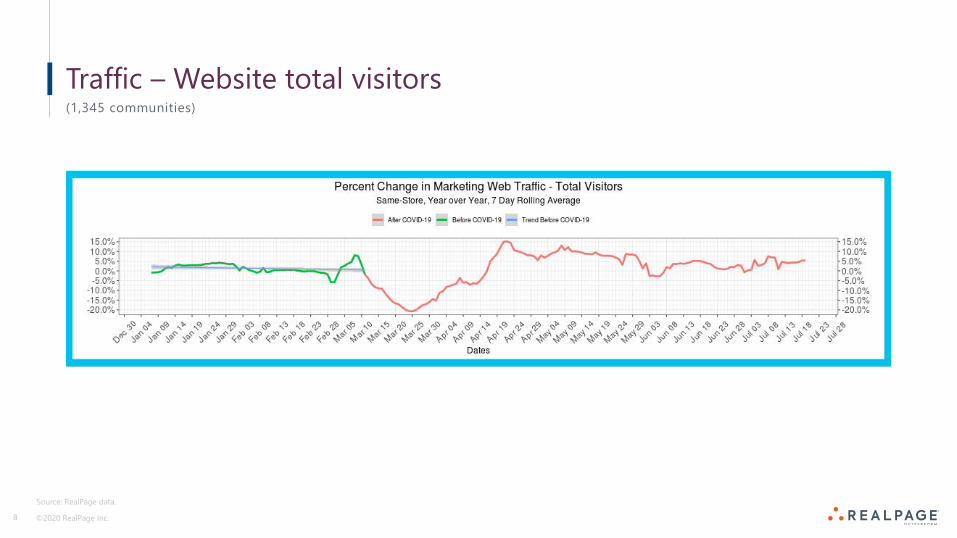
Traffic – Website total visitors(1,345 communities)
8
Source: RealPage data.
©2020 RealPage Inc.
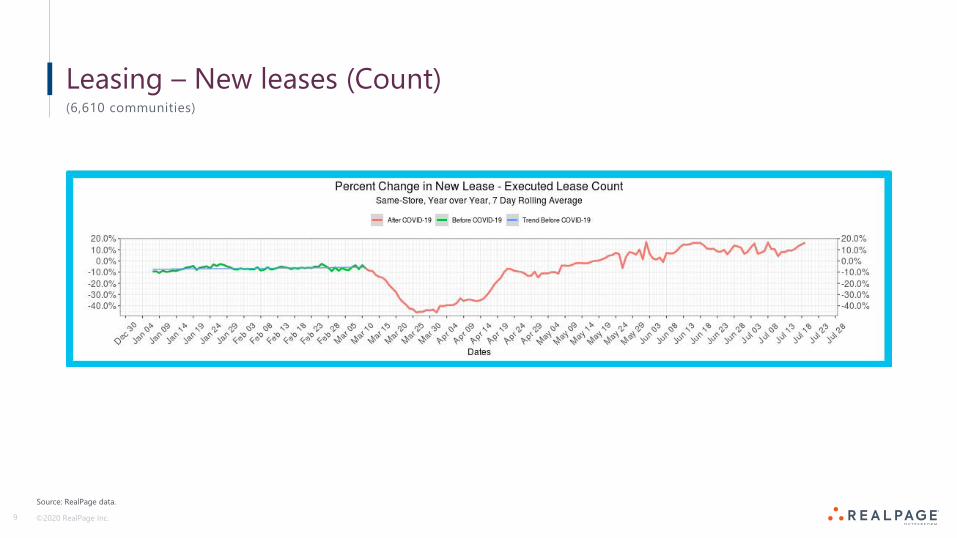
Leasing – New leases (Count)(6,610 communities)
9
Source: RealPage data.
©2020 RealPage Inc.
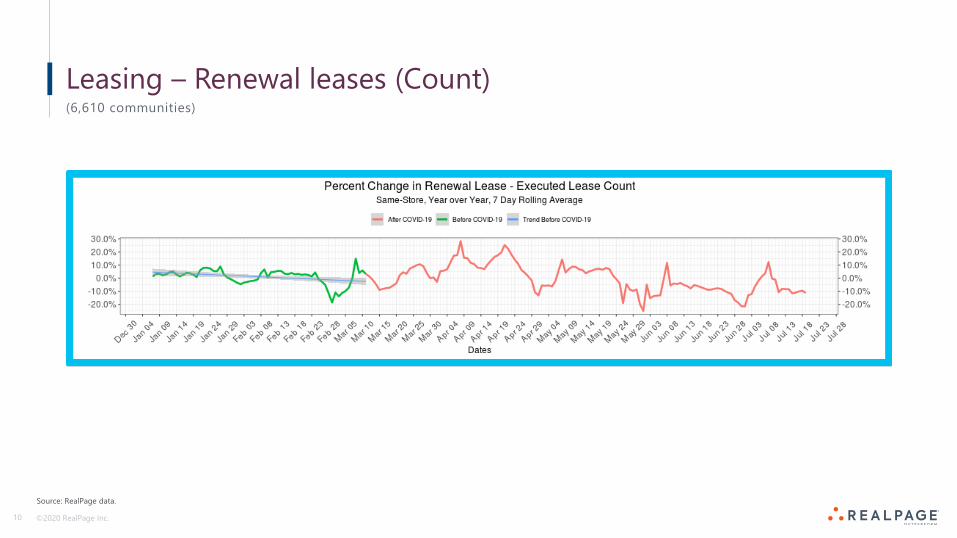
Leasing – Renewal leases (Count)(6,610 communities)
10
Source: RealPage data.
©2020 RealPage Inc.11
Q2 Summary
• Outstanding financial performance given current economic backdrop
• COVID-19 response accelerates transition to virtual leasing• AI ChatBot / AI VoiceBot• Online tours through video conference• Electronic lease payments / Lockbox processing• Online virtual living
• Continued success through SMB strategy• Growth in lead conversion• Providing context, insight and value to industry through COVID-19• Integration of Buildium into our product platform
©2020 RealPage Inc.12
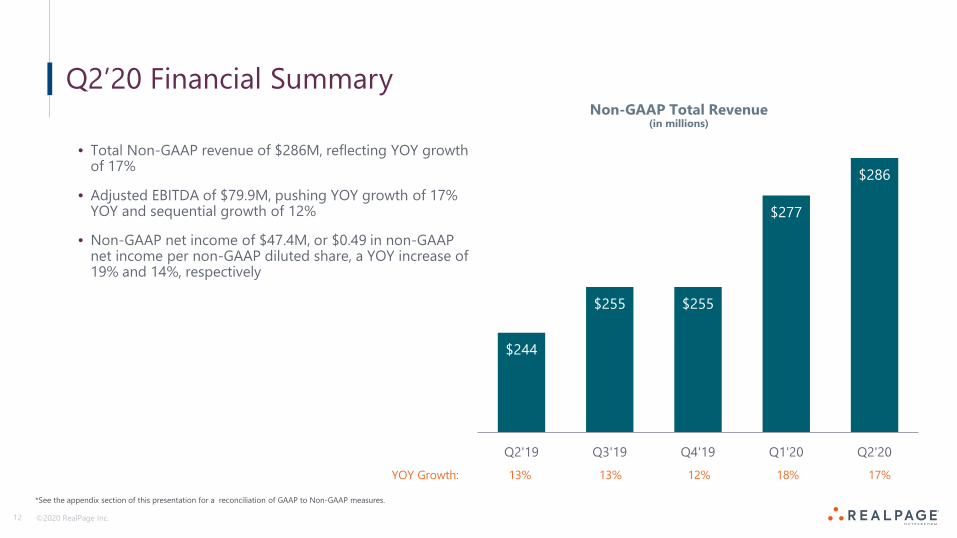
Q2’20 Financial Summary
• Total Non-GAAP revenue of $286M, reflecting YOY growth of 17%
• Adjusted EBITDA of $79.9M, pushing YOY growth of 17% YOY and sequential growth of 12%
• Non-GAAP net income of $47.4M, or $0.49 in non-GAAP net income per non-GAAP diluted share, a YOY increase of 19% and 14%, respectively
$244
$255 $255
$277
$286
Q2'19 Q3'19 Q4'19 Q1'20 Q2'20
Non-GAAP Total Revenue(in millions)
YOY Growth: 13% 13% 12% 18% 17%
*See the appendix section of this presentation for a reconciliation of GAAP to Non-GAAP measures.
©2020 RealPage Inc.13
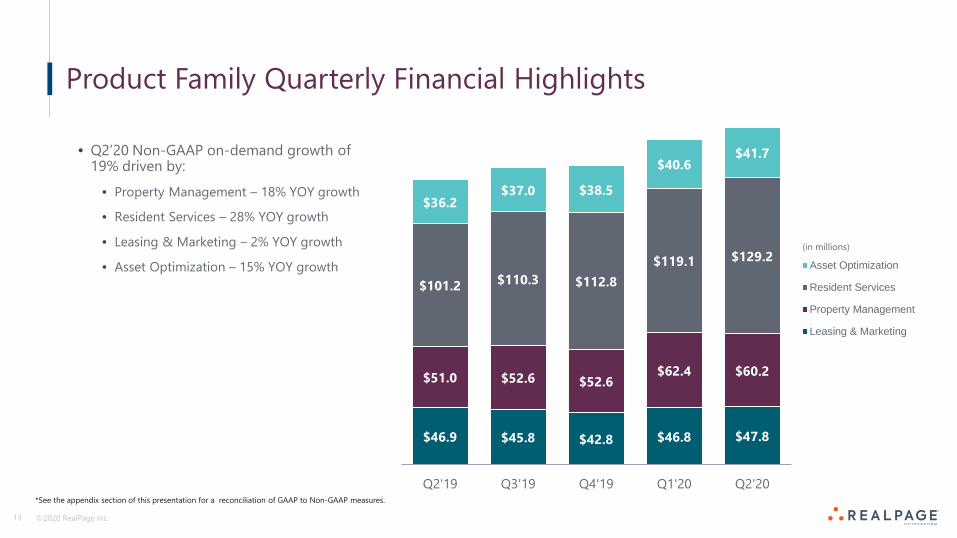
Product Family Quarterly Financial Highlights
• Q2’20 Non-GAAP on-demand growth of 19% driven by:
• Property Management – 18% YOY growth
• Resident Services – 28% YOY growth
• Leasing & Marketing – 2% YOY growth
• Asset Optimization – 15% YOY growth
$46.9 $45.8 $42.8 $46.8 $47.8
$51.0 $52.6 $52.6$62.4 $60.2
$101.2 $110.3 $112.8$119.1 $129.2
$36.2$37.0 $38.5
$40.6$41.7
Q2'19 Q3'19 Q4'19 Q1'20 Q2'20
Asset Optimization
Resident Services
Property Management
Leasing & Marketing
(in millions)
*See the appendix section of this presentation for a reconciliation of GAAP to Non-GAAP measures.
©2020 RealPage Inc.14
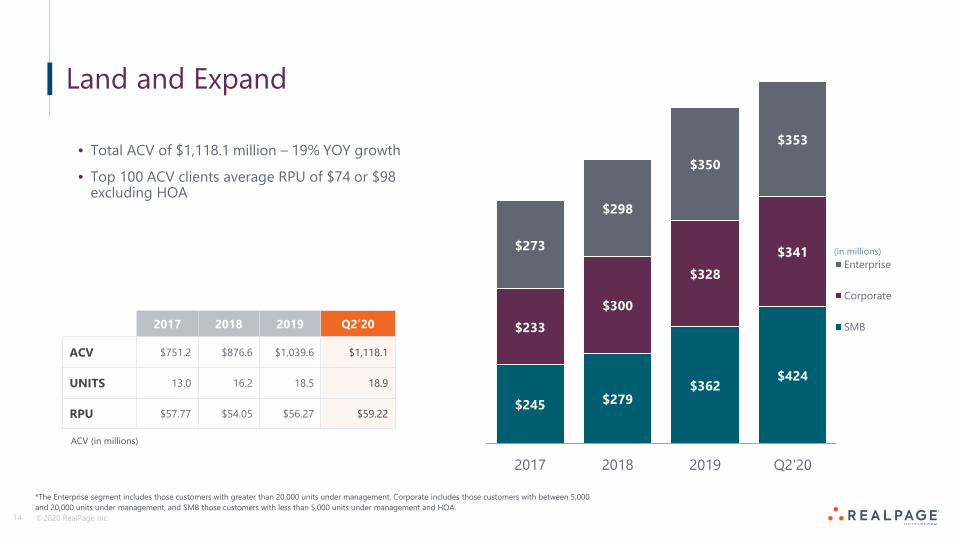
Land and Expand
• Total ACV of $1,118.1 million – 19% YOY growth
• Top 100 ACV clients average RPU of $74 or $98 excluding HOA
2017 2018 2019 Q2’20
ACV $751.2 $876.6 $1,039.6 $1,118.1
UNITS 13.0 16.2 18.5 18.9
RPU $57.77 $54.05 $56.27 $59.22$245 $279
$362$424
$233$300
$328$341$273
$298
$350
$353
2017 2018 2019 Q2'20
Enterprise
Corporate
SMB
(in millions)
ACV (in millions)
*The Enterprise segment includes those customers with greater than 20,000 units under management, Corporate includes those customers with between 5,000 and 20,000 units under management, and SMB those customers with less than 5,000 units under management and HOA.
©2020 RealPage Inc.15
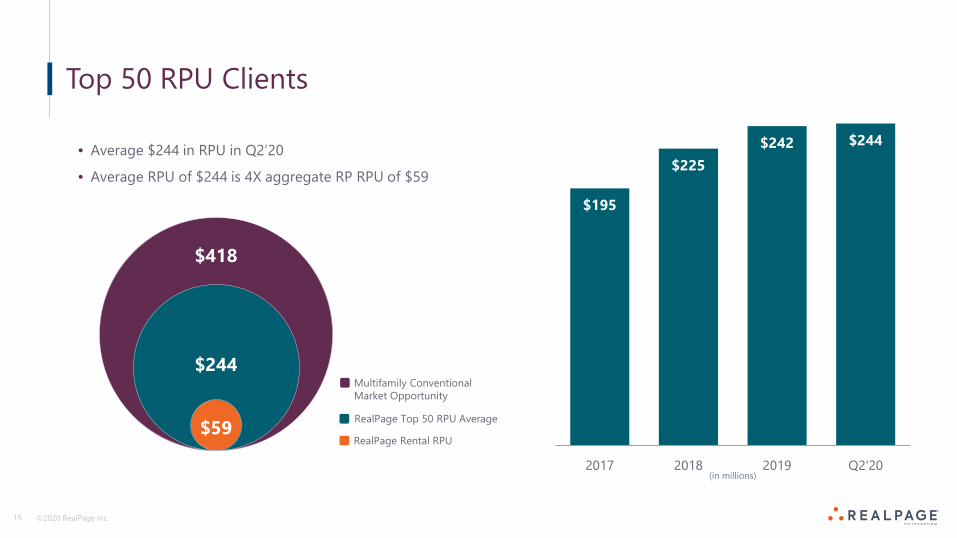
Top 50 RPU Clients
• Average $244 in RPU in Q2’20
• Average RPU of $244 is 4X aggregate RP RPU of $59
RealPage Rental RPU
RealPage Top 50 RPU Average
Multifamily ConventionalMarket Opportunity
$59
$244
$418
$195
$225$242 $244
2017 2018 2019 Q2'20(in millions)
©2020 RealPage Inc.16
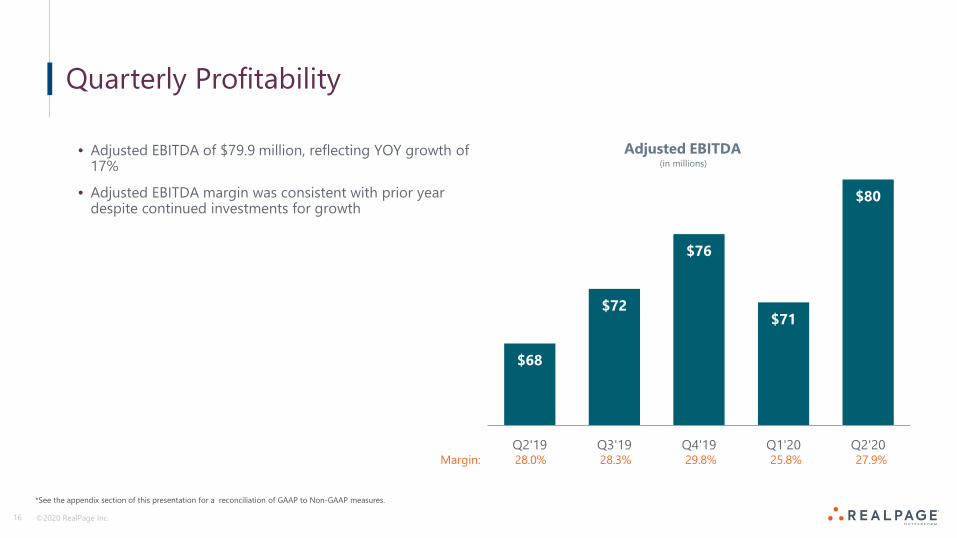
Quarterly Profitability
• Adjusted EBITDA of $79.9 million, reflecting YOY growth of 17%
• Adjusted EBITDA margin was consistent with prior year despite continued investments for growth
$68
$72
$76
$71
$80
Q2'19 Q3'19 Q4'19 Q1'20 Q2'20Margin: 28.0% 28.3% 29.8% 25.8% 27.9%
Adjusted EBITDA
*See the appendix section of this presentation for a reconciliation of GAAP to Non-GAAP measures.
(in millions)
©2020 RealPage Inc.17
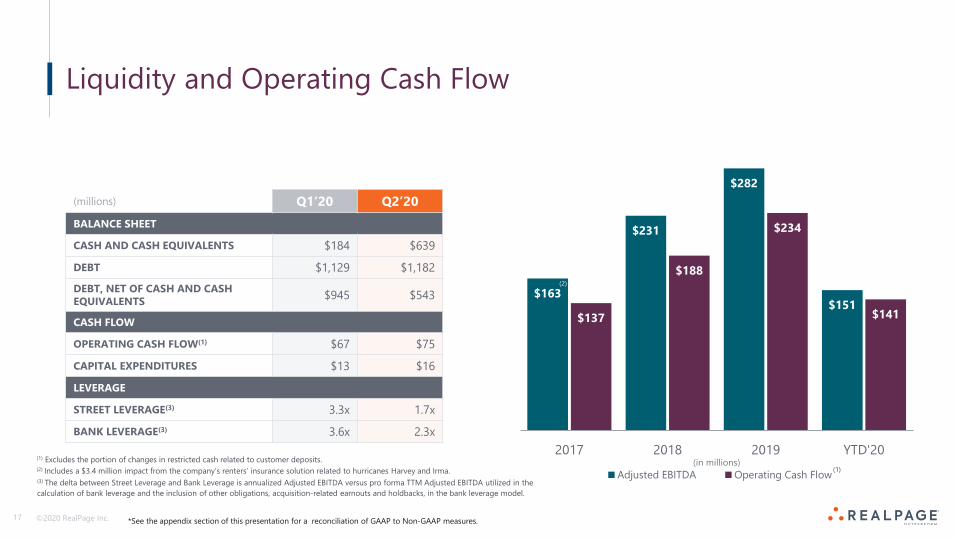
Liquidity and Operating Cash Flow
(1) Excludes the portion of changes in restricted cash related to customer deposits.(2) Includes a $3.4 million impact from the company’s renters’ insurance solution related to hurricanes Harvey and Irma. (3) The delta between Street Leverage and Bank Leverage is annualized Adjusted EBITDA versus pro forma TTM Adjusted EBITDA utilized in the calculation of bank leverage and the inclusion of other obligations, acquisition-related earnouts and holdbacks, in the bank leverage model.
$163
$231
$282
$151 $137
$188
$234
$141
2017 2018 2019 YTD'20
Adjusted EBITDA Operating Cash Flow
*See the appendix section of this presentation for a reconciliation of GAAP to Non-GAAP measures.
(millions) Q1‘20 Q2’20BALANCE SHEET
CASH AND CASH EQUIVALENTS $184 $639
DEBT $1,129 $1,182DEBT, NET OF CASH AND CASH EQUIVALENTS $945 $543
CASH FLOW
OPERATING CASH FLOW(1) $67 $75
CAPITAL EXPENDITURES $13 $16
LEVERAGE
STREET LEVERAGE(3) 3.3x 1.7x
BANK LEVERAGE(3) 3.6x 2.3x
(2)
(1)(in millions)
©2020 RealPage Inc.18 ©2020 RealPage Inc.18
Q3 and FY 2020 Expectations
• Q3’20 Non-GAAP total revenue of $288 million to $294 million
• Q3’20 Adjusted EBITDA of $74 million to $78 million
• Q3’20 Non-GAAP diluted EPS of $0.43 to $0.46
• FY’20 Non-GAAP total revenue of $1,135 million to $1,155 million
• FY’20 Adjusted EBITDA of $300 million to $308 million
• FY’20 Non-GAAP diluted EPS of $1.77 to $1.84
*See the appendix section of this presentation for a reconciliation of GAAP to Non-GAAP measures.

Appendix
©2020 RealPage Inc.20
Reconciliation of Non-GAAP Financial Measures to Comparable GAAP Measures
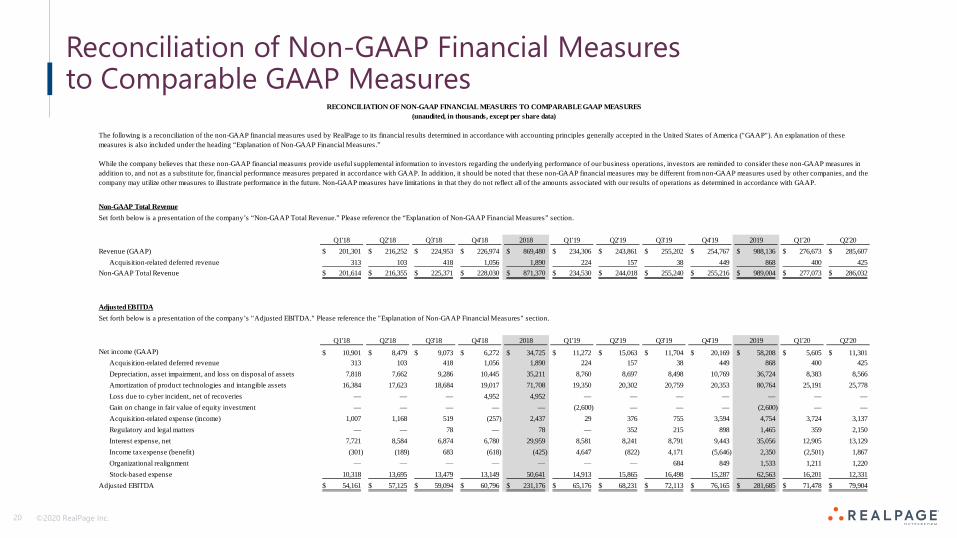
Non-GAAP Total RevenueSet forth below is a presentation of the company’s “Non-GAAP Total Revenue.” Please reference the “Explanation of Non-GAAP Financial Measures” section.
Q1'18 Q2'18 Q3'18 Q4'18 2018 Q1'19 Q2'19 Q3'19 Q4'19 2019 Q1'20 Q2'20Revenue (GAAP) 201,301$ 216,252$ 224,953$ 226,974$ 869,480$ 234,306$ 243,861$ 255,202$ 254,767$ 988,136$ 276,673$ 285,607$
Acquisition-related deferred revenue 313 103 418 1,056 1,890 224 157 38 449 868 400 425 Non-GAAP Total Revenue 201,614$ 216,355$ 225,371$ 228,030$ 871,370$ 234,530$ 244,018$ 255,240$ 255,216$ 989,004$ 277,073$ 286,032$
Adjusted EBITDASet forth below is a presentation of the company’s "Adjusted EBITDA." Please reference the "Explanation of Non-GAAP Financial Measures" section.
Q1'18 Q2'18 Q3'18 Q4'18 2018 Q1'19 Q2'19 Q3'19 Q4'19 2019 Q1'20 Q2'20Net income (GAAP) 10,901$ 8,479$ 9,073$ 6,272$ 34,725$ 11,272$ 15,063$ 11,704$ 20,169$ 58,208$ 5,605$ 11,301$
Acquisition-related deferred revenue 313 103 418 1,056 1,890 224 157 38 449 868 400 425 Depreciation, asset impairment, and loss on disposal of assets 7,818 7,662 9,286 10,445 35,211 8,760 8,697 8,498 10,769 36,724 8,383 8,566 Amortization of product technologies and intangible assets 16,384 17,623 18,684 19,017 71,708 19,350 20,302 20,759 20,353 80,764 25,191 25,778 Loss due to cyber incident, net of recoveries — — — 4,952 4,952 — — — — — — — Gain on change in fair value of equity investment — — — — — (2,600) — — — (2,600) — — Acquisition-related expense (income) 1,007 1,168 519 (257) 2,437 29 376 755 3,594 4,754 3,724 3,137 Regulatory and legal matters — — 78 — 78 — 352 215 898 1,465 359 2,150 Interest expense, net 7,721 8,584 6,874 6,780 29,959 8,581 8,241 8,791 9,443 35,056 12,905 13,129 Income tax expense (benefit) (301) (189) 683 (618) (425) 4,647 (822) 4,171 (5,646) 2,350 (2,501) 1,867 Organizational realignment — — — — — — — 684 849 1,533 1,211 1,220 Stock-based expense 10,318 13,695 13,479 13,149 50,641 14,913 15,865 16,498 15,287 62,563 16,201 12,331
Adjusted EBITDA 54,161$ 57,125$ 59,094$ 60,796$ 231,176$ 65,176$ 68,231$ 72,113$ 76,165$ 281,685$ 71,478$ 79,904$
The following is a reconciliation of the non-GAAP financial measures used by RealPage to its financial results determined in accordance with accounting principles generally accepted in the United States of America ("GAAP"). An explanation of these measures is also included under the heading “Explanation of Non-GAAP Financial Measures.”
While the company believes that these non-GAAP financial measures provide useful supplemental information to investors regarding the underlying performance of our business operations, investors are reminded to consider these non-GAAP measures in addition to, and not as a substitute for, financial performance measures prepared in accordance with GAAP. In addition, it should be noted that these non-GAAP financial measures may be different from non-GAAP measures used by other companies, and the company may utilize other measures to illustrate performance in the future. Non-GAAP measures have limitations in that they do not reflect all of the amounts associated with our results of operations as determined in accordance with GAAP.
RECONCILIATION OF NON-GAAP FINANCIAL MEASURES TO COMPARABLE GAAP MEASURES(unaudited, in thousands, except per share data)
©2020 RealPage Inc.21
Reconciliation of Non-GAAP Financial Measures to Comparable GAAP Measures
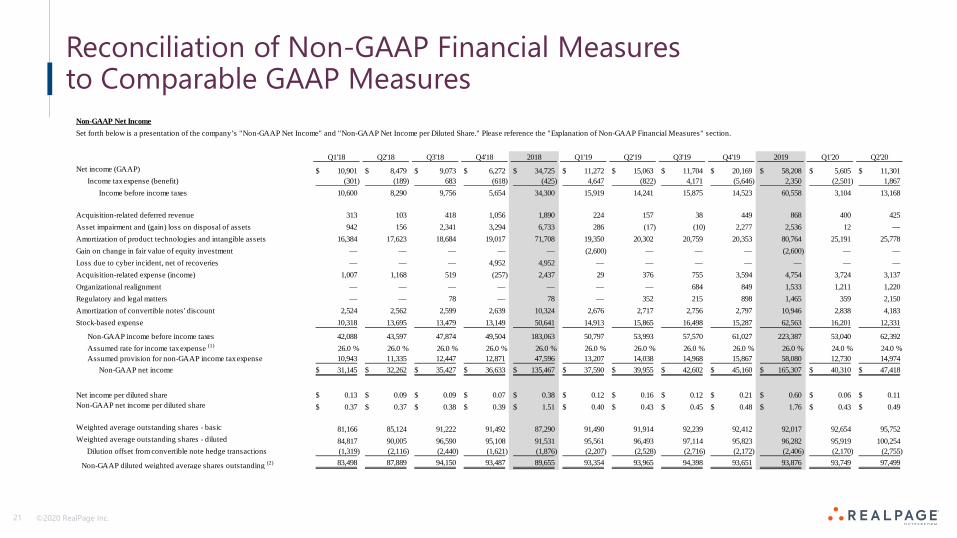
Non-GAAP Net IncomeSet forth below is a presentation of the company’s "Non-GAAP Net Income" and "Non-GAAP Net Income per Diluted Share." Please reference the "Explanation of Non-GAAP Financial Measures" section.
Q1'18 Q2'18 Q3'18 Q4'18 2018 Q1'19 Q2'19 Q3'19 Q4'19 2019 Q1'20 Q2'20Net income (GAAP) 10,901$ 8,479$ 9,073$ 6,272$ 34,725$ 11,272$ 15,063$ 11,704$ 20,169$ 58,208$ 5,605$ 11,301$
Income tax expense (benefit) (301) (189) 683 (618) (425) 4,647 (822) 4,171 (5,646) 2,350 (2,501) 1,867 Income before income taxes 10,600 8,290 9,756 5,654 34,300 15,919 14,241 15,875 14,523 60,558 3,104 13,168
Acquisition-related deferred revenue 313 103 418 1,056 1,890 224 157 38 449 868 400 425 Asset impairment and (gain) loss on disposal of assets 942 156 2,341 3,294 6,733 286 (17) (10) 2,277 2,536 12 — Amortization of product technologies and intangible assets 16,384 17,623 18,684 19,017 71,708 19,350 20,302 20,759 20,353 80,764 25,191 25,778 Gain on change in fair value of equity investment — — — — — (2,600) — — — (2,600) — — Loss due to cyber incident, net of recoveries — — — 4,952 4,952 — — — — — — — Acquisition-related expense (income) 1,007 1,168 519 (257) 2,437 29 376 755 3,594 4,754 3,724 3,137 Organizational realignment — — — — — — — 684 849 1,533 1,211 1,220 Regulatory and legal matters — — 78 — 78 — 352 215 898 1,465 359 2,150 Amortization of convertible notes' discount 2,524 2,562 2,599 2,639 10,324 2,676 2,717 2,756 2,797 10,946 2,838 4,183 Stock-based expense 10,318 13,695 13,479 13,149 50,641 14,913 15,865 16,498 15,287 62,563 16,201 12,331
Non-GAAP income before income taxes 42,088 43,597 47,874 49,504 183,063 50,797 53,993 57,570 61,027 223,387 53,040 62,392 Assumed rate for income tax expense (1) 26.0 % 26.0 % 26.0 % 26.0 % 26.0 % 26.0 % 26.0 % 26.0 % 26.0 % 26.0 % 24.0 % 24.0 %Assumed provision for non-GAAP income tax expense 10,943 11,335 12,447 12,871 47,596 13,207 14,038 14,968 15,867 58,080 12,730 14,974
Non-GAAP net income 31,145$ 32,262$ 35,427$ 36,633$ 135,467$ 37,590$ 39,955$ 42,602$ 45,160$ 165,307$ 40,310$ 47,418$
Net income per diluted share 0.13$ 0.09$ 0.09$ 0.07$ 0.38$ 0.12$ 0.16$ 0.12$ 0.21$ 0.60$ 0.06$ 0.11$ Non-GAAP net income per diluted share 0.37$ 0.37$ 0.38$ 0.39$ 1.51$ 0.40$ 0.43$ 0.45$ 0.48$ 1.76$ 0.43$ 0.49$
Weighted average outstanding shares - basic 81,166 85,124 91,222 91,492 87,290 91,490 91,914 92,239 92,412 92,017 92,654 95,752 Weighted average outstanding shares - diluted 84,817 90,005 96,590 95,108 91,531 95,561 96,493 97,114 95,823 96,282 95,919 100,254
Dilution offset from convertible note hedge transactions (1,319) (2,116) (2,440) (1,621) (1,876) (2,207) (2,528) (2,716) (2,172) (2,406) (2,170) (2,755)
Non-GAAP diluted weighted average shares outstanding (2) 83,498 87,889 94,150 93,487 89,655 93,354 93,965 94,398 93,651 93,876 93,749 97,499
©2020 RealPage Inc.22
Reconciliation of Non-GAAP Financial Measures to Comparable GAAP Measures
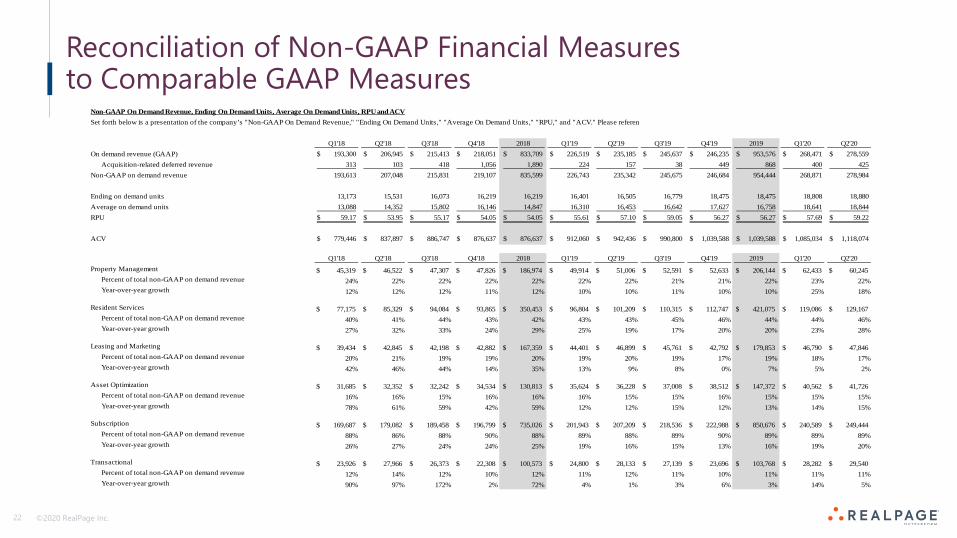
Non-GAAP On Demand Revenue, Ending On Demand Units, Average On Demand Units, RPU and ACV
Q1'18 Q2'18 Q3'18 Q4'18 2018 Q1'19 Q2'19 Q3'19 Q4'19 2019 Q1'20 Q2'20On demand revenue (GAAP) 193,300$ 206,945$ 215,413$ 218,051$ 833,709$ 226,519$ 235,185$ 245,637$ 246,235$ 953,576$ 268,471$ 278,559$
Acquisition-related deferred revenue 313 103 418 1,056 1,890 224 157 38 449 868 400 425 Non-GAAP on demand revenue 193,613 207,048 215,831 219,107 835,599 226,743 235,342 245,675 246,684 954,444 268,871 278,984
Ending on demand units 13,173 15,531 16,073 16,219 16,219 16,401 16,505 16,779 18,475 18,475 18,808 18,880Average on demand units 13,088 14,352 15,802 16,146 14,847 16,310 16,453 16,642 17,627 16,758 18,641 18,844 RPU 59.17$ 53.95$ 55.17$ 54.05$ 54.05$ 55.61$ 57.10$ 59.05$ 56.27$ 56.27$ 57.69$ 59.22$
ACV 779,446$ 837,897$ 886,747$ 876,637$ 876,637$ 912,060$ 942,436$ 990,800$ 1,039,588$ 1,039,588$ 1,085,034$ 1,118,074$
Q1'18 Q2'18 Q3'18 Q4'18 2018 Q1'19 Q2'19 Q3'19 Q4'19 2019 Q1'20 Q2'20Property Management $ 45,319 $ 46,522 $ 47,307 $ 47,826 $ 186,974 $ 49,914 $ 51,006 $ 52,591 $ 52,633 $ 206,144 $ 62,433 $ 60,245
Percent of total non-GAAP on demand revenue 24% 22% 22% 22% 22% 22% 22% 21% 21% 22% 23% 22%Year-over-year growth 12% 12% 12% 11% 12% 10% 10% 11% 10% 10% 25% 18%
Resident Services $ 77,175 $ 85,329 $ 94,084 $ 93,865 $ 350,453 $ 96,804 $ 101,209 $ 110,315 $ 112,747 $ 421,075 $ 119,086 $ 129,167 Percent of total non-GAAP on demand revenue 40% 41% 44% 43% 42% 43% 43% 45% 46% 44% 44% 46%Year-over-year growth 27% 32% 33% 24% 29% 25% 19% 17% 20% 20% 23% 28%
Leasing and Marketing $ 39,434 $ 42,845 $ 42,198 $ 42,882 $ 167,359 $ 44,401 $ 46,899 $ 45,761 $ 42,792 $ 179,853 $ 46,790 $ 47,846 Percent of total non-GAAP on demand revenue 20% 21% 19% 19% 20% 19% 20% 19% 17% 19% 18% 17%Year-over-year growth 42% 46% 44% 14% 35% 13% 9% 8% 0% 7% 5% 2%
Asset Optimization $ 31,685 $ 32,352 $ 32,242 $ 34,534 $ 130,813 $ 35,624 $ 36,228 $ 37,008 $ 38,512 $ 147,372 $ 40,562 $ 41,726 Percent of total non-GAAP on demand revenue 16% 16% 15% 16% 16% 16% 15% 15% 16% 15% 15% 15%Year-over-year growth 78% 61% 59% 42% 59% 12% 12% 15% 12% 13% 14% 15%
Subscription $ 169,687 $ 179,082 $ 189,458 $ 196,799 $ 735,026 $ 201,943 $ 207,209 $ 218,536 $ 222,988 $ 850,676 $ 240,589 $ 249,444 Percent of total non-GAAP on demand revenue 88% 86% 88% 90% 88% 89% 88% 89% 90% 89% 89% 89%Year-over-year growth 26% 27% 24% 24% 25% 19% 16% 15% 13% 16% 19% 20%
Transactional $ 23,926 $ 27,966 $ 26,373 $ 22,308 $ 100,573 $ 24,800 $ 28,133 $ 27,139 $ 23,696 $ 103,768 $ 28,282 $ 29,540 Percent of total non-GAAP on demand revenue 12% 14% 12% 10% 12% 11% 12% 11% 10% 11% 11% 11%Year-over-year growth 90% 97% 172% 2% 72% 4% 1% 3% 6% 3% 14% 5%
Set forth below is a presentation of the company’s "Non-GAAP On Demand Revenue," "Ending On Demand Units," "Average On Demand Units," "RPU," and "ACV." Please referen
©2020 RealPage Inc.23
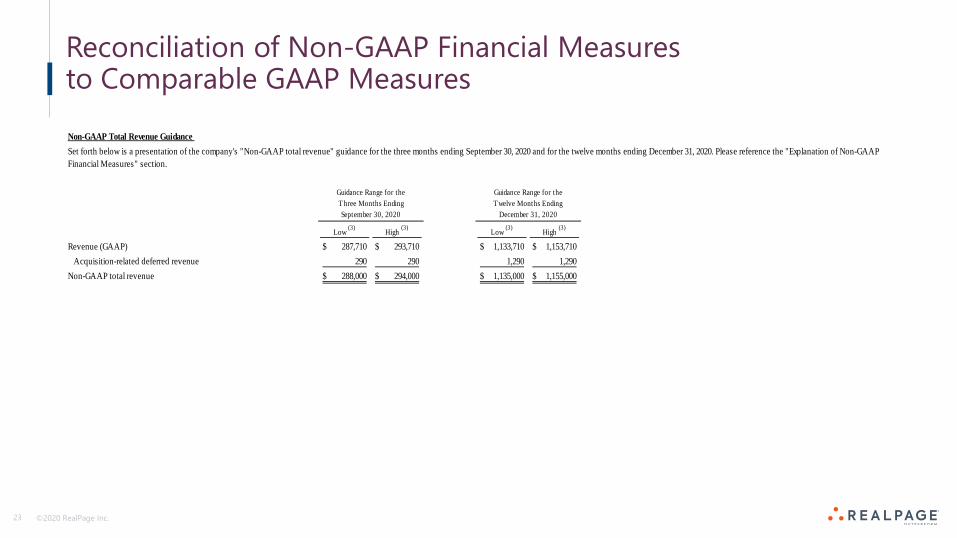
Reconciliation of Non-GAAP Financial Measures to Comparable GAAP MeasuresNon-GAAP Total Revenue Guidance
Low (3) High (3) Low (3) High (3)
Revenue (GAAP) 287,710$ 293,710$ 1,133,710$ 1,153,710$ Acquisition-related deferred revenue 290 290 1,290 1,290
Non-GAAP total revenue 288,000$ 294,000$ 1,135,000$ 1,155,000$
Guidance Range for theThree Months Ending
Guidance Range for theTwelve Months Ending
Set forth below is a presentation of the company's "Non-GAAP total revenue" guidance for the three months ending September 30, 2020 and for the twelve months ending December 31, 2020. Please reference the "Explanation of Non-GAAP Financial Measures" section.
September 30, 2020 December 31, 2020
©2020 RealPage Inc.24
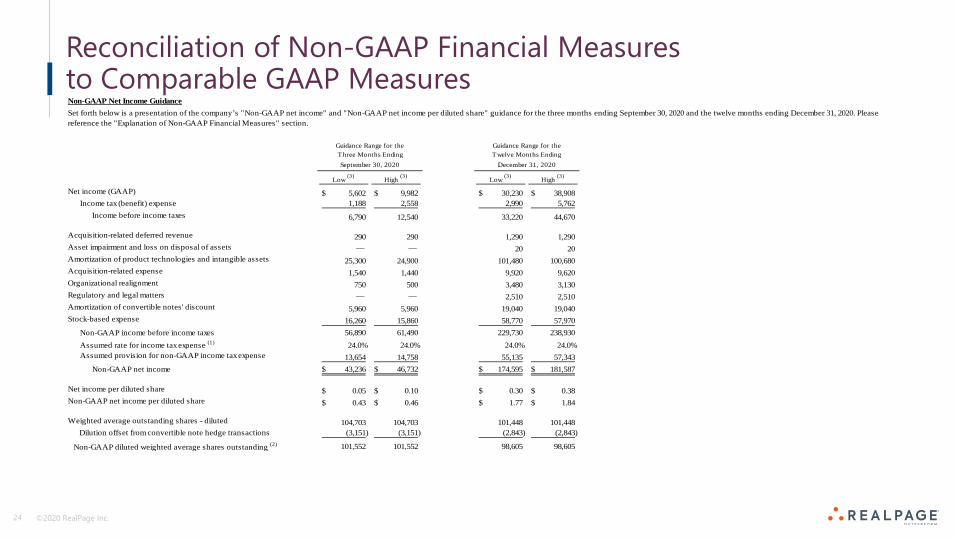
Reconciliation of Non-GAAP Financial Measures to Comparable GAAP MeasuresNon-GAAP Net Income Guidance
Low (3) High (3) Low (3) High (3)
Net income (GAAP) 5,602$ 9,982$ 30,230$ 38,908$ Income tax (benefit) expense 1,188 2,558 2,990 5,762
Income before income taxes 6,790 12,540 33,220 44,670
Acquisition-related deferred revenue 290 290 1,290 1,290 Asset impairment and loss on disposal of assets — — 20 20 Amortization of product technologies and intangible assets 25,300 24,900 101,480 100,680 Acquisition-related expense 1,540 1,440 9,920 9,620 Organizational realignment 750 500 3,480 3,130 Regulatory and legal matters — — 2,510 2,510 Amortization of convertible notes' discount 5,960 5,960 19,040 19,040 Stock-based expense 16,260 15,860 58,770 57,970
Non-GAAP income before income taxes 56,890 61,490 229,730 238,930 Assumed rate for income tax expense (1) 24.0% 24.0% 24.0% 24.0%Assumed provision for non-GAAP income tax expense 13,654 14,758 55,135 57,343
Non-GAAP net income 43,236$ 46,732$ 174,595$ 181,587$
Net income per diluted share 0.05$ 0.10$ 0.30$ 0.38$ Non-GAAP net income per diluted share 0.43$ 0.46$ 1.77$ 1.84$
Weighted average outstanding shares - diluted 104,703 104,703 101,448 101,448 Dilution offset from convertible note hedge transactions (3,151) (3,151) (2,843) (2,843)
Non-GAAP diluted weighted average shares outstanding (2) 101,552 101,552 98,605 98,605
Guidance Range for theThree Months Ending
Guidance Range for theTwelve Months Ending
September 30, 2020 December 31, 2020
Set forth below is a presentation of the company’s "Non-GAAP net income" and "Non-GAAP net income per diluted share" guidance for the three months ending September 30, 2020 and the twelve months ending December 31, 2020. Please reference the "Explanation of Non-GAAP Financial Measures" section.
©2020 RealPage Inc.25
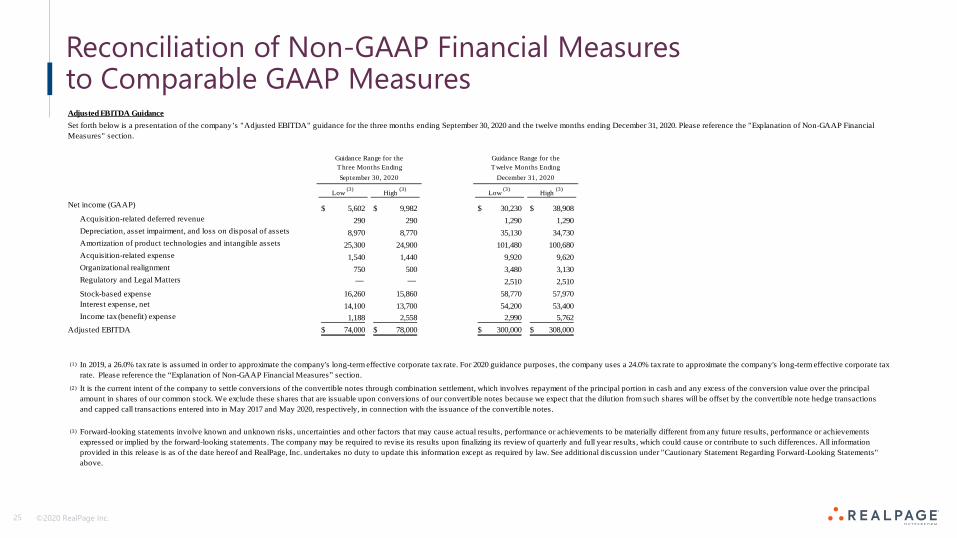
Reconciliation of Non-GAAP Financial Measures to Comparable GAAP MeasuresAdjusted EBITDA Guidance
Low (3) High (3) Low (3) High (3)
Net income (GAAP) 5,602$ 9,982$ 30,230$ 38,908$ Acquisition-related deferred revenue 290 290 1,290 1,290 Depreciation, asset impairment, and loss on disposal of assets 8,970 8,770 35,130 34,730 Amortization of product technologies and intangible assets 25,300 24,900 101,480 100,680 Acquisition-related expense 1,540 1,440 9,920 9,620 Organizational realignment 750 500 3,480 3,130 Regulatory and Legal Matters — — 2,510 2,510 Stock-based expense 16,260 15,860 58,770 57,970 Interest expense, net 14,100 13,700 54,200 53,400 Income tax (benefit) expense 1,188 2,558 2,990 5,762
Adjusted EBITDA 74,000$ 78,000$ 300,000$ 308,000$
(1)
(2)
(3)
Set forth below is a presentation of the company’s "Adjusted EBITDA" guidance for the three months ending September 30, 2020 and the twelve months ending December 31, 2020. Please reference the "Explanation of Non-GAAP Financial Measures" section.
In 2019, a 26.0% tax rate is assumed in order to approximate the company's long-term effective corporate tax rate. For 2020 guidance purposes, the company uses a 24.0% tax rate to approximate the company's long-term effective corporate tax rate. Please reference the “Explanation of Non-GAAP Financial Measures” section.
It is the current intent of the company to settle conversions of the convertible notes through combination settlement, which involves repayment of the principal portion in cash and any excess of the conversion value over the principal amount in shares of our common stock. We exclude these shares that are issuable upon conversions of our convertible notes because we expect that the dilution from such shares will be offset by the convertible note hedge transactions and capped call transactions entered into in May 2017 and May 2020, respectively, in connection with the issuance of the convertible notes.
Forward-looking statements involve known and unknown risks, uncertainties and other factors that may cause actual results, performance or achievements to be materially different from any future results, performance or achievements expressed or implied by the forward-looking statements. The company may be required to revise its results upon finalizing its review of quarterly and full year results, which could cause or contribute to such differences. All information provided in this release is as of the date hereof and RealPage, Inc. undertakes no duty to update this information except as required by law. See additional discussion under "Cautionary Statement Regarding Forward-Looking Statements" above.
Guidance Range for theThree Months Ending
Guidance Range for theTwelve Months Ending
September 30, 2020 December 31, 2020
©2020 RealPage Inc.26
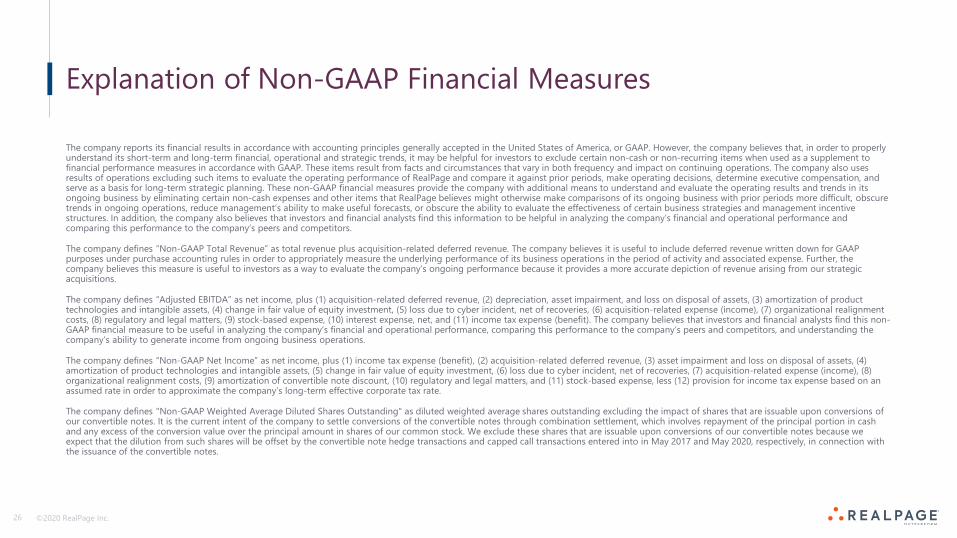
Explanation of Non-GAAP Financial Measures
The company reports its financial results in accordance with accounting principles generally accepted in the United States of America, or GAAP. However, the company believes that, in order to properly understand its short-term and long-term financial, operational and strategic trends, it may be helpful for investors to exclude certain non-cash or non-recurring items when used as a supplement to financial performance measures in accordance with GAAP. These items result from facts and circumstances that vary in both frequency and impact on continuing operations. The company also uses results of operations excluding such items to evaluate the operating performance of RealPage and compare it against prior periods, make operating decisions, determine executive compensation, and serve as a basis for long-term strategic planning. These non-GAAP financial measures provide the company with additional means to understand and evaluate the operating results and trends in its ongoing business by eliminating certain non-cash expenses and other items that RealPage believes might otherwise make comparisons of its ongoing business with prior periods more difficult, obscure trends in ongoing operations, reduce management’s ability to make useful forecasts, or obscure the ability to evaluate the effectiveness of certain business strategies and management incentive structures. In addition, the company also believes that investors and financial analysts find this information to be helpful in analyzing the company’s financial and operational performance and comparing this performance to the company’s peers and competitors.
The company defines “Non-GAAP Total Revenue” as total revenue plus acquisition-related deferred revenue. The company believes it is useful to include deferred revenue written down for GAAP purposes under purchase accounting rules in order to appropriately measure the underlying performance of its business operations in the period of activity and associated expense. Further, the company believes this measure is useful to investors as a way to evaluate the company’s ongoing performance because it provides a more accurate depiction of revenue arising from our strategic acquisitions.
The company defines “Adjusted EBITDA” as net income, plus (1) acquisition-related deferred revenue, (2) depreciation, asset impairment, and loss on disposal of assets, (3) amortization of product technologies and intangible assets, (4) change in fair value of equity investment, (5) loss due to cyber incident, net of recoveries, (6) acquisition-related expense (income), (7) organizational realignment costs, (8) regulatory and legal matters, (9) stock-based expense, (10) interest expense, net, and (11) income tax expense (benefit). The company believes that investors and financial analysts find this non-GAAP financial measure to be useful in analyzing the company’s financial and operational performance, comparing this performance to the company’s peers and competitors, and understanding the company’s ability to generate income from ongoing business operations.
The company defines “Non-GAAP Net Income” as net income, plus (1) income tax expense (benefit), (2) acquisition-related deferred revenue, (3) asset impairment and loss on disposal of assets, (4) amortization of product technologies and intangible assets, (5) change in fair value of equity investment, (6) loss due to cyber incident, net of recoveries, (7) acquisition-related expense (income), (8) organizational realignment costs, (9) amortization of convertible note discount, (10) regulatory and legal matters, and (11) stock-based expense, less (12) provision for income tax expense based on an assumed rate in order to approximate the company’s long-term effective corporate tax rate.
The company defines "Non-GAAP Weighted Average Diluted Shares Outstanding" as diluted weighted average shares outstanding excluding the impact of shares that are issuable upon conversions of our convertible notes. It is the current intent of the company to settle conversions of the convertible notes through combination settlement, which involves repayment of the principal portion in cash and any excess of the conversion value over the principal amount in shares of our common stock. We exclude these shares that are issuable upon conversions of our convertible notes because we expect that the dilution from such shares will be offset by the convertible note hedge transactions and capped call transactions entered into in May 2017 and May 2020, respectively, in connection with the issuance of the convertible notes.
©2020 RealPage Inc.27
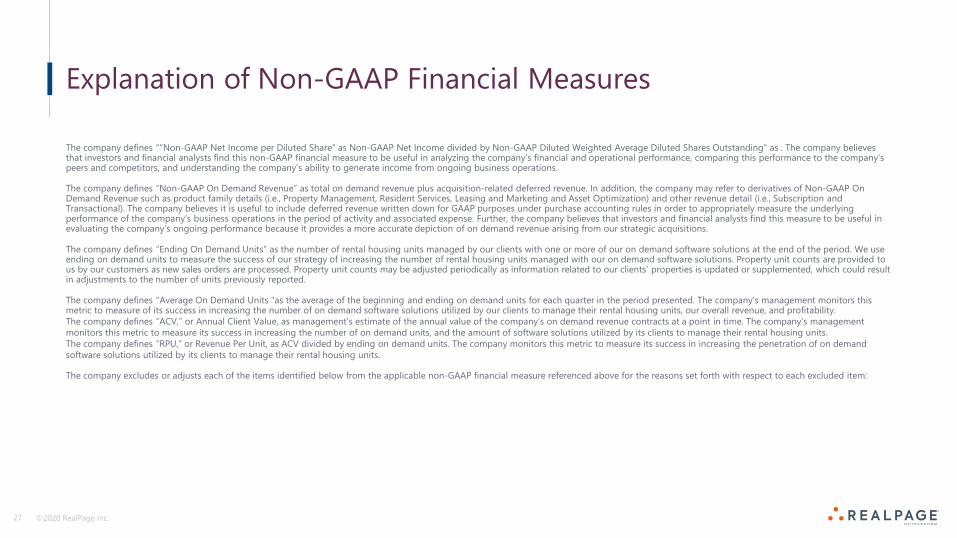
Explanation of Non-GAAP Financial Measures
The company defines "“Non-GAAP Net Income per Diluted Share” as Non-GAAP Net Income divided by Non-GAAP Diluted Weighted Average Diluted Shares Outstanding" as . The company believes that investors and financial analysts find this non-GAAP financial measure to be useful in analyzing the company’s financial and operational performance, comparing this performance to the company’s peers and competitors, and understanding the company’s ability to generate income from ongoing business operations.
The company defines “Non-GAAP On Demand Revenue” as total on demand revenue plus acquisition-related deferred revenue. In addition, the company may refer to derivatives of Non-GAAP On Demand Revenue such as product family details (i.e., Property Management, Resident Services, Leasing and Marketing and Asset Optimization) and other revenue detail (i.e., Subscription and Transactional). The company believes it is useful to include deferred revenue written down for GAAP purposes under purchase accounting rules in order to appropriately measure the underlying performance of the company’s business operations in the period of activity and associated expense. Further, the company believes that investors and financial analysts find this measure to be useful in evaluating the company’s ongoing performance because it provides a more accurate depiction of on demand revenue arising from our strategic acquisitions.
The company defines “Ending On Demand Units” as the number of rental housing units managed by our clients with one or more of our on demand software solutions at the end of the period. We use ending on demand units to measure the success of our strategy of increasing the number of rental housing units managed with our on demand software solutions. Property unit counts are provided to us by our customers as new sales orders are processed. Property unit counts may be adjusted periodically as information related to our clients’ properties is updated or supplemented, which could result in adjustments to the number of units previously reported.
The company defines "Average On Demand Units "as the average of the beginning and ending on demand units for each quarter in the period presented. The company's management monitors this metric to measure of its success in increasing the number of on demand software solutions utilized by our clients to manage their rental housing units, our overall revenue, and profitability.The company defines “ACV,” or Annual Client Value, as management’s estimate of the annual value of the company’s on demand revenue contracts at a point in time. The company’s management monitors this metric to measure its success in increasing the number of on demand units, and the amount of software solutions utilized by its clients to manage their rental housing units.The company defines “RPU,” or Revenue Per Unit, as ACV divided by ending on demand units. The company monitors this metric to measure its success in increasing the penetration of on demand software solutions utilized by its clients to manage their rental housing units.
The company excludes or adjusts each of the items identified below from the applicable non-GAAP financial measure referenced above for the reasons set forth with respect to each excluded item:
©2020 RealPage Inc.28
Explanation of Non-GAAP Financial Measures
Non-GAAP tax rate – The GAAP tax rate includes certain tax items which may include, but are not limited to: income tax expenses or benefits that are not related to ongoing business operations in the current year; unusual or infrequently occurring items; benefits from stock compensation deductions for tax purposes that exceed the stock compensation expense recognized for GAAP; tax adjustments associated with fluctuations in foreign currency re-measurement; certain changes in estimates of tax matters related to prior fiscal years; certain changes in the realizability of deferred tax assets and liabilities; and changes in tax law. The non-GAAP tax rate excludes the tax effect of these items. We believe excluding these items assists investors and analysts in understanding the tax provision and the effective tax rate related to non-GAAP operations. In 2019, the company used a non-GAAP tax rate of approximately 26% to approximate the company’s long-term effective corporate tax rate. During 2019, the company availed itself of research and development tax credits for both federal and state and other state tax credits that will impact its long-term effective tax rate in future periods. For 2020 guidance purposes, the company uses a non-GAAP tax rate of 24% to more align with the expected impact of the credits and other anticipated impacts of US tax reform as rules are clarified by the US Treasury and foreign jurisdictional changes that impact the company’s tax portfolio globally. This non-GAAP tax rate will be reviewed annually to determine whether it remains appropriate in consideration of the company’s operating environment, changes in tax legislation, jurisdictional mix of earnings, and other factors deemed appropriate and necessary.
Acquisition-related deferred revenue – This item is included to reflect deferred revenue written down for GAAP purposes under purchase accounting rules in order to appropriately measure the underlying performance of the company's business operations in the period of activity and associated expense.
Asset impairment and (gain) loss on disposal of assets – This item comprises gains and/or losses on the disposal and impairment of long-lived assets and impairment of intangible assets, which are not reflective of the company's ongoing operations. We believe exclusion of this item facilitates a more accurate comparison of the company's results of operations between periods.
Depreciation of long-lived assets – Long-lived assets are depreciated over their estimated useful lives in a manner reflecting the pattern in which the economic benefit is consumed. Management is limited in its ability to change or influence these charges after the asset has been acquired and placed in service. We do not believe that depreciation expense accurately reflects the performance of our ongoing operations for the period in which the charges are incurred and is therefore not considered by management in making operating decisions.
Amortization of product technologies and intangible assets – Intangible assets are amortized over their estimated useful lives and generally cannot be changed or influenced by the company after initial capitalization. Accordingly, this item is not considered by the company in making operating decisions. The company does not believe such charges accurately reflect the performance of its ongoing operations for the period in which such charges are incurred.
Change in fair value of equity investment – This item represents changes in fair value of our equity investment based on observable price changes in orderly transactions for an identical or similar investment of the same issuer. We believe exclusion of these costs facilitates a more accurate comparison of our results of operations between periods as these items are not reflective of our ongoing operations.
Loss due to cyber incident, net of recoveries – This item relates to losses, net of recoveries, associated with the targeted email phishing campaign which led to a diversion of funds intended for disbursement to three clients in the second quarter of 2018. The company believes this loss is not reflective of its ongoing operations and its exclusion is useful as it allows investors and financial analysts to evaluate our performance for different periods on a more comparable basis.
©2020 RealPage Inc.29
Explanation of Non-GAAP Financial Measures
Acquisition-related expense (income) – This item consists of direct costs incurred in our business acquisition transactions and expenses related to integration activities, and the impact of changes in the fair value of acquisition-related contingent consideration obligations. Examples of these direct costs include transaction fees, due diligence costs, acquisition retention bonuses and severance, and third-party consultants to assist with integration. We believe exclusion of this item facilitates a more accurate comparison of the results of the company’s ongoing operations across periods and eliminates volatility related to changes in the fair value of acquisition-related contingent consideration obligations.
Amortization of the convertible notes’ discount – This item consists of non-cash interest expense related to the amortization of the discount recognized on the convertible notes issued in May 2017 and May 2020. Management excludes this item as it is not indicative of the company’s ongoing operating performance.
Organizational realignment – This item consists of direct costs associated with the alignment of our business strategies. In connection with these actions, we recognize costs related to termination benefits, exit costs associated with closure of facilities, certain asset impairments, cancellation of certain contracts, and other professional and consulting fees associated with these initiatives. We believe exclusion of this item facilitates a more accurate comparison of our ongoing results of operations between periods.
Regulatory and legal matters – This item is comprised of certain regulatory and similar costs and certain legal settlement costs, such as costs related to the company’s Hart-Scott-Rodino Antitrust Improvements Act review process incurred in connection with our acquisitions or the settlement of certain legal matters. These costs are excluded as they are irregular in timing and scope, and may not be indicative of our past and future performance. We believe exclusion of this item facilitates a more accurate comparison of the company’s results of operations between periods.
Stock-based expense – This item is excluded because these are non-cash expenditures that the company does not consider part of ongoing operating results when assessing the performance of our business, and also because the total amount of the expenditure is partially outside of its control because it is based on factors such as stock price, volatility, and interest rates, which may be unrelated to the company’s performance during the period in which the expenses are incurred.