Embed Size (px)
Citation preview
Research ArticleA Low-Cost Vehicle Anti-Theft System UsingObsolete Smartphone
Bang Liu 1 Nianbo Liu 1 Guihai Chen2 Xili Dai 1 and Ming Liu 1
1University of Electronic Science and Technology of China Chengdu China2Shanghai Jiao Tong University Shanghai China
Correspondence should be addressed to Nianbo Liu liunbuestceducn
Received 28 June 2017 Revised 11 November 2017 Accepted 11 December 2017 Published 29 March 2018
Academic Editor Daniele Riboni
Copyright copy 2018 Bang Liu et alis is an open access article distributed under the Creative CommonsAttribution License whichpermits unrestricted use distribution and reproduction in any medium provided the original work is properly cited
In modern society vehicle theft has become an increasing problem to the general public Deploying onboard anti-theft systemscould relieve this problem but it often requires extra investment for vehicle owners In this paper we propose the idea ofPhoneInside which does not need a special device but leverages an obsolete smartphone to build a low-cost vehicle anti-theftsystem After being fixed in the vehicle body with a car charger the smartphone can detect vehicle movement and adaptively useGPS cellularWiFi localization and dead reckoning to locate the vehicle during driving Especially a novel Velocity-Aware DeadReckoning (VA-DR) method is presented which utilizes map knowledge and vehiclersquos turns at road curves and intersections toestimate velocity for trajectory computation Compared to traditional dead reckoning it reduces accumulated errors and achievesgreat improvement in localization accuracy Furthermore based on the learning of the driving history our system can establishindividual mobility model for a vehicle and distinguish abnormal driving behaviors by a Long Short Term Memory (LSTM)network With the help of ad hoc authentication the system can identify vehicle theft and send out timely alarming and trackingmessages for rapid recovery e realistic experiments running on Android smartphones prove that our system can detect vehicletheft effectively and locate a stolen vehicle accurately with average errors less than the sight range
1 Introduction
Nowadays quick and easy transport has been an essentialpart of our daily life As the dark side of this phenomenonvehicle theft has become one of the costliest property crimesof modern society According to the US National InsuranceCrime Bureau a vehicle theft occurs every 33 seconds thatis roughly one million vehicles each year wind up in thehands of thieves at a cost of nearly 64 billion dollars eindirect charge is even much more expensive To each andevery one of us it is a numbers game where one has to payhundreds of dollars each year in higher insurance premiums
In order to prevent theft some people install anti-theftsystems in their cars such as LoJack ProScout and Trav-elEyes2 Most systems combine wireless communication andGPS localization techniques After a car has been stolen thedevice in it will pinpoint the location send radio signals tothe owner and help the owner or the police retrieve the carHowever the GPS-based anti-theft systems have their own
problems Firstly with a cost of $400 to $1300 they are tooexpensive to many users Secondly they cannot operate intunnels garages underground parking lots or dense urbanareas where GPS signals are screened or disturbed irdlythey are easy to defeat if the thief knows where the device isFor example the thief can simply cover it with a metal canand then localization will be impossible
Besides vehicle theft we are also suffering from a surfeitof electronic waste In modern society people upgrade theirmobile phones every 18months on average either because ofthe incentives in provider contracts or to keep up with thefashion trend Only in the US there are 125 million phonesdiscarded each year which results in 65000 tons of wasteand represents a significant and growing environmentalimpact Since many obsolete phones are smartphones whichstill function normally they can be reused as a vehicle-mounted anti-theft device instead of expensive specialequipment Todayrsquos smartphones are not only program-mable but also come with network interfaces and a rich
HindawiMobile Information SystemsVolume 2018 Article ID 6569826 16 pageshttpsdoiorg10115520186569826
set of embedded sensors which enable great sensing andcommunicating abilities to play the role of protector forvehicle safety
In a vehicle tracking approach the difficulty first arisesfrom how to locate a vehicle with a smartphone inside Anaive solution is to mount the smartphone on vehicledashboard where it can easily receive GPS signals for po-sitioning is design is incredibly fragile for professionalthieves will disable all suspicious devices after entering a carHiding the smartphone deep in vehicle body could relievethis problem but it means GPS signals may be unavailableand more positioning methods should be considered eRF-based methods such as cellularWiFi localization are farless accurate than GPS and can make large errors in theregions without dense deployment of cell towers and accesspoints (APs) With the support of motion sensors such asaccelerometer and gyroscope dead reckoning can be used toestimate a trajectory from a known past position to currentposition However this method suffers from fast error ac-cumulation over time for small errors in the measurementof acceleration are double integrated into increasingly largererrors in displacement It is found that smartphone motionsensors have surprisingly low accuracy generating errors upto 100 meters within a minute at a rate super-linear withtime [1]
Even if the vehicle can be accurately located during thewhole driving the problem of theft detection still exists ashow to decide a driver or a driving is unauthorized Mostdriver verification methods based on biometric featuressuch as vision voice fingerprint and iris cannot be used fora smartphone in vehicle body On the other hand it isimpossible to ask the owner to manually turn off the systembefore driving and turn it on after driving Even a user-defined timetable (eg the system is merely turned on atnight) will finally bring terrible user experience for longunprotected periods or tiresome false alarming
In this paper we propose the idea of PhoneInside whichdoes not need a special device but leverages an obsoletesmartphone to build a low-cost vehicle anti-theft systemAfter being fixed in vehicle body with a car charger thesmartphone can detect vehicle movement and adaptively useGPS cellularWiFi localization and dead reckoning to locatethe vehicle during driving Especially a novel VA-DRmethodis presented which utilizes map knowledge and vehiclersquosturns at road curves and intersections to estimate velocity fortrajectory computation Compared to traditional dead reck-oning it reduces accumulated errors and achieves greatimprovement in localization accuracy Furthermore based onthe learning of the driving history our system can establishindividual mobility model for a vehicle and distinguish ab-normal driving behaviors by an LSTMnetworkWith the helpof ad hoc authentication the system can identify vehicle theftand send out timely alarming and tracking messages for rapidrecovery e realistic experiments running on Androidsmartphones prove that our system can detect vehicle thefteffectively and locate a stolen vehicle accurately with averageerrors less than the sight range
e original contributions that we have made in thepaper are highlighted as follows
(i) To the best of our knowledge we are the first toconsider the using of obsolete smartphone in vehicleanti-theft Furthermore our scheme provides in-sights to waste reuse for property safety in a simpleand feasible way
(ii) We develop a novel dead-reckoning method forvehicle tracking Road curves and intersections arefree and everywhere which contribute distinctvelocity-aware landmarks for trajectory computation
(iii) We deploy a novel deep learning-based method asLSTM network to identify vehicle theft Humantrajectories show a high degree of temporal andspatial regularities while a stolen vehicle does notfollow the mobility regularities of its owner whichprovides a reasonable basis for abnormal detection
e remainder of this paper is structured as followsSection 2 briefly discusses the related work while Section 3presents the overview of our scheme In Section 4 we explainthe design of PhoneInside step by step including orienta-tion sensor errors motion detection matching positioningand details of modelling and theft decision Section 5evaluates our system through realistic experiments andSection 6 summarizes the paper
2 Related Work
ere have been many studies on vehicle tracking and anti-theft In this section we only explore the most relevant workin the areas
21MobileTracking Vehicle tracking is often discussed withmobile tracking due to the wide deployment of smartphonesamong drivers and passengers Some phone tracking ser-vices such as Apple MobileMe and Samsung Dive can helpa user find a missing smartphone which supports GPS andcellularWiFi-based localization However cellular locali-zation is not really accurate e accuracy of this methodranges from 100 meters to several kilometers mainlydepending on the number of cell towers detected [2 3]WiFi-based localization suffers from low coverage especiallyin rural areas and many developing regions us deadreckoning has become a popular localization method formobile tracking
In [4] vehicle trajectory is estimated by an odometer anda gyroscope and a single data-fusion process based onparticle filter performs both positioning and map matchingIn [5] a context-aided Kalman filter for urban vehiclenavigation is proposed where contextual knowledge assensor quality and driving context is used to carry outa continuous estimation and correction of sensor drift er-rors In [6] a cellular network-based vehicle tracking schemeis proposed in which vehicle velocity and heading directionobtained by a speedometer and a heading sensor are directlyemployed in the optimization for position determination
vTrack [7] builds a system to estimate a usersrsquo trajectoryand travel time byWiFi and GPS in which a HiddenMarkovModel- (HMM-) based map matching scheme and traveltime estimation method are performed Since the HMM and
2 Mobile Information Systems
Viterbi algorithm are robust to noise later studies [1 8ndash11]also adopt these techniques to model a vehicle trajectoryover a map area iagarajan et al [8] describe a crowd-sourced cooperative transit tracking system using an indi-vidual smartphone For subway or vehicles in tunnels itdetects vehicle mobility by accelerometer and calculates themost likely vehicle location through dead reckoning CTrack[9] achieves energy-efficient trajectory mapping using rawposition tracks obtained largely from cellular base stationfingerprints which also fuses data from low-energy accel-erometer (to detect movement) and magnetometer (todetect turns) on smartphones WheelLoc [10] providesa continuous outdoor location service without GPS whichdiscusses driving and cycling patterns respectively andgenerates a rough mobility trace with accelerometer andmagnetometer AutoWitness [11] designs a small INS tagthat can be embedded into stolen property In mobiletracking the tag establishes a sequence of movements stopsand turns and estimates trajectory through dead reckoningand then the trajectory data are sent to a server to completea map matching process Bumping [1] proposes an inertialnavigation method for driving in parking garages whichexploits smartphonersquos accelerometer to detect bumpingcaused by speed bumps to find reference positions It alsoproves that such bumping can provide precise velocity es-timates for positioning
Although we adopt accelerometer and gyroscope ourscheme is different from previous approaches Our schemetries to enhance dead reckoning by introducing moremeasurable landmarks such as road curves and in-tersections to reduce accumulated errors not simply usingadvanced algorithm in map matching
In addition ad hoc localization of vehicle [12ndash14] comesas a natural result of vehicular ad hoc networks Each vehicleestimates intervehicle distance and localizes itself among itsneighbors which aims at accurate relative positioning fordriving safety Generally these approaches assume onboarddevice equipped on every vehicle to support ad hoc com-munication which may need a long time for wide de-ployment of hardware
22 Vehicle Anti-eft Many recent research schemes havebeen demonstrated to achieve vehicle electronic immobi-lizers Guo et al [15] designed an automotive security systemto disable an automobile and its key auto systems throughremote control when it is stolen in which four layers ofsecurity features are written in the form of firmware andembedded on the electronic control units Sadagopan et al[16] presented an anti-theft control system use of an em-bedded chip that has an inductive proximity sensor whichsenses the key during insertion and sends a text message tothe ownerrsquos mobile device stating that the car is beingaccessed Hongzhi et al [17] proposed an auto-guard systemwhich combined RFID and the global mobile communi-cation network e system could identify the car ownerquickly and then realize the function of keyless entry andkeyless start-up at the same time e infrared sensors andvibration sensors completed the monitoring function Al-though they deploy different hardware equipment they
exploit cellular communication and GPS localization andhave similar disadvantages as the anti-theft devices discussedabove
At the same time the use of biometric measures isheavily promoted for driver identification purposePOLLUX [18] is proposed as an anti-theft system based uponmachine vision technology which can locate and recognizethe driverrsquos face and send the unauthorized driverrsquos image tocar owner or police through CDMA or GPRS networks InCMAC [19] driver profiles are created using the cerebellummodel articulation controller feature map taking inputs fromthe brake and gas pedals pressure signals ese features canbe used to verify drivers using multilayered perceptron asclassifiers Some researches [18 20] try to deploy smartphonesensors to evaluate driving behaviors for driving safety butthere is no evidence to support that such driving recognitionis accurate enough to identify the driver
Alternatively approaches based on ad hoc communi-cation to guarantee vehicle safety have also been consideredIn SVATS [21] each vehicle has a wireless sensor node andeach node is monitored by its neighbors for identifyingpossible vehicle thefts by detecting unauthorized vehiclemovement In SPARK [22] some sensors are employed asparking lot infrastructure to surveil and manage the wholeparking lot through vehicular ad hoc networks Once a ve-hicle is illegally leaving the parking lot the infrastructure canquickly detect the anomaly Similarly these approachesrequire onboard device on every vehicle which is still anobstacle for current users
3 System Overview
To any vehicle anti-theft system there are two basic tasksalarming and tracking e former is triggered when thefthappens while the latter usually lasts a long period to locatethe moving vehicle us the PhoneInside system carries ontracking and theft detecting in each driving and sendsalarming and locating messages to the owner once the ve-hicle is thought stolen We list several overall considerationsthat meet these requirements as the basis of our research
31 Hardware Installation As shown in Figures 1(a) and1(b) an obsolete smartphone and a car charger (which ispriced at $099 in ebay) are installed in one corner of vehicletrunk as an onboard anti-theft device e car charger isconnected to the wires of taillight so that the smartphonecan stay in this secret place with sufficient power supply Ofcourse the device can be embedded into any other place invehicle body where the power supply is available
32 Design Principles
321 e System Should Be Cost-Efficient Since the hard-ware discussed above is very cheap the spending mainlycomes from the daily using including communication andenergy costs Although most smartphones support 3G4Gcommunication the subscription of 3G4G data plan is oftennot trivial e short message service (SMS) is the better
Mobile Information Systems 3
choice for the communication for low-probability theftevent which lessens the economic burden of vehicle ownersIn addition false alarming should be minimized for eachalarming brings the cost of SMS On the other hand energyconsumption should be minimized due to the long-timerunning of the system It means the whole alarming andtracking system should avoid those sensors and interfacesthat have high power consumption In addition map dataand other involved data can be previously stored in thesmartphone for avoiding extra communication and energycosts
Of course keeping a valid SIM card for SMS is not freewhich depends on different service providers in differentcountries For example it is no more than one dollar permonth in China but seems much higher in the US Gen-erally this cost is indispensable for anti-theft systems thatsupport remote tracking including our system
322 e System Should Be Self-Adaptive After being in-stalled the smartphone will check the feasibility of GPS Indriving the system deploys cellular localization and deadreckoning to generate a vehicle trajectory as an energy-efficient approach If GPS and roadside APs are possible thetrajectory can be improved by introducing more accuratelandmarks from GPS or WiFi localization
In fact with careful installation GPS signals can beguaranteed for our system For example a small antenna canbe put out a hole near the trunk where the smartphone ishidden or the smartphone can be put under the bumperwhere it will receive reflected GPS signals However vehicletracking is not an application requiring very high accuracyAn object as big as a car can be easily found by people if it islocated within the sight range or 50 meters In this case GPSis not very important if other energy-saving localizationmethods such as cellular localization and dead reckoningcan provide a location with average errors less than 50meters us we allow vehicle owners to hide theirsmartphones as they want to not requiring any specialinstallation to guarantee GPS
Another possible solution is to install an OBDII blue-tooth adaptor in the car Once connected to the obsoletesmartphone such an adaptor can sense and upload real-timevelocity and travelling distance for locating the car accu-rately Similar to GPS we only use an obsolete smartphone
to fulfill our task not considering OBDII adaptor or otherextra sensors
323e System Should Be Convenient Since people alwayscarry a smartphone driver verification can be performedthrough ad hoc authentication between the driver-carryingthe device and the embedded one It means our system canopen WiFi interface to monitor the WiFi signals emittingfrom the ownerrsquos smartphone for checking the uniqueMACaddress However many users close their smartphonesrsquoWiFito save energy in daily using while ad hoc authenticationrequires them to open WiFi before driving If the vehicleowner forgets this operation or forgets the phone a falsealarm is triggered us single ad hoc authentication maylead to bad user experience with a high probability of falsealarm
us we need a second theft detection mechanismwhich does not need any operation of user but automaticallyrecognizes unauthorized driving Since the system can re-cord all driving trajectories a history-based mobility modelcan be established to distinguish abnormal driving behaviorsfrom regular ones Combining ad hoc authentication fordriver verification and automatic abnormal recognition fordriving verification our system will meet the conflictingrequirements for a high probability of theft detection anda low probability of false alarm
324 e System Should Be Memory-Efficient and Time-Efficient Our system does not deploy any back end serverbut achieves real-time tracking and alarming with thelimited computational resources of a smartphone It requiresthat the algorithms for theft detection and mobile trackingare simple enough and fast enough to be running ata smartphone
33 Overall Design According to the above principles wecan determine the necessary parts in a smartphone in oursystem a GSM modem a WiFi interface a 3-axis acceler-ometer a 3-axis gyroscope and electronic maps includingcellular base station data As shown in Figure 2 the obsoletesmartphone communicates with the vehicle ownerrsquos phonethrough short messages or ad hoc connections after em-bedded into a vehicle e owner can turn on or turn off the
(a) (b)
Figure 1 Hardware installation (a) Smartphone and recharger (b) Smartphone in vehicle body
4 Mobile Information Systems
system or directly ask the system reporting vehicle locationif heshe nds the vehicle to be stolen
After being installed activated and matched to thevehicle ownerrsquos phone the system enters an Idle mode Inthis mode it uses accelerometer measurements to detectwhether the vehicle moves If the readings exceed somepredened limits for example a driving starts the systemtries to verify the MAC address of the signals from its WiFiinterface If the MAC address of the ownerrsquos smartphone isfound for example ad hoc authentication is passed it entersa Tracking mode and computes a trajectory through cellularlocalization and dead reckoning If GPS signals are availableperiodic records are used to enhance the trajectory Simi-larly roadside APs if detected are also recorded
If the MAC address of the ownerrsquos smartphone is notfound for example ad hoc authentication fails the systemswitches to a theft detecting mode In this mode the systemnot only computes trajectory but also uses a historical modelbased on previous trajectories to detect abnormal driving Ifabnormal driving is recognized the system immediatelysends an alarmingmessage to the vehicle owner If the ownerconrms vehicle theft and sends a request message thesystem would periodically send location messages until it isturned o by the owner
34 Challenges and Solution ere are several challengesthat emerge when meeting the task of tracking and theftdetecting especially if the performance is to be guaranteedFrom the viewpoint of the engineering application webriey describe our solution to guide the system design
(1) Orientation as shown in Figure 1(b) the smart-phone is xed inside the vehicle body in an arbitraryorientation It means that we cannot get correctsensor readings in vehicle axis unless we rst resolvean unconformity between smartphone axis and ve-hicle axis
(2) Sensor errors in most practical systems the primaryerror sources are related to the errors of measure-ment Since current smartphone sensors are quitenoisy and suer from large drifts it is more dicultto obtain robust and reliable estimation of vehiclemovement
(3) Motion detection to a vehicle it may start to movestop for trac lights and trac jam turn at in-tersections and road curves bounce at road bumps
or park at some places Such vehicle motions shouldbe captured classied and measured by sensorreadings as accurately as possible
(4) Matching with motion data the distance and di-rection together produce a meaningful trajectorywhich is further tted into a map topology usinga map matching algorithm A major problem is theperformance of dead reckoning which often in-troduces serious errors into trajectory estimation
(5) Positioning if travel trajectory has matched mapdata successfully the real-time location can be es-timated from the last known landmark e chal-lenge here is that the vehicle may break in anunknown road or a parking garage that is not in-cluded in the map data
(6) Modelling it is well known that human trajectoriesshow a high degree of temporal and spatial regu-larity In this step the goal is to nd regularity fromdriving trajectories and to establish a proper modelbased on such regularity
(7) eft decision with the given mobility model weneed some rules to decide whether a driving isunauthorized or ldquoabnormal enoughrdquo Such rulesare often context-aware vehicle-specic andmultifactored
e rest of this study is meant as a step towards a deeperunderstanding of these fundamental issues especially in thestep of motion detection matching modelling and theftdecision
4 System Design
For the idea of PhoneInside we rst investigate the ori-entation problem and the errors of motion sensors Later weclassify typical driving events by understanding dierentsensor readings explaining the method of VA-DR for ac-curate matching and then giving the details of nal posi-tioning Finally a historical model of vehicle mobility isestablished and an abnormal detection algorithm-basedhistory model is given
41 Orientation Since the smartphone is xed in the vehiclebody in any orientation its axis is massively more likely to bedierent with vehicle axis As depicted in the left part ofFigure 3 a smartphone has its coordinate (x y z) in threevirtual directions As an object it is under the force of gravityg no matter in what state it is By reading the data of ac-celerator and comparing it to the value of gravity acceler-ation we can then measure the angle θ between the x-y planeand the gravity direction
We assume that the rotation process is at an angle αaround x-axis then at an angle β around y-axis and then atan angle c around z-axis Hence the rotation matrix can beexplained as follows
Vlowast R(α)R(β)R(c)V (1)
where
Vehicle
ParkedDriving Stops TurnsBounces Owner
PhoneInside Base stationAlarm
locationAlarm
locationOnoffrequest
Onoffrequest
Theft detectingTracking
Idle
Ad hoc authentication
Figure 2 e PhoneInside system
Mobile Information Systems 5
Vlowast X
Y
Z
V x
y
z
(2)
R(α) 1 0 00 cos θ sin θ0 minussin θ cos θ
R(β) cos θ 0 sin θ0 1 0minussin θ 0 cos θ
R(c) cos θ sin θ 0minussin θ cos θ 00 0 1
(3)
According to the rotation matrix we can calculate thevehiclersquos axis via having three angles between the smart-phone coordinate and the vehicle coordinate at is to saythe smartphone will go through a self-learning process tocomplete reorientation After reorientation vehicle move-ment can be obtained by reading the data of smartphonesensors
42 Sensor Errors An INS is an autonomous system thatprovides information about position displacement andattitude based on the measurements by inertial sensors andapplying the dead reckoning principle which may havedierent designs In many o-the-shelf mobile devicesmagnetometer (electronic compass) is equipped as well asaccelerometer and gyroscope Some studies [9 10 23] alsouse magnetometer to indicate the direction of north duringdriving However if placed in vehicle body the magne-tometer may have large dynamic errors inmeasurement dueto a local magnetic eld from moving metal components invehicle [24] us we use a combination of accelerometer
and gyroscope for motion detection and discuss the mea-surement errors of them respectively
e errors of MEMS sensors include those caused byconstant bias thermomechanical white noise temperatureeects calibration errors and bias instability For acceler-ometer on the smartphone the uncorrected bias errors andwhite noise are typically the primary error sources [25]
A preprocessing method [11] is proposed to correct ac-celeration errors for vehicle tracking At rst the signals ofaccelerometer readings are passed through a second-orderButterworth Filter [26] to remove jitters and noise Further-more the obtained signals are smoothed by taking a median of20 samples and then taking the mean of 10 such obtainedmedians to reduce high amplitude variation caused by highsampling rate and jerks in driving In our system we adopt thismethod to yield average acceleration in dead reckoning
e gyroscopes generally suer from white noise and biase gyroscope bias is the output when it is not experiencingany rotation A constant bias error of ε when integrated causesan angular error which grows linearly with time as θ(t) εlowastt[27]us we can correct this error in the matching process Ifsome routes (parts of the whole trajectory) are matched withthe map the turns in these routes are picked up and measuredus the angles measured by gyroscope and that by mapknowledge of the same turns can tell us the value of ε In latermatching this value can help us to reduce the gyroscope errorsfor generating more accurate trajectory
43MotionDetection e spatial movement of a rigid bodycan be described as a combination of translation and ro-tation in space In our system the movement of vehicle ismeasured by a 3-axis accelerometer and a 3-axis gyroscopewhich is represented in six parameters in vehicle axis as X-Y- Z-acceleration and X- Y- Z-angular velocity Any ve-hicle motion including movement stops turns andbounces is captured and classied according to these six-parameter readings Especially velocity estimates are cal-culated when specic motions occur
(1) Movement in the Idle mode we use X-acceleration todecide whether a vehicle moves During this mode theaccelerometer is sampled at 200Hz for 1 second in every5 seconds and the peak of X-acceleration is kept ina threshold |T| If |Ti+1|ge 10lowast|Ti| happens the value of|Ti| is saved and the sampling is performed in everysecond If half readings of the next 20 samples are morethan 10lowast|Ti| a decision of ldquoa driving startsrdquo is madeen the system carries out ad hoc authentication andswitches to the Tracking mode or the eft Detectingone Otherwise the sampling is restored and the systemkeeps in the Idle mode As shown in Figure 4 theX-acceleration values show the changes from parking tomoving During the interval between 50 and 80 samplesthe obvious positive values indicate a vehiclemovement
In the Trackingeft Detecting mode the sampling rateis set at 200Hz and the six-parameter readings includingX- Y- Z-acceleration and X- Y- Z-angular velocity arerecorded in time order for further processing
X
Y
g
Zx
yθ
z
Figure 3 Phone axis and vehicle axis
6 Mobile Information Systems
(2) Stops in realistic driving a vehicle is not alwaysmovingbut stops for trac lights or trac jam occasionallyCompared to the parking state a stop in driving is oftencalled ldquolive parkingrdquo for the engine is still running InFigure 4 a stop appears between 20 and 45 sampleswhich is slightly dierent from the parking state from0 to 20 samples We do not distinguish the two statesclearly but think a vehicle enters a stop when averageacceleration and angular velocity are both zero
Although a preprocessing method is used to correct ac-celeration errors (Section 42) the accelerometer still producesacceleration values with high oscillation Since a vehicle mayhave successive stops in driving for example waiting for redtrac light twice the average acceleration during the interval iszerous the mean acceleration between two successive stopscan be subtracted from all recorded acceleration values toeliminate the drift from the measurements [28]
(3) Turns in our system the vehicle motion of the turn isrepresented by Y-angular velocity A clockwise rotationgenerates positive reading which indicates the vehicleis making a right turn otherwise the gyroscope gen-erates negative reading indicating the vehicle ismakinga left turn Since a turn is given by the resultant of thetwo opposing forces namely the tangential force andthe centripetal forceX-acceleration andY-accelerationrespectively indicate the tangential acceleration andthe centripetal acceleration Since turns can be accu-rately measured with a high sampling rate an in-teresting question is whether we can estimate vehiclevelocity at turns with the support of parameters asangular velocity acceleration and passed distance
ere are two kinds of turns that frequently appear indriving turns at intersections and turns at road curves Asshown in Figure 5 a turn at an intersection is often sharpwhere Y-angular velocity has large changes in a short timeinterval between t0 and t Even we have X-accelerationrecords as the tangential acceleration a velocity estimate isvery hard to get because
(1) the trajectory may not be known deterministicallywhich may range from P0 to P1
(2) the distance estimate of P obtained from map datacould be dicult for it is very trivial in comparisonto street length
(3) small errors in the estimates of the distance of P andthe time points t0 and t could result in large errors invelocity estimation for the turning is sharp andshort
431 Curve-Based Velocity Estimation As shown in Figure6 a turn at the road curve is often designed large and gentlefor safety driving In this case the curve length P has nomuch dierence from P and P1 At the same time we can getthe value of P from map data if the corresponding roadcurve is found in map Finally measurement errors in P t0and t will not aect velocity estimation very much for theturning is slow and long
Suppose the interval of sampling is Δt and t0 and t denotethe beginning time point and the ending time point of a turnthen the total sampling number N is given by
N tminus t0Δt
(4)
erefore X-acceleration records during the turn can bewrite assumNk1ak e travelling distance P can be expressed asNewtonrsquos law of motion as
P sumN
k1nablaf(k)
sumN
k1Vkminus1Δt +
akΔt2
2( )
(5)
0 20 40 60 80 100 120ndash05
0
05
1
15
2
25
Acce
lera
tion
(ms
2 )
Time
Figure 4 Motion detecting
P1
P0
v0
vt
t0
P
t
Figure 5 A sharp turn at intersection
P
a
v0
t0
vt
P1
L0 Lt
P0
Figure 6 A large gentle turn at road curve
Mobile Information Systems 7
With the entering velocity V0 at the time point t0 we canwrite the travelling distance P as
P sumN
k1V0 +sum
kminus1
i1aiΔt⎛⎝ ⎞⎠Δt +
akΔt2
2⎡⎢⎢⎣ ⎤⎥⎥⎦
NV0Δt +sumN
k2sumkminus1
i1aiΔt
2+sum
N
k1
akΔt2
2
(6)
en we have the velocity estimation function of V0 as
V0 PminussumN
k2sumkminus1i1 aiΔt2 minussum
Nk1 akΔt211138702( 1113857
NΔt
P
NΔtminus sum
N
k2sumkminus1
i1
aiΔtNminus sum
N
k1
akΔt2N
(7)
Now we only need to calculate the leaving velocity V atthe time point t and we consider
Vt V0 +sumN
k1akΔt
P
NΔtminus sum
N
k2sumkminus1
i1
aiΔtNminus sum
N
k1
akΔt2N
+sumN
k1akΔt
P
NΔtminus sum
N
k2sumkminus1
i1
aiΔtN
+sumN
k1
(2Nminus 1)akΔt2N
(8)
Using (11) and (12) we can figure out the entering andleaving velocities of the vehicle if it happens to pass a roadcurve that is matched in map With the velocity estimates attwo ends of a road curve the displacement estimation beforeand after the curve will be largely improved for the accu-mulated errors in dead reckoning are removed
According to our test some turns at intersections forexample those on bypass road or flyover are long enoughand slow enough to make velocity estimates while someturns at sharp curves are useless Some road curves aretoo plain to generate a clear beginning or ending ofa turn Sometimes lane changing may be misleading Wesimply make some rules in turn choosing for velocityestimation
(1) Turning should last at least 5 seconds(2) Angle of turn is larger than 15 degrees(3) Centripetal displacement of turn is larger than 8
meters (since the average lane width is 30ndash36meters [29] most lane-changing can be removed)
432 Two-Turn-Based Velocity Estimation More impor-tantly let us consider the vehicle travelling between two sharpturns which is common in realistic driving If we take the timeof the first turn and that of the second one as t0 and t and thedistance between two turns as P we can compute the enteringvelocity V0 at the first turn as (11) and the leaving velocity V atthe second turn as (12) respectively At the same time thelimits discussed above are not effective It means the pathsbetween two successive turns can be used to estimate ve-locity which makes all turns no matter sharp or slow nomatter at road curves or intersections velocity-awareus VA-DR is feasible and the accuracy of localization isenhanced
(4) Bounces during driving a vehicle may encounterroad bumps which can cause unexpected bounces ofthe vehicle body Using such bounces also calledbumping to estimate driving speed is first proposedin [1] As shown in Figure 7(a) when a vehicle ispassing a speed bump two bounces can be observedfrom Z-acceleration values which indicate that thefront and rear wheels get on top of the bump re-spectively e distance between front and rear
0 50 100 150 200minus6
minus5
minus4
minus3
minus2
minus1
0
1
2
3
4
Time
Acc
eler
atio
n (m
s2 )
(a)
0 50 100 150 200minus3
minus25
minus2
minus15
minus1
minus05
0
05
1
15
2
Time
Acc
eler
atio
n (m
s2 )
(b)
Figure 7 Bounces at road obstacles (a) Good bounces (b) Bad bounces
8 Mobile Information Systems
wheels is called wheelbase which is known to a ve-hicle owner e details of velocity estimation arevery similar to those of turns at road curves andintersections which are discussed above
However we test this bounce-based velocity estimationmethod and the results are not very good ere arebumps flaws potholes manhole covers or others on roadsbut most obstacles are not straight enough and slim enoughto generate good bounces as man-made speed bumps Forexample a tilted road flaw can cause complex bounces onfour wheels and two speed bumps placed near to each otherwill bring four bounces Diving in bad roads also makes toomany bounces As shown in Figures 7(a) and 7(b) re-spectively good bounces are two peaks of Z-accelerationwhile bad ones often involve too many peaks that cannot beused to calculate velocity In realistic driving the chance ofhitting a good bump on roads is low Another problem isthat people often slow down for speed bumps in drivingwhich increases errors in velocity computation In addi-tion the wheelbase is a short travelling distance so thatsmall errors in measurement will cause large errors inestimation
us we only use this method to compute velocity at thebeginning and the end of driving At these stages vehiclesare often moving slowly in parking lots where man-madespeed bumps exist (as the case in [1]) Similarly we set somerules in bounce choosing for velocity estimation
(1) Only the bounces happened during the first 100seconds and the last 100 seconds of a driving
(2) Only two successive bounces are observed and nobounce can be found in 5 seconds ahead and 5seconds later
44 Matching A landmark can be any fixed location ref-erence such as a bridge Its physical location is not necessaryto be known and we only take it as a unique identity forlabelling the vehicle movement Since a series of vehiclemotions are classified in the last subsection we list their rolesin matching in Table 1
As shown in Table 1 all vehicle motions are recorded inorder of time for example known in time points Unclassifiedmovement cannot be matched to any location but generatesdistance estimation through dead reckoning Since a vehiclemay stop or turn at intersections suchmotions are possible tobe matched to intersections in map data At the same timestops are restarting points of dead reckoning where accel-erometer and gyroscope measurements can be flushed out so
that accumulated errors are removed In this study newlandmarks with velocity estimates such as bounces and turnsare considered which introduce extra restarting points indead reckoning us a more accurate trajectory can beachieved with more velocity-aware landmarks
Once a travel trajectory based on a sequence of dis-placements turns stops and bounces has been obtained thenext challenge is to search a map of streets to identify thesequence of road segments that is most likely to result intothe observed trajectory e matching process is especiallychallenging for many factors will affect the performance
(1) Not all trajectory data are meaningful in map es-pecially those in the early and last stages For ex-ample a vehicle may start from or drive into a smallroad not included in map
(2) Sensor errors and dead reckoning may result in largeerrors in trajectory
(3) e resemblance of roads is also an obstacle Someroad segments may have similar lengths or curves
Note that velocity estimates at road curves and in-tersections are impossible unless we know the curve lengthsor road lengths between two turns at first It means that weneed to have a two-step matching which first matches roadsegments with the support of VA-DR and finally constructsa path as a sequence of road segments Based on a basic mapmatching algorithm known as the nearest segmentmatching (NSM) [7] we develop a VA-DR matching al-gorithm to support our system Algorithm 1 shows theoverall procedure of VA-DR matching in which those roadsegments with curves and those between turns are firstestimated and matched
In Algorithm 1 we have a road segment set as map dataA road segment is a portion of road between two points ofinterest which could be intersections not necessarilyneighboring An error region contains a number of segmentswhere the vehicle is travelling Since the vehicle can belocated through cellular localization an error region mayrange from 100 meters to several kilometers [2 3] us toa road segment or a trajectory we can use the NSM to selectmost matched segment candidates within error region
As shown in Algorithm 1 a greedy strategy is adopted tofind the matched segment where turns at curves and in-tersections happen If a turn at road curve is found thesegment candidates set S are found through calling NSM InLines 5 6 and 7 each candidate Si provides its curve lengthestimates velocity as (9) and (10) then estimates the dis-tances before and after the curve as (8) and finally forms
Table 1 e roles of vehicle motions
Motion type Landmark Matched location Accelerometer readings Gyroscope readingsMovement No None Continue ContinueStops Yes Possible Restart RestartTurns at interscetions Yes Possible Restart ContinueTurns at curves Yes Possible Restart ContinueBounces Yes None Restart Continue
Mobile Information Systems 9
a segment estimate in Scur If Scur equals the candidate Si inlength the candidate Si can be regarded as the real segmentwhere the vehicle passed by Similarly if two successive turnsare encountered the segment candidates S (S1 S2 Sn)
are found through calling NSM In Lines 17 18 and 19 eachcandidate Si provides its distance between two turns esti-mates velocity as (9) and (10) and then estimates the dis-tances before the first turn and after the second turn as (8)and finally forms a segment estimate in Stur If Stur equals thecandidate Si in length the candidate Si can be regarded as thereal segment where the vehicle passed by
Generally the idea behind Algorithm 1 is that VA-DRcan provide accurate velocity and distance estimates so thatthose road segments with turns at curves and intersectionsshould be initially estimated and matched and those roadsegments without turns should be estimated and matchedlater Since the incremental matching is beginning fromsingle segment with turns it is very efficient for there are noglobal considerations e drawback is a result of local-bestwhich means the generated path may be incomplete orincorrect However this approach effectively trades accuracyfor speed of computation which fits the running in the
smartphone In addition if cellular localization is accurateenough or the segment candidates are few the performanceof Algorithm 1 will be good for there are no much matchingerrors
45 Positioning Positioning is the last step of vehicletracking which directly decides the localization perfor-mance If travel trajectory has matched map data success-fully the real-time vehicle location can be estimated fromthe last known landmark Besides the landmarks in Table 1a GPS location is also a landmark if GPS signals are feasibleIn addition a WiFi AP can be a landmark if the systemassures that vehicle theft happens and gets WiFi localizationresults from ownerrsquos phone through SMS
If the last known landmark happens to be a GPS locationa road curve or a turn in map VA-DR will provide distanceestimation as (12) with a known starting velocity Otherwisetraditional dead reckoning is used to estimate the final lo-cation Especially bounces at the end of driving are recorded(Section 432) and bounce-based velocity estimation is usedto compute vehicle trajectory It may provide a better lo-calization for vehicle entering an unknown road or a parkinggarage at a low speed
46 Modelling e researches on human mobility weredeveloping rapidly in recent years Some of them noticedthe relationship between human social activities andgeographic movements e time-variant communitymobility model [30] captures two properties of humanmobility via empirical WLAN traces skewed locationvisiting preferences and periodical reappearance of nodesat the same location Another study [31] investigates thetrajectories of 100000 anonymous mobile phone usersand finds that human trajectories show a high degree oftemporal and spatial regularity each individual can becharacterized by a time-independent characteristic lengthscale and a significant probability to return to a few highlyfrequented locations
According to NHTS [32] the majority of individualdaily trips (87 percent) are taken by personal vehicle edaily activities of an individual person including ldquogoingto workrdquo ldquohaving lunchrdquo and ldquoshoppingrdquo often showregular features As a kind of human activity driving iscontrolled by individual drivers and follows their re-spective social activities partially Although some un-expected driving occurs individual or household drivingin a certain vehicle usually yields the same spatial andtemporal features For instance a commuter always driveshisher car from home to office at 900 and from office tohome at 1700 Research in the field of transportation alsovalidates the regularities both in human mobility andvehicle mobility Mobidrive [33 34] monitors the tra-jectories of private cars by collecting their trajectories Amobility pattern is constituted by the spatial distributionof those locations where a traveler has had six weeks ofpersonal experience e spatial regularities indicate twoto four main locations (such as home and office) and cover
Require NSM select most matched segment candidateswithin error regionMotionDetect detect vehicle motions fromsensor readings
Ensure A sequence of road segment(1) if MotionDetect finds Curve then(2) set a segment Scur(3) call NSM for Scur get S (S1 S2 Sn)(4) for i 1 ile n i + + do(5) calculate velocity of Si with CurveLength(6) calculate distance of Si with CurveLength(7) set Scur values(8) if Scur equals Si then(9) return Si
(10) end if(11) end for(12) else(13) if MotionDetect finds Two-Turns then(14) set a segment Stur(15) call NSM for Stur S (S1 S2 Sn)(16) for i 1 ile n i + + do(17) calculate velocity of Si with Distance(18) -BetweenTurns(19) calculate distance of Si with Distance(20) -BetweenTurns(21) set Stur values(22) if Stur equals Si then(23) return Si
(24) end if(25) end for(26) end if(27) else(28) call NSM to get a most matched S1(29) end if
ALGORITHM 1 VA-DR matching
10 Mobile Information Systems
more than 70 of the overall trips However this modeldoes not involve the temporal regularities
In this study we rst collected realistic driving trajec-tories from a 16-car 3-month test (Section 51) en we canestablish a new driving mobility reecting spatial andtemporal regularities Suppose a driving history data set isD di ∣ i isin N and N is the capacity a driving trajectory ican be expressed as di (Li0 Ti0) (Li1 Ti1) (Lin Tin) in which Lij and Tij are the location (including latitude andlongitude) and the time of the jth measurement in thedriving i respectively
More specically we use a weighted graph G(V E) torepresent onersquos driving behaviors V v1 v2 vp is the
set of visiting places and E wij (vi vj) ∣ vi vj isin V isthe set of driving trajectories in which wij represents alltrajectories from visiting place vi to visiting place vj In sucha weighted graph a vertex represents a visiting place anda line represents a driving trajectory
461 Visiting Places We rst consider the starting pointand the ending point of each driving and depict these pointsin their spatial and temporal contexts including latitudelongitude and time of day e typical starting and endingpoint sets of a vehicle can be depicted as Figure 8(a) whichrepresent the visiting places of a vehicle owner en we useK-means clustering to process these points which isa commonly used data clustering for performing un-supervised learning tasks As shown in Figure 8(b) some setsof visiting places as V v1 v2 vp are found byeliminating the noise data
462 Driving Trajectories With a driving history data setDwe can nd E wij (vi vj) ∣ vi vj isin V as onersquos drivingtrajectories To a record in D we put the starting pointand the ending point into the visiting place setsV v1 v2 vp and nd the values of i and j inwijuswe can classify the driving history data in D into the line setsE of the weighted graph G(V E)
At the same time the location records in E are con-verted into some road IDs through map matching Itmeans that repeating driving can be integrated and thedata size of E can be reduced In addition there are sometrajectories that cannot be classied into the line set Ewhich can be stored for later learning People may changetheir visiting places and paths and form new mobilitymodels
47 eft Decision After building a mobility model basedon driving history we need to decide under what condi-tions a driving behavior can be regarded abnormal Sincesuch abnormal may disobey the temporal and spatialregularities of the mobility model of the vehicle we mainlyconsider some driving features with obvious temporal andspatial regularities as the most important factors in theftdecision
Here we discuss three factors in driving such as currentlocation current driving direction and the distance betweencurrent driving and historical driving Correspondingly weset three rules based on these factors for determiningwhether theft happens as follows
471 Location Rule As discussed above more than 70 ofthe overall driving is to two to four main visiting places forexample a regular driving largely happens between some ofthe most visiting places Furthermore a driver is usuallyfamiliar with those roads to those places which makes theshortest path or the most convenient path to be chosen atrstus we can make a location rule as follows if a vehicleis on the roads it most travelled in history the chance ofvehicle theft is low
Suppose (xc yc) is current location and ID(xc yc)represent the ID of the road that current location belongs toTo a line set E wij (vi vj) ∣ vi vj isin V the location rulecan be written as follows
sgn xc yc( ) 1 if ID xc yc( ) isin E0 if ID xc yc( ) notin E
(9)
0 1 2 3 4 5 6 7 01
23
0
5
10
15
20
25
Tim
e
LongitudeLatitude
(a)
0 1 2 3 4 5 6 7 005
115
225
0
5
10
15
20
25
Tim
e
LongitudeLatitude
(b)
Figure 8 Visiting place sets (a) Before clustering (b) After clustering
Mobile Information Systems 11
472 Direction Rule Sometimes a driver will take a newpath to a familiar place due to road close trac jammissing highway exit making a wrong turn or otherreasons Although the path is new the travelling desti-nation is still the most visiting place us we can makea direction rule as follows if a vehicle is on the roads to itsmost visiting place in history the chance of vehicle theft islow
In this case with a start location Ls(xs ys) and currentlocation Lc(xc yc) we can get a driving direction vectorvscrarr (xc minusxs yc minusys) en we can obtain the directionvectors from the start location to the cluster centers of thevisiting place sets as vrarrs1 v
rarrs2 v
rarrssminus1 v
rarrss+1 v
rarrsp
Each of them indicates a potential driving path to a knownvisiting place
Moreover we can nd the angles between currentdriving direction and all possible driving directions toknown visiting places With i 1 2 sminus 1 s + 1 pthe angles θcsi can be written as follows
θcsilang vrarrsc vrarrsirang arccos
vrarrsc middot vrarrsi
vrarrsc
∣∣∣∣∣∣∣∣ middot vrarrsi
∣∣∣∣∣∣∣∣
( ) (10)
Later we can select two minimum angles as θmin1 θmin2from θcsi
θmin1 θmin2 min θcs1 θcs2 θcsp (11)
Finally the direction rule for example the safety prob-ability based on driving direction can be written as follows
P1 1minusθmin1
θmin1 + θmin205leP1 le 1( ) (12)
An example of the direction rule is given in Figure 9 Ina 2D plane a vehicle starts from the place A but does not takeany history path Here we take themost probable destinationsas the place B and C because β θmin1 and α θmin2 are thetwo minimum angles between current direction and possibledirections en we have βlt α which indicates that thechance of driving to the place C is bigger
473 Distance Rule e time criterion in driving does notappear in the rst two rules but it is always eective For
example people often start cars in workday morning butseldom drive at night us we can make a distance rule asfollows if a driving is near to the driving in history thechance of vehicle theft is low
In the 3D coordination shown in Figure 8(b) we can getthe center of each cluster as Qi(xi yi Ti) With a start pointQs(xs ys Ts) and current point Qc(xc yc Tc) we can writethe distance rule for example the safety probability based onthe distance between current driving and historical drivingas follows
P2 1minussum pi1 d Qc Qi( )minus d Qs Qi( )[ ]sum pi1max d Qc Qi( ) d Qs Qi( )
(13)
An example of the distance rule is given in Figure 10 Ina 3D space a vehicle drives from the point S to the point CSuppose all previous visiting places belong to onersquos lifecircle with a time criterion as L If the distance of SL islarger than that of CL it means a vehicle is getting awayfrom the ownerrsquos life circle In this case the chance ofvehicle theft increases
474 Deep Learning-Based eft Decision Combining thelocation rule the direction rule and the distance rule dis-cussed above we can obtain one triple feature sequence P
rarr
(P10 P
11 P
12)(P2
0 P21 P
22) (Pnminus10 Pnminus11 Pnminus12 ) from one
GPS sequence (x1 y1) (x2 y2) (xn yn) Pi0 is theresult of location rule form as Pi0 sgn(xi yi) e triplefeature sequence P
rarris less than GPS sequence with 1 step (P
rarr
length of nminus 1 GPS sequence length of n) since Pi1 and Pi2
are vectors which need to be calculated from two GPS pointsMoreover we label each triple feature sequence with a se-quence label For example we label the nminus 1 length featuresequence P
rarrwith 0 1nminus 1 middot middot middot nminus 1nminus 1 while it corre-
sponds to a theft event (negative sample) It is a labelsmoothing regularization (LSR) method [35] Otherwise welabel it with 0 0 0 (positive sample) e elements ineach label sequence represent the probability of theft eventand we use LSR which needs a powerful model to t the ruleof theft event
In this study we choose a special recurrent neuralnetwork named LSTM which is a powerful deep learningmodel and is ourish in speech recognition [36] and
β
α A
B
C
D
E
Figure 9 Destination rule for theft decision
0 1 2 3 4 5 6 7 005
115
225
0
5
10
15
20
25
Tim
e
Longitude Latitude
S
C
Figure 10 Distance rule for theft decision
12 Mobile Information Systems
machine translation [37] e LSTM takes a sequence ofhprime-dimension vectors and transforms each one intohprime-dimension vprimei e LSTM module can be denoted asfollows
ii fi oi gi( )T Wxvi +Whhiminus1 + b
ii fi oi gi( ) sig m ii( ) sig m fi( ) sig m oi( ) tan h gi( )( )
ci fi ⊙ ciminus1 + ii ⊙gihi oi ⊙ tan h ci( )
(14)We use only one layer LSTM network with hidden size
256 since our dataset is limited e detail experimentsettings and results are shown in Section 52
5 Performance Evaluation
In this section after a brief introduction of testbed wepresent the evaluations of various aspects of the PhoneInsidesystem including distance estimation map matching po-sitioning accuracy theft detection and system cost
51 Testbed To evaluate the PhoneInside system we need totest our designs in realistic driving It is not easy to buildsuitable testbed to nish experiment and comparison Wefound 16 volunteers most of them are school employees toattend our experiments Each volunteer has a private car Weprepared 16 Android smartphones as anti-theft device in-cluding Google Nexus 5 Galaxy S3 and Huawei 3C Eachuser embedded one phone in hisher vehicle body andmatched it to hisher private phone In addition all userswere asked to run our application in their private phonesduring driving which also collects GPS traces as referencetrajectories
After a 3-month test we take back data from the em-bedded phones and the ownerrsquos phone and evaluate theperformance of the PhoneInside system A total trace of 4833trips are found which involves 48900 km travelling eaverage driving to each volunteer is about 336 times per daywith a distance of 34 km one day
In order to train an ecient neural network sucienttraining data are necessary Among the volunteers 10 ofthem are picked up to simulate vehicle theft Each volunteerdrives on each vehicle with three times one for normaldriving one for abnormal driving and another one fornormal driving on unusual paths For the collected trips weuse dierent sample steps on the GPS trajectories to makedata enhancement which can enlarge the dataset by a factorof 100 At last we label the 3000 trajectoriesGPS sequenceswith LSR (which is discussed in Section 47) for furtherprocessing
52 Performance
521 Dead Reckoning As shown in Table 1 there are twokinds of landmarks in traditional dead reckoning which arestops and turns at intersections Now we mainly use three
kinds of landmarks in VA-DR as stops turns at in-tersections and turns at curves (that are marked as S Ti andTc in Figure 11) Bounces are also velocity-aware landmarksbut seldom appear in trajectory computation Since distanceestimation between two landmarks is the fundamental stepof localization we can compare the average errors of dis-tance estimation between dierent landmarks e GPStraces between these landmarks which obtained from theownerrsquos phone are used as accurate distance values
As shown in Figure 11 the average error in dead reck-oning is about 58 VA-DR greatly improves the estimationthat related to velocity-aware landmarks as Ti and Tc whichis not surprising for VA-DR is designed to do that
522 Map Matching We mainly consider two factors af-fecting matching for example base station and distanceSince the vehicle is rst located through cellular localizationan error region inmatching is roughly decided by the numberof base station According to the studies in cellular locali-zation [2 3] the coverage of base station plays a vital role inlocalization If the coverage is small there are dense towerdeployment that represents a small error region in mapmatching On the contrary a larger coverage means fewer celltowers can be used for localization As shown in Figure 12(a)the coverage is ranging from 500 to 3500m which representsan accuracy from 100m to nearly 1300m [2] We test NSMVA-DRmatching and HMMmatching (Section 21) and ndall error segments in matching process with the rising of basestation coverage Compared NSM and VA-DR matchingHMM matching show better performance in which theglobal knowledge of trajectory is considered In incrementalmatching schemes VA-DRmatching is better than NSM dueto more accurate trajectory based on VA-DR
In Figure 12(b) the impact of travel distance is shownWith an increase of travel distance HMM matching showsbetter with longer travel distance and more knowledge NSMdoes not show this trend in which incremental matching
SS STi STc TiTi TiTc TcTc0
10
20
30
40
50
60
70
Erro
r (
)
DRAV-DR
Figure 11 Error in distance estimation
Mobile Information Systems 13
cannot x previous errors in travelling VA-DR matchingrises rst and falls later when a vehicle travels further Itproves that the problem of local best exists if there is no globalknowledge However VA-DR matching has a highest hittingrate in the matching with short distance in which localcharacteristics as accurate trajectory based on VA-DR playan important role in incremental matchingus an accurateand fast localization is feasible in the early stage of vehicletracking
523 Positioning Accuracy Table 2 summarizes the sta-tistics of positioning accuracy in our test which providethe nal performance for vehicle recovering e basiclocalization scheme of our system is cellular localizationand VA-DR with an accuracy of 468 m For those systemthat can receive GPS signals the accuracy increases to147 m though GPS and VA-DR If there is no VA-DRcellular localization and traditional dead reckoningachieve an accuracy of 724 m If there is a back server tosupport online HMMmatching the accuracy will be up to417 m
As discussed in Section 3 a vehicle can be easily found bypeople within 50 meters Using cellular localization and VA-DR is an energy-ecient solution to achieve this goalMoreover it is also a cost-ecient scheme to achieve this
goal for a HMM matching process requires the support ofback server and 3G4G connections (Section 2) Generallythe scheme of cellular localization and VA-DR ts oursystem well and may be useful to many car navigationsystems as an auxiliary localization method
524 eft Detection(a) Experiment settings we use one layer LSTM network
with 256 hidden units to build our deep learningmodel e weights are initialized with truncatednormal distribution of 0 mean and 01 standard de-viation We choose RMSProp as training optimizerwith a learning rate of 0002 and use cross entropy
500 1000 1500 2000 2500 3000 35000
10
20
30
40
50
60
70
80
90
100
Base station coverage (m)
Righ
t seg
men
t rat
e (
)
NSMVA-DR matchingHMM matching
(a)
5 10 15 20 25 30 350
10
20
30
40
50
60
70
80
90
100
Travel distance (km)
Righ
t seg
men
t rat
e (
)
NSMVA-DR matchingHMM matching
(b)
Figure 12 Map matching (a) Base station factor (b) Distance factor
Table 2 Accuracy of dierent localization methods
Scheme Mean (m) STD (m)Cellular +DR 724 559Cellular +HMM 417 312Cellular +VA-DR 468 376GPS+VA-DR 147 284
Lossloss
135
130
125
120
115
110
105
100
0950
000
0
200
0
400
0
600
0
800
0
100
0k
120
0k
140
0k
160
0k
180
0k
200
0k
Figure 13 e training procedure of the LSTM model
14 Mobile Information Systems
with the sigmod function e implementation of themodel uses a public deep learning library TensorFlowand is trained on a server with 4 GTX1080 GPUs and8GB memory e batch size is set to 8 and a validtraining have 3750 iterations which costs about 10minutes After that the LSTM model is deployed onthe smartphone to test
(b) Training based on the simulation dataset of theft de-tection Figure 13 shows the training procedure of theLSTM model e loss is stably decreasing with theincreasing of iteration numberWe also add the dropoutmethod and the output keeps a probability of 08 emodel is converged since the loss is less than 100
(c) Test the trained model is tested on the simulatedvehicle theft dataset discussed in the last subsectionand the test results are shown in Table 3 In Table 3 wecan find that the true positive rate is about 093 whilethe false positive rate is 0068 As a second theft de-tection mechanism our system could achieve a verylow false positive rate with the help of phone-based adhoc authentication e average delay time of alarm isalso low which indicates that our system could sendout alarm in time and track a stolen vehicle quickly
525 System Cost In our system the obsolete smartphoneis installed with a recharger which obtains power supplyduring driving and relies on its own battery in parking timeWith the help of Android system monitor we record theaverage power consumption of PhoneInside app running indifferent states and find the following results in Table 4
In the Idle state the car is parked and the system detectspossible vehicle moving with the accelerometer and gyro-scope In this case the energy consumption is about3439mW and the system keeps running about 682 hours inaverage But it does not mean that our system will be out offunction after three days As soon as the car is driving thesystem will keep tracking after a restarting period In theTracking andeft Detectingmodes the energy consumptionrises to 4855mW and 6725mW respectively ere is noenergy limit because the car is in driving and the recharger isworking According to NHTS [32] the average driving time isabout 55 minutes one day e power consumption of oursystem in daily use is about 229748mAh one day which isvery near to a smartphone in standby mode
Another cost lies in the SMSmessages as communicationcost ineft Detecting mode At a frequency of one messageevery 3 minutes the system will send out 40 messages ina two-hour driving After the vehicle is parked the systemdoes not send messages and the last SMS indicates theposition of the vehicle Since vehicle theft is an event witha very low probability sending some messages is acceptableto most vehicle owners
Generally we can draw a conclusion that our scheme islow cost in daily use and longtime tracking with very lowenergy cost and communication cost
6 Conclusion and Perspective
Motivated by substantial losses of vehicle theft we proposePhoneInside to make the best of obsolete smartphones forvehicle safety e basic idea of PhoneInside is simple if wehave to discard old phones why not keep them to protectour cars as free anti-theft devices
In the paper we first explain hardware installation anddescribe the system overview en we consider the systemdesign step by step and investigate the challenges in it Usinga novel dead-reckoning method we achieve an energy-efficient tracking with enough accuracy At the same timewe use individual driving history to distinguish abnormaldriving and construct a convenient and effective anti-theftmechanism including ad hoc authentication and deeplearning-based driving abnormal detection At last theexperiment results show that our system can detect vehicletheft effectively and locate a stolen vehicle accurately
Since some implementation issues have not been care-fully considered we list them as future work
(1) e algorithm of VA-DR matching(2) e rules to distinguish abnormal driving(3) More training data for LSTM(4) More smartphone OS supports
Conflicts of Interest
e authors declare that they have no conflicts of interest
References
[1] G Tan M Lu F Jiang K Chen X Huang and J WuldquoBumping a bump-aided inertial navigationmethod for indoorvehicles using smartphonesrdquo IEEE Transactions on Parallel andDistributed Systems vol 25 no 7 pp 1670ndash1680 2013
[2] L Xiong ldquoA selective model to suppress NLOS signals inangle-of-arrival (AOA) location estimationrdquo in Proceedings ofthe Ninth IEEE International Symposium on Personal Indoorand Mobile Radio Communications 1998 vol 1 pp 461ndash465Boston MA USA September 1998
[3] L Cong and W Zhuang ldquoNon-line-of-sight error mitigationin tdoa mobile locationrdquo in Proceedings of the Global Telecom-munications Conference (GLOBECOMrsquo01) vol 1 pp 680ndash684San Antonio TX USA November 2001
[4] R Toledo-Moreo D Betaille and F Peyret ldquoLane-level integrityprovision for navigation and map matching with gnss deadreckoning and enhancedmapsrdquo IEEE Transactions on IntelligentTransportation Systems vol 11 no 1 pp 100ndash112 2010
Table 3 Test of vehicle theft
Alarm No alarm Average delay timeNormal 0068 093 034 (h)Abnormal 0932 007 03 (h)
Table 4 Power consumption in different states
State Power (mW) Lasting time (h)Idle 3439 682Tracking 4855 No limiteft detecting 6725 No limit
Mobile Information Systems 15
[5] E D Martı D Martın J Garcıa A de la EscaleraJ M Molina and J M Armingol ldquoContext-aided sensorfusion for enhanced urban navigationrdquo Sensors vol 12 no 12pp 16802ndash16837 2012
[6] K Yu and E Dutkiewicz ldquoGeometry and motion-basedpositioning algorithms for mobile tracking in nlos environ-mentsrdquo IEEE Transactions onMobile Computing vol 11 no 2pp 254ndash263 2012
[7] A iagarajan L Ravindranath K LaCurts et al ldquoVtrackaccurate energy-aware road traffic delay estimation usingmobile phonesrdquo in Proceedings of the 7th ACM Conference onEmbedded Networked Sensor Systems pp 85ndash98 BerkeleyCA USA November 2009
[8] A iagarajan J Biagioni T Gerlich and J Eriksson ldquoCo-operative transit tracking using smart-phonesrdquo in Proceedingsof the 8th ACM Conference on Embedded Networked SensorSystems pp 85ndash98 Zurich Switzerland November 2010
[9] A iagarajan L Ravindranath H Balakrishnan et alldquoAccurate low-energy trajectory mapping for mobile de-vicesrdquo in Proceedings of the 8th USENIX Conference onNetworked Systems Design and Implementation p 20 BostonMA USA MarchndashApril 2011
[10] H Wang Z Wang G Shen F Li S Han and F ZhaoldquoWheelloc enabling continuous location service on mobilephone for outdoor scenariosrdquo in Proceedings of the INFO-COM 2013 pp 2733ndash2741 Turin Italy April 2013
[11] S Guha K Plarre D Lissner et al ldquoAutowitness locating andtracking stolen property while tolerating gps and radio out-agesrdquo ACM Transactions on Sensor Networks vol 8 no 4p 31 2012
[12] V Kukshya H Krishnan and C Kellum ldquoDesign of a systemsolution for relative positioning of vehicles using vehicle-to-vehicle radio communications during gps outagesrdquo in Pro-ceedings of the Vehicular Technology Conference (VTCrsquo05)vol 2 pp 1313ndash1317 Stockholm Sweden MayndashJune 2005
[13] R Parker and S Valaee ldquoVehicle localization in vehicularnetworksrdquo in Proceedings of the Vehicular Technology Con-ference (VTCrsquo06) pp 1ndash5 Melbourne Australia May 2006
[14] H Gong L Yu and X Zhang ldquoSocial contribution-basedrouting protocol for vehicular network with selfish nodesrdquoInternational Journal of Distributed Sensor Networks vol 10no 4 p 753024 2014
[15] H Guo H Cheng Y Wu et al ldquoAn automotive securitysystem for anti-theftrdquo in Proceedings of the Eighth In-ternational Conference on Networks (ICNrsquo09) pp 421ndash426Cancun Mexico March 2009
[16] V K Sadagopan U Rajendran and A J Francis ldquoAnti theftcontrol system design using embedded systemrdquo in Proceedingsof the IEEE International Conference on Vehicular Electronicsand Safety (ICVESlsquo11) pp 1ndash5 Beijing China July 2011
[17] O Hongzhi W Xinlin Z Weihua and L Yuehua ldquoDesign ofauto-guard system based on rfid and networkrdquo in Proceedingsof the International Conference on Electric Information andControl Engineering (ICEICErsquo2011) pp 1292ndash1295 WuhanChina April 2011
[18] D A Johnson and M M Trivedi ldquoDriving style recognitionusing a smartphone as a sensor platformrdquo in Proceedings ofthe 14th International IEEE Conference on Intelligent Trans-portation Systems (ITSClsquo2011) pp 1609ndash1615 HamburgGermany September 2011
[19] M Khalid A Wahab and N Kamaruddin ldquoReal time drivingdata collection and driver verification using CMAC-MFCCrdquo inProceedings of the 2008 International Conference on ArtificialIntelligence (ICAIrsquo08) pp 219ndash224 LasVegasNVUSA July 2008
[20] H Eren S Makinist E Akin and A Yilmaz ldquoEstimatingdriving behavior by a smartphonerdquo in Proceedings of theIntelligent Vehicles Symposium (IVrsquo2012) pp 234ndash239 Alcalde Henares Madrid Spain June 2012
[21] H Song S Zhu and G Cao ldquoSVATS a sensor-network-based vehicle anti-theft systemrdquo in Proceedings of the 27thConference on Computer Communications IEEE INFOCOM2008 pp 2128ndash2136 Phoenix AZ USA April 2008
[22] R Lu X Lin H Zhu and X Shen ldquoSPARK a new vanet-based smart parking scheme for large parking lotsrdquo in Pro-ceedings of the IEEE INFOCOM 2009 pp 1413ndash1421 Rio deJaneiro Brazil April 2009
[23] R Bhoraskar N Vankadhara B Raman and P KulkarnildquoWolverine traffic and road condition estimation using smart-phone sensorsrdquo in Proceedings of the Fourth International Confer-ence on Communication Systems and Networks (COMSNETSlsquo12)pp 1ndash6 Bangalore India January 2012
[24] E Abbott and D Powell ldquoLand-vehicle navigation usingGPSrdquo Proceedings of the IEEE vol 87 no 1 pp 145ndash162 1999
[25] O J Woodman ldquoAn introduction to inertial navigationrdquoTech Rep UCAMCL-TR-696 Computer Laboratory Uni-versity of Cambridge Cambridge UK 2007
[26] A Lawrence Modern Inertial Technology NavigationGuidance and Control Springer Berlin Germany 1998
[27] V Marotto M Sole T Dessı A Manchinu D Carboni andA Serra ldquoOrientation analysis through a gyroscope sensor forindoor navigation systemsrdquo in Proceedings of the FourthInternational Conference on Sensor Device Technologies andApplications pp 85ndash90 Barcelona Spain August 2013
[28] D M Boore ldquoAnalog-to-digital conversion as a source of driftsin displacements derived from digital recordings of groundaccelerationrdquo Bulletin of the Seismological Society of Americavol 93 no 5 pp 2017ndash2024 2003
[29] Lane width chapter 3 e 13 controlling criteriardquo 2013 httpsafetyfhwadotgovgeometricpubsmitigationstrategieschapter33_lanewidthhtm
[30] W Hsu T Spyropoulos K Psounis and A Helmy ldquoModelingtime-variant user mobility in wireless mobile networksrdquo in Pro-ceedings of the 26th IEEE International Conference on ComputerCommunications IEEE (INFOCOMlsquo2007) pp 758ndash766 An-chorage AK USA May 2007
[31] M Gonzalez C Hidalgo and A Barabasi ldquoUnderstandingindividual human mobility patternsrdquo Nature vol 453 no 7196pp 779ndash782 2008
[32] National household travel surveyrdquo 2001 httpwwwbtsgovprogramsnational_household_travel_survey
[33] S Schonfelder and S Raumplanung ldquoSome notes on spacelocation and travel behaviourrdquo in Proceedings of the 1st SwissTransport ResearchConference Ascona SwitzerlandMarch 2001
[34] S Schonfelder and U Samaga ldquoWhere do you want to gotodayndashmore observations on daily mobilityrdquo in Proceedingsof the 3rd Swiss Transport Research Conference AsconaSwitzerland July 2003
[35] C Szegedy V Vanhoucke S Ioffe J Shlens and Z WojnaldquoRethinking the inception architecture for computer visionrdquoin Proceedings of the Computer Vision and Pattern Recogni-tion pp 2818ndash2826 Las Vegas NV USA JunendashJuly 2016
[36] D Amodei R Anubhai E Battenberg et al ldquoDeep speech 2end-to-end speech recognition in english and mandarinrdquoComputer Science 2015
[37] M T Luong H Pham and C D Manning ldquoEffective ap-proaches to attention-based neural machine translationrdquoComputer Science 2015
16 Mobile Information Systems
Computer Games Technology
International Journal of
Hindawiwwwhindawicom Volume 2018
Hindawiwwwhindawicom
Journal ofEngineeringVolume 2018
Advances in
FuzzySystems
Hindawiwwwhindawicom
Volume 2018
International Journal of
ReconfigurableComputing
Hindawiwwwhindawicom Volume 2018
Hindawiwwwhindawicom Volume 2018
Applied Computational Intelligence and Soft Computing
thinspAdvancesthinspinthinsp
thinspArtificial Intelligence
Hindawiwwwhindawicom Volumethinsp2018
Hindawiwwwhindawicom Volume 2018
Civil EngineeringAdvances in
Hindawiwwwhindawicom Volume 2018
Electrical and Computer Engineering
Journal of
Journal of
Computer Networks and Communications
Hindawiwwwhindawicom Volume 2018
Hindawi
wwwhindawicom Volume 2018
Advances in
Multimedia
International Journal of
Biomedical Imaging
Hindawiwwwhindawicom Volume 2018
Hindawiwwwhindawicom Volume 2018
Engineering Mathematics
International Journal of
RoboticsJournal of
Hindawiwwwhindawicom Volume 2018
Hindawiwwwhindawicom Volume 2018
Computational Intelligence and Neuroscience
Hindawiwwwhindawicom Volume 2018
Mathematical Problems in Engineering
Modelling ampSimulationin EngineeringHindawiwwwhindawicom Volume 2018
Hindawi Publishing Corporation httpwwwhindawicom Volume 2013Hindawiwwwhindawicom
The Scientific World Journal
Volume 2018
Hindawiwwwhindawicom Volume 2018
Human-ComputerInteraction
Advances in
Hindawiwwwhindawicom Volume 2018
Scientic Programming
Submit your manuscripts atwwwhindawicom
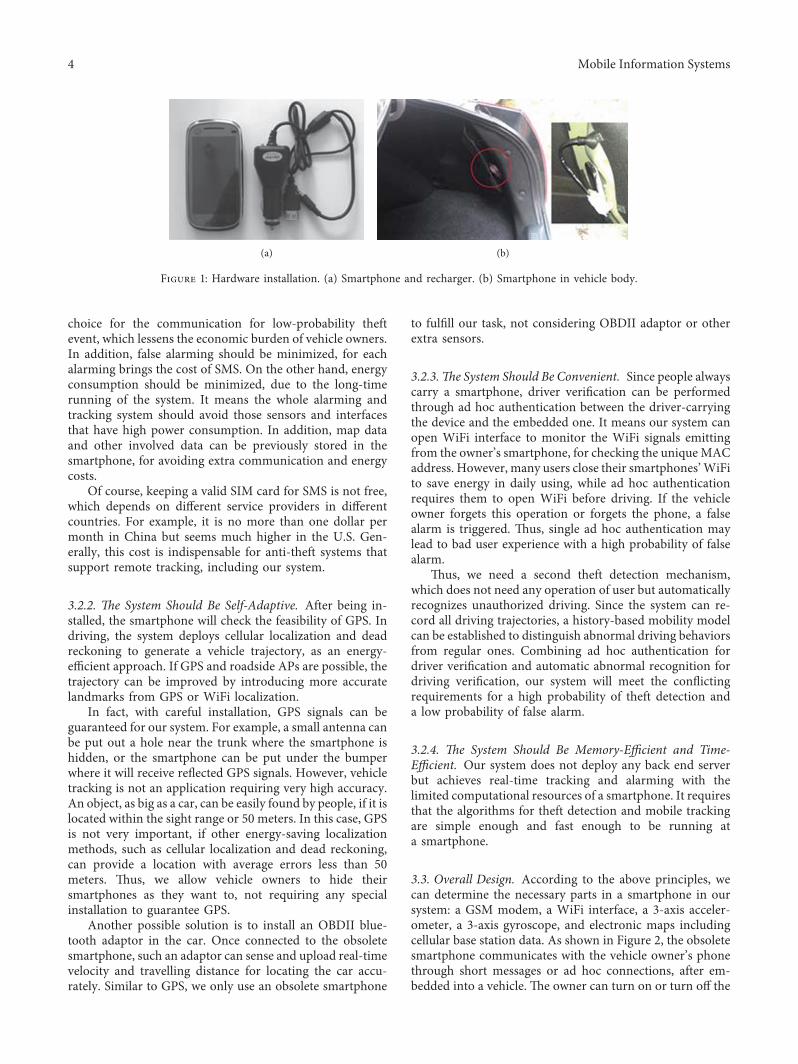
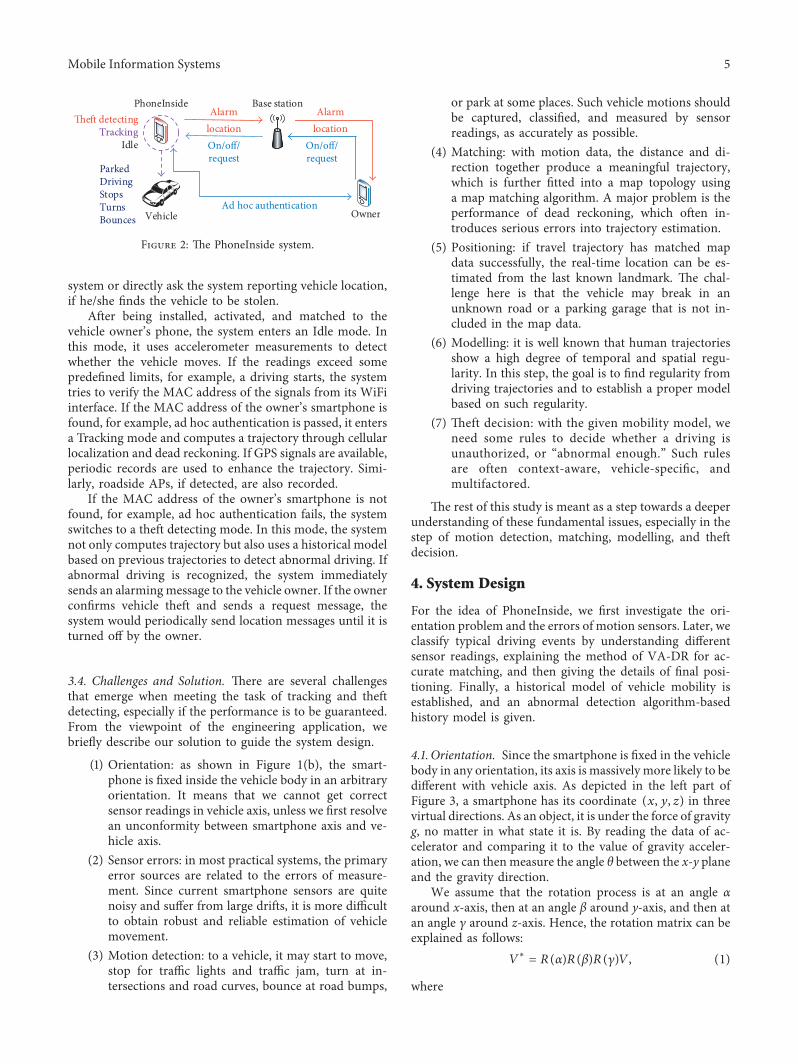
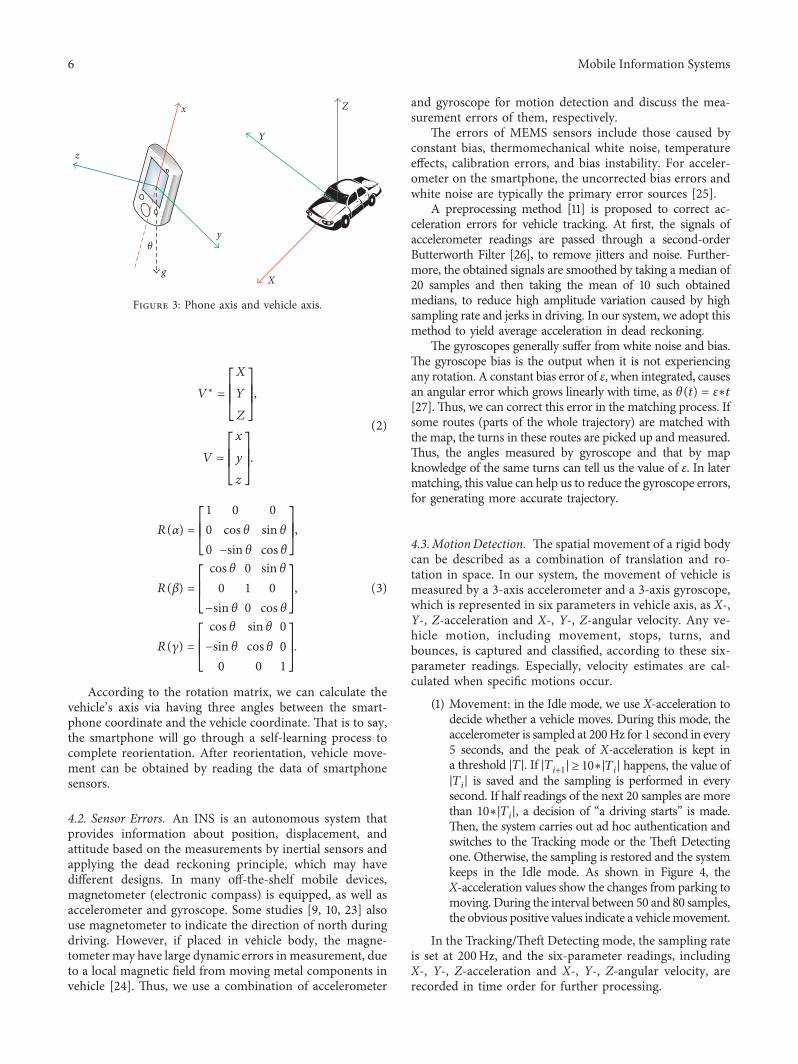
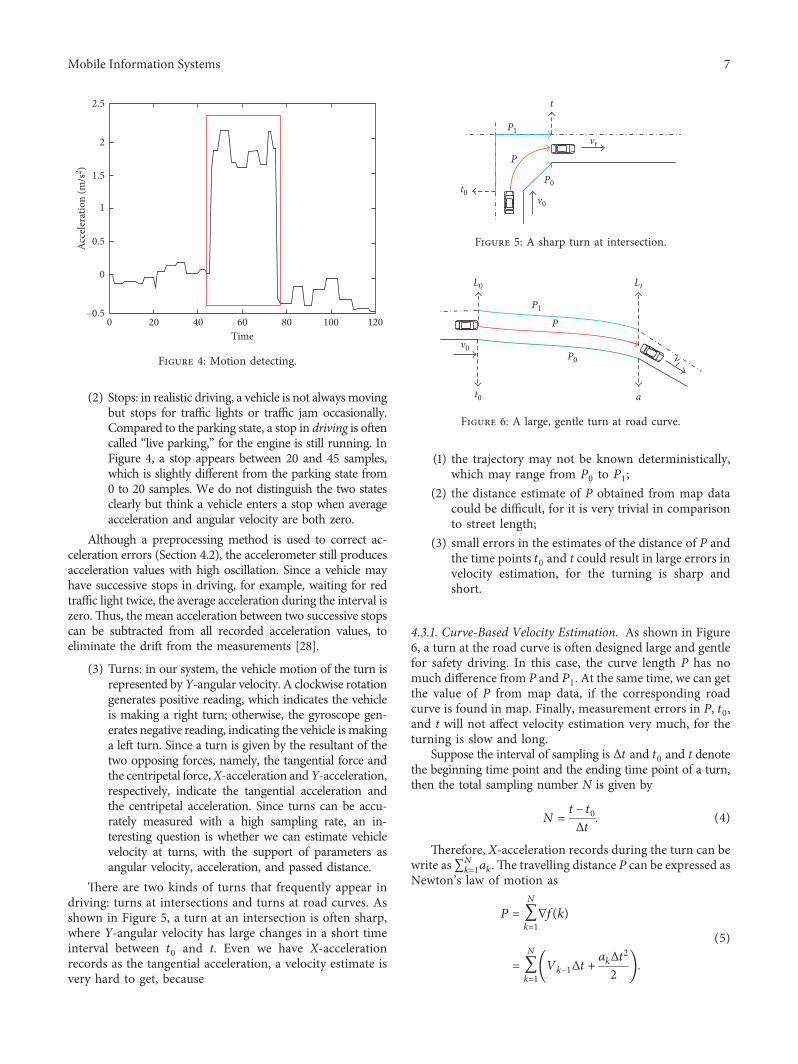
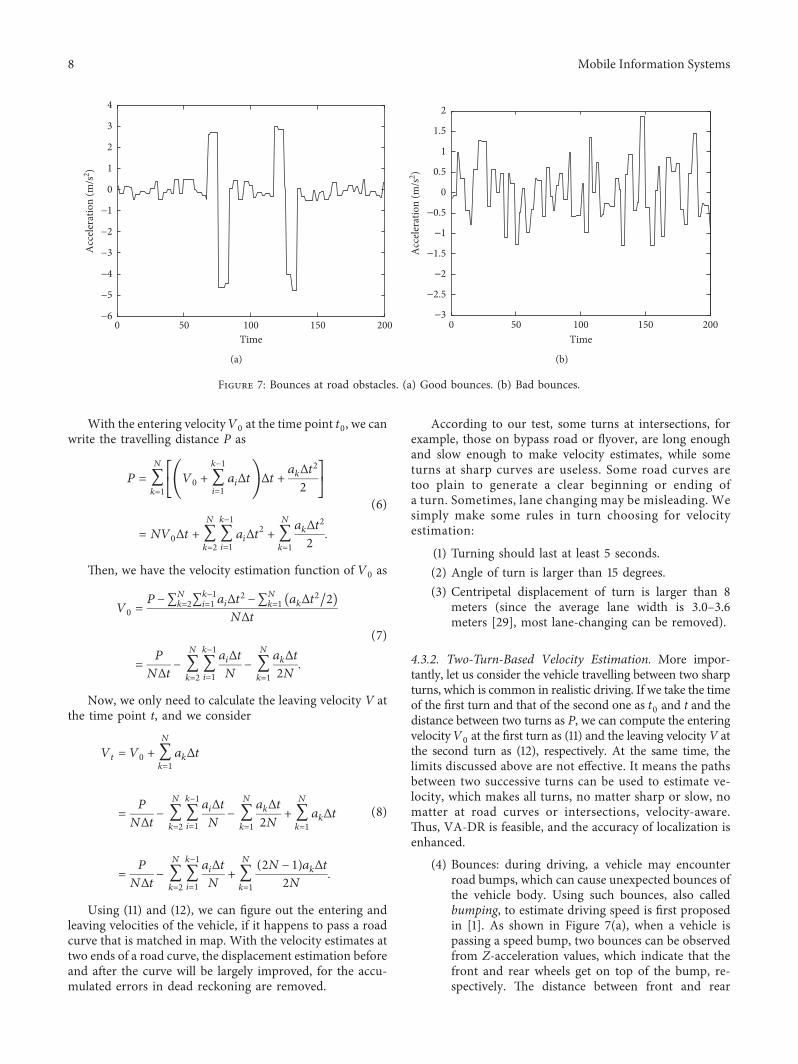
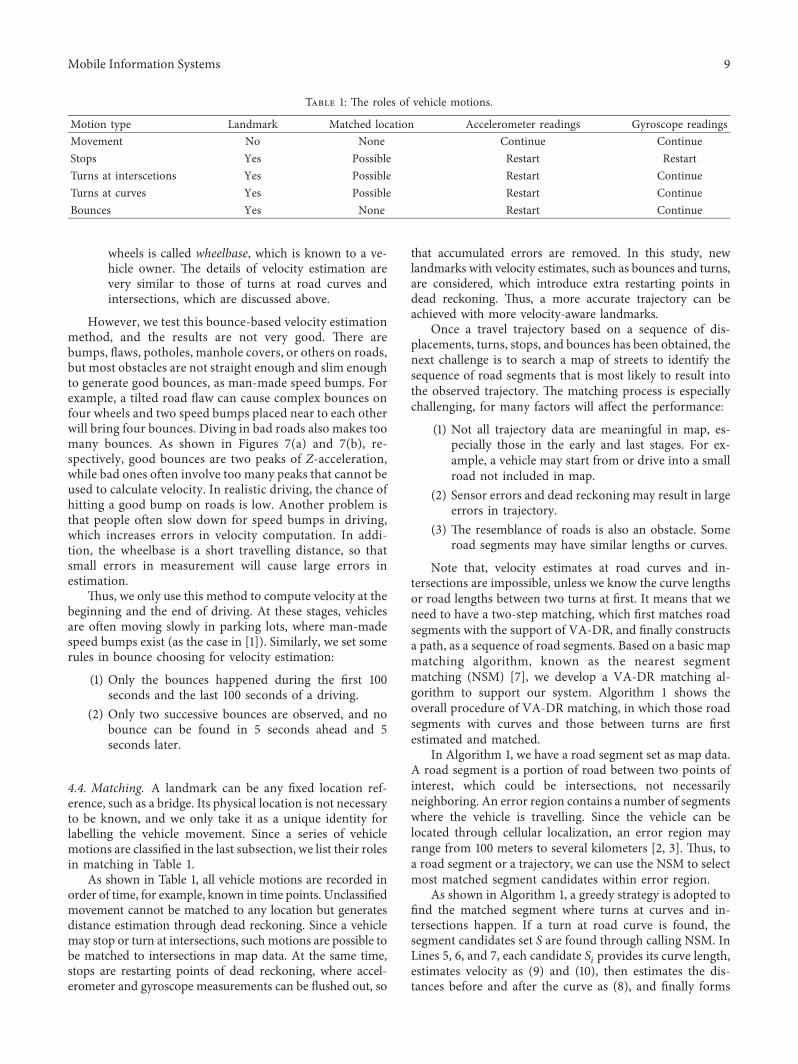
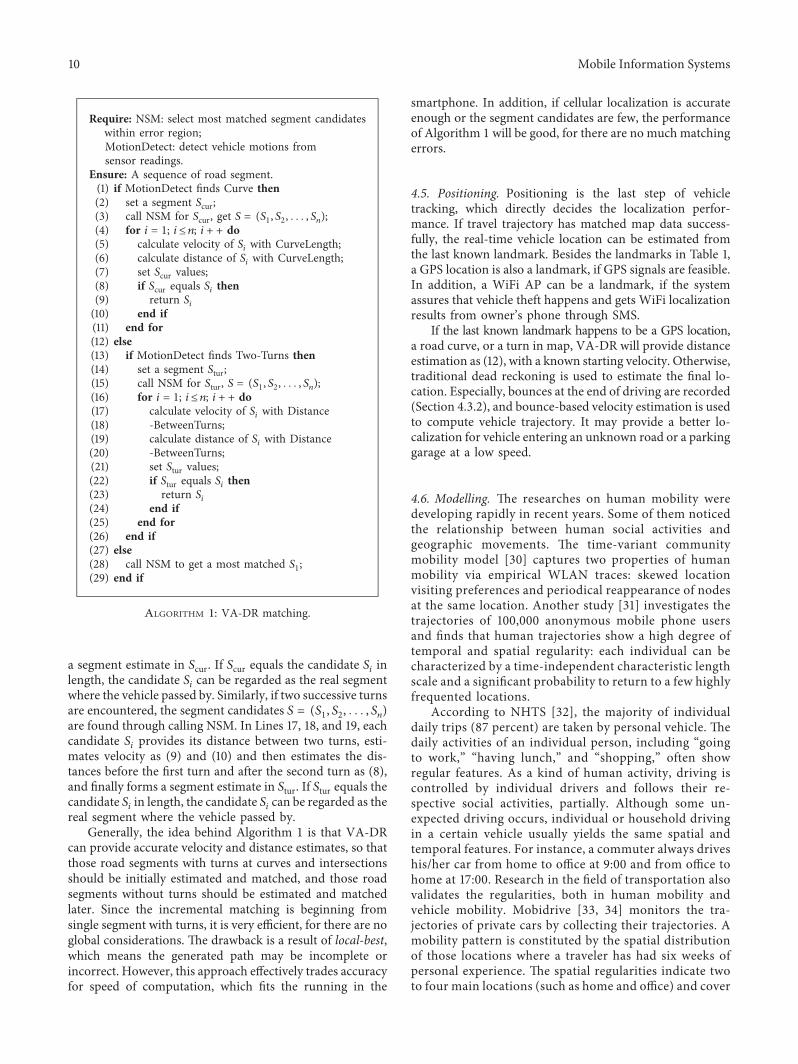
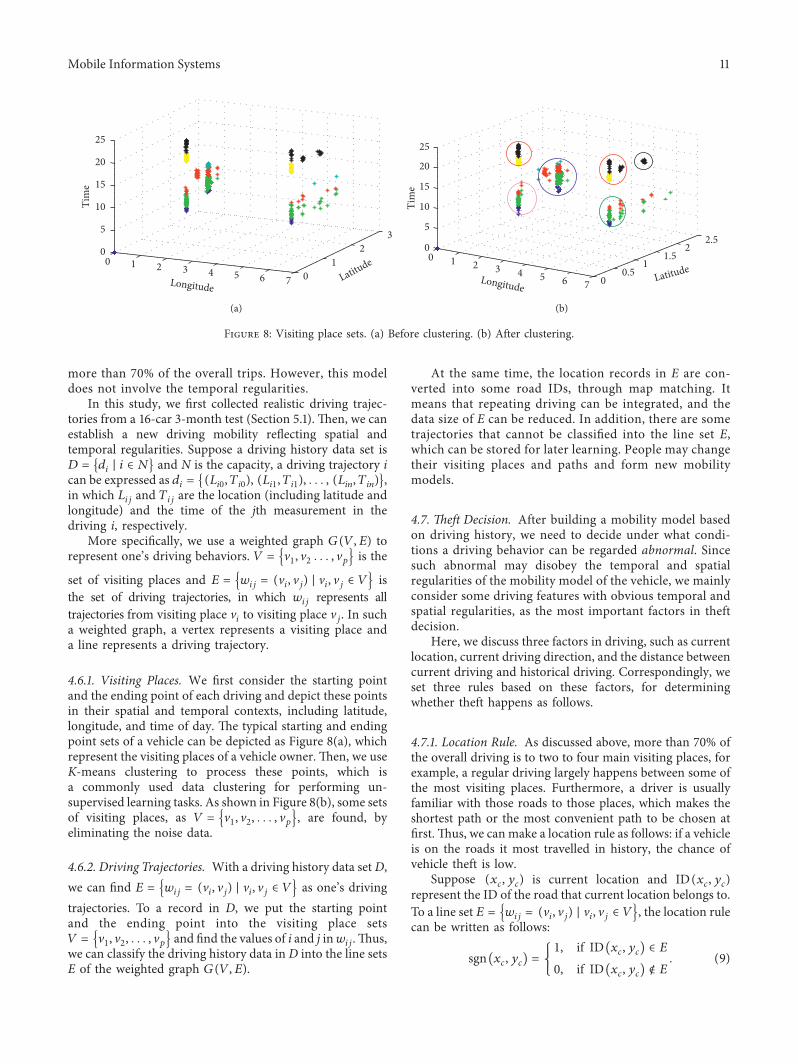
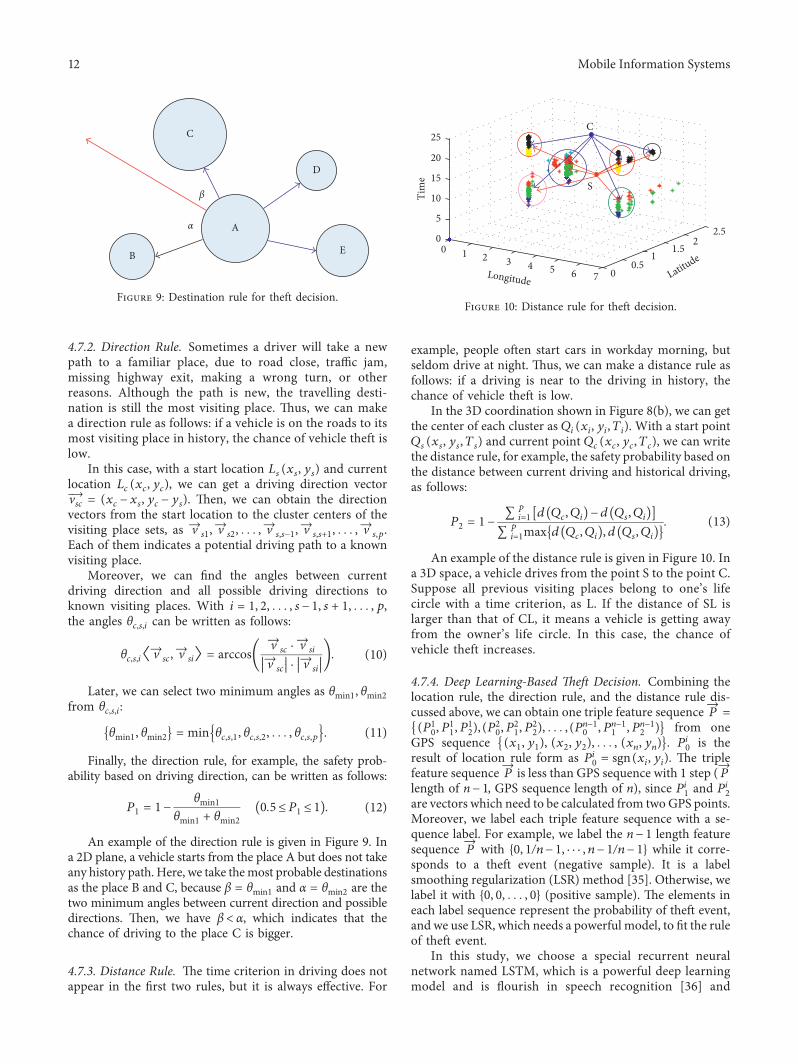
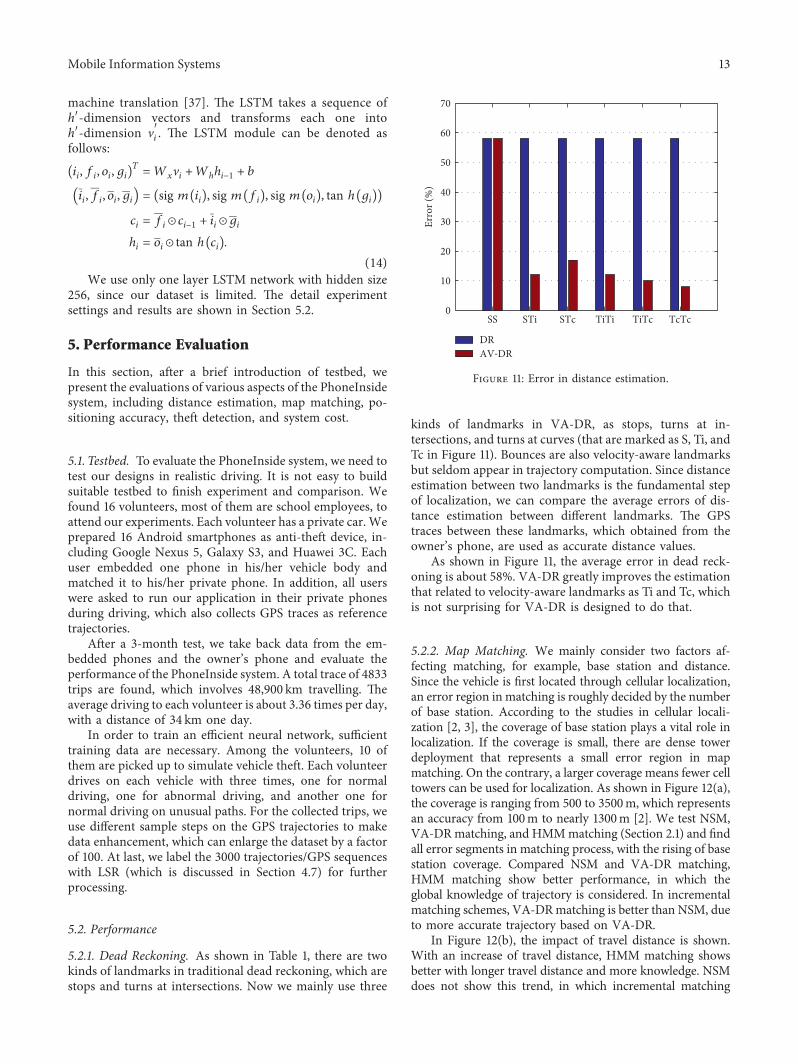
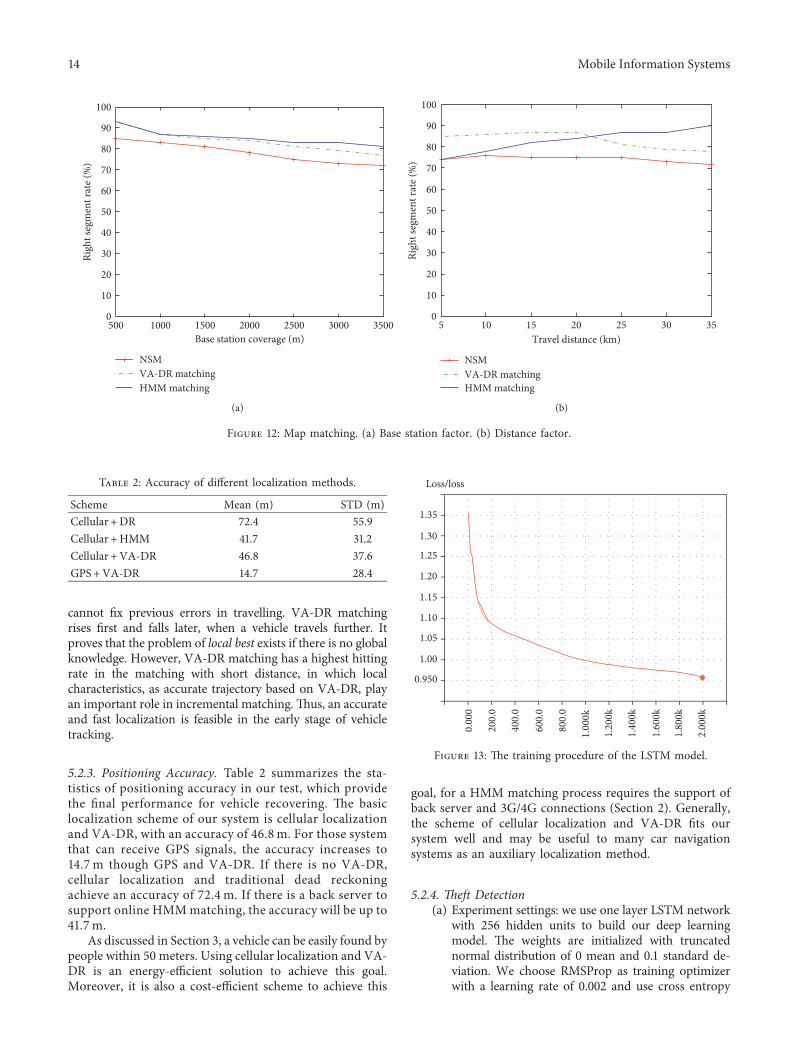
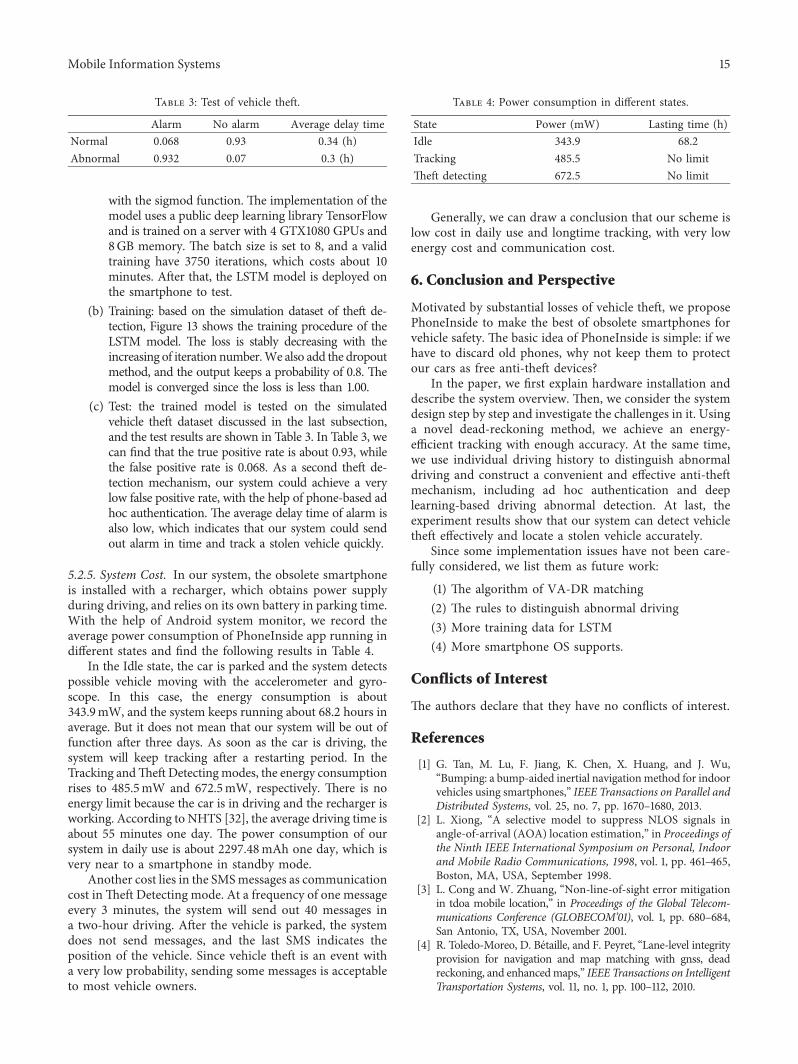


![Formation of a cytoplasmic salt bridge network in …...mechanism [10]. Mitochondrial carriers consist of three homologous sequence re-peats, each coding for two transmembraneα-helices[11].Alow-](https://img.pdfslide.us/doc/110x75/5e9747e74465ab275b6066fc/formation-of-a-cytoplasmic-salt-bridge-network-in-mechanism-10-mitochondrial.jpg)