Embed Size (px)
Citation preview
HYDROTHERMAL LIQUEFACTION OF MUNICIPAL WASTEWATER CULTIVATED ALGAE: INCREASING OVERALL SUSTAINABILITY AND VALUE STREAMS OF
ALGAL BIOFUELS
By
Griffin William Roberts
Submitted to the graduate degree program in Chemical and Petroleum Engineering and the Graduate Faculty of the University of Kansas in partial fulfillment of the requirements for the
degree of Doctor of Philosophy.
________________________________
Chairperson: Susan M. Stagg-Williams
________________________________
Belinda S.M. Sturm
________________________________
Laurence R. Weatherley
________________________________
Aaron M. Scurto
________________________________
Raghunath V. Chaudhari
Date Defended: April 27, 2015
ii
The Thesis Committee for Griffin William Roberts
certifies that this is the approved version of the following thesis:
HYDROTHERMAL LIQUEFACTION OF MUNICIPAL WASTEWATER CULTIVATED ALGAE: INCREASING OVERALL SUSTAINABILITY AND VALUE STREAMS
________________________________
Chairperson: Susan M. Stagg-Williams
Date approved: May 11, 2015
iii
Abstract
The forefront of the 21st century presents ongoing challenges in economics, energy, and
environmental remediation, directly correlating with priorities for U.S. national security.
Displacing petroleum-derived fuels with clean, affordable renewable fuels represents a solution
to increase energy independence while stimulating economic growth and reducing carbon-based
emissions. The U.S. government embodied this goal by passing the Energy Independence and
Security Act (EISA) in 2007, mandating 36 billion gallons of annual biofuel production by 2022.
Algae possess potential to support EISA goals and have been studied for the past 30-50 years as
an energy source due to its fast growth rates, noncompetitive nature to food markets, and ability
to grow using nutrient waste streams. Algae biofuels have been identified by the National
Research Council to have significant sustainability concerns involving water, nutrient, and land
use. Utilizing municipal wastewater to cultivate algae provides both water and nutrients needed
for growth, partially alleviating these concerns.
This dissertation demonstrates a pathway for algae biofuels which increases both
sustainability and production of high-value products. Algae are cultivated in pilot-scale open
ponds located at the Lawrence Wastewater Treatment Plant (Lawrence, KS) using solely effluent
from the secondary clarifier, prior to disinfection and discharge, as both water and nutrient
sources. Open ponds were self-inoculated by wastewater effluent and produced a mixed-species
culture of various microalgae and macroalgae. Algae cultivation provided further wastewater
treatment, removing both nitrogen and phosphorus, which have devastating pollution effects
when discharged to natural watersheds, especially in large draining watersheds like the Gulf
Coast. Algae demonstrated significant removal of other trace metals such as iron, manganese,

iv
barium, aluminum, and zinc. Calcium did not achieve high removal rate but did present a
significant portion of algae biomass total weight; wastewater treatment using nitrification
requires significant daily additions of buffers, most commonly lime or calcium hydroxide.
Accumulation of these ions and metals in wastewater-cultivated algae results in a biomass with
substantial amount of inorganic ash content. The cultivated biomass was converted to a carbon-
rich biocrude, similar to petroleum crude oil, through a process called hydrothermal liquefaction
(abbreviated as HTL), which uses subcritical water (water just below its supercritical point) as
the chemical driving force for conversion. Biomass HTL produces four product fractions; liquid
biocrude, solids (referred to as biochar), an aqueous product (referred to as aqueous co-product;
abbreviated as ACP), and gasses. Many factors contribute to the overall viability of using algae
HTL biocrude as a petroleum displacement, particularly yield and quality are important for
overall economics and ability to utilize existing refining infrastructure, respectively.
The HTL product distribution and quality of wastewater-cultivated algae has been found
to be extremely unique with significant advantageous over controlled fertilized growth strategies.
Biocrude yields of were typically lower but substantially higher quality with lower oxygen
content and higher amounts of direct fuel distillate fractions. This phenomenon is contributed to
the fact that large amounts of pure-phase substituted hydroxyapatite (a calcium orthophosphate
material) are synthesized in-situ, providing catalytically active sites. Hydroxyapatite
(abbreviated HA) is a widely studied material for bone (and dental) tissue regeneration purposes
and its acid-base catalytic properties. The specific HA produced during HTL of wastewater-
cultivated algae presents unique characteristics for performance and tunability in each respective
application, providing novel economic value streams for the production of algal biofuels. The
v
overall work of this dissertation concludes Lawrence Wastewater Treatment Plant could produce
10-18 barrels of crude oil and over 2 metric tons of refined hydroxyapatite per day for the
creation of revenue sales.
The work within this dissertation encompasses novelty of characterization methods, HTL
feedstocks, and identification of high-value products. Overall, efforts to demonstrate the
feasibility of a sustainable biofuel strategy resulted in formulating hypotheses which led to novel
discoveries in creating high-value heterogeneous catalysts and biomedical materials. The works
presented have the potential to produce an overall process capable of selling significant
quantities of biofuels as a by-product and not as the main economic generator, laying the
foundation of breakthrough technology which can meet and potentially exceed the $3 per gal
biofuel target.

vi
Acknowledgements
I would like to thank the support of the Madison and Lila Self Graduate Fellowship for
their financial support of my tenure at the University of Kansas. I thank my advisor(s) Susan
Stagg-Williams and Belinda Sturm and their research groups. A special thanks to Marie-Odile
Fortier for leading cultivation efforts and many conversations as well as Gabe Stanton, Umar
Hamdeh, Tiffany Kinsella, and Alejandra Rocha for all their hard work. Also, I would like to
acknowledge my undergraduate advisor(s) Paul Kenis and Sarah Perry and express a sincere
gratitude for each of my additional committee members; Aaron Scurto, Lawrence Weatherley,
and Raghunath Chaudhari.
I would like to thank the lifelong support of my friends and family. To my mother
Barbara, thank you for showing me how to strive for the best and achieve my goals. To my
father Hal, thank you for showing me the true nature of engineering and that you can build
anything from everything. I also would like to express my extreme gratitude to Jennifer
Melendez, whose steadfast support throughout the entire process was unprecedented. Thank you
for your endearing friendship, loving compassion, and momentous wonder as a human being,
mother, and partner.

vii
Dedicated to my children
Barrett and Viviana
In memory of
Jesse Wayne Manning
Feb. 10, 1984 – Jan. 26, 2003

viii
Preface
Significant portions of this dissertation have been previously published through the
American Chemical Society and Royal Society of Chemistry which hold original copyrights for
the content.
Reprinted with permission from Roberts, G. W.; Fortier, M.-O. P.; Sturm, B. S. M.; Stagg-
Williams, S. M., Promising Pathway for Algal Biofuels through Wastewater Cultivation and
Hydrothermal Conversion. Energy & Fuels 2013, 27, (2), 857-867. DOI: 10.1021/ef3020603.
Copyright 2015 American Chemical Society.
Roberts, G. W.; Sturm, B. S.; Hamdeh, U.; Stanton, G. E.; Rocha, A.; Kinsella, T. L.; Fortier,
M.-O. P.; Sazdar, S.; Detamore, M. S.; Stagg-Williams, S. M., Promoting catalysis and high-
value product streams by in situ hydroxyapatite crystallization during hydrothermal liquefaction
of microalgae cultivated with reclaimed nutrients. Green Chemistry 2015, 17, 2560.
DOI: 10.1039/C5GC00187K. Adapted with permission of the Royal Society of Chemistry.
ix
Table of Contents
Abstract .......................................................................................................................................... iii
Acknowledgements ........................................................................................................................ vi
Preface.......................................................................................................................................... viii
Table of Contents ........................................................................................................................... ix
List of Figures .............................................................................................................................. xiii
List of Tables ............................................................................................................................. xviii
1 Introduction ............................................................................................................................. 1
1.1 Biofuels ......................................................................................................................... 1
1.2 Algae ............................................................................................................................. 5
1.3 Wastewater Cultivation of Algae .................................................................................. 8
1.4 Hydrothermal Liquefaction (HTL) ............................................................................... 9
1.5 Research Goals............................................................................................................ 10
1.6 Research Work Overview and Outline ....................................................................... 11
1.7 References ................................................................................................................... 12
2 Hydrothermal Liquefaction Review ..................................................................................... 15
2.1 Background ................................................................................................................. 15

x
2.2 Literature Data ............................................................................................................ 16
2.3 References ................................................................................................................... 23
3 Experimental Materials and Methods ................................................................................... 27
3.1 Algae Cultivation ........................................................................................................ 27
3.2 Algae Characterization................................................................................................ 30
3.2.1 Proximate Analysis ...................................................................................... 30
3.2.2 Algae lot# 2013 Ash .................................................................................... 31
3.2.3 Ultimate analysis .......................................................................................... 32
3.2.4 Higher Heating Value (HHV) ...................................................................... 33
3.2.5 Proton Induced X-ray Emission (PIXE) ...................................................... 33
3.2.6 Inductively Coupled Plasma- Optical Emission Spectroscopy (ICP-OES) . 33
3.3 Hydrothermal Liquefaction (HTL) ............................................................................. 34
3.3.1 Reaction, Product Separation, and Yield Determination ............................. 34
3.4 Product Characterizations ........................................................................................... 41
3.4.1 Proximate Analysis ...................................................................................... 41
3.4.2 Ultimate analysis .......................................................................................... 41
3.4.3 Gas Chromatography-Mass Spectroscopy (GC-MS) ................................... 41
3.4.4 Simulated Distillation (SimDist).................................................................. 43
3.4.5 X-ray Diffraction (XRD) ............................................................................. 44
3.4.6 Fourier-Transform Inferred Spectroscopy (FTIR) ....................................... 44
3.4.7 Scanning Electron Microscopy -Energy Dispersive X-ray Spectroscopy (SEM-EDS) and Transmission Electron Microscopy (TEM) ...................... 44
3.4.8 Cell Culturing and Live/Dead Assay ........................................................... 45
3.5 References ................................................................................................................... 45
4 Demonstrating Sustainability through Wastewater-Cultivated Algae .................................. 47
4.1 Algae Growth and Characterization............................................................................ 48
xi
4.2 Algae lot# 2011 HTL Product Yields ......................................................................... 51
4.3 Algae lot# 2011 Biocrude Molecular Profile .............................................................. 53
4.4 Biocrude Energy and Heteroatom Content ................................................................. 64
4.5 HTL Co-Products ........................................................................................................ 68
4.6 Conclusions ................................................................................................................. 70
4.7 References ................................................................................................................... 72
5 Increasing Value-Added Product Streams ............................................................................ 75
5.1 Algae lot# 2013 Characterization and HTL Bulk Yields ............................................ 76
5.2 Wastewater Nutrient Removal .................................................................................... 79
5.3 In-situ Crystallization of Substituted Hydroxyapatite during HTL of Municipal Wastewater-Cultivated Algae ..................................................................................... 82
5.4 Conclusions ................................................................................................................. 89
5.5 References ................................................................................................................... 90
6 Hydroxyapatite Synergies and its Potential Applications ..................................................... 93
6.1 In-situ Catalytic Upgrading of the Biocrude from Hydroxyapatite Crystallization ... 94
6.2 Phase Tuning of Hydroxyapatite .............................................................................. 102
6.3 Cell Culturing on Hydroxyapatite Product ............................................................... 107
6.4 Conclusions ............................................................................................................... 109
6.5 References ................................................................................................................. 110
7 Future Directions ................................................................................................................ 112
7.1 Furthering Liquefaction Studies ............................................................................... 112
xii
7.1.1 Increasing Biocrude Productivity through Activated Municipal Sludge ... 112
7.1.2 Fraction Distillation of Biocrude for Complete End-Use Characterization113
7.1.3 Continuous HTL Operation with Regenerative Recycle ........................... 115
7.2 Continuing Catalytic Studies of Hydroxyapatite Product ......................................... 115
7.3 Bioactivity and Genealogical Promotion Studies of Hydroxyapatite Product .......... 118
7.4 References ................................................................................................................. 120
8 Concluding Remarks ........................................................................................................... 125

xiii
List of Figures
Figure 2-1. Product fractions for hydrothermal conversion of biomass. Main product for
HTC, HTL, and HTG are solid biochar, biocrude, and gasses, respectively. ....... 16
Figure 2-2. Van Krevelen diagram from literature HTL biocrude data contained in Table 2-1
and Table 2-2; identifying numbers correspond to the identifying numbers in
Table 2-3. .............................................................................................................. 21
Figure 3-1. Algae cultivation schematic at the wastewater treatment plant (WWTP). ........... 30
Figure 3-2. Product handling and recovery for Algae lot# 2011. (a) Flow diagram of product
handling, (b) Phase separation of HTL products: 1- solids, 2- ACP, 3- solids, 4-
dilute biocrude, and (c) pictures of main HTL products. ...................................... 36
Figure 3-3. Schematic of product handling and isolation for algae lot# 2013. ....................... 38
Figure 4-1. HTL yields from algae lot# 2011; reported on an afdw%. Error bars indicate
standard deviations, which could not be calculated for macroalgae due to limited
available biomass and restricting HTL experiments to two.................................. 53
xiv
Figure 4-2. GC-MS chromatograms for biocrude produced from microalgae from samples (a)
concentrated and derizatized with MSTFA and (b) dilute biocrude in decane
obtained as is from extraction procedure. ............................................................. 55
Figure 4-3. GC-MS chromatogram of dilute (in decane) biocrude from macro lot# 2011. .... 62
Figure 4-4. GC-MS of derivatized concentrated biocrude from (a) microalgae and (b)
macroalgae. ........................................................................................................... 63
Figure 4-5. Effect of gravity and surface tension, demonstrating relative viscosity, on droplets
of each biocrude produced. ................................................................................... 64
Figure 4-6. Van Krevelen diagram from Figure 2-2 including data from algae lot# 2011. .... 67
Figure 5-1. Proximate (TGA) and ultimate (CHN Analyzer) analysis of algae lot# 2013.
TGA plot indicates pyrolysis weight change (blue) and post pyrolysis combustion
(green) and corresponding derivative weight change, (purple) and (red),
respectively. Ultimate analysis is provided on a ash free dry weight percent
(afdw%)................................................................................................................. 77
Figure 5-2. Product Yields, and respective organic elemental content, from the HTL of algae
lot#2013. The organic recovery represents the fate of algal carbon and nitrogen

xv
toward each perspective product fraction. *oxygen calculated by difference; O =
100- C- H- N- ash [wt%] ...................................................................................... 79
Figure 5-3. (a) Integration of powder XRD of HTL solid product and combustion-produced
algal ash at a 2θ range of 20° to 70°; peaks for HA (green square), calcium oxide
(red triangle) and TCP (blue circle), JCPDS# 70-2005, are identified. (b) FTIR
spectrum of HTL solid product and algae ash; all peaks present in the range from
500-3700 cm-1 are shown. ..................................................................................... 84
Figure 5-4. HA product consists of hexagonal nanorods, which assemble into hierarchal
structures from bundles to sheets to flowers. TEM images of (a) well-defined
hexagonal nanocrystals which (b), aggregate to bundles along the c-axis. SEM
images of (c), ~40 µm particle with sheet and flower-like hierarchical
morphologies......................................................................................................... 87
Figure 5-5. SEM-EDS imaging and spectrum of a single particle of solid HTL product, scale
bar equals 10 µm, with elemental mapping of calcium, phosphorus, oxygen,
magnesium, and silicon. ........................................................................................ 89
Figure 6-1. GC-MS chromatogram from the biocrude (non-derivatized) produced through
HTL of algae lot#2013. ......................................................................................... 97
xvi
Figure 6-2. GC-MS chromatogram from the biocrude (derivatized) produced through HTL of
algae lot#2013. ...................................................................................................... 99
Figure 6-3. Simulated distillation via TGA of the biocrude and corresponding distillate
fractions found in the biocrude produced in the presence of HA crystallization.101
Figure 6-4. HA product transforms to tricalcium phosphate in stages up to 900 °C. Powder
XRD integration of 2θ from 20° to 70°; TCP begins to form at 600 °C until it is
the primary phase at 900 °C. Dashed red lines indicate characteristic peaks for
TCP. FTIR spectrum(s) showing hydroxyl (3300- 3800 cm-1), carbonate (1300-
1600 cm-1) and phosphate (500-1300 cm-1) regions. TCP retains silica
substitution dissimilar to the TCP form during combustion of algae lot# 2013
shown in Figure 5-3b. ......................................................................................... 104
Figure 6-5. HA (HTL solid product) proximate analysis and corresponding TGA plot;
carbonate loss associated with phase change are indicated with asterisk. .......... 105
Figure 6-6. SEM image of HTL solid product from algae lot# 2013 after calcining in air at
900 °C; hexagonal nano-rods (shown in Figure 5-4) have sintered into a globular
morphology indicative of TCP............................................................................ 106
xvii
Figure 6-7. Human Wharton’s jelly cells attached to HA product. Live/ dead assay
micrograph after 10 day incubation on HA product calcined at 600 °C. Live cells
fluoresce in green, dead cells fluoresce in red. The HA product interacted with
the florescent components to induce auto fluorescence, primarily in the red. Scale
bars are 100 µm. .................................................................................................. 108
xviii
List of Tables
Table 1-1. Feedstocks and corresponding transformation technologies for specific biofuels. 2
Table 1-2. Oil production of various biomass per unit area.27, 31 ............................................. 7
Table 2-1. Properties of petroleum crude oil. ......................................................................... 18
Table 2-2. Average literature data on algae liquefaction at similar reaction conditions. ....... 19
Table 2-3. Bulk yields and biocrude properties from published data on HTL of algae. ........ 20
Table 3-1. Identified algae species. ........................................................................................ 28
Table 4-1. Average water quality of algal growth tanks at Lawrence WWTP. ..................... 49
Table 4-2. Algae lot #2011 characterization data. .................................................................. 51
Table 4-3. Oil Yields from microalgae. ................................................................................. 52
xix
Table 4-4. Identified compounds using GC-MS of (a) concentrated derivatized biocrude and
(b) biocrude diluted in decane straight from the reactor. ...................................... 56
Table 4-5. Compound identification of biocrude from macro lot# 2011. .............................. 62
Table 4-6. Ultimate analysis and HHV of micro- and macro- biocrude and micro- solid
product. ................................................................................................................. 65
Table 5-1. Bio-mining effects from algae cultivation and hydrothermal liquefaction. .......... 80
Table 6-1. Compound identification list from GC-MS analysis of biocrude from Figure 6-1;
above 90% confidence as compared with NIST MS library. ................................ 98
Table 6-2. Compound identification list from GC-MS analysis of biocrude from Figure 6-1;
above 90% confidence as compared with NIST MS library. .............................. 100
Table 7-1. Genes and their descriptions expressed through the osteogenic lineage from
mesenchymal stem cells (MSCs).46 .................................................................... 119
1
1 Introduction
1.1 Biofuels
A biofuel, as defined by Merriam-Webster, is a fuel composed of, or produced from,
biological raw materials. Biofuels can be in any state of matter, solid, liquid, or gas, and used for
various applications including transportation, heat, and even the base fuel for electricity
production. Traditionally, society has used fossil fuel sources, such as petroleum crude, coal,
and natural gas for both transportation needs and heating duties. However, factors such as but
not limited to, market volatility, availability, environmental concerns, and socioeconomic control
of these fossil sources has drastically increased the desire to create sustainable renewable fuels.
The U.S. government has played a pivotal role by passing the Energy Independence and Security
Act of 2007, mandating 36 billion gallons of annual transportation biofuel production by 2022.1, 2
Transportation biofuels are the primary focus for this dissertation, which typically include
ethanol, biodiesel, and green gasoline/ diesel/ jet fuel (green-GDJ). Biodiesel is commonly
confused with green-GDJ; however, the two are fundamentally and chemically different.
Biodiesel is a generic name for fatty acid methyl esters (FAME) derived from the
transesterification reaction of triglycerides and esterification of fatty acids. Green-GDJ are
mixtures of hydrocarbons and aliphatics with similar compositions and boiling points of fuels
produced from traditional petroleum refining which have been derived from a renewable source
in place of a fossil source. In general, a biofuel’s usability in the market place can be associated
with three main factors; 1) What is the biological raw material to produce the fuel? Is that raw

2
material used in existing industries, and therefore compete in the market, i.e., is there a food for
fuel debate? 2) Can that fuel be economically produced from the biological source; including
both cultivating raw biomass and chemically transforming the biomass into fuel, and 3) Can the
biofuel integrate seamlessly into the existing infrastructure, regarding both refining and end-use?
Each biological raw material(s), or feedstock, must undergo a chemical transformation
and/or deconstruction chemistry to produce an end-use biofuel product. In general, feedstocks
can dictate which transformation technology would be employed to produce a specific biofuel.
Table 1-1 outlines transformation technologies that can be applied to various feedstocks to
produce the three main biofuels indicated above.
Table 1-1. Feedstocks and corresponding transformation technologies for specific biofuels.
Biofuel Transformation Technology Feedstock Ethanol Fermentation Corn
Soybeans
Sugar cane
Switch grass
Wood Agriculture residue
Biodiesel Transesterification Vegetable oil
Waste cooking oil
Animal tallow
Jatropha
Algae
Green-GDJ Hydrodeoxygenation Bio-oil(s)
Fisher-Tropsch post gasification All
Upgrading post pyrolysis All
Upgrading post hydrothermal liquefaction All

3
Cross referencing Table 1-1 to the three main factors of biofuel adoption will enable optimal
choices for successful and sustainable biofuel production. Feedstocks such as corn, soybeans,
sugar cane, and vegetable oil incorporate undesired food for fuel concerns. Ethanol produced
from grasses, wood, and agriculture residues are commonly referred to as cellulosic ethanol.3
Although cellulosic ethanol has promise, when evaluating factors 2 & 3, this biofuel has
significant shortcomings in both economic transformation and end-use.3 Deconstruction of the
main components of biomass to fermentable sugars has proven inefficient and relies heavily on
converting other components of the biomass, hemi-cellulose and lignin, into usable bi-products
for an economic return.4 Ethanol as a transportation fuel itself has significant shortcomings.
Ethanol can only be combined with gasoline up to a certain blend because of its low energy
density, solubility with water, and high oxygen content; commonly requiring engine
modifications in order to burn significant concentrations within a fuel blend.5, 6 Biodiesel has
similar limitations; the transesterification of oils and fats requires initial separation of those oils
from the base feedstock again requiring creation of separate value streams for both the residual
biomass components and transformation side-products.7-9 In addition, biodiesel is another
oxygenated compound and depending upon the exact chemical fatty acid structure can have poor
physical properties as a liquid fuel. For example, the cold point, or the temperature at which the
fuel begins to solidify, is above typical ambient (winter) temperatures in the U.S. throughout a
given year.10 Therefore, biodiesel can require significant blending with conventional diesel in
order to maintain proper engine performance. These factors tend to limit the quantity of
biodiesel which is widely consumed. The feedstocks used for biodiesel production also require
extensive pre-treatment to obtain a pure bio-oil, or triglycerides, which then can be converted to
4
FAMEs. This leaves significant portion the biomass requiring either separate transformation
and/or incorporation into separate value streams for optimal economic return, further limiting the
amount of biodiesel widely produced.11
Since the chemical compounds of Green-GDJ are no different than petrol fuels, it
represents the main biofuel which can integrate optimally into existing infrastructure, specifically
at the end-use.12 Green-GDJ is also the most feedstock agnostic, allowing essentially any type of
biomass to be converted to green-GDJ depending upon the transformation technology. The
specific transformation technology employed for producing green-GDJ is where issues may
arise. Hydrodeoxygenation of bio-oil(s) to green-GDJ suffers similar pre-treatment requirements
as biodiesel.13-15 Further, the main by-product of hydrodeoxygenation is carbon dioxide (CO2)
and/or carbon monoxide (CO). These products drastically reduce carbon efficiency; therefore,
after pre-treatment and hydrodeoxygenation the overall carbon balance from initial biomass
feedstock to green-GDJ can be very low. Fischer-Tropsch (FT) synthesis is the combination of
hydrogen gas and CO to produce liquid fuels, thus, to produce green-GDJ from a particular
feedstock the biomass must first be gasified into these components before synthesis.15, 16 Both
gasification and FT each require energy and produces CO2, again, reducing the overall energy
and carbon efficiencies. Pyrolysis is the thermal breakdown of biomass in the absence of water
and oxygen producing a solid char and condensable gasses.17 Once these gasses are condensed
to pyrolysis oil, the oil can be upgraded to a viable green-GDJ fuel.18 Upgrading generally
consists of cracking, or reducing molecular weight distribution resulting in lower boiling point
distillates, and heteroatom removal, i.e., removing oxygen, nitrogen, and sulfur. The main
concerns with pyrolysis technologies are drying of the feedstock and the significant heteroatom
5
content (oxygen and nitrogen) of the condensed gasses. Pyrolysis oils from biomass can have
upwards of 30 weight % (wt%) oxygen and higher with considerable acid contents.17 This
results in stability issues and must be extensively upgraded rather quickly to reduce the oxygen
content. Oxygen can be removed via hydrodeoxygenation, requiring large amounts of hydrogen,
to produce CO2. Since pyrolysis is a dry process, wet biomass such as algae requires extensive
drying negatively impacting the overall energy balance of the system.19 Algae as a biofuel
feedstock will be expanded in section 1.2: Algae. Producing green-GDJ from the upgrading of
biocrude, or carbon-rich crude oil similar to petroleum, produced from hydrothermal liquefaction
(HTL) of biomass serves as an extremely attractive process. HTL uses hot compressed water,
below the supercritical point (374°C and 22 MPa), as the chemical driving force to decompose
biomass resulting in the desired biocrude. The utilization of HTL to convert algal biomass into
valuable products is the main focus of this thesis outlined in section 1.4: Hydrothermal
Liquefaction (HTL) and a thorough review on HTL of algae is discussed in Chapter 2:
Hydrothermal Liquefaction Review.
1.2 Algae
Algae represent one of the oldest, highly abundant sources of flora, typically representing
the basis of the majority of food chains, on the planet.20 Algae are highly prolific and
predominately photosynthetic aquatic organisms which require certain essential components for
growth, including nitrogen, phosphorus, carbon and trace elements. In addition, algae are
extremely diverse and opportunistic organisms which can extract their essential components
from a variety of sources, including wastewaters.21-24 Therefore, algae can utilize non-potable
6
water, non-arable land, and waste streams making them attractive as a biofuel feedstock by
eliminating any food for fuel concerns. Algae proliferation, in terms of biomass productivity,
has been shown to exceed that of terrestrial flora normalized to the area of land use.25 Algae also
accumulate lipids and fats as triglycerides and free fatty acids in higher amounts than terrestrial
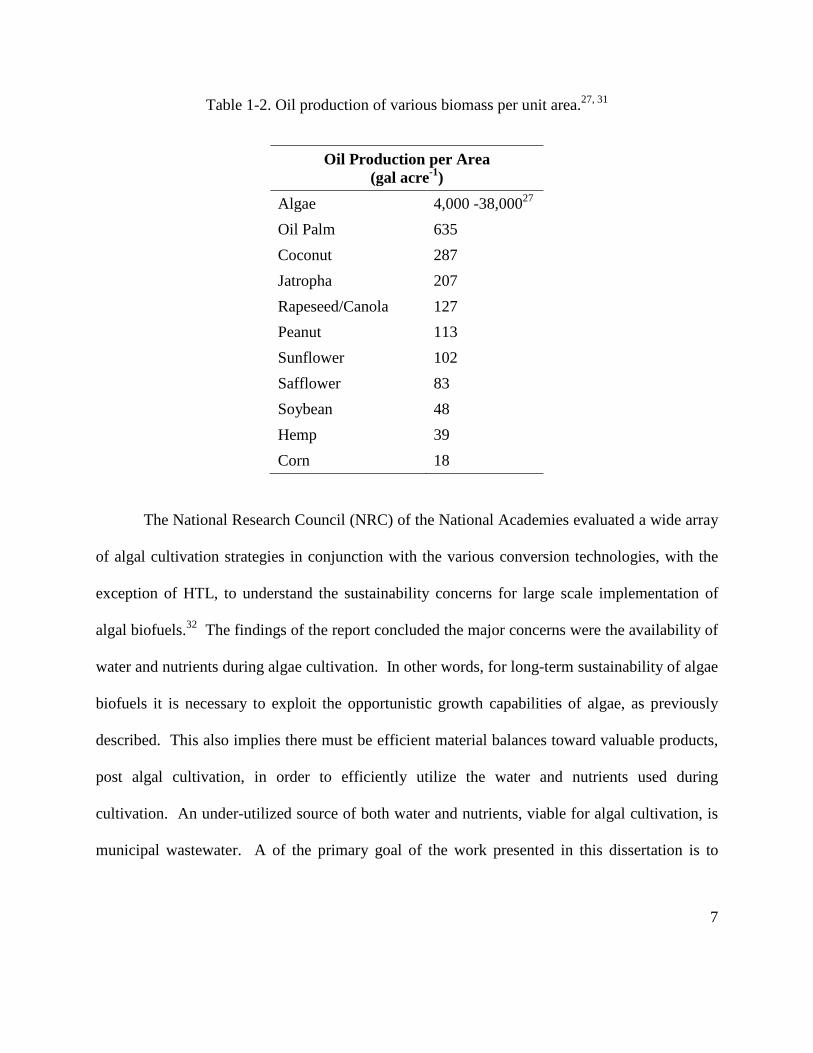
flora seeds per unit area.26 Table 1.2 indicates oil production of algae compared to terrestrial oil
producing seed crops.27 The range oil from algae given is based on a best case scenario and a
theoretical maximum. Algal growth conditions, specifically nitrogen and phosphorus
availabilities, greatly affect the lipid or oil productivity of any given algal species.28 A
simplified version of the well-known algal Redfield ratio29 for carbon, nitrogen, and phosphorus
is 106:16:1, respectively, representing a theoretical molecular formula for algae biomass.
Deviations from the Redfield ratio for nitrogen and phosphorus (N:P) results in different algae
assemblages; high lipid accumulation/ low proliferation or low lipid accumulation/ high
proliferation for nitrogen limited and phosphorus limited, respectively.30
7
Table 1-2. Oil production of various biomass per unit area.27, 31
Oil Production per Area (gal acre-1)
Algae 4,000 -38,00027 Oil Palm 635 Coconut 287 Jatropha 207 Rapeseed/Canola 127 Peanut 113 Sunflower 102 Safflower 83 Soybean 48 Hemp 39 Corn 18
The National Research Council (NRC) of the National Academies evaluated a wide array
of algal cultivation strategies in conjunction with the various conversion technologies, with the
exception of HTL, to understand the sustainability concerns for large scale implementation of
algal biofuels.32 The findings of the report concluded the major concerns were the availability of
water and nutrients during algae cultivation. In other words, for long-term sustainability of algae
biofuels it is necessary to exploit the opportunistic growth capabilities of algae, as previously
described. This also implies there must be efficient material balances toward valuable products,
post algal cultivation, in order to efficiently utilize the water and nutrients used during
cultivation. An under-utilized source of both water and nutrients, viable for algal cultivation, is
municipal wastewater. A of the primary goal of the work presented in this dissertation is to

8
demonstrate the sustainability of algal biofuels by utilizing municipal wastewater for algae
cultivation.
1.3 Wastewater Cultivation of Algae
The objective of a wastewater treatment plant is to reclaim polluted waters for safe
further use either by society or the environment.33 The primary concern for a typical municipal
wastewater treatment facility is to remove insoluble and soluble organic materials. This is
achieved by various stages of solid separations/ settling processes in combination with activated
sludge, or bacterial, digestions of the particulate and dissolved organics; commonly referred to as
primary and secondary clarification, respectively. Not all wastewater plants are design equally.
Each plant is designed and operated based off its respective governing body, i.e., each city and
state may have different regulations, above that of the EPA, to achieve a particular maximum
allowable lever of a particular “pollutant”. Some commonly regulated pollutants are arsenic,
atrazine, barium, chromium, fluoride, copper, lead, nitrate, selenium, chloramine, and total
organic carbon (TOC). There also exists a class of unregulated components which have federal
recommendation levels which are monitored to help in the development of future regulations,
such as, calcium, magnesium, nickel, and total phosphorus to name a few. No current federal
regulations exist for removing total nitrogen (TN) and total phosphorus (TP), however, there are
future expectations. Therefore, a typical wastewater treatment plant discharges significant
amounts of both nitrogen and phosphorus, providing a source of both water and nutrients in
which the algal biofuel sector can take full advantage.

9
High levels of TN and TP in a treatment facilities discharge waters can result in negative
effects when introduced to natural water bodies. This is particularly seen throughout the
Mississippi delta area in the Gulf Coast.34 These high levels of TN and TP cause algal blooms to
occur where they normally would not; when an algal bloom dies the resultant organic matter is
decomposed by a drastic increase in bacterial respiration. The increase in bacterial growth
depletes the dissolved oxygen within the water body leading to anoxic conditions, which is
highly detrimental to the natural ecosystem. Therefore, when algae is cultivated in a contained
area around a wastewater treatment facility a win-win scenario is obtained by removing the TN
and TP before water discharge, eliminating future devastation to ecosystems,35 and producing
substantial biomass for biofuels/ chemicals feedstock. This strategy has dual benefit; production
of sustainable algae biomass and economically viable means to meet expected future regulations
for nitrogen and phosphorus at wastewater treatment facilities.
1.4 Hydrothermal Liquefaction (HTL)
Hydrothermal liquefaction (HTL) utilizes subcritical water chemistry to convert biomass
to a carbon-rich biocrude.36, 37 Divergent from ambient water, subcritical water properties
include a decreased dielectric constant, increased ionic product, and decreased density38 which
provide an acid-base reaction media capable to solubilize organic compounds.39 HTL is
particularly advantageous for algae conversion for multiple reasons. Algae biomass consists of
macromolecules which include lipids and oils, carbohydrates, and proteins. Processes such as
transesterification and hydrodeoxygenation solely utilize the lipid and oil content of the biomass
where the remainder of the cell must be used elsewhere. Efficient use of the growth resources,

10
water and nutrients, dictates a whole cell conversion technology must be employed, and
therefore, restricted to gasification, pyrolysis, and HTL. As stated earlier, gasification and
pyrolysis are dry processes. Since algae are an aquatic biomass and cultivated in relatively low
solids concentrations these conversion technologies will have limited energy efficiencies when
processing as a dry biomass. HTL of algae typically proceeds as 5- 20 wt% solids concentration
which represents the minimum of dewatering needed based on conversion technologies listed in
Table 1-1 and also represents the only wet whole cell conversion technology. During HTL of
algae, macromolecules are broken down and recovered as a biocrude with similar composition
and properties to petroleum crude37, 40, 41 and capable of refining similar to petroleum crude to
produce end-use fuels and chemicals. A detailed overview and prior work review of algae HTL
will be covered in Chapter 2: Hydrothermal Liquefaction Review.
1.5 Research Goals
The primary goals of the work presented in this dissertation are to establish a baseline
study for the effectiveness of producing bio-based fuels and chemicals from algae cultivated with
municipal wastewater as the sole nutrient and water source. Utilizing both reclaimed water and
nutrients greatly increases the overall sustainability of algae cultivation while contributing to an
increased environmental remediation effort. Algae cultivated in such a manner are shown to
have significant differences from a controlled media growth, primarily in proximate and ultimate
contents of the biomass. Once the algae were successfully cultivated, chemical transformation
efforts are demonstrated through the use of HTL, representing the first study which was
conducted using a mixed microalgae species and the first to utilize HTL on algae sultivated soley
11
from water and nutrients provided by a functioning wastewater treatment facility. Due to the
cultivation strategy, algal variances carry downstream to HTL, which resulted in unexpected
results, initially thought to be simply higher production rates of solid products. However, the
work herein details the formulated hypotheses, experimental methods to confirm the hypotheses,
and the discovery process of value-added components produced during the HTL of the algal
biomass used. This work represents the foundation to achieve an overall process where algal
biofuels are considered lower value by-product of producing higher-value catalysts and
biomedical materials.
1.6 Research Work Overview and Outline
This dissertation is outlined in the following manner. A detailed review of algae HTL
will be given in Chapter 2, to include previous works with the current literature detailing algae
conversion with HTL. Chapter 3 outlines the materials used and methods performed for each
subsequent chapter of the dissertation and will be used as reference within each chapter
respectively; highlighting a novel method developed for achieving a full proximate analysis of
biomass to overcome shortcoming identified in the current ASTM method for ash determination.
The initial results of this dissertation will begin in Chapter 4 detailing the algae cultivation (from
2011) and its conversion via HTL. This chapter includes information from both a mixed-culture
algae biomass, cited in Energy & Fuels, and macro-algae, work previously presented at a
national conference (American Institute of Chemical Engineers Annual Meeting 2012), which
were harvested from the same cultivation pond. The results and discussions from performing
HTL on algae cultivated in 2013 are found in Chapter 5. Using knowledge gained and

12
hypotheses formulated from the previous chapter, this section details the discovery process of
value-added product synthesis, and potential market places. Chapter 6 expands the discussion of
in-situ synergies between the main HTL products and potential uses of the value-added products
produced from the 2013 algae. Chapter 7 details future work that will need to be performed to
answer the next round of questioning that pertains to the discoveries made and potential uses
discussed in Chapter 5 & 6, respectively. Concluding remarks are made in Chapter 8.
1.7 References
1. Independence, E., Security Act of 2007. Public law 2007, 110, (140), 19. 2. Sissine, F. In Energy Independence and Security Act of 2007: a summary of major
provisions, 2007; DTIC Document: 2007. 3. Brethauer, S.; Wyman, C. E., Review: continuous hydrolysis and fermentation for
cellulosic ethanol production. Bioresource Technology 2010, 101, (13), 4862-4874. 4. Binder, J. B.; Raines, R. T., Fermentable sugars by chemical hydrolysis of biomass.
Proceedings of the National Academy of Sciences 2010. 5. Mužíková, Z.; Šimáček, P.; Pospíšil, M.; Šebor, G., Density, Viscosity and Water Phase
Stability of 1-Butanol-Gasoline Blends. Journal of Fuels 2014, 2014. 6. Center, A. F. D., Fuel properties comparison. Retrieved April 2013, 19, 2013. 7. Meher, L.; Sagar, D. V.; Naik, S., Technical aspects of biodiesel production by
transesterification—a review. Renewable and sustainable energy reviews 2006, 10, (3), 248-268.
8. Mata, T. M.; Martins, A. A.; Caetano, N. S., Microalgae for biodiesel production and other applications: a review. Renewable and sustainable energy reviews 2010, 14, (1), 217-232.
9. Singh, S.; Singh, D., Biodiesel production through the use of different sources and characterization of oils and their esters as the substitute of diesel: a review. Renewable and Sustainable Energy Reviews 2010, 14, (1), 200-216.
10. Hoekman, S. K.; Broch, A.; Robbins, C.; Ceniceros, E.; Natarajan, M., Review of biodiesel composition, properties, and specifications. Renewable and Sustainable Energy Reviews 2012, 16, (1), 143-169.
11. Haas, M. J., Improving the economics of biodiesel production through the use of low value lipids as feedstocks: vegetable oil soapstock. Fuel Processing Technology 2005, 86, (10), 1087-1096.
12. Kalnes, T.; Marker, T.; Shonnard, D. R., Green diesel: a second generation biofuel. International Journal of Chemical Reactor Engineering 2007, 5, (1).

13
13. Choudhary, T.; Phillips, C., Renewable fuels via catalytic hydrodeoxygenation. Applied Catalysis A: General 2011, 397, (1), 1-12.
14. Greenwell, H.; Laurens, L.; Shields, R.; Lovitt, R.; Flynn, K., Placing microalgae on the biofuels priority list: a review of the technological challenges. Journal of the Royal Society Interface 2009, rsif20090322.
15. Naik, S.; Goud, V. V.; Rout, P. K.; Dalai, A. K., Production of first and second generation biofuels: a comprehensive review. Renewable and Sustainable Energy Reviews 2010, 14, (2), 578-597.
16. Tijmensen, M. J.; Faaij, A. P.; Hamelinck, C. N.; van Hardeveld, M. R., Exploration of the possibilities for production of Fischer Tropsch liquids and power via biomass gasification. Biomass and Bioenergy 2002, 23, (2), 129-152.
17. Mohan, D.; Pittman, C. U.; Steele, P. H., Pyrolysis of wood/biomass for bio-oil: a critical review. Energy & Fuels 2006, 20, (3), 848-889.
18. Bridgwater, A. V., Review of fast pyrolysis of biomass and product upgrading. Biomass and bioenergy 2012, 38, 68-94.
19. Demirbas, M. F., Biofuels from algae for sustainable development. Applied Energy 2011, 88, (10), 3473-3480.
20. Falkowski, P. G.; Katz, M. E.; Knoll, A. H.; Quigg, A.; Raven, J. A.; Schofield, O.; Taylor, F., The evolution of modern eukaryotic phytoplankton. Science 2004, 305, (5682), 354-360.
21. Sturm, B. S.; Peltier, E.; Smith, V.; deNoyelles, F., Controls of microalgal biomass and lipid production in municipal wastewater‐fed bioreactors. Environmental Progress & Sustainable Energy 2012, 31, (1), 10-16.
22. Woertz, I.; Feffer, A.; Lundquist, T.; Nelson, Y., Algae Grown on Dairy and Municipal Wastewater for Simultaneous Nutrient Removal and Lipid Production for Biofuel Feedstock. Journal of Environmental Engineering-Asce 2009, 135, (11), 1115-1122.
23. Chinnasamy, S.; Bhatnagar, A.; Hunt, R. W.; Das, K. C., Microalgae cultivation in a wastewater dominated by carpet mill effluents for biofuel applications. Bioresource Technology 2010, 101, (9), 3097-3105.
24. Singh, M.; Reynolds, D. L.; Das, K. C., Microalgal system for treatment of effluent from poultry litter anaerobic digestion. Bioresource Technology 2011, 102, (23), 10841-10848.
25. Brennan, L.; Owende, P., Biofuels from microalgae—A review of technologies for production, processing, and extractions of biofuels and co-products. Renewable and Sustainable Energy Reviews 2010, 14, (2), 557-577.
26. Chisti, Y., Biodiesel from microalgae. Biotechnology Advances 2007, 25, (3), 294-306. 27. Weyer, K. M.; Bush, D. R.; Darzins, A.; Willson, B. D., Theoretical Maximum Algal Oil
Production. BioEnergy Research 2009, 3, (2), 204-213. 28. Xin, L.; Hu, H. Y.; Ke, G.; Sun, Y. X., Effects of different nitrogen and phosphorus
concentrations on the growth, nutrient uptake, and lipid accumulation of a freshwater microalga Scenedesmus sp. Bioresour Technol 2010, 101, (14), 5494-500.
29. Tett, P.; Droop, M.; Heaney, S., The Redfield ratio and phytoplankton growth rate. Journal of the Marine Biological Association of the United Kingdom 1985, 65, (02), 487-504.

14
30. Sturm, B. S. M.; Peltier, E.; Smith, V.; deNoyelles, F., Controls of microalgal biomass and lipid production in municipal wastewater-fed bioreactors. Environmental Progress & Sustainable Energy 2012, 31, (1), 10-16.
31. El Bassam, N., Handbook of bioenergy crops. London, Earthscan 2010. 32. Council, N. R., Sustainable Development of Algal Biofuels in the United States. In
Academies, N. R. C. o. t. N., Ed. National Academy Press: Committee on the Sustainable Development of Algal Biofuels, 2012.
33. Levine, A. D.; Asano, T., Peer reviewed: recovering sustainable water from wastewater. Environmental science & technology 2004, 38, (11), 201A-208A.
34. Rabalais, N. N.; Turner, R. E.; Díaz, R. J.; Justić, D., Global change and eutrophication of coastal waters. ICES Journal of Marine Science: Journal du Conseil 2009, 66, (7), 1528-1537.
35. Mitsch, W. J.; Day, J. W.; Gilliam, J. W.; Groffman, P. M.; Hey, D. L.; Randall, G. W.; Wang, N., Reducing Nitrogen Loading to the Gulf of Mexico from the Mississippi River Basin: Strategies to Counter a Persistent Ecological Problem Ecotechnology—the use of natural ecosystems to solve environmental problems—should be a part of efforts to shrink the zone of hypoxia in the Gulf of Mexico. BioScience 2001, 51, (5), 373-388.
36. López Barreiro, D.; Prins, W.; Ronsse, F.; Brilman, W., Hydrothermal liquefaction (HTL) of microalgae for biofuel production: State of the art review and future prospects. Biomass and Bioenergy 2013, 53, 113-127.
37. Roberts, G. W.; Fortier, M.-O. P.; Sturm, B. S. M.; Stagg-Williams, S. M., Promising Pathway for Algal Biofuels through Wastewater Cultivation and Hydrothermal Conversion. Energy & Fuels 2013, 27, (2), 857-867.
38. Möller , M.; Nilges , P.; Harnisch, F.; Schröder, U., Subcritical Water as Reaction Environment: Fundamentals of Hydrothermal Biomass Transformation. ChemSusChem 2011, 4, (5), 566-579.
39. Felício-Fernandes, G.; Laranjeira, M., Calcium phosphate biomaterials from marine algae. Hydrothermal synthesis and characterisation. Quimica Nova 2000, 23, (4), 441-446.
40. Elliott, D. C.; Hart, T. R.; Schmidt, A. J.; Neuenschwander, G. G.; Rotness, L. J.; Olarte, M. V.; Zacher, A. H.; Albrecht, K. O.; Hallen, R. T.; Holladay, J. E., Process development for hydrothermal liquefaction of algae feedstocks in a continuous-flow reactor. Algal Research 2013.
41. Valdez, P. J.; Nelson, M. C.; Wang, H. Y.; Lin, X. N.; Savage, P. E., Hydrothermal liquefaction of Nannochloropsis sp.: Systematic study of process variables and analysis of the product fractions. Biomass and Bioenergy 2012, 46, 317-331.

15
2 Hydrothermal Liquefaction Review
2.1 Background
Properties of water such as dielectric constant, ionic product, viscosity, density, heat
capacity, and compressibility are highly temperature dependent, especially at temperatures when
approaching the supercritical point.1 In this regime, water acts more as an organic solvent
capable of both solubilizing traditionally insoluble components such as fats and oils and
performing chemistries including acid-base reactions, hydrogen donation, free radicals, cracking,
polymerization, hydrolysis, dehydration, and Maillard reactions.2 Hydrothermal processing of
biomass has been described via three steps; 1) depolymerization of biomass, 2) decompositions
of monomers, and 3) recombination of reactive fragments,2 where each mechanism and its extent
are controlled by the compounds present and the reaction temperature. This greatly effects the
product fraction distributions from hydrothermal processing, shown in Figure 2-1. Hydrothermal
processing includes three main categories; hydrothermal carbonization (HTC), hydrothermal
liquefaction (HTL), and hydrothermal gasification (HTG). Each category typically defined by
the temperature ranges of 100-200 °C, 200- 350 °C, and 350-750 °C for HTC, HTL, and HTG,
respectively.1 As reaction temperature increases for each reaction class, the main products
(desired) are solid biochar, biocrude, and gasses. Since each conversion temperature uses water
as the reaction media, each process produces an aqueous co-product (ACP) comprised of soluble
organics and inorganic ions. Beyond algae, hydrothermal processing has been used for
conversion of various feedstocks including manure3, 4, bacteria5, 6 and cellulosic materials.7-10

16
Figure 2-1. Product fractions for hydrothermal conversion of biomass. Main product for HTC,
HTL, and HTG are solid biochar, biocrude, and gasses, respectively.
2.2 Literature Data
The majority of studies to date involving the HTL of algae are small scale batch systems
from ranging from 5 mL to 1.8 L,11, 12 however, recently a few continuous systems have been
reported.13-15 Although batch systems do not necessarily mimic commercial scale operation, they
provide a platform in which reliable and rapid data collection can be performed in order to better
understand product distribution and quality over a wide range of operating parameters and algal
feedstocks. In addition, HTL studies have been performed in the presence of various
heterogeneous and homogeneous catalysts.16-22
A typical batch operation of algae HTL includes a series of reaction, product removal/
separations, and product analysis stages. Reaction parameters of interest are typically percent
solids (of algae), temperature, and time held at desired temperature. Ranges for these parameters
have been studied from 5-20 wt%, 200- 350°C, and 5 min- 1 hr, respectively.23 Product

17
separation techniques can, and generally do, include solvent extraction of the reaction products
and reactor vessel, which results in a three phase system including organic liquid phase, aqueous
liquid phase, and solid phase, representing the three main products described in Figure 2-1. The
most common solvent used has been dichloromethane due to its volatility, solubility with
biocrude components, and suitability for a gas chromatography analysis solvent. Other solvents,
such as hexadecane, decane, hexane, cyclohexane, methoxycylopentane, and chloroform, have
been studied to determine the effect of bulk yield and elemental recovery on extraction
technique.24 However, these solvents have been primarily studied solely for research purposes
and if solvent extraction is deemed necessary at full commercial scale both choice of solvent and
process design could contribute greatly to the overall sustainability and life cycle assessment of
the process. Certain solvents, such as hydrocarbons, would represent molecules actually
produced during HTL and could be separated and recycled to an extraction unit operation
without the addition of new input streams.
Once the products are separated, various analytical tools are used to determine properties
such as elemental content, particularly, carbon, hydrogen, nitrogen, and oxygen (CHNO or
ultimate analysis), molecular profile through gas chromatography with mass spectrometry
detection (GC-MS), and higher heating value (HHV) or energy content. Most data collected
measures these parameters along with bulk yields of each product as a unit of measure for the
reaction efficacy and are commonly used as comparison amongst data.
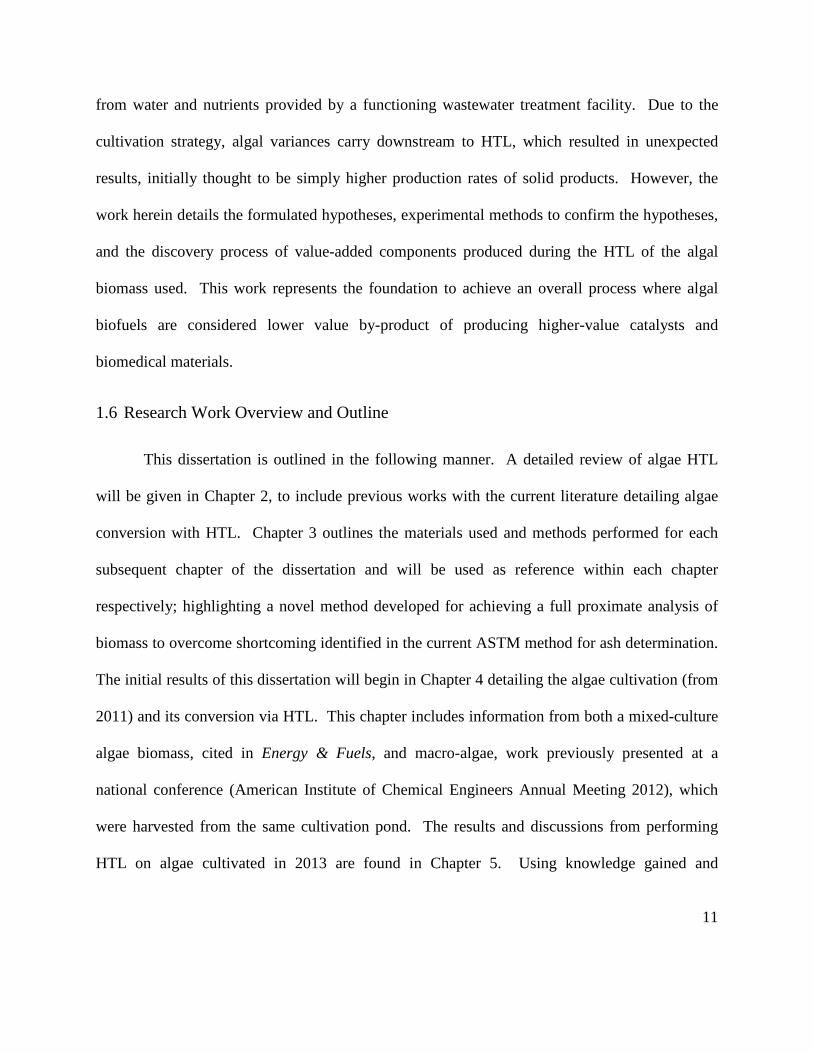
In general, the goal is to produce a biocrude with as similar properties to that of
petroleum crude. Petroleum crude oil has reported ranges for CHNO and HHV presented in
Table 2-1.12, 25, 26
18
Table 2-1. Properties of petroleum crude oil.
Petroleum CHNO (wt%) and HHV (MJ kg-1)
C 83- 87 H 10- 14 N 0.1- 1.5 O 0.5- 6 HHV 41- 43
In contrast, the ultimate analysis of biocrude produced from the HTL of algae differs from that of
petroleum, typically with lower C & H and higher N & O, requiring HTL biocrude to be
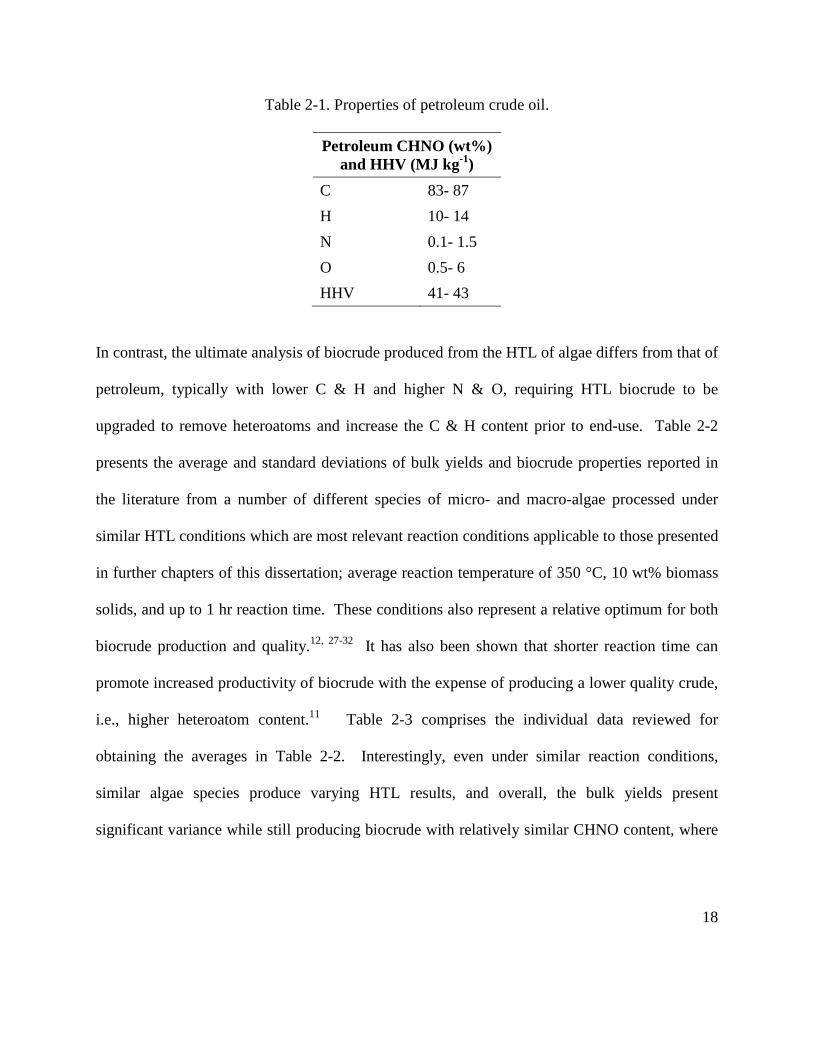
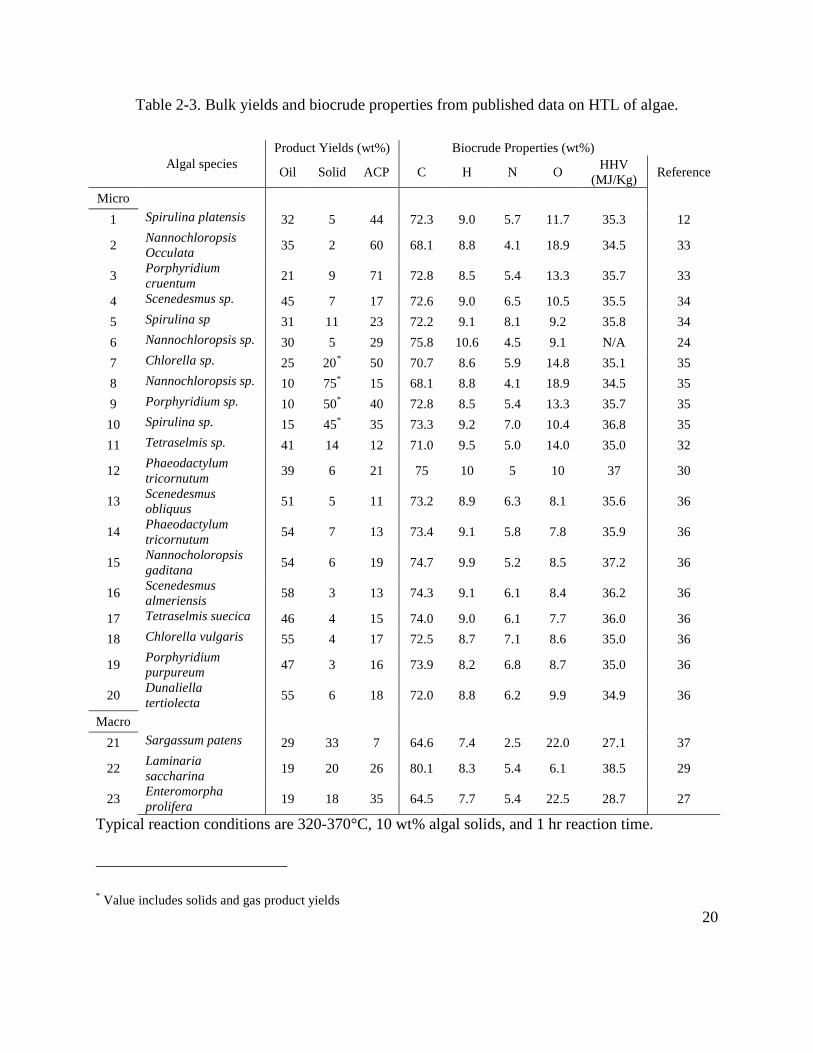
upgraded to remove heteroatoms and increase the C & H content prior to end-use. Table 2-2
presents the average and standard deviations of bulk yields and biocrude properties reported in
the literature from a number of different species of micro- and macro-algae processed under
similar HTL conditions which are most relevant reaction conditions applicable to those presented
in further chapters of this dissertation; average reaction temperature of 350 °C, 10 wt% biomass
solids, and up to 1 hr reaction time. These conditions also represent a relative optimum for both
biocrude production and quality.12, 27-32 It has also been shown that shorter reaction time can
promote increased productivity of biocrude with the expense of producing a lower quality crude,
i.e., higher heteroatom content.11 Table 2-3 comprises the individual data reviewed for
obtaining the averages in Table 2-2. Interestingly, even under similar reaction conditions,
similar algae species produce varying HTL results, and overall, the bulk yields present
significant variance while still producing biocrude with relatively similar CHNO content, where

19
the individual C & O content of the biocrude has the highest degree of variance among the
ultimate analysis.
Table 2-2. Average literature data on algae liquefaction at similar reaction conditions.
Average HTL Results Yields wt% Biocrude 35.7 ± 15.1 Solids 15.6 ± 18.1 Aqueous 26.4 ± 16.4
Biocrude wt% C 72.3 ± 3.4
H 8.9 ± 0.7 N 5.6 ± 1.2 O 11.8 ± 4.6 HHV (MJ kg-1) 35.0 ± 2.5
20
Table 2-3. Bulk yields and biocrude properties from published data on HTL of algae.
Algal species
Product Yields (wt%) Biocrude Properties (wt%)
Oil Solid ACP C H N O HHV (MJ/Kg) Reference
Micro 1 Spirulina platensis 32 5 44 72.3 9.0 5.7 11.7 35.3 12
2 Nannochloropsis Occulata 35 2 60 68.1 8.8 4.1 18.9 34.5 33
3 Porphyridium cruentum 21 9 71 72.8 8.5 5.4 13.3 35.7 33
4 Scenedesmus sp. 45 7 17 72.6 9.0 6.5 10.5 35.5 34 5 Spirulina sp 31 11 23 72.2 9.1 8.1 9.2 35.8 34 6 Nannochloropsis sp. 30 5 29 75.8 10.6 4.5 9.1 N/A 24 7 Chlorella sp. 25 20* 50 70.7 8.6 5.9 14.8 35.1 35 8 Nannochloropsis sp. 10 75* 15 68.1 8.8 4.1 18.9 34.5 35 9 Porphyridium sp. 10 50* 40 72.8 8.5 5.4 13.3 35.7 35 10 Spirulina sp. 15 45* 35 73.3 9.2 7.0 10.4 36.8 35 11 Tetraselmis sp. 41 14 12 71.0 9.5 5.0 14.0 35.0 32
12 Phaeodactylum tricornutum 39 6 21 75 10 5 10 37 30
13 Scenedesmus obliquus 51 5 11 73.2 8.9 6.3 8.1 35.6 36
14 Phaeodactylum tricornutum 54 7 13 73.4 9.1 5.8 7.8 35.9 36
15 Nannocholoropsis gaditana 54 6 19 74.7 9.9 5.2 8.5 37.2 36
16 Scenedesmus almeriensis 58 3 13 74.3 9.1 6.1 8.4 36.2 36
17 Tetraselmis suecica 46 4 15 74.0 9.0 6.1 7.7 36.0 36 18 Chlorella vulgaris 55 4 17 72.5 8.7 7.1 8.6 35.0 36
19 Porphyridium purpureum 47 3 16 73.9 8.2 6.8 8.7 35.0 36
20 Dunaliella tertiolecta 55 6 18 72.0 8.8 6.2 9.9 34.9 36
Macro 21 Sargassum patens 29 33 7 64.6 7.4 2.5 22.0 27.1 37
22 Laminaria saccharina 19 20 26 80.1 8.3 5.4 6.1 38.5 29
23 Enteromorpha prolifera 19 18 35 64.5 7.7 5.4 22.5 28.7 27
Typical reaction conditions are 320-370°C, 10 wt% algal solids, and 1 hr reaction time.
* Value includes solids and gas product yields

21
Even though the ultimate analysis of the biocrude is promising, there is still a significant gap
between HTL biocrude and petroleum crude. This is easily seen within the Van Krevelen
diagram presented in Figure 2-2. A Van Krevelen diagram shows the relationship between
carbon, hydrogen, and oxygen, where a desirable fuel has large magnitude in the y-axis and
small magnitude in the x-axis. This region would indicate a high energy density fuel with little
upgrading needed to remove oxygen.
Figure 2-2. Van Krevelen diagram from literature HTL biocrude data contained in Table 2-1 and
Table 2-2; identifying numbers correspond to the identifying numbers in Table 2-3.
1.21.31.41.51.61.71.81.9
2
0 0.05 0.1 0.15 0.2 0.25 0.3
H/C
Atom
ic R
atio
O/C Atomic Ratio
Light Petroleum Heavy Petroleum 1 Spirulina platensis2 Nannochloropsis Occulata 3 Porphyridium cruentum 4 Scenedesmus sp.5 Spirulina sp 6 Nannochloropsis sp. 7 Chlorella sp.8 Nannochloropsis sp. 9 Porphyridium sp. 10 Spirulina sp.11 Tetraselmis sp. 12 Phaeodactylum tricornutum 13 Scenedesmus obliquus14 Phaeodactylum tricornutum 15 Nannocholoropsis gaditana 16 Scenedesmus almeriensis17 Tetraselmis suecica 18 Chlorella vulgaris 19 Porphyridium purpureum20 Dunaliella tertiolecta 21 Sargassum patens 22 Laminaria saccharina23 Enteromorpha prolifera

22
In addition to the heteroatom content, the molecular profile of a biocrude is also
important to understand in terms of upgrading to an end-use fuel. Typical biocrude from HTL of
algae contain a wide array of chemical compounds with typical classes including straight chain
and branched alkanes and alkenes, aromatics, keytones, fatty acids, fatty acid amides, alcohols,
phenolics, indoles, pyridines, and nitriles.22, 38 Identifying specific molecules within the HTL
biocrude is important when deciding on particular upgrading strategy to remove the heteroatom
content and increase the lower boiling point distillates. Cracking the higher boiling point
distillates such as the vacuum gas oil and vacuum gas residual fractions will increase profitability
of the biocrude by producing a larger fraction of useable fuels. Further detail of biocrude
molecular profiles and distillate fractions from the literature will be discussed in relationship to
the data collected for this dissertation and presented in Section 6.1: In-situ Catalytic Upgrading
of the Biocrude from Hydroxyapatite Crystallization.
Other studies on the HTL of algae and related components have included the evaluation
of algae with different biochemical components as compared to model compounds such as
various proteins, sugars, and oils; which showed lipids and proteins are converted most readily
into biocrude product with the carbohydrates more easily converted under alkali catalysts.35
Converting the protein and carbohydrate portions of an algae cell into a viable biocrude (beyond
lipids) makes HTL a highly suitable conversion route for low- lipid containing algae39 or algae
residuals which have gone through a lipid extraction process,15, 34 where some cultivation
strategies want to promote accumulation of omega-3 fatty acids for nutraceutical industry as a
lucrative option to replace marine fatty fish.40 Therefore, once these industries obtain their
valuable lipids the remaining fraction of the algae biomass is a suitable biofuel feedstock. In
23
addition to lipids, HTL has also been used to extract polysaccharides prior to conversion to a
biocrude.41 Further fundamental studies have been reported in efforts to understand the
complexity of reactive biomolecules in the presence of subcritical water and develop a reaction
network to begin to understand kinetic parameters in regards to the formation of the bulk
products formed shown in Figure 2-1.42
2.3 References
1. Möller , M.; Nilges , P.; Harnisch, F.; Schröder, U., Subcritical Water as Reaction Environment: Fundamentals of Hydrothermal Biomass Transformation. ChemSusChem 2011, 4, (5), 566-579.
2. Toor, S. S.; Rosendahl, L.; Rudolf, A., Hydrothermal liquefaction of biomass: A review of subcritical water technologies. Energy 2011, 36, (5), 2328-2342.
3. Yin, S.; Dolan, R.; Harris, M.; Tan, Z., Subcritical hydrothermal liquefaction of cattle manure to bio-oil: Effects of conversion parameters on bio-oil yield and characterization of bio-oil. Bioresource Technology 2010, 101, (10), 3657-3664.
4. Vardon, D. R.; Sharma, B. K.; Scott, J.; Yu, G.; Wang, Z.; Schideman, L.; Zhang, Y.; Strathmann, T. J., Chemical properties of biocrude oil from the hydrothermal liquefaction of Spirulina algae, swine manure, and digested anaerobic sludge. Bioresource Technology 2011, 102, (17), 8295-8303.
5. Valdez, P. J.; Nelson, M. C.; Faeth, J. L.; Wang, H. Y.; Lin, X. N.; Savage, P. E., Hydrothermal liquefaction of bacteria and yeast monocultures. Energy & Fuels 2013, 28, (1), 67-75.
6. Hammerschmidt, A.; Boukis, N.; Galla, U.; Dinjus, E.; Hitzmann, B., Conversion of yeast by hydrothermal treatment under reducing conditions. Fuel 2011, 90, (11), 3424-3432.
7. Jindal, M.; Jha, M., Catalytic Hydrothermal Liquefaction of Waste Furniture Sawdust to Bio-oil. Indian Chemical Engineer 2015, (ahead-of-print), 1-15.
8. Zhu, Z.; Rosendahl, L.; Toor, S. S.; Yu, D.; Chen, G., Hydrothermal liquefaction of barley straw to bio-crude oil: Effects of reaction temperature and aqueous phase recirculation. Applied Energy 2015, 137, 183-192.
9. Karagöz, S.; Bhaskar, T.; Muto, A.; Sakata, Y.; Oshiki, T.; Kishimoto, T., Low-temperature catalytic hydrothermal treatment of wood biomass: analysis of liquid products. Chemical Engineering Journal 2005, 108, (1-2), 127-137.
10. Lu, W.; Yang, F.; Wang, C.; Yang, Z., Comparison of high-caloric fuel (HCF) from four different raw materials by deoxy-liquefaction. Energy & Fuels 2010, 24, (12), 6633-6643.

24
11. Faeth, J. L.; Valdez, P. J.; Savage, P. E., Fast Hydrothermal Liquefaction of Nannochloropsis sp. To Produce Biocrude. Energy & Fuels 2013, 27, (3), 1391-1398.
12. Jena, U.; Das, K. C.; Kastner, J. R., Effect of operating conditions of thermochemical liquefaction on biocrude production from Spirulina platensis. Bioresource Technology 2011, 102, (10), 6221-6229.
13. Jazrawi, C.; Biller, P.; Ross, A. B.; Montoya, A.; Maschmeyer, T.; Haynes, B. S., Pilot plant testing of continuous hydrothermal liquefaction of microalgae. Algal Research 2013, 2, (3), 268-277.
14. Elliott, D. C.; Biller, P.; Ross, A. B.; Schmidt, A. J.; Jones, S. B., Hydrothermal liquefaction of biomass: Developments from batch to continuous process. Bioresource technology 2015, 178, 147-156.
15. Elliott, D. C.; Hart, T. R.; Schmidt, A. J.; Neuenschwander, G. G.; Rotness, L. J.; Olarte, M. V.; Zacher, A. H.; Albrecht, K. O.; Hallen, R. T.; Holladay, J. E., Process development for hydrothermal liquefaction of algae feedstocks in a continuous-flow reactor. Algal Research 2013, 2, (4), 445-454.
16. Chen, Y.; Wu, Y.; Ding, R.; Zhang, P.; Liu, J.; Yang, M.; Zhang, P., Catalytic hydrothermal liquefaction ofD. tertiolectafor the production of bio-oil over different acid/base catalysts. AIChE Journal 2015, 61, (4), 1118-1128.
17. Duan, P.; Savage, P. E., Hydrothermal Liquefaction of a Microalga with Heterogeneous Catalysts. Industrial & Engineering Chemistry Research 2011, (50), 52-61.
18. Li, H.; Hurley, S.; Xu, C., Liquefactions of peat in supercritical water with a novel iron catalyst. Fuel 2011, 90, (1), 412-420.
19. Yang, C.; Jia, L.; Chen, C.; Liu, G.; Fang, W., Bio-oil from hydro-liquefaction of Dunaliella salina over Ni/REHY catalyst. Bioresource Technology 2011, 102, (6), 4580-4584.
20. Jena, U.; Das, K. C.; Kastner, J. R., Comparison of the effects of Na2CO3, Ca3(PO4)2, and NiO catalysts on the thermochemical liquefaction of microalga Spirulina platensis. Applied Energy 2012, 98, 368-375.
21. Hammerschmidt, A.; Boukis, N.; Hauer, E.; Galla, U.; Dinjus, E.; Hitzmann, B.; Larsen, T.; Nygaard, S. D., Catalytic conversion of waste biomass by hydrothermal treatment. Fuel 2011, 90, (2), 555-562.
22. Bai, X.; Duan, P.; Xu, Y.; Zhang, A.; Savage, P. E., Hydrothermal catalytic processing of pretreated algal oil: A catalyst screening study. Fuel 2014, 120, 141-149.
23. Tian, C.; Li, B.; Liu, Z.; Zhang, Y.; Lu, H., Hydrothermal liquefaction for algal biorefinery: A critical review. Renewable and Sustainable Energy Reviews 2014, 38, 933-950.
24. Valdez, P. J.; Dickinson, J. G.; Savage, P. E., Characterization of Product Fractions from Hydrothermal Liquefaction ofNannochloropsissp. and the Influence of Solvents. Energy & Fuels 2011, 25, (7), 3235-3243.
25. Ross, A. B.; Biller, P.; Kubacki, M. L.; Li, H.; Lea-Langton, A.; Jones, J. M., Hydrothermal processing of microalgae using alkali and organic acids. Fuel 2010, 89, (9), 2234-2243.
26. Matar, S.; Hatch, L. F., Chemistry of petrochemical processes. Gulf Professional Publishing: 2001.

25
27. Zhou, D.; Zhang, L.; Zhang, S.; Fu, H.; Chen, J., Hydrothermal Liquefaction of Macroalgae Enteromorpha prolifera to Bio-oil. Energy & Fuels 2010, 24, (7), 4054-4061.
28. Brown, T. M.; Duan, P.; Savage, P. E., Hydrothermal Liquefaction and Gasification of Nannochloropsis sp. Energy & Fuels 2010, 24, (6), 3639-3646.
29. Anastasakis, K.; Ross, A. B., Hydrothermal liquefaction of the brown macro-alga Laminaria Saccharina: Effect of reaction conditions on product distribution and composition. Bioresource Technology 2011, 102, (7), 4876-4883.
30. Christensen, P. S.; Peng, G.; Vogel, F.; Iversen, B. B., Hydrothermal Liquefaction of the MicroalgaePhaeodactylum tricornutum: Impact of Reaction Conditions on Product and Elemental Distribution. Energy & Fuels 2014, 28, (9), 5792-5803.
31. Garcia Alba, L.; Torri, C.; Samorì, C.; van der Spek, J.; Fabbri, D.; Kersten, S. R. A.; Brilman, D. W. F., Hydrothermal Treatment (HTT) of Microalgae: Evaluation of the Process As Conversion Method in an Algae Biorefinery Concept. Energy & Fuels 2011, 111201165948002.
32. Eboibi, B.; Lewis, D.; Ashman, P.; Chinnasamy, S., Effect of operating conditions on yield and quality of biocrude during hydrothermal liquefaction of halophytic microalga< i> Tetraselmis</i> sp. Bioresource technology 2014, 170, 20-29.
33. Biller, P.; Riley, R.; Ross, A. B., Catalytic hydrothermal processing of microalgae: Decomposition and upgrading of lipids. Bioresource Technology 2011, 102, (7), 4841-4848.
34. Vardon, D. R.; Sharma, B. K.; Blazina, G. V.; Rajagopalan, K.; Strathmann, T. J., Thermochemical conversion of raw and defatted algal biomass via hydrothermal liquefaction and slow pyrolysis. Bioresource Technology 2012, 109, 178-187.
35. Biller, P.; Ross, A. B., Potential yields and properties of oil from the hydrothermal liquefaction of microalgae with different biochemical content. Bioresour Technol 2011, 102, (1), 215-25.
36. Lopez Barreiro, D.; Zamalloa, C.; Boon, N.; Vyverman, W.; Ronsse, F.; Brilman, W.; Prins, W., Influence of strain-specific parameters on hydrothermal liquefaction of microalgae. Bioresour Technol 2013, 146, 463-71.
37. Li, D.; Chen, L.; Xu, D.; Zhang, X.; Ye, N.; Chen, F.; Chen, S., Preparation and characteristics of bio-oil from the marine brown alga Sargassum patens C. Agardh. Bioresource Technology 2012, 104, 737-742.
38. Roussis, S. G.; Cranford, R.; Sytkovetskiy, N., Thermal Treatment of Crude Algae Oils Prepared Under Hydrothermal Extraction Conditions. Energy & Fuels 2012, 26, (8), 5294-5299.
39. Yu, G.; Zhang, Y.; Schideman, L.; Funk, T.; Wang, Z., Distributions of carbon and nitrogen in the products from hydrothermal liquefaction of low-lipid microalgae. Energy & Environmental Science 2011, 4, (11), 4587.
40. Adarme-Vega, T. C.; Lim, D. K.; Timmins, M.; Vernen, F.; Li, Y.; Schenk, P. M., Microalgal biofactories: a promising approach towards sustainable omega-3 fatty acid production. Microb Cell Fact 2012, 11, (1), 96.
41. Miao, C.; Chakraborty, M.; Chen, S., Impact of reaction conditions on the simultaneous production of polysaccharides and bio-oil from heterotrophically grown Chlorella

26
sorokiniana by a unique sequential hydrothermal liquefaction process. Bioresource Technology 2012, 110, 617-627.
42. Valdez, P. J.; Savage, P. E., A reaction network for the hydrothermal liquefaction of Nannochloropsis sp. Algal Research 2013, 2, (4), 416-425.

27
3 Experimental Materials and Methods
Herein, the work represents the culmination of combined studies from two main lots of
algae biomass cultivated and harvested in 2011 and 2013 from the Lawrence, KS Wastewater
Treatment Plant. For identification purposes, the biomass, reaction parameters, and
characterization techniques will be referred to by the corresponding year the algae was
harvested; referred from here on as algae lot# 2011 and algae lot# 2013, respectively. Many
procedures used in this work were taken from standard methods, adapted from those reported in
the literature, or developed as novel methods. One particular novel method that was developed
incorporated using thermogravimetric analysis to simultaneously obtain a full proximate analysis
(moisture, volatile, fixed-carbon, and ash content) of either the algae biomass or HTL solid
product. Significant limitations to the standard method of biomass ash determination (ASTM
E1755) were identified; including being susceptible to inaccuracies during material handling and
weighing procedures as well as be very time consuming (requiring multiple days). The
development of the thermogravimetric method for proximate analysis overcame both of these
limitations and provided additional characterizations beyond moisture and ash content which add
valuable information in terms of volatile content and optimum burning temperatures of the
samples.
3.1 Algae Cultivation
All algae cultivation used in this dissertation was grown and collected at the Lawrence,
KS Wastewater Treatment Plant, in four 2500 gallon open pond reactors (height, 1.2 m;

28
diameter, 3.17 m). The open ponds operated continuously as stirred tanks fed by incoming water
and nutrients supplied by effluent from the secondary clarifier before disinfection. Each reactor
was held at a hydraulic residence time (HRT) of 10 days. Aeration and mixing was provided by
fine-bubble air stones. No algae inoculum was used and native algae species were allowed to
cultivate naturally. A representative mixed algae culture was identified and is presented in Table
3.1.
Table 3-1. Identified algae species.
Species Identified Scenedesmus quadricauda Cladophora sp. Navicula sp. Golenkinia radiata Scenedesmus bijuga Selenastrum sp. Oscillatoria sp. Cosmarium sp. Micractinium pusillum Pediastrum boryanum Merismopedia sp. Microcystis sp. Chlorella sp. Oedogonium sp. Cryptomonas sp. Cosmarium sp. Cyclotella sp. Spirogyra sp.
Top-down ecological control was implemented through the addition of Gambusia fish which
prey on zooplankton such as Daphnia. Operation of these pond reactors have been previously
reported by Sturm and Lamer1 and Sturm et al.2 Effluent from the four reactors continuously
flowed to four separate gravity sedimentation tanks each with a surface area of 1.56 ft2 and an
operating volume of 42.9 gal. Each system had an overflow velocity of 6.7 m day-1 at the
operational flowrate. The concentrated microalgae samples (1-1.5% solids) were collected from
the bottom of each sedimentation tank daily and were immediately processed. Algae harvested
from the settling tanks were centrifuged at 3220 rcf for 10 minutes. The pellet was then freeze

29
dried, ground with a conventional coffee grinder, and stored at or below 4°C until processed for
characterization(s) and HTL.
During the collection of algae lot# 2011 each settling tank was mixed together before
centrifugation. Macroalgae (Cladophora sp.) grown on the tank walls were also collected and
processed separately but in the same manner; furthermore identified as macro lot# 2011. The
cultivation strategy for algae lot# 2013 deviated slightly from the above mentioned; each of the
four reactors were set-up as duplicate sets of two reactors in series, in which the treatment
plant’s secondary effluent was sent to the first open pond, whose effluent was sent to a second
open pond. Each pond had a hydraulic retention time (HRT) of 10 days resulting in a total of 20
day HRT for each set in the 2 X 2 system. Biomass grown in the second pond of one set was
used as the algae lot# 2013. Figure 3-1 shows the process water/nutrient flow for each algae lot
cultivated.
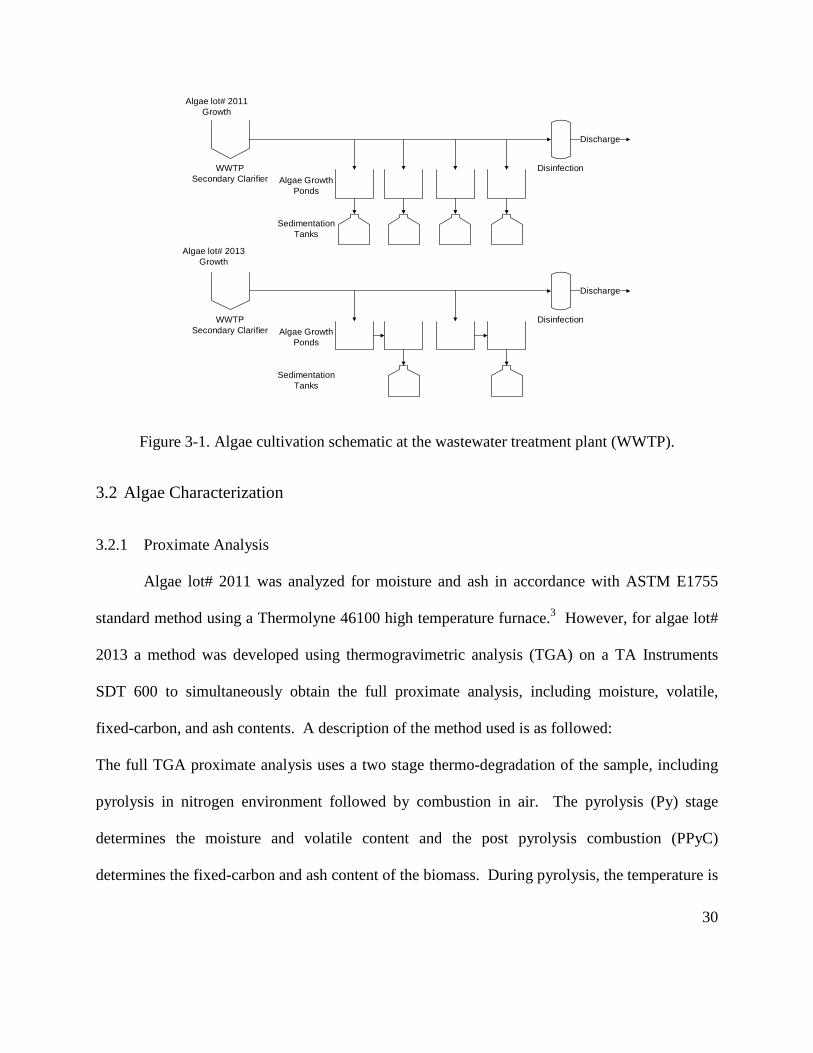
30
WWTPSecondary Clarifier
Disinfection
Discharge
Algae Growth Ponds
Sedimentation Tanks
Algae lot# 2013 Growth
Algae lot# 2011 Growth
WWTPSecondary Clarifier
Disinfection
Discharge
Algae Growth Ponds
Sedimentation Tanks
Figure 3-1. Algae cultivation schematic at the wastewater treatment plant (WWTP).
3.2 Algae Characterization
3.2.1 Proximate Analysis
Algae lot# 2011 was analyzed for moisture and ash in accordance with ASTM E1755
standard method using a Thermolyne 46100 high temperature furnace.3 However, for algae lot#
2013 a method was developed using thermogravimetric analysis (TGA) on a TA Instruments
SDT 600 to simultaneously obtain the full proximate analysis, including moisture, volatile,
fixed-carbon, and ash contents. A description of the method used is as followed:
The full TGA proximate analysis uses a two stage thermo-degradation of the sample, including
pyrolysis in nitrogen environment followed by combustion in air. The pyrolysis (Py) stage
determines the moisture and volatile content and the post pyrolysis combustion (PPyC)
determines the fixed-carbon and ash content of the biomass. During pyrolysis, the temperature is

31
increased to 90°C where it enters a stepwise function until 110 °C. During the stepwise function,
the temperature was either isothermal or increasing at 1 °C min-1 depending upon criteria of the
derivative weight change, i.e., the sample is isothermal when derivative weight change is >0.01
wt% min-1 and increasing temperature when the derivative weight change is <0.01 wt% min-1.
This allows accurate determination of a precise weight loss at a particular temperature. After the
first stepwise function the temperature was ramped at a constant rate, 5-10°C min-1 to 800 °C and
entered another stepwise function until 850 °C. Moisture and volatile matter was then
determined at the point where weight changes were essentially zero at ~100 °C and 850 °C,
respectively. The sample was then cooled to 120 °C and flow was switched from nitrogen to air
commencing the PPyC phase for determination of the fixed-carbon and ash content. Under
oxygen, the PPyC proceeded to 800 °C and enters another stepwise function to 850 °C. The
calculations used for quantifying the proximate analysis are as followed, where %SR refers to
mass percent of the sample remaining:
Moisture: 100% - %SR [after 1st step-wise during Py]
Volatile: %SR [after 1st step-wise during Py] – %SR [after 2nd step-wise during Py]
Fixed Carbon: %SR [after 2nd step-wise during Py] - %SR [after step-wise during PPyC]
Ash: %SR [after entire program]
3.2.2 Algae lot# 2013 Ash
Ash from algae lot# 2013 was obtained by placing a sample of freeze dried algae, ∼100
mg, in a homemade quartz tube furnace with a programmable temperature controller. The
sample was combusted under a flow of 100 mL min−1 of air during 2 °C min−1 ramp to 600 °C
32
and held for 8 h. The combustion procedure was performed three times to ensure all organic
material was removed.
3.2.3 Ultimate analysis
The ultimate analysis or carbon, hydrogen, nitrogen, and oxygen (CHN & O) contents of
algae lot# 2011 were determined by Micro Analysis Inc. (Wilmington, DE). Algae lot# 2013
was determined in house with a Perkin Elmer CHN Analyzer with O content determined by
difference. Since algae cultivated for this thesis results in significant ash contents reporting the
ultimate content on a ash free dry weight percent (afdw%) is important for comparing data
throughout the literature. Samples are measured completely dry and therefore measured values
are normalized to the ash for reporting afdw%. Typical procedure for measuring CHN contents
include the following: after drying biomass samples in an oven overnight at 105 °C they are
immediately placed in a desiccator. The analyzer is calibrated by running a series of black and
k-factors (terminology used by the manufacturer) which include running a blank tin sample cup
and a known amount of acetanilide (Perkin Elmer standard), respectively. Once stable readings
are obtained for both k-factors and blanks, the acetanilide is analyzed as a sample to ensure that
the proper CHN content is obtained by the instrument. Once the instrument is properly
calibrated (performed during each day of analysis) each sample is repeated until at least three
values within the instrument error (±0.03 wt%) is obtained. All samples (and k-factors) are
weighed to the nearest 0.001 mg using a calibrated Perkin Elmer micro analytical balance.
33
3.2.4 Higher Heating Value (HHV)
Higher heating value (HHV), of algae lot# 2011, was obtained using a Parr 6200
calorimeter using decane (Fisher; 99+%) as a combustion agent. Utilization of a combustion
agent first requires prior calibration within the instrument which is stored within the internal
memory of the instrument. Decane was chosen to ensure reliable combustion and minimal
evaporation during sample transfer from the balance to the calorimeter. All samples and
combustion agents are measured to 0.1 mg using a Metler Toledo NewClassic MF analytical
balance. HHV of algae lot# 2013 was not measured, however could be calculated by the
following equation(s)
HHV =14441.82(X ) + 7018.311
Where, X = volatile matter / (volatile matter + fixed carbon + ash)
Or,
HHV =343.08C + 424.92H + 261.98N + 27.76O
Where, CHNO = carbon, hydrogen, nitrogen, and oxygen on a dry-ash-free-basis in kJ/kg.4
3.2.5 Proton Induced X-ray Emission (PIXE)
Inorganic elemental (non-CHNO content) of algae lot# 2011 was analyzed and quantified
through PIXE performed by Elemental Analysis, Inc. (Lexington, KY).
3.2.6 Inductively Coupled Plasma- Optical Emission Spectroscopy (ICP-OES)
ICP-OES (Agilent) was used for analysis during algae lot# 2013. The elements of: (Al,
Ba, Ca, Fe, K, Mg, Na, P, S)- group “A”, (B, La, Mn, Ni, Zn) –group “B”, and (As, Co, Cu, Pb,
Sr) group- “C”, were quantified in samples of the wastewater effluent, growth media in each

34
open ponds in series, the algae biomass, and the resultant HTL solid product. One standard stock
solution was created by and purchased from Inorganic Ventures (Christiansburg, VA) with
concentrations of 1000 ppm, 100 ppm, and 10 ppm, for group A, B, and C, respectively.
Standard solutions were prepared and used at 5 vol% nitric acid (Fisher; trace metal grade) and
concentrations of 0.5, 1, 2, 5, and 10 ppm with respect to group A, leaving group(s) B and C at
their respective concentration magnitudes. Standard curves were created using the five
concentrations and a blank with a quality control check at 3 ppm with respect to group A. When
performing analysis a new standard curve was created every 10 samples. Samples were adjusted
to 5 vol% nitric acid and filtered through a 0.2 µm filter before analysis. Solid samples (algae
biomass and HTL solid product) were digested by standard acid microwave digestion.
3.3 Hydrothermal Liquefaction (HTL)
3.3.1 Reaction, Product Separation, and Yield Determination
All reactions were performed in a 450 mL 4560 series mini bentchtop reactor (Parr;
Moline, IL) attached to a 4848 model controller (Parr) and used 50 mL of MilliQ water at a
particular solids concentration. Once contents were sealed inside the reactor, oxygen was purged
from the headspace by flowing nitrogen multiple times. Reactor temperatures were performed at
350 ± 5 °C with a reaction time of 1 hr and a stir rate of 150 rpm. Post reaction, the reactor was
cooled using a water bath to quench the reaction and the contents were allowed to equilibrate
overnight, upon which product recovery and characterizations were commenced. At least three
identical experiments were performed to obtain standard deviations for each algae lot (except for
macro lot# 2011; only duplicate reactions were performed due to the availability of algae
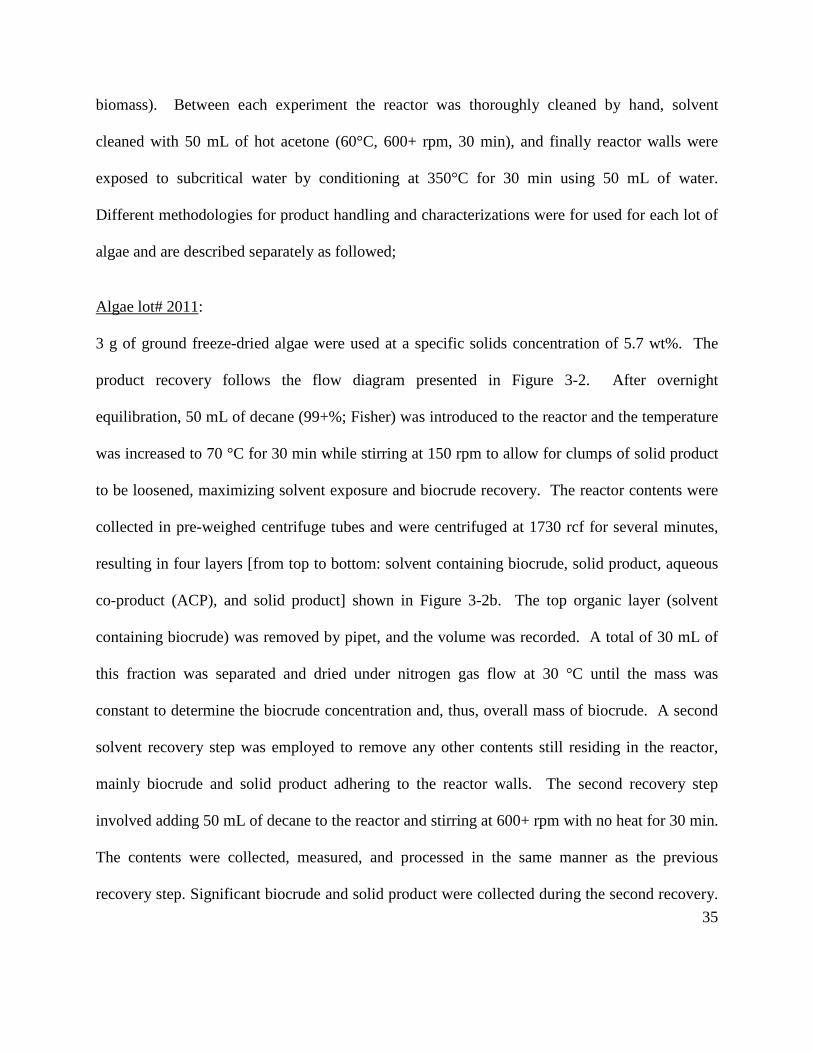
35
biomass). Between each experiment the reactor was thoroughly cleaned by hand, solvent
cleaned with 50 mL of hot acetone (60°C, 600+ rpm, 30 min), and finally reactor walls were
exposed to subcritical water by conditioning at 350°C for 30 min using 50 mL of water.
Different methodologies for product handling and characterizations were for used for each lot of
algae and are described separately as followed;
Algae lot# 2011:
3 g of ground freeze-dried algae were used at a specific solids concentration of 5.7 wt%. The
product recovery follows the flow diagram presented in Figure 3-2. After overnight
equilibration, 50 mL of decane (99+%; Fisher) was introduced to the reactor and the temperature
was increased to 70 °C for 30 min while stirring at 150 rpm to allow for clumps of solid product
to be loosened, maximizing solvent exposure and biocrude recovery. The reactor contents were
collected in pre-weighed centrifuge tubes and were centrifuged at 1730 rcf for several minutes,
resulting in four layers [from top to bottom: solvent containing biocrude, solid product, aqueous
co-product (ACP), and solid product] shown in Figure 3-2b. The top organic layer (solvent
containing biocrude) was removed by pipet, and the volume was recorded. A total of 30 mL of
this fraction was separated and dried under nitrogen gas flow at 30 °C until the mass was
constant to determine the biocrude concentration and, thus, overall mass of biocrude. A second
solvent recovery step was employed to remove any other contents still residing in the reactor,
mainly biocrude and solid product adhering to the reactor walls. The second recovery step
involved adding 50 mL of decane to the reactor and stirring at 600+ rpm with no heat for 30 min.
The contents were collected, measured, and processed in the same manner as the previous
recovery step. Significant biocrude and solid product were collected during the second recovery.
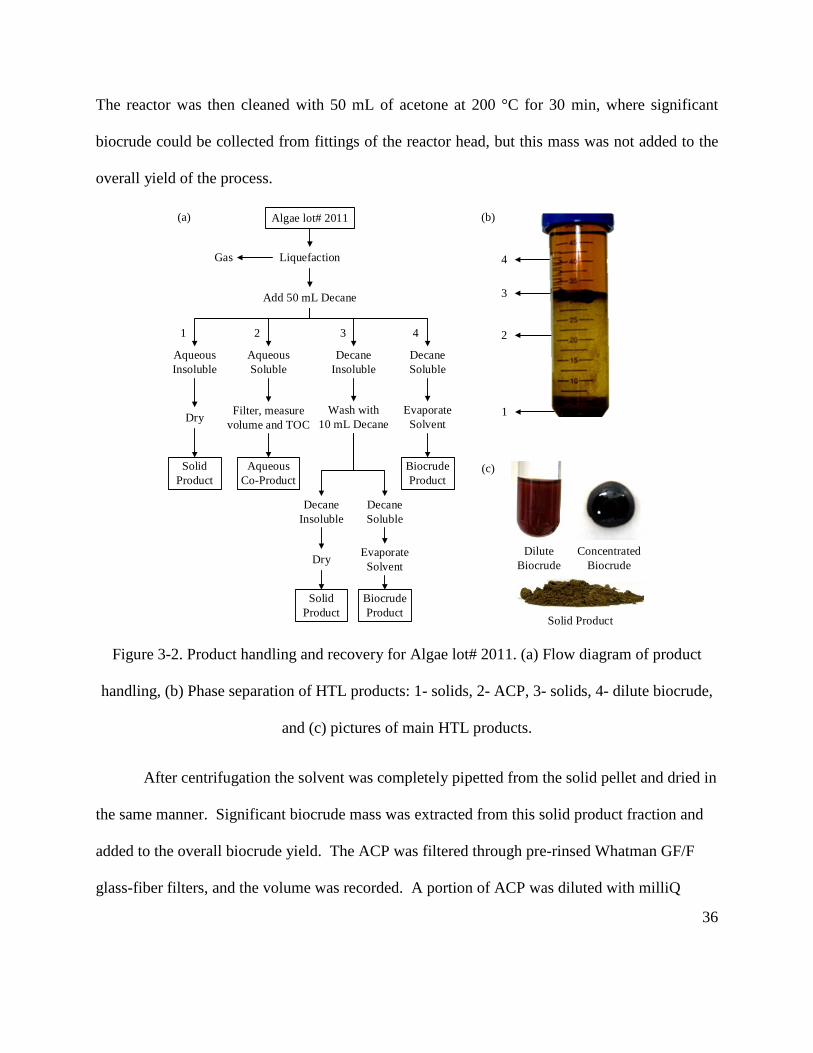
36
The reactor was then cleaned with 50 mL of acetone at 200 °C for 30 min, where significant
biocrude could be collected from fittings of the reactor head, but this mass was not added to the
overall yield of the process.
LiquefactionGas
Add 50 mL Decane
Dry
AqueousCo-Product
Solid Product
Algae lot# 2011
Aqueous Insoluble
Aqueous Soluble
Decane Insoluble
Decane Soluble
Filter, measure volume and TOC
Wash with 10 mL Decane
Evaporate Solvent
Decane Insoluble
Biocrude Product
Decane Soluble
Dry Evaporate Solvent
Solid Product
Biocrude Product
1 2 3 4
(a) (b)
(c)
2
1
3
4
Concentrated Biocrude
Dilute Biocrude
Adsorbants3
Solid Product
Figure 3-2. Product handling and recovery for Algae lot# 2011. (a) Flow diagram of product
handling, (b) Phase separation of HTL products: 1- solids, 2- ACP, 3- solids, 4- dilute biocrude,
and (c) pictures of main HTL products.
After centrifugation the solvent was completely pipetted from the solid pellet and dried in
the same manner. Significant biocrude mass was extracted from this solid product fraction and
added to the overall biocrude yield. The ACP was filtered through pre-rinsed Whatman GF/F
glass-fiber filters, and the volume was recorded. A portion of ACP was diluted with milliQ

37
water [40:1; water: ACP] and analyzed for total organic carbon (TOC) and total nitrogen (TN)
using a Torch Combustion TOC/TN Analyzer. All solids were dried under N2 flow at 30 °C, and
the weights of each were combined for a total solid product mass. The energy content (HHV)
and elemental analysis of the solid product and biocrude were determined in the same manner as
the starting algae. A photograph of the biocrude (dilute and concentrated) and solid product are
shown in Figure 3-2c. A control experiment was performed using the same lot and amount of
algae and water. Using the same reactor, the algae/ water suspension was agitated at 150 rpm for
1 hr at room temperature. The solvent recovery method described above was employed without
addition of heat at any point. Both recovery steps were implemented, and oil mass determination
methods were consistent for both HTL and control experiments.
Yields of each product fraction were equated from the following equations:
𝐵𝐵𝐵𝐵𝐵𝐵𝐵𝐵 𝑦𝐵𝐵𝑦𝐵 = ∑𝑚𝑚𝑚𝑚𝑚𝑚𝑚𝑚𝑚𝑚𝑚𝑚𝑚𝑚𝑚𝑜𝑜𝑜𝑜𝑜𝑜𝑜𝑜
𝑥 100 (3.1)
𝐴𝐴𝐴 𝑦𝐵𝐵𝑦𝐵 = [𝑇𝑇𝑇]∗ 𝑚𝐴𝑣𝑜𝑣𝑚𝑇𝑜𝑣𝑜𝑜𝑎
𝑥 100 (3.2)
𝑆𝐵𝑦𝐵𝐵𝑆 𝑦𝐵𝐵𝑦𝐵 = 𝑚𝑚𝑚𝑚𝑚𝑚𝑚−𝑚𝑚𝑚ℎ𝑜𝑣𝑜𝑜𝑎𝑚𝑚𝑚𝑚𝑚𝑚𝑜𝑜𝑜𝑜𝑜𝑜𝑜𝑜
𝑥 100 (3.3)
𝐺𝐺𝑆 𝑦𝐵𝐵𝑦𝐵 = 100 − (3.1) − (3.2) − (3.3) (3.4)
where, ∑mBiocrude is the summation of all calculated masses of biocrude from each fraction,
mAlgaeorganics is the mass of freeze dried algae * (100 – ash% - moisture%), [TOC] is the
concentration of measured total organic carbon, Aqvol is the measured filtered ACP volume,
mCalgae is the mass of carbon (afdw%) in algae, mSolids is the mass of dried solid product, and
mAshalgae is the mass of ash in starting algae. Dry weight (dw%) solid product yield was

38
calculated by relating the total dry weight of product to the dry weight of algae used in the
reaction.
Algae lot# 2013:
5.56 g of ground freeze-dried algae were used resulting in 10.0 wt% solids for each
reaction. Product recovery and isolation used dichloromethane (DCM) (high performance liquid
chromatography grade, Fisher) and followed the flow diagram shown in Figure 3-2.
Solids/ Oil/ SolventSolids/ Oil
Hydrothermal Processing
Gas
Vacuum Filtration
Aqueous Co-Product
Reactor
DCM
Gravity Filtration
SolidProduct
OilSolvent
Distillation
BiocrudeProduct
Algae lot# 2013
Figure 3-3. Schematic of product handling and isolation for algae lot# 2013.
Once the reactor contents had equilibrated, the gasses formed were vented and the contents were
vacuum filtered separating the aqueous co-product (ACP) and solids/ oil mixture. The solids/ oil
mixture was placed back into the reactor vessel with the addition of 50 mL DCM and heated to
40 °C with stir rate of 600+ rpm for 30 min. Upon cooling the vessel again in a water bath, the
contents were gravity filtered and washed with additional DCM via slow pipette until no
additional oil was extracted from the solids. The solid product was dried and the oil/ solvent
mixture was distilled to remove solvent and obtain biocrude product.
39
Commencing product analysis directly after separations is critical for obtaining reliable
yields, particularly for the biocrude fraction. After the majority of the DCM solvent was distilled
off, a vacuum was applied to lower solvent content to <10 wt%. The weight of the biocrude was
recorded in the tarred flask and immediately placed an ice bath. Simulated distillation (see
section 3.4.4) and ultimate analysis (see section 3.4.2) was immediately performed on the
biocrude using the same TGA instrument and CHN analyzer as used for the proximate and
ultimate analysis of the algae biomass, respectively. Yield and ultimate analysis (using known
molecular weight, carbon, and hydrogen content of DCM) are adjusted by the corresponding
amount of residual solvent for each experiment individually.
The dried solid product was weighed and analyzed for proximate (TGA: see section
3.4.1) and ultimate (CHN: see section 3.4.2) contents, functional groups (FTIR: see section
3.4.6), and crystallography (XRD: see section 3.4.5), along with bulk and trace metal
compositions (ICP-OES: see section 3.2.5). Yield of the solids was determined on a dry weight
(dw) and an ash free dry weight (afdw) basis. Portions (~100 mg) of the solid product were
calcined in 100 mL min-1 air flow in a homemade quartz tube furnace with a ramp rate of 2 °C
min-1 to specified temperature (500, 600, 700, 800, 900 °C) for 8 hrs. Each calcination
temperature was analyzed for FTIR (see section 3.4.6) and XRD (see section 3.4.5).
The aqueous co-product (ACP) underwent analysis of total organic carbon (TOC) and
total nitrogen (TN). The TOC and TN were simultaneously measured by Torch TOC/TN
analyzer. The measured volume of ACP and corresponding TOC were used for determining the
afdw% yield. Any gasses that were formed during HTL were not analyzed and the yield was
determined by a difference and/or using the ideal gas law assuming all CO2, headspace volume,
40
and recorded post-reaction temperature and pressure, similar to algae lot# 2011. Post analysis of
the elemental balance for carbon, hydrogen, nitrogen, and phosphorus for the feedstock and
products were performed. The equations used for determining afdw% product yields are as
followed:
𝐵𝐵𝐵𝐵𝐵𝐵𝐵𝐵 𝑦𝐵𝐵𝑦𝐵 = 𝑤𝑤𝑏𝑜𝑜𝑜𝑜𝑏𝑏𝑎 (1−%𝐷𝑇𝐷)𝑚𝑚𝑚𝑚𝑚𝑜𝑎𝑏𝑎
∗ 100 (3.5)
𝑆𝐵𝑦𝐵𝐵𝑆 𝑦𝐵𝐵𝑦𝐵 = 𝑤𝑤𝑜𝑜𝑣𝑜𝑏𝑜(1−%𝑚𝑚ℎ𝑜𝑜𝑣𝑜𝑏𝑜)𝑚𝑚𝑚𝑚𝑚𝑜𝑎𝑏𝑎
∗ 100 (3.6)
𝐴𝐴𝐴 𝑦𝐵𝐵𝑦𝐵 = 𝑣𝑚𝑚𝐴𝐴𝐴∗𝑇𝑇𝑇𝑚𝑚𝑚𝑚𝑚𝑜𝑎𝑏𝑎∗% 𝑚𝑚𝑚𝑐𝑚𝑐𝑜𝑎𝑏𝑎
∗ 100 (3.7)
𝐺𝐺𝑆 𝑦𝐵𝐵𝑦𝐵 = 100− (3.5)− (3.6)− (3.7) (3.8)
Where, algaeafdw is the weight of algae used in the reactor minus the amount of moisture and ash
determined by TGA, wtbiocrude is the measured weight after distillation, %DCM is the fraction of
solvent remaining found with SimDist, wtsolids is the measured weight of the solids fraction after
gravity filtration, %ashsolids is the ash content of the solid product measured from TGA, volACP is
the measured volume of the ACP after vacuum filtration, TOC is the measured concentration of
organic carbon in the ACP, and % carbonafdw is the amount of carbon in the algae normalized to
the organic fraction of biomass.

41
3.4 Product Characterizations
3.4.1 Proximate Analysis
The solid product from algae lot# 2011 was not specifically evaluated for proximate
analysis. The solids product from algae lot# 2013 was evaluated for proximate analysis in the
same manner as the algae biomass of the corresponding algae lot# 2013 (see section 3.2.1).
3.4.2 Ultimate analysis
The ultimate analysis for both the biocrude and solid product of each algae lot was
determined in the same manner as its respective algae biomass (see section 3.2.2).
3.4.3 Gas Chromatography-Mass Spectroscopy (GC-MS)
Algae lot# 2011:
GC-MS analysis of biocrude produced from algae lot# 2011 was performed using an
Agilent 6890 Series GC-FID System with 5973 Network Mass Selective Detector equipped with
a HP-5MS column (5% Phenyl Methyl Siloxane mobile phase; 30.0 m length, 250 µm diameter,
0.25 µm thickness). The method used an injection volume of 1.0 µL with a split ratio of 20:1,
initial temp of 40 °C, ramp of 8 °C min-1 to 250 °C, holding for 5 min followed by a 20 °C min-1
ramp to 300 °C, holding for 1 min. Samples were prepared for the GC-MS analysis in two ways:
1) a derivatized sample of concentrated biocrude and 2) a non-derivatized sample of dilute
biocrude in the decane solvent. The derivatized sample was prepared using 10.0 mg of
concentrated biocrude, weighed in a GC vial, with 100 µL MSTFA (n-Methyl-n-
(trimethylsilyl)trifluoroacetamide; derivatizing agent supplied by Agilent) and 100 µL pyridine
(HPLC grade 99.5+%, Alfa Aesar) added and diluted with 800 µL n-heptane (99+%, Sigma).

42
Analysis of the biocrude in the concentrated derivatized sample revealed that residual decane
was present, even though the oil had been dried until a consistent weight was reached. A 5-point
(in triplicate) calibration curve was produced using known masses of decane in chloroform
[high-performance liquid chromatography (HPLC); Fisher] to quantify residual decane in the
concentrated biocrude and control experiment. The calibration curve had an R2 value of 0.988.
Four points of the calibration curve was obtained by creating a stock solution of 3.84 mg (5.0
µL) of decane diluted to 1 mL in chloroform and performing subsequent serial dilutions. The
serial dilutions used 10, 20, 30, and 40 µL of stock solution and diluting to 1 mL again with
chloroform. The fifth point used 1.0 µL of decane (0.72 mg) and 99.0 µL of chloroform.
Algae lot# 2013:
GC-MS analysis of the biocrude produced from algae lot# 2013 was performed using an
Agilent 6890 Series GC−FID system with a 5973 network mass selective detector equipped with
a Varian CP8956 column (5% phenyl methyl siloxane mobile phase; 30.0 m length; 320 μm
diameter; and 0.50 μm thickness). The method used an injection volume of 1.0 μL with a split
ratio of 1:1, an initial temperature of 40 °C with a holding time of 15 min, ramp of 10 °C min-1 to
100 °C, holding for 1 min, followed by a 1 °C min-1 ramp to 200 °C, with 15 min holds at 150 °C
and 200 °C, followed by a 5 °C min-1 ramp to 270 °C, and final hold for 5 min. Samples were
prepared for the GC-MS analysis in two ways: 1) 10.0 mg of biocrude in 1.0 mL of DCM and 2)
10.0 mg of biocrude derivatized with MSTFA (n-methyl-n-(trimethylsilyl)trifluoroacetamide;
Agilent). The derivatized sample was prepared using 10.0 mg of biocrude, weighed in a GC vial,
with 100.0 μL of MSTFA and 100.0 μL of pyridine [high-performance liquid chromatography
43
(HPLC) grade, 99.5+%, Alfa Aesar] added, and diluted with 800.0 μL of n-heptane (99+%,
Sigma).
3.4.4 Simulated Distillation (SimDist)
SimDist was performed on the biocrude produced from algae lot# 2013 by
thermogravimetric analysis (TGA) on a TA Instruments SDT 600. The method used was created
to obtain accurate values of residual solvent (DCM) content in the biocrude after removal by
distillation (see section 3.3.1). The method performed is as followed: Under a 10 mL min-1 flow
of nitrogen gas a sample of biocrude (5-10 mg) was heated at a rate of 10 °C min-1 until 35 °C,
where it entered a stepwise function (described in section 3.2.1) until 45 °C, to determine the
precise amount of DCM in the biocrude same. The method then reverts back to a 10 °C min-1
until 800 °C. Determination of each distillate fraction within the sample followed the following
equations, where wt%S is the weight percent of the sample.
Wt % DCM: 100 – wt%S [at the end of the step-wise]
Heavy Naphtha: wt%S [at the end of the step-wise] – wt%S [at 193 °C]
Kerosene: wt%S [at 193 °C] - wt%S [at 271 °C]
Gas Oil: wt%S [at 271 °C] - wt%S [at 343 °C]
Vacuum Gas Oil: wt%S [at 343 °C] - wt%S [at 538 °C]
Vacuum Gas Residual: wt%S [at 538 °C] - wt%S [at 800 °C]
Ash: wt%S remaining after 800 °C
44
3.4.5 X-ray Diffraction (XRD)
XRD patterns of the algae lot# 2013 combustion ash (see section 3.2.2), HTL solid
product from algae lot# 2013, including each of its calcination temperatures (see section 3.3.1)
were collected using monochromated CuKα radiation (λ= 1.54178 Å) on a Bruker Proteum
Diffraction System equipped with Helios multilayer optics, an APEX II CCD detector and a
Bruker MicroStar microfocus rotating anode x-ray source operating at 45 kV and 60 mA. Sample
preparation included mixing powder with Paratone N oil and placing it in a <0.5 mm nylon loop
mounted on a goniometer head. A Bruker Apex2 V2010.3-0 software package was used to
collect and merge three, 60 sec. 180° φ-scans with the detector at 2θ = 30º, 60º and 90º using a
sample-to-detector distance of 50.0 mm. The raw data was processed with Bruker EVA powder
diffraction software.
3.4.6 Fourier-Transform Inferred Spectroscopy (FTIR)
FTIR spectrums of the algae lot# 2013 combustion ash (see section 3.2.2) and HTL solid
product from algae lot# 2013, including each of its calcination temperatures (see section 3.3.1),
were collected on a Varian 600 series FTIR equipped with a GladiATRTM (PIKE Technologies)
at a constant temperature of 105 °C. Absorbance spectra were averaged over 254 scans,
collected from 4000 to 500 cm-1 with resolution and sensitivity of 4 cm-1 and 8 cm-1, respectively.
3.4.7 Scanning Electron Microscopy -Energy Dispersive X-ray Spectroscopy (SEM-EDS) and
Transmission Electron Microscopy (TEM)
All imaging of algae lot# 2013 solid products were performed by the University of
Kansas Microscopy and Analytical Imaging (MAI) Laboratory, on a Carl Zeiss Leo 1550 field

45
emission scanning electron microscope (High Vacuum with a Schottky field emitter
Operating Voltages from 200 V to 30kV) and a FEI Tecnai F20 XT transmission electron
microscope (200kV electron source- Schottky field emitter, with high tension values of 20, 40,
80, 120, 160, and 200 kV).
3.4.8 Cell Culturing and Live/Dead Assay
Tissue-culture treated 24-well plates were coated, via aqueous suspension, with HTL
solid product calcined at 600 °C. The plates were dried at 42 °C overnight and subsequently
sterilized with ethylene oxide. Human umbilical cord Wharton’s jelly cells (hWJCs) were
trypsinized with 0.05% trypsin and seeded on plates at 6 x10⁴ ± 2 x10⁴ hWJCs per
well. hWJCs were cultured with Dulbecco’s Minimal Essential Medium (DMEM) suspensions
with 10% mesenchymal stem cell qualified fetal bovine serum (FBS) and 1%
penicillin/streptomycin at 37oC with 5% CO2. hWJCs were isolated from Wharton's jelly of a
human umbilical cord (#157) obtained from Lawrence Memorial Hospital (LMH) (LMH IRB
approval #LMH 08-2). The umbilical cord came from a male born at full term under normal
conditions. Growth medium was changed every 2 days. After 10 days, a viability assay was
performed using LIVE/DEAD® Viability/Cytotoxicity Kit (Molecular Probes® LIVE/DEAD
assay; from Invitrogen) and analyzed through fluorescence microscopy (Zeiss AX10). Images
were processed using ZEN lite 2012 (blue edition) software.
3.5 References
1. Sturm, B. S. M.; Lamer, S. L., An energy evaluation of coupling nutrient removal from wastewater with algal biomass production. Applied Energy 2011, 88, (10), 3499-3506.

46
2. Sturm, B. S. M.; Peltier, E.; Smith, V.; deNoyelles, F., Controls of microalgal biomass and lipid production in municipal wastewater-fed bioreactors. Environmental Progress & Sustainable Energy 2012, 31, (1), 10-16.
3. Huang, H.; Yuan, X.; Zeng, G.; Zhu, H.; Li, H.; Liu, Z.; Jiang, H.; Leng, L.; Bi, W., Quantitative evaluation of heavy metals’ pollution hazards in liquefaction residues of sewage sludge. Bioresource Technology 2011, 102, (22), 10346-10351.
4. Phichai, K.; Pragrobpondee, P.; Khumpart, T.; Hirunpraditkoon, S., Prediction Heating Values of Lignocellulosics from Biomass Characteristics.
47
4 Demonstrating Sustainability through Wastewater-Cultivated Algae
The purpose of algae lot# 2011 was to demonstrate the feasibility of a sustainable
cultivation strategy [algae cultivated with effluent from an operating wastewater treatment plant
(WWTP) as sole provider of both water and nutrients] integrated to an algae-to-biocrude process
to produce renewable fuels and chemicals. The work presented in this chapter contains data
collected from both a mixed-culture microalgae (see Table 3.1), cited in Energy & Fuels (2013)
and previously presented data (American Institute of Chemical Engineers 2012 Annual Meeting)
on a species of macroalgae (Cladophora sp.) which were co-harvested from the same growth
ponds and will be commonly referred to as simply micro- and macro- algae, respectively,
throughout the entirety of this chapter. This work (at the time of publication) represents the first
of its kind to incorporate the hydrothermal liquefaction of algal biomass cultivated at an
operating wastewater treatment facility. The biomass was cultivated at the pilot-scale using
wastewater effluent as the sole provider of both water and nutrients. In addition, the data also
represented the first to perform liquefaction on a mixed species algae culture. The main
hypothesis was that using the sustainable strategy of wastewater cultivation would still provide
comparable biocrude yields to those found in the literature (see section 2.2) and be a viable
option for both advanced wastewater treatment and a renewable source of crude oil production,
regardless of minimal lipid accumulation within the algae cells.
48
4.1 Algae Growth and Characterization
The average water quality and nutrient concentrations in the wastewater effluent feed and
algal ponds can be found in Table 4-1, producing average biomass production rate1 of 12 g m-2
day-1. The average TN concentration of the wastewater effluent feed was 29.3 ± 4.8 mg L-1 and
the average TP concentration was 2.65 ± 0.10 mg L-1. During operation of the pond reactors in
the previous year (2010), the average TN of the wastewater effluent was 19.5 ± 4.5 mg L-1 and
the average TP was 3.21 ± 0.93 mg L-1.1 The measured concentrations over these two periods of
operation are similar to the textbook TN concentration for wastewater effluent (20 mg L-1), while
the TP concentrations are slightly lower than the textbook TP concentration (10 mg L-1).2
Similar to the majority of WWTPs in the United States, the Lawrence WWTP does not perform
biological nutrient removal (no phosphorus removal or denitrification). Only 206 of the more
than 12,000 municipal WWTPs in the country reported use of denitrification or phosphorus
removal technologies in the EPA 2008 Clean Watersheds Needs Survey.3 Thus, the Lawrence
WWTP effluent is representative of average municipal wastewater effluent characteristics in the
United States.

49
Table 4-1. Average water quality of algal growth tanks at Lawrence WWTP.
Water quality parameter Average measured value
Analysis method Wastewater Effluent Feed
Growth Ponds
Total nitrogen (TN; mg L-1) 29.3 ± 4.8 27.0 ± 4.9 Standard Method
4500-N Ca
Total dissolved nitrogen (TDN; mg L-1) 28.9 ± 5.2 22.4 ± 5.8 Standard Method
4500-N Ca
Total phosphorus (TP; mg L-1) 2.65 ± 0.10 3.41 ± 0.67 Standard Method
4500-P Ea Total dissolved phosphorus (TDP; mg L-1) 2.52 ± 0.12 2.75 ± 1.1 Standard Method
4500-P Ea
Total suspended solids (TSS; mg L-1) 13.3 ± 7.5 85.5 ± 22 Standard Method
2540 Da
pH 6.89 ± 0.31 7.44 ± 0.87 Field meterb
Temperature (°C) 25.7 ± 0.65 28.1 ± 2.2 Field meterb
Dissolved oxygen (DO; mg L-1) 2.71 ± 2.0 7.45 ± 0.51 Field meterb
aStandard methods can be found in Eaton et al.4 bYSI 556, Yello Springs, OH
The wastewater-cultured algae had high intercellular ash (non-combustible material)
content of 29.0 dw% and 24.4 dw% for micro- and macro-algae, respectively. Compared to
other reports of monoculture microalgae with ash contents as low as 5% and up to 25%.5, 6 The
majority, ~70%, of this non-combustible material is calcium and silica and calcium for the
microalgae where potassium and calcium dominate in the macroalgae. These levels are directly
related to the municipal wastewater effluent growth media. The high levels of silica can be
ascribed to the presence of diatoms as confirmed by the species listed in Table 3-1. The high
calcium is attributed to the municipal water source having an average water hardness of 40-120

50
mg L-1 as CaCO3, with calcium concentrations of 24-43 mg L-1.7 High ash content is also
normally found in marine macroalgae due to high levels of inorganics which incorporate into
their cell wall.8 Because the algae produced for this study had a high inorganic composition, the
product yields were subsequently based on an ash free dry weight (afdw%) basis to understand
the degree of organic conversion.
The organic and inorganic elemental analysis of the algae can be found in Table 4-2. The
measured carbon content of the microalgae was 34.7 dw%, similar to other wastewater-cultivated
algae (30-37 dw%)9, or 48.9 afdw%, which is lower than 51.3-57.8 afdw% of commercially
grown microalgae reported in the literature.6 Since significant amount of the HTL studies
reported in the literature use algae provided by companies, it is difficult to directly compare algal
growth conditions between studies. Adding CO2 to the algal tanks may increase the carbon
content of microalgae, but this was not performed in the wastewater pilot. Although the algae
have lower carbon content, it has a high oxygen content of 37.5 afdw%. This oxygen content is
5% to 15% higher than what has been reported for microalgae used in previous HTL studies.5, 6, 8,
10-16 The combination of the low carbon and the high oxygen content directly affects the HHV of
the algal biomass, which was measured at 15.1 and 14.1 MJ kg-1 for micro- and macro- algae,
respectively. Ross et al.5 reported HHV for Spirulina sp. and Chlorella vulgaris to be 21.2 and
23.2 MJ kg-1, respectively. However, the carbon content for both species was near 54 afdw%,
while the oxygen content was closer to 27 afdw%. These results indicate that microalgae grown
using municipal wastewater effluent are unique compared to fertilized monoculture algae that are
typically studied for HTL processing.
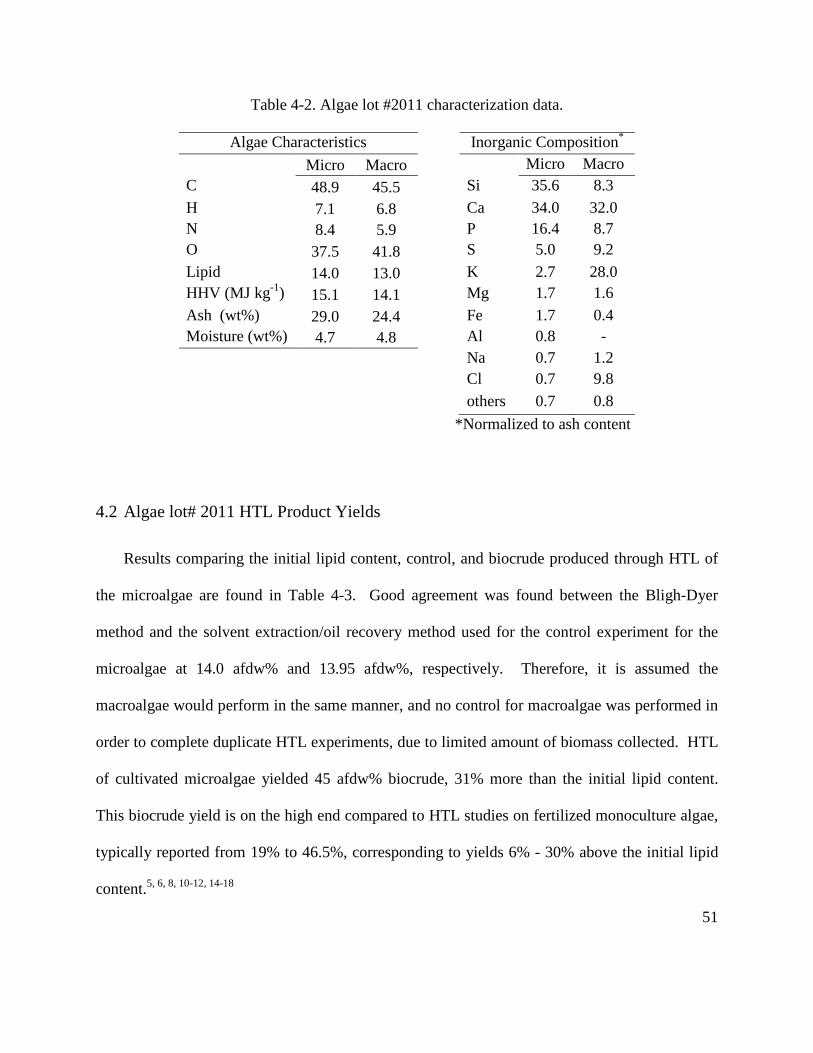
51
Table 4-2. Algae lot #2011 characterization data.
Algae Characteristics Inorganic Composition*
Micro Macro Micro Macro C 48.9 45.5 Si 35.6 8.3 H 7.1 6.8 Ca 34.0 32.0 N 8.4 5.9 P 16.4 8.7 O 37.5 41.8 S 5.0 9.2 Lipid 14.0 13.0 K 2.7 28.0 HHV (MJ kg-1) 15.1 14.1 Mg 1.7 1.6 Ash (wt%) 29.0 24.4 Fe 1.7 0.4 Moisture (wt%) 4.7 4.8 Al 0.8 - Na 0.7 1.2 Cl 0.7 9.8 others 0.7 0.8
*Normalized to ash content
4.2 Algae lot# 2011 HTL Product Yields
Results comparing the initial lipid content, control, and biocrude produced through HTL of
the microalgae are found in Table 4-3. Good agreement was found between the Bligh-Dyer
method and the solvent extraction/oil recovery method used for the control experiment for the
microalgae at 14.0 afdw% and 13.95 afdw%, respectively. Therefore, it is assumed the
macroalgae would perform in the same manner, and no control for macroalgae was performed in
order to complete duplicate HTL experiments, due to limited amount of biomass collected. HTL
of cultivated microalgae yielded 45 afdw% biocrude, 31% more than the initial lipid content.
This biocrude yield is on the high end compared to HTL studies on fertilized monoculture algae,
typically reported from 19% to 46.5%, corresponding to yields 6% - 30% above the initial lipid
content.5, 6, 8, 10-12, 14-18

52
Table 4-3. Oil Yields from microalgae.
Oil Yields (afdw%) Lipid Contenta Control Biocrude
14.0 13.95 45 aMeasured by Bligh-Dyer method19
The product yields from HTL of both micro- and macro-algae are shown in Figure 4-1 on an
afdw% basis. The main product was the biocrude at 45 ± 5%, followed by 21 ± 9% solid
product, 18 ± 5% aqueous product, and 16 ± 8% gas. The gas is reported by difference;
however, it was also verified using an ideal gal law calculation, assuming all the gas is CO2 with
equilibrated temperature (18 °C), pressure (4 psig), and a reactor head space volume of 400 mL.
The macroalgae yielded similar afdw% results with the average of two experiments resulting in
43%, 22%, 15%, and 20% for biocrude, solids, aqueous, and gas, respectively. The two
experiments performing HTL on the macroalgae had similar spread as the microalgae and is
believed would have obtained very similar standard deviations had there been enough biomass to
perform three reactions.
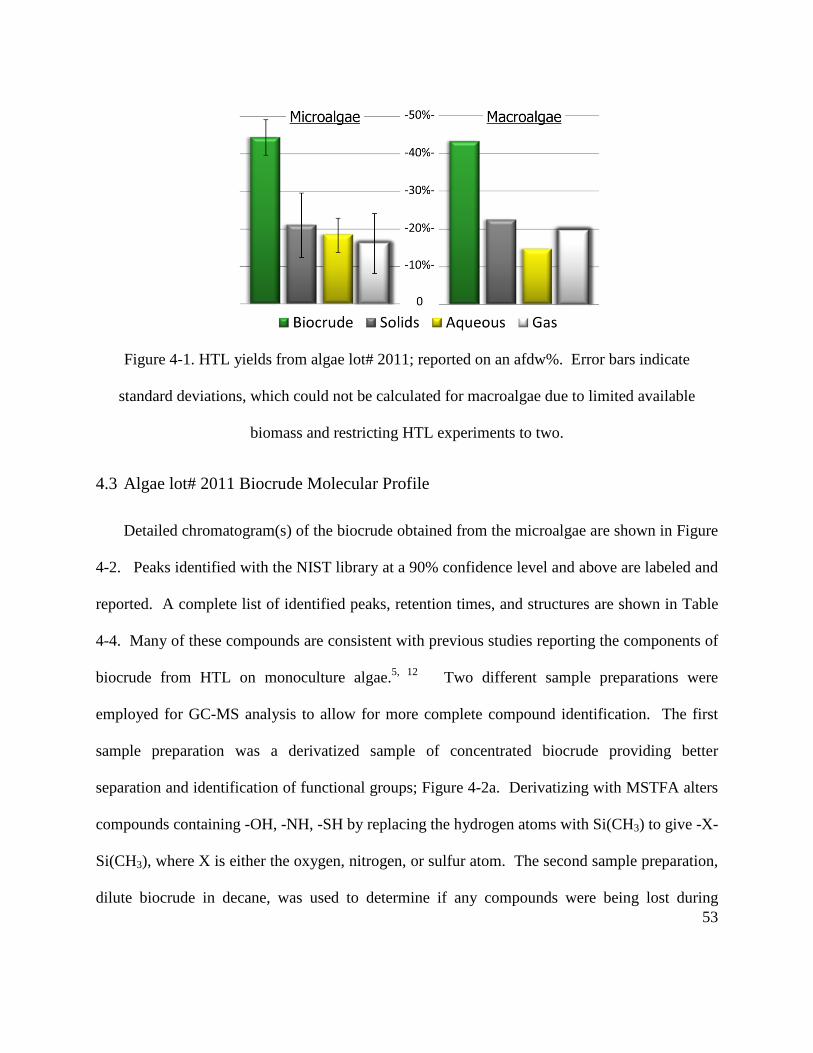
53
Figure 4-1. HTL yields from algae lot# 2011; reported on an afdw%. Error bars indicate
standard deviations, which could not be calculated for macroalgae due to limited available
biomass and restricting HTL experiments to two.
4.3 Algae lot# 2011 Biocrude Molecular Profile
Detailed chromatogram(s) of the biocrude obtained from the microalgae are shown in Figure
4-2. Peaks identified with the NIST library at a 90% confidence level and above are labeled and
reported. A complete list of identified peaks, retention times, and structures are shown in Table
4-4. Many of these compounds are consistent with previous studies reporting the components of
biocrude from HTL on monoculture algae.5, 12 Two different sample preparations were
employed for GC-MS analysis to allow for more complete compound identification. The first
sample preparation was a derivatized sample of concentrated biocrude providing better
separation and identification of functional groups; Figure 4-2a. Derivatizing with MSTFA alters
compounds containing -OH, -NH, -SH by replacing the hydrogen atoms with Si(CH3) to give -X-
Si(CH3), where X is either the oxygen, nitrogen, or sulfur atom. The second sample preparation,
dilute biocrude in decane, was used to determine if any compounds were being lost during

54
drying/concentration; Figure 4-2b. Certain molecules were identified in the derivatized sample
including hydrogen sulfide, methyl amine, phenols, and free fatty acids; overall the biocrude
consisted of aliphatics, phenols, fatty acids, ketones, and indoles, including the presence of
pyrrole, pyridine and phthalate. Both sample preparations indicate the presence of a phthalate,
which is a common plasticizer, and was suspected to have been contamination from various
centrifuge tubes and/or pipette tips. However, GC-MS analysis of the solvent, in this case
decane, exposed to all types of lab ware used indicated there was no phthalate stripped from the
plastics involved.

55
(a)
(b)
Figure 4-2. GC-MS chromatograms for biocrude produced from microalgae from samples (a)
concentrated and derizatized with MSTFA and (b) dilute biocrude in decane obtained as is from
extraction procedure.
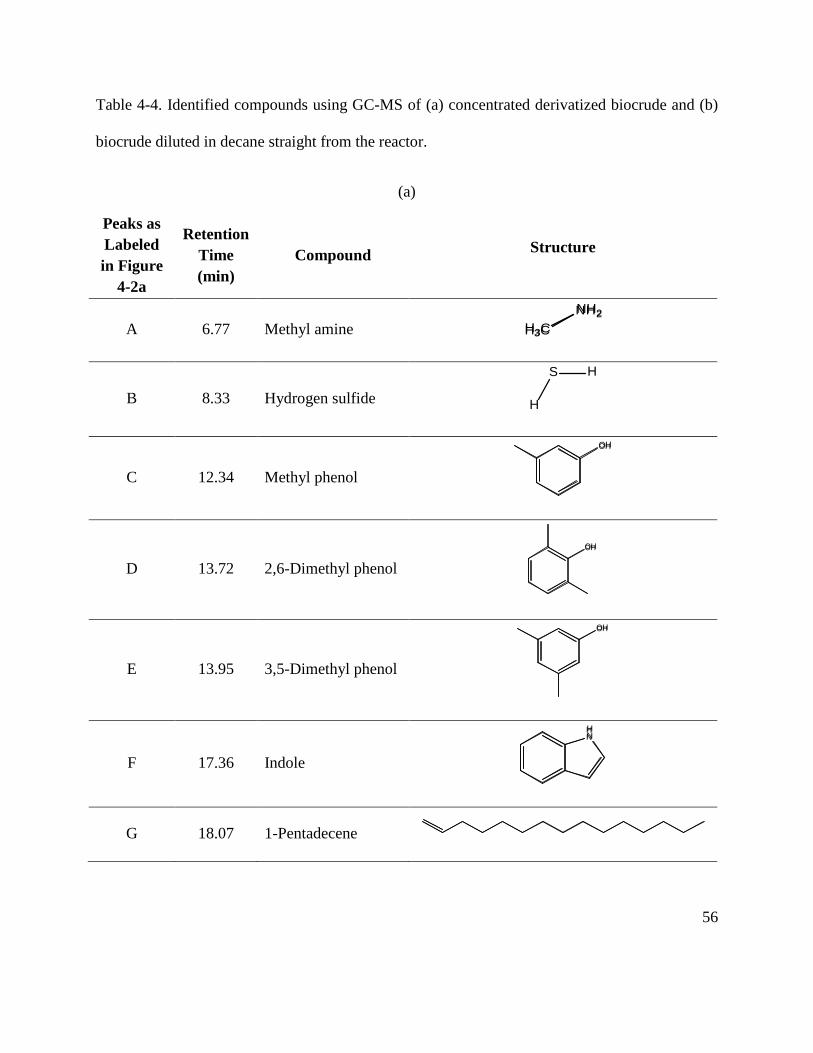
56
Table 4-4. Identified compounds using GC-MS of (a) concentrated derivatized biocrude and (b)
biocrude diluted in decane straight from the reactor.
(a)
Peaks as Labeled in Figure
4-2a
Retention Time (min)
Compound Structure
A 6.77 Methyl amine HH33CC
NNHH22
B 8.33 Hydrogen sulfide
S
H
H
C 12.34 Methyl phenol
OOHH
D 13.72 2,6-Dimethyl phenol OOHH
E 13.95 3,5-Dimethyl phenol
OOHH
F 17.36 Indole
HHNN
G 18.07 1-Pentadecene

57
H 18.17 1H-Indole, 2,5-dimethyl- NNHH
I 18.72 1H-Indole, 3-methyl- NNHH
J 19.66 Hexadecane
K 20.45 Dodecanoic acid OOHH
OO
L 20.66 1,7-Trimethylene-2,3-dimethylindole
NN
M 20.97 1-Heptadecene
N 21.07 Heptadecane
O1 22.26
2-Phytene Isomer O2 22.85
O3 23.01
P 24.44 Hexadecanol OOHH
Q 24.87 Eicosane
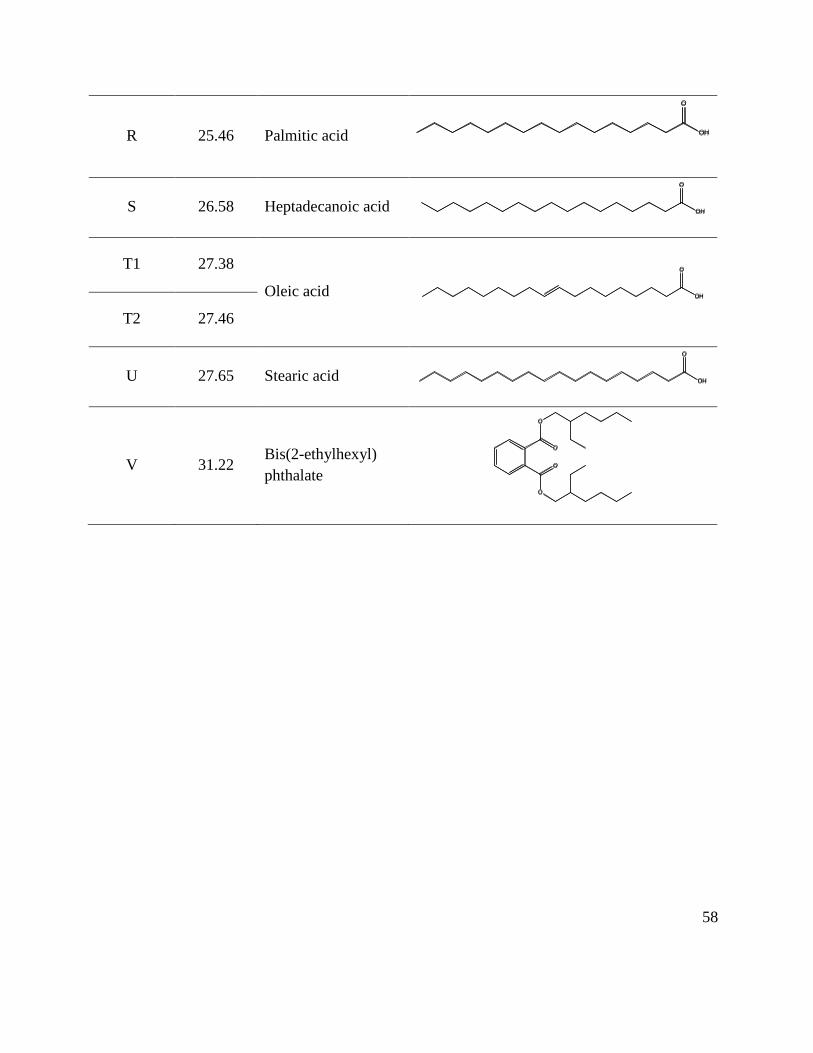
58
R 25.46 Palmitic acid OOHH
OO
S 26.58 Heptadecanoic acid OOHH
OO
T1 27.38
Oleic acid OOHH
OO
T2 27.46
U 27.65 Stearic acid OOHH
OO
V 31.22 Bis(2-ethylhexyl) phthalate
OO
OO
OO
OO

59
(b)
Peaks as Labeled in Figure
4-2b
Retention Time (min)
Compound Structure
1 4.32 Toluene
2 5.28 1-Ethyl-1H-Pyrrole NN
3 5.41 2-Methyl pyridine NN
4 5.83 2-Methyl cyclopentanone
OO
5 7.29 2-Methyl-2-cyclopenten-1-one
OO
6 13.13 2-Decanone OO
7 14.84 1-Tridecene
8 14.96 5H-1-pyridine N

60
9 16.50 5-Methyl-1H-Indole NN
10 18.07 1-Pentadecene
11 18.18 Pentadecane
12 19.02 Cyclododecane
13 19.66 Hexadecane
14 20.97 1-Heptadecene
15 21.07 Heptadecane
16 21.49 1-Nonadecene
17 22.46 4-Methyl-dodec-3-en-1-ol
OOHH
18 23.00 2-Phytene Isomer
19 24.88 Eicosane
20 31.22 Bis(2-ethylhexyl) phthalate
OO
OO
OO
OO
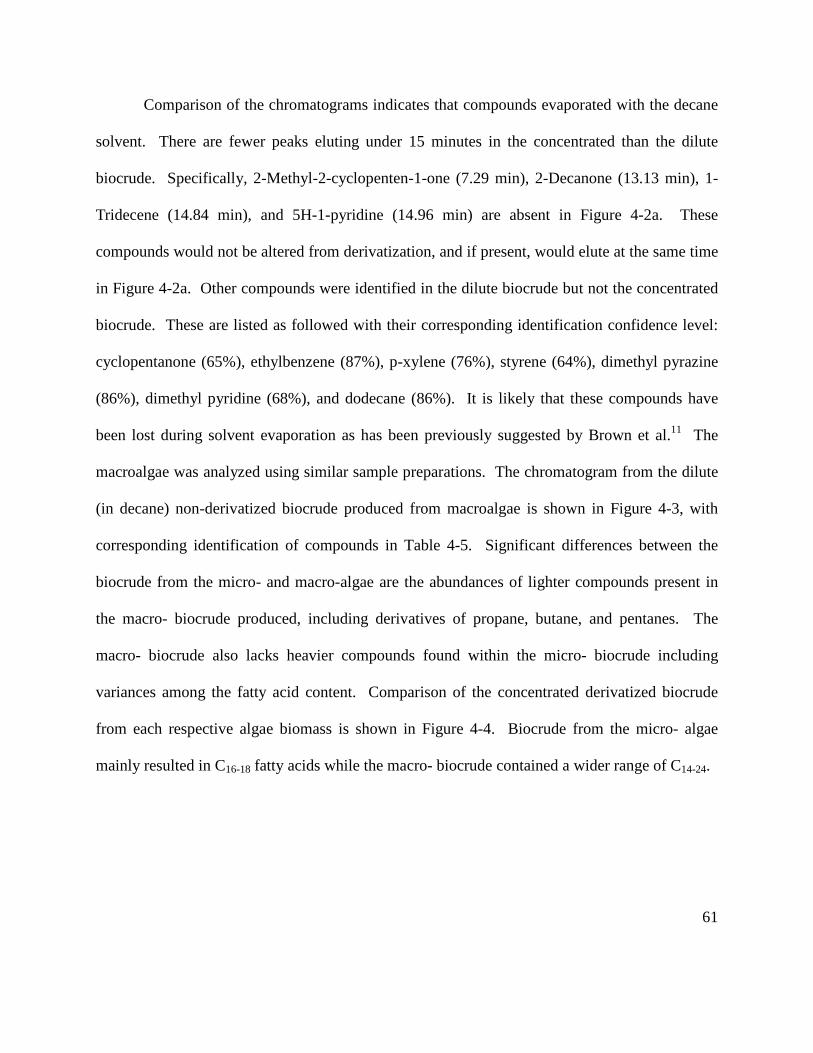
61
Comparison of the chromatograms indicates that compounds evaporated with the decane
solvent. There are fewer peaks eluting under 15 minutes in the concentrated than the dilute
biocrude. Specifically, 2-Methyl-2-cyclopenten-1-one (7.29 min), 2-Decanone (13.13 min), 1-
Tridecene (14.84 min), and 5H-1-pyridine (14.96 min) are absent in Figure 4-2a. These
compounds would not be altered from derivatization, and if present, would elute at the same time
in Figure 4-2a. Other compounds were identified in the dilute biocrude but not the concentrated
biocrude. These are listed as followed with their corresponding identification confidence level:
cyclopentanone (65%), ethylbenzene (87%), p-xylene (76%), styrene (64%), dimethyl pyrazine
(86%), dimethyl pyridine (68%), and dodecane (86%). It is likely that these compounds have
been lost during solvent evaporation as has been previously suggested by Brown et al.11 The
macroalgae was analyzed using similar sample preparations. The chromatogram from the dilute
(in decane) non-derivatized biocrude produced from macroalgae is shown in Figure 4-3, with
corresponding identification of compounds in Table 4-5. Significant differences between the
biocrude from the micro- and macro-algae are the abundances of lighter compounds present in
the macro- biocrude produced, including derivatives of propane, butane, and pentanes. The
macro- biocrude also lacks heavier compounds found within the micro- biocrude including
variances among the fatty acid content. Comparison of the concentrated derivatized biocrude
from each respective algae biomass is shown in Figure 4-4. Biocrude from the micro- algae
mainly resulted in C16-18 fatty acids while the macro- biocrude contained a wider range of C14-24.
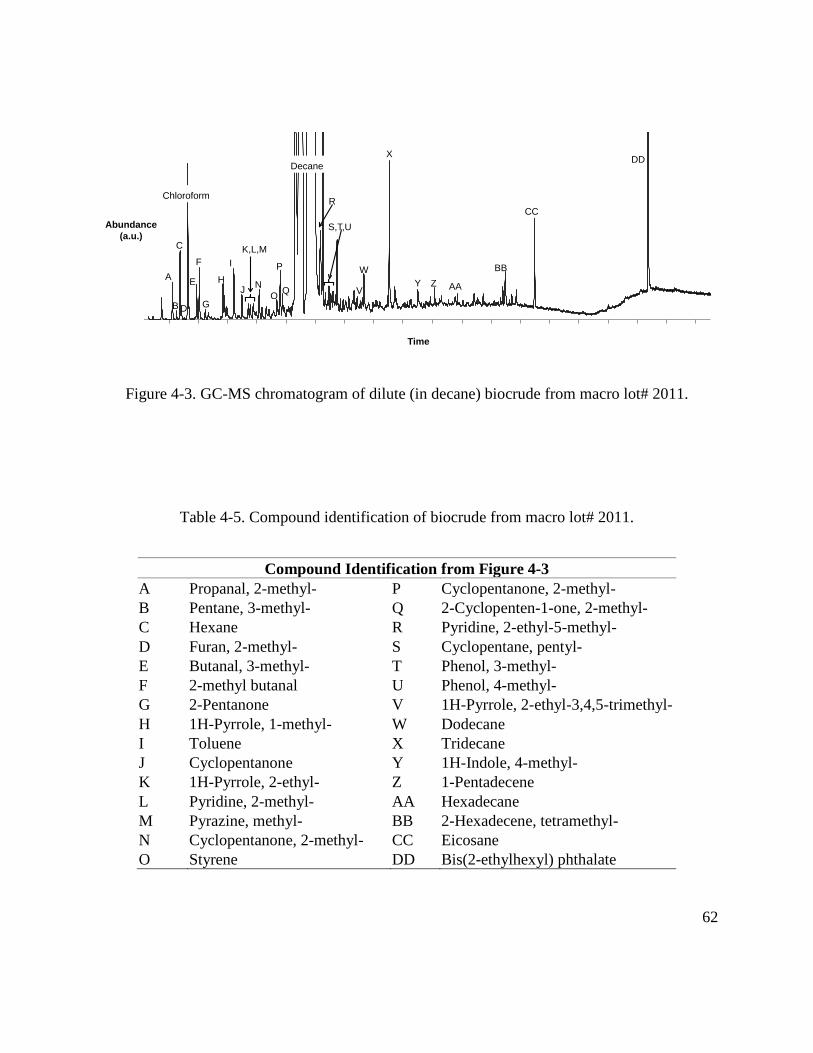
62
Figure 4-3. GC-MS chromatogram of dilute (in decane) biocrude from macro lot# 2011.
Table 4-5. Compound identification of biocrude from macro lot# 2011.
Compound Identification from Figure 4-3 A Propanal, 2-methyl- P Cyclopentanone, 2-methyl- B Pentane, 3-methyl- Q 2-Cyclopenten-1-one, 2-methyl- C Hexane R Pyridine, 2-ethyl-5-methyl- D Furan, 2-methyl- S Cyclopentane, pentyl- E Butanal, 3-methyl- T Phenol, 3-methyl- F 2-methyl butanal U Phenol, 4-methyl- G 2-Pentanone V 1H-Pyrrole, 2-ethyl-3,4,5-trimethyl- H 1H-Pyrrole, 1-methyl- W Dodecane I Toluene X Tridecane J Cyclopentanone Y 1H-Indole, 4-methyl- K 1H-Pyrrole, 2-ethyl- Z 1-Pentadecene L Pyridine, 2-methyl- AA Hexadecane M Pyrazine, methyl- BB 2-Hexadecene, tetramethyl- N Cyclopentanone, 2-methyl- CC Eicosane O Styrene DD Bis(2-ethylhexyl) phthalate
A
B
C
Chloroform
D
E
F
G
HJ
K,L,M
NO
P
Q
R
S,T,U
V
W
X
Y Z AA
BB
CC
DecaneDD
I
Abundance(a.u.)
Time
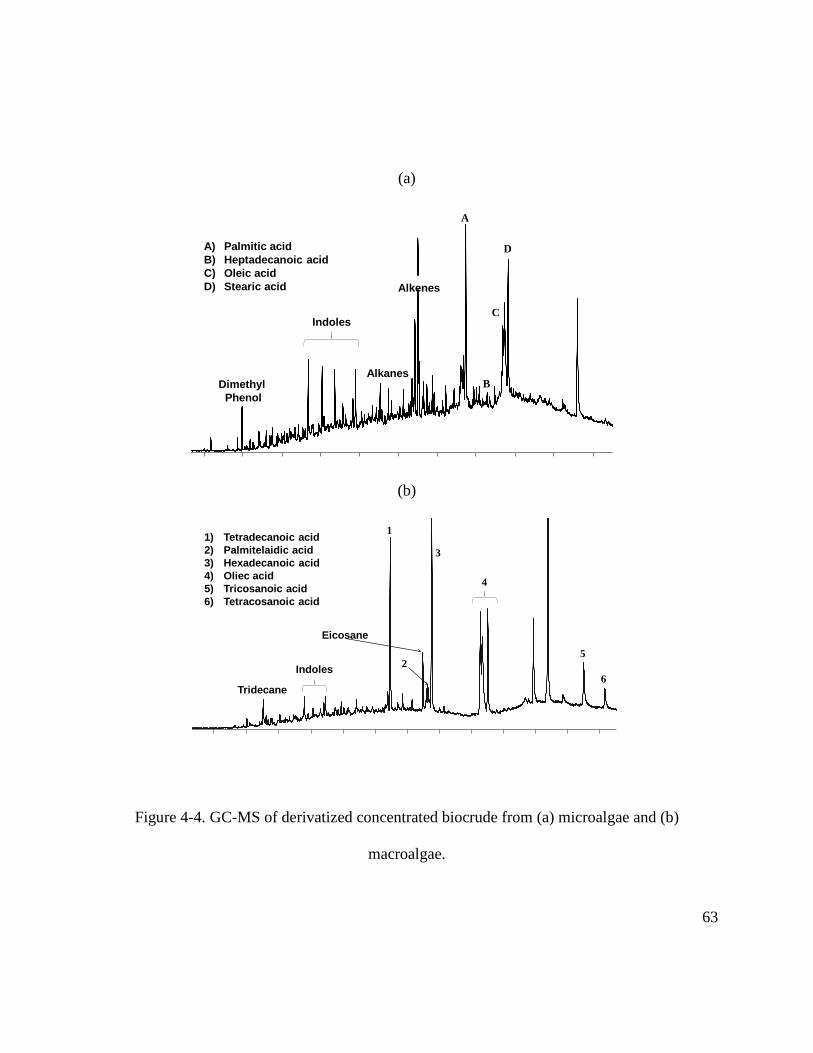
63
(a)
(b)
Figure 4-4. GC-MS of derivatized concentrated biocrude from (a) microalgae and (b)
macroalgae.
A
B
C
DA) Palmitic acidB) Heptadecanoic acidC) Oleic acidD) Stearic acid
Indoles
Alkenes
AlkanesDimethyl
Phenol
1) Tetradecanoic acid2) Palmitelaidic acid3) Hexadecanoic acid4) Oliec acid5) Tricosanoic acid6) Tetracosanoic acid
1
2
3
4
5
6Indoles
Tridecane
Eicosane

64
These combined differences of molecular profiles provided varying viscosities, which were not
directly measured, but are demonstrated in a simple pictograph of droplets of each biocrude
placed on an elevated weigh tray, shown in Figure 4-5.
Figure 4-5. Effect of gravity and surface tension, demonstrating relative viscosity, on droplets of
each biocrude produced.
4.4 Biocrude Energy and Heteroatom Content
Using the wastewater cultivation strategy and HTL conversion, a biocrude was obtained
with similar properties to petroleum crude and significant benefits over biocrude produced from
fertilized, monoculture microalgae. The elemental analysis of the biocrude is shown in Table
4-6. The carbon content of the micro- biocrude was 78.7 wt% compared to others reported in the
literature ranging from 68-76 wt% carbon.5, 6, 11, 12, 17, 18 The high carbon content is especially
significant given the relatively low carbon content of the feedstock algae. The hydrogen content
of biocrude was measured at 10.1 wt%, which is comparable to previous studies.17 The
heteroatom (N & O) content of biocrude is the major difference compared to petroleum crude
(typically 0.1-2.0 wt% N and 0.1-1.5 wt% O)10, 11, 20, and is important to analyze for upgrading

65
purposes. The micro- biocrude produced had a nitrogen content of 4.4 wt% and an oxygen
content of 5.5 wt%. In contrast, the oxygen content is typically 10-30 wt%21, 22 and 10-20
wt%10,6 for pyrolysis-produced algal oils and HTL biocrude from fertilized-monoculture
microalgae, respectively.
Table 4-6. Ultimate analysis and HHV of micro- and macro- biocrude and micro- solid product.
Elemental Composition
C H N O HHV (MJ kg-1)
Micro-Biocrude
(wt%)
78.7 10.1 4.4 5.5 39
Micro- Solids (dw%)
20.4 2.0 1.8 10.8 8-10
Macro-
Biocrude
(wt%)
76.9 9.6 4.8 7.4 42
When comparing the heteroatom content of biocrude produced in this study to most HTL
studies (see Table 2-3), nitrogen is comparable while oxygen is lower, better resembling heavy
petroleum crude.17 One study has reported an oxygen content of HTL-produced biocrude near 5
wt%17 for Nannochloropsis sp., but a reaction temperature of 500 °C was used. This increase in
temperature decreased oxygen but sacrificed hydrogen (7.1 wt%) and the overall biocrude yield
(16 wt%). The micro- biocrude produced here had low oxygen content, did not sacrifice
hydrogen, and maintained high organic conversion to biocrude. One other study which showed a

66
high carbon, low oxygen, and high hydrogen biocrude; Sapphire Energy reported HTL-produced
biocrude (reaction temperature of 260 °C) from Nannochloropsis sp. with 77.7 wt%, 11.7 wt%,
and 5.7 wt% for carbon, hydrogen, and oxygen, respectively.23 However, a very different
procedure was used for oil recovery (variable heating after reducing pH with H3PO4), and no
information was provided on algal growth conditions or the elemental analysis of the feedstock
algae, so a direct comparison is not possible. The macro- biocrude had slightly different
heteroatom content compared to the micro- biocrude, even though they had been harvested from
the same growth ponds. The macro- biocrude had slightly lower carbon and hydrogen, 76.9%
and 9.6%, respectively, with higher nitrogen and oxygen, 4.8% and 7.4%, respectively.
As discussed in Chapter 2, the relationship between the H/C ratio and the O/C ratio, and
the trade-off between maximizing H/C while minimizing O/C, can be seen in a van Krevelen
diagram. Higher H/C atomic ratios and lower O/C atomic ratios indicate that the energy content
of the substance (feedstock, crude, or fuel) is high with less need for extensive upgrading. The
data collected with algae lot# 2011 has been applied to the van Krevelen diagram in Chapter 2
(Figure 2-2) and is shown in Figure 4-6. Both the micro- and macro- biocrude produced are both
favorable (closest to petroleum crude) compared the majority of the literature values, and the
O/C ratio for the micro- biocrude is the lowest (farthest left on the x-axis) while still maintaining
a high H/C ratio, which suggests that the least amount of heteroatom upgrading would be needed
for biocrude produced under comparable HTL conditions.

67
Figure 4-6. Van Krevelen diagram from Figure 2-2 including data from algae lot# 2011.
The measured HHV of the micro- and macro- biocrude was 39 and 42 MJ kg-1, respectively,
compared to the petroleum crude HHV of 41-43 MJ kg-1. The large HHV of the micro- biocrude
is attributed to the high C and H and low O contents of the biocrude. Interestingly, the even
higher measured HHV of the macro- biocrude, with lower C & H and higher N & O content
compared to the micro-, can be explained when re-evaluating the molecular profile described in
the previous section. It could be expect that the macro- biocrude would have a higher octane
1.2
1.3
1.4
1.5
1.6
1.7
1.8
1.9
2
0 0.05 0.1 0.15 0.2 0.25 0.3
H/C
Atom
ic R
atio
O/C Atomic Ratio Micro Macro Light PetroleumHeavy Petroleum 1 Spirulina platensis 2 Nannochloropsis Occulata3 Porphyridium cruentum 4 Scenedesmus sp. 5 Spirulina sp6 Nannochloropsis sp. 7 Chlorella sp. 8 Nannochloropsis sp.9 Porphyridium sp. 10 Spirulina sp. 11 Tetraselmis sp.12 Phaeodactylum tricornutum 13 Scenedesmus obliquus 14 Phaeodactylum tricornutum15 Nannocholoropsis gaditana 16 Scenedesmus almeriensis 17 Tetraselmis suecica18 Chlorella vulgaris 19 Porphyridium purpureum 20 Dunaliella tertiolecta21 Sargassum patens 22 Laminaria saccharina 23 Enteromorpha prolifera
Micro Macro

68
number based off the degree of branching associated with identified compounds within the as
well as the increased number of lower boiling point molecules. This concludes that the macro-
algae produced a biocrude containing a higher fraction of direct fuels but with higher heteroatom
content, which would need to be removed, compared to biocrude produced from the micro-algae.
Both the micro- and macro- algae have favorable energy densities and heteroatom
content, clearly depicted by the van Krevelen diagram in Figure 4-6. Previous studies on
Spirulina sp. and Chorella vulgaris have shown that adding alkali catalysts to HTL reactors
results in lower oxygen and larger HHV when compared to adding organic acids.5 Furthermore,
studies have shown that alkali catalysts are detrimental to oil formation when algae has a high
starting initial lipid content, but are advantageous when algae is high in carbohydrates.6 Based
on the elemental distribution of the inorganic composition of the cultivated algae, alkali species
are present during the HTL reaction. At the time of data collection for this demonstration study,
it was unclear of the exact role of these alkali species; however the hypothesis was that catalyzed
reactions were proceeding to reduce the overall oxygen content of the biocrude within the HTL
reactor. Further findings (see Chapter 5 & 6) will indicate this hypothesis to be true and is
discussed in detail within subsequent chapters. Thus, the higher inorganic fraction of
wastewater-fed algae has found to be advantageous for producing a biocrude with lower oxygen
and larger HHV.
4.5 HTL Co-Products
The HTL conversion of the cultivated microalgae resulted in an aqueous co-product
(ACP) containing ~50% of the algae’s cellular nitrogen with a fraction of the cellular
69
phosphorus. The concentrations of carbon (TOC), nitrogen (TN), and phosphorus (TP) in the
ACP derived from the microalgae were measured at 4550 ± 460 mg L-1, 1640 ± 250 mg L-1, and
3.5 mg L-1, respectively; the macroalgae derived ACP resulted in slightly lower compared to the
micro- derived ACP with TOC and TN at 3130 and 1250 mg L-1, respectively. It is speculated
that the bulk of the algal phosphorus resides in the solid product. The macronutrient
concentrations in the ACP compared to the wastewater effluent feed was 56:1 for TN and 1:1 for
TP. The NRC report24 has specifically listed the availability of N & P as a “high importance”
concern for algal biofuel sustainability. Fortier and Sturm25 have shown that wastewater
treatment facilities alone would not supply adequate levels of nutrients to meet high demands of
fuel consumption. The ability to capture N and P from HTL co-products and recycle them for
algal cultivation would increase the potential of algal fuel production. Few studies to date have
supplemented algal culture media with ACP from HTL processing. Jena et al.26 reported an
optimal recycle fraction of 0.2 vol% ACP diluted with deionized water achieving an algal growth
rate of 0.035 g L-1 day-1 compared to a rate of 0.07 g L-1 day-1 for algae cultivated in BG 11
growth media. Zhou et al.27 showed that recycling higher amounts of ACP from two HTL
feedstocks (swine manure and Spirulina sp.) had inhibitory effects on algal growth. When
diluting the ACP with F/2 medium, they determined that algal growth was inhibited when
supplemented with greater than 5 vol% swine manure ACP and 1 vol% Spirulina sp. ACP.
Previous studies on Spirulina sp. and Chorella vulgaris used TOC analysis to show that a
significant amount of the organic products are water soluble.5 Acetic acid, glycerol, and 3-
pyridinol have been identified as the primary water soluble organics in the ACP produced during
HTL of Enteromorpha prolifera macroalgae.8 Depending on the organics identified, it may be
70
possible through separation to produce value-added organics and allow higher levels of the ACP
to be recycled for algae growth. Overall, further research is necessary to determine the recycle
potential and value of the ACP produced from HTL.
Another major co-product of HTL conversion is solid product. On a dry weight basis,
45.0 ± 5.9 dw% of biomass is retained in the form of solid product (from microalgae) due to high
amounts of non-combustible intercellular material. Most of the solid product is comprised of the
inorganic content of the algae shown in Table 4-2. The solid product was found to contain 35
wt% organic material, containing 20.4 dw% carbon. This is reported as a weighted average of
the two fractions of solid product produced, shown in Figure 3-2, where the ultimate analysis
differed by <2 wt% between fractions. The measured HHV of the solid product was 8-10 MJ kg-
1, depending on which fraction of solids were evaluated. Beyond burning the solid product for
energy recovery, it could be used for soil amendments28, absorbents29, and catalysts.30 Further
research into the solid product produced from wastewater-cultivated algae has revealed exciting
and encouraging results for applications into value-added products and is the main area of
discussion of Chapter 5: Increasing Value-Added Product Streams and Chapter 6:
Hydroxyapatite Synergies and its Potential Applications.
4.6 Conclusions
The described algal cultivation strategy (open pond, wastewater-fed, naturally inoculated
mixed culture) and hydrothermal liquefaction conversion (whole, wet biomass to produce a drop-
in crude replacement and co-products) were successfully demonstrated. Micro- and macro-
algae cultivated in same growth ponds yields comparable results for individual product yields;

71
obtaining 45 and 43 afdw% biocrude yield for micro- and macro- algae, respectively. Significant
differences were found within the biocrude properties in terms of heteroatom content, energy
density, and molecular profile. Microalgae resulted in a biocrude with low oxygen content, 5.5
wt%, high amounts of straight chain aliphatics >C16, and an energy density of 39 MJ kg-1.
Macroalgae derived biocrude had 7.4 wt% oxygen, large number of low boiling point
compounds including branched aliphatics which resulted in a low visual viscosity and high
energy density, 42 MJ kg-1. Overall macro- derived biocrude potentially creates a higher fraction
of direct fuel distillates but may require more heteroatom removal then compared to micro-
derived biocrude.
The main hypothesis of the study was confirmed to be true; algae cultivated using treated
wastewater (prior to discharge) would yield significant biocrude yields once exposed to
subcritical water reaction media, resulting in 31% organic conversion above the solvent
extractible lipid fraction. However, unexpected results showed a superior quality biocrude was
produced with very large production of solid product compared to fertilized monoculture algae
typically studied in the literature. This developed new hypotheses which speculated the
formation of the solid product, particularly the inorganic content established from wastewater-
cultivated algae, was contributing to the desirable properties biocrude and potentially leading to
catalytic effects. These hypotheses drove further investigations into understanding both the
composition of the solid product and what role it may be playing in reducing the oxygen content
of the biocrude. The remainder of this dissertation describes the composition of the solid
product, the effects of the solid product formation on the biocrude in-situ, and its applications as
a value-added product within the scope of algal biofuels.

72
4.7 References
1. Sturm, B. S. M.; Lamer, S. L., An energy evaluation of coupling nutrient removal from wastewater with algal biomass production. Applied Energy 2011, 88, (10), 3499-3506.
2. National Research Council Committee on the Use of Treated Municipal Wastewater Effluents Sludge in the Production of Crops for Human Consumption, Use of reclaimed water and sludge in food crop production. National Academy Press: 1996.
3. United States Environmental Protection Agency (US EPA), Clean Watersheds Needs Survey 2008 Report to Congress. In US EPA, Office of Water Management: Washington, D.C., 2008.
4. Eaton, A. D.; Clesceri, L. S.; Rice, E. W.; Greenberg, A. E., Standard methods for the examination of water & wastewater. 21 ed.; American Public Health Association: 2005.
5. Ross, A. B.; Biller, P.; Kubacki, M. L.; Li, H.; Lea-Langton, A.; Jones, J. M., Hydrothermal processing of microalgae using alkali and organic acids. Fuel 2010, 89, (9), 2234-2243.
6. Biller, P.; Ross, A. B., Potential yields and properties of oil from the hydrothermal liquefaction of microalgae with different biochemical content. Bioresource Technology 2011, 102, (1), 215-225.
7. Huang, H.; Yuan, X.; Zeng, G.; Wang, J.; Li, H.; Zhou, C.; Pei, X.; You, Q.; Chen, L., Thermochemical liquefaction characteristics of microalgae in sub- and supercritical ethanol. Fuel Processing Technology 2011, 92, (1), 147-153.
8. Zhou, D.; Zhang, L.; Zhang, S.; Fu, H.; Chen, J., Hydrothermal Liquefaction of Macroalgae Enteromorpha prolifera to Bio-oil. Energy & Fuels 2010, 24, (7), 4054-4061.
9. Griffiths, E. W. Removal and Utilization of Wastewater Nutrients for Algae Biomass and Biofuels. Utah State University, 2009.
10. Jena, U.; Das, K. C.; Kastner, J. R., Effect of operating conditions of thermochemical liquefaction on biocrude production from Spirulina platensis. Bioresource Technology 2011, 102, (10), 6221-6229.
11. Brown, T. M.; Duan, P.; Savage, P. E., Hydrothermal Liquefaction and Gasification of Nannochloropsis sp. Energy & Fuels 2010, 24, (6), 3639-3646.
12. Valdez, P. J.; Dickinson, J. G.; Savage, P. E., Characterization of Product Fractions from Hydrothermal Liquefaction ofNannochloropsissp. and the Influence of Solvents. Energy & Fuels 2011, 25, (7), 3235-3243.
13. Demirbas, M. F., Biofuels from algae for sustainable development. Applied Energy 2011, 88, (10), 3473-3480.
14. Anastasakis, K.; Ross, A. B., Hydrothermal liquefaction of the brown macro-alga Laminaria Saccharina: Effect of reaction conditions on product distribution and composition. Bioresource Technology 2011, 102, (7), 4876-4883.
15. Shuping, Z.; Yulong, W.; Mingde, Y.; Kaleem, I.; Chun, L.; Tong, J., Production and characterization of bio-oil from hydrothermal liquefaction of microalgae Dunaliella tertiolecta cake. Energy 2010, 35, (12), 5406-5411.
73
16. Minowa, T.; Yokoyama, S.-y.; Kishimoto, M.; Okakura, T., Oil production from algal cells of Dunaliella tertiolecta by direct thermochemical liquefaction. Fuel 1995, 74, (12), 1735-1738.
17. Garcia Alba, L.; Torri, C.; Samorì, C.; van der Spek, J.; Fabbri, D.; Kersten, S. R. A.; Brilman, D. W. F., Hydrothermal Treatment (HTT) of Microalgae: Evaluation of the Process As Conversion Method in an Algae Biorefinery Concept. Energy & Fuels 2011, 111201165948002.
18. Vardon, D. R.; Sharma, B. K.; Scott, J.; Yu, G.; Wang, Z.; Schideman, L.; Zhang, Y.; Strathmann, T. J., Chemical properties of biocrude oil from the hydrothermal liquefaction of Spirulina algae, swine manure, and digested anaerobic sludge. Bioresource Technology 2011, 102, (17), 8295-8303.
19. Bligh, E. G.; Dyer, W. J., A rapid method of total lipid extraction and purification. Canadian Journal of Biochemistry and Physiology 1959, 37, (8), 911-917.
20. Matar, S.; Hatch, L. F., Chemistry of petrochemical processes. Gulf Professional Publishing: 2001.
21. Pan, P.; Hu, C.; Yang, W.; Li, Y.; Dong, L.; Zhu, L.; Tong, D.; Qing, R.; Fan, Y., The direct pyrolysis and catalytic pyrolysis of Nannochloropsis sp. residue for renewable bio-oils. Bioresource Technology 2010, 101, (12), 4593-4599.
22. Vardon, D. R.; Sharma, B. K.; Blazina, G. V.; Rajagopalan, K.; Strathmann, T. J., Thermochemical conversion of raw and defatted algal biomass via hydrothermal liquefaction and slow pyrolysis. Bioresource Technology 2012, 109, 178-187.
23. Roussis, S. G.; Cranford, R.; Sytkovetskiy, N., Thermal Treatment of Crude Algae Oils Prepared Under Hydrothermal Extraction Conditions. Energy & Fuels 2012, 26, (8), 5294-5299.
24. Council, N. R., Sustainable Development of Algal Biofuels in the United States. In Academies, N. R. C. o. t. N., Ed. National Academy Press: Committee on the Sustainable Development of Algal Biofuels, 2012.
25. Fortier, M.-O. P.; Sturm, B. S. M., Geographic Analysis of the Feasibility of Collocating Algal Biomass Production with Wastewater Treatment Plants. Environmental Science & Technology 2012, 46, (20), 11426-11434.
26. Jena, U.; Vaidyanathan, N.; Chinnasamy, S.; Das, K. C., Evaluation of microalgae cultivation using recovered aqueous co-product from thermochemical liquefaction of algal biomass. Bioresource Technology 2011, 102, (3), 3380-3387.
27. Zhou, Y.; Schideman, L.; Zhang, Y.; Yu, G.; Wang, Z.; Pham, M., Resolving Bottlenecks in Current Algal Wastewater Treatment Paradigms: A Synergistic combination of Low-Lipid algal Wastewater Treatment and Hydrothermal Liquefaction for Large-Scale Biofuels Production. Energy and Water 2011, 347-361.
28. Singh, B.; Singh, B. P.; Cowie, A. L., Characterisation and evaluation of biochars for their application as a soil amendment. Australian Journal of Soil Research 2010, 48, 516-525.
29. Park, J. H.; Lamb, D.; Paneerselvam, P.; Choppala, G.; Bolan, N.; Chung, J.-W., Role of organic amendments on enhanced bioremediation of heavy metal(loid) contaminated soils. Journal of Hazardous Materials 2011, 185, (2-3), 549-574.

74
30. Muradov, N.; Fidalgo, B.; Gujar, A. C.; Garceau, N.; T-Raissi, A., Production and characterization of Lemna minor bio-char and its catalytic application for biogas reforming. Biomass and Bioenergy 2012, 42, 123-131.
75
5 Increasing Value-Added Product Streams
The data presented in this chapter was obtained entirely from algae lot# 2013. The main
goals of the studies performed for algae lot# 2013 were to answer hypotheses formulated when
evaluating the results from algae lot# 2011 described in Chapter 4. The main hypotheses, post
evaluation of algae lot# 2011, was that the majority of the phosphorus resided in the solid
product and that the inorganics were paying significant (catalytic) role in producing higher
quality biocrude, particularly reducing the oxygen content. Therefore, it was imperative to
understand and determine the composition of the solid product. In order to do so, it was
hypothesized that thorough understanding of the nutrient uptake by the algal biomass from
wastewater effluent and the fate of those nutrients post liquefaction would provide the basic
fundamentals of which elements are retained in the solid product. Once the elemental
composition of the solid product was known, exploratory characterization could then be guided
to determine both the structure of the solid product and functionality within the HTL reactor.
This chapter is subcategorized into three main bodies; 1) the characterization of algae lot# 2013
and the bulk HTL yields, 2) nutrient mining effects of wastewater-cultivated algae and HTL
process, and 3) the novel discovery of higher-value products co-produced during the HTL of
wastewater-cultivated algae. The majority of the work presented in this chapter is published in
Green Chemistry (2015), 17, 2560.

76
5.1 Algae lot# 2013 Characterization and HTL Bulk Yields
The algae biomass cultivated and collected obtained similar characteristics to that of
algae lot# 2011 with slight decrease in ash, hydrogen, and oxygen content(s) and an increase in
carbon and nitrogen. The novel method developed, described in section 3.2.1, for obtaining a
full proximate analysis was used in evaluating algae lot# 2013 and its finding are shown in
Figure 5-1 alongside the ultimate analysis of the biomass. Undergoing the TGA method for
proximate analysis we clearly see three distinct temperatures for pyrolysis (Py) decomposition of
the algal biomass around 310, 375, and 450 °C, presumed to be the decomposition of
macromolecular components such as carbohydrates, proteins, and lipids.1 During the post
pyrolysis combustion (PPyC) stage the majority of the fixed carbon decomposes at 400 °C with
the remaining residual decomposing at 600 °C, representing bulk fixed carbon and coke,
respectively.

77
Proximate Analysis (wt %)
Ultimate Analysis (afdw %)
Moisture 4.4 Carbon 55.6 Volatiles 61.6 Hydrogen 6.2 Combustibles 9.9 Nitrogen 7.6 Ash 24.1 Oxygen* 30.6 *oxygen calculated by difference after normalized to the ash: O (afdw%) = C - H - N [afdw%].
Figure 5-1. Proximate (TGA) and ultimate (CHN Analyzer) analysis of algae lot# 2013. TGA
plot indicates pyrolysis weight change (blue) and post pyrolysis combustion (green) and
corresponding derivative weight change, (purple) and (red), respectively. Ultimate analysis is
provided on a ash free dry weight percent (afdw%).
Similarly to the algae lot# 2011, the main product yields from algae lot# 2013 were the
solid product and biocrude fractions. Again, the ash free dry weight yields represent a
significant difference in compared to the dry weight yields, due to the relatively high ash content
of both the starting biomass and the solid product fraction. Figure 5-2 details the bulk product
yields and organic elemental composition. The partitioning of carbon and nitrogen was
evaluated for each product; the biocrude product contained 50% and 23% of the algal carbon and
0
3.5
0
10
0 100 200 300 400 500 600 700 800
dW/d
t (%
/min
)
Wei
ght (
mg)
Temperature (°C)
Pyrolysis (wt: mg)Post Pyrolysis Combustion (wt: mg)dW/dt (Py: %/min)dW/dt (PPyC: %/min)
78
nitrogen, respectively, where the ACP contained 13% and 44% of the algal carbon and nitrogen,
respectively. Half of the carbon is recovered into the desired product fraction where 20% is lost
as gas, presumably as CO2.2 The carbon recovery is similar to another reported low-lipid algae3
and much lower compared to biocrude produced with extremely fast reaction times which result
in substantially higher heteroatom content.4 Therefore, biocrude carbon recovery has been
linked to reaction times and process temperature, typically acquiring heteroatom removal at the
expense of carbon efficiency. Close to 75% of the nitrogen is accounted for in the three main
product fractions, majorly in the aqueous phase, comparable to other reports.2 The significant
nitrogen in the aqueous product could potentially be available to future nutrient use for
continuing algal cultivation,5 specifically when added with essential micronutrients.6

79
Figure 5-2. Product Yields, and respective organic elemental content, from the HTL of algae
lot#2013. The organic recovery represents the fate of algal carbon and nitrogen toward each
perspective product fraction. *oxygen calculated by difference; O = 100- C- H- N- ash [wt%]
5.2 Wastewater Nutrient Removal
The cultivation strategy used for algae lot# 2013 provided interesting evaluation of the
effectiveness of wastewater algal polishing. Using the algal growth ponds in series (as seen in
Figure 3-1) it was possible to evaluate nutrients and minerals from the wastewater effluent (ww-
effluent), each algal cultivation pond, resultant algal biomass, and HTL solid product. This
evaluation determines which components are mined by the algae and ultimately stay within the
Biocrude (wt%)
Solids (wt%)
Yield 27.3 29.5 C 76.9 ± 1.6 24.2 ± 1.6 H 10.1 ± 0.4 2.6 ± 0.05 N 4.7 ± 0.2 1.1 ± 0.04 O* 6.7 ± 2.0 - Ash 1.6 67.6
Aqueous Co-Product (g L-1)
TOC 6.6 TN 3.1

80
solid product, post HTL. Table 5-1 shows the ICP-OES data collected from each stage
throughout the process. The production of each element represents a theoretical maximum and
was calculated using the data collected and following assumtions: all of the wastewater was
processed through algae cultivation and all the phosphorus was used to form algae. The
following formula was used;
Production day-1 = (ww-effluent flow)* (X-concentration of ww-effluent)* (measured %-
X of algae)* (% HTL solid yield)* (measured %-X solid product)
Where, X represents a specific element of interest and daily production represents total
theoretical mass incorporated into a solid product removed from the ww-effluent.
Table 5-1. Bio-mining effects from algae cultivation and hydrothermal liquefaction.
Ca P Mg S Fe K Al Na Ba Sr Mn Zn
WW-Effluent (ppm) 82.8 5.1 10.2 24.3 0.05 17.2 0.07 19.8 0.05 0.3 0.02 0.08
Pond 1 (ppm) 85.7 5.1 10.8 24.9 0.03 17.0 0.02 20.3 0.02 0.3 0.002 0.03
Pond 2 (ppm) 78.5 3.1 12.8 29.2 0.01 16.2 - 23.2 0.01 0.3 - 0.02
Algae (wt%) 5.7 2.3 0.4 0.8 0.1 0.4 0.06 0.06 0.01 0.02 0.01 0.02
Solid Product (wt%) 17.1 7.4 1.4 0.5 0.4 0.3 0.16 0.09 0.07 0.06 0.05 0.03
Recovery in Solid Product (%) 89 95 100 19 84 24 79 44 (206) 89 (147) 59
Production (kg day-1) 508 220 43 16 11 9 5 3 2 2 1.5 1

81
Most of the elements show a progressive decrease from the ww-effluent to each cultivation pond
with that element accumulating in the algae biomass, which would be expected. However, some
elements indicate increases through the progression which is not necessarily unexpected and can
be explained by one of two mechanisms. First, the extremely dynamic nature of wastewater
creates constant fluxes within a short time frame and the algal growth ponds (running at an HRT
of 10 days each) may not have responded to a particular flux within that time frame of sample
collection. Second, biomass die-off could cause a slight increase in a particular element;
continuous cultivation with dynamic inputs could cause algae to enter into various sinusoidal
stages of their growth cycle, i.e., lag phase, exponential growth phase, stationary phase, and
death phase. The elements of Ba and Mn were found to be much higher concentrations in the
solid product then were even present in the starting biomass (indicated in parenthesis).
Potentially, this could be attributed to analysis interference with some of the larger amounts of
calcium and magnesium, which have been reported.7 The main findings of the data indicate that
significant mining of minerals and phosphorus within a solid product can occur during algae
cultivation and hydrothermal liquefaction. In addition, certain elements which accumulate into
algal cells are recovered or retained with higher affinity to the solid HTL product. Element such
as Ca, P, Mg, Fe, Al, and Sr all prefer to retain within the HTL solid product where most others
such as, S, K, and Na do not.
82
5.3 In-situ Crystallization of Substituted Hydroxyapatite during HTL of Municipal
Wastewater-Cultivated Algae
Hydroxyapatite (HA) preparation typically proceeds through a well-controlled synthesis
combining reagents from individual phosphorus and calcium sources. Synthesis procedures
follow co-precipitation, hydrothermal, or various wet and dry methods resulting in a variety of
morphologies and ionic substitutions.8-11 Certain marine algae (Corallina officinalis and
Amphiroa ephedrathe) have be used as a calcium source for HA crystallization, but only after
prior removal of organics and using an external phosphorus source.12, 13 This section will detail
the crystallization of HA in-situ, using algae lot# 2013 as both the calcium and phosphorus
source without pre-treatment.
Calcium hydroxide, or lime, is added by the wastewater treatment facility in significant
quantities daily (2000 lbs day-1) as a buffering agent to raise alkalinity and pH as activated
sludge, or bacteria, performs nitrification in the water column. The effects of this addition are
shown both in Table 5-1 and the elemental characterization of algae lot# 2011 discussed in
previous chapter.
In the growth ponds, calcium, phosphorous, magnesium, sulfur, potassium, and sodium
had the highest observable concentrations; silicon, although not measured by ICP due to
analytical limitations, is expected from the presence of diatoms in the mixed algal cultures (as
seen by algae lot#2011 inorganic composition). The retention of certain elements (Ca, P, Mg,
Fe, and Al) within HTL solid product is significantly interesting since literature suggests algae
that have higher sodium and potassium and lower calcium concentrations produce less solids
during HTL and retain more inorganics in the aqueous product.14-16
83
The general HA structure, Ca10(PO4)6(OH)2, allows both cationic and anionic
substitutions, including magnesium, silicon, and carbonate substitutions, which have been shown
to improve HA performance as biomaterials.17-20 Analysis of the HTL solids from algae lot#
2013 with XRD determines the crystallographic structure is monophasic HA, according to
JCPDS# 73-0293, and is confirmed by FTIR. Additional information from the FTIR spectrum
indicates residual organics remain from HTL processing, B-type (PO4) carbonate substitutions
occur, and significant hydroxyl deficiencies and phosphorus bound hydroxyls are present. To
confirm that the HA was not formed via precipitation during the cultivation process, but rather
from the HTL reaction, comparison of the XRD and FTIR patterns from the solid product and
the combustion ash produced from algae lot# 2013 were performed. The ash was solely
tricalcium phosphate (TCP) and calcium oxide. A previous study21 demonstrated combustion of
calcium and phosphorus sources results in an amorphous material which, upon calcination at 600
°C, crystallizes to form TCP. However, the combustion process at 600 °C is not sufficient for
significant transformation of HA to TCP.22, 23 Thus, significant HA formation does not occur
during algae cultivation and is formed during the HTL of wastewater-cultivated algae. Figure
5-3 shows XRD and FTIR analysis from the HTL solid product and algae lot#2013 combustion
ash.

84
(a)
(b)
Figure 5-3. (a) Integration of powder XRD of HTL solid product and combustion-produced algal
ash at a 2θ range of 20° to 70°; peaks for HA (green square), calcium oxide (red triangle) and
TCP (blue circle), JCPDS# 70-2005, are identified. (b) FTIR spectrum of HTL solid product and
algae ash; all peaks present in the range from 500-3700 cm-1 are shown.

85
Peak identification for the FTIR spectrums present in Figure 5-3b are as followed:
The solid HTL product exhibit distinct absorption bands for HA; including PO43- vibrations, v1
(964 cm-1), v3 (1087 and 1017 cm-1), v4 (603 and 561 cm-1), hydroxide stretching (3564 cm-1 and
3677 cm-1; lattice -OH and P-OH, respectively), CO32- (1417 and 1452 cm-1; carbonate B-Type
substitution), and either HPO42- or CO3
2- (871 cm-1). Residual organics from HTL processing
show bands for C-O (1563 cm-1) and C-H (2852 and 2922 cm-1) groups. Algae lot# 2013 ash
exhibit FTIR vibration bands for PO43- (947 and 983 cm-1; as TCP), P2O7
4- (1218 cm-1) and
surface hydroxyl (3639 cm-1; from calcium oxide).
Commercial production of HA gives significant effort to generating calcium
orthophosphates with both controlled nanoparticle rod and hierarchical morphologies.11
Previous studies have demonstrated that HA nanorods can aggregate into bundles and, through
Oswald ripening, form sheets and hierarchical flower structures.24, 25 To facilitate nanoparticle
rod and hierarchical morphologies, surfactants have been incorporated during commercial HA
crystallization, including an array of molecules such as fatty acids26, amino acids27, 28, and a
variety of organic polymers.11, 25 The hydrothermal synthesis of HA has also been demonstrated
utilizing a biogenic phosphate source (adenosine 5’-triphosphate or ATP) as both morphological
control and a phosphorus source using an external calcium source.29 Algae contain phosphorus
in many biomolecules within the cell, including DNA, RNA, ATP, and phospholipids. Since the
wastewater-cultivated algae also contains significant calcium (Table 5-1), there are biomolecules
present that can contribute to hierarchical structures without the addition of an external calcium
sources.
86
Morphology and hierarchical structures are shown through transmission electron (TEM)
and scanning electron micrographs (SEM) of the HA product directly after HTL formation
presented in Figure 5-4. Hexagonal nanocrystals (Figure 5-4a,b) are present up to 1 micron in
length along the c-axis and 15 nm about the a and b-axis; these crystals then form into bundles
along the c-axis, Figure 5-4b. Each bundle can then form hierarchical sheets and flower-like
structures, Figure 5-4c. Unlike literature studies, which have suggested homogenous formation
of the nanoparticles and hierarchical morphologies in the presence of a single surfactant, the in-
situ crystallization of HA during HTL of algae lot# 2013 results in heterogeneous morphologies.
The heterogeneity of the material could be due to the short reaction times compared to
conventional HA synthesis techniques, or the presence of variable growth mechanisms due to
localized biomolecules (i.e., fatty acids, amino acids, phospholipids) being present at different
concentrations during the HTL processing.
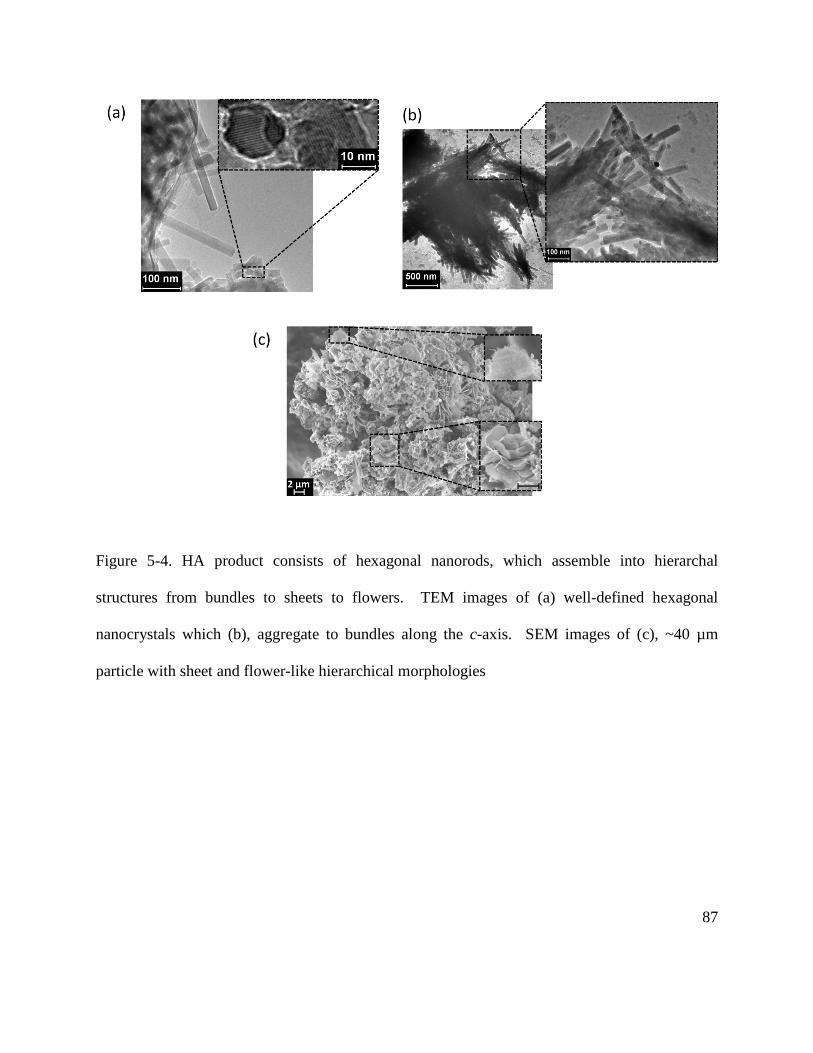
87
Figure 5-4. HA product consists of hexagonal nanorods, which assemble into hierarchal
structures from bundles to sheets to flowers. TEM images of (a) well-defined hexagonal
nanocrystals which (b), aggregate to bundles along the c-axis. SEM images of (c), ~40 µm
particle with sheet and flower-like hierarchical morphologies
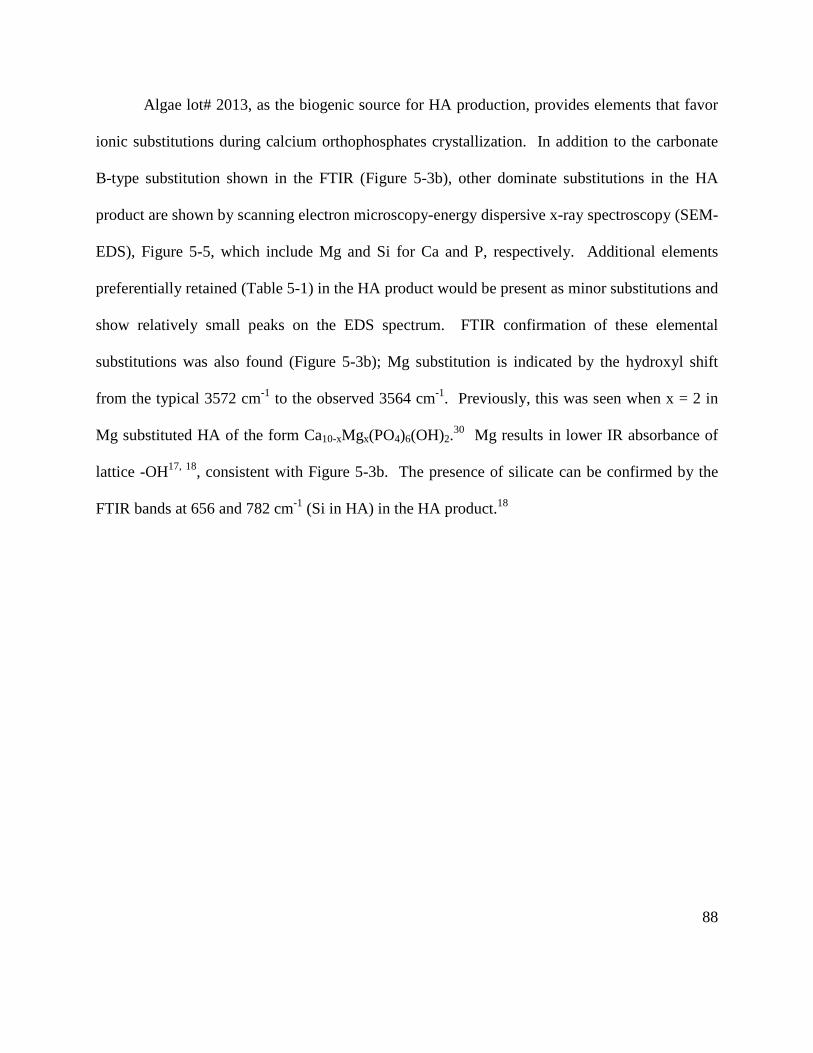
88
Algae lot# 2013, as the biogenic source for HA production, provides elements that favor
ionic substitutions during calcium orthophosphates crystallization. In addition to the carbonate
B-type substitution shown in the FTIR (Figure 5-3b), other dominate substitutions in the HA
product are shown by scanning electron microscopy-energy dispersive x-ray spectroscopy (SEM-
EDS), Figure 5-5, which include Mg and Si for Ca and P, respectively. Additional elements
preferentially retained (Table 5-1) in the HA product would be present as minor substitutions and
show relatively small peaks on the EDS spectrum. FTIR confirmation of these elemental
substitutions was also found (Figure 5-3b); Mg substitution is indicated by the hydroxyl shift
from the typical 3572 cm-1 to the observed 3564 cm-1. Previously, this was seen when x = 2 in
Mg substituted HA of the form Ca10-xMgx(PO4)6(OH)2.30 Mg results in lower IR absorbance of
lattice -OH17, 18, consistent with Figure 5-3b. The presence of silicate can be confirmed by the
FTIR bands at 656 and 782 cm-1 (Si in HA) in the HA product.18

89
Figure 5-5. SEM-EDS imaging and spectrum of a single particle of solid HTL product, scale bar
equals 10 µm, with elemental mapping of calcium, phosphorus, oxygen, magnesium, and silicon.
5.4 Conclusions
The fundamental scientific method employed within this chapter, step-wise determination
of elemental content and fundamental solid characterizations, led to the novel discovery that the
hydrothermal liquefaction of wastewater-cultivated algae can result in not only significant
organic conversion to biocrude oil but also large quantities of highly substituted (carbonate,
magnesium, and silicon) pure phase hydroxyapatite. This novel process is the first
hydroxyapatite synthesis procedure to use both calcium and phosphorus from the same biogenic

90
source, which also provided biological crystallization directing agents (resulting in hierarchical
micro structures produced from hexagonal nano-rods), and the source for the significant
elemental substitutions present.
In conclusion, it is possible to mine municipal wastewater, through algae cultivation and
hydrothermal processing, into value-added products, including a low oxygen content biocrude
and significant amounts of highly substituted hydroxyapatite. Hydroxyapatite has applications in
use of fertilizers, heterogeneous catalysts, and tissue engineering scaffold materials; each with an
increased value proportional to the quality control of a commercial scale production. The next
chapter of this dissertation will evaluate further in-situ synergies between the biocrude and
hydroxyapatite as well as describe the potential tuning of the hydroxyapatite product by creating
a secondary tricalcium phosphate phase.
5.5 References
1. Marcilla, A.; Gómez-Siurana, A.; Gomis, C.; Chápuli, E.; Catalá, M. C.; Valdés, F. J., Characterization of microalgal species through TGA/FTIR analysis: Application to nannochloropsis sp. Thermochimica Acta 2009, 484, (1-2), 41-47.
2. Elliott, D. C.; Hart, T. R.; Schmidt, A. J.; Neuenschwander, G. G.; Rotness, L. J.; Olarte, M. V.; Zacher, A. H.; Albrecht, K. O.; Hallen, R. T.; Holladay, J. E., Process development for hydrothermal liquefaction of algae feedstocks in a continuous-flow reactor. Algal Research 2013, 2, (4), 445-454.
3. Yu, G.; Zhang, Y.; Schideman, L.; Funk, T.; Wang, Z., Distributions of carbon and nitrogen in the products from hydrothermal liquefaction of low-lipid microalgae. Energy & Environmental Science 2011, 4, (11), 4587.
4. Faeth, J. L.; Valdez, P. J.; Savage, P. E., Fast Hydrothermal Liquefaction of Nannochloropsis sp. To Produce Biocrude. Energy & Fuels 2013, 27, (3), 1391-1398.
5. Biller, P.; Ross, A. B.; Skill, S. C.; Lea-Langton, A.; Balasundaram, B.; Hall, C.; Riley, R.; Llewellyn, C. A., Nutrient recycling of aqueous phase for microalgae cultivation from the hydrothermal liquefaction process. Algal Research 2012, 1, (1), 70-76.
6. Garcia Alba, L.; Torri, C.; Fabbri, D.; Kersten, S. R. A.; Brilman, D. W. F., Microalgae growth on the aqueous phase from Hydrothermal Liquefaction of the same microalgae. Chemical Engineering Journal 2013, 228, 214-223.
91
7. Boevski, I.; Daskalova, N.; Havezov, I., Determination of barium, chromium, cadmium, manganese, lead and zinc in atmospheric particulate matter by inductively coupled plasma atomic emission spectrometry (ICP-AES). Spectrochimica Acta Part B: Atomic Spectroscopy 2000, 55, (11), 1643-1657.
8. Silvester, L.; Lamonier, J.-F.; Vannier, R.-N.; Lamonier, C.; Capron, M.; Mamede, A.-S.; Pourpoint, F.; Gervasini, A.; Dumeignil, F. Y., Structural, textural and acid-base properties of carbonates-containing hydroxyapatites. Journal of Materials Chemistry A 2014.
9. Tsuchida, T.; Kubo, J.; Yoshioka, T.; Sakuma, S.; Takeguchi, T.; Ueda, W., Reaction of ethanol over hydroxyapatite affected by Ca/P ratio of catalyst. Journal of Catalysis 2008, 259, (2), 183-189.
10. Matsuura, Y.; Onda, A.; Yanagisawa, K., Selective conversion of lactic acid into acrylic acid over hydroxyapatite catalysts. Catalysis Communications 2014, 48, 5-10.
11. Sadat-Shojai, M.; Khorasani, M. T.; Dinpanah-Khoshdargi, E.; Jamshidi, A., Synthesis methods for nanosized hydroxyapatite with diverse structures. Acta biomaterialia 2013, 9, (8), 7591-621.
12. Walsh, P. J.; Walker, G. M.; Maggs, C. A.; Buchanan, F. J., Thermal preparation of highly porous calcium phosphate bone filler derived from marine algae. Journal of materials science. Materials in medicine 2010, 21, (8), 2281-6.
13. Spassova, E.; Gintenreiter, S.; Halwax, E.; Moser, D.; Schopper, C.; Ewers, R., Chemistry, ultrastructure and porosity of monophasic and biphasic bone forming materials derived from marine algae. Materialwissenschaft und Werkstofftechnik 2007, 38, (12), 1027-1034.
14. Elliott, D. C.; Hart, T. R.; Schmidt, A. J.; Neuenschwander, G. G.; Rotness, L. J.; Olarte, M. V.; Zacher, A. H.; Albrecht, K. O.; Hallen, R. T.; Holladay, J. E., Process development for hydrothermal liquefaction of algae feedstocks in a continuous-flow reactor. Algal Research 2013.
15. Valdez, P. J.; Dickinson, J. G.; Savage, P. E., Characterization of Product Fractions from Hydrothermal Liquefaction ofNannochloropsissp. and the Influence of Solvents. Energy & Fuels 2011, 25, (7), 3235-3243.
16. Valdez, P. J.; Nelson, M. C.; Wang, H. Y.; Lin, X. N.; Savage, P. E., Hydrothermal liquefaction of Nannochloropsis sp.: Systematic study of process variables and analysis of the product fractions. Biomass and Bioenergy 2012, 46, 317-331.
17. Huang, T.; Xiao, Y.; Wang, S.; Huang, Y.; Liu, X.; Wu, F.; Gu, Z., Nanostructured Si, Mg, CO3 2− Substituted Hydroxyapatite Coatings Deposited by Liquid Precursor Plasma Spraying: Synthesis and Characterization. Journal of Thermal Spray Technology 2011, 20, (4), 829-836.
18. Marchat, D.; Zymelka, M.; Coelho, C.; Gremillard, L.; Joly-Pottuz, L.; Babonneau, F.; Esnouf, C.; Chevalier, J.; Bernache-Assollant, D., Accurate characterization of pure silicon-substituted hydroxyapatite powders synthesized by a new precipitation route. Acta biomaterialia 2013, 9, (6), 6992-7004.
19. Mostafa, N. Y.; Hassan, H. M.; Abd Elkader, O. H., Preparation and Characterization of Na+, SiO44−, and CO32−Co-Substituted Hydroxyapatite. Journal of the American Ceramic Society 2011, 94, (5), 1584-1590.

92
20. Pietak, A. M.; Reid, J. W.; Stott, M. J.; Sayer, M., Silicon substitution in the calcium phosphate bioceramics. Biomaterials 2007, 28, (28), 4023-32.
21. Loher, S.; Stark, W. J.; Maciejewski, M.; Baiker, A.; Pratsinis, S. E.; Reichardt, D.; Maspero, F.; Krumeich, F.; Günther, D., Fluoro-apatite and Calcium Phosphate Nanoparticles by Flame Synthesis. Chemistry of Materials 2004, 17, (1), 36-42.
22. Zorn, K.; Gbureck, U.; Mitró, D.; Müller, F. A.; Vorndran, E., Hydrothermal synthesis of calcium-deficient hydroxyapatite whiskers and their thermal transformation to polycrystalline β-tricalcium phosphate short fibers. Bioinspired, Biomimetic and Nanobiomaterials 2013, 2, (1), 11-19.
23. Fathi, M. H.; Hanifi, A.; Mortazavi, V., Preparation and bioactivity evaluation of bone-like hydroxyapatite nanopowder. Journal of Materials Processing Technology 2008, 202, (1-3), 536-542.
24. Ma, M. G., Hierarchically nanostructured hydroxyapatite: hydrothermal synthesis, morphology control, growth mechanism, and biological activity. International journal of nanomedicine 2012, 7, 1781-91.
25. Nathanael, A. J.; Han, S. S.; Oh, T. H., Polymer-Assisted Hydrothermal Synthesis of Hierarchically Arranged Hydroxyapatite Nanoceramic. Journal of Nanomaterials 2013, 2013, 1-8.
26. Wang, X.; Zhuang, J.; Peng, Q.; Li, Y. D., Liquid–Solid–Solution Synthesis of Biomedical Hydroxyapatite Nanorods. Advanced Materials 2006, 18, (15), 2031-2034.
27. Boanini, E.; Fini, M.; Gazzano, M.; Bigi, A., Hydroxyapatite Nanocrystals Modified with Acidic Amino Acids. European Journal of Inorganic Chemistry 2006, 2006, (23), 4821-4826.
28. Cui, H.; Liu, H.; Qin, J.; Li, Y.; Tang, H.; Yang, X., Hydrothermal synthesis and characterisation of glutamine-modified rod-like hydroxyapatite nanoparticles. Micro & Nano Letters 2012, 7, (12), 1292-1295.
29. Qi, C.; Tang, Q.-L.; Zhu, Y.-J.; Zhao, X.-Y.; Chen, F., Microwave-assisted hydrothermal rapid synthesis of hydroxyapatite nanowires using adenosine 5'-triphosphate disodium salt as phosphorus source. Materials Letters 2012, 85, 71-73.
30. Diallo-Garcia, S.; Laurencin, D.; Krafft, J.-M.; Casale, S.; Smith, M. E.; Lauron-Pernot, H.; Costentin, G., Influence of Magnesium Substitution on the Basic Properties of Hydroxyapatites. The Journal of Physical Chemistry C 2011, 115, (49), 24317-24327.

93
6 Hydroxyapatite Synergies and its Potential Applications
The work in this chapter is used to confirm the hypothesis formulated at the end of
Chapter 4: Demonstrating Sustainability through Wastewater-Cultivated Algae, that inorganics
formed within the HTL solid product [now known to be hydroxyapatite(HA)] are performing
catalytic roles in obtaining a biocrude with low oxygen content. Evaluation of this hypothesis
included obtaining both a detailed distillate and molecular profile for comparison with literature
sources which have performed HTL on algae and subsequent thermal and catalytic treatment of
the resultant biocrude. In addition, since this work represents the first to create a HA material
during the HTL of algae significant potential remains to understand how the material can be used
as a higher-value product. Two main hypotheses which were formulated based of the full
characterization of the substitutions included: 1) the material could be altered to a secondary
tricalcium phosphate phase through heat treatments and 2) since the material contains more
bone-like substitutions it would be well suited for bioactivity as a tissue engineering scaffold
material. In order to evaluate each hypotheses the HA product was 1) calcined at variable
temperatures and evaluated for structure and functionality and 2) used as an in-vitro growth
substrate for human Wharton’s jelly cells and evaluated with a live/dead assay. The work
presented in this chapter was collected in conjunction with Chapter 5 using algae lot# 2013 and
has been published in Green Chemistry (2015), 17, 2560.

94
6.1 In-situ Catalytic Upgrading of the Biocrude from Hydroxyapatite Crystallization
HA is increasingly studied for its acid-base catalytic capabilities. Typical catalytic
applications of HA include dehydration (acid catalyzed) and dehydrogenation (base catalyzed)1,
2, Guerbet coupling reactions3, and use as active metal support materials.4 While biocrude oil
can be generated from a variety of feedstocks, it typically needs to be upgraded, or further
processed for lower heteroatom content and more desired distillate fractions, in order to be easily
integrated into current infrastructure for refining and transportation. Therefore, creating a
biocrude with lower oxygen and nitrogen, while increasing amount of lower boiling point
distillate fractions, is of significant interest. The HA produced by HTL of wastewater-cultivated
algae provides in-situ upgrading in both accounts. Complete analysis of molecular profile,
resulting from the non-derivatized and MSTFA-derivatized samples are found in Figure 6-1 and
Figure 6-2, respectively, with corresponding compound identification(s) found in Table 6-1 and
Table 6-2, respectively. The SimDist TGA profile and corresponding distillate fractions are
found in Figure 6-3. The biocrude product resulted in 80 wt% direct fuels and vacuum gas oil,
and overall 96 wt% of the biocrude could be distilled below 600 °C. GC-MS analysis on the
biocrude indicates the direct fuels are highly aromatic with primary components including
phenol, cresol isomers, dimethyl and ethyl phenols, and indoles, along with significant amounts
of straight chain and branched aliphatics. The vacuum gas oil primarily consists of free fatty
acids and >C20 straight chain aliphatics. The free fatty acids and methyl amine are shown in the
MSTFA-derivatized GC-MS chromatogram. Only one fatty acid amide was present, in small
amounts, and no nitriles. Studies have shown both thermal5 and catalytic6 upgrading treatments
to reduce fatty acid amides and nitriles while producing lower boiling point aromatics and

95
aliphatics. Roussis et al.5 explains a thermal upgrading pathway from amides to nitriles to
aliphatics and aromatics at thermal treatment above 400 °C. Within the biocrude produced from
algae lot# 2013, small amounts of fatty acid amides, with no nitriles, and the presence of methyl
amine suggests that HA product is catalyzing the dehydration pathway from amides to aliphatics
and aromatics. The three main stages of this pathway include dehydration of the amides to
nitriles (reducing oxygen content by water removal), deamination of nitriles to alkanes and
olefins (producing methyl amine), followed by dehydrogenation producing olefin isomers and
aromatics. Both the dehydration and deamination steps would be catalyzed by active acid sites
while the dehydrogenation results from basic active sites. It is hypothesized that the dehydration
step is the rate limiting step while deamination occurs relatively quickly, due to the fact that
small amount of amides where still identified and no nitriles were present. Further evidence of
HA catalysis can be found by comparing results to Bai et al. catalytically treated biocrude.6
Their findings also included reduction of fatty acid amides and nitriles, and upon upgrading they
began to form benzenamine and carbozole. Both of these compounds are found within the
biocrude from algae lot# 2013 (Figure 6-1, peak 23: benzenamine and Figure 6-2, peak E`:
carbozole). Additionally, Bai et al. determined catalytic treatment was required to achieve total
distillation of >90 wt% at or below 600 °C, similar to the biocrude produced during HA
crystallization.
The distillate fractions from the biocrude co-produced with HA, presented in Figure 6-3,
more closely resemble Roussis et al. thermally-upgraded biocrude at 400 °C, especially in the
lower boing point distillates. The amount of vacuum gas oil and residual are more similar to
Roussis et al. 350 °C upgraded oil, however, this is misleading because vacuum gas residuals

96
(which boil much higher than 600 °C) are cracking which produce higher amounts of >C20
aliphatics, leading to more vacuum gas oils and remaining vacuum gas residuals which boil
below 600 °C. Overall, the distillate fractions, oxygen content, and molecular profile of the
biocrude are affected by the catalytic dehydration pathway induced by HA.
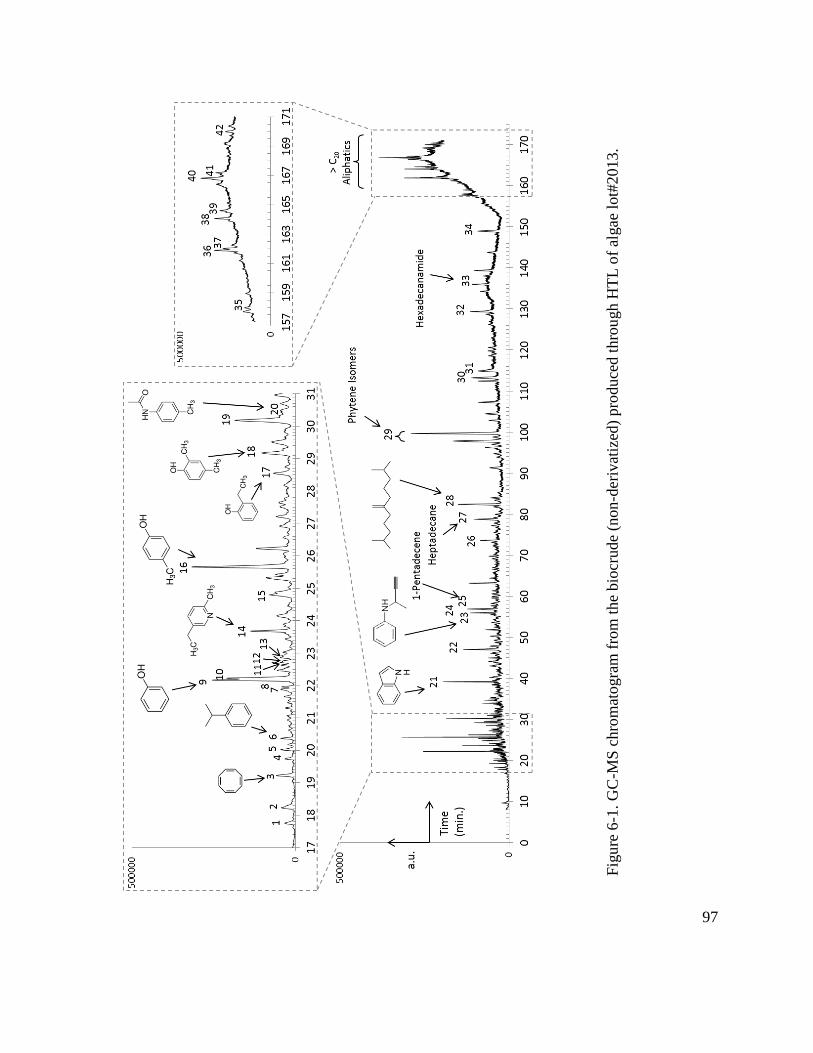
97
Figu
re 6
-1. G
C-M
S ch
rom
atog
ram
from
the
bioc
rude
(non
-der
ivat
ized
) pro
duce
d th
roug
h H
TL o
f alg
ae lo
t#20
13.

98
Table 6-1. Compound identification list from GC-MS analysis of biocrude from Figure 6-1;
above 90% confidence as compared with NIST MS library.
Retention Time Compound Name
Retention Time Compound Name
1 17.75 Ethylbenzene 23 55.93 N-(1-Methyl-2-propynyl)benzenamine 2 18.23 1,3-Dimethyl benzene 24 56.74 2,3-Dimethyl indole 3 19.20 1,3,5,7-Cyclooctatetraene 25 56.88 1-Pentadecene 4 19.73 2-Cyclopenten-1-one 26 73.58 1,7-Trimethylene-2,3-dimethyl indole 5 20.02 2,5-Dimethyl pyrazine 27 78.74 Heptadecane 6 20.36 1-Methylethyl benzene 28 82.33 2-Isohexyl-6-methyl-1-heptene 7 21.88 Dimethyl trisulfide
29 97.77 Phytene isomer
8 21.96 Cyclotetrasiloxane 99.62 Phytene isomer 9 22.18 Phenol 30 113.20 1-Methyl-9H-pyrido[3,4b]indole 10 22.23 Methyl styrene 31 114.76 9H-Pyrido[3,4-b]indole 11 22.70 2,3-Dimethyl-2-cyclopentene-1-one 32 129.35 Phytol 12 22.76 2-Ethyl-6-methyl pyrazine 33 135.95 Hexadecanamide 13 22.91 2-Ethyl-5-methyl pyrazine 34 148.94 Nonadecane 14 23.68 2-Ethyl-5-methyl pyridine 35 157.94 > C20 alkane 15 24.78 2-Methyl phenol 36 161.72 > C20 alkene 16 25.65 4-Methyl phenol 37 161.88 > C20 alkane 17 28.53 2-Ethyl phenol 38 164.06 1-(12-Methyltetradecanoyl) pyrrolidine 18 29.17 2,4-Dimethyl phenol 39 164.60 > C20 alkane 19 30.17 4-Ethyl phenol 40 166.80 > C20 alkene 20 30.53 4'-Methylacetanilide 41 167.18 2-Pentacosanone 21 39.15 Indole 42 169.97 Cholest-4-ene 22 47.00 3-Methyl indole
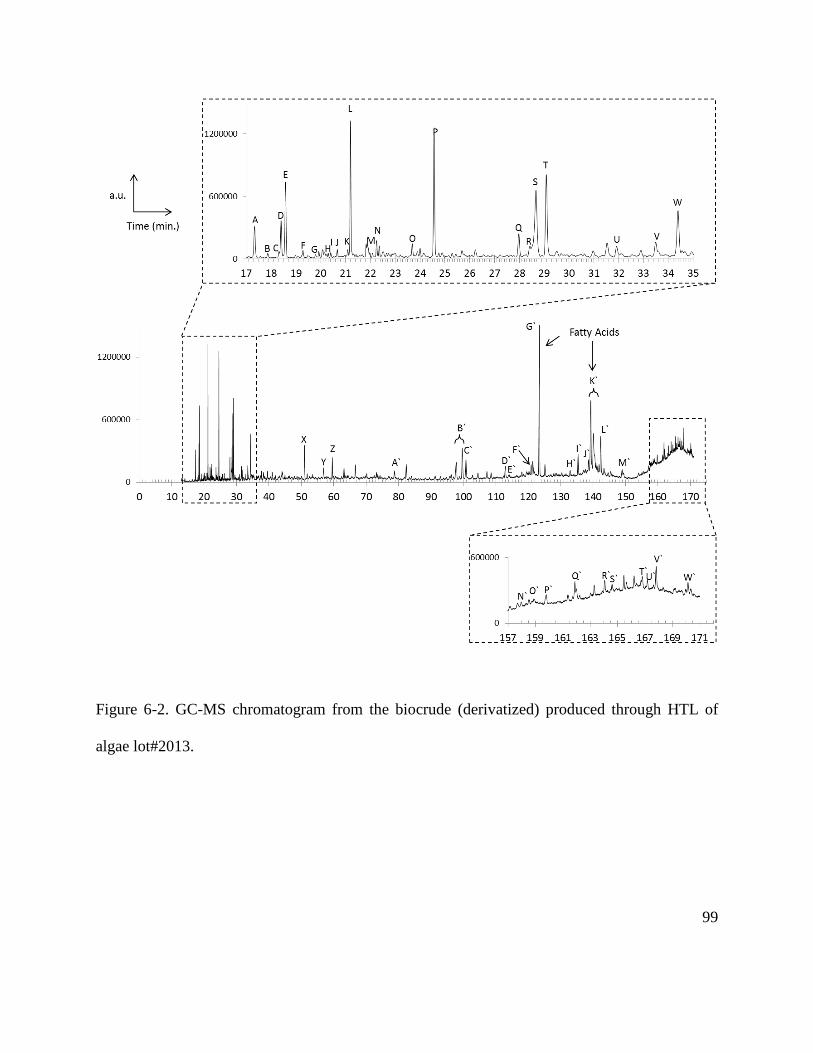
99
Figure 6-2. GC-MS chromatogram from the biocrude (derivatized) produced through HTL of
algae lot#2013.

100
Table 6-2. Compound identification list from GC-MS analysis of biocrude from Figure 6-1;
above 90% confidence as compared with NIST MS library.
Retention Time Compound Name
Retention Time Compound Name
A 17.33 MSTFA B`
97.68 Phytene isomer B 17.86 Ethylbenzene 99.64 Phytene isomer C 18.32 1,3-dimethylbenzene C` 100.73 Tetradecanoic acid D 18.40 Dihydroxy(dimethyl)silane D` 112.96 1-Methyl-9H-pyrido[3,4-b]indole E 18.59 Methylamine E` 113.92 9H-Carbazole F 19.29 1,3,5,7-Cyclooctatetraene F` 120.95 9-Hexadecenoic acid G 19.79 2-Methyl-2-cyclopenten-1-one G` 123.40 Hexadecanoic acid H 20.29 2-Methylbutyric acid H` 132.94 Heptadecanoic acid I 20.40 Cumene I` 135.39 3,7,11,15-Tetramethyl-2-hexadecen-1-ol J 20.68 3-Methylbutanoic acid J` 138.58 9,12-Octadecanoic acid K 21.08 Piperidine
K`
139.30 Oliec acid isomer L 21.19 Hydrogen sulfide 139.60 Oliec acid isomer M 21.92 Dimethyl trisulfide 140.10 Oliec acid isomer N 22.25 Methyl styrene 140.50 Oliec acid isomer O 23.69 2-Ethyl-5-methylpyridine 140.80 Oliec acid isomer P 24.59 Phenol 141.20 Oliec acid isomer Q 27.98 2-Methylphenol L` 142.40 Octadecanoic Acid R 28.42 Pyridine M` 148.97 Nonadecane S 28.08 4-Methylphenol N` 157.98 > C20 alkane T1 28.60 Piperdine (co-elute) O` 158.90 11-Eicosenoic acid T2 28.60 6-Propylquinoline (co-elute) P` 159.79 Eicosanoic acid U 31.91 3-Hydroxy-6-methylpyridine Q` 161.70 > C20 alkene V 33.48 2,4-Dimethylphenol R` 164.04 1-(12-Methyltetradecanoyl)pyrrolidine W 34.39 2,5-Dimethylphenol S` 164.60 > C20 alkane X 51.00 Indole T` 166.70 > C20 alkene Y 56.88 Pentadecene U` 167.19 2-Pentacosanone Z 59.58 3-Methyl indole V` 167.80 Tricosanoic acid A` 78.76 Heptadecane W` 170.13 Tetracosanoic acid

101
Figure 6-3. Simulated distillation via TGA of the biocrude and corresponding distillate fractions
found in the biocrude produced in the presence of HA crystallization.
-1
10
0
6
0 100 200 300 400 500 600
dW/d
t (%
/min
)
Wei
ght (
mg)
Temperature (°C)
0
10
20
30
40
50
<193 °C 193-271 °C 271-343 °C 343-538 °C >538 °C
Heavy Naphtha Kerosene Gas Oil Vac Gas Oil Vac Residual
Mas
s %
0
10
20
30
40
50
60
104- 260 260- 400 400- 490 490- 630 630- 1020 >1020
Mas
s %
Distillate Fraction (°F)
Biocrude from algae lot# 2013Biocrude (Roussis et al.)350°C Thermal Treatment (Roussis et al.)400°C Thermal Treatment (Roussis et al.)
Solvent
Weight (mg)
dW/dt (%/min)
36% Direct Fuels

102
6.2 Phase Tuning of Hydroxyapatite
Ionic substitutions in HA can promote thermal transformation to tricalcium phosphate
(TCP) at temperatures above 600 °C.7-9 Multiphasic calcium orthophosphates (mixtures of HA
and TCP) as biomaterials are known to have high osteogenicity and osteoinductive properties7,
particularly in achieving an optimum balance between the more stable HA and more soluble
TCP.10 Thermal treatment of the HA product steadily transforms the material to TCP with
intermediate temperatures giving variable biphasic mixtures. XRD and FTIR analysis of
thermally treated HA product in 100 °C increments from 500 °C to 900 °C are depicted in Figure
6-4. Residual organics from HTL processing are removed at 500 °C, as observed by the
disappearance of the C-O peak at 1563 cm-1 and the C-H bands at 2852 & 2922 cm-1 (not shown)
in the FTIR spectra. However, the XRD spectrum indicates that thermal treatment at 500 °C
does not alter the HA structure. The FTIR at 500 °C retains significant carbonate peaks at 1417
& 1452 cm-1, indicative of B-type, or PO4, substitution. These ionic substitutions can distort the
lattice and compensate charge by creating hydroxyl vacancies resulting in a reduction of FTIR
stretching intensity11, as seen with HA product (Figure 5-3 & Figure 6-4).
A clear decrease in the FTIR carbonate bands (1417 & 1452 cm-1) is observed with
increasing thermal treatment. The XRD spectra defines the onset of transition from HA to TCP
at 600 °C and corresponds to the loss of carbonate bands, indicating that carbonate
decomposition plays a role within phase transformation. The TGA for the ultimate analysis of
the HA product, shown in Figure 6-5, indicates there are four main areas of decomposition
between 600-850 °C. Loss of carbonate ions within the lattice of substituted HA is still an active
area of research, trying to understand how relationships between lattice dimension, density, and
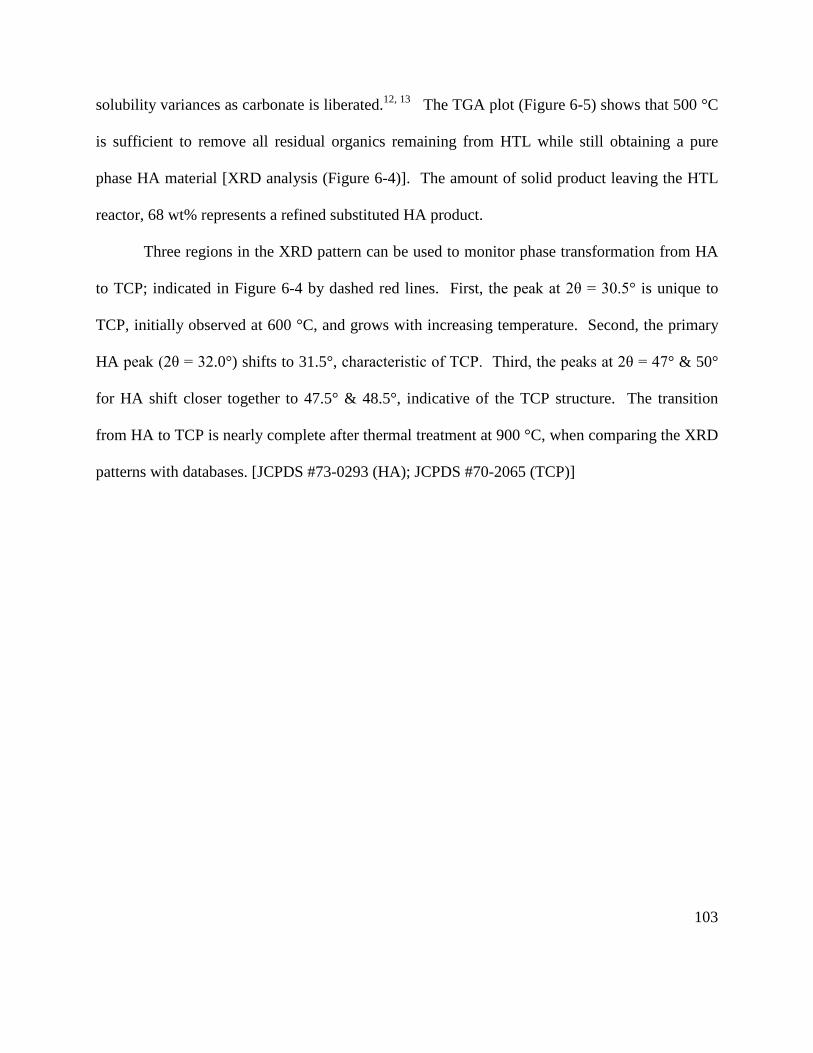
103
solubility variances as carbonate is liberated.12, 13 The TGA plot (Figure 6-5) shows that 500 °C
is sufficient to remove all residual organics remaining from HTL while still obtaining a pure
phase HA material [XRD analysis (Figure 6-4)]. The amount of solid product leaving the HTL
reactor, 68 wt% represents a refined substituted HA product.
Three regions in the XRD pattern can be used to monitor phase transformation from HA
to TCP; indicated in Figure 6-4 by dashed red lines. First, the peak at 2θ = 30.5° is unique to
TCP, initially observed at 600 °C, and grows with increasing temperature. Second, the primary
HA peak (2θ = 32.0°) shifts to 31.5°, characteristic of TCP. Third, the peaks at 2θ = 47° & 50°
for HA shift closer together to 47.5° & 48.5°, indicative of the TCP structure. The transition
from HA to TCP is nearly complete after thermal treatment at 900 °C, when comparing the XRD
patterns with databases. [JCPDS #73-0293 (HA); JCPDS #70-2065 (TCP)]
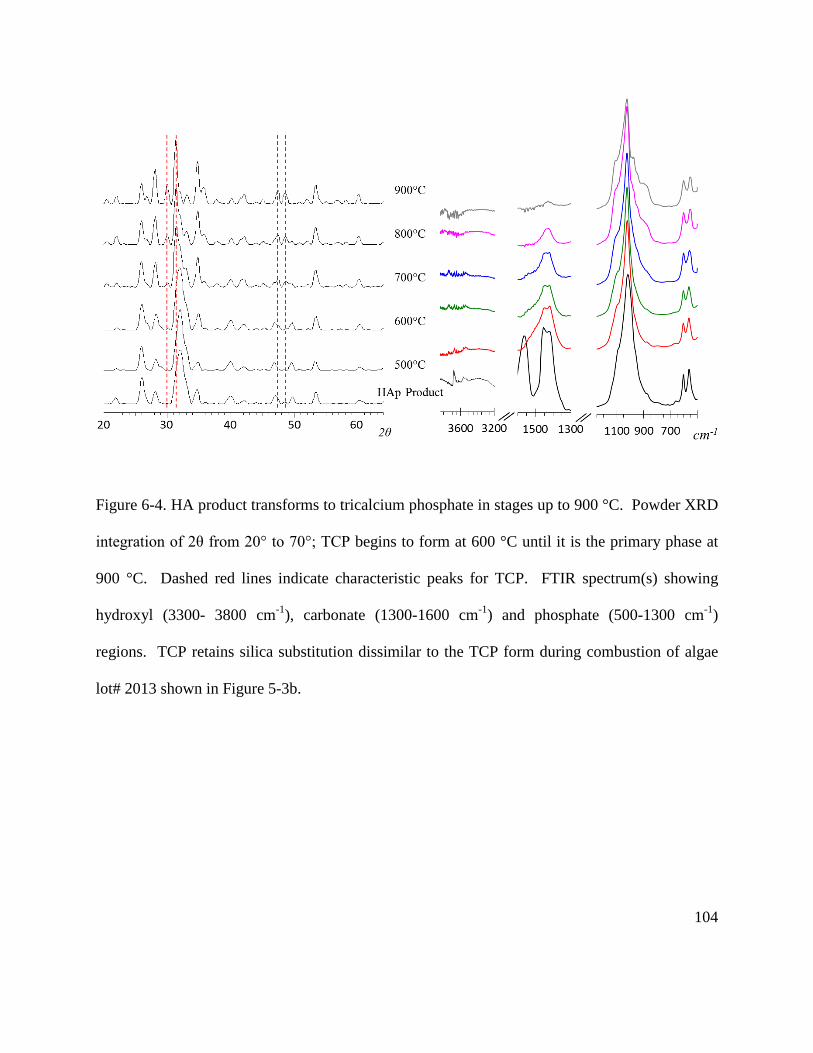
104
Figure 6-4. HA product transforms to tricalcium phosphate in stages up to 900 °C. Powder XRD
integration of 2θ from 20° to 70°; TCP begins to form at 600 °C until it is the primary phase at
900 °C. Dashed red lines indicate characteristic peaks for TCP. FTIR spectrum(s) showing
hydroxyl (3300- 3800 cm-1), carbonate (1300-1600 cm-1) and phosphate (500-1300 cm-1)
regions. TCP retains silica substitution dissimilar to the TCP form during combustion of algae
lot# 2013 shown in Figure 5-3b.

105
Significant broadening of the phosphate shoulder peaks at 800- 1000 cm-1 in the FTIR
patterns occur with increasing thermal treatment. Broad shoulders with multiple peaks are unlike
typical FTIR patterns for TCP, which have a sharp peak near 983 cm-1 and small shoulder at 947
cm-1, similar to algae lot# 2013 ash spectra shown in Figure 5-3b. These shoulders are attributed
to SiO44- substitution, which have been seen in pure Si-HA.14 However, the XRD profiles
suggest that the SiO44- is actually within the TCP phase, suggesting the Si present in HA is
retained during the transformation to TCP. If the Si was not integrated in the TCP structure,
FTIR peaks for silicate or poly-silicate would expected to be observed, similar to the algae lot#
2013 ash, with increasing thermal treatment. However, no characteristic peak for amorphous
silica is observed at 800 cm-1.
Figure 6-5. HA (HTL solid product) proximate analysis and corresponding TGA plot; carbonate
loss associated with phase change are indicated with asterisk.

106
Transformation to the TCP phase induces globular morphological changes, as shown
through SEM images in Figure 6-6. The combination of both phase and morphological changes
that occur through simple heat treatments of the HA product allows tunability within each
market, catalysis and/or biomedical.
Figure 6-6. SEM image of HTL solid product from algae lot# 2013 after calcining in air at 900
°C; hexagonal nano-rods (shown in Figure 5-4) have sintered into a globular morphology
indicative of TCP.
HA is primarily a non-porous crystal which exhibits acid-base activity on external crystal
surfaces. The amount and strength of the active sites are a function of Ca/P ratio, substitutions,
and crystal morphology; each altering which atoms are exposed on the crystal surface.15-18
Silvester et al.15 contribute P-OH as Brønsted acid sites and the Ca2+ and OH vacancies as Lewis
acids. Yan et al.1 describe when organics adsorb on the HA surface, a P-OH complex is formed
and catalytically dehydrates lactic acid to acrylic acid. Once the molecule desorbs from the
surface the P-O- is regenerated.

107
A closer view of the FTIR hydroxyl stretching area of the HA product in Figure 6-4 show
two things; 1) the lattice hydroxyl peak is extremely small from considerable hydroxyl vacancies
(or Lewis acids),15, 16 and 2) the there is a pronounced P-OH complex peak.16 Removal of
organics at 500 °C results in no changes to lattice hydroxyls, however, the P-OH complex is lost
suggesting the original P-O- is regenerated. These results demonstrate that regeneration can be
achieved through minimal heat treatment and create a pure phase HA product stream after the in-
situ synthesis of a HA catalyst which, compared to the evaluation of Silvester et al.15 and Yan et
al.1 contains Brønsted and Lewis acid sites. Overall, the contribution of these active sites
provide the means for in-situ catalytic upgrading of the biocrude produced, as previously
discussed in section 6.1.
6.3 Cell Culturing on Hydroxyapatite Product
The substituted HA structure formed with HTL of algae lot# 2013 shows great promise
for biomedical and bioengineering applications. Although natural bone is mainly Ca2+ and PO43-
, it also incorporates other ions of CO32-, SiO4
4-, and Mg2+. These substitutions, and optimizing
HA/TCP ratio through calcination, can help HA behave more like natural apatite in human bone
and increase bioactivity to allow steady bone regeneration over an extended period of time.9, 19
The first stage chosen to evaluate efficacy for bone scaffolds or regenerative materials was to
determine whether human Wharton’s jelly cells (hWJCs) will attach to the material. It was
observed within 1 day of seeding hWJCs on the HA product calcined at 600 °C, cells began to
attach and showed beginning stages of morphological changes. After 10 day incubation, a
live/dead assay was performed; the images in Figure 6-6 show living cells which are clearly
108
attached to the HA product through extended filopodia. These promising results strongly
warrant further investigation to understand if the HA product will promote a genetic response
toward an osteogenic lineage. If so, this process could provide a cheap and effective alternative
to producing bone-like apatite, greatly contributing to higher-value product streams for the HTL
of algae.
Figure 6-7. Human Wharton’s jelly cells attached to HA product. Live/ dead assay micrograph
after 10 day incubation on HA product calcined at 600 °C. Live cells fluoresce in green, dead
cells fluoresce in red. The HA product interacted with the florescent components to induce auto
fluorescence, primarily in the red. Scale bars are 100 µm.

109
6.4 Conclusions
The work in this chapter confirmed the overall hypothesis that crystallizing
hydroxyapatite within the reactor for the HTL of wastewater-cultivated algae resulted in catalytic
upgrading of the biocrude product. Particularly, in the dehydration of fatty acid amides to
alkenes and aromatics, overall reducing the amount of oxygen content of the resultant biocrude
and producing an increased amount of (desired) lower boiling point distillate fractions. The
biocrude was found to achieve >90 wt% distillation below 600 °C, where previously had only
been reported when thermally or catalytically treated.
In addition, both hypotheses formulated to evaluate the hydroxyapatite product for
higher-value applications were confirmed. There existed gradual phase tunability with a
secondary tricalcium phosphate phase, utilizing a simple calcination procedure. Steady increases
in calcination temperature decomposed carbonate substitutions within the hydroxyapatite,
resulting in increased degree of tricalcium phosphate phase, up to 900 °C, where primarily
tricalcium phosphate was present. Once the material was in the tricalcium phosphate phase, it
was determined silicon substitution remained and induction of globular morphologies occurred.
Phase tunability of the hydroxyapatite product could greatly enhance functionality within it
respective markets, controlling factors such as catalytically active sites and solubility for either a
fertilizer or biomedical material. The preliminary cell culturing study indicated attachment and
morphological changes occurred with the growth of Wharton’s jelly cells after 10 day incubation
in-vitro.
This work represents the first of its kind to produce a catalyst and utilize active sites in-
situ during the HTL of algae. Further, the catalytic active sites can be regenerated and

110
potentially tuned with a simple heat treatment, potentially making the overall HTL of
wastewater-cultivated algae process a high-value catalysts producer with a by-product of high
quality renewable crude oil. This work also represents novel formulation of potential biomedical
materials; linking the traditionally separate fields of study including environmental remediation,
energy, and medicine.
6.5 References
1. Yan, B.; Tao, L.-Z.; Liang, Y.; Xu, B.-Q., Sustainable Production of Acrylic Acid: Catalytic Performance of Hydroxyapatites for Gas-Phase Dehydration of Lactic Acid. ACS Catalysis 2014, 1931-1943.
2. Rahmanian, A.; Ghaziaskar, H. S., Continuous dehydration of ethanol to diethyl ether over aluminum phosphate–hydroxyapatite catalyst under sub and supercritical condition. The Journal of Supercritical Fluids 2013, 78, 34-41.
3. Kozlowski, J. T.; Davis, R. J., Heterogeneous Catalysts for the Guerbet Coupling of Alcohols. ACS Catalysis 2013, 3, (7), 1588-1600.
4. Indra, A.; Gopinath, C. S.; Bhaduri, S.; Kumar Lahiri, G., Hydroxyapatite supported palladium catalysts for Suzuki–Miyaura cross-coupling reaction in aqueous medium. Catalysis Science & Technology 2013, 3, (6), 1625.
5. Roussis, S. G.; Cranford, R.; Sytkovetskiy, N., Thermal Treatment of Crude Algae Oils Prepared Under Hydrothermal Extraction Conditions. Energy & Fuels 2012, 26, (8), 5294-5299.
6. Bai, X.; Duan, P.; Xu, Y.; Zhang, A.; Savage, P. E., Hydrothermal catalytic processing of pretreated algal oil: A catalyst screening study. Fuel 2014, 120, 141-149.
7. Dorozhkin, S. V., Biphasic, triphasic and multiphasic calcium orthophosphates. Acta biomaterialia 2012, 8, (3), 963-77.
8. Zorn, K.; Gbureck, U.; Mitró, D.; Müller, F. A.; Vorndran, E., Hydrothermal synthesis of calcium-deficient hydroxyapatite whiskers and their thermal transformation to polycrystalline β-tricalcium phosphate short fibers. Bioinspired, Biomimetic and Nanobiomaterials 2013, 2, (1), 11-19.
9. Fathi, M. H.; Hanifi, A.; Mortazavi, V., Preparation and bioactivity evaluation of bone-like hydroxyapatite nanopowder. Journal of Materials Processing Technology 2008, 202, (1-3), 536-542.
10. Daculsi, G., Biphasic calcium phosphate concept applied to artificial bone, implant coating and injectable bone substitute. Biomaterials 1998, 19, (16), 1473-1478.
11. Huang, T.; Xiao, Y.; Wang, S.; Huang, Y.; Liu, X.; Wu, F.; Gu, Z., Nanostructured Si, Mg, CO3 2− Substituted Hydroxyapatite Coatings Deposited by Liquid Precursor Plasma
111
Spraying: Synthesis and Characterization. Journal of Thermal Spray Technology 2011, 20, (4), 829-836.
12. Gamelas, J.; Martins, A., Surface properties of carbonated and non-carbonated hydroxyapatite obtained after bone calcination at different temperatures. Colloids and Surfaces A: Physicochemical and Engineering Aspects 2015.
13. Liu, Q.; Matinlinna, J. P.; Chen, Z.; Ning, C.; Ni, G.; Pan, H.; Darvell, B. W., Effect of thermal treatment on carbonated hydroxyapatite: Morphology, composition, crystal characteristics and solubility. Ceramics International 2015, 41, (5), 6149-6157.
14. Marchat, D.; Zymelka, M.; Coelho, C.; Gremillard, L.; Joly-Pottuz, L.; Babonneau, F.; Esnouf, C.; Chevalier, J.; Bernache-Assollant, D., Accurate characterization of pure silicon-substituted hydroxyapatite powders synthesized by a new precipitation route. Acta biomaterialia 2013, 9, (6), 6992-7004.
15. Silvester, L.; Lamonier, J.-F.; Vannier, R.-N.; Lamonier, C.; Capron, M.; Mamede, A.-S.; Pourpoint, F.; Gervasini, A.; Dumeignil, F. Y., Structural, textural and acid-base properties of carbonates-containing hydroxyapatites. Journal of Materials Chemistry A 2014.
16. Diallo-Garcia, S.; Laurencin, D.; Krafft, J.-M.; Casale, S.; Smith, M. E.; Lauron-Pernot, H.; Costentin, G., Influence of Magnesium Substitution on the Basic Properties of Hydroxyapatites. The Journal of Physical Chemistry C 2011, 115, (49), 24317-24327.
17. Matsuura, Y.; Onda, A.; Ogo, S.; Yanagisawa, K., Acrylic acid synthesis from lactic acid over hydroxyapatite catalysts with various cations and anions. Catalysis Today 2014, 226, 192-197.
18. Tsuchida, T.; Kubo, J.; Yoshioka, T.; Sakuma, S.; Takeguchi, T.; Ueda, W., Reaction of ethanol over hydroxyapatite affected by Ca/P ratio of catalyst. Journal of Catalysis 2008, 259, (2), 183-189.
19. Khan, A. F.; Saleem, M.; Afzal, A.; Ali, A.; Khan, A.; Khan, A. R., Bioactive behavior of silicon substituted calcium phosphate based bioceramics for bone regeneration. Materials science & engineering. C, Materials for biological applications 2014, 35, 245-52.

112
7 Future Directions
This chapter details future studies (as it pertains to the findings of this dissertation and the
incorporation of hydrothermal liquefaction of algae) that have been deemed most significant to
advance current knowledge and data found within the field for creating increased sustainability
and end-use applications. Three main areas of focus to be discussed include liquefaction studies,
post catalytic studies for the hydroxyapatite product, and bioactivity of the hydroxyapatite
product for medical use.
7.1 Furthering Liquefaction Studies
7.1.1 Increasing Biocrude Productivity through Activated Municipal Sludge
The data presented in this dissertation and among collaborating researchers1-4 have shown
that municipal wastewater contributes a fraction of a local population’s fuel demands; therefore
increasing liquid fuel production from a sustainable pathway can have greater long-term
significance for contributing to end-use biofuels. The proposed investigation to further the
biocrude productivity of a wastewater treatment plant includes the co-liquefaction of discarded
activated municipal sludge (AMS) and algae.
Few studies have presented data on the liquefaction of AMS5-7 and bacteria8, where most
interest with the hydrothermal conversion has been at lower temperature carbonization9-11 for
producing a coal supplement/ substitute or a soil conditioner.11 Typically, the biocrude produced
from the liquefaction from AMS has slightly lower yields, lower carbon and higher oxygen
113
content then compared to algae.5, 7, 8 However, addition of calcium oxide has shown to facilitate
hydrolysis and deamination processes.7
The present hypothesis is that co-liquefaction of wastewater-cultivated algae, similar to
those evaluated in this dissertation, and AMS will perform the following: 1) addition of more
total biomass for higher overall biocrude return, 2) AMS has the potential to also crystallize
hydroxyapatite in-situ, if not, the algae can facilitate crystallization while AMS can contribute
more carbon, calcium, and phosphorus to the process, and 3) in-situ upgrading of biocrude
produced from co-liquefaction of algae and AMS will result in lower overall oxygen content
similarly to HTL of algae alone.
The suggested study involves a simple experimental plan well suited for the current
research group and its collaborators, which includes the following: Once the AMS is obtained
from the Lawrence Wastewater Treatment Plant and characterized (similarly to algae biomass in
this dissertation), perform HTL experiments on the AMS alone, as a baseline, and mixed with
wastewater-cultivated algae. The evaluation of hydroxyapatite crystallization should be
performed after each HTL experiment as well as all relevant HTL product characterizations.
This study has the potential to utilize valuable nitrogen and phosphorus in a responsible
manner and “recycle” carbon into usable fuels and chemicals, overall, increasing productivity
and sustainability of algae-based biofuels and chemicals
7.1.2 Fraction Distillation of Biocrude for Complete End-Use Characterization
Growing interest within hydrothermal liquefaction (of algae) and the promise it has for
commercial scale production warrants insight into end-use applications and scope of downstream
processing. To date, insufficient characterization(s) of the whole biocrude has been reported,
114
particularly limited to those presented in this dissertation (GC-MS, simulated distillations, and
elemental content(s)). Recently, techniques such as two dimensional nuclear magnetic resonance
(2D-NMR) and Fourier transform ion cyclotron resonance mass spectrometry (FT-ICR MS) have
been employed to understand relationship between molecules which have heteroatoms (O & N)
within a particular carbon number.12-14 These techniques begin to evaluate molecules of the
biocrude product which are out of the range for GC-MS which contribute to the understanding of
the complexity of the biocrude but fundamentally lack insight into creating an end-use product.
Moving toward commercial use of biocrude (in place of petroleum) will require efforts
for end-use application studies and characterizations. Therefore, it is believed the first step in
this direction is to obtain significant quantities of biocrude and perform fraction distillation prior
to characterization and upgrading. Evaluating individual distillate fractions will aid in
determining optimal upgrading techniques to employ, or targeted markets for an increased return.
This type of study has not been demonstrated in the literature and could provide insightful
advantages or disadvantages to HTL biocrude. The current research group has existing
equipment that could be used to perform necessary studies. Currently housing a 4.8 L reaction
vessel capable of safely operating in the supercritical water regime which can be used for
obtaining significant quantities of biocrude, and a vacuum distillation apparatus which is design
for specific ASTM methods for biodiesel, which could be slightly altered to acquire
fractionation. It is believed that once individual fractions are obtained of various distillates
thorough characterizations (GC-MS and ultimate analysis) will reveal individual distillate
fractions contain various commodity chemicals and heteroatom content(s). Once identified,
115
further research could be performed into purification and upgrading strategies to optimize
higher-value product streams.
7.1.3 Continuous HTL Operation with Regenerative Recycle
In reference to the data presented and conclusive findings of this dissertation, a
completely novel approach to hydrothermal liquefaction of algae is suggested. A common and
well-studied unit operation in chemical engineering is the fluidized catalytic cracking (FCC)
unit. Since the HTL of wastewater-cultivated algae has resulted in the synthesis of a beneficial
heterogeneous catalyst, which has shown regenerative capabilities through simple heat treatment,
a FFC unit could be used as the reactor/ catalyst regenerator/ recycle to fully utilize the catalytic
potential of hydroxyapatite in dehydration reactions further reducing overall oxygen content of
the biocrude produced. Thoughtful in the design of the FCC unit, the purging of (typically spent)
catalyst would actually become a high-value product stream of the refined hydroxyapatite.
This type of operation would benefit HTL of algae in multiple ways, including: valuable
heat integration from flue gasses from the regenerator, optimizing usability of acid-base catalytic
power of hydroxyapatite by ensuring available active sites at all times of operation, potentially
obtaining a superior hydroxyapatite product by removing unwanted impurities as the material
continuously alters through crystal growth and regenerative sintering, and minimizing overall
operational cost by maximizing catalytic efficiency.
7.2 Continuing Catalytic Studies of Hydroxyapatite Product
As an acid-base catalyst, HA is has been used to catalyze a number of reactions including
dehydration and dehydrogenation reactions15-20, Guerbet alcohol coupling21-25, and Michael
116
addition.26 Two reactants of particular interest include both ethanol and lactic acid, both
produced through conventional fermentation of biomass and its components. Therefore, it is of
great interest to find efficient and environmentally friendly reaction pathways to transform these
chemicals to commodities and value-added products. HA has proven to be a suitable catalyst for
the conversion of either reactant because acid-base properties can be tuned by altering HA
synthesis procedure and changing the Ca/P molar ratio resulting in higher acid or basic sites,
resulting in variable selectivity to dehydration or dehydrogenation products, respectively.
Stoichiometric HA, Ca10(PO4)6(OH)2, has the Ca/P ratio of 1.67, higher acid or basic sites are
found at Ca/P < 1.67 and ≥1.67, respectively. The HA produced through the liquefaction of
wastewater-cultivated algae shows the phase can be slowly altered through increasing calcination
temperature to more basic tricalcium phosphate (TCP), Ca3(PO4)2, thus, it is proposed that acid-
base properties of the HA product can be easily tuned for desired reactions and selectivities
without altering the synthesis procedures and only employing variable calcination temperatures
resulting in different ratios of HA and TCP.
Acid-base properties of HA with various Ca/P ratios have been reported to achieve total
conversion of dehydration lactic acid where highest selectivity (60%) to acrylic acid using the
lowest Ca/P ratio and thus highest number of acid sites.27 Alcohol coupling or Guerbet alcohols
were found to have the highest selectivity with HA with increasing Ca/P ratios with higher basic
sites25, where TCP showed higher alcohol coupling rate compared to HA.24 The HA produced in
this dissertation should lead to interesting acid-base properties, where it is unknown how the
multitude of substitutions will affect the overall acid-base properties of the material. Recent
studies have begun to identify some substitution effects on catalytic sites, including CO3/ Na,28
117
Mg,29 and Sr/ Pb/ VO4.30 In the case of CO3 and Na, acid site density were found in the order of
Ca-deficient > stoichiometric > carbonate-HA > Na/CO3-HA > CO3 rich-HA > Na/CO3 rich-HA
which directly correlated to the selectivity of propylene from isopropyl alcohol (90% - 5%). In
contrast, catalytic basicity (selectivity of acetone from isopropyl alcohol) had the exact opposite
trend (5% - 70%). The degree at which the HA produced in this dissertation is substituted, both
anionic and cationic, primarily with CO32-, SiO4
4-, Mg2+ would give significant quantities of both
acid and base active sites. It is believed the HA product will contain more acid than basic sites
and as the calcination temperature increases, changing the phase toward TCP, the basic sites will
increase due to more exposed PO4 ion in the TCP structure because of changing morphology (as
shown in Figure 5-4 and Figure 6-6). However, the biphasic intermediate temperatures could
potentially form interesting ratios and strengths of both acid and base sites and therefore each
temperature should be carefully considered for future catalytic reactions.
There have been an increasing number of research articles, published in the current year
(2015),31-42 incorporating and understanding hydroxyapatite’s catalytic ability which have
demonstrated extreme versatility as an effective green catalyst in a variety of reactions including
hydrogenation, oxidation, hydrocracking, and photocatalytic degradation and have also shown
that hydroxyapatite can be used as-is or as support material for gold, ruthenium, cesium,
rhodium, and lanthanum. Therefore, there is a strong urge to demonstrate the activity (and
versatility) of the hydroxyapatite co-produced with biocrude from algae. The suggested starting
point is the full characterizations of acid-base active sites through temperature programmed
desorption of both ammonia (for acid sites) and CO2 (for basic sites) at each calcination
temperature presented in section 6.2, followed by a simple and straight forward reaction study
118
converting isopropyl alcohol to either acetone or propylene utilizing current set-up in
conjunction with the Unit Operations laboratory for undergraduate coursework at the University
of Kansas. Other suggested studies are to follow similar studies to that of Tsuchida et al.23 and
Ghantani et al.27 for conversion of ethanol and lactic acid, respectively.
7.3 Bioactivity and Genealogical Promotion Studies of Hydroxyapatite Product
Differentiating stem cells toward an osteogenic lineage has been a top area of interest in
regenerative medicine for bone reconstruction and tissue engineering for over two decades.43
One component of bone is natural apatite material; therefore, hydroxyapatite (HA) was a likely
candidate for regenerative bone engineering and proved itself for scaffolding materials many
years ago.44 Synthetic HA has demonstrated bone-like bioresorption,45 biocapatability,44 and
genealogical lineage differentiation (the ability to promote stem cells toward a specific
phenotype; in this case osteocytes).46 Multiple studies have shown silicon substituted HA can
increase the efficacy of for bone regeneration.47
Natural bone is mainly Ca2+ and PO43-, it also incorporates other ions of CO3
2-, SiO44-,
and Mg2+. As these substitutions are found in the HA product in this work, in conjunction with
optimizing HA/TCP ratio through calcination, it is believed this HA will behave more like
natural apatite in human bone and increase bioactivity to allow steady bone regeneration over an
extended period of time.45, 47
Continuing bioactivity efforts will strengthen higher-value market targeting for
commercial use of these products. Suggested studies include evaluating genealogical lineage
similar to Guo et al.44 or Cameron et al.46 using simple disk pellets as a scaffold from a HA

119
materials and evaluated in-vitro culturing mesenchymal stem cells (MSCs). Evaluation of the
gene expression is suggested to be conducted similarly to the study by Cameron et al.46
evaluating gene markers endoglin (CD105), runt related transcription factor 2 (RUNX2),
parathyroid hormone recepot 1 (PTH1R), collagen type 1 (Col1a1), osteocalcin (BGLAP), and
dentin matrix acidic phophoprotein 1 (DMP1). A simple description of each gene is provided in
Table 7-1.
Table 7-1. Genes and their descriptions expressed through the osteogenic lineage from
mesenchymal stem cells (MSCs).46
Gene Description
CD105 cell surface receptor commonly associated with MSCs, and decreases in expression as these cells differentiate
RUNX2 a key role in osteoblast differentiation, indicating onset
PTH1R expression is associated with endochondral ossification and plays a vital role in calcium homeostasis in bone
Col1a1 early marker of osteoblast differentiation and a reporter of osteoblast activity
BGLAP late marker of osteoblast differentiation, expressed at the onset of mineralization
DMP1 Expressed by terminally differentiated osteocytes
It is suggested to create pressed disks of the hydroxyapatite material to perform in-vitro studies.
Two methods could be used when pressing the disks, 1) calcine the powder HA material directly
from the reactor and use a circular die (roughly 14 mm diameter and 1 mm thick)46 using a
hydraulic or mechanical press (pressures may need to be experimented with to obtain a
120
mechanically stable disk) and 2) press the HA material directly from the reactor and then calcine
the material. The latter may form a macro-porous disk from the removal of the organics which
could create higher surface area for increased cell attachment. Once the scaffolds are created
MSCs should be cultured in an osteogenic medium including 50 µM ascorbic acid phosphate, 10
mM β-glycerophosphate, and 100 nM dexamethasone, replacing media three times every 7
days.46 Post cell culturing, total RNA extraction and RT-PCR performed to evaluate gene
expression for those listed in Table 7-1 following protocol from Cameron et al.46 Advantages
may arise between the variable phase mixtures (HA/TCP) produced through increased
calcination temperatures and therefore, it is suggested each temperature is to be carefully
considered for optimum performance in osteogenic differentiation. Further studies may also be
considered for protein drug delivery applications, following similar studies to that of Zhao et al.48
which has shown promising results based off of flower-like morphologies of HA materials
similar to those found with the HTL of wastewater-cultivated algae.
7.4 References
1. Roberts, G. W.; Fortier, M.-O. P.; Sturm, B. S. M.; Stagg-Williams, S. M., Promising Pathway for Algal Biofuels through Wastewater Cultivation and Hydrothermal Conversion. Energy & Fuels 2013, 27, (2), 857-867.
2. Roberts, G. W.; Sturm, B. S. M.; Hamdeh, U.; Stanton, G. E.; Rocha, A.; Kinsella, T. L.; Fortier, M.-O. P.; Sazdar, S.; Detamore, M. S.; Stagg-Williams, S. M., Promoting catalysis and high-value product streams by in situ hydroxyapatite crystallization during hydrothermal liquefaction of microalgae cultivated with reclaimed nutrients. Green Chem. 2015.
3. Fortier, M.-O. P.; Sturm, B. S. M., Geographic Analysis of the Feasibility of Collocating Algal Biomass Production with Wastewater Treatment Plants. Environmental Science & Technology 2012, 46, (20), 11426-11434.
4. Fortier, M.-O. P.; Roberts, G. W.; Stagg-Williams, S. M.; Sturm, B. S., Life cycle assessment of bio-jet fuel from hydrothermal liquefaction of microalgae. Applied Energy 2014, 122, 73-82.
121
5. Vardon, D. R.; Sharma, B. K.; Scott, J.; Yu, G.; Wang, Z.; Schideman, L.; Zhang, Y.; Strathmann, T. J., Chemical properties of biocrude oil from the hydrothermal liquefaction of Spirulina algae, swine manure, and digested anaerobic sludge. Bioresource Technology 2011, 102, (17), 8295-8303.
6. Huang, H.-j.; Yuan, X.-z.; Zhu, H.-n.; Li, H.; Liu, Y.; Wang, X.-l.; Zeng, G.-m., Comparative studies of thermochemical liquefaction characteristics of microalgae, lignocellulosic biomass and sewage sludge. Energy 2013, 56, 52-60.
7. Malins, K.; Kampars, V.; Brinks, J.; Neibolte, I.; Murnieks, R.; Kampare, R., Bio-oil from thermo-chemical hydro-liquefaction of wet sewage sludge. Bioresour Technol 2015, 187, 23-29.
8. Valdez, P. J.; Nelson, M. C.; Faeth, J. L.; Wang, H. Y.; Lin, X. N.; Savage, P. E., Hydrothermal liquefaction of bacteria and yeast monocultures. Energy & Fuels 2013, 28, (1), 67-75.
9. Lu, X.; Jordan, B.; Berge, N. D., Thermal conversion of municipal solid waste via hydrothermal carbonization: comparison of carbonization products to products from current waste management techniques. Waste Manag 2012, 32, (7), 1353-65.
10. He, C.; Giannis, A.; Wang, J.-Y., Conversion of sewage sludge to clean solid fuel using hydrothermal carbonization: Hydrochar fuel characteristics and combustion behavior. Applied Energy 2013, 111, 257-266.
11. Zhang, J.-h.; Lin, Q.-m.; Zhao, X.-r., The Hydrochar Characters of Municipal Sewage Sludge Under Different Hydrothermal Temperatures and Durations. Journal of Integrative Agriculture 2014, 13, (3), 471-482.
12. Sudasinghe, N.; Dungan, B.; Lammers, P.; Albrecht, K.; Elliott, D.; Hallen, R.; Schaub, T., High resolution FT-ICR mass spectral analysis of bio-oil and residual water soluble organics produced by hydrothermal liquefaction of the marine microalga Nannochloropsis salina. Fuel 2014, 119, 47-56.
13. Sudasinghe, N.; Cort, J. R.; Hallen, R.; Olarte, M.; Schmidt, A.; Schaub, T., Hydrothermal liquefaction oil and hydrotreated product from pine feedstock characterized by heteronuclear two-dimensional NMR spectroscopy and FT-ICR mass spectrometry. Fuel 2014, 137, 60-69.
14. Sanguineti, M. M.; Hourani, N.; Witt, M.; Sarathy, S. M.; Thomsen, L.; Kuhnert, N., Analysis of impact of temperature and saltwater on Nannochloropsis salina bio-oil production by ultra high resolution APCI FT-ICR MS. Algal Research 2015, 9, 227-235.
15. Yan, B.; Tao, L.-Z.; Liang, Y.; Xu, B.-Q., Sustainable Production of Acrylic Acid: Catalytic Performance of Hydroxyapatites for Gas-Phase Dehydration of Lactic Acid. ACS Catalysis 2014, 1931-1943.
16. Stošić, D.; Bennici, S.; Sirotin, S.; Calais, C.; Couturier, J.-L.; Dubois, J.-L.; Travert, A.; Auroux, A., Glycerol dehydration over calcium phosphate catalysts: Effect of acidic–basic features on catalytic performance. Applied Catalysis A: General 2012, 447-448, 124-134.
17. Maki-Arvela, P.; Simakova, I. L.; Salmi, T.; Murzin, D. Y., Production of lactic acid/lactates from biomass and their catalytic transformations to commodities. Chemical reviews 2014, 114, (3), 1909-71.

122
18. Blanco, E.; Delichere, P.; Millet, J. M. M.; Loridant, S., Gas phase dehydration of lactic acid to acrylic acid over alkaline-earth phosphates catalysts. Catalysis Today 2014, 226, 185-191.
19. Matsuura, Y.; Onda, A.; Yanagisawa, K., Selective conversion of lactic acid into acrylic acid over hydroxyapatite catalysts. Catalysis Communications 2014, 48, 5-10.
20. Tavan, Y.; Hosseini, S. H.; Ghavipour, M.; Khosravi Nikou, M. R.; Shariati, A., From laboratory experiments to simulation studies of methanol dehydration to produce dimethyl ether—Part I: Reaction kinetic study. Chemical Engineering and Processing: Process Intensification 2013, 73, 144-150.
21. Ozer, R.; Fagan, P. J.; Calvarese, T. G., Conversion of butanol to a reaction product comprising 2-ethylhexanol using hydroxyapatite catalysts. In Google Patents: 2013.
22. Fagan, P. J.; Calvarese, T. G.; Davis, R. J.; Ozer, R., Conversion of ethanol to a reaction product comprising 1-butanol using hydroxyapatite catalysts. In Google Patents: 2013.
23. Tsuchida, T.; Sakuma, S.; Takeguchi, T.; Ueda, W., Direct Synthesis ofn-Butanol from Ethanol over Nonstoichiometric Hydroxyapatite. Industrial & Engineering Chemistry Research 2006, 45, (25), 8634-8642.
24. Kozlowski, J. T.; Davis, R. J., Heterogeneous Catalysts for the Guerbet Coupling of Alcohols. ACS Catalysis 2013, 3, (7), 1588-1600.
25. Tsuchida, T.; Kubo, J.; Yoshioka, T.; Sakuma, S.; Takeguchi, T.; Ueda, W., Reaction of ethanol over hydroxyapatite affected by Ca/P ratio of catalyst. Journal of Catalysis 2008, 259, (2), 183-189.
26. Gruselle, M.; Kanger, T.; Thouvenot, R.; Flambard, A.; Kriis, K.; Mikli, V.; Traksmaa, R.; Maaten, B.; Tõnsuaadu, K., Calcium Hydroxyapatites as Efficient Catalysts for the Michael C–C Bond Formation. ACS Catalysis 2011, 1, (12), 1729-1733.
27. Ghantani, V. C.; Lomate, S. T.; Dongare, M. K.; Umbarkar, S. B., Catalytic dehydration of lactic acid to acrylic acid using calcium hydroxyapatite catalysts. Green Chemistry 2013, 15, (5), 1211.
28. Silvester, L.; Lamonier, J.-F.; Vannier, R.-N.; Lamonier, C.; Capron, M.; Mamede, A.-S.; Pourpoint, F.; Gervasini, A.; Dumeignil, F. Y., Structural, textural and acid-base properties of carbonates-containing hydroxyapatites. Journal of Materials Chemistry A 2014.
29. Diallo-Garcia, S.; Laurencin, D.; Krafft, J.-M.; Casale, S.; Smith, M. E.; Lauron-Pernot, H.; Costentin, G., Influence of Magnesium Substitution on the Basic Properties of Hydroxyapatites. The Journal of Physical Chemistry C 2011, 115, (49), 24317-24327.
30. Matsuura, Y.; Onda, A.; Ogo, S.; Yanagisawa, K., Acrylic acid synthesis from lactic acid over hydroxyapatite catalysts with various cations and anions. Catalysis Today 2014, 226, 192-197.
31. Silvester, L.; Lamonier, J.-F.; Faye, J.; Capron, M.; Vannier, R.-N.; Lamonier, C.; Dubois, J.-l.; Couturier, J.-l.; Calais, C.; Dumeignil, F. Y., Reactivity of Ethanol over Hydroxyapatite-Based Ca-enriched Catalysts with Various Carbonate Contents. Catalysis Science & Technology 2015.
32. Moeinpour, F.; Khojastehnezhad, A., Cesium carbonate supported on hydroxyapatite coated Ni 0.5 Zn 0.5 Fe 2 O 4 magnetic nanoparticles as an efficient and green catalyst for the synthesis of pyrano [2, 3-c] pyrazoles. Chinese Chemical Letters 2015.
123
33. Saffar-Teluri, A., Bovine Bone Derived Natural Nanocrystalline Hydroxyapatite Supported Boron Trifluoride: An Efficient, Recyclable and Eco-friendly Heterogeneous Catalyst for Diastereoselective Formation of α-Hydroxy-β-methoxyketones. Synthesis and Reactivity in Inorganic, Metal-Organic, and Nano-Metal Chemistry 2015, (just-accepted), 00-00.
34. Wang, Y.; Chen, B.-b.; Crocker, M.; Zhang, Y.-j.; Zhu, X.-b.; Shi, C., Understanding on the origins of hydroxyapatite stabilized gold nanoparticles as high-efficiency catalysts for formaldehyde and benzene oxidation. Catalysis Communications 2015, 59, 195-200.
35. Huang, C.; Ma, Z.; Xie, P.; Yue, Y.; Hua, W.; Gao, Z., Hydroxyapatite-supported rhodium catalysts for N 2 O decomposition. Journal of Molecular Catalysis A: Chemical 2015, 400, 90-94.
36. Oh, S. C. In Oxidative Coupling of Methane over Hydroxyapatite Catalysts, 24th North American Catalysis Society Meeting, 2015; Nam: 2015.
37. Wen, C.; Cui, Y.; Chen, X.; Zong, B.; Dai, W.-L., Reaction temperature controlled selective hydrogenation of dimethyl oxalate to methyl glycolate and ethylene glycol over copper-hydroxyapatite catalysts. Applied Catalysis B: Environmental 2015, 162, 483-493.
38. Kim, D.; Kim, Y.; Jung, K.; Choi, M. Y.; Park, M.; Lee, B. Y.; Kim, T. H.; Kwon, K. Y., Ruthenium‐Incorporated Hydroxyapatites for the Oxidation of Alcohols and Amines Using Molecular Oxygen as an Oxidant. Bulletin of the Korean Chemical Society 2015, 36, (1), 1-2.
39. Farooq, M.; Ramli, A., Biodiesel production from low FFA waste cooking oil using heterogeneous catalyst derived from chicken bones. Renewable Energy 2015, 76, 362-368.
40. Liu, K. J.; Yu, H. G. In Synthesis and Photocatalytic Activity of Silicon-Substituted Hydroxyapatite, Key Engineering Materials, 2015; Trans Tech Publ: 2015; pp 115-117.
41. Fan, K.; Yang, X.; Liu, J.; Rong, L., Effect of reducing coke of catalyst by La loading in hydrocracking of Jatropha oil. RSC Advances 2015.
42. Puértolas, B.; Mayoral, A.; Arenal, R.; Solsona, B.; Moragues, A. M.; Murcia-Mascaros, S.; Amoros, P.; Hungría, A. B.; Taylor, S. H.; Garcia, T., High Temperature Stable Gold Nanoparticle Catalysts for Application under Severe Conditions: The Role of TiO2 Nanodomains on Structure and Activity. ACS Catalysis 2015.
43. Heng, B. C.; Cao, T.; Stanton, L. W.; Robson, P.; Olsen, B., Strategies for directing the differentiation of stem cells into the osteogenic lineage in vitro. Journal of bone and mineral research : the official journal of the American Society for Bone and Mineral Research 2004, 19, (9), 1379-94.
44. Guo, H.; Su, J.; Wei, J.; Kong, H.; Liu, C., Biocompatibility and osteogenicity of degradable Ca-deficient hydroxyapatite scaffolds from calcium phosphate cement for bone tissue engineering. Acta biomaterialia 2009, 5, (1), 268-78.
45. Fathi, M. H.; Hanifi, A.; Mortazavi, V., Preparation and bioactivity evaluation of bone-like hydroxyapatite nanopowder. Journal of Materials Processing Technology 2008, 202, (1-3), 536-542.
46. Cameron, K.; Travers, P.; Chander, C.; Buckland, T.; Campion, C.; Noble, B., Directed osteogenic differentiation of human mesenchymal stem/precursor cells on silicate
124
substituted calcium phosphate. Journal of biomedical materials research. Part A 2013, 101, (1), 13-22.
47. Khan, A. F.; Saleem, M.; Afzal, A.; Ali, A.; Khan, A.; Khan, A. R., Bioactive behavior of silicon substituted calcium phosphate based bioceramics for bone regeneration. Materials science & engineering. C, Materials for biological applications 2014, 35, 245-52.
48. Zhao, X.-Y.; Zhu, Y.-J.; Chen, F.; Lu, B.-Q.; Wu, J., Nanosheet-assembled hierarchical nanostructures of hydroxyapatite: surfactant-free microwave-hydrothermal rapid synthesis, protein/DNA adsorption and pH-controlled release. CrystEngComm 2013, 15, (1), 206-212.

125
8 Concluding Remarks
The hydrothermal liquefaction of wet algae biomass presents promising results for
creating renewable fuels and chemicals to replace its petroleum counterparts, while reaching
towards federal goals of producing 36 billion gallons of renewable fuels by 2022. The work
presented in this dissertation substantially alleviates concerns for algae-based fuels and
chemicals in terms of sustainability and economics. This dissertation demonstrates municipal
wastewater is suitable for algae cultivation and provides multiple benefits, particularly achieving
advanced wastewater treatment and environmental remediation while cheaply cultivating
biomass. Combining hydrothermal liquefaction as part of the holistic strategy produces a
carbon-rich crude oil, with relatively similar properties to that of petroleum, alongside solid and
aqueous co-products. Algae cultivation with municipal wastewater results in relatively low (10
dw%) cellular oils and relatively large amounts of inorganic ash fraction (24-29 dw%) which is
composed largely of calcium and silicon. Post liquefaction, half of the algal carbon is partitioned
into the biocrude product, and the remainder is partitioned in a 20-20-10 (wt%) for solid, gas,
and aqueous fractions, respectively. A significant portion of the algal nitrogen (45 wt%) resides
in the aqueous product and almost all the algal phosphorus (95 wt%) accumulates into the solid
product. In terms of nutrient recovery and re-use, these numbers hold great significance, and
pose prospect in recovering future fertilizers from municipal wastewater.
The biocrude produced from hydrothermal liquefaction of wastewater-cultivated algae
has superior quality compared to many previous studies using fertilized monocultures, in terms
of heteroatoms (5-7 wt% oxygen) and energy content (39 MJ kg-1), while resulting in significant

126
amounts of aliphatics (straight and branched ) which can be used as direct fuels and lower order
aromatics (phenolics). The biocrude was shown to be comprised of 36 wt% direct fuel distillate
and have a higher limit distillate temperature of 600 °C, where 96 wt% of the biocrude boiled
below 600 °C. Macro-algae derived biocrude, compared to biocrude derived from micro-algae,
produced slightly less desirable oxygen content but much higher amounts of lower boiling point
compounds and aromatics and, while not quantified, had a much lower viscosity. Overall,
hydrothermal liquefaction of wastewater-cultivated macro-algae resulted in similar yields of
biocrude but with higher fraction of direct fuel distillates which would require more heteroatom
removal compared to micro-algae.
High production yields of solid product (29- 45 dw%) from the liquefaction of
wastewater-cultivated algae warranted extensive investigation, which lead to the discovery of
high-value product determination and a mechanistic understanding of the more desired biocrude
properties as compared to previous studies throughout the literature. It was determined that the
solid product consisted of highly substituted (silicon, magnesium, and carbonate) hydroxyapatite
hexagonal nano-rods which underwent hierarchical micro structuring into bundles, sheets, and
flower-like morphologies. The crystallization and presence of hydroxyapatite in the reactor
provided effective means of catalytic dehydration of fatty acid amides into methyl amine and
alkenes, while also providing necessary acid-base chemistries for cracking high boiling distillate
fractions. The substitutions within the crystal lattice provides mean for phase tunability with
tricalcium phosphate which can increase usability within the market place as either a primary
acid or base catalyst as well as contribute to the bioactivity as a medical scaffolding material.
Phase tunability studies indicated that residual organics within the hydroxyapatite are easily
127
removed and regenerate catalytically active intermediate Brønsted acid sites. Once the material
was fully transitioned into the tricalcium phosphate phase it was determined silicon substitutions
remained in the material.
Crystallization of hydroxyapatite directly from algae using hydrothermal liquefaction
represents a new value stream for traditional algae biofuel production. It was found a reasonably
small municipal wastewater treatment plant (serving population of ~80,000, with average flow of
12 million gallons per day) could produce up to 18 barrels of biocrude and 2000 kg of refined
pure phase substituted hydroxyapatite per day, while simultaneously reclaiming nitrogen and
phosphorous. Data suggests that a commercial scale hydrothermal liquefaction plant can now
have the ability to synthesize a catalyst within the process, utilize its catalytic ability in-situ and
upon regeneration, produce a high-value product stream.
This novel approach for creating high-value product streams from water reclamation
sources can have significant impacts to tax payer dollars, creating profit for a traditionally
regulatory industry while contributing to biofuels, green catalysis, and medicine. These findings
provide the basis for new developments in algae-based fuels, chemicals, and bioproducts at both
the fundamental and macro commercialization levels, where the full impacts into heterogeneous
catalysis and tissue engineering applications are widely unknown.