Embed Size (px)
Citation preview

J O U R N A L O F P R O T E O M I C S 7 1 ( 2 0 0 8 ) 5 6 1 – 5 7 1
ava i l ab l e a t www.sc i enced i rec t . com
www.e l sev i e r. com/ loca te / j p ro t
Aldehyde dehydrogenase 1A1 and gelsolin identified as novelinvasion-modulating factors in conditioned medium ofpancreatic cancer cells
Naomi Walsh⁎,1, Paul Dowling1, Norma O'Donovan, Michael Henry,Paula Meleady, Martin ClynesNational Institute for Cellular Biotechnology, Dublin City University, Glasnevin, Dublin 9, Ireland
A R T I C L E D A T A
⁎ Corresponding author. Fax: +353 7005484.E-mail address: [email protected] (N. W
1 Authors contributed equally.
1874-3919/$ – see front matter © 2008 Elsevidoi:10.1016/j.jprot.2008.09.002
A B S T R A C T
Article history:Received 30 April 2008Accepted 16 September 2008
Conditioned medium (CM) from clonal sub-populations of the pancreatic cancer cell line,MiaPaCa-2 with differing invasive abilities, were examined for their effect on in vitroinvasion. Conditionedmedium from Clone #3 (CM#3) strongly promoted invasion, while CMfrom Clone #8 (CM#8) inhibited invasion in vitro. 2D DIGE followed by MALDI–TOF MSanalysis of CM#3 and CM#8 identified 41 proteins which were differentially regulated; 27proteins were down-regulated and 14 proteins up-regulated in the invasion-promotingCM#3 when compared to CM#8. Western blotting analysis confirmed the down-regulatedexpression of gelsolin and the up-regulation of aldehyde dehydrogenase 1A1 in CM#3.Down-regulation of aldehyde dehydrogenase 1A1 in Clone #3 CM and gelsolin levels inClone #8 CM by siRNA transfection revealed an important involvement of these proteins inpromoting and inhibiting invasion in these pancreatic cancer cell lines.
© 2008 Elsevier B.V. All rights reserved.
Keywords:ALDH1A1GSNPancreatic cancerInvasionConditioned media2D DIGE MALDI–TOF MS
1. Introduction
Pancreatic cancer is one of the most lethal cancers and is the8th leading cause of cancer-related deaths in Europe [1].Pancreatic cancer is associatedwith poor prognosis, the rate ofmortality being similar to that of the rate of incidence.
All-stage 5-year survival rate is less than 5% [2,3]. Conven-tional approaches including, surgery, radiation, chemotherapyand combinations of these therapies, have had little effect onthe survival rate of patients diagnosed with pancreatic cancer.Pancreatic cancer appears to be inherently resistant to a widevariety of chemotherapeutic agents, which can differ greatlyand are unrelated with respect to molecular structure andtarget specificity. The malignant progression, invasion andmetastasis of this cancer are complex and poorly understood.In this study, we investigated the proteomic profile of proteinsfrom the conditioned media of two sub-clones of a pancreatic
alsh).
er B.V. All rights reserved
cancer cell line with varying in vitro invasive characteristics.Proteins released by pancreatic tumour cellsmay be detectablein bodily fluids such as urine, blood, serum and pancreaticductal juice. Such proteins could be useful in early diagnosis,monitoring and perhaps even molecular classification ofpancreatic tumours [4]. Proteomic analyses of pancreatictissue, pancreatic juice as well as blood plasma and sera havebeen reported [5]. The main biomarker currently available forpancreatic cancer detection, CA19-9, has been demonstratedto be quite sensitive and specific in the diagnosis of thismalignancy [6,7], however, this marker is not fully specific asfalse-positive or false-negative findings occur in patients withother gastrointestinal malignancies and also in patients withbenign disease, particularly when associated with obstructivejaundice or cirrhosis, whichmay contribute to late diagnosis ofpancreatic cancer. Approximately 10% of the population withthe Lewis negative genotype are not able to produce CA 19-9,
.

562 J O U R N A L O F P R O T E O M I C S 7 1 ( 2 0 0 8 ) 5 6 1 – 5 7 1
due to a deficiency in a fucosyltransferase specified by the Legene that is involved in its synthesis [8]. Therefore, in a sub-setof patients, CA 19-9 expression will be falsely low even in thepresence of advanced pancreatic cancer [9].
We previously isolated sub-clones of the human pancreaticadenocarcinoma cell line, MiaPaCa-2. This cell line waschosen as it displays modest invasion through matrigel, andcould be easily cultured as single cell colonies. Two sub-clones, Clone #3 and Clone #8 displayed the largest differencesin invasion compared to the parental cell line andwere chosenfor further analysis.
In this study, we compared proteins in the conditionedmedia of highly and poorly invasive sub-clones of thepancreatic cancer cell line, MiaPaCa-2, and identified manynovel up-regulated and down-regulated proteins in ourmodel.Furthermore, we investigated the functional role of aldehydedehydrogenase 1A1 and gelsolin in invasion by siRNA analysisand determined that these proteins may have a novel role inthe invasive phenotype of pancreatic cancer.
Fig. 1 –A. Invasion assays of Clone #3 under control conditions aB. Invasion assays of Clone #8 under control conditions and contaof invading cells was determined by counting the number of cellaverage number of cells per field was then multiplied by a factormagnification (calibrated using a microscope graticule)). Insert: Cdetermined by elution of insertswith 0.33% acetic acid and spectrin triplicate. Statistics; *p≤0.05, **p≤0.01, ***p≤0.005 Student's t-t
2. Materials and methods
2.1. Cell lines
Thehumanpancreatic cell lineMiaPaCa-2wasobtained fromtheEuropean Collection of Cell Cultures (ECACC, UK). BxPc-3, Panc-1and AsPc-1 human pancreatic cancer cell lines were obtainedfromtheAmericanTypeCultureCollection (ATCC,Rockville,MD,USA). Clone #3 and Clone #8were obtained by single cell dilutionin this laboratory. Briefly the parental cell line, MiaPaCa-2 wasdiluted to a concentration of 3 cells/ml and 100 µl plated ontoeach well of a 96-well plate. After 24 h each well was studied forsingle cells, and allowed to grow into colonies. The colonieswerethen screened by invasion assay to assess their invasive abilities.Cells were maintained in a humidified atmosphere containing5% CO2 at 37 °C in DMEM supplemented with 5% FCS (Sigma-Aldrich). All cell lines were free fromMycoplasma as tested withthe indirect Hoechst staining method.
nd containing CM#3 and CM#8 in the invasion insert.ining CM#3 and CM#8 in the invasion insert. The total numbers per field in 10 random fields, at 200× magnification. Theof 140 (growth area of membrane/field area viewed at 200×olorimetric relative quantification of invading cells was alsoophotometrically quantified. All experimentswere performedest.

Fig. 2 –Protein expression map (PEM) of differentiallyregulated proteins in the comparison of CM#3 versus CM#8.All protein numbers correspond to Tables 1 and 2.
563J O U R N A L O F P R O T E O M I C S 7 1 ( 2 0 0 8 ) 5 6 1 – 5 7 1
2.2. Collection of pancreatic cancer cell line-conditionedmedia
Clone #3 and Clone #8 monolayers were cultured in T175 cm3
flasks until approximately 60% confluent in culture medium.Cells were then washed 3× with serum free (SF) DMEM andincubated for 1 hwith SF DMEM. Cells werewashed 3× again inSF DMEM, then placed in SF DMEM for 72 h. At the timeof collection, cellular debris was removed by centrifugationand filtration through a 0.22 µm filter; aliquots were frozenat −80 °C until analysed.
2.3. Invasion assays
Invasionassayswere performedusing anadaptedmethod [10].Matrigel was diluted to 1 mg/ml in serum free DMEM. 100 µl ofmatrigel was placed into each insert (Falcon) (8.0 µm pore size)in a 24-well plate (Costar). The coated inserts were incubatedovernight at 4 °C. The following day, the matrigel was allowedto polymerise at 37 °C for 1 h. The inserts were then washedwith DMEM, 100 µl of 1×10⁵/100 µl cells in complete DMEM and100 µl of CM supplementedwith 5% serumwas added onto theinsert. 250 µl of total DMEM:250 µl CM supplemented with 5%serum was added to the 24-well plate. After 24 h incubation,the inside of the insert was wiped with a wet cotton swab. Theunder surface was gently rinsed with PBS and stained with0.25% crystal violet for 10 min, rinsed again with sterile waterand allowed to dry. To determine the total number of invadingcells, the inserts were then viewed under the microscope andthe number of cells per field in 10 random fields, were countedat 200× magnification. The average number of cells per fieldwas then multiplied by a factor of 140 (growth area ofmembrane/field area viewed at 200×magnification (calibratedusing a microscope graticule)). Colorimetric quantification ofinvasion was determined by eluting the crystal violet stainsolution with 33% acetic acid extraction buffer and theabsorbance was read with a Bio-Tek plate reader (BectonDickinson Labware) at 570 nm and a reference wavelength of620 nm. The mean values were obtained from a minimum ofthree individual experiments andwere subjected to t-tests. Allexperiments were performed in triplicate.
2.4. Sample preparation and protein labelling
Six individual 50 ml samples for both CM#3 and CM#6(biological replicates and technical replicates/CM of cell line)were concentrated using a 10,000 molecular weight cut-off(Millipore); samples were cleaned-up using a ready-prep 2Dclean-up kit (Bio-Rad). Protein concentration was determinedusing the BCA protein assay kit (Bio-Rad). CM samples werelabelled with N-hydroxy succinimidyl ester-derivatives of thecyanine dyes Cy2, Cy3 and Cy5 [11]. Typically, 50 µg of the CMwas minimally labelled with 200 pmol of either Cy3 or Cy5 forcomparison on the same 2-D gel. Labelling reactions wereperformed on ice in the dark for 30 min and then quenchedwith a 50-fold molar excess of free lysine to dye for 10 min onice. A pool containing equal amounts of all samples was alsoprepared and labelled with Cy2 to be used as a standard on allgels to aid image matching and cross-gel statistical analysis.The Cy3 and Cy5 reverse labelling reactions (50 µg of each)
from each CM sample were mixed and run on the same gelswith an equal amount (50 µg) of Cy2-labelled standard.
2.5. Protein separation by 2-DE and gel imaging
Immobilised 24 cm linear pH gradient (IPG) strips, pH 3–11,were rehydrated in rehydration buffer (7 M urea, 2 M thiourea,4%CHAPS, 0.5% IPG buffer, 50mMDTT) overnight, according tomanufacturer guidelines. IEF was performed using an IPGphorapparatus (GE Healthcare) for 40 kV/h at 20 °C with resistanceset at 50mA. Stripswere equilibrated for 20min in 50mMTris-HCL, pH 8.8, 6 M urea, 30% v/v glycerol, 1% w/v SDS containing65 mM DTT and then for 20 min in the same buffer containing240 mM iodoacetamide. Equilibrated IPG strips were trans-ferred onto 18×20 cm 12.5% uniform polyacrylamide gelspoured between low fluorescence glass plates. Strips wereoverlaid with 0.5% w/v low melting point agarose in runningbuffer containingbromophenol blue. Gelswere runat 2.5W/gelfor 30 min and then 100 W total at 10 °C. All the images werecollected on a Typhoon 9400 Variable Mode Imager (GEHealthcare). Statistics and quantification of protein expressionwere carried out in DeCyder software (GE Healthcare).
2.6. Spot digestion and MALDI–TOF analysis
Excision of protein spots, trypsin digestion and proteinidentification by MS analysis using an Ettan MALDI–TOF Pro(GE Healthcare) were performed. Preparative gels containing300 µg of protein were fixed in 30% v/v methanol, 7.5% v/vacetic acid overnight and washed in water, and total proteinwas detected by post-staining with CBB and Deep purple stain(Molecular Probes) for 3 h at room temperature. Excess dyewas removed bywashing twice inwater, and gels were imagedusing a Typhoon 9400 VariableMode Imager (GE Healthcare) at

564 J O U R N A L O F P R O T E O M I C S 7 1 ( 2 0 0 8 ) 5 6 1 – 5 7 1
the appropriate excitation and emission wavelengths for thestain. The subsequent gel image was imported into the BVAmodule of DeCyder software and was matched to imagesgenerated from DIGE analysis. Spots of interest were selectedand confirmed using this software for subsequent pickingusing an Ettan Spot Picker. Gel plugs were placed into apresiliconised 1.5 ml plastic tube for destaining, desalting andwashing steps. The remaining liquid above the gel plugs wasremoved and sufficient ACN was added in order to cover thegel plugs. Following shrinkage of the gel plugs, ACN wasremoved and the protein containing gel pieces were rehy-drated for 5 min with a minimal volume of 100 mMammonium bicarbonate. An equal volume of ACN wasadded, and after 15 min of incubation the solution was
Table 1 – 2D DIGE and MALDI–TOF MS identification of down-rClone #3
No. Protein name Genesymbol
Protein ACnumber
1 Gelsolin isoform b (a) GSN gi|38044288|
2 Gelsolin isoform b (b) GSN gi|38044288|
3 Gelsolin isoform b (c) GSN gi|38044288|
4 Gelsolin isoform b (f) GSN gi|38044288|
5 Gelsolin isoform b (d) GSN gi|38044288|
6 Gelsolin isoform b (g) GSN gi|38044288|
7 Gelsolin (amyloidosis: Finnish type) GSN gi|55960299|
8 Pro-MMP-2TIMP2 complex TIMP2 gi|22218678|9 Beta actin (a) ACTB gi|15277503|
10 Nucleoside-diphosphate kinase 2isoform
NDPK2 gi|66392203|
11 Beta actin (c) ACTB gi|15277503|
12 Proteasome activator reg (alpha) PSME1 gi|2780883|
13 Beta actin (b) ACTB gi|15277503|
14 Heat shock protein 90-alpha(HSP86)
HSP86 gi|92090606|
15 Phosphoglycerate kinase 1 (a) PGK1 gi|48145549|16 Thioredoxin peroxidase PRDX2 gi|9955016|17 Phosphoglycerate kinase 1 (b) PGK1 gi|48145549|18 Phosphoglycerate kinase 1 (c) PGK1 gi|48145549|19 Heat shock 70 kDa protein 8
isoform 2 (b)HSPA8 gi|62896815|
20 Beta actin (d) ACTB gi|15277503|
21 NM23-H1 NME1 gi|29468184|22 Triosephosphate isomerase TPI1 gi|999893|23 Heat shock 70 kDa protein 8
isoform 2 (a)HSPA8 gi|62896815|
24 S-adenosylhomocysteinehydrolase
AHCY gi|178277|
25 Malate dehydrogenase cytosolic MDH1 gi|7431153|26 Heat shock 70 kDa protein 8
isoform 2 variant (c)HSPA8 gi|62896815|
27 Nucleoside phosphorylase NP gi|58176568|
removed from the gel plugs and the samples were dried for30 min using a vacuum centrifuge. Individual gel pieces werethen rehydrated in digestion buffer (12.5 ng trypsin per μl of10% ACN, 40 mM ammonium bicarbonate) to cover the gelpieces. Exhaustive digestion was carried out overnight at37 °C. After digestion, the samples were centrifuged at12,000 ×g for 10 min using a bench top centrifuge. Thesupernatant was carefully removed from each sample andplaced into clean plastic tubes. Samples were stored at −80 °Cuntil analysed by M.S. For spectrometric analysis, mixtures oftryptic peptides from individual samples were desalted usingMillipore C-18 Zip-Tips (Millipore) and eluted onto the sampleplate with the matrix solution (5 mg/ml CHCA in 50% ACN/0.1% TFA v/v). Mass spectra were recorded using the MALDI–
egulated proteins in the conditioned media of the invasive
TheoreticalpI/Mw
%Coverage
Foldchange
Molecular function
5.6/80.9 17.9 −21.0⁎⁎⁎ Structural constituent of thecytoskeleton
5.6/80.9 24.4 −15.2⁎⁎⁎ Structural constituent of thecytoskeleton
5.6/80.9 18.6 −10.7⁎⁎⁎ Structural constituent of thecytoskeleton
5.6/80.9 15.2 −6.4⁎⁎⁎ Structural constituent of thecytoskeleton
5.6/80.9 18.3 −3.8⁎⁎⁎ Structural constituent of thecytoskeleton
5.6/80.9 18.5 −3.4⁎⁎⁎ Structural constituent of thecytoskeleton
5.9/86.0 9.5 −2.5⁎⁎⁎ Structural constituent of thecytoskeleton
6.5/22.4 30.9 −1.8⁎⁎⁎ ECM structural constituent5.6/40.5 36.6 −1.7⁎⁎⁎ Structural constituent of the
cytoskeleton9.3/30.5 21.7 −1.7⁎⁎ Transcription factor activity
5.6/40.5 24.4 −1.6⁎⁎⁎ Structural constituent of thecytoskeleton
7.1/16.3 44.3 −1.5⁎⁎⁎ Ubiquitin-specific proteaseactivity
5.6/40.5 24.2 −1.5⁎⁎⁎ Structural constituent of thecytoskeleton
4.9/85.0 24.5 −1.5⁎⁎⁎ Chaperone activity
8.6/44.9 25.7 −1.4⁎⁎⁎ Catalytic activity5.7/21.6 28.4 −1.4⁎⁎⁎ Peroxidase activity8.6/44.9 25.7 −1.4⁎⁎⁎ Catalytic activity8.6/44.9 27.3 −1.4⁎⁎⁎ Catalytic activity5.6/53.6 16.8 −1.3⁎⁎⁎ Heat shock protein activity
5.6/40.5 27.3 −1.3⁎⁎⁎ Structural constituent of thecytoskeleton
5.4/19.8 27.1 −1.3⁎⁎⁎ Catalytic activity6.5/26.8 29.0 −1.3⁎⁎⁎ Isomerase activity5.6/53.6 28.8 −1.3⁎⁎⁎ Heat shock protein activity
6.0/48.2 10.6 −1.3⁎⁎⁎ Hydrolase activity
5.9/36.6 20.1 −1.2⁎⁎⁎ Catalytic activity5.6/53.6 19.7 −1.2⁎⁎⁎ Heat shock protein activity
6.5/32.2 36.1 −1.2⁎⁎⁎ Phosphorylase activity
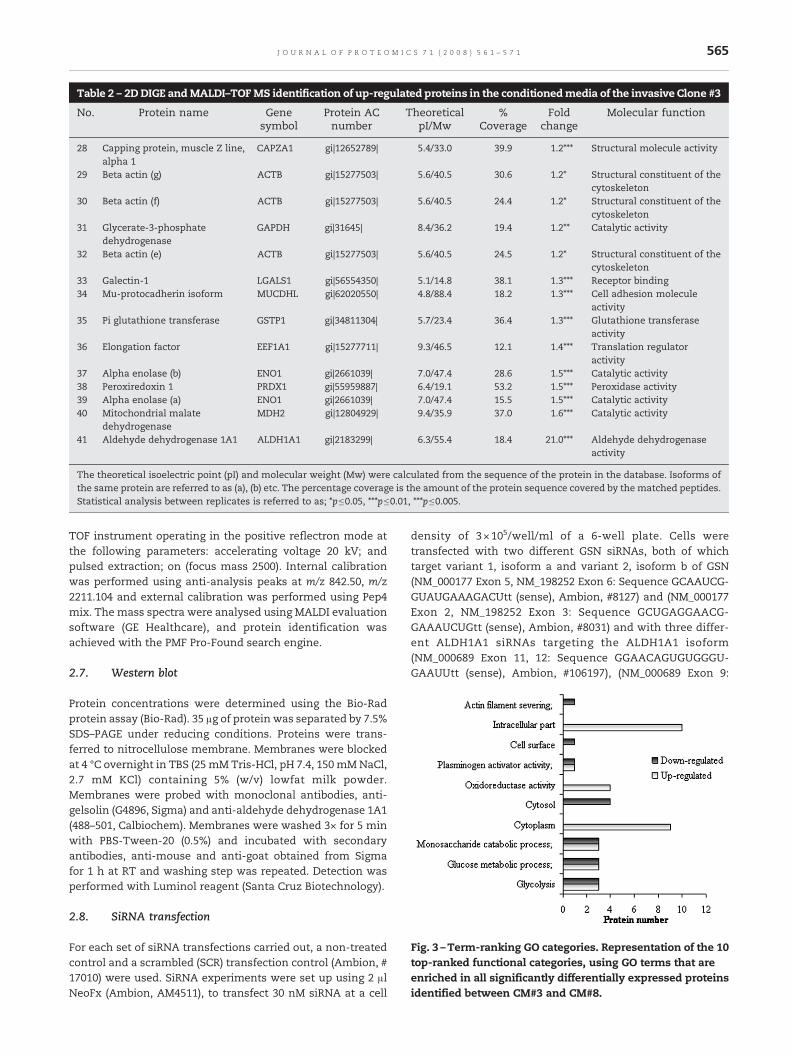
Table 2 – 2DDIGE andMALDI–TOFMS identification of up-regulated proteins in the conditionedmedia of the invasive Clone #3
No. Protein name Genesymbol
Protein ACnumber
TheoreticalpI/Mw
%Coverage
Foldchange
Molecular function
28 Capping protein, muscle Z line,alpha 1
CAPZA1 gi|12652789| 5.4/33.0 39.9 1.2⁎⁎⁎ Structural molecule activity
29 Beta actin (g) ACTB gi|15277503| 5.6/40.5 30.6 1.2⁎ Structural constituent of thecytoskeleton
30 Beta actin (f) ACTB gi|15277503| 5.6/40.5 24.4 1.2⁎ Structural constituent of thecytoskeleton
31 Glycerate-3-phosphatedehydrogenase
GAPDH gi|31645| 8.4/36.2 19.4 1.2⁎⁎ Catalytic activity
32 Beta actin (e) ACTB gi|15277503| 5.6/40.5 24.5 1.2⁎ Structural constituent of thecytoskeleton
33 Galectin-1 LGALS1 gi|56554350| 5.1/14.8 38.1 1.3⁎⁎⁎ Receptor binding34 Mu-protocadherin isoform MUCDHL gi|62020550| 4.8/88.4 18.2 1.3⁎⁎⁎ Cell adhesion molecule
activity35 Pi glutathione transferase GSTP1 gi|34811304| 5.7/23.4 36.4 1.3⁎⁎⁎ Glutathione transferase
activity36 Elongation factor EEF1A1 gi|15277711| 9.3/46.5 12.1 1.4⁎⁎⁎ Translation regulator
activity37 Alpha enolase (b) ENO1 gi|2661039| 7.0/47.4 28.6 1.5⁎⁎⁎ Catalytic activity38 Peroxiredoxin 1 PRDX1 gi|55959887| 6.4/19.1 53.2 1.5⁎⁎⁎ Peroxidase activity39 Alpha enolase (a) ENO1 gi|2661039| 7.0/47.4 15.5 1.5⁎⁎⁎ Catalytic activity40 Mitochondrial malate
dehydrogenaseMDH2 gi|12804929| 9.4/35.9 37.0 1.6⁎⁎⁎ Catalytic activity
41 Aldehyde dehydrogenase 1A1 ALDH1A1 gi|2183299| 6.3/55.4 18.4 21.0⁎⁎⁎ Aldehyde dehydrogenaseactivity
The theoretical isoelectric point (pI) and molecular weight (Mw) were calculated from the sequence of the protein in the database. Isoforms ofthe same protein are referred to as (a), (b) etc. The percentage coverage is the amount of the protein sequence covered by the matched peptides.Statistical analysis between replicates is referred to as; ⁎p≤0.05, ⁎⁎⁎p≤0.01, ⁎⁎⁎p≤0.005.
Fig. 3 –Term-ranking GO categories. Representation of the 10top-ranked functional categories, using GO terms that areenriched in all significantly differentially expressed proteinsidentified between CM#3 and CM#8.
565J O U R N A L O F P R O T E O M I C S 7 1 ( 2 0 0 8 ) 5 6 1 – 5 7 1
TOF instrument operating in the positive reflectron mode atthe following parameters: accelerating voltage 20 kV; andpulsed extraction; on (focus mass 2500). Internal calibrationwas performed using anti-analysis peaks at m/z 842.50, m/z2211.104 and external calibration was performed using Pep4mix. The mass spectra were analysed using MALDI evaluationsoftware (GE Healthcare), and protein identification wasachieved with the PMF Pro-Found search engine.
2.7. Western blot
Protein concentrations were determined using the Bio-Radprotein assay (Bio-Rad). 35 µg of protein was separated by 7.5%SDS–PAGE under reducing conditions. Proteins were trans-ferred to nitrocellulose membrane. Membranes were blockedat 4 °C overnight in TBS (25mM Tris-HCl, pH 7.4, 150mMNaCl,2.7 mM KCl) containing 5% (w/v) lowfat milk powder.Membranes were probed with monoclonal antibodies, anti-gelsolin (G4896, Sigma) and anti-aldehyde dehydrogenase 1A1(488–501, Calbiochem). Membranes were washed 3× for 5 minwith PBS-Tween-20 (0.5%) and incubated with secondaryantibodies, anti-mouse and anti-goat obtained from Sigmafor 1 h at RT and washing step was repeated. Detection wasperformed with Luminol reagent (Santa Cruz Biotechnology).
2.8. SiRNA transfection
For each set of siRNA transfections carried out, a non-treatedcontrol and a scrambled (SCR) transfection control (Ambion, #17010) were used. SiRNA experiments were set up using 2 µlNeoFx (Ambion, AM4511), to transfect 30 nM siRNA at a cell
density of 3×10⁵/well/ml of a 6-well plate. Cells weretransfected with two different GSN siRNAs, both of whichtarget variant 1, isoform a and variant 2, isoform b of GSN(NM_000177 Exon 5, NM_198252 Exon 6: Sequence GCAAUCG-GUAUGAAAGACUtt (sense), Ambion, #8127) and (NM_000177Exon 2, NM_198252 Exon 3: Sequence GCUGAGGAACG-GAAAUCUGtt (sense), Ambion, #8031) and with three differ-ent ALDH1A1 siRNAs targeting the ALDH1A1 isoform(NM_000689 Exon 11, 12: Sequence GGAACAGUGUGGGU-GAAUUtt (sense), Ambion, #106197), (NM_000689 Exon 9:

566 J O U R N A L O F P R O T E O M I C S 7 1 ( 2 0 0 8 ) 5 6 1 – 5 7 1
Sequence GGAGUGUUGAGCGGGCUAAtt (sense), Ambion,#106196), and (NM_000689 Exon 4: Sequence GGGCCGUA-CAAUACCAAUUtt (sense), Ambion, #106195). After 32 h, themedia were removed, washed 3× in SF DMEM and 1 ml of SFDMEM was added onto the cells. The effects of siRNAsilencing were analysed on the SF CM after 48 and 72 h.SiRNA transfected SF CM was collected, centrifuged andfiltered through a 0.22 µm filter. SiRNA transfected SF CMwasconcentrated using 10,000 molecular weight cut-off concen-trators (Millipore); samples were cleaned-up using a ready-prep 2D clean-up kit (Bio-Rad) and protein concentration wasdetermined using the BCA protein assay kit (Bio-Rad).Western blot analysis was then carried out to assess efficienttransfection. All experiments were repeated in triplicate.
2.9. Statistical analysis
Student's t-test was used to identify the difference in meanvalues between treated and non-treated samples. In siRNAexperiments, siRNA scrambled transfected cells were used ascontrol compared to siRNA treated samples. This was to
Fig. 4 –A.Western blot of two independent target siRNA-GSN knocloading between the samples. B. Invasion assay of Clone #8 cellssiRNA, CM#8 treated with GSN-siRNA (1) and CM#8 treated withdetermined by counting the number of cells per field in 10 randomfield was thenmultiplied by a factor of 140 (growth area of memba microscope graticule)). Insert: Colorimetric relative quantificatiowith 0.33% acetic acid and spectrophotometrically quantified. Exp***p≤0.005.
ensure no ‘off-target’ effects of the transfection procedure.Non-treated controls were used to ensure scrambled siRNAwas having no effects and to normalise data. A p value of≤0.05⁎ was deemed significant, p value≤0.01⁎⁎ was deemedmore significant, and p value≤0.005⁎⁎⁎ was deemed highlysignificant.
3. Results
3.1. Factors in conditioned medium alter invasive abilitiesof pancreatic cancer cell lines
CM#3 enhanced invasion of Clone #3 by 1.8-fold (p=0.0008)compared to an invasion assay control containing freshmedium. Clone #3 containing CM#8 in the invasion assayshowed a 3.33-fold decrease in invasion (pb0.001) (Fig. 1A).Fig. 1B shows that CM#3 significantly increased the invasion(4.2-fold (p=0.005)) of Clone #8 compared to an invasion assaycontrol containing fresh medium. CM#8 caused a very slight(1.1-fold) decrease in invasion of Clone #8 (p=0.7).
kdowns in CM#8. Bip antibodywas used to demonstrate evenwith the addition of CM#8 untreated control, CM#8 scrambledGSN-siRNA (2) (n=3). The total number of invading cells wasfields, at 200×magnification. The average number of cells perrane/field area viewed at 200×magnification (calibrated usingn of invading cells was also determined by elution of insertseriments performed in triplicate. Statistics; *p≤0.05, **p≤0.01,

567J O U R N A L O F P R O T E O M I C S 7 1 ( 2 0 0 8 ) 5 6 1 – 5 7 1
3.2. Proteomic analysis of CM#3 and CM#8 by 2-D DIGEMALDI–TOF MS
Proteins found in CM#3 and CM#8 were analysed by 2-DDIGE. Triplicate biological repeats were reverse labelled withCy3 and Cy5 dyes. All samples used in the experiment werepooled and labelled with the internal dye, Cy2. Each samplewas compared internally to the same standard, to accountfor any gel-to-gel variation. DeCyder image analysis mergedthe Cy2, Cy3 and Cy5 images for each gel and detected spotboundaries for the calculation of normalised protein abun-dance. All paired images were then matched to generatecomparative cross-gel statistical analysis. Biological varia-tion analysis of these spots showing greater than 1.2-foldchange in expression with a t-test score of b0.05, revealed 41proteins significantly differentially regulated between CM#3versus CM#8. Protein expression maps (PEM) of all identifiedproteins are shown in Fig. 2 (position number corresponds to
Fig. 5 –A. Western blot of ALDH1A1 knockdown in CM#3 untreat(2) and siRNA ALDH1A1 (3). B. Invasion assay of Clone #3 with adsiRNA, CM#3 treated with ALDH1A1 siRNA (1), CM#3 treated with(3) (n=3). The total number of invading cells was determined by200×magnification. The average number of cells per field was thearea viewed at 200× magnification (calibrated using a microscopinvading cells was also determine by elution of inserts with 0.33%number of invading cells were stained with 0.25% crystal violet,quantified, to determine the relative number of invading cells. Exbar, 200μm. Statistics; *p≤0.05, **p≤0.01, ***p≤0.005.
Tables 1 and 2). For protein identification, all proteins weredigested and identified at least twice from separate gelswith MALDI–TOF MS. An expectation value of b0.002 wasused for all reported identifications, which indicates a 0.2%chance that the identification is random. Table 1 outlinesthe down-regulated proteins in CM#3 compared to CM#8 andTable 2 shows the proteins up-regulated in CM#3 comparedto CM#8.
3.3. Gene ontology enrichment analysis
Using DAVID gene ID tool software (http://david.abcc.ncifcrf.gov), all the proteins differentially regulated in our modelwere converted to their gene IDs. Gene ontology (GO STAT)(http://gostat.wehi.edu.au/cgi-bin/goStat.pl) was then usedto classify the proteins and their corresponding genes intogene categories. Enrichment of a particular ontology term,for significantly expressed genes in response to the process
ed control, scrambled, siRNA ALDH1A1 (1), siRNA ALDH1A1dition of CM#3 media (control), CM#3 media with scrambledALDH1A1 siRNA (2), CM#3 treated with ALDH1A1 siRNA
counting the number of cells per field in 10 random fields, atnmultiplied by a factor of 140 (growth area ofmembrane/fielde graticule)). Insert: Colorimetric relative quantification ofacetic acid and spectrophotometrically quantified. The total
eluted with 0.33% acetic acid and spectrophotometricallyperiments performed in triplicate. Magnification, 200×. Scale

568 J O U R N A L O F P R O T E O M I C S 7 1 ( 2 0 0 8 ) 5 6 1 – 5 7 1
under study, means that the ontology term is likely to beinvolved in the process. In our study, the process refers tofactors involved in invasion of pancreatic cancer. Using theover-expression function of the software and false discoveryrate (Benjamini) statistics, 30 GO terms were found signifi-cantly enriched in both the up-regulated and down-regu-lated proteins list in CM#3 versus CM#8. The “glycolysis”term achieved the highest degree of significance in both theup-regulated and down-regulated gene class (p=0.005,p=0.001). In the up-regulated class, “cytoplasm” (p=0.01),“oxidoreductase activity” (p=0.01) and “intracellular part”—(including cytoplasmic and nucleus proteins) (p=0.03) werehighly significant terms. In the down-regulated class,“cytosol”—(no membranous or subcellular components)(p=0.007), and “actin filament severing” (p=0.03) were alsosignificantly enhanced. Fig. 3 outlines the top ten rankedfunctional categories using GO terms in the differentiallyexpressed proteins in the pancreatic cancer model.
3.4. Invasion inhibitory role of GSN by siRNA in CM#8
GSN, a down-regulated protein in CM#3 compared to CM#8 wasanalysed to assess its functional involvement in pancreatic
Fig. 6 –A.Western blot of GSN and ALDH1A1 expression in pancrused as loading control. B. Invasion assay of BxPc-3, Panc-1 and Acounting the number of cells per field in 10 random fields, at 200×multiplied by a factor of 140 (growth area of membrane/field areagraticule)). Insert: Colorimetric relative quantification of invadingacetic acid and spectrophotometrically quantified. Experiments p
cancer cell invasion. Fig. 4A shows the successful knockdownofGSN in CM#8 by two independent siRNA targets relative tocontrol (untreated) and siRNA scrambled CM#8. The addition ofCMfromClone#8GSN-siRNA (1) ontoClone#8cells significantlyincreased the invasive abilities of the cells by 1.3 fold (p=0.01).CM fromGSN-siRNA (2) treated Clone #8 cells onto Clone #8 alsoincreased the invasiveness of the cells 1.5 fold (p=0.2) (Fig. 4B).
3.5. Invasion enhancement role of ALDH1A1 by siRNA inCM#3
ALDH1A1, which is up-regulated in CM#3 compared to CM#8,was knocked down in Clone #3 to assess its functional role inpancreatic cancer cell invasion. Fig. 5A shows the efficientknock down of ALDH1A1 in CM#3 by three independentsiRNAs. CM from ALDH1A1-siRNA treated Clone #3 cells wasadded into the invasion assay of Clone #3. Reduction ofALDH1A1 expression resulted in a significant decrease ininvasion of Clone #3. CM#3 ALDH1A1-siRNA (1) on Clone #3reduced invasion 4.2-fold (p=0.01), ALDH1A1 siRNA (2)decreased invasion 2.7-fold (p=0.003) and ALDH1A1 siRNA (3)also significantly reduced the invasive abilities of Clone #3 2.5-fold (p=0.02), compared to the scrambled control (Fig. 5B).
eatic cancer cell lines, BxPc-3, Panc-1 and AsPc-1. β-actin wassPc-1. The total number of invading cells was determined bymagnification. The average number of cells per fieldwas thenviewed at 200× magnification (calibrated using a microscopecells was also determined by elution of inserts with 0.33%erformed in triplicate.

569J O U R N A L O F P R O T E O M I C S 7 1 ( 2 0 0 8 ) 5 6 1 – 5 7 1
3.6. GSN and ALDH1A1 expression in panel of pancreaticcancer cell lines
GSN and ALDH1A1 expression was detected through westernblot in three other human pancreatic cancer cell lines, BxPc-3,Panc-1 and AsPc-1 (Fig. 6A). Fig. 6B shows the relative invasivepotential of the cell lines. Both BxPc-3 and Panc-1 expressedlow levels of GSN compared to AsPc-1, which is less invasive.ALDH1A1 expression was stronger in BxPc-3 and Panc-1 thanin AsPc-1 which corresponds to the high invasive abilities ofBxPc-3 and Panc-1.
4. Discussion
In this study, proteins were analysed from culture mediumconditioned by Clone #3 and Clone #8 in serum free conditions(SF) (to reduce the abundance of bovine serum proteins in thesamples). 2D DIGE followed by MALDI–TOF MS analysis of SFCM#3 and CM#8 resulted in identification of 41 differentiallyexpressed proteins. Bio-informatic analysis (GO STAT) wasapplied to all differentially abundant proteins between CM#3and CM#8. Gene ontology (GO STAT) classified the proteinsand their corresponding genes into gene categories. Althoughmembrane-bound and secreted proteins are more likely to becleaved and found in the circulation [12], our GO STAT analysisdetermined that most up-regulated and down-regulatedproteins were involved in glycolysis, cytoplasm, cytosol andintracellular part. Proteins, such as heat shock proteins andactins, generally viewed as cytoplasmic, have been increas-ingly implicated in extracellular functions [13,14]. Eukaryoticprotein secretion normally routes through the endoplasmaticreticulum (ER) and Golgi, ending up in a secretory vesiclefusing to the cell membrane. In addition, recent studies haveshown that the non-classical secretory pathway worksindependently of the ER–Golgi network; the secreted proteinsdo not enter the ER and have not been glycosylated [15]. Non-classical secretion by cell lines of the cytosolic greenfluorescent protein (GFP) was shown experimentally [16];export was not hampered by inhibitors of the classicalsecretory pathway, such as monensin and brefeldin A. Martinet al. [17] also identified many intracellular proteins from boththe cytoplasmic and nuclear compartments from proteomicsanalysis of medium conditioned by the prostate cell line,LNCaP. During cell culture in serum free conditions, some cellswill die, resulting in the release of intracellular proteins intothe media. These intracellular proteins could serve as viablecancer-specific markers as cancer cells undergoing death canrelease proteins which can be detected in the circulation [18].During our analysis we observed very little difference in theproliferation rate of cells grown in serum free conditionsversus normal cell culture, therefore cell death was not amajor contributor to the expression of intracellular proteins inthe CM. Further analysis into the possible “secretion”mechan-isms of these intracellular proteins would be of interest.
Two proteins, GSN and ALDH1A1, were chosen for siRNAsilencing based on fold difference and p value. GSN is a calcium-binding protein, which binds to and regulates actin filaments.GSN binds to the barbed ends of actin filaments and preventscapping [19]. Severing and capping of actin filament enhance
the rate of cell motility and migration [20]. Gelsolin is locatedintracellularly in the cytoplasmandmitochondria [21] aswell asextracellularly in the blood plasma [22]. The intracellular form,termed cytoplasmic, and the secreted form, termed plasmaGSN, are derived from a single gene by alternative transcriptioninitiation sites and differential sequencing [23]. Plasma GSNdiffers from cytoplasmic GSN, in that it is larger, contains 25extra amino acids at its NH2 terminus, and is more positivelycharged [24], suggesting that it is synthesised more rapidly orcatabolised more slowly [25]. Plasma GSN is removed from thecells more rapidly, consistent with a secreted protein, and onlythe plasma form of GSN is secreted in HepG2, a humanhepatoma-derived cell line. Expression of GSN was lowest intheCMof the high invasive cell line, Clone #3, andhighest in theCMof thepoorly invasiveClone#8. RNAi technologywasused tostudy GSN protein function in CM#8. Using two independentGSN-siRNA target sequences, GSN protein expression wasspecifically down-regulated in Clone #8 cells, resulting indecreased expression of GSN. Addition of CM from GSN-siRNAtransfected Clone #8 cells into the invasion chamber, increasedinvasion of Clone #8. Our results suggest that GSN hasfunctional effects on invasion in Clone #8 cells. Decreasedexpression of GSN has been detected in several types of humancancers, including urinary bladder carcinogenesis [26], NSCLC[27], prostatic adenocarcinoma [28], breast [29] and ovariancancer [30], suggesting a possible role as a tumour suppressor.Our results suggest that the invasion-inhibitory effects of CM#8may be in part due to GSN expression. GSN expressionsuppresses the activation of phospholipase C (PLC)/proteinkinase C (PKCs) involved in phospholipid signalling pathways,thus inhibiting cell proliferation and tumourigenicity [31].Furthermore, Tanaka et al. [32] functionally knocked downGSNexpressionbysiRNA in thehumanmammaryepithelial cellline,MCF10A, and suggested thatGSN functions as a switch thatcontrols E- and N-cadherin conversion via the transcriptionfactor Snail. GSN knockdown led to an epithelial to mesench-ymal transition, characterised by fibroblastic morphology, lossof contact inhibition, focus formation inmonolayer growth andenhancedmotility and invasiveness in vitro. Therefore, silencingGSN expression could possibly lead to tumour progression.However, GSN over-expression in 56% of breast cancers wasshown to be associatedwith over-expression of EGFR andHER2,as well as a more aggressive phenotype [33]. High GSN levelshave also been identified as a negative prognostic factor inpulmonary carcinomas, stage I non-small cell lung carcinomas[34], where they have been linked to enhanced cellularmotility.In pancreatic cancer, Ni et al [35] found reduced GSN expressionin 71% (30/42) of pancreatic cancer cases compared to matchedcontrol tissues by immunohisochemistry. This reductionseemed to be dependent on the ubiquitin–proteasome depen-dent degradation of GSN. However, GSN expression was higherin lymph node positive pancreatic cancers compared to lymphnode negative tumours. Thompson et al [36] reported that highlevels of nuclear GSN correlated with reduced patient survivaltime, signifying re-emergence of GSN during the most aggres-sive metastatic stages of pancreatic cancer. Reduction in thelevel of GSN in pancreatic cancer cells decreased themotility ofthe cells, which differs from our results; the up-regulation ofmotility-modulating actin-capping proteins in pancreatic can-cer cells may have different consequences for the motility of
570 J O U R N A L O F P R O T E O M I C S 7 1 ( 2 0 0 8 ) 5 6 1 – 5 7 1
these cells at different stages of themetastatic process [36]. Thisstudy found GSN expression in the MiaPaCa-2 cell line, andshowed that down-regulation of GSN decreasedmotility. In ourmodel, both cytoplasmic and plasma GSN were detected bywestern blot and 2D-DIGE from the conditionedmedia of Clone#8, the less invasive clonal population of MiaPaCa-2. Clone #8 isa clonal population of MiaPaCa-2, with very different propertiesfromClone#3, isolatedat thesame time. Furthermore,we foundthat down-regulation of plasma GSN expression in CM#8increased invasion of Clone #8 cells. Thompson et al [36]detected cytoplasmic/nuclear expression of GSN in pancreaticcancer tissue specimens and cytoplasmic GSN in pancreaticcancer cell lines. The differences in the GSN isoforms detectedbetween the two studies may explain why differing effects oninvasion andmigrationwere observed, however further studiesare required to specifically clarify the roles of cytoplasmic andplasma GSN on migration and invasion in pancreatic cancer. Astudy detailing antibody microarray profiling of combinedserum proteins associated with pancreatic cancer, showed asignificant reduction of plasmaGSN in pancreatic cancer serumcompared to healthy controls [37], and plasma GSN expressionwas also decreased in lung cancer serumby proteomic profiling[38]. The mechanism by which GSN stimulates invasion byinteracting extracellularly with cancer cells as detailed is notknown. To further characterise function of GSN in this system,experiments involving addition of recombinant GSN proteininto CM#3 would be valuable, but highly purified GSN would beneeded to generate useful results.
A novel protein identified as promoting the invasive abilitiesof pancreatic cancer cells is aldehyde dehydrogenase 1A1(ALDH1A1). ALDH1A1 is an enzyme, belonging to the aldehydedehydrogenase family of proteins which are involved in theconversion of aldehydes to their corresponding acids byNAD(P)+
dependent reactions [39]. ALDH1A1 is a cytosolic enzyme foundin many tissues, including brain [40] and red blood cells [41].ALDH1A1 expression has also been implicated in drug resis-tance, asALDH1A1levelswerehigher inmetastatic tumours thatdid not respond to cyclophosphamide-based treatment thanthose that did respond to the regimen [42]. ALDH1A1 expressionhas also been reported in the lung cancer cell line, A549, whereits expression along with ALDH1A3 was knocked down by RNAiand implicated in cyclophosphamide resistance [43]. Jelski et al.[44] also found that ALDH is expressed in pancreatic cancer cellsand furthermore ALDH could also be detected in the sera ofpancreatic cancer patients, although not significantly differentbetween pancreatic cancer patients and healthy controls [45].
ALDH1A1 is highly expressed in CM#3 compared to CM#8.ALDH1A1 expression was reduced in CM#3 through siRNAtargeting three independent sequences of the ALDH1A1 gene.Addition of CM from ALDH1A1-siRNA transfected Clone #3cells into the invasion chamber reduced invasion of Clone #3cells. This is the first time that ALDH1A1 has been reported asa protein involved in pancreatic cancer cell invasion. Furtherresearch will be required to determine its role in the clinicalsetting.
The expression ofGSNandALDH1A1determinedbywesternblot in the human pancreatic cancer cell lines, BxPc-3, Panc-1and AsPc-1 corresponded to the invasive properties of the cells.A larger panel of pancreatic cancer cell lines would be requiredto confirmthe linkbetween theexpressionof theseproteinsand
invasion status in pancreatic cancer. Han et al [46] found thatGSN mRNA is expressed at low levels in a panel of ninepancreatic cancer cell lines compared to the normal pancreasusing cDNAmicroarrays.
In conclusion, identification of released proteins fromcancer cell lines may serve as an efficient method in theestablishment of a panel of potential therapeutic targets andbiomarkers correlating to invasion/metastatic cascade ofpancreatic cancer. Future work will include examining thesera of pancreatic cancer patients to further demonstrate ifGSN and ALDH1A1 have a diagnostic potential as biomarkersfor pancreatic adenocarcinoma.
Acknowledgement
This work was supported by the Irish Higher EducationAuthority's Programme for Research in Third-Level Institutions(PRTLI) cycle 3 and 4.
R E F E R E N C E S
[1] Ferlay J, Autier P, Boniol M, Heanue M, Colombet M, Boyle P.Estimates of the cancer incidence and mortality in Europe in2006. Ann Oncol 2007;18:581–92.
[2] Jemal A, Thomas A, Murray T, ThunM. Cancer statistics, 2002.CA Cancer J Clin 2002;52:23–47.
[3] Faivre J, Forman D, Esteve J, Obradovic M, Sant M. Survival ofpatients with primary liver cancer, pancreatic cancer andbiliary tract cancer in Europe. Eur J Cancer 1998;34:2184–90.
[4] Negm RS, Verma M, Srivastava S. The promise of biomarkersin cancer screening and detection. Trends Mol Med2002;8:288–93.
[5] Kuramitsu K, Nakamura Y. Proteomic analysis of cancertissues: shedding light on carcinogenesis and possiblebiomarkers. Proteomics 2006;6:5650–61.
[6] Lundin J, Roberts PJ, Kuusela P, Haglund C. Prognosticsignificance of serum CA 242 in pancreatic cancer. Acomparison with CA 19-9. Anticancer Res 1995;15:2181–6.
[7] Safi F, Schlosser W, Falkenreck S, Beger HG. Prognosticvalue of CA 19-9 serum course in pancreatic cancer.Hepatogastroenterology 1998;45:253–9.
[8] Tempero MA, Uchida E, Takasaki H, Burnett DA, Steplewski Z,Pour PM. Relationship of carbohydrate antigen 19-9 and Lewisantigens in pancreatic cancer. Cancer Res 1987;47:5501–3.
[9] Goggins M. Molecular markers of early pancreatic cancer.J Clin Oncol 2005;23:4524–31.
[10] Albini A, Iwamoto Y, Kleinman HK, Martin GR, Aaronson SA,Kozlowski JM, et al. A rapid in vitro assay for quantitating theinvasive potential of tumor cells. Cancer Res 1987;47:3239–45.
[11] Alban A, David SO, Bjorkesten L, Andersson C, Sloge E, LewisS, et al. A novel experimental design for comparativetwo-dimensional gel analysis: two-dimensional differencegel electrophoresis incorporating a pooled internal standard.Proteomics 2003;3:36–44.
[12] Kulasingam V, Diamandis EP. Proteomic analysis ofconditioned media from three breast cancer cell lines: a minefor biomarkers and therapeutic targets. Mol Cell Proteomics2007;6:1997–2011.
[13] Altmeyer A, Maki RG, Feldweg AM, Heike M, Protopopov VP,Masur SK, et al. Tumor-specific cell surface expression ofthe-KDEL containing, endoplasmic reticular heat shockprotein gp96. Int J Cancer 1996;69:340–9.

571J O U R N A L O F P R O T E O M I C S 7 1 ( 2 0 0 8 ) 5 6 1 – 5 7 1
[14] Wang H, Schultz R, Hong J, Cundiff DL, Jiang K, Soff GA. Cellsurface-dependent generation of angiostatin4.5. Cancer Res2004;64:162–8.
[15] Bendtsen JD, Jensen LJ, Blom N, Von Heijne G, Brunak S.Feature-based prediction of non-classical and leaderlessprotein secretion. Protein Eng Des Sel 2004;17:349–56.
[16] Tanudji M, Hevi S, Chuck SL. Improperly folded greenfluorescent protein is secreted via a non-classical pathway.J Cell Sci 2002;115:3849–57.
[17] Martin DB, Gifford DR, Wright ME, Keller A, Yi E, Goodlett DR,et al. Quantitative proteomic analysis of proteins released byneoplastic prostate epithelium. Cancer Res 2004;64:347–55.
[18] Holdenrieder S, Stieber P. Apoptotic markers in cancer. ClinBiochem 2004;37:605–17.
[19] Kumar N, Tomar A, Parrill AL, Khurana S. Functionaldissection and molecular characterization ofcalcium-sensitive actin-capping and actin-depolymerizingsites in villin. J Biol Chem 2004;279:45036–46.
[20] Cunningham CC, Stossel TP, Kwiatkowski DJ. Enhancedmotility in NIH 3T3 fibroblasts that overexpress gelsolin.Science 1991;251:1233–6.
[21] Koya RC, Fujita H, Shimizu S, Ohtsu M, Takimoto M,Tsujimoto Y, et al. Gelsolin inhibits apoptosis by blockingmitochondrial membrane potential loss and cytochrome crelease. J Biol Chem 2000;275:15343–9.
[22] Chaponnier C, Borgia R, Rungger-Brandle E, Weil R, GabbianiG. An actin–destabilizing factor is present in human plasma.Experientia 1979;35:1039–41.
[23] Kwiatkowski DJ, Mehl R, Yin HL. Genomic organization andbiosynthesis of secreted and cytoplasmic forms of gelsolin.J Cell Biol 1988;106:375–84.
[24] Kwiatkowski DJ, Stossel TP, Orkin SH, Mole JE, Colten HR, YinHL. Plasma and cytoplasmic gelsolins are encoded by a singlegene and contain a duplicated actin-binding domain. Nature1986;323:455–8.
[25] Yin HL, Kwiatkowski DJ, Mole JE, Cole FS. Structure andbiosynthesis of cytoplasmic and secreted variants of gelsolin.J Biol Chem 1984;259:5271–6.
[26] Tanaka M, Mullauer L, Ogiso Y, Fujita H, Moriya S, Furuuchi K,et al. Gelsolin: a candidate for suppressor of human bladdercancer. Cancer Res 1995;55:3228–32.
[27] Dosaka-Akita H, Hommura F, Fujita H, Kinoshita I, Nishi M,Morikawa T, et al. Frequent loss of gelsolin expression innon-small cell lung cancers of heavy smokers. Cancer Res1998;58:322–7.
[28] Lee HK, Driscoll D, Asch H, Asch B, Zhang PJ. Downregulatedgelsolin expression in hyperplastic and neoplastic lesions ofthe prostate. Prostate 1999;40:14–9.
[29] Winston JS, Asch HL, Zhang PJ, Edge SB, Hyland A, Asch BB.Downregulation of gelsolin correlates with the progression tobreast carcinoma. Breast Cancer Res Treat 2001;65:11–21.
[30] Noske A, Denkert C, Schober H, Sers C, Zhumabayeva B,Weichert W, et al. Loss of Gelsolin expression in humanovarian carcinomas. Eur J Cancer 2005;41:461–9.
[31] Sagawa N, Fujita H, Banno Y, Nozawa Y, Katoh H, KuzumakiN. Gelsolin suppresses tumorigenicity through inhibiting PKCactivation in a human lung cancer cell line, PC10. Br J Cancer2003;88:606–12.
[32] Tanaka H, Shirkoohi R, Nakagawa K, Qiao H, Fujita H,Okada F, et al. siRNA gelsolin knockdown inducesepithelial–mesenchymal transition with a cadherin switch
in human mammary epithelial cells. Int J Cancer2006;118:1680–91.
[33] Thor AD, Edgerton SM, Liu S, Moore II DH, Kwiatkowski DJ.Gelsolin as a negative prognostic factor and effector ofmotility in erbB-2-positive epidermal growth factorreceptor-positive breast cancers. Clin Cancer Res2001;7:2415–24.
[34] Shieh DB, Godleski J, Herndon II JE, Azuma T, Mercer H,Sugarbaker DJ, et al. Cell motility as a prognostic factor inStage I non-small cell lung carcinoma: the role of gelsolinexpression. Cancer 1999;85:47–57.
[35] Ni XG, Zhou L, Wang GQ, Liu SM, Bai XF, Liu F, et al. Theubiquitin–proteasome pathwaymediates the downregulationof gelsolin protein levels in pancreatic cancer. Mol Med 2008[Electronic publication ahead of print].
[36] Thompson CC, Ashcroft FJ, Patel S, Saraga G, VimalachandranD, Prime W, et al. Pancreatic cancer cells overexpress gelsolinfamily-capping proteins, which contribute to their cellmotility. Gut 2007;56:95–106.
[37] Orchekowski R, Hamelinck D, Li L, Gliwa E, vanBrocklin M,Marrero JA, et al. Antibody microarray profiling revealsindividual and combined serum proteins associated withpancreatic cancer. Cancer Res 2005;65:11193–202.
[38] Okano T, Kondo T, Kakisaka T, Fujii K, Yamada M, Kato H,et al. Plasma proteomics of lung cancer by a linkage ofmulti-dimensional liquid chromatography andtwo-dimensional difference gel electrophoresis.Proteomics 2006;6:3938–48.
[39] Yoshida A, Rzhetsky A, Hsu LC, Chang C. Human aldehydedehydrogenase gene family. Eur J Biochem 1998;251:549–57.
[40] Bhave SV, Hoffman PL, Lassen N, Vasiliou V, Saba L, DeitrichRA, et al. Gene array profiles of alcohol and aldehydemetabolizing enzymes in brains of C57BL/6 and DBA/2 mice.Alcohol Clin Exp Res 2006;30:1659–69.
[41] Collard F, VertommenD, Fortpied J, Duester G, Van SchaftingenE. Identification of 3-deoxyglucosone dehydrogenase asaldehydedehydrogenase 1A1 (retinaldehydedehydrogenase1).Biochimie 2007;89:369–73.
[42] Sladek NE, Kollander R, Sreerama L, Kiang DT. Cellular levels ofaldehyde dehydrogenases (ALDH1A1 and ALDH3A1) aspredictorsof therapeutic responses to cyclophosphamide-basedchemotherapy of breast cancer: a retrospective study. Rationalindividualization of oxazaphosphorine-based cancerchemotherapeutic regimens. Cancer Chemother Pharmacol2002;49:309–21.
[43] Moreb JS, Mohuczy D, Ostmark B, Zucali JR. RNAi-mediatedknockdown of aldehyde dehydrogenase class-1A1 andclass-3A1 is specific and reveals that each contributes equallyto the resistance against 4-hydroperoxycyclophosphamide.Cancer Chemother Pharmacol 2007;59:127–36.
[44] Jelski W, Chrostek L, Szmitkowski M. The activity of class I, II,III, and IV of alcohol dehydrogenase isoenzymes andaldehyde dehydrogenase in pancreatic cancer. Pancreas2007;35:142–6.
[45] Jelski W, Zalewski B, Szmitkowski M. Alcohol dehydrogenase(ADH) isoenzymesandaldehydedehydrogenase (ALDH) activityin the sera of patients with pancreatic cancer. Dig Dis Sci 2007.
[46] Han H, Bearss DJ, Browne LW, Calaluce R, Nagle RB, Von HoffDD. Identification of differentially expressed genes inpancreatic cancer cells using cDNA microarray. Cancer Res2002;62:2890–6.